Article

Resilience Evaluation of Traditional Villages from a Built-Environment Perspective: An Integrated Community–Ecology–Economy–Culture Approach
1
School of Architecture, Southeast University, Nanjing 210096, China
2
Research Institute of Architecture, Southeast University, Nanjing 210096, China
*
Author to whom correspondence should be addressed.
Buildings 2026, 16(1), 133; https://doi.org/10.3390/buildings16010133
Submission received: 24 November 2025 / Revised: 19 December 2025 / Accepted: 25 December 2025 / Published: 26 December 2025
(This article belongs to the Section Building Energy, Physics, Environment, and Systems)

Abstract

Traditional villages are integral to the broader context of global socio-economic transition. This study developed a resilience evaluation model centred on built-environment indicators. This model integrates the community, economy, ecology, and culture dimensions. Clarifying the typology and key driving factors of traditional village built environment resilience can effectively activate the inherent potential of villages. The study provides a holistic approach to identifying traditional village built environment resilience types and analysing the key influencing factors. Utilising a method combining the SOM-K-means clustering model and the interpretable XGBoost-SHAP model, the study provides a holistic analytical framework for identifying traditional village built environment resilience types and quantifying the nonlinear action characteristics of various indicators across different types. Taking the Yangtze River Delta (YRD) region as an example, the study demonstrates that traditional villages can be categorised into six potential resilience types, with differentiated key indicator combinations across these types. Furthermore, the nonlinear action characteristics and operational thresholds of the same key indicator differ significantly across various traditional village types. For instance, at medium-to-high threshold levels, the accessibility of cultural buildings contributes significantly to the sustainability of culture–service-driven villages but, conversely, becomes a detriment in ecology-cultural composite archetypes. Similarly, in industry–creative driven villages, once the density of cultural and creative spaces reaches a specific threshold, it exerts a significant positive effect on traditional village development and stabilises into a sustained positive state. However, in ecology–agriculture–organisation-driven villages, exceeding a certain threshold in the density of cultural and creative spaces has a significant negative influence. The results provide an analytical framework for the resilience typology and influencing factors of traditional village built environments, consequently offering a scientific basis for formulating refined, differentiated policies for traditional villages.

1. Introduction

Rural transformation has become a global imperative. Rural areas worldwide are grappling with significant existential challenges. Urban development triggers critical issues such as population loss [1], the disintegration of social networks, and the restructuring of spatial morphology. These problems accelerate the decline of rural areas. As an essential component of rural regions, traditional villages possess superior natural landscapes and a diverse historical heritage [2]. These areas play a positive role in promoting sustainable tourism and local culture, holding unique value within sustainable development strategies. Precisely because of this exceptional value, traditional villages face the dual pressures of conservation and development, attracting increasing attention.
To address the multifaceted pressures shaping the transformation of traditional villages, resilience theory has increasingly been adopted across the field. It has since evolved into a vital analytical framework for guiding village governance and transitional development [3]. The concept of “resilience” originated in materials science, where it described the recovery ability of engineering materials, and was later adopted by Holling, who introduced the concept of “ecological resilience” [4]. Ecological resilience eventually evolved into “evolutionary resilience,” which emphasises the system’s capacity for adaptation and transformation [5]. This concept offers a critical theoretical lens for understanding the long-term evolutionary trajectories of traditional villages and aligns closely with the United Nations Sustainable Development Goals (SDGs) [6,7]. For instance, the adaptive development of traditional villages in agricultural diversification and ecological tourism can simultaneously enhance food production and climate resilience, thereby supporting SDG 2 and SDG 13. Therefore, resilience theory demonstrates broad applicability and unique advantages for rural transformation studies, offering a valuable contribution to the ongoing promotion of the SDGs [8]. Resilience theory is increasingly guiding rural development policies and has been echoed in policy implementation across North America, South America, Asia, Australia, and Africa [9]. Moreover, the ICOMOS and IUCN have advanced heritage conservation frameworks grounded in resilience [10] that support the long-term planning of global heritage sites.
Drawing primarily on theoretical frameworks such as the Social-Ecological Systems (SES) [11] and Pressure–State–Response (PSR) models [12], existing research on traditional village resilience typically examines the subject from the perspectives of the natural environment, economic development, and community governance. However, these frameworks were primarily tailored to general rural areas or individual village case studies; as a result, they fail to systematically address the distinct natural landscapes and historical heritage of traditional villages. Traditional villages encompass living spaces, production systems, and cultural landscapes. Consequently, their resilience is not determined by any single dimension but emerges from the dynamic interaction among these multiple dimensions. In particular, while cultural resilience is a defining feature of traditional villages, its underlying mechanisms within the resilience system remain insufficiently elucidated. Existing research, grounded mainly in Social-Ecological Systems (SES) or community resilience perspectives, does incorporate cultural indicators. However, these are often reduced to static metrics such as heritage counts, protection levels, or resource endowments [13], thereby overlooking substantive cultural elements, including the frequency of cultural practices and mechanisms of skill transmission [14]. The systematic absence of cultural mechanisms in resilience assessments not only limits their explanatory power for the evolution of traditional villages but also undermines research’s capacity to inform differentiated conservation and development strategies [15]. Therefore, to more comprehensively unveil potential pathways for sustainable development, it is imperative to reconstruct a four-dimensional analytical framework that encompasses community, economy, ecology, and culture. This approach clarifies the mechanisms governing traditional villages as multi-dimensional systems of resilience.
The scientific and rational classification of traditional villages, along with the identification of their typological characteristics, is a crucial prerequisite for promoting differentiated, sustainable development. Existing research has primarily categorised traditional villages by their conservation value [16], spatial distribution [17], and cultural–regional traits [18], and then proposed corresponding protection and development strategies. However, such classification methods often rely on a single dimension, making it difficult to fully capture the heterogeneity within the internal structures of villages of the same type. For example, traditional villages are classified as a “conservation-oriented” type due to their inherent cultural resources [19]. Traditional villages are complex systems shaped by interactions among natural, economic, and cultural factors [20,21], exhibiting significant differences in their natural environments [22], industrial structures [23], and historical and cultural characteristics. Since 2020, China has promoted strategies for contiguous protection and cluster-based development of traditional villages [24]. The current development of traditional villages urgently requires the establishment of a more systematic and scientific classification system that identifies the resilience characteristics and differentiated development paths of different types of villages, thus providing a scientific basis for implementing policies to promote the clustered development of traditional villages.
To address the practical challenges of traditional village conservation and development, this study constructs a scientific, systematic resilience framework for traditional villages. Furthermore, the study identifies key influencing indicators and their nonlinear mechanisms across different village types. The study focuses on quantifying the nonlinear mechanisms of key resilience indicators in traditional villages. The research findings can provide accurate, practical decision-support information, offering a scientific basis for developing differentiated, localised conservation and development strategies.

2. Literature Review

Existing studies have sought to integrate resilience theory with the Sustainable Development Goals (SDGs) to develop more comprehensive, growth-focused assessment systems. As indicated in Table 1, although current assessments analyse specific aspects such as ecology, community, economy, and culture, they lack a comprehensive, integrated structural approach. First, most assessment frameworks focus on a single dimension. For instance, the DPSER framework [25] prioritises ecological processes; the ‘Resource-Governance-Actor’ [26] and RRS [16] frameworks emphasise community organisation and governance capabilities, whereas the VTV [27] and ‘Ecology–Industry–Society’ [28] models concentrate on economic transition and industrial structure. Secondly, although some studies have attempted to incorporate cultural factors into resilience frameworks, the cultural dimension is usually subsumed under resource or environmental dimensions, lacking an independent and systematic analysis of cultural resilience [15,29]. In recent years, scholars have increasingly recognised the enhancing effects of cultural traditions on village adaptability [30] and the role of cultural industry development in driving economic transformation [31]. These findings thereby indicate that cultural resilience plays a distinct and independent role in the study of traditional village resilience. However, existing studies remain predominantly qualitative or single-case, and a systematic framework for integrating and representing cultural resilience has yet to be established. This deficiency, to some extent, compromises the accuracy of resilience assessment and typology identification for traditional villages.
Various methods are available for measuring indicators of traditional village resilience, including multi-indicator comprehensive evaluation, obstacle degree models, statistical modelling methods, and spatial analysis models. Earlier studies primarily employed linear aggregation methods, which made it difficult to capture the complex nonlinear relationships among indicators [32,33]. For example, Sun et al. [12] quantified the ecological resilience of coastal villages using a linear weighted summation model (combining objective and subjective weighting). However, this method is insufficient in reflecting the nonlinear action characteristics of complex village systems. Specifically, some scholars have introduced nonlinear models to mitigate the shortcomings of linear approaches. For instance, Zhao & Zhao [34] introduced the Projection Pursuit Model (PPM) to investigate the relationship between digital villages and agricultural resilience in ecologically vulnerable areas. Although these methods mitigate the subjectivity inherent in traditional weighting approaches, they still exhibit deficiencies in fitting complex data and extracting nonlinear features. Avand et al. [35] introduced machine learning models into village resilience analysis, further enhancing predictive accuracy. They compared Random Forest (RF), Generalized Linear Models (GLM), and Artificial Neural Networks (ANN), and found that the Random Forest model has advantages for handling complex data. Machine learning algorithms require interpretable models to visualise the marginal contribution direction and magnitude of resilience indicators [36]. Furthermore, existing research methods overlook the differences in village typology. This results in the averaging of trade-offs among resilience-influencing factors across different village types, thereby undermining the explanatory power of resilience measurements.
Given the limitations of existing research in the framework and modelling of traditional village resilience assessment, particularly the deficiencies in integrating the cultural dimension, identifying resilience types, and providing a quantitative explanation of nonlinear indicator mechanisms. This study aims to construct a more comprehensive and interpretable traditional village resilience assessment system. First, the study developed a traditional village resilience assessment framework integrating four dimensions: ecology, economy, culture, and community. Community resilience is manifested as the organisational and management capacity of traditional villages to cope with social, political, and environmental changes [37,38]. Economic resilience refers to a community’s ability to withstand economic shocks [39]. Ecological resilience emphasises the stability and healthy state of the ecosystem [40,41]. Cultural resilience reflects the crucial role of the traditional cultural value system and its practices in enhancing system adaptability and promoting economic development [31]. The comprehensive assessment framework established by this study provides a basis for evaluating indicator effects, which is key to identifying the differentiated development pathways of traditional village resilience systems. Second, following the data-driven paradigm of “Rural Computing” proposed by Lang et al. [42]. This study proposes an integrated analytical framework that fuses SOM-KMEANS and XGBoost-SHAP. The study employs the SOM-K-means clustering approach to identify potential differences in traditional village resilience types by combining the self-organising capability of SOM with the efficiency and scalability of K-means. Subsequently, the study utilised the XGBoost-SHAP model to enhance predictive accuracy and generalisation ability, achieving visualised attribution of results and addressing the limitations of traditional models in explaining nonlinear features.
In light of the limitations within current scholarship on traditional village resilience, this study addresses the following three core inquiries:
(1)
Construction of a comprehensive and holistic assessment framework for traditional village resilience: Existing frameworks are predominantly derived from general rural studies at the regional scale or micro-level case studies of individual villages. Consequently, there is a lack of indicator systems capable of elucidating the internal structural relationships among “ecology–economy–community–culture” at the macro- and meso-regional levels.
(2)
Scientific and systematic identification of traditional village resilience typologies: Current research focuses heavily on heritage conservation values while neglecting the distinct multi-dimensional resilience structures—encompassing ecology, economy, community, and culture. This neglect risks inducing a homogenising trend in traditional village development planning. Village typology identification relies heavily on subjective expert judgment or isolated case studies, lacking unified indicator systems and analytical methodologies. This methodological limitation impedes the identification of structural characteristics within diverse village resilience systems and obscures potential synergies for coordinated development.
(3)
Identification and elucidation of core driving factors and their mechanisms within diverse traditional village typologies: Existing research typically analyses influencing factors from a holistic perspective, overlooking how structural heterogeneity among village types modulates the specific effects and mechanisms of these determinants. Furthermore, current studies lack systematic methodologies for capturing nonlinear interactions among indicators. This methodological gap hinders the elucidation of the differentiated mechanisms through which driving factors operate within distinct traditional village resilience systems.

3. Methods

3.1. Research Area and Data Sources

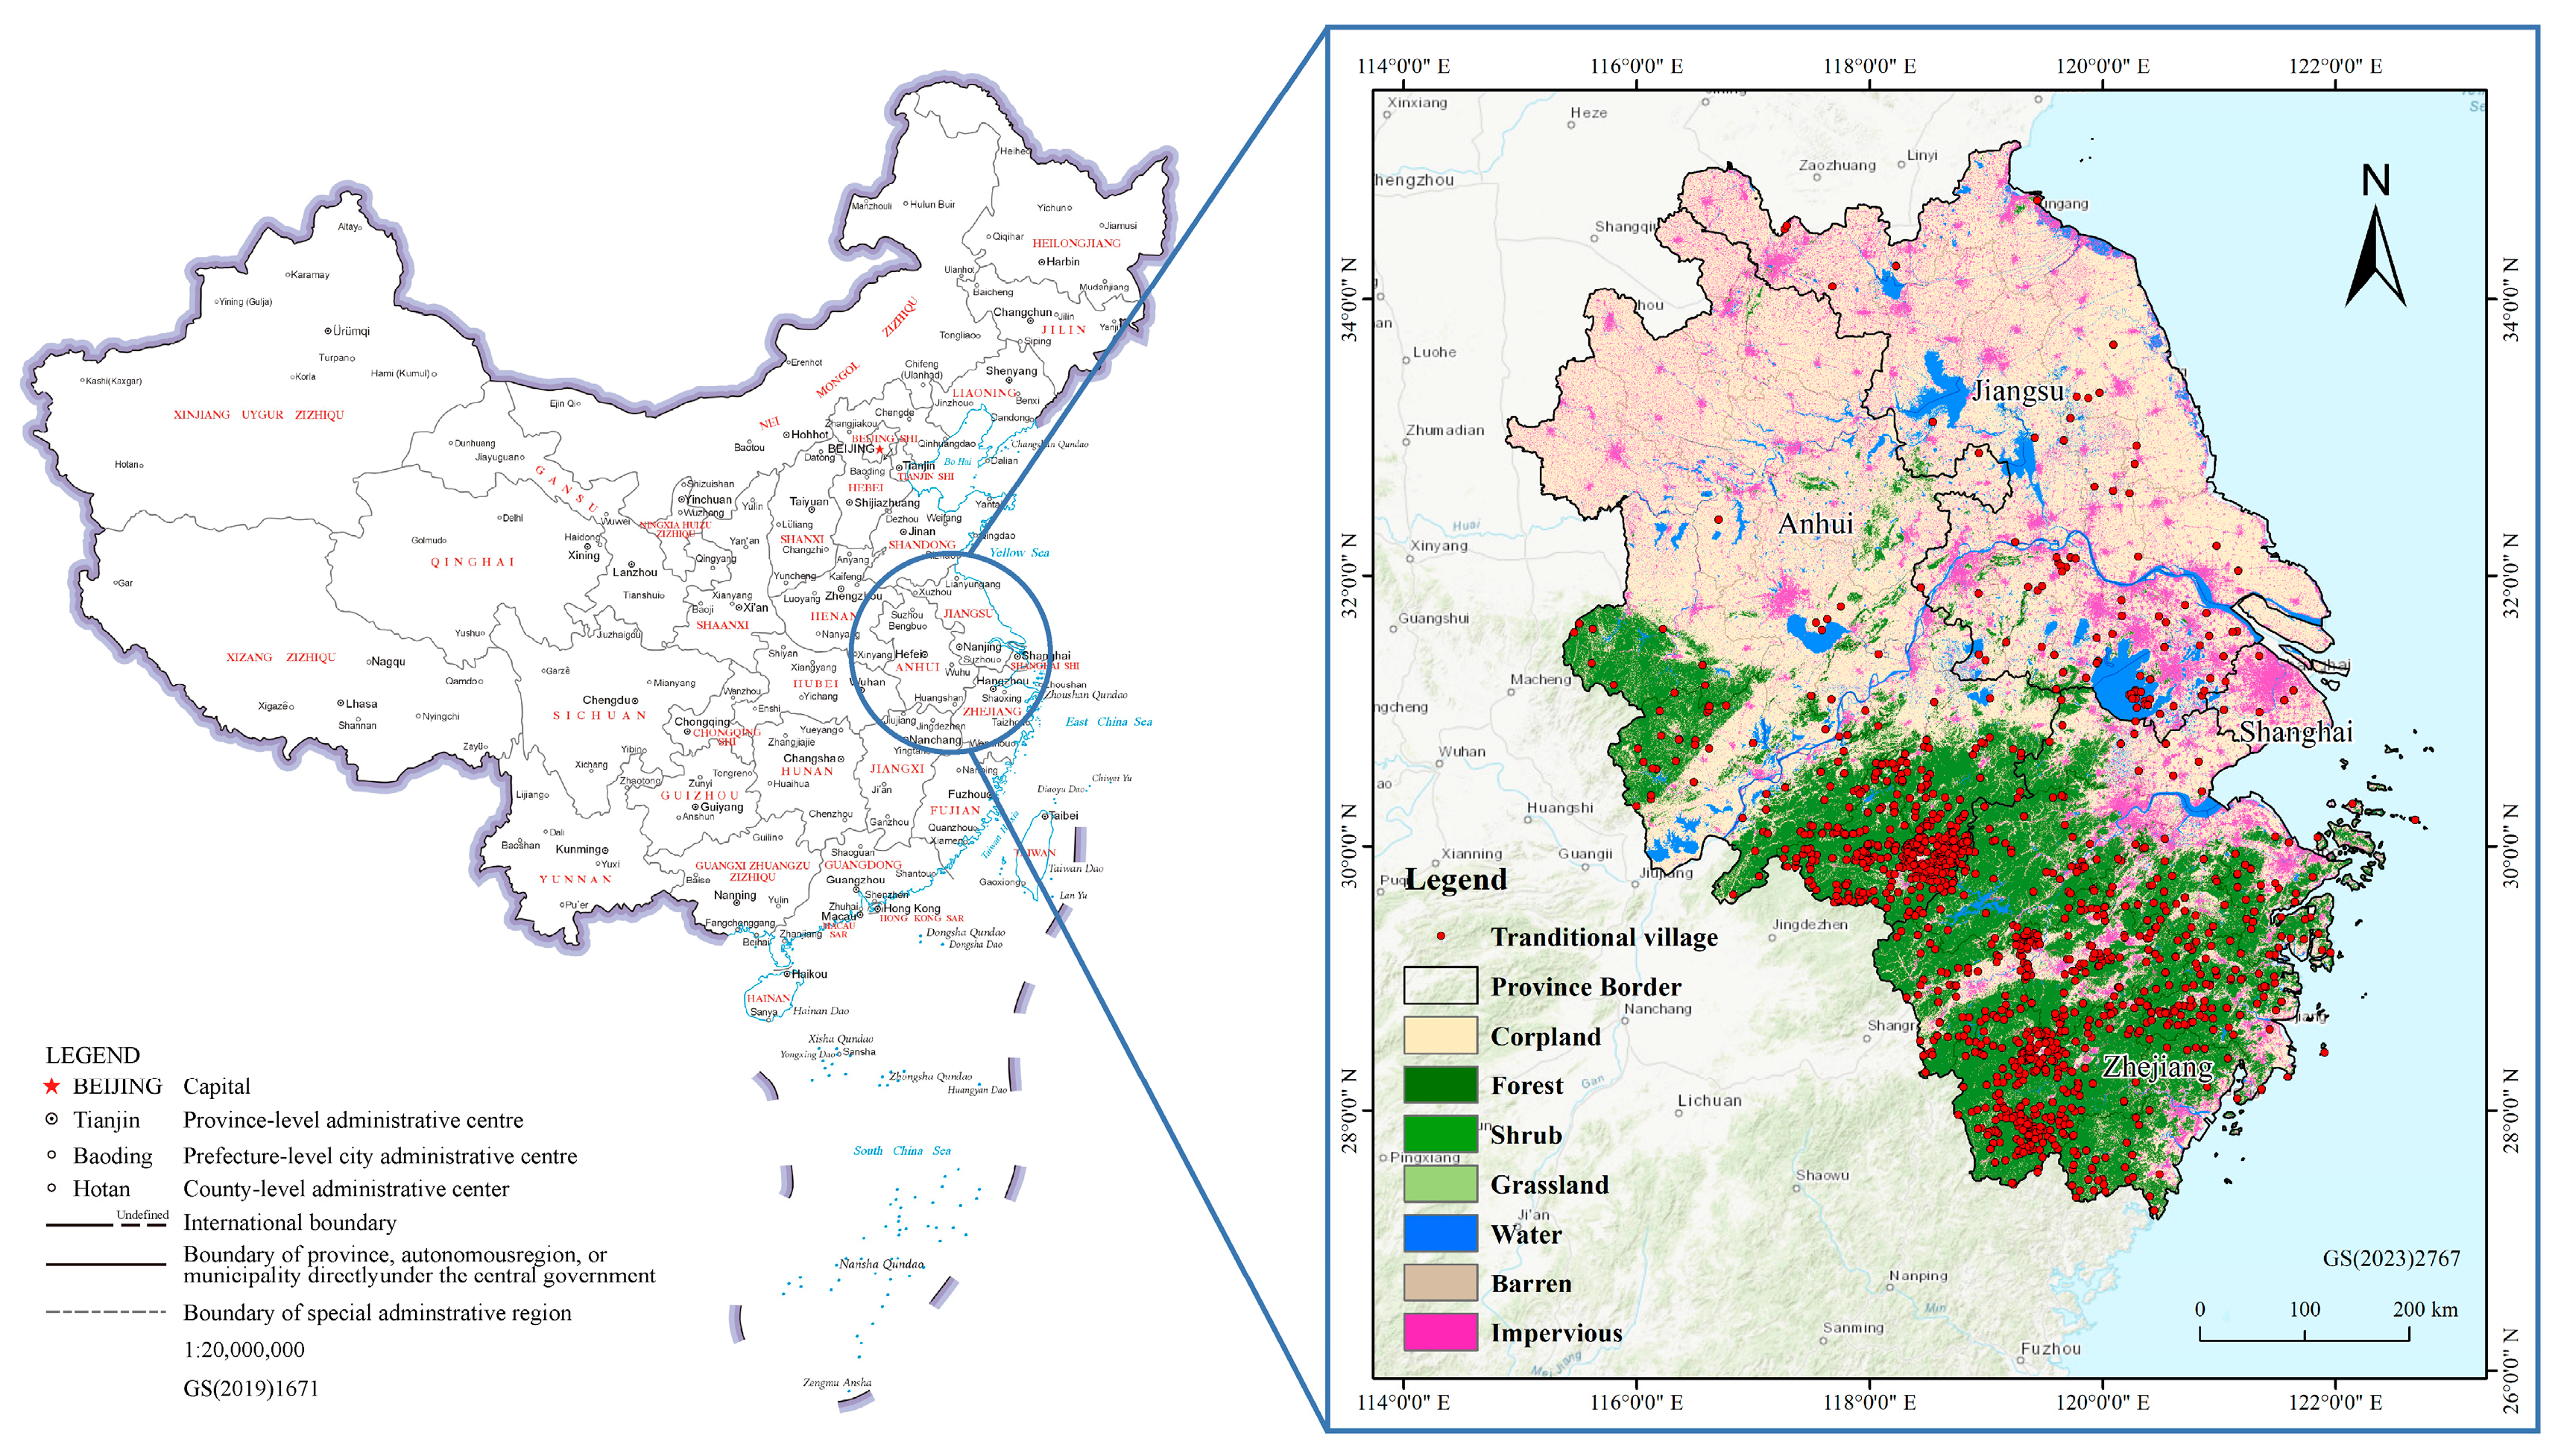
This study focuses on the Yangtze River Delta (YRD) region (see Figure 1), located in the southeastern coastal area of China (30°20′–32°30′ N, 119°24′–122°30′ E), encompassing the entire administrative territories of Shanghai, Jiangsu, Zhejiang, and Anhui provinces, with a total area of approximately 358,000 km2 [43]. According to the National List of Traditional Villages in China, there are currently 1246 nationally recognised traditional villages in the region, providing a substantial empirical basis for this study. Ecologically, the YRD is characterised predominantly by plains, but also includes six distinct landform types—plains, mountains, hills, basins, water networks, and islands—interwoven throughout the region. This geomorphological diversity offers a robust sample foundation for comparing and identifying resilience characteristics of traditional villages across different ecological contexts. From a socio-economic perspective, the YRD exhibits high population density, advanced levels of urbanisation and economic development, and strong infrastructure. The region’s favourable natural geography, strategic location, and deep cultural heritage make the balance and interaction among ecological, social, and economic resilience dimensions particularly prominent in its traditional villages [44]. The conservation and development of these villages is crucial for regional human well-being and the continuity of cultural heritage. The identification and analysis of the traditional village resilience system in the YRD region are highly relevant to the sustainable development of traditional villages worldwide.

3.2. Data Processing

The village samples utilised in this study were sourced from the List of Traditional Chinese Villages. As of 2023, a total of six batches of Traditional Chinese Villages have been officially released by the Digital Museum of Traditional Chinese Villages (https://www.dmctv.cn, accessed on 15 November 2024) and the Ministry of Housing and Urban-Rural Development (https://www.mohurd.gov.cn/, accessed on 15 November 2024). Within the study area, 1246 traditional villages were identified as subjects for analysis.
The data employed in this study were sourced from statistical yearbooks and multiple authoritative data platforms. All relevant data for the year 2023 were selected to ensure temporal consistency and timeliness across the entire dataset. Socio-economic attributes are obtained from the China County Statistical Yearbook (2023) [45], the China Regional Economic Statistical Yearbook (2023), and the Digital Finance Research Center of Peking University (2023). The official list of traditional villages is gathered from the Digital Museum of Chinese Traditional Villages and the Ministry of Housing and Urban–Rural Development website. For vector data, the administrative village boundary dataset is sourced from the Geographic Remote Sensing and Ecology Network (https://www.gisrs.cn/), which provides polygon features of administrative villages across China. The attribute information, including standard 12-digit administrative codes, village names, and regional affiliations, is matched to village point data using the spatial join tool in ArcGIS 10.8. Population density data were obtained from LandScan-Global (https://landscan.ornl.gov/). The land-use data utilised in this study were obtained from the Big Earth Data Science Engineering Project (CAS Earth) (http://data.casearth.cn) with a spatial resolution of 30 m, which is sufficient to meet the accuracy requirements for regional-scale resilience assessment. Additionally, the Digital Elevation Model (DEM) data were sourced from the NASA Earth Science Data website (https://www.earthdata.nasa.gov/, accessed on 10 January 2025), featuring a spatial resolution of 30 m and a vertical accuracy of approximately ±10 m.
Additional geospatial data are processed and interpreted in ArcGIS 10.8 (e.g., elevation and slope derived from DEMs). POI data were partly obtained via web scraping from Amap (Gaode), while cultural and commercial facility data were retrieved from Dianping (https://www.dianping.com/, accessed on 12 January 2025), and all datasets were corrected to the WGS84 coordinate system.

3.3. Selection of Resilience Indicators

Evaluation indicators were selected based on development goals across four dimensions: ecological, economic, cultural, and community resilience. Drawing upon existing research and considering data availability, 16 influencing factors were ultimately identified (Table 2).
Community resilience focuses on the resistance, recoverability, and adaptability of traditional villages in the face of external shocks and challenges. Community resilience involves multiple aspects, including social resources, population foundations, and support from physical infrastructure [14]. Accordingly, the evaluation can be conducted by focusing on dimensions such as community demographics, infrastructure diversity and accessibility, and grassroots governance capacity [46]. Population size reflects community stability and serves as a measure of the community’s human resources and social capital base [47]. The number of village organisations reflects the grassroots management capacity of traditional villages. It serves as an essential indicator for assessing the resilience, adaptability, and transformative capacity of conventional village power communities [48]. Public service and transportation accessibility were used to reflect the level of infrastructure development in traditional villages [49], serving as foundational indicators for measuring the resilience and adaptive capacity of traditional village communities. To mitigate potential multicollinearity issues, a Variance Inflation Factor (VIF) test was conducted for the relevant indicators (see Table S1). The results demonstrate that the VIF values for all retained indicators remain well below the conventional threshold, indicating no significant risk of multicollinearity. Since these variables represent distinct operational mechanisms of community resilience, they were retained simultaneously within the indicator system to ensure a comprehensive assessment.
Economic resilience assesses the industrial transformation and economic self-recovery capacity of traditional villages by examining indicators within the economic system, such as industrial scale, the diversity of industrial structures, and the level of economic digitalisation. The following indicators were selected to measure it: industrial structure was used to show the degree of shift from a solely agricultural economy to a more diversified rural economy; rural enterprise density and emerging industries density reflected the current state of industrial development in traditional villages [50], and the Digital Financial Inclusion Index [51] was used to assess financial inclusion and digitalisation in local economies [52], thereby indicating the transformative potential of industrial resilience in traditional villages [53]. The various indicators in the economic dimension clearly reveal the redundancy and transformation potential of the rural economic system in terms of industrial scale, structural diversity, and digitalisation level.
Ecological resilience was defined as the capacity of ecosystems to maintain their structure and functions in the face of external disturbances. It was assessed using several indicators. Ecosystem sensitivity reflected the responsiveness of traditional villages to environmental changes [54]. Terrain relief was used to assess the complexity of village landforms and served as a key indicator of ecological endowments [55]. Although ecosystem sensitivity and topographic relief are categorised as negative factors in the indicator system, their influence on traditional village resilience is not assumed to be strictly linear. Instead, their marginal effects and threshold characteristics are further identified in the subsequent analysis using the SHAP (SHapley Additive exPlanations) method to capture the complex, nonlinear dynamics involved. Land use diversity reflected the ecological health of traditional villages [56,57]. Specifically, the cultivated land area ratio, the forest coverage ratio, and the diversity of land-use types [58] demonstrated the structural richness of the ecological environment. They served as important indicators of the adaptive and transformative capacity of ecological resilience.
Cultural resilience emphasises the protection of cultural heritage and its role in driving economic and social development [59]. Culture in traditional villages transcends its role as a static heritage asset. Instead, it integrates into the resilience system’s transformation via mechanisms such as daily routines, spatial usage, and industrial engagement. To measure the cultural resilience of traditional villages, we selected indicators that capture the enabling conditions for cultural activities and the efficacy of cultural functions. Cultural Landscape Accessibility (CLA) reflects the ease with which residents access and utilise cultural heritage spaces in their daily lives. Thereby, it characterises the actual level of heritage utilisation in traditional villages and serves to assess the adaptability and transformability of cultural resilience [31]. Cultural Facility Accessibility (CFA) reflects the developmental level of cultural activities and public cultural services in traditional villages, serving as a critical indicator of cultural resilience’s adaptive capacity [60]. Creative Space Density (CSD) intuitively reflects the degree of agglomeration of cultural industries and cultural practice carriers in traditional villages. This metric measures the tangible capacity of cultural industries to drive the rural economy, as well as the potential for sustained regeneration of cultural skills within productive and social activities [14]. These indicators measure the favourable conditions supporting various dimensions of cultural resilience, such as the transmission of cultural practices and skills, through spatial accessibility and the geographical distribution of cultural resources.
It should be noted that intangible cultural processes typically rely on in-depth fieldwork and qualitative methodologies for identification, which pose significant challenges for quantitative representation in large-sample, cross-regional spatial analyses [13]. Consequently, this study utilises POI indicators as proxy measurements for the spatial conditions and physical carriers through which cultural practices unfold. This approach enables us to elucidate the underlying mechanisms of the cultural dimension within the resilience systems of traditional villages. At the regional scale, Point of Interest (POI) data provide a consistent, spatially explicit means to represent the distribution of cultural facilities, cultural spaces, and activity venues across a large number of villages. Compared to questionnaire-based surveys or qualitative ethnographic investigations, POI-based metrics enable standardised measurement and cross-village comparisons, which are crucial for assessing resilience at a regional scale. Existing research has demonstrated that POI data can effectively capture the spatial conditions and infrastructural foundations through which cultural practices are actualised, maintained, and reproduced at the village level, thereby elucidating the spatial characteristics associated with village culture [61].
Specific indicators of community and cultural resilience in this study are measured based on Point of Interest (POI) data. Point of Interest (POI) data, characterised by its spatial explicitness, consistency, and cross-regional comparability, has been widely applied to investigate the distributional characteristics of public services and cultural activity spaces [62]. Spatial heterogeneity in POI data coverage may exist across different regions. In certain underdeveloped or data-poor regions, the Point of Interest (POI) datasets for cultural facilities and activity venues may be incomplete, potentially leading to systematic biases in the measurement of cultural vitality and service accessibility indicators. However, the potential imbalance in POI data primarily stems from data availability constraints, rather than any methodological bias inherent in the research design.

3.4. Methodological Framework

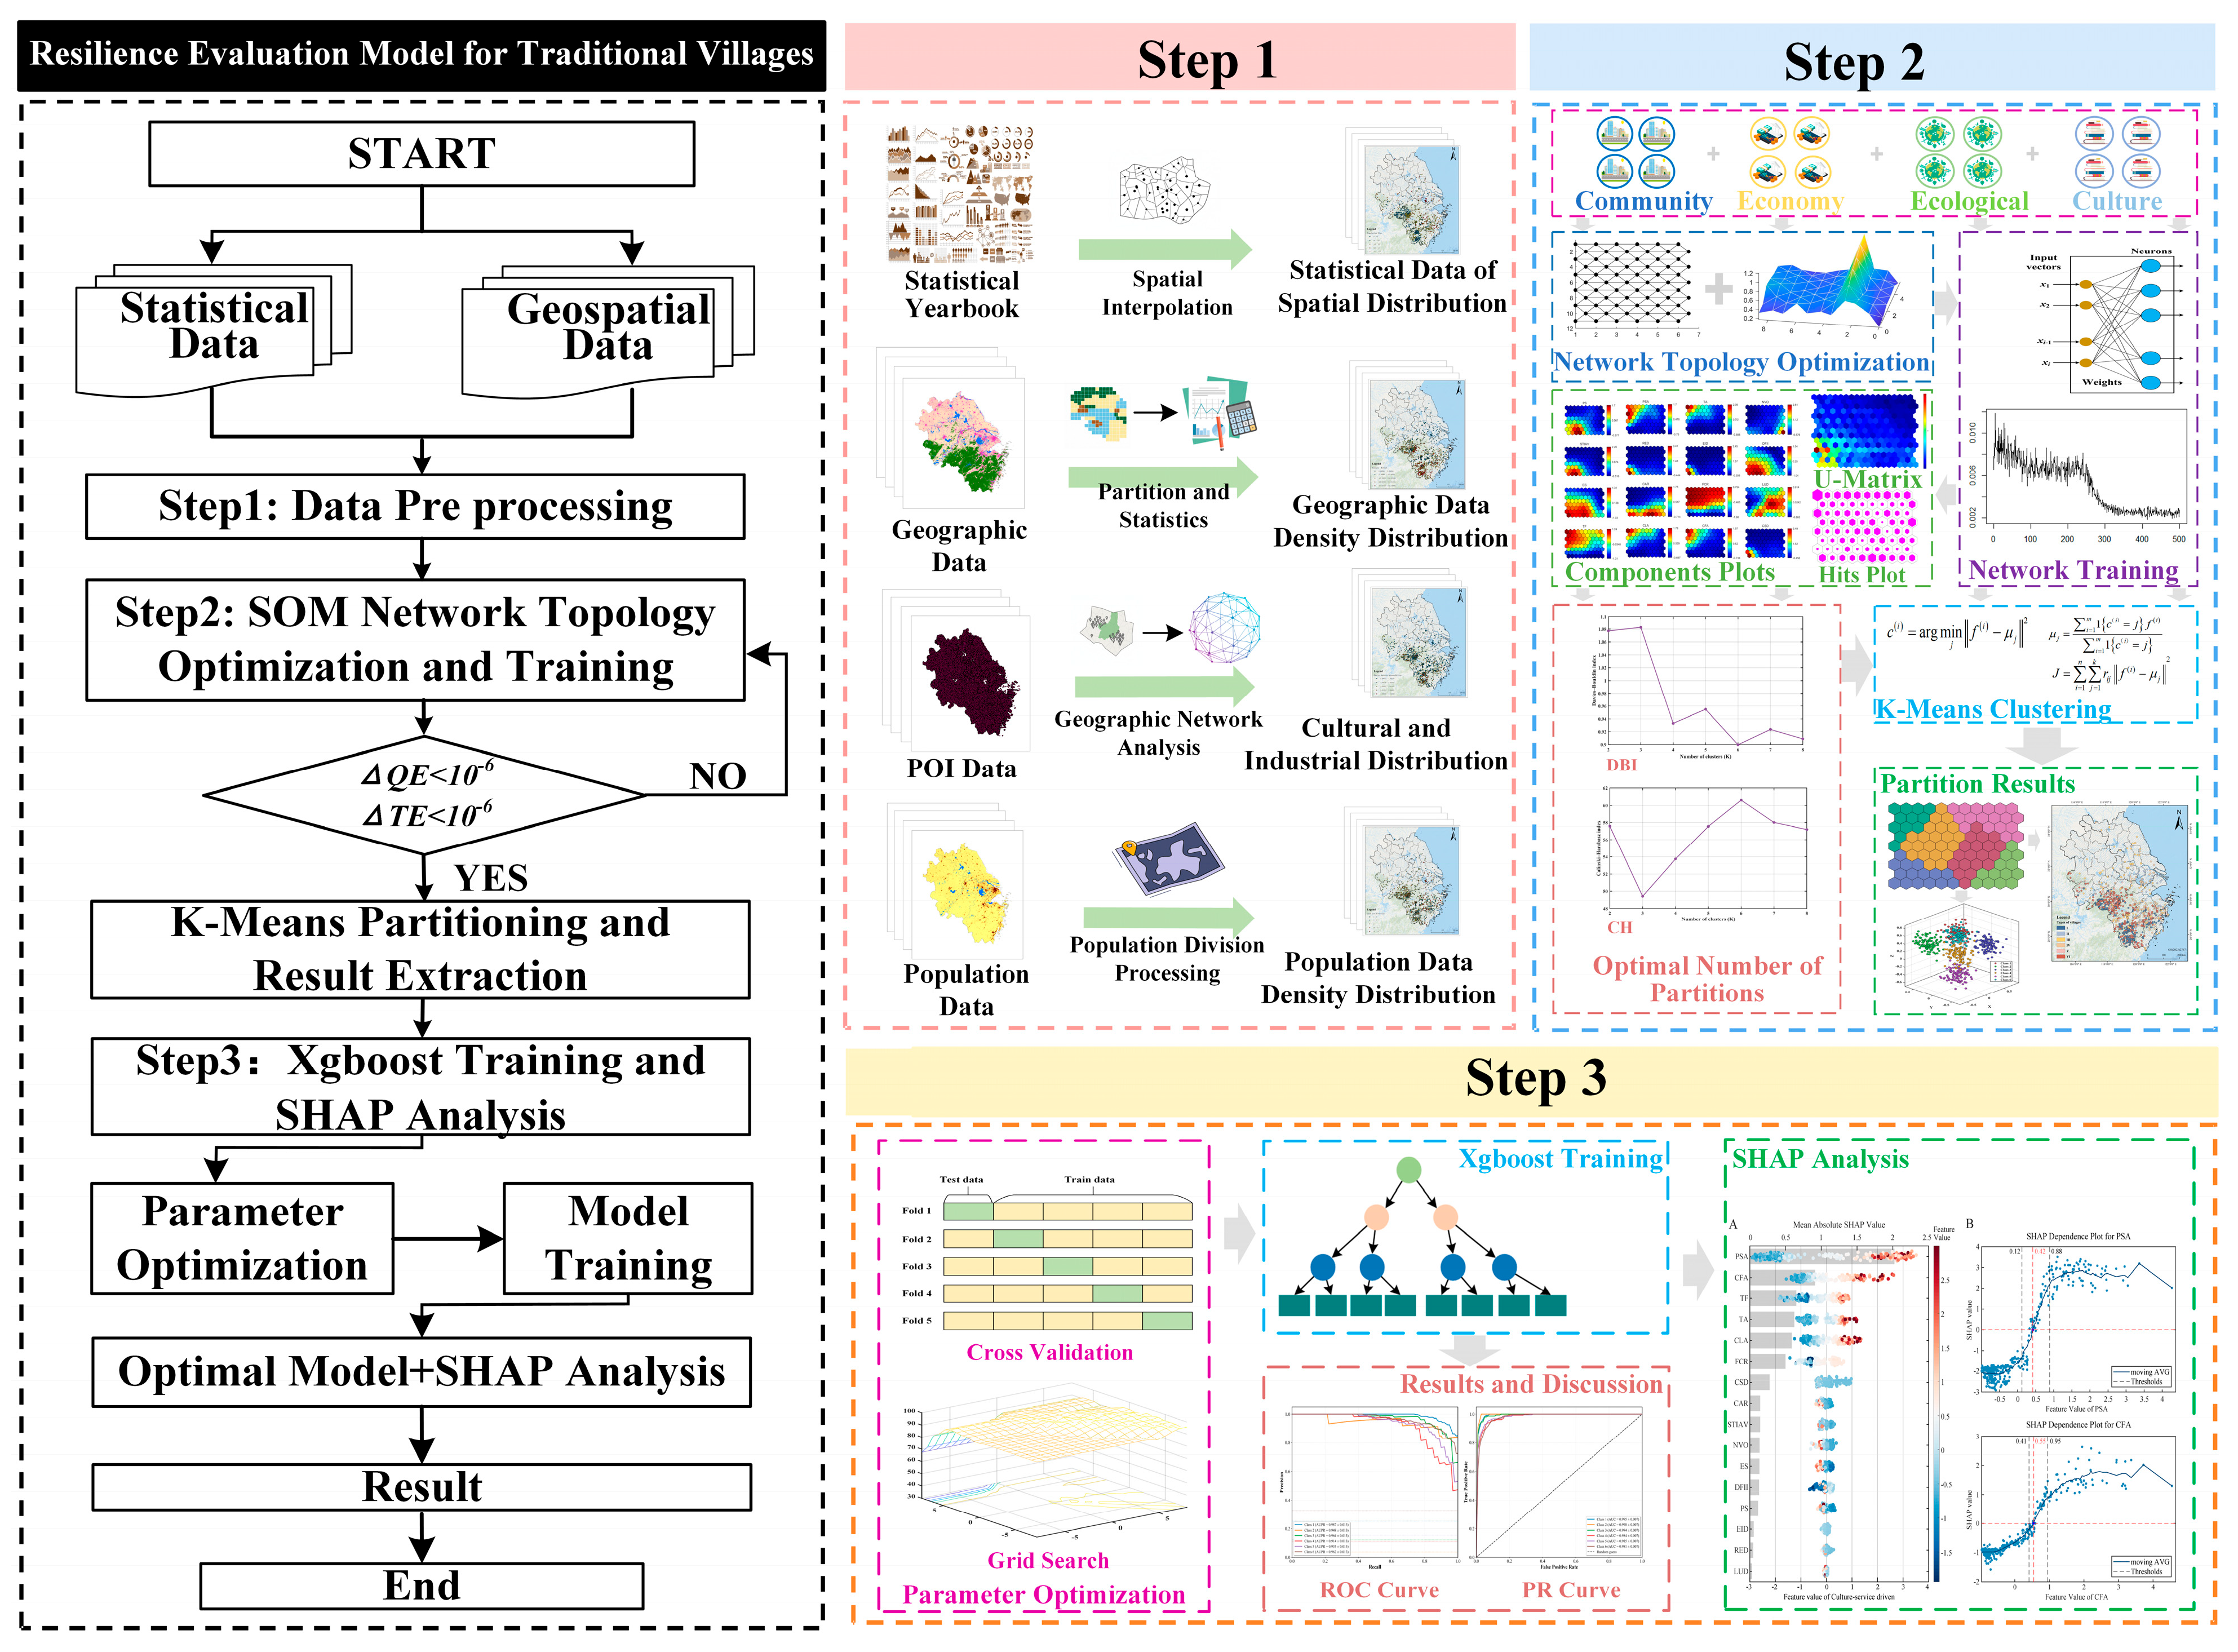
This study established a technical pipeline for identifying and interpreting traditional village resilience systems, combining unsupervised clustering with interpretable machine learning (see Figure 2). First, an indicator system for assessing traditional village resilience was constructed based on four dimensions: community, economy, ecology, and culture. And, multi-source data underwent standardised processing. Second, the study utilised a hybrid clustering methodology, integrating the Self-Organizing Map (SOM) and K-means, to identify potential traditional village resilience types and analyse their structural differences. Then, the XGBoost-SHAP interpretable model was introduced to analyse the nonlinear action characteristics and thresholds of each indicator across different village types. This ultimately clarifies the distinct driving mechanisms behind the key indicators. Finally, by integrating traditional village types with indicator action characteristics, this study yields differentiated sustainable development pathways and regionalised policy recommendations.

3.5. Model Training and Validation

3.5.1. Traditional Village Cluster Based on SOM–K-Means

This study employed a two-stage clustering method integrating SOM with K-means to identify typologies of traditional village resilience scientifically. The methodology proceeded as follows: (1) The 16-indicator dataset was Z-score standardised to ensure data comparability and model robustness. (2) The study conducted comparative tests using various competitive layer dimensions, including 6 × 8, 7 × 9, 8 × 10, and 9 × 11, to identify the optimal configuration. The comparative results indicate that a competitive layer size of 8 × 10 yields the optimal overall Quantization Error (QE) and Topographic Error (TE). This configuration effectively preserves the topological structure of the samples (see Figure S1). Consequently, the 8 × 10 grid was selected as the optimal network scale for this study. To achieve optimal training performance, we systematically explored combinations of training iterations (200–800) and initial learning rates (0.005–0.05). By evaluating the network’s performance across multiple trials under various parameter settings, we analysed parameter sensitivity and identified the optimal configuration for the SOM network. Sensitivity analysis results reveal that the QE and TE reach stable, low values at 500 iterations, ensuring that the network is sufficiently trained (see Figures S2 and S3). Simultaneously, a learning rate of 0.01 ensures an efficient convergence speed while maintaining a more stable neighbourhood structure. Because this rate proved robust for neuron activation patterns, 0.01 was ultimately selected as the initial learning rate. (3) These prototypes were then subjected to K-means clustering. To determine the optimal number of clusters, we ran multiple clustering analyses. The study performed a robustness analysis by calculating the Davies–Bouldin Index (DBI), the Average Silhouette Coefficient (ASC), and the Calinski–Harabasz (CH) Index (see Figures S4–S6). The results indicate that, after multiple trials per cluster category, the average DBI reached a local minimum (0.892) at K = 6 and subsequently stabilised, reflecting intense category discrimination. Meanwhile, the average CH Index peaked at K = 6 (60.3), suggesting that this configuration achieves the highest intra-cluster compactness and inter-cluster separation. The ASC reaches a local peak (0.539) at K = 6. These validation results confirm that K = 6 is the most statistically robust cluster count, providing the most evident differentiation of structural heterogeneities in traditional village resilience and ensuring the scientific rigour of the subsequent typological analysis. (4) All village samples were then classified into one of these six typologies based on the cluster assignment of their respective Best Matching Units (BMUs). These resulting typologies were formulated as the categorical target variable for the downstream XGBoost classification model.

3.5.2. XGBoost Modeling

This study first utilised resilience types and 16 resilience indicators as independent variables to explore the key factors affecting the sustainable development of traditional villages with different resilience types. The XGBoost algorithm was used as the core predictive model owing to its demonstrated strengths in capturing complex nonlinear relationships, mitigating overfitting through built-in regularisation, and providing feature importance rankings. To rigorously validate this choice, the study benchmarked its performance against two widely used algorithms: Random Forest (RF) and an Artificial Neural Network (ANN). The results confirmed that XGBoost outperformed the other models across key performance metrics (see Table S2). The final predictive model of the algorithm can be expressed as the sum of multiple regression trees:
y ^ i = k = 1 K f k x i ,   f k F
Denotes the predicted value of a sample, k represents the k decision tree, with k being the total number of trees, and F refers to the ensemble of all trees, where f k is generated iteratively during the boosting process. XGBoost optimises a regularised objective function to control model complexity, thereby improving generalisation capacity. In addition, it provides feature importance scores that serve as the basis for identifying key resilience indicators.
Given the imbalance in sample sizes across different traditional village resilience types, the study employed the Synthetic Minority Oversampling Technique (SMOTE) during the training phase. This approach was used to moderately oversample the minority classes, thereby mitigating the bias introduced by class imbalance. Regarding data partitioning, stratified random sampling was employed to split the dataset into an 80% training set and a 20% test set. A fixed random seed (random_state = 42) was specified to ensure reproducibility of the experiments. For robust model training and hyperparameter optimisation, the study used RandomizedSearchCV with 5-fold cross-validation. The study prioritised the macro-averaged F1-score (Macro-F1) as the primary evaluation metric during cross-validation. This choice ensures that the model performance is not dominated by the majority classes, thereby preventing skewed results and providing a balanced assessment across all resilience types. The five-fold cross-validation results yielded a macro-F1 score of 0.888 ± 0.021, indicating that the model performs consistently across different folds without signs of overfitting (see Table S3). Simultaneously, the Precision and Recall across all categories performed consistently well, indicating that the model effectively balances the identification of both majority and minority classes while demonstrating strong generalisation capability. The optimal configuration was determined as n_estimators = 100, max_depth = 7, learning_rate = 0.2, subsample = 0.7, and colsample_bytree = 0.7. A final XGBoost model was then retrained on the entire training dataset with these optimised parameters.

3.5.3. SHAP (Shapley Additive Explanation)

SHAP was employed as an interpretability tool for the XGBoost model to quantify the marginal contributions and effects of individual indicators on predicting resilience types in traditional villages. Sixteen resilience indicators were input into the trained XGBoost model, and SHAP values were calculated at the sample level for each indicator. The core computational formula is expressed as follows:
ϕ i = S F i   S ! F S 1 ! F ! f S U i x S U i f S x S
Here, ϕ i is the SHAP value for feature i , which measures its positive or negative effect on the resilience type of traditional villages. F represents the set of all features, S is a subset of features excluding feature i , and f S indicates the predicted resilience level under the feature subset S . By aggregating SHAP values across all samples, the global importance ranking of resilience indicators is obtained. Combined with SHAP value distributions, this approach reveals nonlinear relationships between resilience indicators and resilience types in traditional villages, thereby providing a scientific basis for the sustainable development of villages across different resilience categories.

4. Result

4.1. Resilience Assessment Results

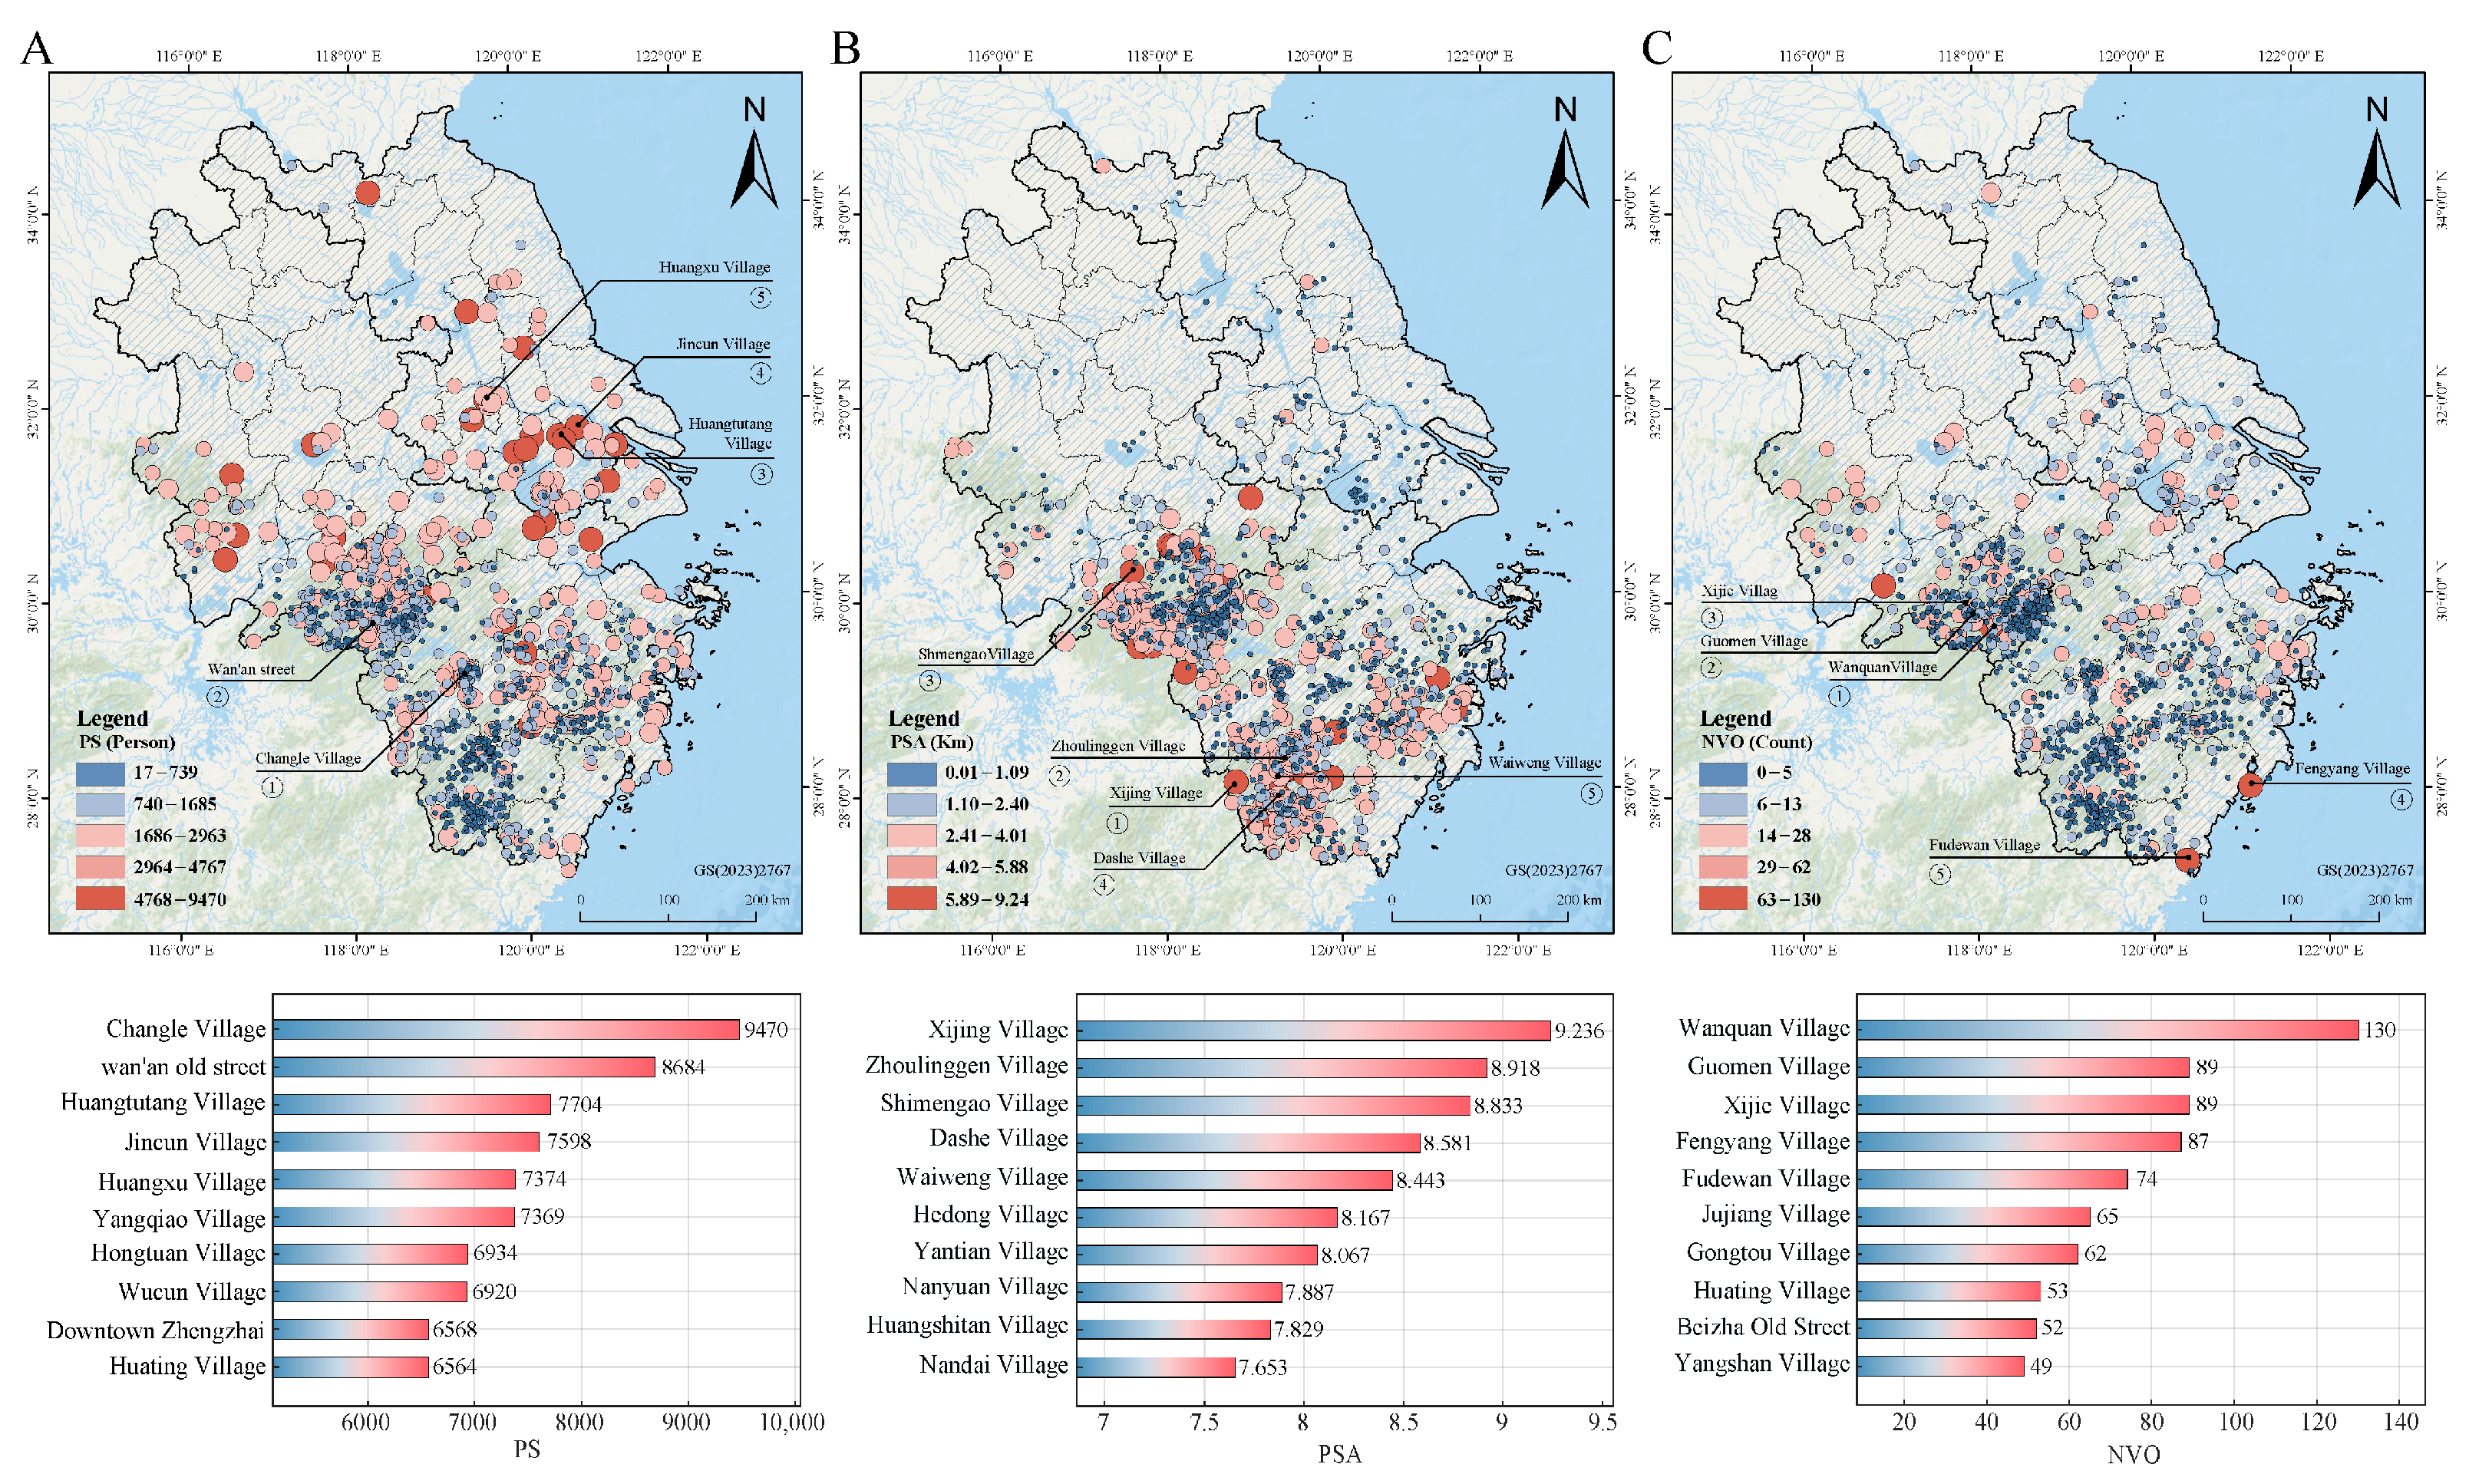
Figure 3A–C illustrates the spatial distribution of community resilience–related indicators in traditional villages across the Yangtze River Delta. Figure 3A shows that village populations tend to be larger in the southeastern coastal areas and the central Zhejiang Plain, while smaller in the mountainous regions of the south and southeast. This spatial pattern closely aligns with differences in terrain and transportation access. Figure 3B indicates that public service facilities are more developed in the southern part of the region, whereas infrastructure services are generally less available in the northern areas. Figure 3C reveals that village organisation density is relatively high in south-central Zhejiang and coastal zones but significantly lower in northern Anhui and northern Jiangsu, thereby displaying an overall gradient that decreases from core areas toward the periphery.
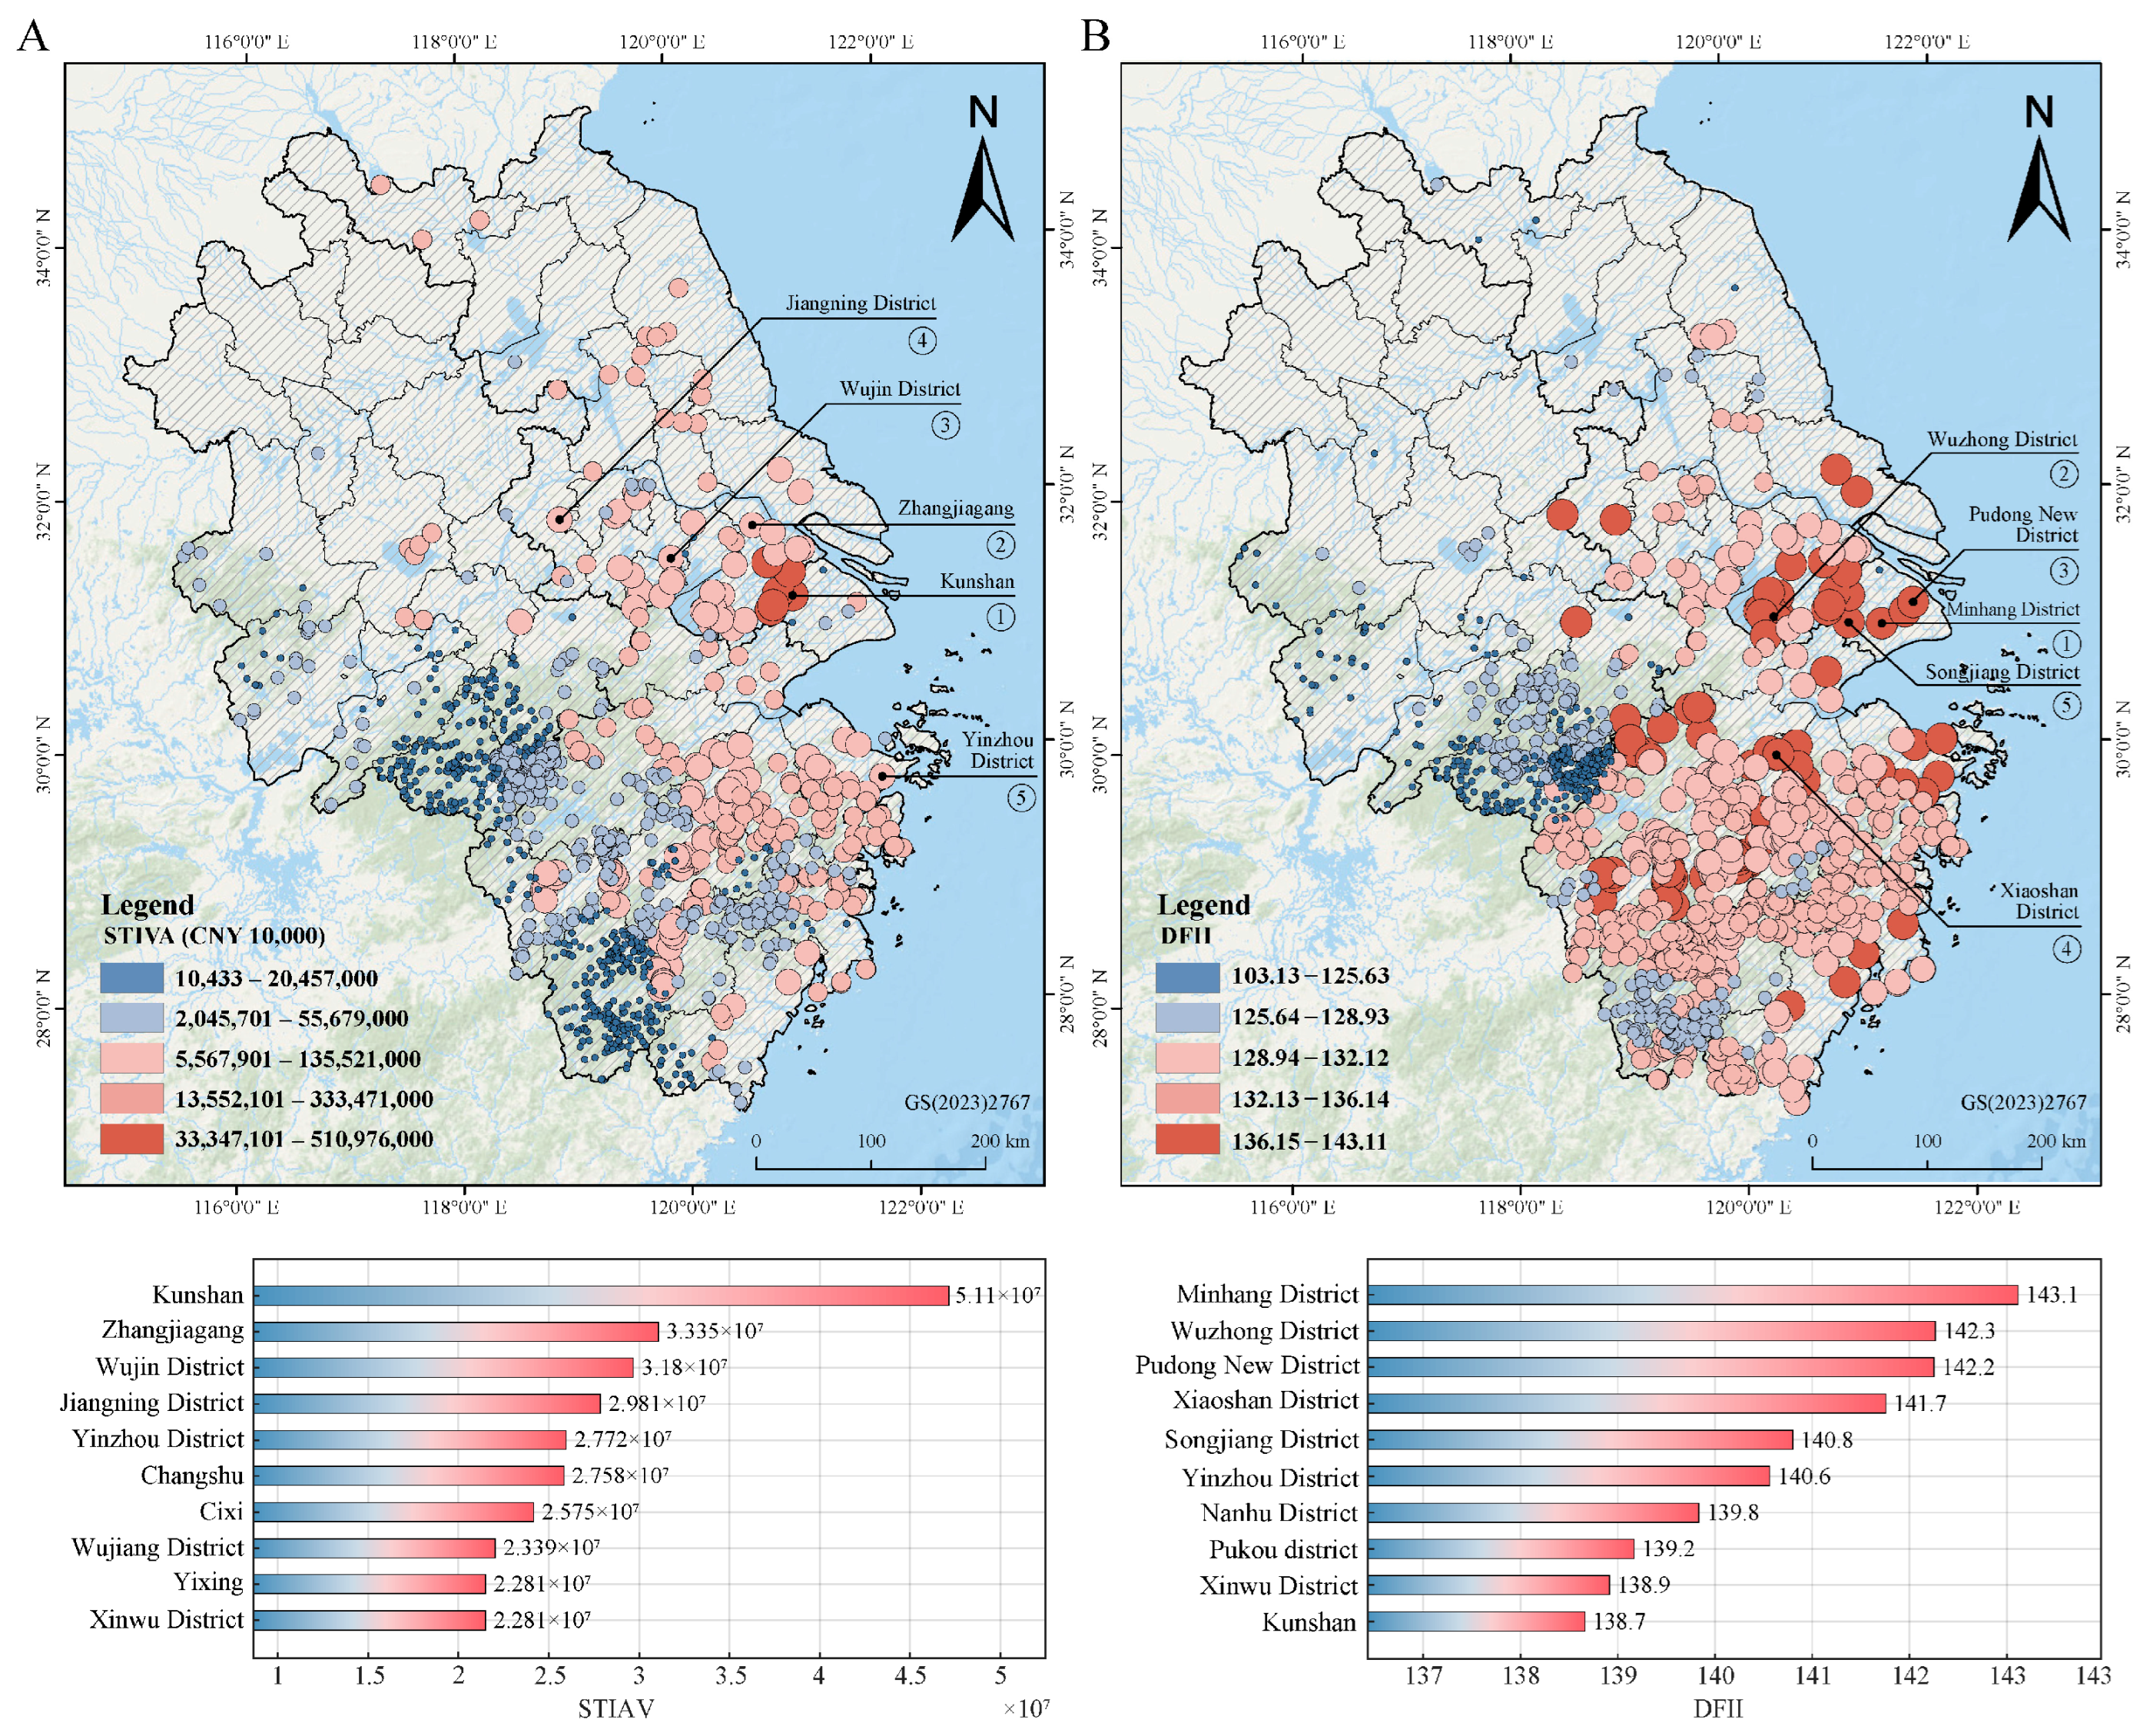
Figure 4A,B presents the spatial distribution of economic resilience–related indicators in traditional villages. Figure 4A shows that high-value industrial clusters are concentrated in the eastern regions near urban agglomerations and major transportation corridors, suggesting that industrial transformation in these regions is relatively advanced. Concurrently, the southern and southwestern regions exhibit lower levels of transformation. Figure 4B indicates that villages exhibiting higher levels of digital financial inclusion are primarily located around metropolitan areas.
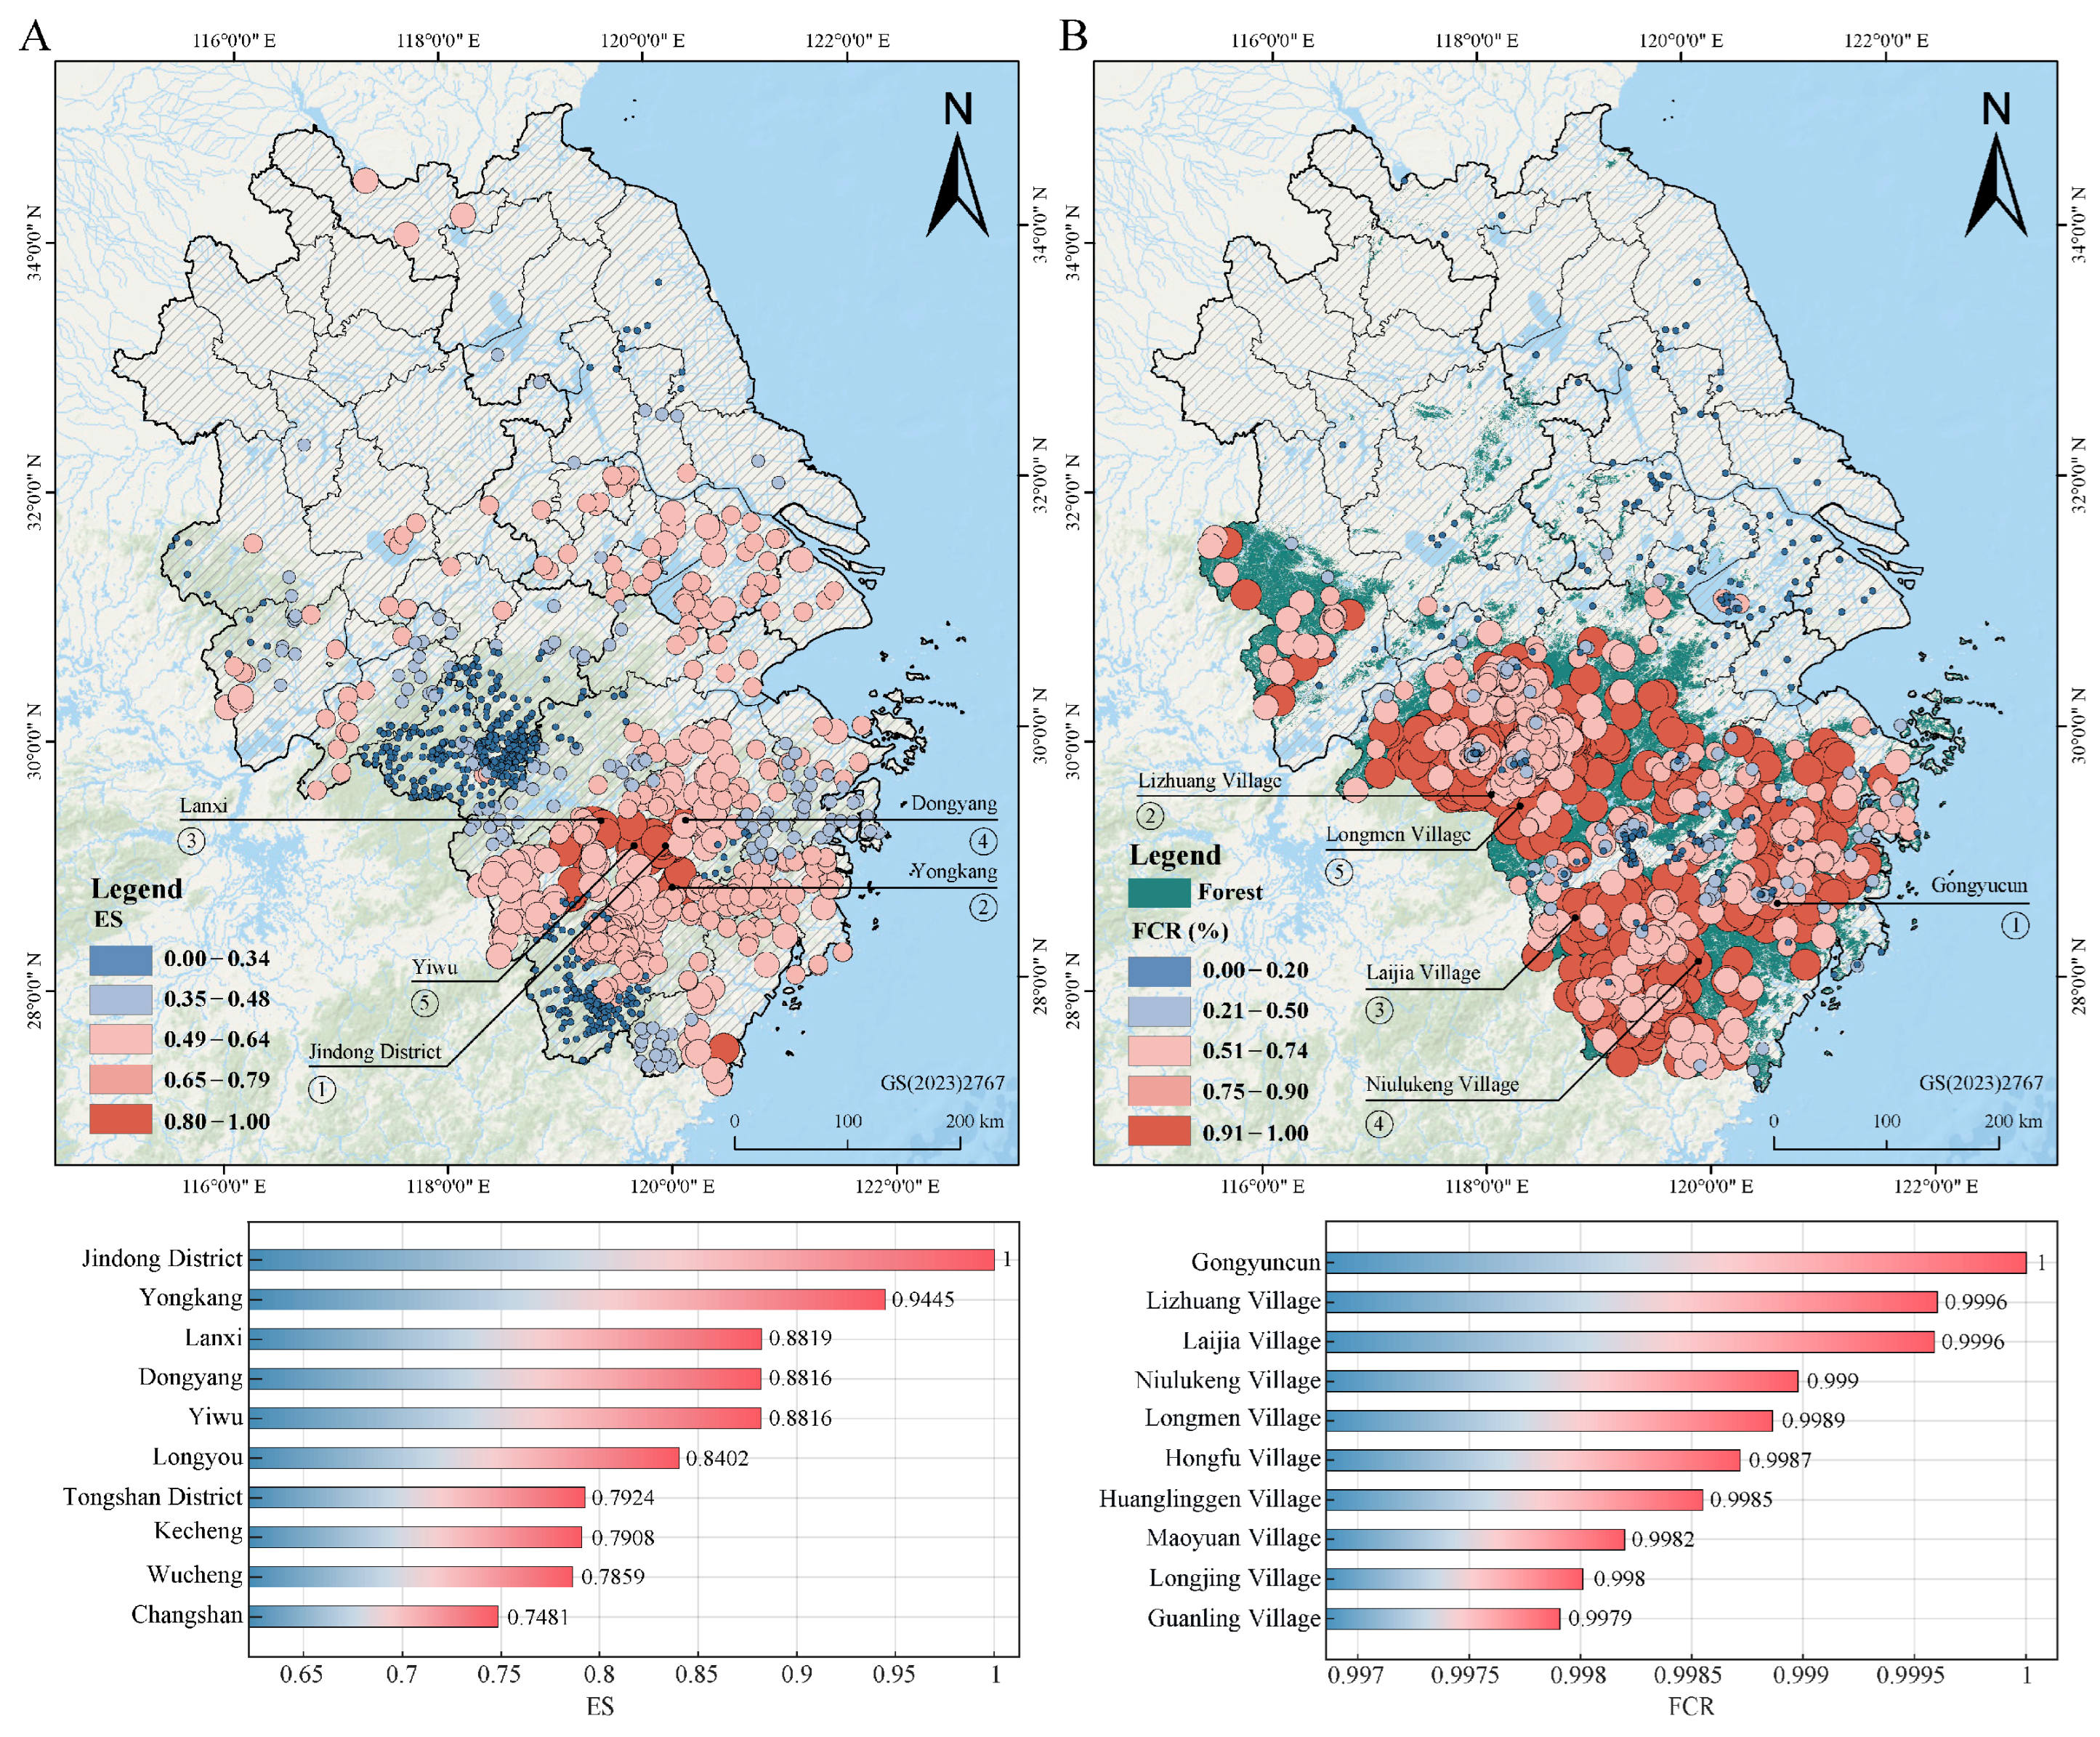
Figure 5A,B shows the spatial distribution of ecological resilience indicators—ecosystem sensitivity and forest coverage ratio—in traditional villages. Figure 5A illustrates that ecosystem sensitivity is relatively high in the southern hilly areas, whereas the northern and eastern coastal regions exhibit more stable ecosystems. Figure 5B shows that forest coverage ratios are generally higher in the southern hilly regions and decline gradually toward the coastal plains.
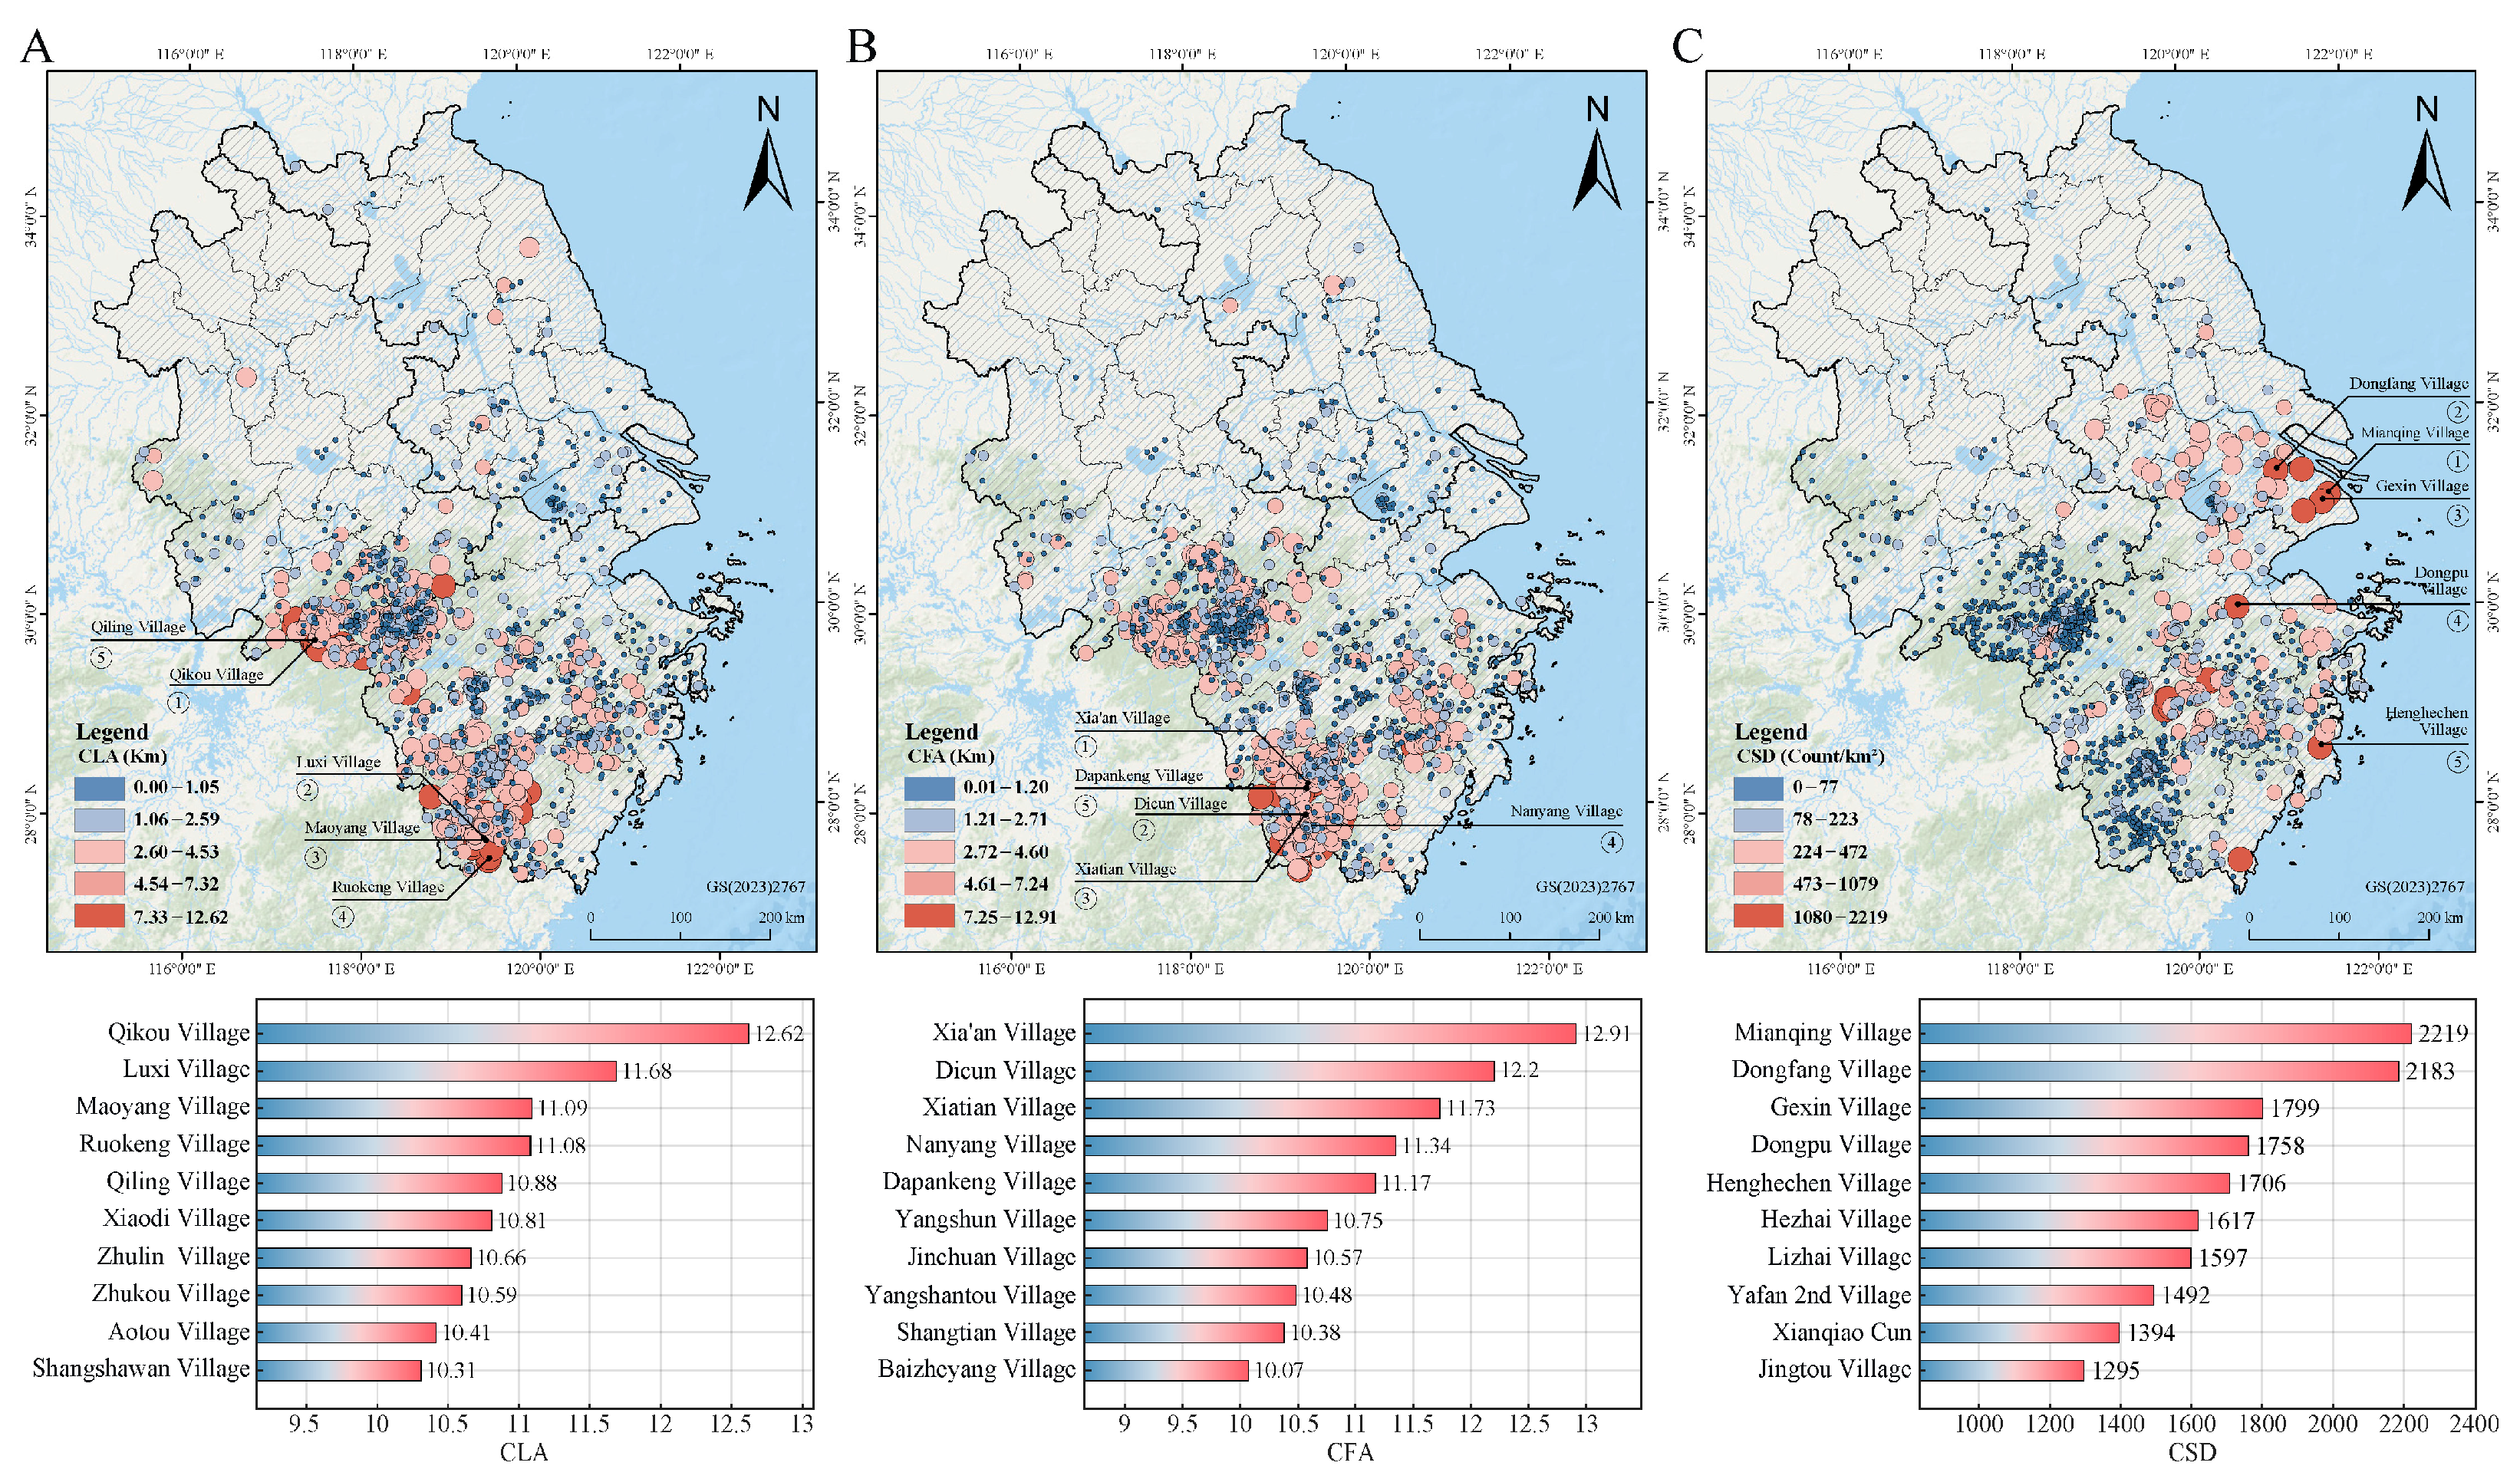
Figure 6A–C presents the spatial distribution of cultural resilience indicators. Figure 6A shows that the southeastern region exhibits a relatively balanced distribution of cultural landscapes, forming a well-structured cultural spatial system. Conversely, the southwestern region displays a fragmented and uneven pattern, with cultural landscapes being scattered and lacking systematic organisation. Figure 6B indicates that cultural facility accessibility is highest in the southeastern areas. Figure 6C demonstrated that traditional villages in the plains hosted a larger number of creative spaces, reflecting stronger resource transformation capacity, while the southern and southwestern regions displayed relatively weaker cultural resource conversion capacity.

4.2. Analysis of Clustering Results

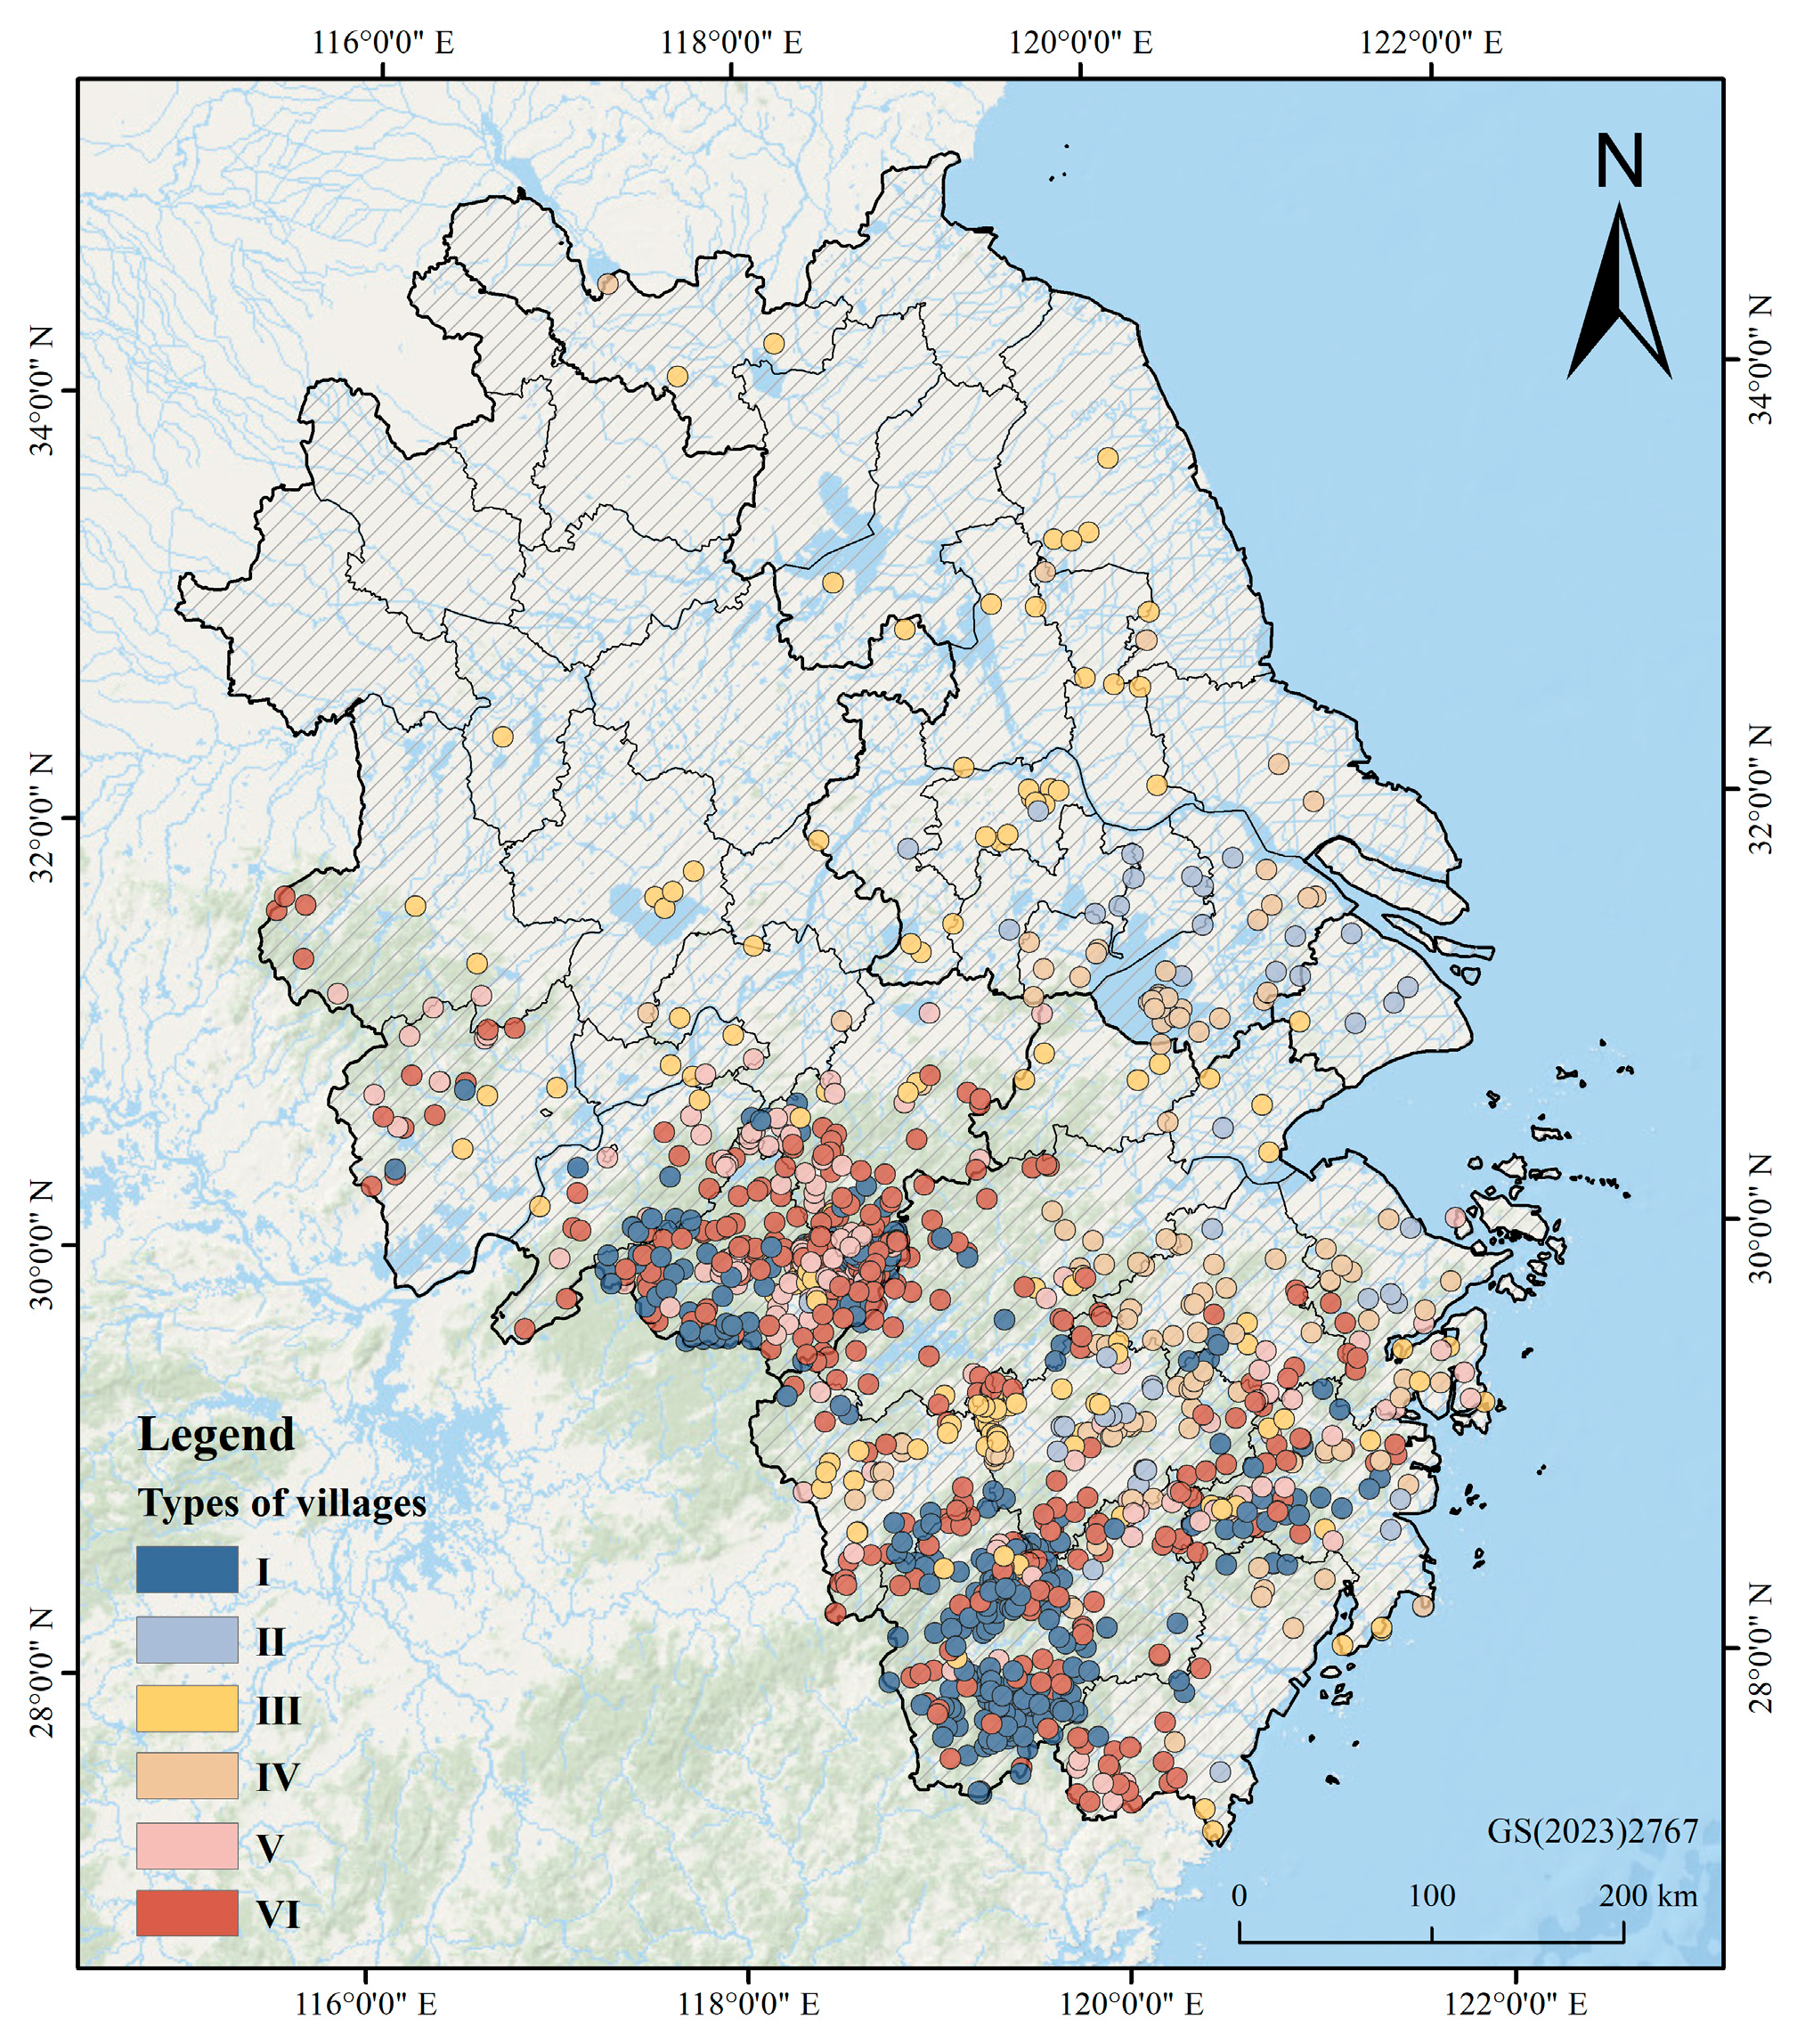
The SOM–K-means clustering identified six resilience types of traditional villages. Significant differences exist among these types, as illustrated in Figure 6. Traditional villages are mainly concentrated in the southern and southeastern parts of the Yangtze River Delta. At the same time, they are less common in the northern areas and around core metropolitan zones.
According to Figure 7, type VI villages are the most numerous among the six categories, accounting for 32.6% of the total sample. They are predominantly located in the southern and southwestern regions’ mountainous and river-valley areas, with relatively few in the northern and coastal plains. The second-largest group is Type I villages, which account for 25.1% of the sample. These villages are mainly distributed in the peripheral zones of mountainous areas, forming banded patterns that overlap considerably with Type VI, especially in the southern area. Type III and Type IV villages are primarily found in low-elevation plains and coastal zones, generally forming banded distributions along plains and major rivers. Type V villages are mainly concentrated in the southwestern areas and southern river valleys, showing strong spatial proximity to Type I and Type VI villages. By contrast, Type II villages are the least numerous and are scattered across the eastern plains and central Zhejiang river valleys, frequently interspersed with Type IV villages.
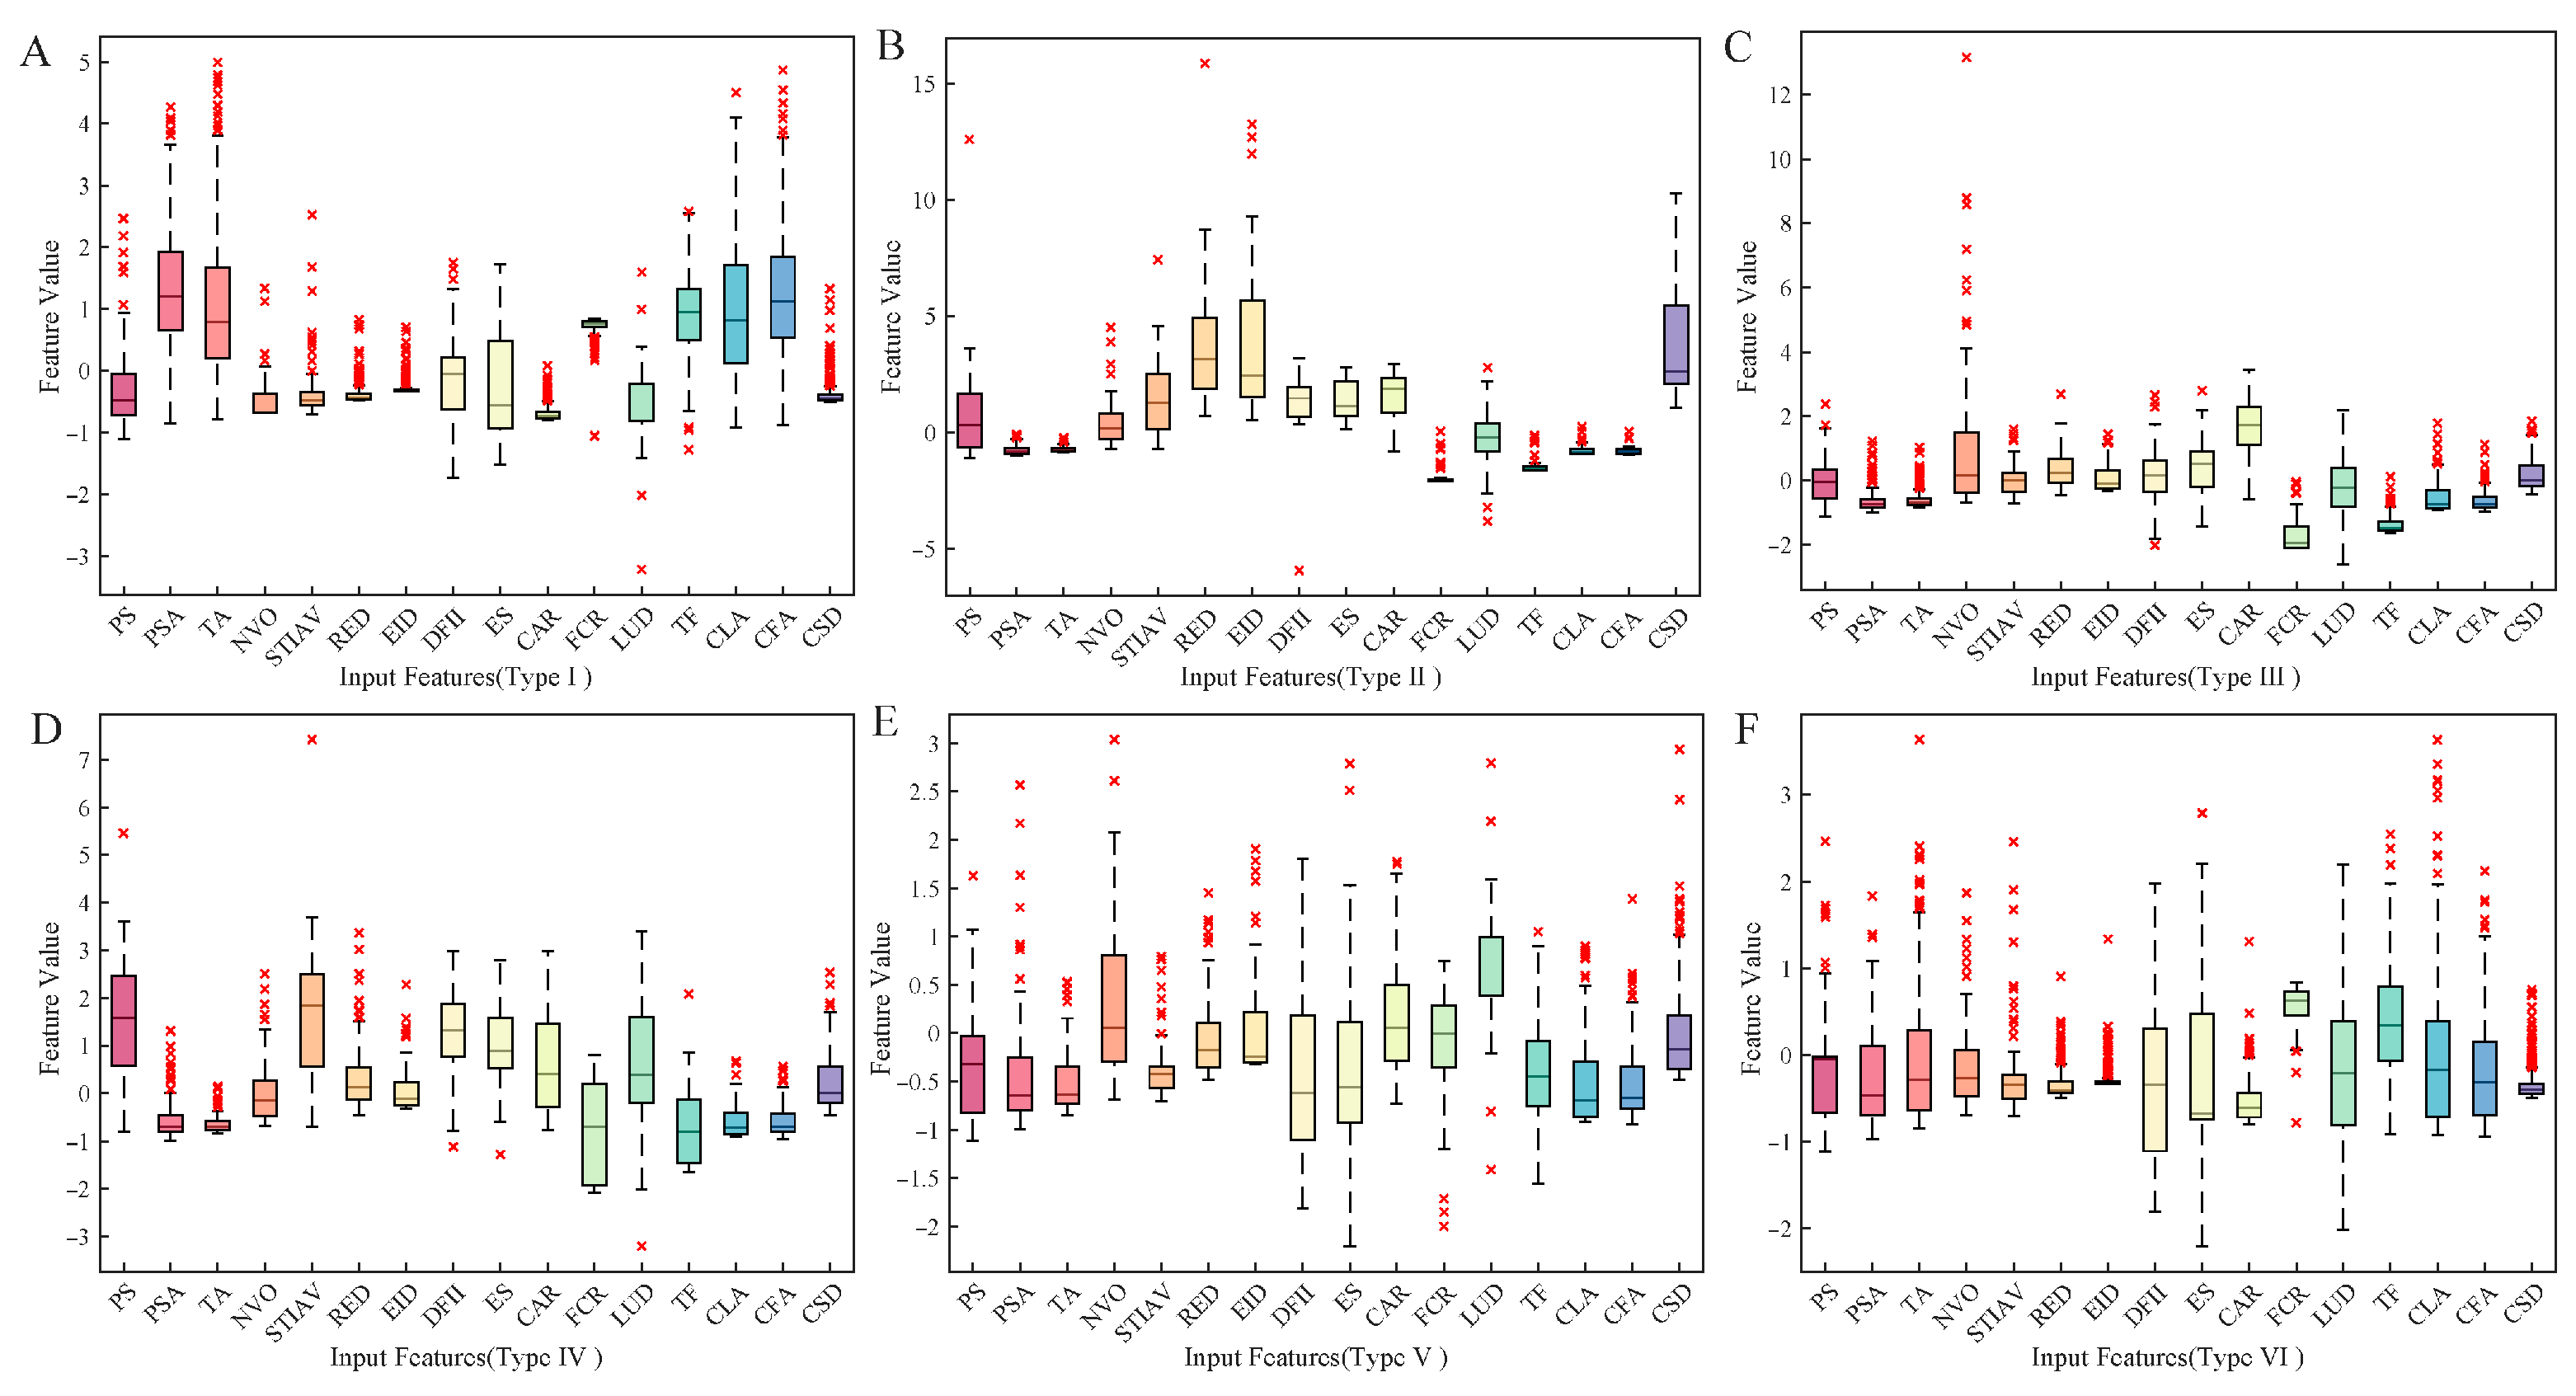
According to Figure 8, traditional villages exhibit apparent structural differences across the community, economic, ecological, and cultural dimensions. Figure 8 presents box plots of the six identified traditional village resilience types, with the horizontal (X-axis) axis representing the resilience indicators and the vertical (Y-axis) denoting the standardised scores for each indicator. A value of 0 on the vertical axis signifies an indicator’s value at the average level across all villages.
Figure 8A shows that type I villages are characterised by strong public service and cultural facility accessibility, despite smaller populations and low-density industrial structure. Figure 8B indicates that Type II villages exhibit diversified, relatively well-developed industries, high levels of digitalisation, and concentrated creative spaces. Figure 8C shows that Type III villages have medium populations and significantly high village organisation density. Their industrial development is limited, but they have higher farmland shares and better access to cultural landscapes, along with some creative spaces. Figure 8D demonstrates that Type IV villages leverage significant demographic advantages and diversified industrial structures, especially in traditional industries. They have abundant farmland but low forest cover, slightly higher ecosystem sensitivity, and weak cultural indicators. Figure 8E indicates that Type V villages exhibit high village organisation density and are ecologically friendly, with high forest cover, diverse land use, and low ecosystem sensitivity. Their industrial structures are simple, and cultural indicators are generally weak. Figure 8F shows that moderately small populations characterise Type VI villages, weak public services and transportation, and low industrial density.

4.3. Model Evaluation

During the hyperparameter optimisation phase, the best-performing model configuration achieved a macro-averaged F1-score of 0.852 ± 0.021 (mean ± standard deviation) in 5-fold cross-validation, providing initial evidence of its effectiveness and stability. To further assess its ultimate generalisation capability, this model was then applied to an independent test set. According to the results in Table 3, the model demonstrates strong reliability and generalisation capacity in identifying resilience indicators of traditional villages. The overall accuracy on the testing set reached 0.8925, while the macro-averaged and weighted-averaged F1 scores were 0.8859 and 0.8916, respectively, indicating that the model maintained relatively balanced classification performance under imbalanced sample distributions. At the category level, the F1-scores of the six resilience types ranged from 0.8179 to 0.9380. These findings suggest the model possesses strong discriminative power for the major categories, but its recognition of small-sample categories remains limited.
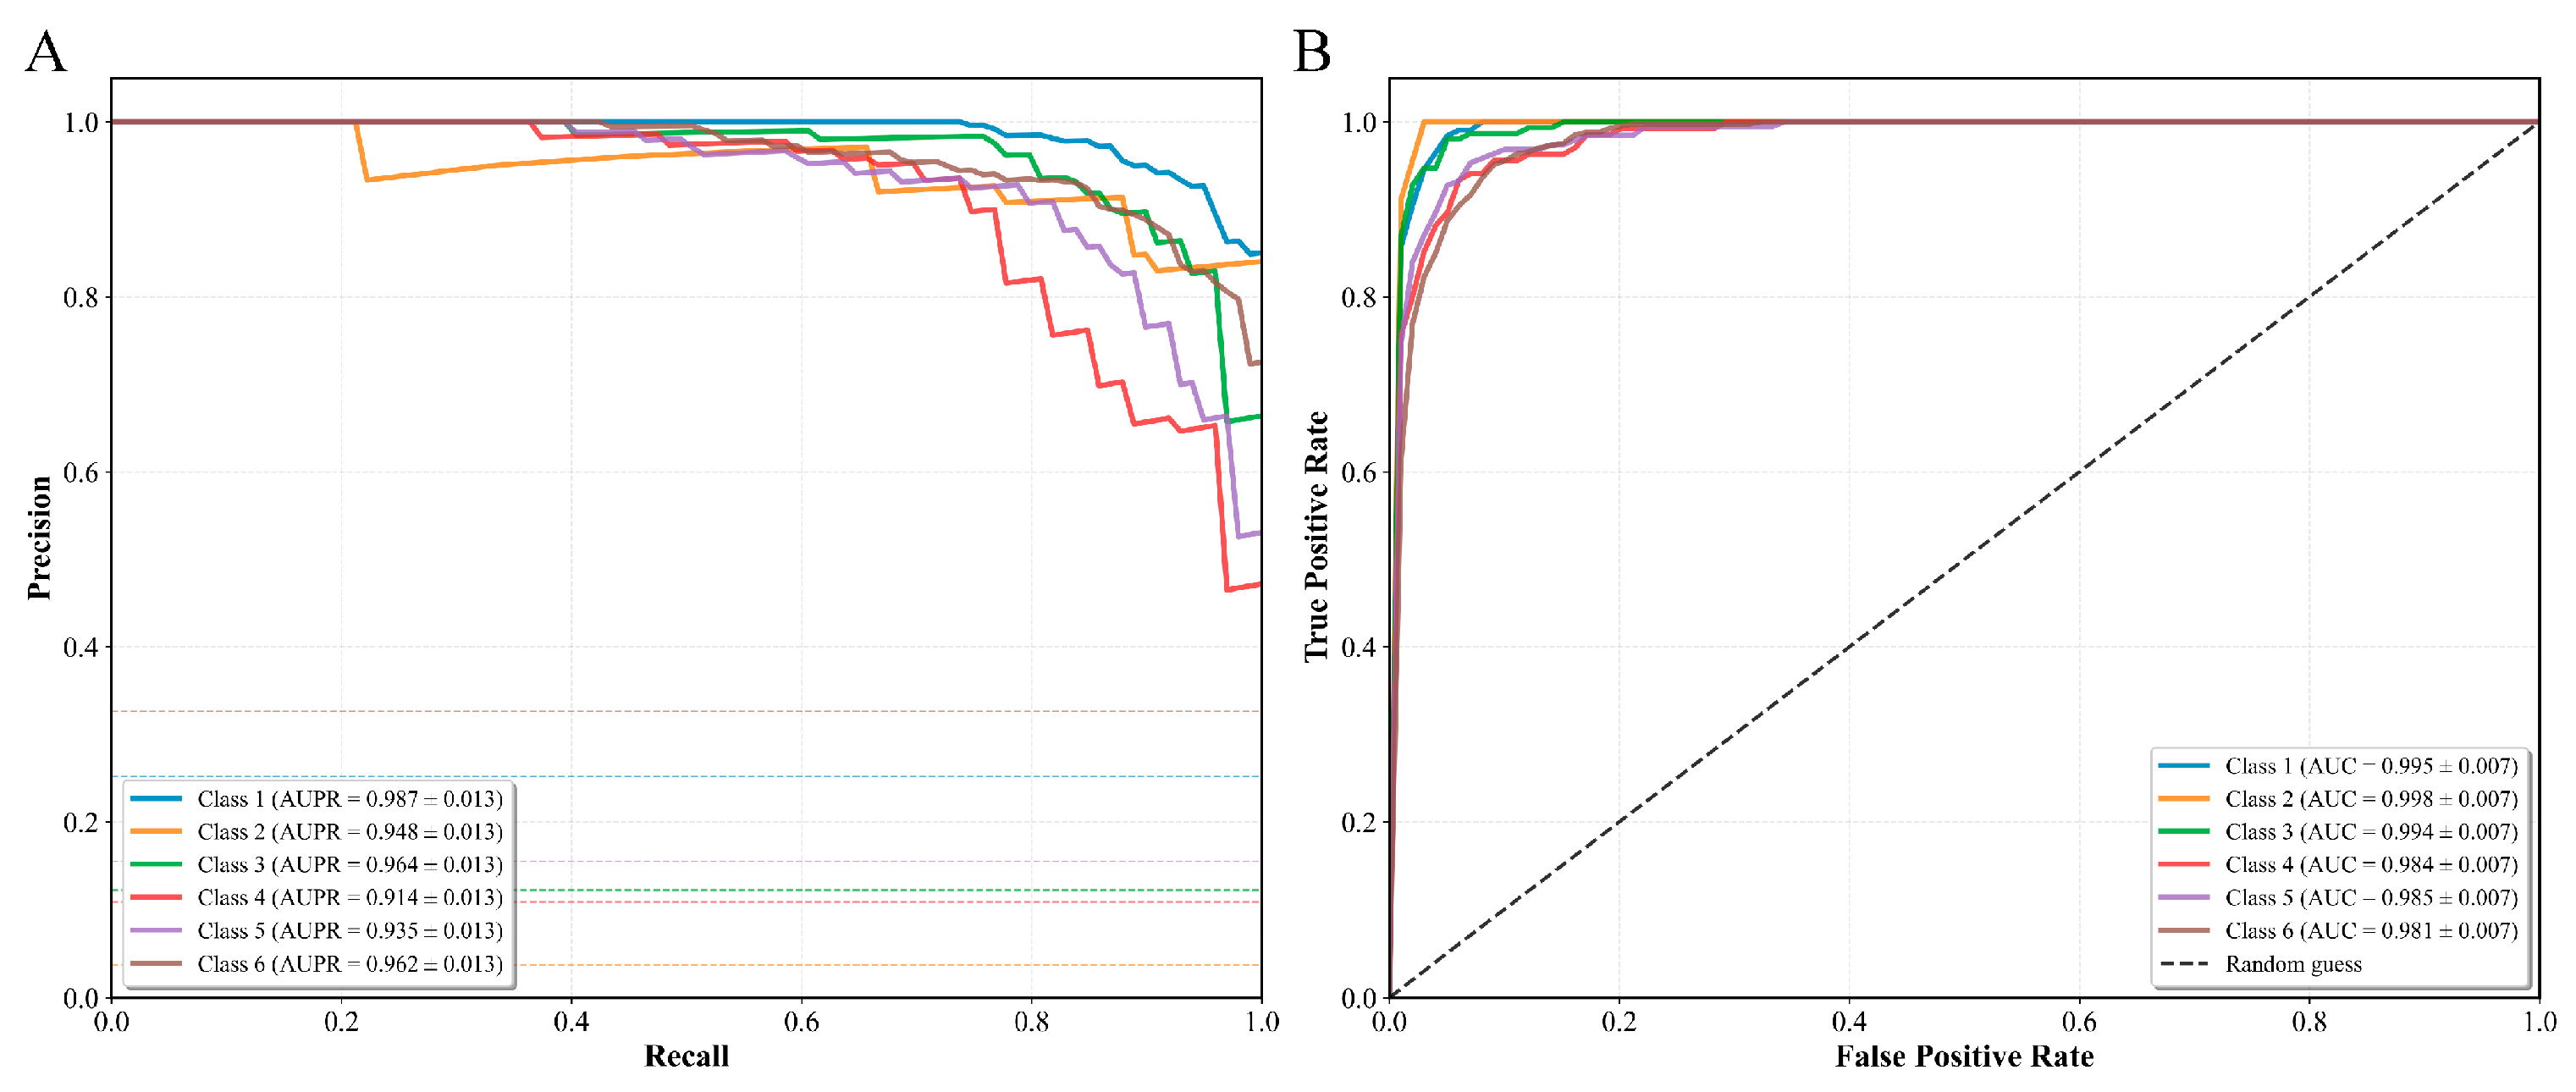
The results of cross-validated ROC and PR curves further confirm the model’s stability (Figure 9). The AUC values for all categories ranged from 0.981 to 0.998, and the AUPR values ranged from 0.914 to 0.987, with standard deviations of approximately ±0.007 and ±0.013, respectively. These results indicate minimal variation across categories, validating the model’s overall stability and robustness. However, the PR curves for Types IV and V were lower than those of the other four categories, suggesting that their relatively small sample sizes or the similarity of their feature distributions limited recall performance. Given that this study aims to explore the developmental pathway differences among village types, these two categories were retained for subsequent analysis. The model demonstrated high accuracy and stability in multi-class classification, although its performance in minority-class recognition requires improvement. Future work could address this limitation by expanding sample sizes or enhancing feature differentiation.

4.4. Indicator Contribution Analysis

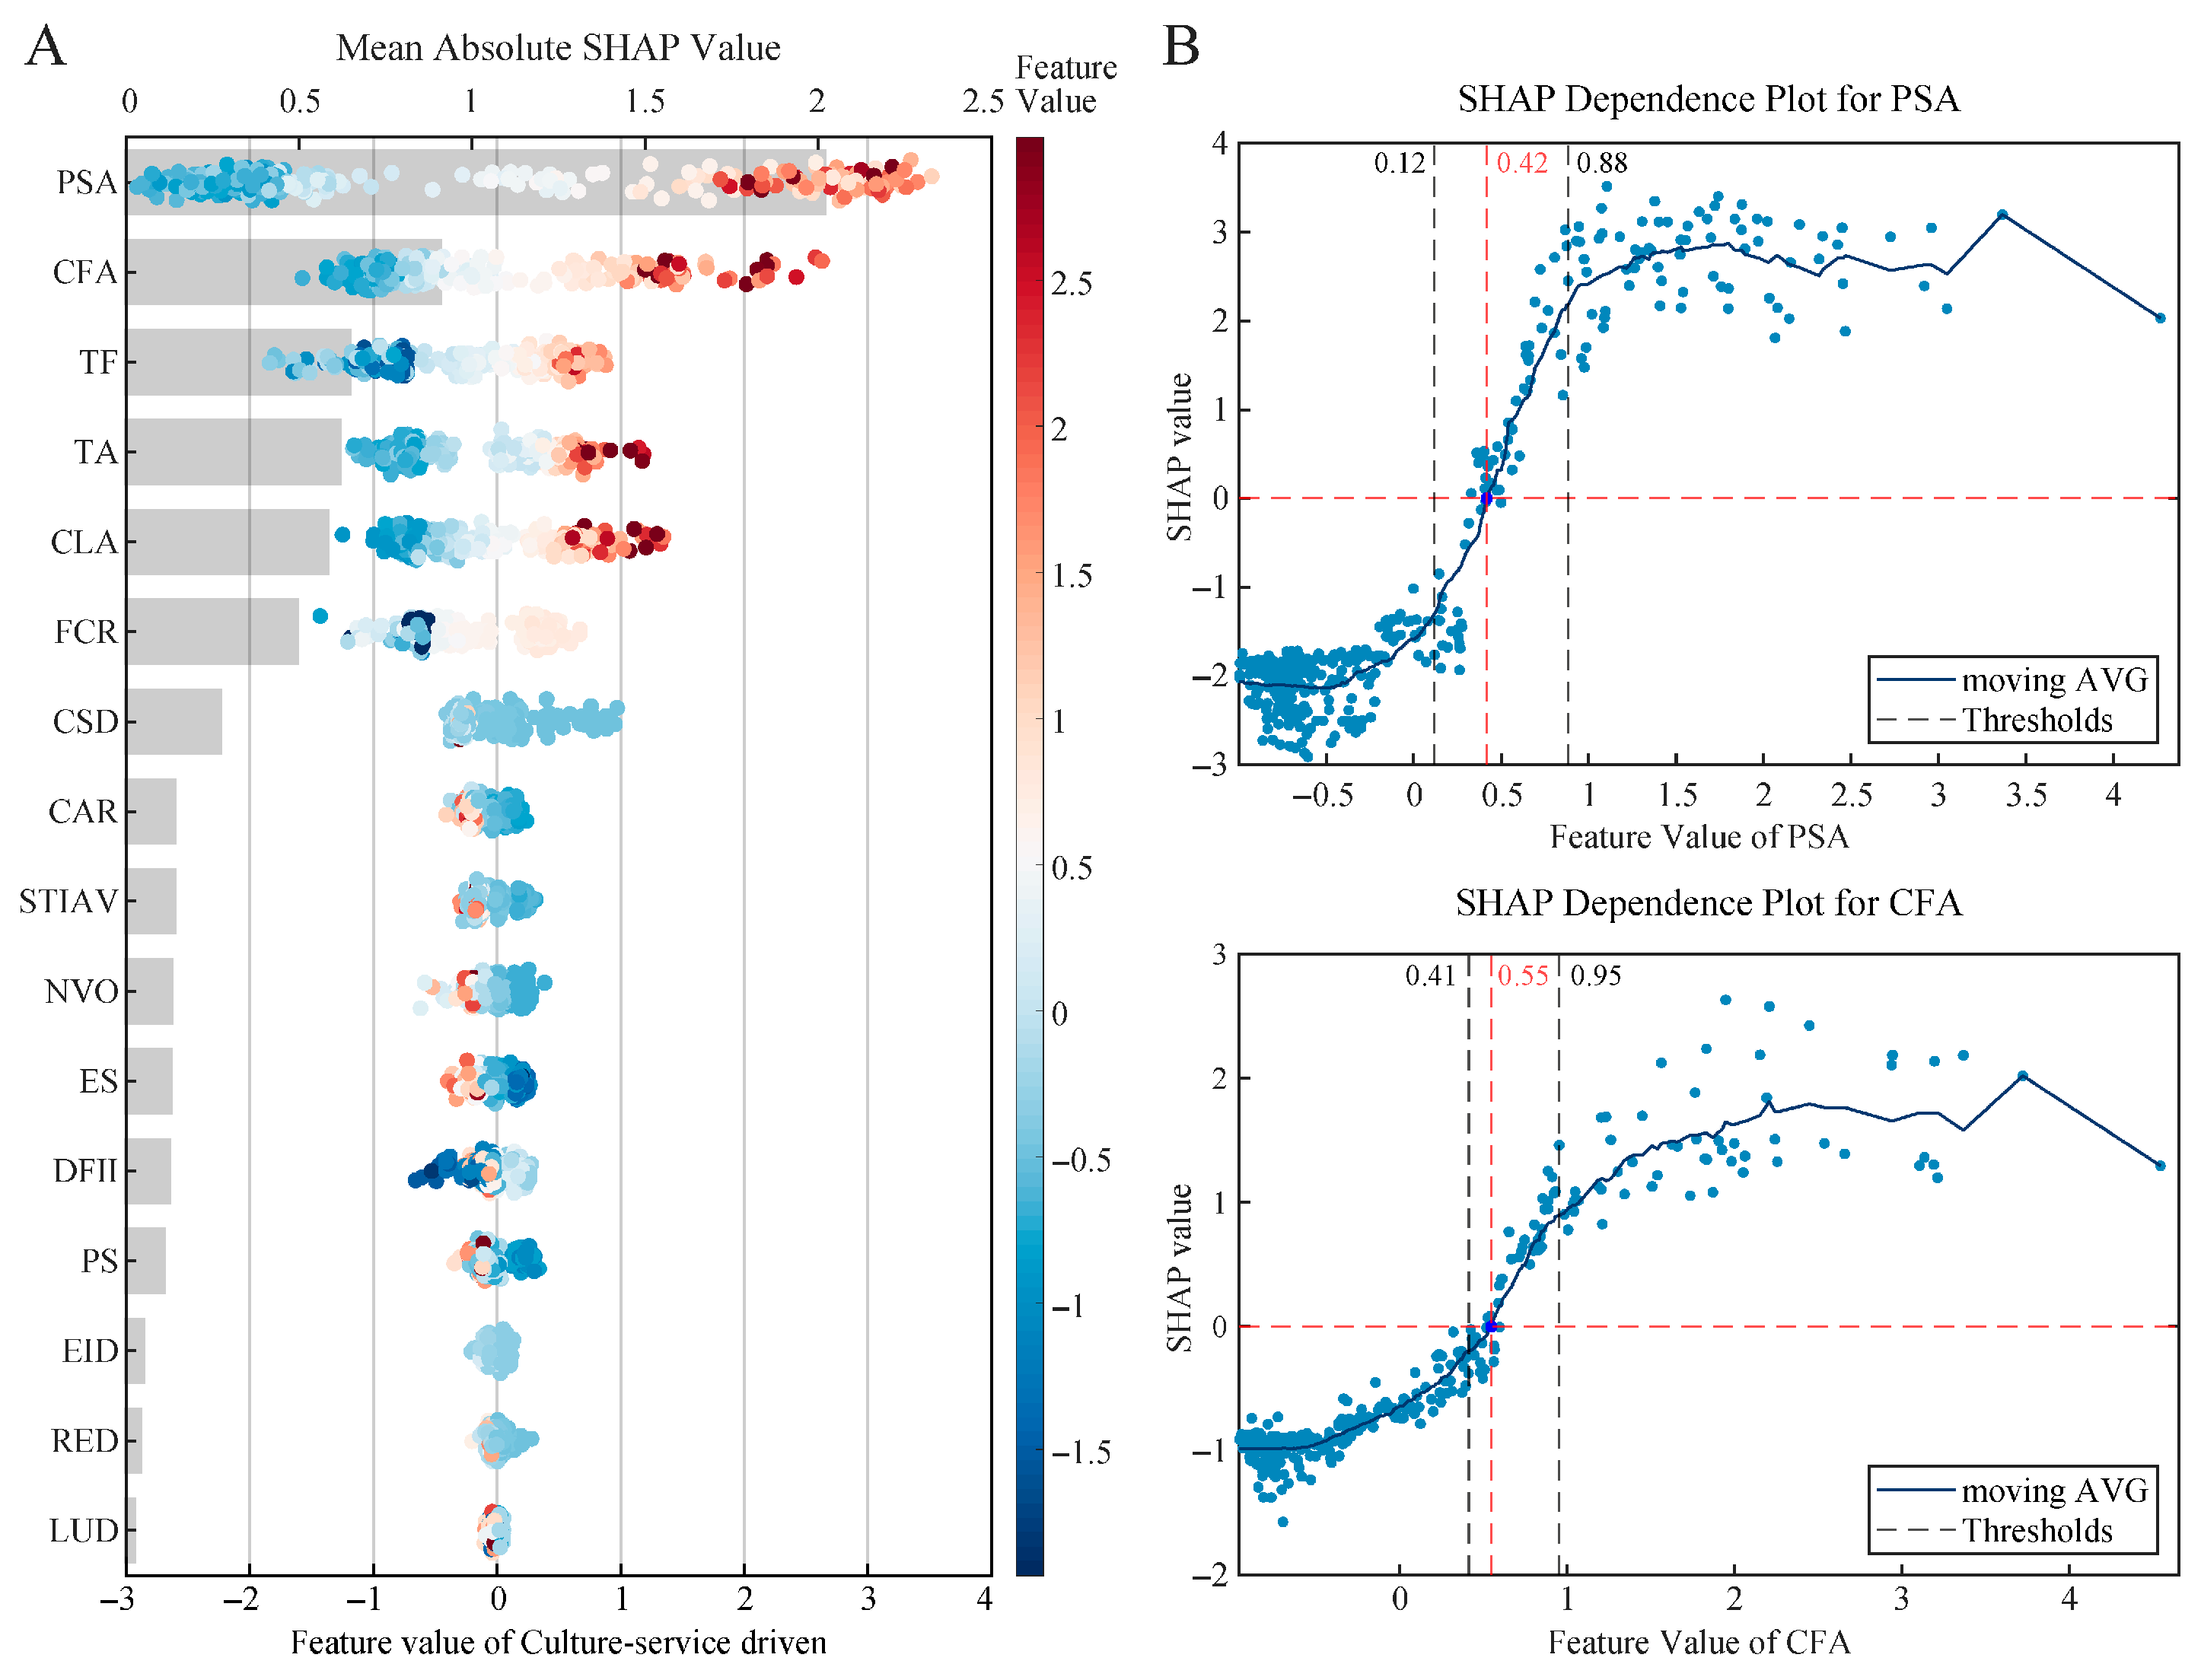
Type I traditional villages are “culture–service driven”. The resilience of this type is primarily influenced by public service accessibility (PSA) and cultural facility accessibility (CFA). These two indicators capture the maturity of public infrastructure and cultural service systems during the village transformation process. As shown in Figure 10B, the contribution curves for Public Service Accessibility (PSA) and Cultural Facility Accessibility (CFA) share a similar thresholded pattern. For PSA, once its marginal contribution exceeds 0.12 SD, the positive effect on resilience rises sharply, marking a shift from fragmented provision to a basic, networked system. As PSA approaches 0.88, marginal gains plateau or decline slightly, suggesting that excessive facility concentration can reduce utilisation efficiency. By contrast, CFA’s inflection occurs at 0.55, indicating that cultural facilities begin to translate cultural resources into system support only after a minimum level of functional integrity is achieved.
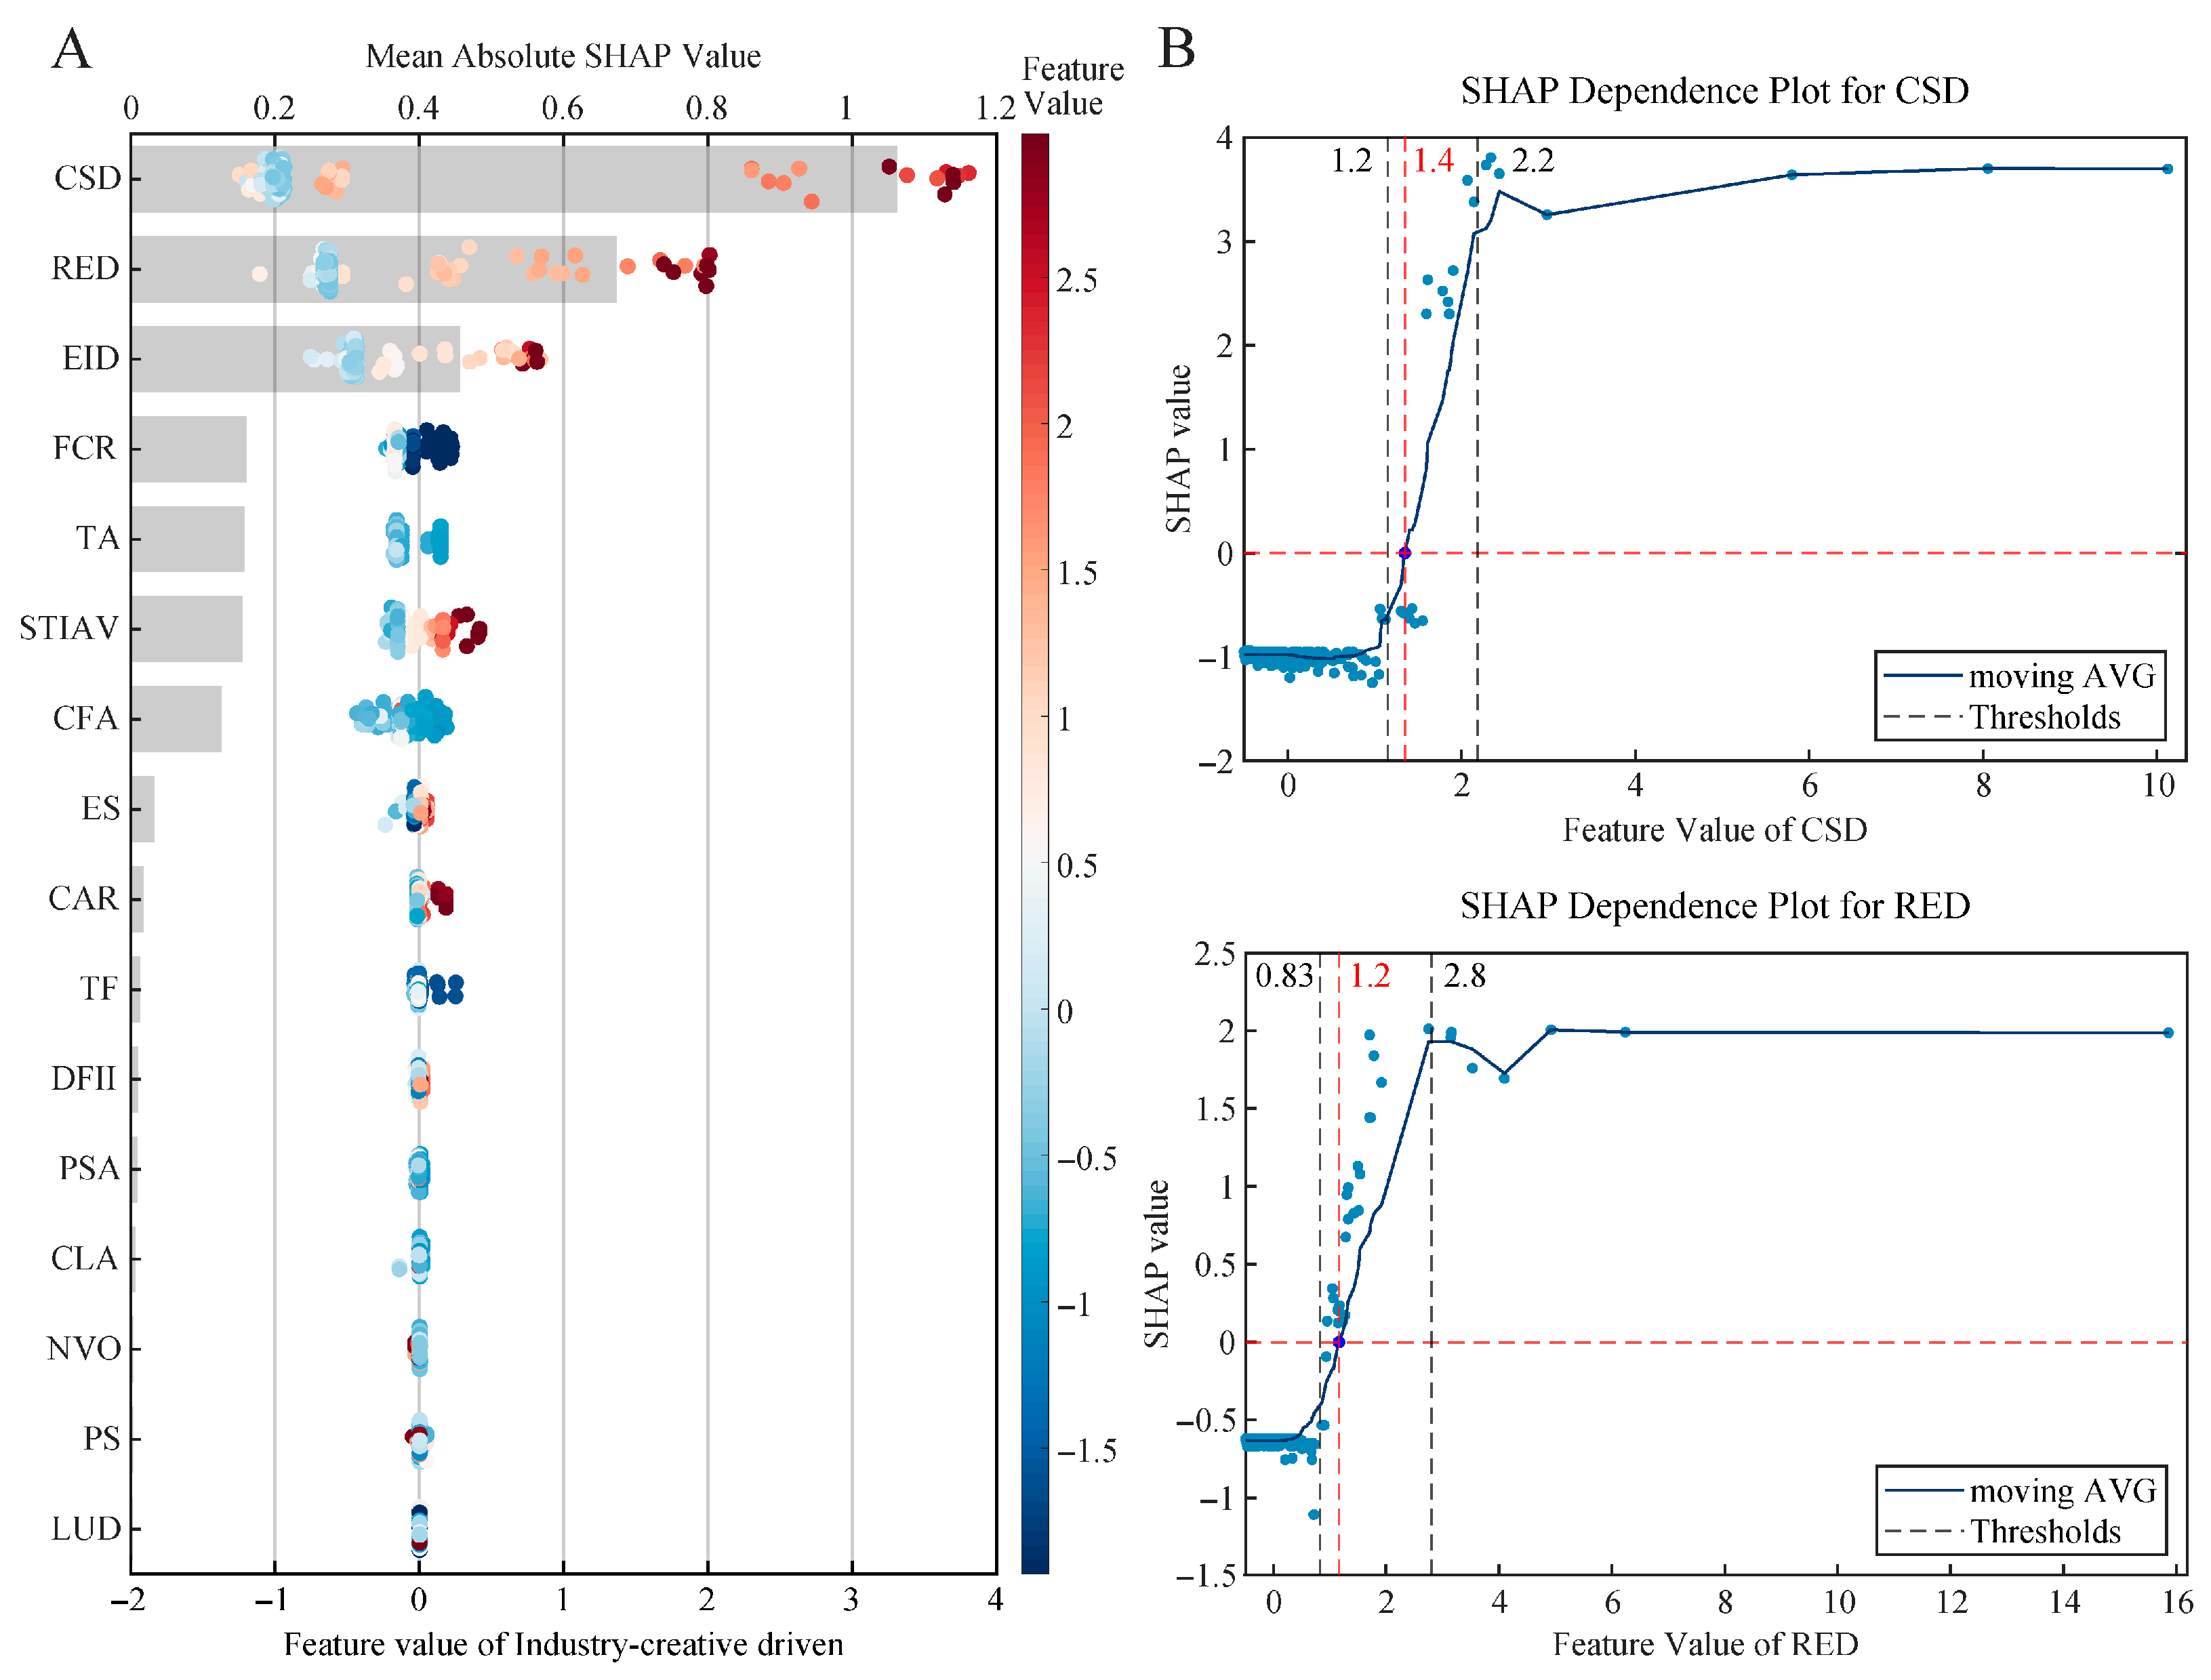
Type II traditional villages can be described as an “industry–creative composite” that relies on the synergistic development of cultural production activities and emerging industries. In Figure 11B, both Cultural and Creative Space Density (CSD) and Traditional Industry Density exhibit a rapid increase phase followed by early saturation. At low densities, dispersed cultural-creative spaces often fail to sustain a stable cultural production system, resulting in limited gains in employment and industrial linkages. Once CSD surpasses a critical threshold, its positive effects intensify; with further agglomeration, the marginal returns of both indicators level off. Sustainable development in Type II villages, therefore, requires moderate clustering of industrial and creative assets. Policy should prioritise synergistic efficiency rather than simple scale expansion, thereby avoiding structural imbalance and efficiency losses associated with over-concentration.
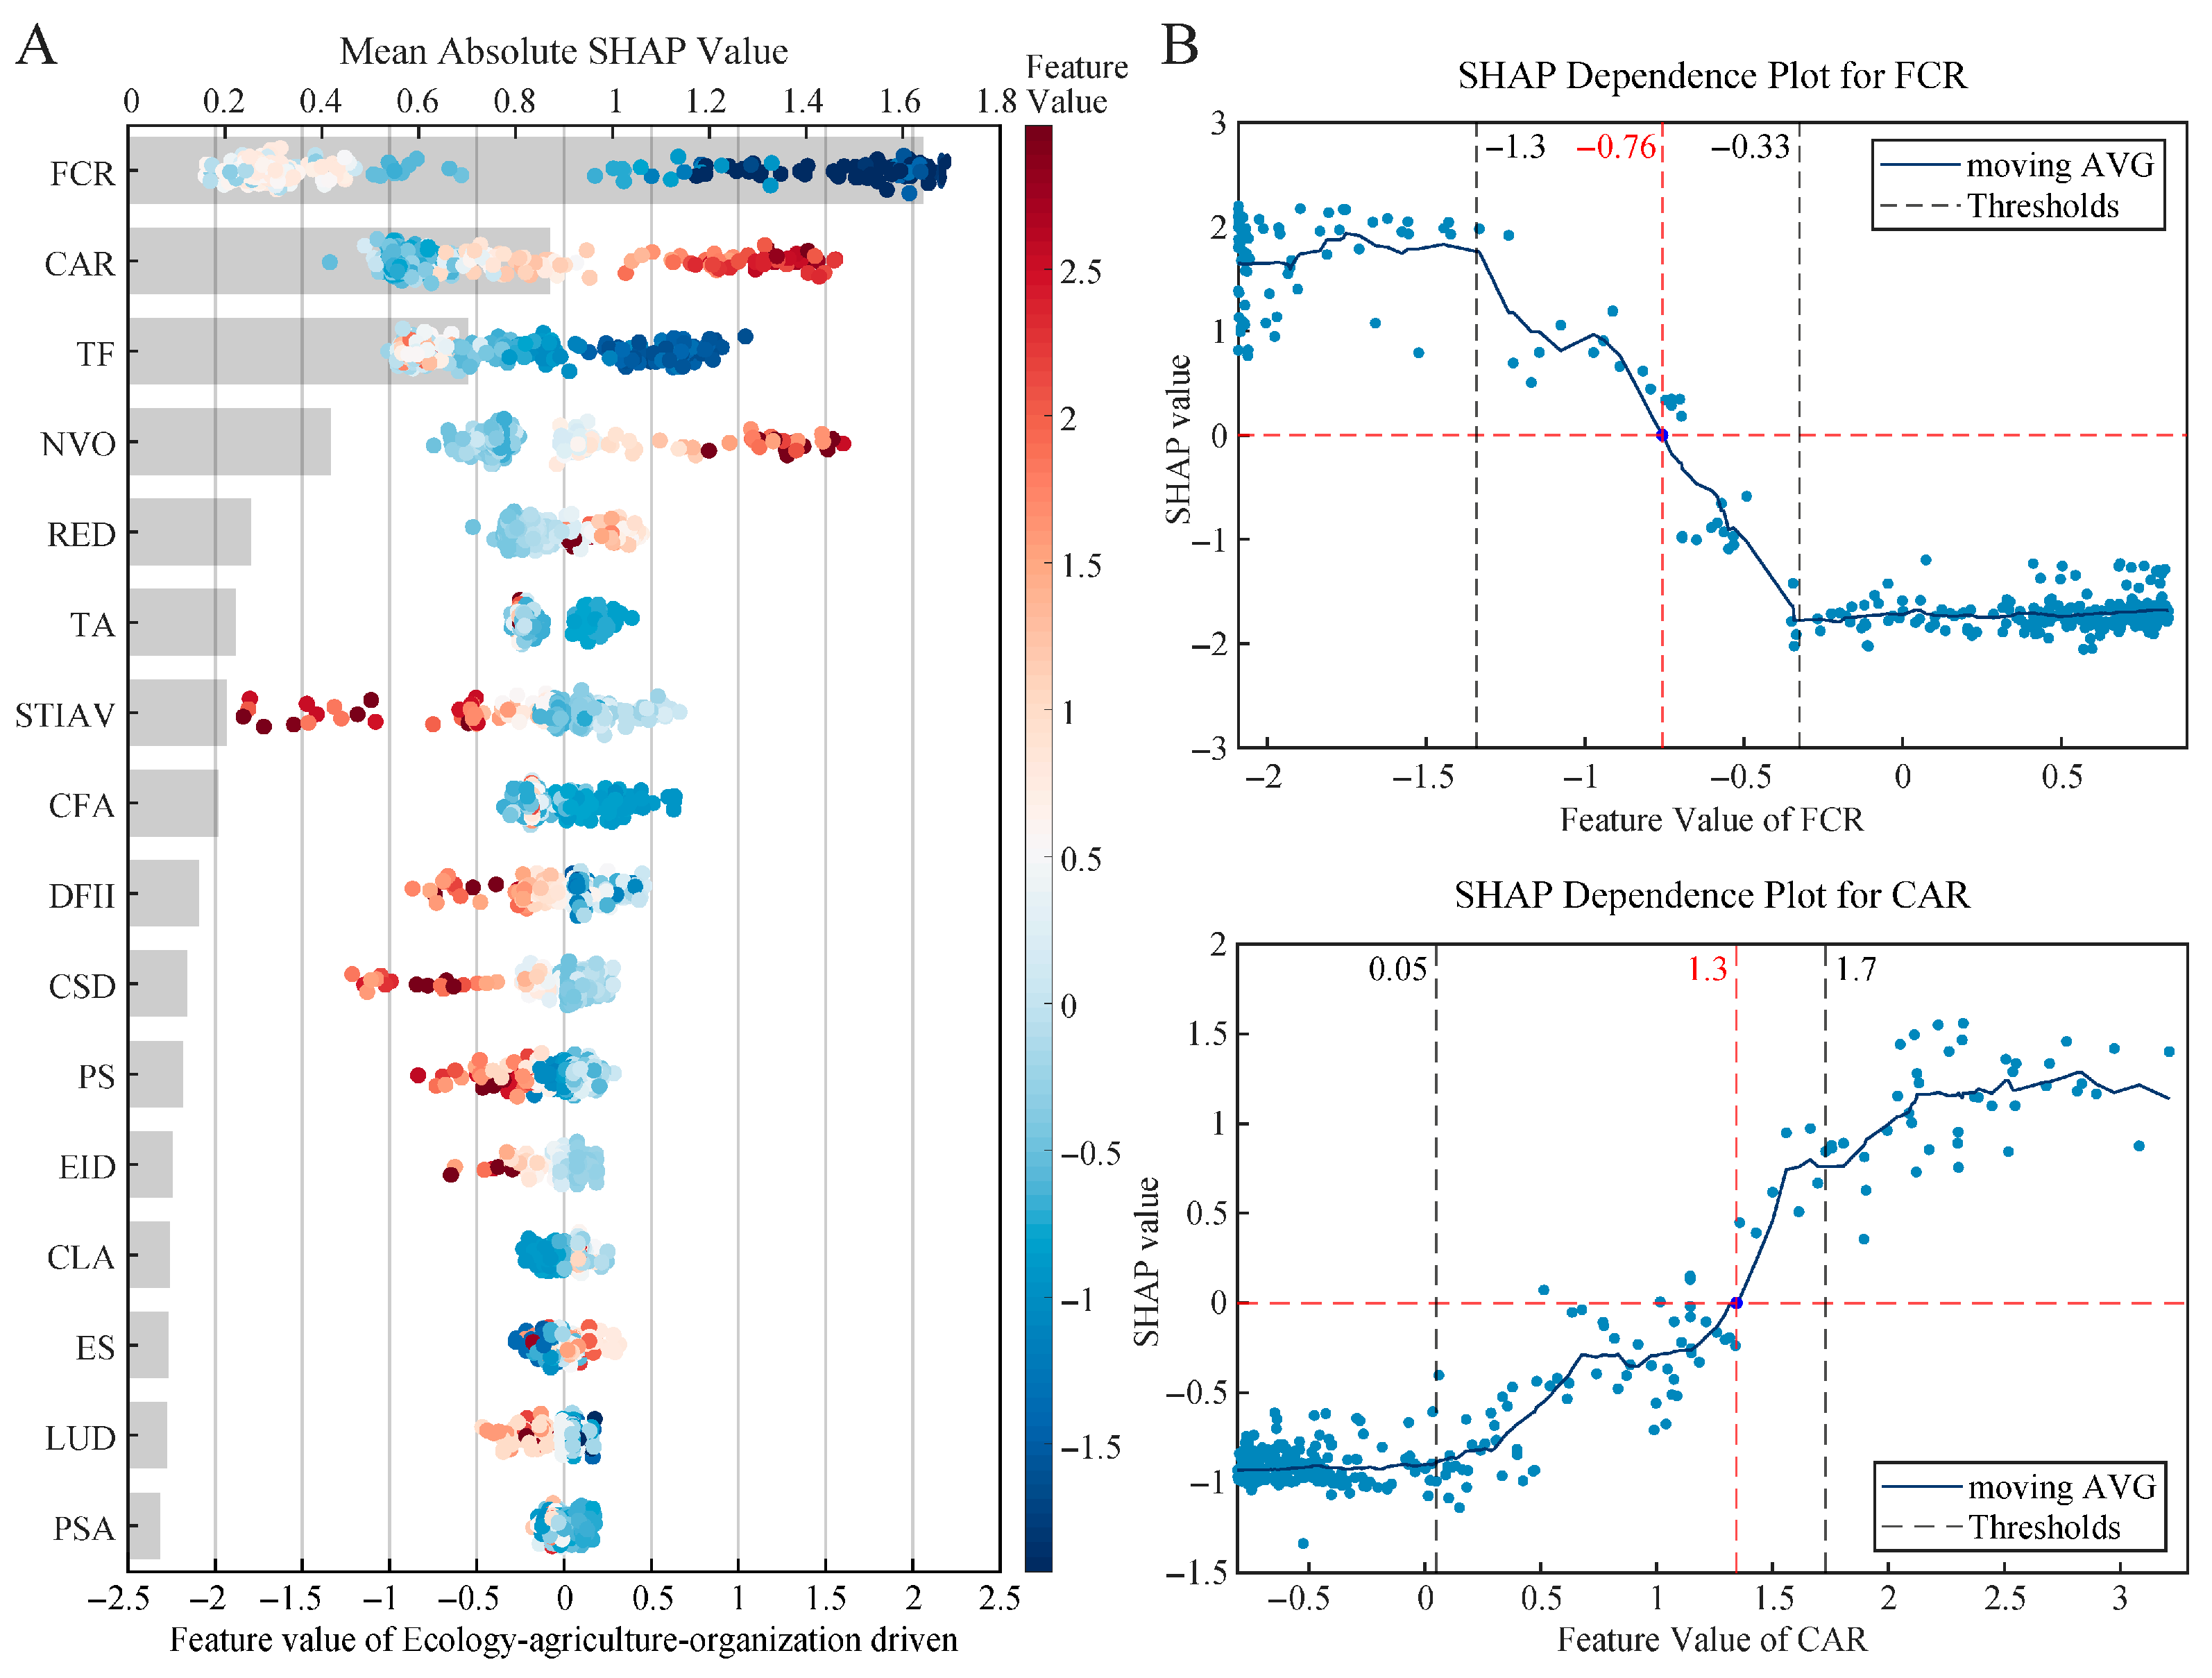
Type III traditional villages can be described as “ecology–agriculture–organization driven”. The forest coverage ratio (FCR) and cultivated land area ratio (CAR) are the main positive contributors. This finding is consistent with previous research on the importance of ecological environments and agricultural resources [63]. From Figure 12B, forest coverage shows a positive contribution at low to moderate levels, but its marginal effect declines rapidly once it exceeds a threshold of −1.3. In contrast, the positive influence of cultivated land area increases steadily with its proportion.
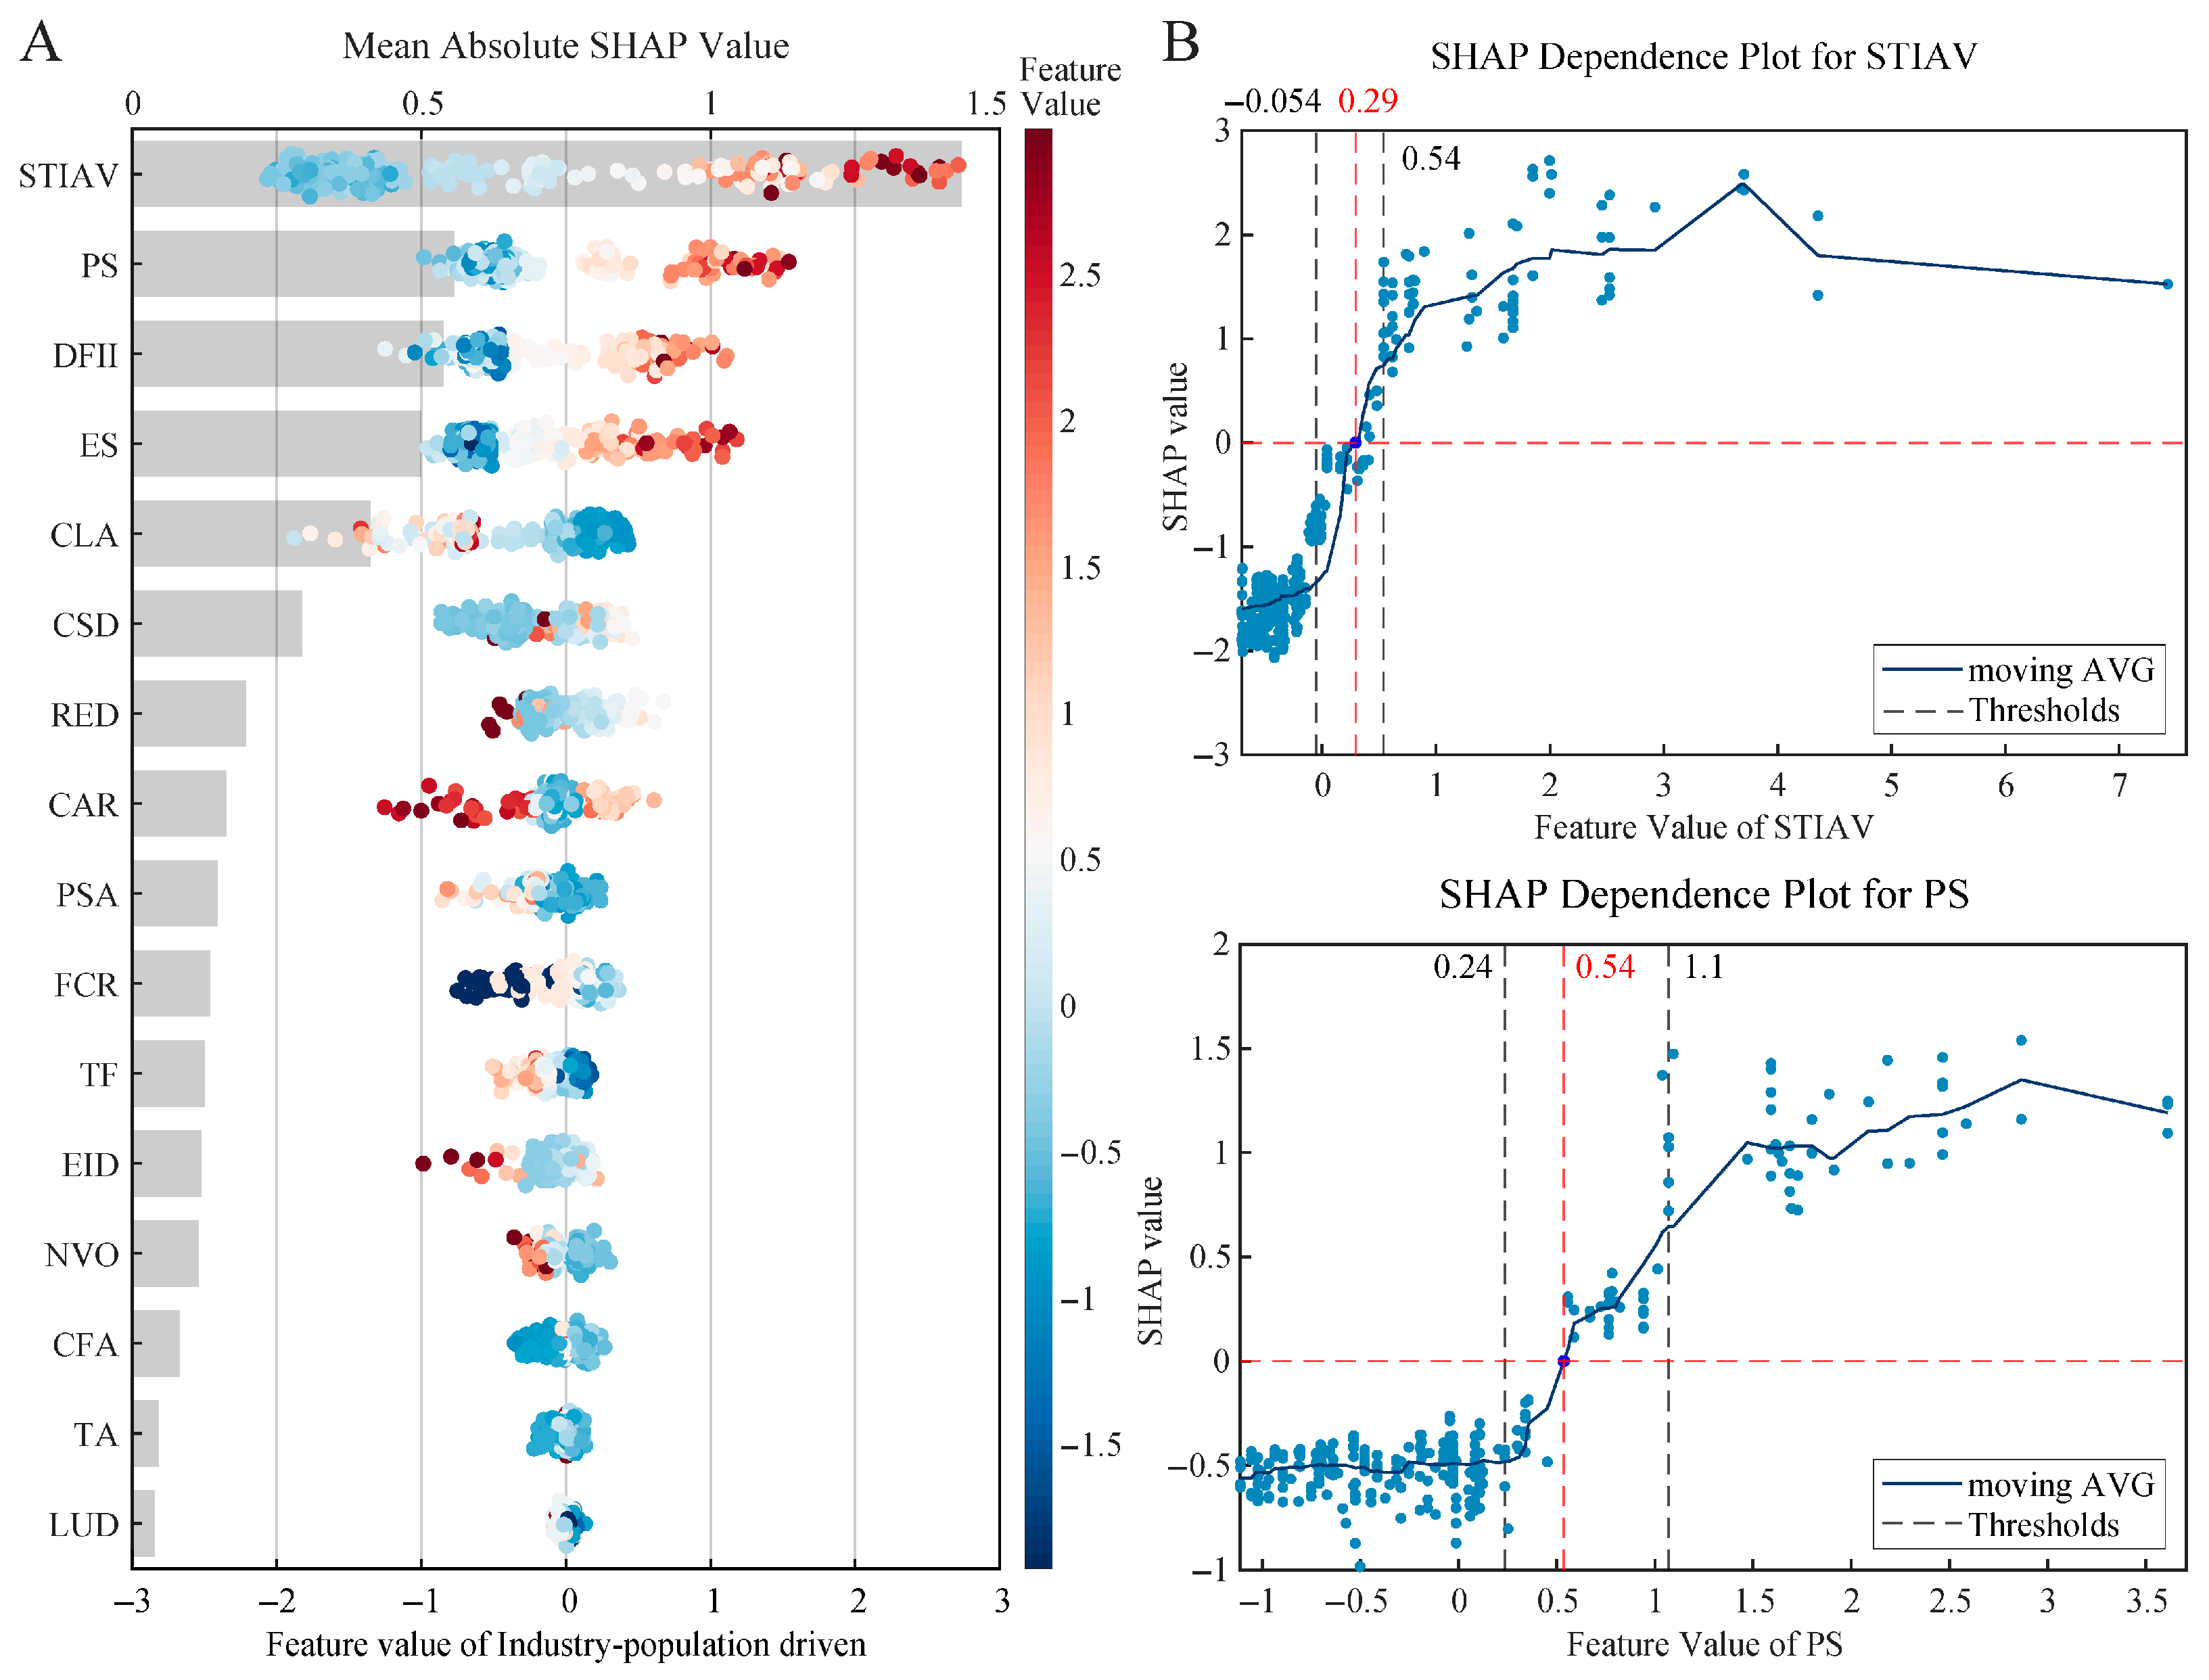
Type IV traditional villages can be characterised as “industry–population driven”. The primary influencing indicators include secondary and tertiary industry added value (STIAV) and population size (PS). In Figure 13B, the second- and third-industry added value (STIAV) shows a sharp positive effect once the threshold exceeds approximately −0.054, indicating that a shift from single-sector agriculture to a more diversified industrial structure markedly strengthens village resilience. For population size, resilience is low below the 0.24 threshold due to labour shortages and limited market scale, whereas above 1.5, rising resource-carrying pressure and governance costs reduce marginal gains. Overall, the sustainable development of Type-IV villages hinges on the synergy between industrial diversification and an optimal population range.
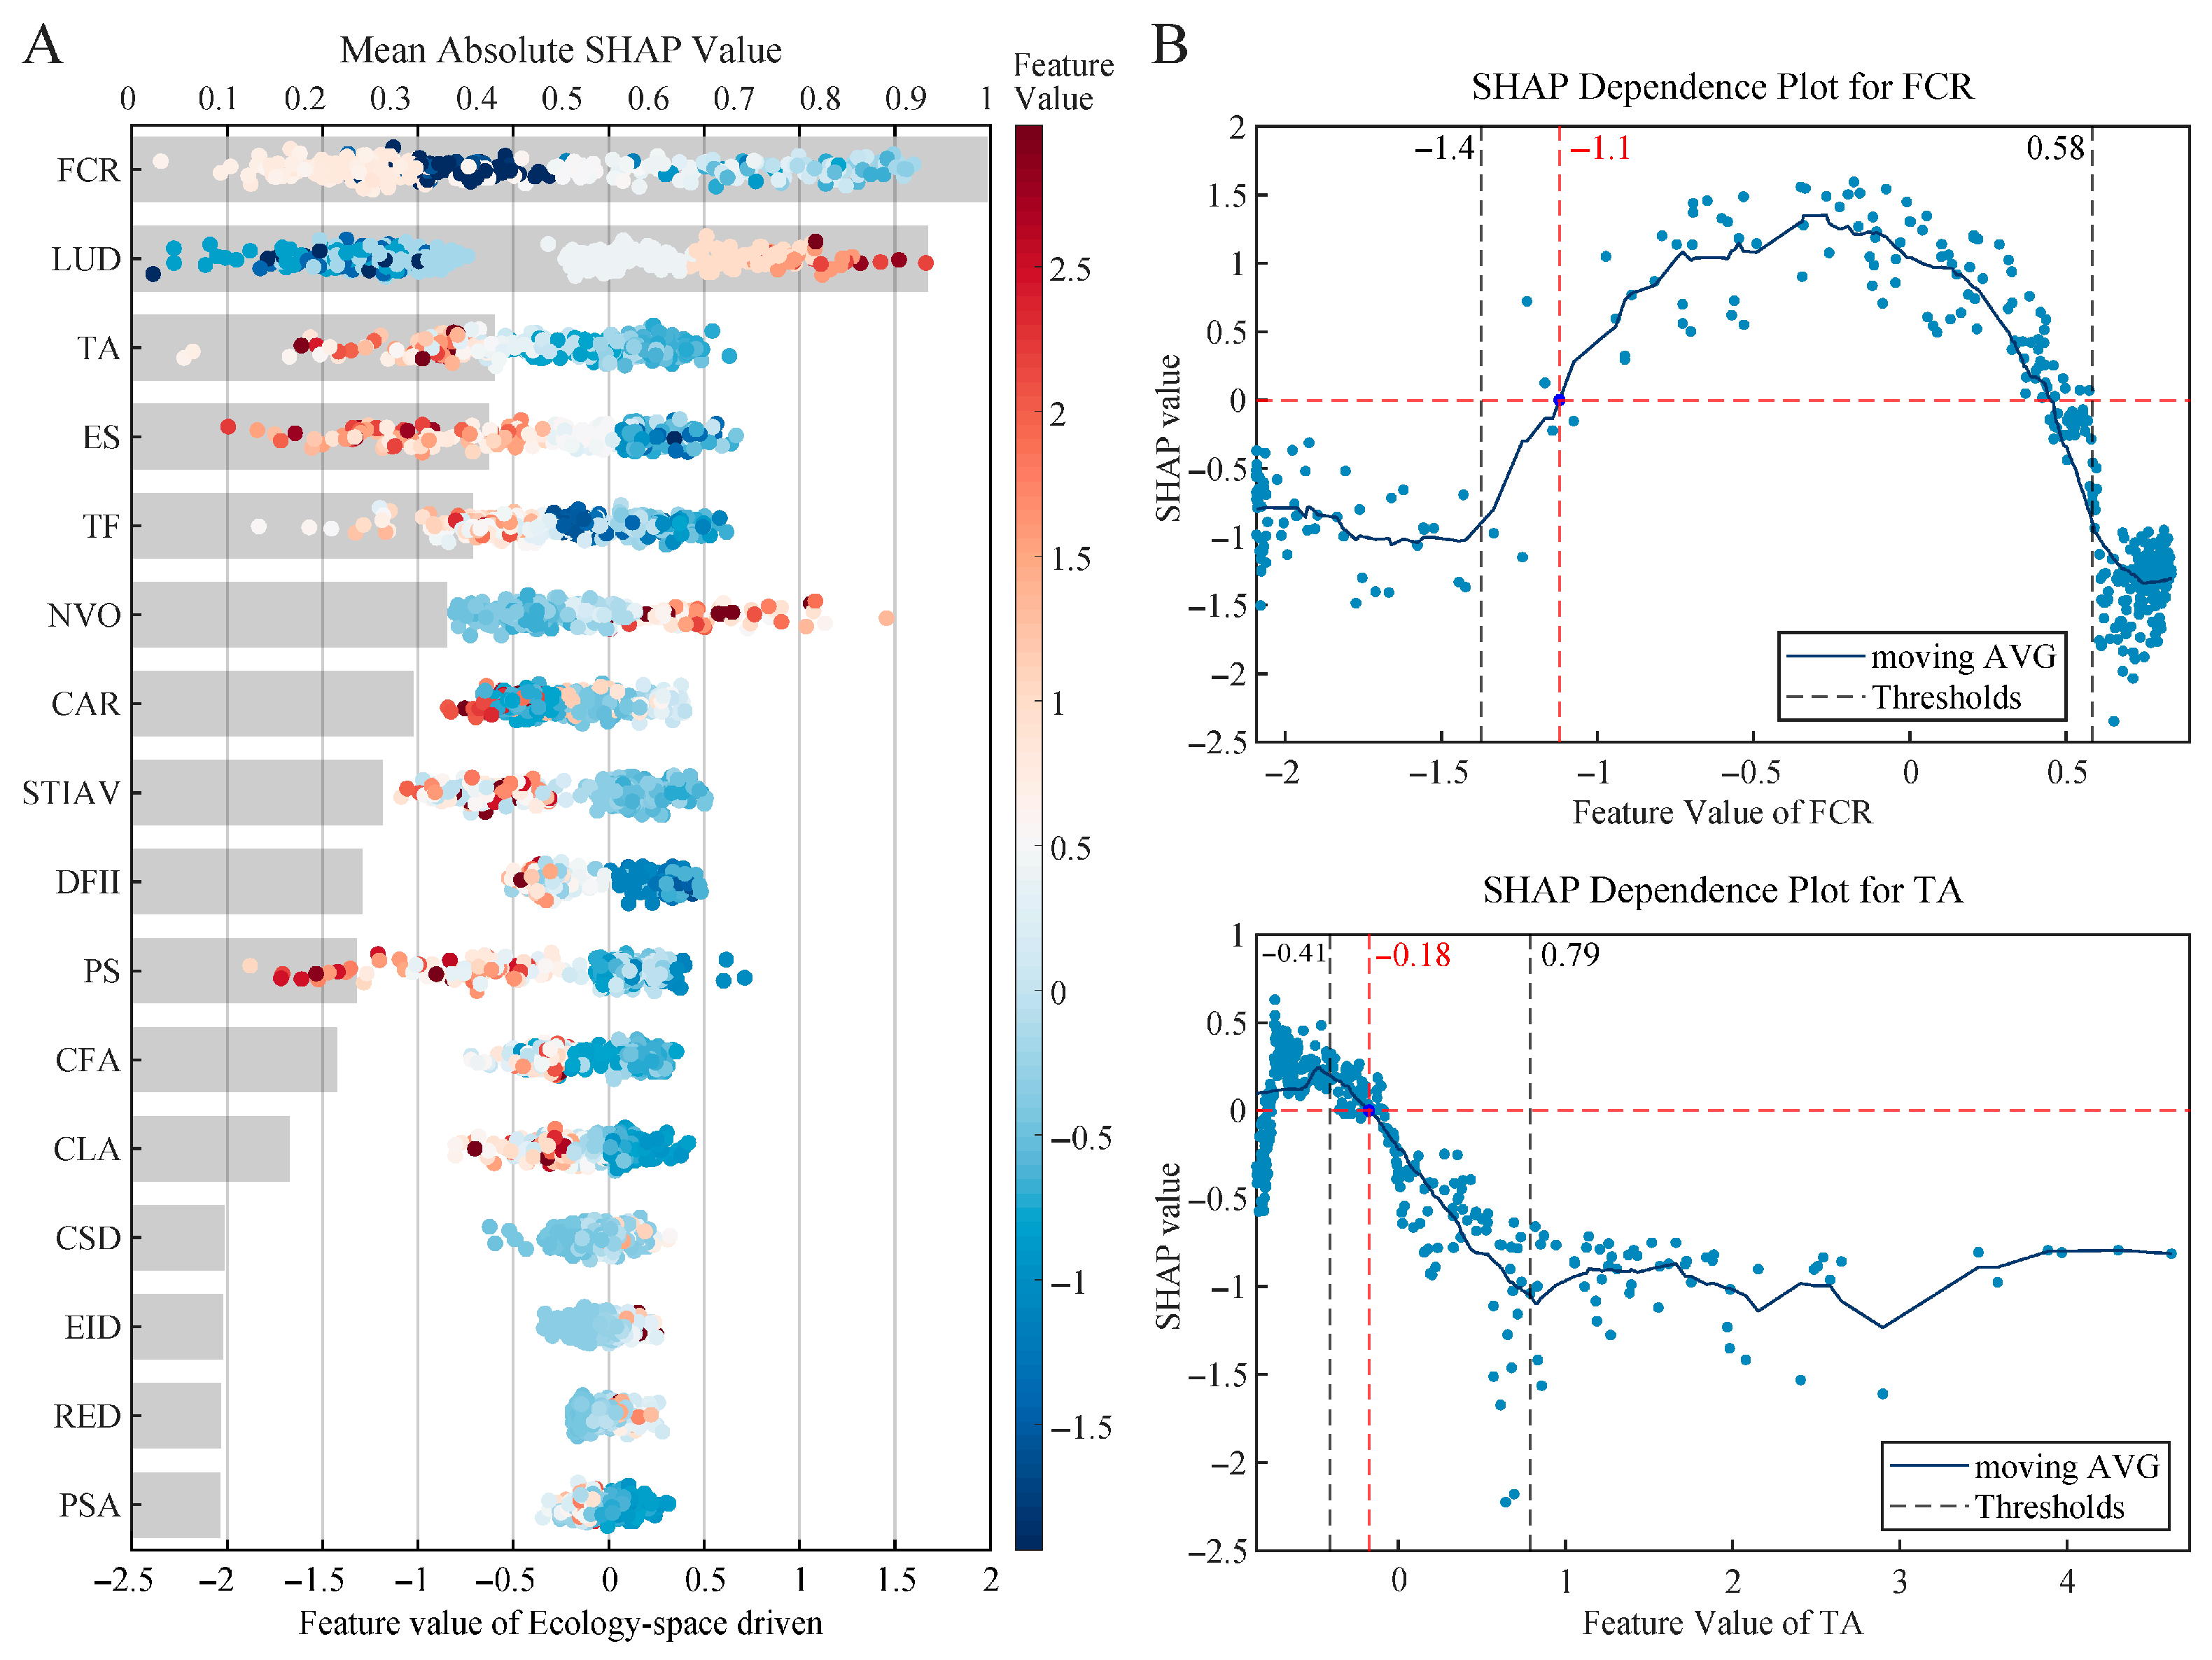
Type V traditional villages can be characterised as “ecology–space driven”. The leading influencing indicators include FCR and TA. The FCR is the most significant positive contributor, underscoring the critical role of ecological resources in maintaining the stability of the village resilience system. According to Figure 14B, the marginal contribution of forest cover is positive at low to medium levels, but turns positive after reaching −1.1. The results suggest that ‘excessive forest coverage’ may inhibit accessibility and functional diversification. Transportation accessibility in these villages also exhibits diminishing marginal returns; moderate to high levels of accessibility are optimal, while the marginal benefit decreases at the highest levels. In summary, external connectivity and resource flows are crucial development factors for these villages, and these two factors must be balanced with ecological protection. Type V traditional villages should focus on enhancing land-use diversity and transport accessibility while maintaining an appropriate level of forest coverage.
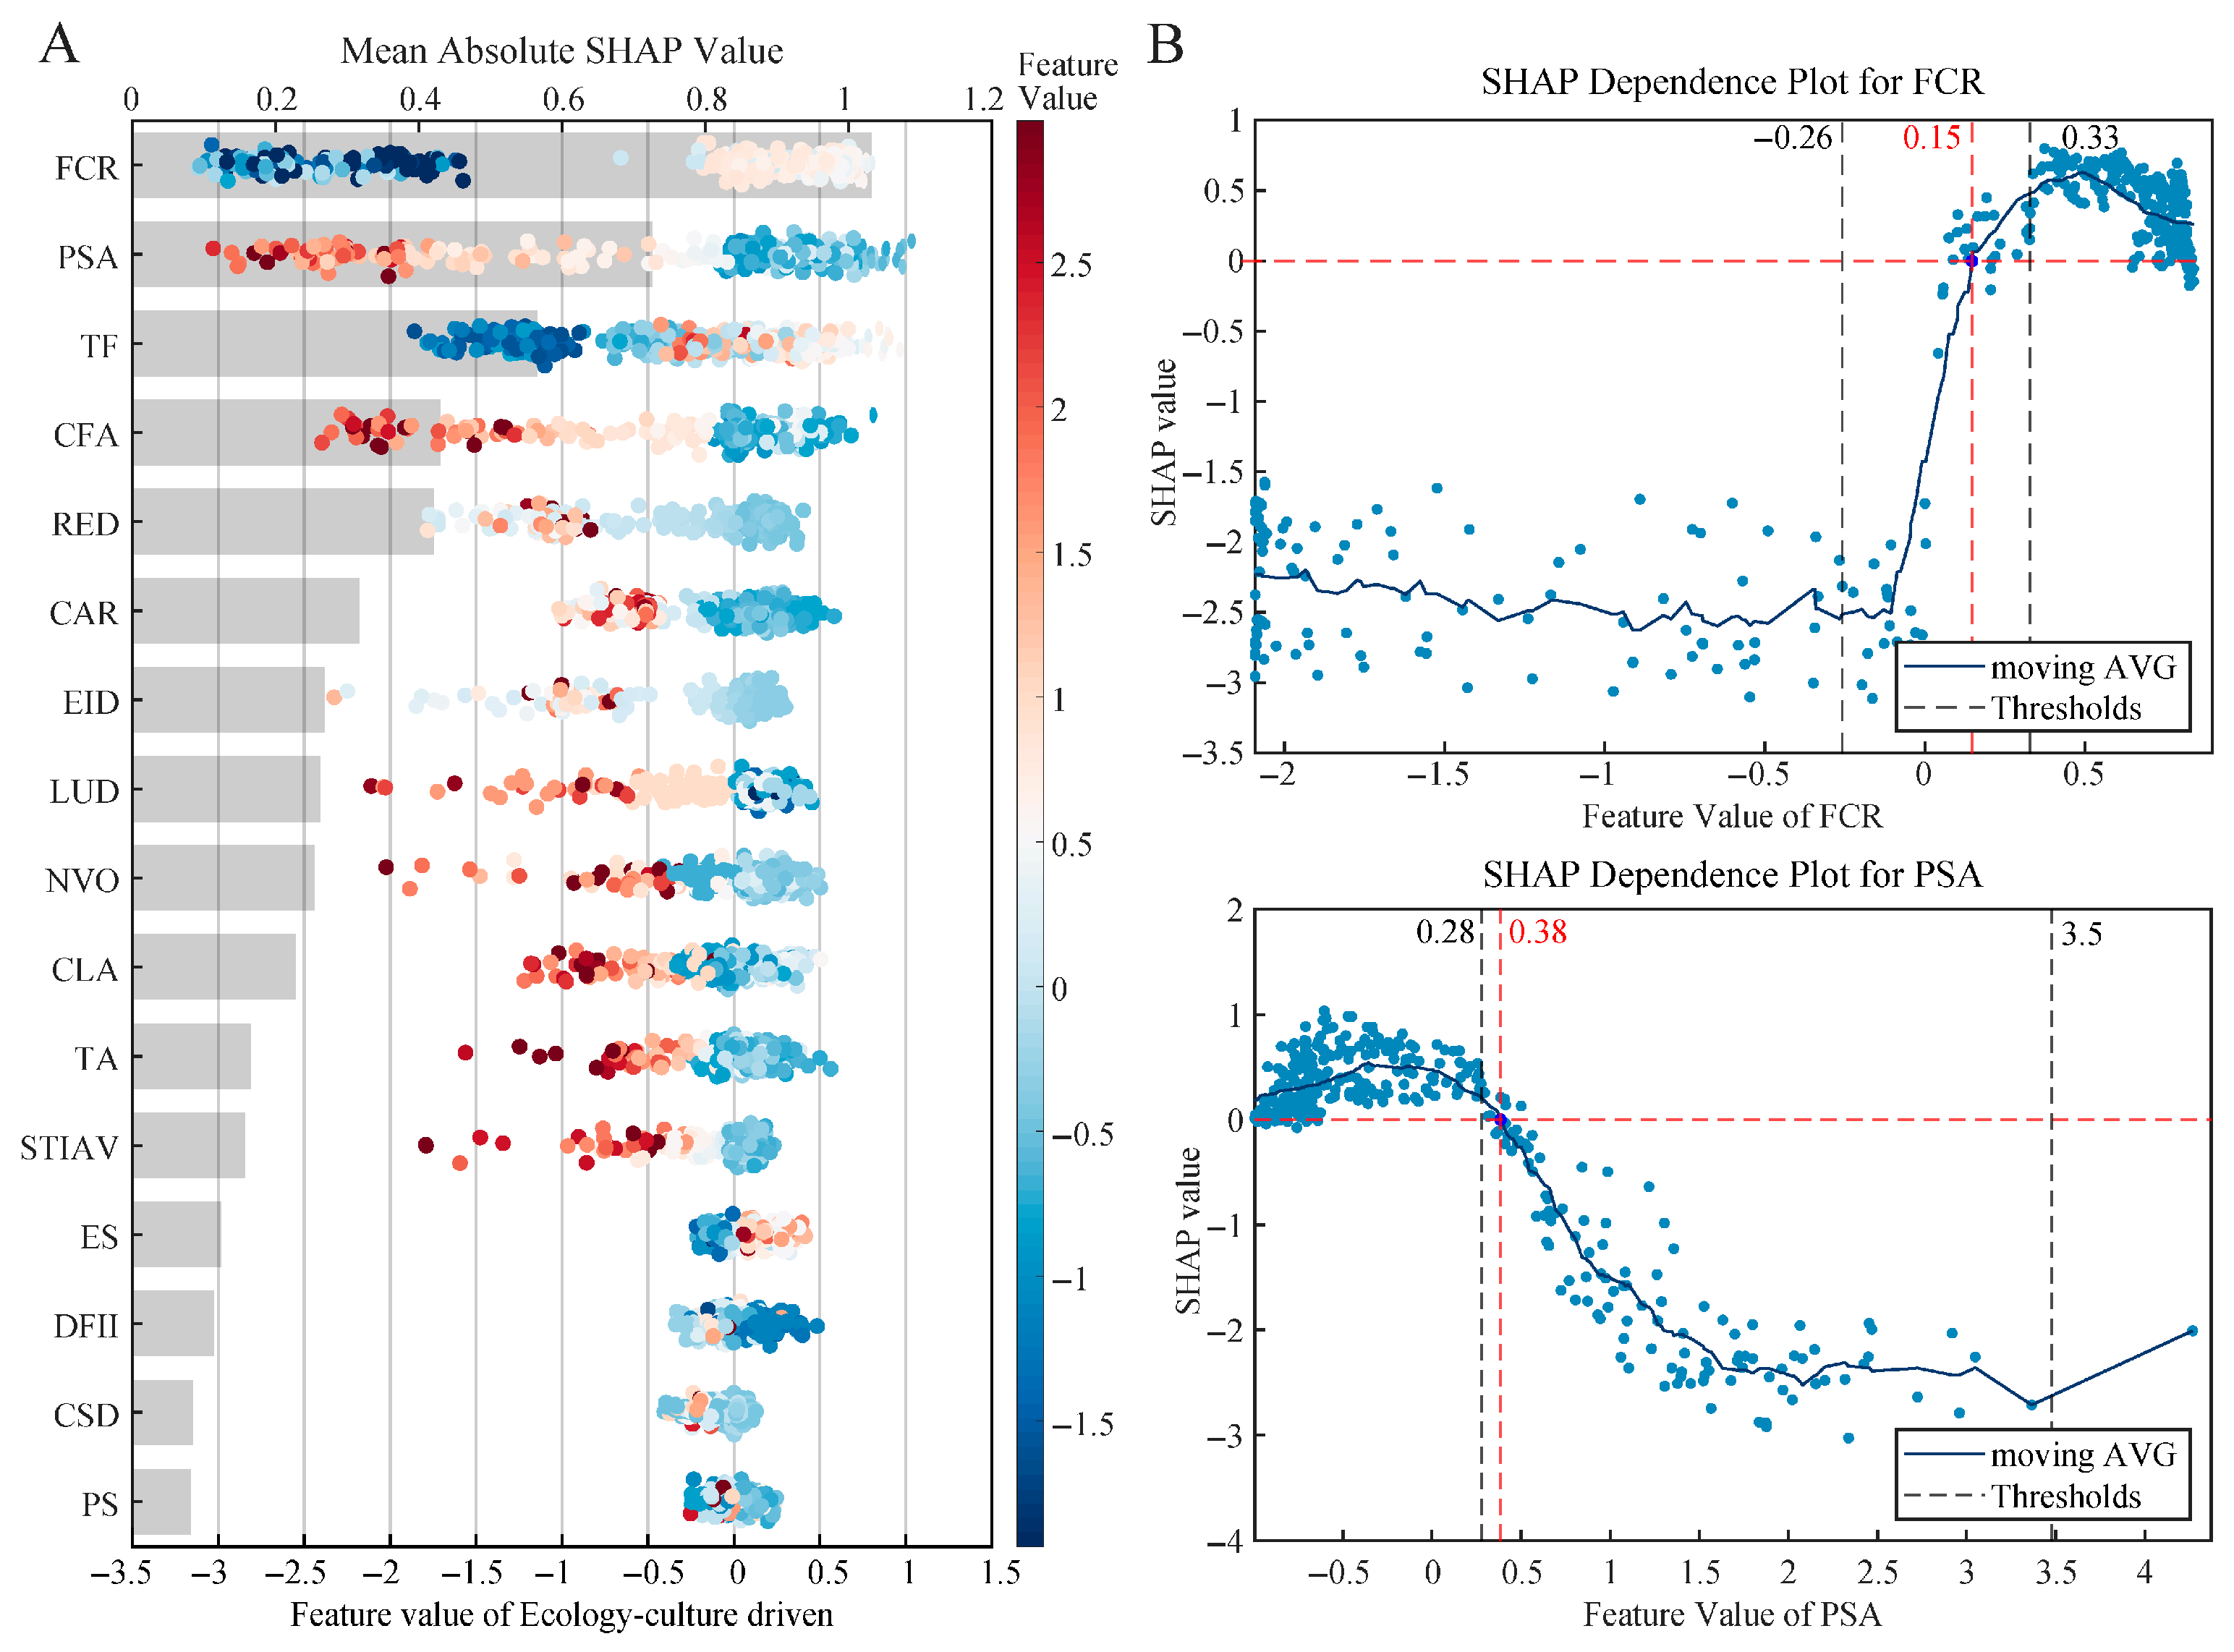
Type VI traditional villages can be characterised as “ecology–culture composite”. The leading influencing indicators are FCR and PSA. Among these, the forest coverage ratio is the most significant positive contributor, underscoring the critical role of ecological resources in maintaining system resilience. Public service accessibility exhibits a nonlinear pattern: it is positively associated with resilience at low-to-medium values, but its contribution declines and may even turn negative at higher levels. According to Figure 15B, the relationship between forest coverage and resilience exhibits a delayed activation effect: below +0.15, the ecological foundation is insufficient to catalyse social functions; beyond this point, the synergy between ecosystem services and cultural spaces strengthens. Yet, this effect eventually plateaus due to spatial configuration limits. Notably, PSA demonstrates a nonlinear trade-off; beyond a certain proximity, the over-centralisation of services may displace informal social capital and self-governing mechanisms. These findings suggest that for Type VI clusters, resilience optimisation depends on an optimal density of both green and service infrastructures to prevent functional crowding-out.

5. Discussion

5.1. Typological Differences in Traditional Village Resilience

The research results indicate that traditional villages in the Yangtze River Delta (YRD) region can be categorised into six distinct resilience types. These typological differences are determined by the structural characteristics of the various influencing indicators across the ecological, economic, cultural, and community dimensions within the village resilience system.
Significant disparities exist in the key indicators within the resilience systems of different types of traditional villages. The resilience development of culture-service driven villages primarily relies on the accessibility of public service facilities, coupled with cultural resources, indicating a clear social service and cultural resource orientation. Sustainable development for industry–creative-driven villages necessitates attention to the synergistic effect of cultural creativity and industrial diversification. Ecology–agriculture–organisation-driven villages are primarily characterised by high forest cover, a high proportion of cultivated land, and high village-level organisation density. The development of these villages requires the synergy among ecology, agriculture, and local organisation. Key indicators for industry–population-driven villages include secondary and tertiary industries, population size, and the Digital Inclusive Finance Index. The resilience of ecology–space-driven villages is significantly associated with forest cover, land-use diversity, and traffic accessibility. The resilience of ecology–culture-driven villages is primarily determined by forest cover, public service accessibility, and accessibility to cultural facilities. The variations in these key indicator combinations reflect distinct internal ecological environments, social structures, cultural resources, and economic foundations across villages, providing a scientific basis for formulating differentiated sustainable development strategies.
Significant differences also exist in the nonlinear action characteristics and operational thresholds of these indicators across different types of villages. Traditional villages can, based on their inherent structural characteristics, pursue differentiated development pathways. Taking the accessibility of public service facilities as an example, the feature value and marginal contribution exhibit a positive overall correlation in culture–service-driven villages. The indicator’s contribution rapidly increases as the feature value rises, then stabilises after reaching a high level. This trajectory confirms that moderately centralised public service facilities can effectively augment the resilience development of traditional villages. Conversely, in ecology–culture-driven villages, the feature value and contribution value of public service accessibility show an overall negative correlation. A low level of PSA, conversely, provides a higher marginal contribution, indicating that a dispersed, low-density distribution of public service facilities enhances the resilience of ecologically dominated villages. The direction and magnitude of the impact of ecosystem sensitivity and topographic relief exhibit significant heterogeneity across different resilience types. These factors do not consistently exert negative influences across all village categories, suggesting that their roles are highly context-dependent. Furthermore, multiple indicators, including CSD, CFA, FCR, and TA, exhibit disparities in cross-type action characteristics. The findings fully demonstrate that the sustainable development of traditional villages must be based on their typological structural characteristics to formulate differentiated development strategies.

5.2. Verification of Indicator Effectiveness

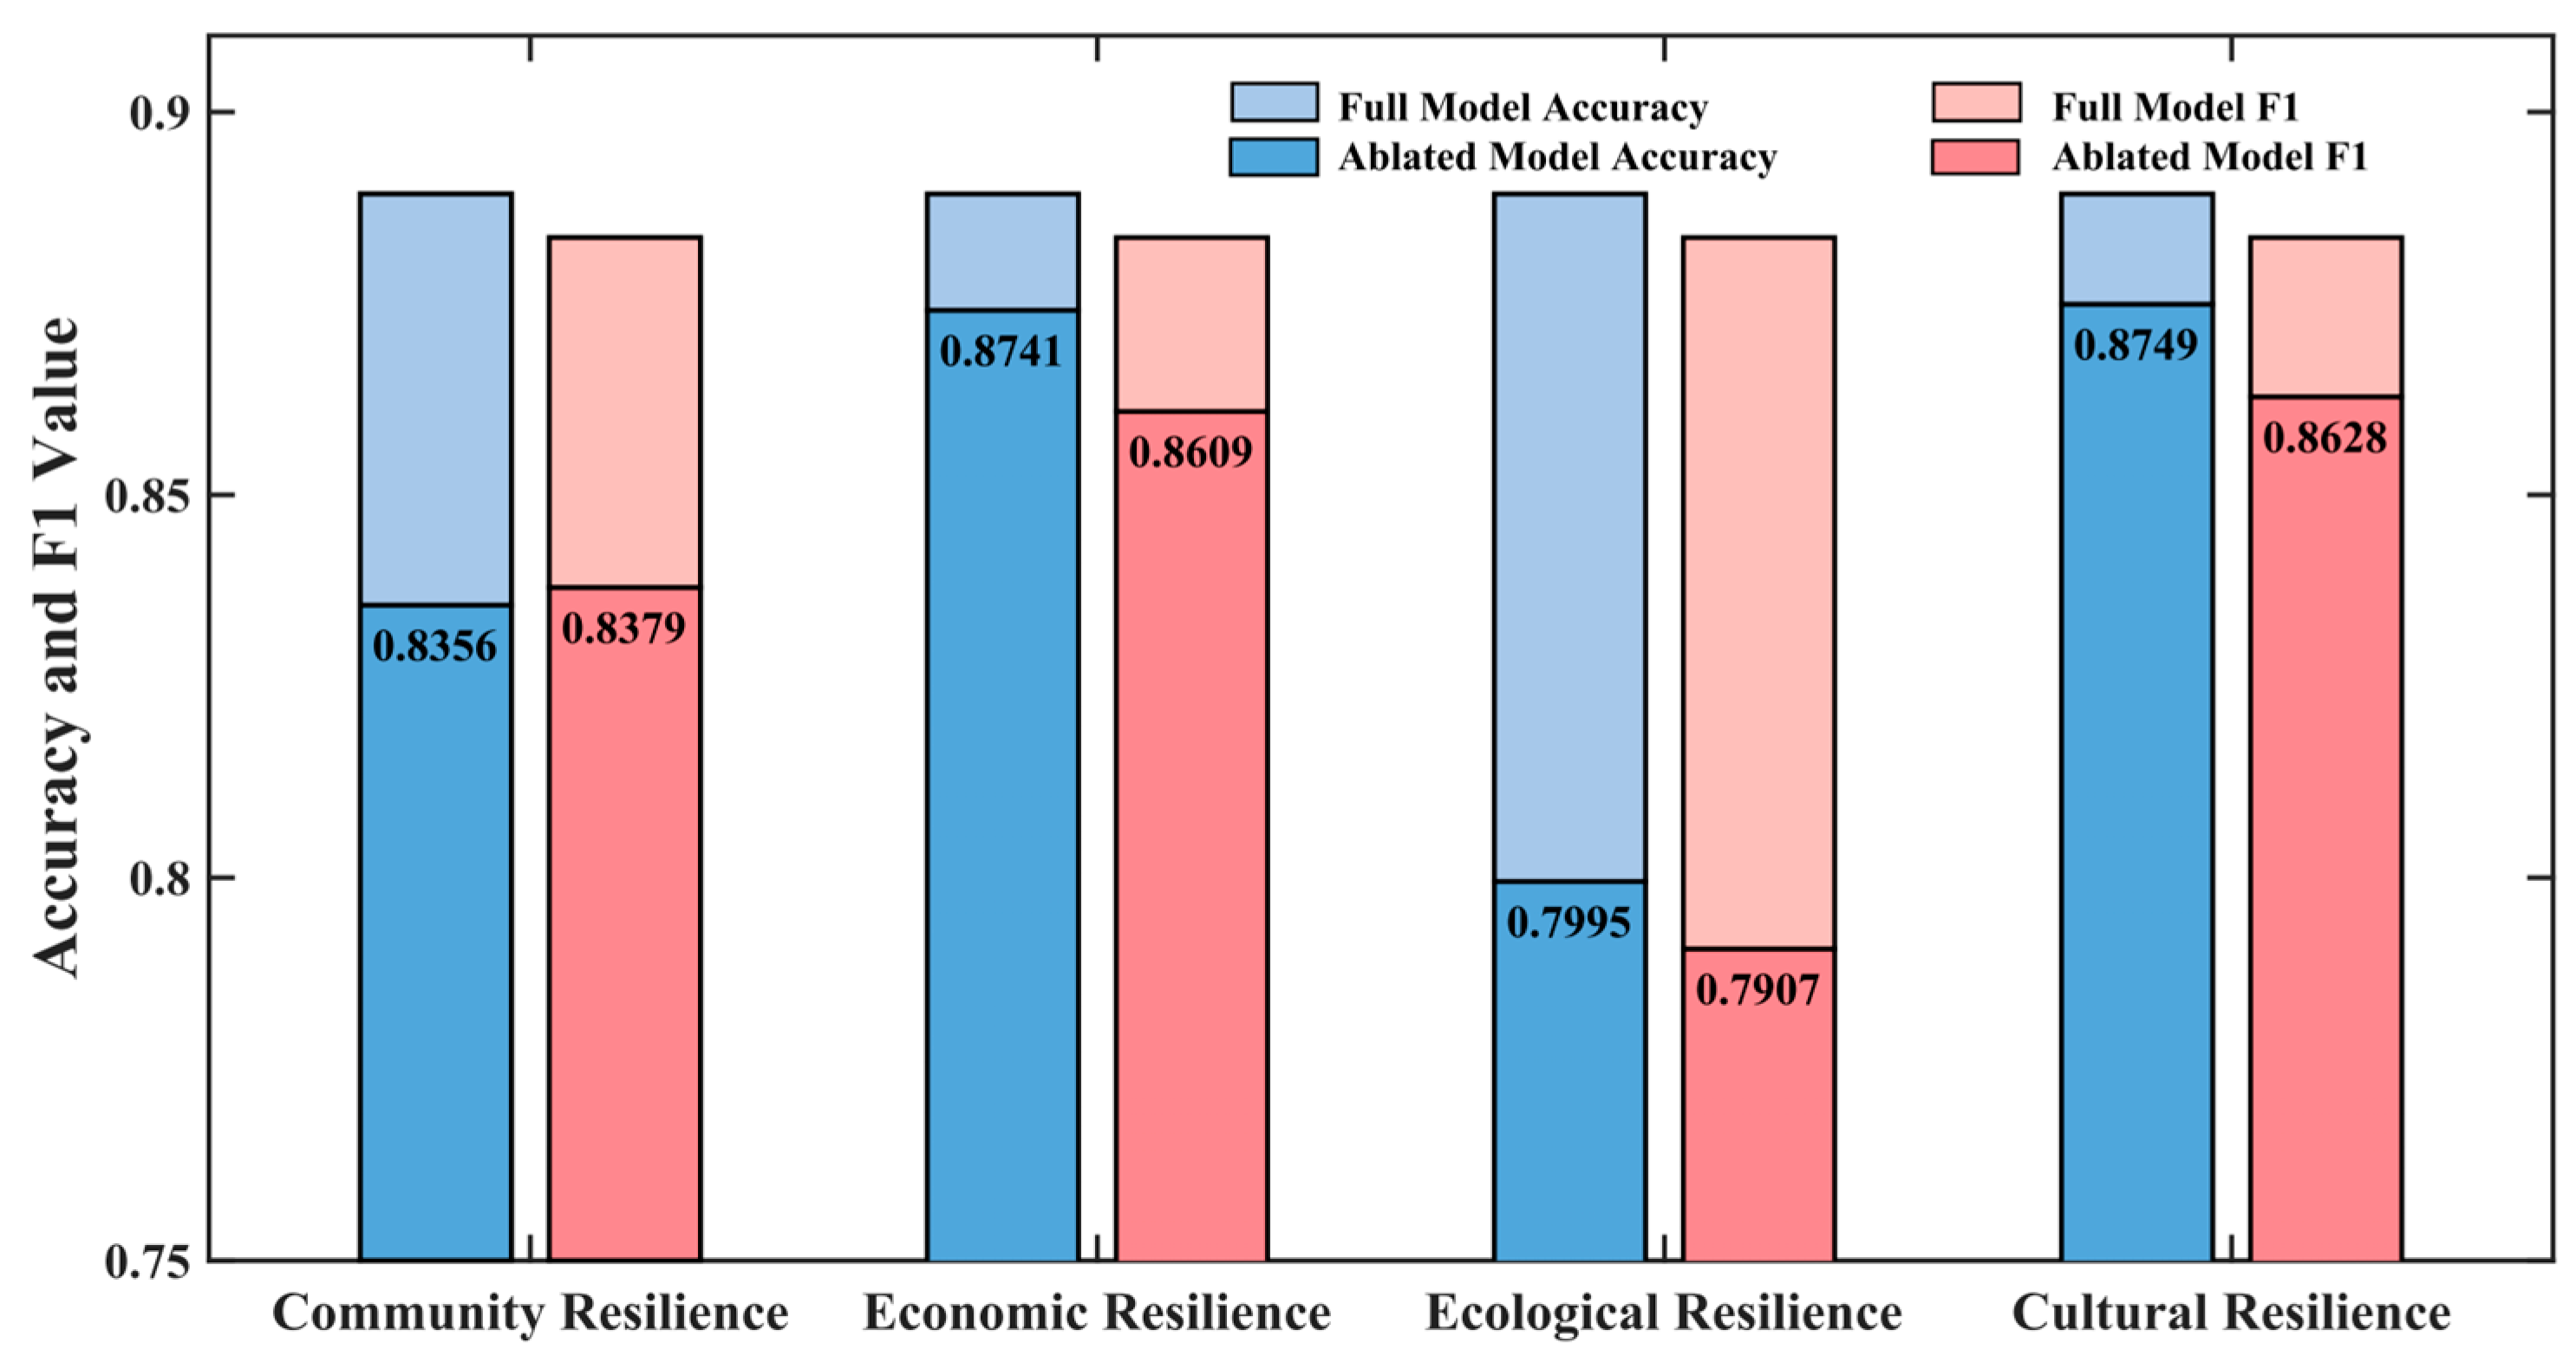
Based on the results of the ablation experiment, removing any of the four dimensions (community, economy, ecology, and culture) consistently decreased model performance (Figure 16). The results demonstrate the effectiveness of the multi-dimensional resilience assessment indicator system established in this study for traditional villages.
Specifically, removing the ecology and community dimensions resulted in a significant drop in model performance, indicating that these dimensions are core variables in the traditional village resilience structure. Factors such as ecological environment carrying capacity, land-use structure, and community organisation density provide the basis for maintaining stability within the YRD traditional village resilience system. In contrast, ablation of the economic and cultural dimensions resulted in a minor decrease in performance; nevertheless, they make a significant contribution in specific village types. Combined with the SHAP results, cultural dimension indicators—such as cultural facility accessibility, spatial equilibrium of cultural landscape, and density of creative spaces—exhibit significant contributions in Culture-service Driven and Ecology-culture Driven villages. Furthermore, these indicators demonstrate apparent nonlinear threshold effects across different types, suggesting that the cultural dimension is a critical factor for explaining structural disparities within the traditional village resilience system. Based on these findings, the indicator system proposed herein, which integrates the four dimensions of community, economy, ecology, and culture, demonstrates clear advantages.

5.3. Policy Implications

According to the research results, traditional villages must follow typological development strategies. Based on the typological characteristics of traditional villages in the YRD region, the study proposes the following policy recommendations:
For culture–service-driven traditional villages, enhancing resilience depends on the effective organisation of services and cultural facilities within a spatial network. The configuration method should transition from centralised clustering to multi-node synergy. By rationally distributing elderly care, cultural activities, and public spaces between core and peripheral villages, a service-sharing network can be formed to avoid resource redundancy and efficiency loss caused by single-point, high-density concentration. On a regional scale, these villages should be positioned as composite cultural service nodes, supporting other resilience-type villages by providing essential services and cultural experiences.
The development planning for industry–creative-driven villages depends on the synergy between creative spaces and industrial activities at an optimal level of aggregation. Therefore, creative spaces should serve as the organisational core, guiding their integration with traditional handicrafts, educational experiences, and cultural exhibitions to form moderately concentrated industrial clusters. Concurrently, the scale of creative and industrial land should be regulated to avoid the diminishing marginal efficiency caused by over-expansion. At the regional level, industry- and creative-driven villages should be positioned as innovation and cultural production nodes, complementing culture–service-driven villages.
Ecology–agriculture–organisation-driven villages depend on the synergy between ecological resources, agricultural production, and grassroots organisational capacity. Research shows that the enhanced resilience of these villages is driven by interactions among environmental resources, agricultural infrastructure, and organisational governance. As a typical example, Zhuge Village avoided high-intensity development, instead integrating local ecological restoration with industries such as health and wellness and rural tourism. While ensuring the scale of bare arable land, it guides ecological restoration to enhance agricultural landscapes and ecosystem services. At the regional level, ecologically driven villages are important nodes for environmental security and agricultural protection, playing a crucial role in ecological buffering, food production, and maintaining basic livelihood stability.
Planning strategies for industry–population-driven villages rely on the combined effects of industrial diversification, stable population growth, and financial support systems to enhance resilience. In planning practice, priority should be given to embedding modern agricultural processing, supporting services, and digital platforms, so that the industrial chain can be extended to increase employment absorption capacity. Incorporating digital production and trading platforms to support small- to medium-sized entities and household businesses in achieving regional scale effects. Regionally, industry–population-driven villages are best positioned as industrial and demographic anchors, undertaking critical functions in job creation and economic stability.
Planning for ecology–space-driven villages must prioritise maintaining ecosystem stability by achieving a balance between ecological protection and development. In planning practice, efforts should focus on the integrated coordination of agricultural, forest, and construction land to prevent disorderly urban sprawl [64]. Development trajectories should avoid high-intensity interventions and utilise existing policy tools—such as ecological red lines, permanent basic farmland, and village construction boundaries—to preserve the environmental integrity of the overall spatial pattern. From a regional perspective, these villages serve as ecological nodes, functioning as environmental buffers and landscape transitions between urban expansion zones and industrial clusters.
The development of ecology–culture-driven villages requires a delicate balance between maintaining ecosystem stability and moderate integration of cultural functions and public services. In planning practice, low-impact cultural and eco-leisure industries should be developed in accordance with ecological carrying capacity, promoting the transformation of ecological resources into cultural experiences and green economies. From a regional perspective, Ecology-Culture Driven villages are best integrated into regional eco-cultural corridors or cultural landscape systems. These villages should be guided to fulfil the dual functions of ecological protection and cultural heritage at a regional scale, rather than engaging in homogeneous tourism competition.

5.4. Limitations and Future Research

First, this study primarily relies on macro-regional scale data. While beneficial for identifying the overall typology of traditional villages, this approach falls short in thoroughly revealing the development-driving factors of specific micro-scale village locations. Micro-scale factors—such as building conditions, grassroots governance, and community participation—play a pivotal role in the formation and evolution of traditional village resilience. However, as these factors rely heavily on fieldwork and qualitative research, it is challenging to consistently represent them in a large-sample, cross-regional quantitative analysis. Therefore, these specific indicators were not incorporated into the current study. This trade-off suggests that the conclusions of this study are better suited to explaining relative disparities at regional and typological levels than to informing governance decisions for individual villages at the micro-scale. Second, the model in this study exhibits good overall accuracy (all accuracies > 0.85); however, the precision and recall rates are relatively low for small sample categories. Finally, the study relies mainly on cross-sectional data to analyse the resilience typology and the influencing indicators of traditional villages, thereby limiting its ability to examine the system’s dynamic evolution.
Future research will focus on the following aspects: First, Micro-scale empirical studies of traditional villages. By incorporating micro-level variables—such as building quality assessments, community governance structures, and resident engagement—and integrating multi-source data from interviews and questionnaires, the construction of a multi-scale database will help deepen the understanding of the internal mechanisms underlying different types of resilience. Second, to further enhance the model’s generalisation ability and robustness, future research will need to expand the dataset further and explore finer-grained indicators or new data processing methods. Third, by employing methods such as Partial Dependence Plots (PDP) and Accumulated Local Effects (ALE) to analyse interaction effects further and integrating in-depth case studies of typical villages, we aim to bridge the gap left by purely quantitative methods in revealing micro-scale attributes. Finally, expanding regional validation is essential to enhance the generalizability of the proposed framework. Although the six resilience types and their nonlinear threshold characteristics were identified using traditional-village samples from the Yangtze River Delta, the differentiated contribution patterns of multi-dimensional resilience factors—including ecological, cultural, economic, and communal elements—as well as the threshold features across different structural types, are rooted in cross-regional theoretical logic. Consequently, the framework possesses a certain degree of transferability. Future research should broaden the geographical scope to further test the applicability and explanatory power of the framework and its findings across diverse regional contexts.

6. Conclusions

The study developed a comprehensive resilience assessment framework that employs the SOM-K-means clustering model to identify potential resilience system types within the traditional village-built environment. Then, the XGBoost-SHAP model was used to reveal the nonlinear effects of key influencing indicators across different types of resilience. The study yielded the following conclusions:
(1)
This study proposes and validates a comprehensive analytical framework encompassing community, economy, ecology, and culture. In doing so, it bridges a critical theoretical gap in existing resilience research: the disproportionate emphasis on ecological or economic dimensions at the expense of the internal mechanisms of cultural resilience.
(2)
This study established a comprehensive resilience assessment system covering four dimensions: ecology, economy, culture, and community, comprising a total of 16 indicators. The evaluation framework can characterise the resilience features of traditional villages across various aspects, including the built environment, ecological environment, industrial structure, social organisation, and cultural inheritance.
(3)
This study revealed the core influencing indicators and their nonlinear threshold characteristics for each village type. The results further indicate that the direction and intensity of the same indicator differ significantly across various types. For instance, cultural facility accessibility has a significant positive effect in culture–service–driven villages within the mid-to-high threshold range, whereas it shows an inverse effect in ecology–culture-driven villages within the low threshold range.
(4)
The study indicates that six distinct resilience typologies characterise traditional villages in the Yangtze River Delta (YRD) region. The key influencing indicators and their nonlinear effects within the built environment of various village typologies differ significantly, consequently leading to differentiated development paths. For example, culture–service-driven villages are primarily characterised by the accessibility of public and cultural facilities. Industry–creative composite villages feature a diverse range of industries and highly dense cultural and creative spaces.
(5)
Based on research conducted in the Yangtze River Delta (YRD) region, which possesses broad global influence and representativeness, the study indicates that regional sustainable development requires both differentiated functional positioning and complementary synergistic development among various village types. For example, culture–service-driven villages are well-suited to serve as core regional cultural service nodes. In contrast, industry–creative-driven villages are appropriate as innovation nodes for cultural and creative–industrial synergistic development.

Supplementary Materials

The following supporting information can be downloaded at: https://www.mdpi.com/article/10.3390/buildings16010133/s1, Figure S1: Sensitivity of quantization error (QE) and topographic error (TE) to SOM map size; Figure S2: Sensitivity of quantization error (QE) to learning rate and training epochs in the SOM model; Figure S3: Sensitivity of topographic error (TE) to learning rate and training epochs in the SOM model; Figure S4: Mean Davies–Bouldin index across repeated runs for different numbers of clusters; Figure S5: Mean Calinski–Harabasz index across repeated runs for different numbers of clusters; Figure S6: Mean average silhouette coefficient across repeated runs for different numbers of clusters; Table S1: Multicollinearity assessment of explanatory variables using variance inflation factor (VIF); Table S2: Classification performance metrics of the ANN, RF, and XGBoost model 1; Table S3: Results of Five-fold Cross-validation.

Author Contributions

Conceptualization, W.D.; methodology, W.D.; software, W.D.; validation, W.D.; formal analysis, W.D.; resources, W.D.; data curation, W.D.; writing—original draft preparation, W.D., Y.J., Q.D.; writing—review and editing, W.D., Y.J., and Q.D.; visualization, W.D.; supervision, T.C.; project administration, T.C.; funding acquisition, T.C. All authors have read and agreed to the published version of the manuscript.

Funding

This research was funded by the National Natural Science Foundation of “Context-Informed Green Building Design Methods and Key Technologies in the Yangtze River Delta” (Grant No. 51878141).

Data Availability Statement

The datasets presented in this article are not readily available as the data are part of an ongoing study. Requests to access the datasets should be directed to the authors.

Conflicts of Interest

The authors declare no conflicts of interest.

References

  1. Wang, D.; Zhu, Y.; Zhao, M.; Lv, Q. Multi-dimensional hollowing characteristics of traditional villages and its influence mechanism based on the micro-scale: A case study of Dongcun Village in Suzhou, China. Land Use Policy 2021, 101, 105146. [Google Scholar] [CrossRef] [Scilit]
  2. Mahmud, H.; Roy, J. Barriers to Overcome in Accelerating Renewable Energy Penetration in Bangladesh. Sustainability 2021, 13, 7694. [Google Scholar] [CrossRef] [Scilit]
  3. Vairo, T.; Pettinato, M.; Reverberi, A.P.; Milazzo, M.F.; Fabiano, B. An approach towards the implementation of a reliable resilience model based on machine learning. Process Saf. Environ. Prot. 2023, 172, 632–641. [Google Scholar] [CrossRef] [Scilit]
  4. Holling, C.S. Resilience and Stability of Ecological Systems; Cambridge University Press: Cambridge, UK, 1973. [Google Scholar]
  5. Pickett, S.T.A.; Cadenasso, M.L.; Grove, J.M. Resilient cities: Meaning, models, and metaphor for integrating the ecological, socio-economic, and planning realms. Landsc. Urban Plan. 2004, 69, 369–384. [Google Scholar] [CrossRef] [Scilit]
  6. Folke, C.; Carpenter, S.R.; Walker, B.; Scheffer, M.; Chapin, T.; Rockström, J. Resilience thinking: Integrating resilience, adaptability and transformability. Ecol. Soc. 2010, 15, 20. [Google Scholar] [CrossRef] [Scilit]
  7. Nations, U. The Sustainable Development Goals Report 2024; United Nations: New York, NY, USA, 2024. [Google Scholar]
  8. Zhang, J.; Wang, S.; Pradhan, P.; Zhao, W.; Fu, B. Untangling the interactions among the Sustainable Development Goals in China. Sci. Bull. 2022, 67, 977–984. [Google Scholar] [CrossRef] [Scilit] [PubMed]
  9. Chirisa, I.; Nel, V. Resilience and climate change in rural areas: A review of infrastructure policies across global regions. Sustain. Resilient Infrastruct. 2022, 7, 380–390. [Google Scholar] [CrossRef] [Scilit]
  10. Leitão, L.; Brown, S. Wayfinder Heritage: Applying Resilience Thinking to Long-Term Planning of Heritage Places; ICOMOS & IUCN: Paris, France, 2023; p. 75. [Google Scholar]
  11. Ostrom, E. A General Framework for Analyzing Sustainability of Social-Ecological Systems. Science 2009, 325, 419–422. [Google Scholar] [CrossRef] [Scilit]
  12. Sun, F.; Zheng, Q.; Ye, C.; Lin, J. A rural resilience development indicator system oriented to common prosperity: The case of a coastal village in Zhejiang Province. Ecol. Indic. 2023, 156, 111126. [Google Scholar] [CrossRef] [Scilit]
  13. Wu, X.; Yuan, Z. Understanding the socio-cultural resilience of rural areas through the intergenerational relationship in transitional China: Case studies from Guangdong. J. Rural. Stud. 2023, 97, 303–313. [Google Scholar] [CrossRef] [Scilit]
  14. Gocer, O.; Boyacioglu, D.; Karahan, E.E.; Shrestha, P. Cultural tourism and rural community resilience: A framework and its application. J. Rural. Stud. 2024, 107, 103238. [Google Scholar] [CrossRef] [Scilit]
  15. Moussavi, S.M.R.; Lak, A. Cultural landscapes in climate change: A framework for resilience in developing countries. J. Environ. Manag. 2024, 362, 121310. [Google Scholar] [CrossRef] [Scilit]
  16. Li, H.; Jin, X.; Liu, J.; Feng, D.; Xu, W.; Zhou, Y. Analytical framework for integrating resources, morphology, and function of rural system resilience—An empirical study of 386 villages. J. Clean. Prod. 2022, 365, 132738. [Google Scholar] [CrossRef] [Scilit]
  17. Lin, Z.R.; Liang, Y.; Liu, X.H. Study on spatial form evolution of traditional villages in Jiuguan under the influence of historic transportation network. Herit. Sci. 2024, 12, 29. [Google Scholar] [CrossRef] [Scilit]
  18. Wang, J.; Sun, Q.; Zou, L. Spatial-temporal evolution and driving mechanism of rural production-living-ecological space in Pingtan islands, China. Habitat Int. 2023, 137, 102833. [Google Scholar] [CrossRef] [Scilit]
  19. Zhou, Y.; Shen, Y.; Yang, X.; Wang, Z.; Xu, L. Where to Revitalize, and How? A Rural Typology Zoning for China. Land 2021, 10, 1336. [Google Scholar] [CrossRef] [Scilit]
  20. Chen, X.; Xie, W.; Li, H. The spatial evolution process, characteristics and driving factors of traditional villages from the perspective of the cultural ecosystem: A case study of Chengkan Village. Habitat Int. 2020, 104, 102250. [Google Scholar] [CrossRef] [Scilit]
  21. Tu, S.; Long, H. Rural restructuring in China: Theory, approaches and research prospect. J. Geogr. Sci. 2017, 27, 1169–1184. [Google Scholar] [CrossRef] [Scilit]
  22. Tao, G.; Li, X.; Tian, S.; Li, H.; Song, Y. Influence of human settlements factors on the spatial distribution patterns of traditional villages in Liaoning province. Humanit. Soc. Sci. Commun. 2024, 11, 1757. [Google Scholar] [CrossRef] [Scilit]
  23. Jia, A.; Yun, X.; Zheng, X.; Wen, X.; Liang, X.; Yun, Y. Towards Sustainable Rural Revitalization: A Multidimensional Evaluation of Rural Vitality in China’s Traditional Villages. Sustainability 2024, 16, 5408. [Google Scholar] [CrossRef] [Scilit]
  24. Zhao, X.; Xue, P.; Wang, F.; Qin, Y.; Duan, X.; Yang, Z. How to become one? The modern bond of traditional villages in centralized contiguous protection and utilization areas in China. Habitat Int. 2024, 145, 103018. [Google Scholar] [CrossRef] [Scilit]
  25. Han, G.; Wei, Z.; Zheng, H.; Zhu, L. Evaluation Index System of Rural Ecological Revitalization in China: A National Empirical Study Based on the Driver-Pressure-State-Impact-Response Framework. Land 2024, 13, 1270. [Google Scholar] [CrossRef] [Scilit]
  26. Liu, R.; Zhang, L.; Tang, Y.; Jiang, Y. Understanding and evaluating the resilience of rural human settlements with a social-ecological system framework: The case of Chongqing Municipality, China. Land Use Policy 2024, 136, 106966. [Google Scholar] [CrossRef] [Scilit]
  27. Liu, S.; Ge, J.; Bai, M.; Yao, M.; He, L.; Chen, M. Toward classification-based sustainable revitalization: Assessing the vitality of traditional villages. Land Use Policy 2022, 116, 106060. [Google Scholar] [CrossRef] [Scilit]
  28. Dai, M.; Huang, X.; Xu, Y.; Han, Z. Spatial patterns and influencing factors of traditional villages in the Pearl River–Xijiang River Economic Belt (PRXREB). PLoS ONE 2025, 20, e0321646. [Google Scholar] [CrossRef] [Scilit] [PubMed]
  29. Aktürk, G.; Dastgerdi, A.S. Cultural Landscapes under the Threat of Climate Change: A Systematic Study of Barriers to Resilience. Sustainability 2021, 13, 9974. [Google Scholar] [CrossRef] [Scilit]
  30. Daskon, C. Cultural Resilience—The Roles of Cultural Traditions in Sustaining Rural Livelihoods: A Case Study from Rural Kandyan Villages in Central Sri Lanka. Sustainability 2010, 2, 1080–1100. [Google Scholar] [CrossRef] [Scilit]
  31. Chen, X.; Li, B. Rethinking Cultural Creativity and Tourism Resilience in the Post-Pandemic Era in Chinese Traditional Villages. Sustainability 2022, 14, 12371. [Google Scholar] [CrossRef] [Scilit]
  32. Cáceres-Feria, R.; Hernández-Ramírez, M.; Ruiz-Ballesteros, E. Depopulation, community-based tourism, and community resilience in southwest Spain. J. Rural Stud. 2021, 88, 108–116. [Google Scholar] [CrossRef] [Scilit]
  33. Praptika, I.P.G.E.; Yusuf, M.; Heslinga, J.H. How can communities better prepare for future disasters? Learning from the tourism community resilience model from Bali, Indonesia. J. Tour. Futures 2024, 10, 504–523. [Google Scholar] [CrossRef] [Scilit]
  34. Zhao, X.; Zhao, R. The Impact and Mechanism of Digital Villages on Agricultural Resilience in Ecologically Fragile Ethnic Areas: Evidence from China’s Provinces. Agriculture 2024, 14, 221. [Google Scholar] [CrossRef] [Scilit]
  35. Avand, M.; Khazaei, M.; Ghermezcheshmeh, B. Comprehensive assessment of resilience of flood hazard villages using a modeling and field survey approach. Int. J. Disaster Risk Reduct. 2023, 96, 103910. [Google Scholar] [CrossRef] [Scilit]
  36. Luo, H.; Zhang, Y.; Gao, X.; Liu, Z.; Meng, X.; Yang, X. Multi-scale electricity consumption prediction model based on land use and interpretable machine learning: A case study of China. Adv. Appl. Energy 2024, 16, 100197. [Google Scholar] [CrossRef] [Scilit]
  37. Zhang, R.; Yuan, Y.; Li, H.; Hu, X. Improving the framework for analyzing community resilience to understand rural revitalization pathways in China. J. Rural Stud. 2022, 94, 287–294. [Google Scholar] [CrossRef] [Scilit]
  38. Berkes, F.; Ross, H. Community Resilience: Toward an Integrated Approach. Soc. Nat. Resour. 2013, 26, 5–20. [Google Scholar] [CrossRef] [Scilit]
  39. Ye, W.; Wang, Y.; Wu, K.; Yang, X.; Yang, Q.; Liu, Q. Exploring the rural transformation of the Loess Plateau from a perspective of community resilience: A case study from the Jiaxian County, northwestern China. Appl. Geogr. 2023, 154, 102919. [Google Scholar] [CrossRef] [Scilit]
  40. Cabell, J.F.; Oelofse, M. An Indicator Framework for Assessing Agroecosystem Resilience. Ecol. Soc. 2012, 17, 18. [Google Scholar] [CrossRef] [Scilit]
  41. Xie, X.; Zhou, G.; Yu, S. Study on rural ecological resilience measurement and optimization strategy based on PSR-“Taking Weiyuan in Gansu Province as an Example”. Sustainability 2023, 15, 5462. [Google Scholar] [CrossRef] [Scilit]
  42. Lang, W.; Hui, E.C.-M.; Chen, T.; Huang, Y. A pathway to empower rural resilience through rural computing: An exploratory study. Appl. Geogr. 2025, 176, 103530. [Google Scholar] [CrossRef] [Scilit]
  43. CPC Central Committee; State Council. Outline of the Integrated Regional Development of the Yangtze River Delta. Gazette of the State Council of the People’s Republic of China, 1 December 2019; pp. 10–34.
  44. Wu, J.; Sun, W. Regional Integration and Sustainable Development in the Yangtze River Delta, China: Towards a Conceptual Framework and Research Agenda. Land 2023, 12, 470. [Google Scholar] [CrossRef] [Scilit]
  45. National Bureau of Statistics of China. China Statistical Yearbook 2023; China Statistical Publishing House: Beijing, China, 2023. [Google Scholar]
  46. Wilson, G. Multifunctional ‘quality’ and rural community resilience. Trans. Inst. Br. Geogr. 2010, 35, 364–381. [Google Scholar] [CrossRef] [Scilit]
  47. Lane, M.; Dawes, L.; Grace, P. Scalar considerations in carrying capacity assessment: An Australian example. Popul. Environ. 2015, 36, 356–371. [Google Scholar] [CrossRef] [Scilit]
  48. Yang, B.; Feldman, M.W.; Li, S. The status of perceived community resilience in transitional rural society: An empirical study from central China. J. Rural Stud. 2020, 80, 427–438. [Google Scholar] [CrossRef] [Scilit]
  49. Wang, J.; Deng, Y.; Qalati, S.A.; Qureshi, N.A. Urban Resilience and Transportation Infrastructure Level in the Yangtze River Delta. Front. Environ. Sci. 2022, 10, 893964. [Google Scholar] [CrossRef] [Scilit]
  50. Pan, Y.; Lin, Y.; Yang, R. Agricultural Production Space Suitability in China: Spatial Pattern, Influencing Factors and Optimization Strategies. Int. J. Environ. Res. Public Health 2022, 19, 13812. [Google Scholar] [CrossRef] [Scilit] [PubMed]
  51. Guo, F.; Wang, J.; Wang, F.; Kong, T.; Zhang, X.; Cheng, Z. Measuring China’s digital financial inclusion: Index compilation and spatial characteristics. China Econ. Q. 2020, 19, 1401–1418. [Google Scholar] [CrossRef]
  52. Du, Y.; Wang, Q.; Zhou, J. How does digital inclusive finance affect economic resilience: Evidence from 285 cities in China. Int. Rev. Financ. Anal. 2023, 88, 102709. [Google Scholar] [CrossRef] [Scilit]
  53. Hu, L.; Chen, F.; Zhao, R. Does Digital Inclusive Finance Increase Industry Chain Resilience in China? Sustainability 2024, 16, 6028. [Google Scholar] [CrossRef] [Scilit]
  54. Van Meerbeek, K.; Jucker, T.; Svenning, J.C. Unifying the concepts of stability and resilience in ecology. J. Ecol. 2021, 109, 3114–3132. [Google Scholar] [CrossRef] [Scilit]
  55. Li, M.; Luo, G.; Li, Y.; Qin, Y.; Huang, J.; Liao, J. Effects of landscape patterns and their changes on ecosystem health under different topographic gradients: A case study of the Miaoling Mountains in southern China. Ecol. Indic. 2023, 154, 110796. [Google Scholar] [CrossRef] [Scilit]
  56. Wang, Y.; Huang, A.; Wang, F.E.; Cheng, Z.; Wang, M. Land Use Functions Serve as a Critical Tool for Advancing the Settlements Quality Assessment in Traditional Villages: A Case Study of Guizhou Province. Land 2025, 14, 462. [Google Scholar] [CrossRef] [Scilit]
  57. Chai, C.Q.; Zhang, B.B.; Li, Y.Y.; Niu, W.H.; Zheng, W.W.; Kong, X.B.; Yu, Q.; Zhao, M.J.; Xia, X.L. A new multi-dimensional framework considering environmental impacts to assess green development level of cultivated land during 1990 to 2018 in China. Environ. Impact Assess. Rev. 2023, 98, 106927. [Google Scholar] [CrossRef] [Scilit]
  58. Baldwin, C.; Hamerlinck, J.; McKinlay, A. Institutional support for building resilience within rural communities characterised by multifunctional land use. Land Use Policy 2023, 132, 106808. [Google Scholar] [CrossRef] [Scilit]
  59. Li, G.; Chen, B.; Zhu, J.; Sun, L. Traditional Village research based on culture-landscape genes: A Case of Tujia traditional villages in Shizhu, Chongqing, China. J. Asian Archit. Build. Eng. 2024, 23, 325–343. [Google Scholar] [CrossRef] [Scilit]
  60. Wu, X.; Chen, L.; Li, X. “Without the school, the village has no soul”: Rethinking school and socio-cultural resilience in rural China. Habitat Int. 2025, 166, 103610. [Google Scholar] [CrossRef] [Scilit]
  61. Liu, S.; Ge, J.; Bai, M.; Yao, M.; Zhu, Z. Uncovering the factors influencing the vitality of traditional villages using POI (point of interest) data: A study of 148 villages in Lishui, China. Herit. Sci. 2023, 11, 123. [Google Scholar] [CrossRef] [Scilit]
  62. Ranjgar, B.; Sadeghi-Niaraki, A.; Shakeri, M.; Choi, S.-M. An ontological data model for points of interest (POI) in a cultural heritage site. Herit. Sci. 2022, 10, 13. [Google Scholar] [CrossRef] [Scilit]
  63. Fischer, J.; Hartel, T.; Kuemmerle, T. Conservation policy in traditional farming landscapes. Conserv. Lett. 2012, 5, 167–175. [Google Scholar] [CrossRef] [Scilit]
  64. Qian, X.; Xu, K. How village leaders behave in leading vernacular heritage-based rural regeneration in traditional villages, agent or steward? Field research in traditional villages of the southeast of Chongqing, China. Habitat Int. 2025, 156, 103257. [Google Scholar] [CrossRef] [Scilit]
Figure 1. Location and scope of the Yangtze River Delta.
Buildings 16 00133 g001
Figure 2. Technical Roadmap.
Buildings 16 00133 g002
Figure 3. Spatial distribution of community resilience indicators in traditional villages of the Yangtze River Delta. (A) Population size, (B) Public service accessibility, (C) Village organisation density.
Buildings 16 00133 g003
Figure 4. Spatial distribution of economic resilience indicators in traditional villages of the Yangtze River Delta. (A) Industrial structure; (B) Digital Financial Inclusion Index.
Buildings 16 00133 g004
Figure 5. Spatial distribution of ecological resilience indicators in traditional villages of the Yangtze River Delta. (A) Ecosystem sensitivity; (B) Forest coverage ratio.
Buildings 16 00133 g005
Figure 6. Spatial distribution of community resilience indicators in traditional villages of the Yangtze River Delta. (A) Cultural landscape accessibility; (B) Cultural facility accessibility; (C) Creative space density.
Buildings 16 00133 g006
Figure 7. Spatial distribution of traditional village resilience levels.
Buildings 16 00133 g007
Figure 8. Characteristics of traditional village clusters: (A) Type I; (B) Type II; (C) Type III; (D) Type IV; (E) Type V; (F) Type VI.
Buildings 16 00133 g008
Figure 9. Multi-class classification performance curves: (A) Multi-class precision–recall curves with cross-validation results; the colored horizontal dashed lines denote the class-wise baseline precision; and the color of each dashed line matches the PR curve of the corresponding class shown in the legend.; (B) Multi-class ROC curves with cross-validation results.
Buildings 16 00133 g009
Figure 10. SHAP-based interpretation for Type I villages: (A) global feature importance ranking; (B) dependence plots of key predictors.
Buildings 16 00133 g010
Figure 11. SHAP-based interpretation for Type II villages: (A) global feature importance ranking; (B) dependence plots of key predictors.
Buildings 16 00133 g011
Figure 12. SHAP-based interpretation for Type III villages: (A) global feature importance ranking; (B) dependence plots of key predictors.
Buildings 16 00133 g012
Figure 13. SHAP-based interpretation for Type IV villages: (A) global feature importance ranking; (B) dependence plots of key predictors.
Buildings 16 00133 g013
Figure 14. SHAP-based interpretation for Type V villages: (A) global feature importance ranking; (B) dependence plots of key predictors.
Buildings 16 00133 g014
Figure 15. SHAP-based interpretation for Type VI villages: (A) global feature importance ranking; (B) dependence plots of key predictors.
Buildings 16 00133 g015
Figure 16. Ablation Analysis on the Contribution of the Four Dimensions (Community, Economy, Ecology, and Culture) to Model Performance.
Buildings 16 00133 g016
Table 1. Major Resilience Assessment Frameworks for Traditional Villages.
Assessment FrameworkPrimary Resilience DimensionStrengthsLimitations
DPSER Framework EcologicalIntegrates community and economic dimensions; focuses on system dynamic processesLacks cultural resilience indicators and quantitative validation
Resource–Governance–Actor FrameworkCommunityIntegrates economic and environmental dimensions; focuses on human settlement resilienceLacks cultural dimension integration
RRS FrameworkCommunityApplies geographical detection; focuses on village scale; integrates resource–form–function evaluationLacks cultural resilience indicators and feature-based indicator identification
VTV FrameworkEconomicMeasures economic and cultural vitality jointlyIgnores ecological resilience and community resilience dimensions
Ecological–Industrial–Social FrameworkEconomicIntegrates ecological and community dimensions; classifies village types based on combined influencing factorsLacks cultural resilience indicators; uses static influencing factors without nonlinear feature identification
Cultural Landscape Resilience FrameworkCulturalIncorporates ecological and community attributes within cultural indicators; applies EFA and CFA for factor identification and validation.Lacks economic feedback mechanisms and feature identification of influencing factors
Table 2. Resilience Indicators for Traditional Villages.
Goal LevelResilience DimensionIndicatorDescription
Village Resilience PotentialCommunity ResiliencePopulation size (PS)Village population count
Public Service accessibility (PSA)Shortest distance from the village center to public buildings
Transportation accessibility (TA)Shortest distance from the village center to transportation facilities
Number of Village Organizations (NVO)Number of grassroots organisations in the village area
Economic ResilienceSecondary and Tertiary Industry Added Value (STIAV)The sum of the secondary and tertiary industry value-added represents the level of economic diversification
Rural enterprise density (RED)The number of Primary Sector enterprises (e.g., agricultural, forestry, fishery, and animal husbandry) per square kilometer of the village area
Emerging industries density (EID)Number of emerging enterprises (e.g., electronic information, internet technology) per square kilometer of the village area
Digital Financial Inclusion Index (DFII)Digitalisation penetration level in the village
Ecological ResilienceEcosystem sensitivity (ES)The responsiveness of village ecosystems to external disturbances. Based on a weighted overlay analysis of key sensitivity factors that affect the response of ecosystems to external disturbances (including terrain slope, soil type and erodibility, land cover stability, vegetation health index (NDVI), and distance to water bodies, etc.)
Cultivated land area ratio (CAR)Ratio of arable land area to total village area
Forest coverage ratio (FCR)Ratio of forest land area to total village area
Land use diversity (LUD)Number of land use types (e.g., cultivated, forest, construction) within the village area.
Terrain relief (TF)the variation in elevation within a given area
Cultural ResilienceCultural landscape accessibility (CLA)Average distance from the village center to cultural landscape spaces (including historical buildings, intangible cultural heritage display sites, and landscape nodes, etc.)
Cultural buildings accessibility (CFA)Average distance from the village center to cultural facilities
Creative space density (CSD)Number of cultural and creative spaces (e.g., intangible cultural heritage workshops, galleries) per square kilometer of the village area.
Table 3. Classification performance metrics of the XGBoost model.
Resilience TypePrecisionRecallF1-ScoreSupport
Type I0.94120.93620.938062
Type II0.93140.89110.90799
Type III 0.90420.92750.915430
Type IV0.85080.79260.817927
Type V0.86470.82940.843538
Type VI0.87690.90910.892681
Macro average0.89490.88100.8859247
Disclaimer/Publisher’s Note: The statements, opinions and data contained in all publications are solely those of the individual author(s) and contributor(s) and not of MDPI and/or the editor(s). MDPI and/or the editor(s) disclaim responsibility for any injury to people or property resulting from any ideas, methods, instructions or products referred to in the content.