Abstract
Vegetation phenology significantly influences urban microclimate and thermal comfort in cold regions, yet its quantitative impact—specifically the potential of deciduous trees to enhance winter solar access—remains underexplored. This study investigates how seasonal vegetation changes affect thermal conditions in an urban plaza. Field measurements were conducted at Beiyang Plaza, Tianjin University, during the autumn–winter transition. High-precision Sky View Factors (SVF) were extracted from panoramic images using a deep learning-based semantic segmentation model (PSPNet), validated against field observations. The Universal Thermal Climate Index (UTCI) was calculated to assess thermal stress. Results indicate that the leaf-off phase significantly increases SVF, shifting the radiative balance. Areas experiencing phenological changes exhibited a marked improvement in UTCI, effectively alleviating cold stress by maximizing solar gain. Advanced statistical models (ARIMAX and GAM) confirmed that, after controlling for background climatic variations, the positive effect of vegetation phenology on thermal comfort is statistically significant. These findings challenge the traditional focus on summer shading, highlighting the “winter-warming” potential of deciduous trees and providing quantitative evidence for climate-responsive urban design.
1. Introduction
In urban environments, microclimatic conditions and thermal comfort significantly influence residents’ quality of life and health. While the urban heat island effect is commonly identified as a primary concern during summer months [1,2], the challenges associated with outdoor thermal comfort in cold regions during winter differ substantially. Low ambient temperatures, reduced solar altitude angles, and insufficient solar radiation during winter months often lead to outdoor environments experiencing severe cold stress. Consequently, the creation of a thermally comfortable outdoor environment under these harsh winter conditions has emerged as an urgent research priority [3,4].
1.1. Winter Features and Role of Vegetation Phenology
The distinct climatic characteristics of winter in cold regions necessitate targeted measures for managing the local thermal environment, emphasizing efficient solar radiation capture and effective utilization of localized thermal energy [5]. Within this context, vegetation—particularly deciduous trees—undergoes significant seasonal changes in canopy structure and shading effectiveness, profoundly impacting shading and radiation balance in open spaces such as urban plazas. After leaf fall, the Sky View Factor (SVF) increases markedly, allowing a greater proportion of solar radiation to directly reach surfaces and occupants. As demonstrated by Redweik et al. (2013), the sky view factor is a primary determinant of the solar energy potential on urban surfaces [6]. Therefore, the phenology-driven increase in SVF acts as a critical mechanism to improve thermal comfort under cold conditions (Figure 1).

Figure 1.
Schematic diagram illustrating the influence of vegetation phenology (leaf-on vs. leaf-off) on Sky View Factor (SVF) and winter solar access.
1.2. Previous Research on Vegetation and Microclimate
A substantial body of research has demonstrated that trees significantly influence local microclimatic conditions. However, existing studies have predominantly concentrated on the “cooling effect” of vegetation in summer. For instance, Feng et al. (2023) highlighted the pivotal role of tree canopies in reducing local temperatures in hot and humid areas [7]. Similarly, Gao et al. (2021) confirmed a strong correlation between canopy density and understory microclimate regulation [8]. Aalto et al. (2021) further validated that trees effectively regulate radiation and wind speed in urban fringe areas [9].
Despite these advances, a critical research gap remains regarding the temporal dynamics of these effects. Most previous studies have relied on binary comparisons between “leaf-on” (summer) and “leaf-off” (winter) seasons, treating vegetation as a static element within each season [10,11]. Recent investigations by Duan et al. (2025) and Xu et al. (2025) have begun to highlight the importance of seasonal variations in green indices and morphological patterns [12,13]. However, quantitative research exploring the continuous process of phenological change—specifically the gradual leaf fall transition—remains sparse. This study aims to bridge this gap by monitoring the entire autumn-to-winter transition to reveal how progressive canopy loss alters the microclimate.
1.3. Research Progress on SVF and UTCI Relationships
SVF, an important quantitative indicator of spatial openness, is widely applied in urban microclimatic evaluations. Previous studies have demonstrated that SVF is not only closely associated with the urban heat island effect but also plays a pivotal role in characterizing localized thermal conditions [14]. Compared to traditional simulation-based methods, estimating SVF from street-level imagery offers a more realistic representation of the physical environment. Gong et al. (2018) validated that SVF derived from segmented street view images achieves high agreement with fisheye photo measurements and provides a scalable approach for high-density urban environments [15].
Building on this, Shata et al. (2021) identified significant correlations between SVF and the Universal Thermal Climate Index (UTCI) in hot, arid environments [16]. Similarly, Dirksen et al. (2019) utilized remote sensing data to elucidate SVF’s sensitivity in assessing urban heat islands [17]. However, the potential of deciduous trees to alleviate cold stress by enhancing solar access in winter has received significantly less attention compared to summer shading. To advance this line of research, the present study systematically analyzes the influence of vegetation phenological transitions on SVF and UTCI in cold-region urban environments. By employing a deep learning-based segmentation approach, this study aims to quantitatively reveal how the seasonal leaf-fall process modulates solar access and improves outdoor thermal comfort. To guide this investigation, a systematic research framework was established, integrating data acquisition, statistical grouping, and advanced modeling, as illustrated in Figure 2.

Figure 2.
The methodological framework of this study, integrating deep learning-based visual data extraction (PSPNet) and statistical time-series analysis (ARIMAX/GAM) to quantify the phenological impact on thermal comfort.
2. Methodology
2.1. Study Area and Morphological Characteristics
Beiyang Plaza at Tianjin University was selected as the representative study area (Figure 3). Situated in a typical cold region (Köppen climate classification Dwa, 39°06′ N, 117°10′ E), the plaza features a rigorous geometric layout organized along a central axis. The site is defined by a combination of granite paving, water features, and symmetrical green spaces.

Figure 3.
Study Area: Beiyang Plaza, Tianjin University (39°06′ N, 117°10′ E). Left: Location analysis; Right: Aerial view and site photos (Source: Photographed by the authors); Bottom: Detailed plan showing vegetation distribution and measurement points.
The vegetation consists primarily of mature deciduous broadleaf trees (Populus spp.), arranged in linear rows flanking the central water feature. Based on field surveys, the trees have an average height of approximately 12–15 m with a crown diameter of 8–10 m. The trunk height is about 2.5–3 m, creating a permeable visual corridor at the pedestrian level while forming a continuous canopy overhead. It is important to note that, unlike traditional arcaded plazas, the pedestrian paths at the measurement points are free from architectural overhangs or porticoes. The variations in shading in these zones are driven exclusively by vegetation phenology.
2.2. Measurement Design
Based on the actual site conditions and the need to isolate phenological effects, ten measurement points (labelled A through J) were uniformly established across Beiyang Plaza. The points were strategically categorized into two groups:
- 1.
- Vegetation-Affected Group (Points A–H): Located under or near the tree canopy, these points are directly subject to seasonal SVF changes caused by leaf fall.
- 2.
- Control Group (Points I and J): Established to provide baseline data independent of phenology.
Point I (Open Control): Located in an unobstructed open square, representing a consistently high SVF scenario.
Point J (Shaded Control): Situated inside the Memorial Pavilion (as shown in Figure 3). This point is permanently shaded by the pavilion’s roof structure, representing a consistently low SVF scenario unaffected by vegetation changes.
This systematic arrangement effectively reflects the diverse influences of vegetation configurations and structural shading, providing robust empirical data for subsequent quantitative analyses.
2.3. Data Collection and Calculation
Data collection and calculation procedures in this study consist of three main components: meteorological data collection, SVF measurement and calculation, and UTCI computation.
2.3.1. Meteorological Data Collection
Meteorological data were collected from 09:00 to 17:00 daily, coinciding with peak periods of human activity. The Portable multifunctional meteorological instruments use, specifically a Hengxin AZ8758 (AZ Instrument Corp., Taichung City, Taiwan, China) and a Kestrel 5500 (NK5500; NK Home Products LLC, Birmingham, MI, USA), were used to measure key parameters including air temperature (), relative humidity (RH), wind speed (), and black globe temperature () at each measurement location (Figure 4). Detailed specifications of the instruments, including measurement ranges and sensor accuracy, are listed in Table 1. Following on-site calibration and data preprocessing, mean radiant temperature (MRT) was calculated using the black globe temperature method to accurately represent the actual impact of radiant heat within localized thermal environments in urban plazas. Specifically, the black globe device used in the experiment had a diameter of 75 mm ( = 0.075 m) and an emissivity () of 0.95. MRT was computed based on the data, using the following formula:
where:
is the black globe temperature (°C);
is the air temperature (°C);
is the wind speed (m/s);
is the emissivity of the globe’s surface (usually taken as 0.95);
is the diameter of the black globe (m), which is 0.075 m in this study.
This equation first converts the measured temperatures to absolute temperature units (Kelvin), incorporates corrections for convective heat transfer effects due to wind speed, and finally reconverts the results into Celsius. Through this approach, the combined influence of radiant heat, convection, and ambient temperature on human thermal comfort can be accurately assessed, thus providing essential data to support subsequent UTCI calculations and microclimatic regulation analyses.

Figure 4.
Measurement instruments and field survey scenes during the data collection period in Beiyang Plaza, Tianjin University: (a,b) Kestrel 5500; (c) AZ8758.

Table 1.
Specifications of the meteorological instruments used in the field measurement.
Table 1.
Specifications of the meteorological instruments used in the field measurement.
| Instrument Model | Measured Parameter | Measurement Range | Accuracy | Resolution |
|---|---|---|---|---|
| Kestrel 5500 (NK Home Products LLC, Birmingham, MI, USA) | Air Temperature (Ta) | −29.0 to 70.0 °C | ±0.5 °C | 0.1 °C |
| Relative Humidity (RH) | 10% to 90% | ±2% | 0.10% | |
| Wind Speed (v) | 0.6 to 40.0 m/s | ±3% | 0.1 m/s | |
| Wind Direction | 0° to 360° | ±5° | 1 °C | |
| AZ 8758 (AZ Instrument Corp., Taichung City, Taiwan, China) | Globe Temperature (Tg) | 0 to 80.0 °C | ±0.6 °C | 0.1 °C |
| (Black Bulb) |
2.3.2. UTCI Calculation
The UTCI is an integrated indicator widely used for assessing outdoor thermal comfort. It is calculated based on a human energy balance model that synthesizes air temperature, wind speed, humidity, and mean radiant temperature (MRT). In this study, UTCI values were computed utilizing the open-source Python library pythermalcomfort (version 0.10.0) under Python 3.9 [18]. This tool employs a polynomial approximation model, derived from extensive numerical simulations, to achieve high-accuracy approximations of the original human energy balance equations.
In cold-region contexts, UTCI values between 0 °C and 9 °C are generally categorized as ‘slight cold stress.’ However, for local populations, this range often represents a thermally acceptable condition due to long-term adaptation. For instance, field studies in the adjacent city of Beijing have reported that residents across different age groups exhibit a high tolerance for cold, with the lower limit of the thermal acceptability range extending well into this ‘slight cold stress’ band [19]. Therefore, upward shifts within this range represent a meaningful improvement in comfort for outdoor activities.
2.3.3. SVF Data Acquisition and Calculation
To obtain the SVF at each measurement point, panoramic images were first captured at designated sampling dates using standardized fisheye lens equipment. Compared to traditional simulation-based methods (e.g., using simplified geometric blocks in ENVI-met), estimating SVF from street-level imagery offers a more realistic representation of the physical environment, as it captures the intricate and irregular branching structures of vegetation. This method has been validated for high-density urban contexts and proven to yield higher correlation with ground-level radiation measurements [20].
Subsequently, these panoramic images underwent geometric correction and projection transformation to generate fisheye images (Figure 5). To accurately quantify the sky proportion, a deep learning-based semantic segmentation model was applied. Specifically, the Pyramid Scene Parsing Network (PSPNet) architecture was selected for its superior performance in scene parsing tasks [21]. Unlike traditional Fully Convolutional Networks (FCNs) which often struggle with multi-scale objects, PSPNet incorporates a hierarchical Pyramid Pooling Module. This module aggregates contextual information from different sub-regions (with bin sizes of 1 × 1, 2 × 2, 3 × 3, and 6 × 6), thereby fusing global and local context.
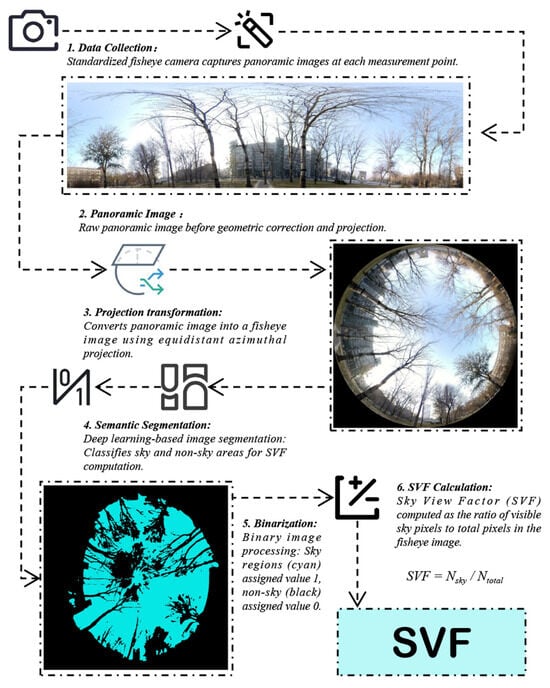
Figure 5.
Calculation Method for SVF.
This capability is particularly crucial for our study area during the winter transition, where the complex, fine-grained mesh of leafless tree branches creates ambiguous boundaries against the sky background. The model was pre-trained on the Cityscapes dataset—a large-scale database of diverse urban street scenes—and fine-tuned to distinguish between ‘vegetation’ (including trunks and thin branches), ‘building’, and ‘sky’ pixels with high precision. Following segmentation, the resulting probability maps were binarized using an optimal threshold. Finally, SVF was calculated by quantifying the ratio of sky pixels (Nsky) to the total number of pixels (Ntotal) within the hemispherical view, providing a high-precision, time-resolved dataset for analyzing phenological changes [22].
2.4. Statistical Analysis Framework
To systematically quantify the influence of vegetation phenology on thermal comfort, a multi-stage statistical framework was established, progressing from descriptive grouping to advanced time-series modeling. First, to verify the rationale of the grouping strategy, a one-way Analysis of Variance (ANOVA) was conducted. This test evaluated whether the variation in SVF (ΔSVF) differed significantly between the identified “Vegetation-affected” and “Non-plant-affected” groups, providing statistical legitimacy for the subsequent comparative analysis.
Second, considering the inherent periodicity in meteorological data, Seasonal-Trend Decomposition using Loess (STL) was employed [23]. This non-parametric method decomposes the original time series of SVF and UTCI into three additive components: a long-term trend (reflecting seasonal progression), a seasonal component (reflecting diurnal cycles), and a residual component (random noise). This decomposition allows for the isolation of the “phenological trend” from daily meteorological fluctuations.
Finally, to determine the independent contribution of SVF to UTCI after controlling for confounding climatic variables, two complementary modeling approaches were utilized:
- 1.
- ARIMAX Model (AutoRegressive Integrated Moving Average with Exogenous Variables): Standard linear regression models often fail to capture the temporal autocorrelation inherent in time-series data (i.e., the current temperature is dependent on previous states). The ARIMAX model addresses this by explicitly modeling the autoregressive (AR) and moving average (MA) terms while incorporating SVF, temperature, humidity, and wind speed as exogenous predictors (X). This approach allows for a rigorous estimation of the linear marginal effect of SVF on UTCI while satisfying the assumption of independent residuals [24].
- 2.
- GAM (Generalized Additive Model): Recognizing that microclimatic interactions are rarely strictly linear—for instance, the cooling effect of wind speed and the warming effect of solar radiation may not scale linearly with thermal sensation—a Generalized Additive Model was employed. GAMs extend generalized linear models by allowing the linear predictor to depend on unknown smooth functions of predictor variables [25]. By fitting penalized regression splines to the data, this model offers a flexible framework to uncover complex, non-linear SVF-UTCI response curves without imposing rigid parametric assumptions [26].
3. Results and Discussion
This study uses continuous field observations and quantitative modeling to examine how deciduous tree leaf fall affects the microclimate and outdoor thermal comfort in cold-region urban plazas. The results are organized into five parts: data preprocessing and grouping based on SVF variation, descriptive statistics and comparative analysis, temporal evolution revealed by STL decomposition, quantitative modeling with ARIMAX and GAM, and intergroup differences with corresponding design implications.
3.1. Data Preprocessing and Grouping Strategies
In this study, preprocessing was conducted on meteorological data—comprising SVF, UTCI, air temperature, humidity, wind speed, and global radiation—collected across several critical sampling periods. The aim of this preprocessing step was to ensure the accuracy, reliability, and comparability of the datasets, thus establishing a robust foundation for subsequent quantitative analyses. To eliminate potential biases arising from instrument errors, environmental disturbances, and inconsistencies in sampling timing, rigorous quality control procedures were implemented on the raw data. These included outlier detection, missing data exclusion, and appropriate data imputation. Additionally, spatial and temporal standardization was uniformly applied across observations from all measurement points, enabling coherent comparisons both horizontally (across locations) and longitudinally (over time).
Following these procedures, the maximum and minimum SVF values for each measurement point throughout the entire sampling period were computed. Based on these calculations, the variation in SVF (ΔSVF) was derived to quantitatively characterize local changes in sky visibility associated with leaf-fall events (Table 2, Figure 6a).
Table 2.
Variation in SVF at Each Measurement Point During the Sampling Period.
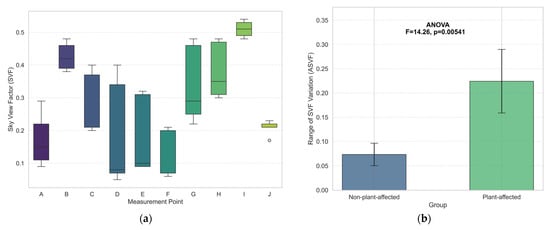
Figure 6.
(a) Variation in SVF During Sampling Period; (b) Comparison of ΔSVF between Plant-affected and Non-plant-affected Groups (ANOVA). Note: Significant difference between groups (F = 14.26, p = 0.00541).
To classify measurement points based on the statistical distribution of ΔSVF values, a threshold of 0.15 was established. Points exhibiting an SVF variation equal to or exceeding 0.15 during the sampling period were designated as belonging to the “Plant-affected Group”, while those with variations below 0.15 were categorized into the “Non-plant-affected Group”. Accordingly, the ten measurement points were divided into two groups based on observed ΔSVF values across five sampling dates and corresponding field observations. Specifically, measurement points A, C, D, E, F, G, and H, characterized by substantial ΔSVF and clear evidence of vegetation-induced changes in the field, constituted the Plant-affected Group. Conversely, points B, I, and J, showing relatively minor and stable SVF variations, comprised the Non-plant-affected Group.
To validate the statistical rationality of this grouping strategy, a one-way analysis of variance (ANOVA) was conducted to compare the magnitude of SVF variations between the two groups (Figure 6b). The analysis demonstrated a significant difference in SVF variations between the Plant-affected and Non-plant-affected groups (F = 14.26, p = 0.00541), confirming the effectiveness of the chosen threshold in differentiating the groups statistically. This classification scheme not only elucidates the considerable influence of deciduous tree leaf-fall on localized variations in sky visibility but also provides a robust stratified data foundation for subsequent investigations into the independent contributions of leaf-fall events on thermal comfort indicators (UTCI), utilizing time-series decomposition methods and statistical modeling approaches.
From a broader temporal perspective, data preprocessing, point classification, and subsequent decomposition analyses collectively reveal that the Plant-affected Group experienced a distinct upward trend in SVF during late autumn to early winter, whereas the Non-plant-affected Group exhibited relatively stable SVF values. This pattern indicates that deciduous canopy loss significantly reduced local visual obstruction, thereby increasing sky openness and facilitating greater solar radiation access. Such an increase in sky openness provides the physical basis for the seasonal buffering effect of leaf fall on local thermal stress.
3.2. Descriptive Statistics and Preliminary Comparative Analysis
To explore the overall microclimatic distribution across measurement points and assess the potential contribution of SVF to the UTCI, descriptive statistical analysis and preliminary comparisons were first conducted on the data collected from all measurement locations.
As shown in the temperature boxplot (Figure 7a), notable differences in both the mean values and dispersion of temperature are evident across measurement points, indicating that localized environmental characteristics-such as vegetation shading and surface material composition-exert considerable influence on ambient temperature.
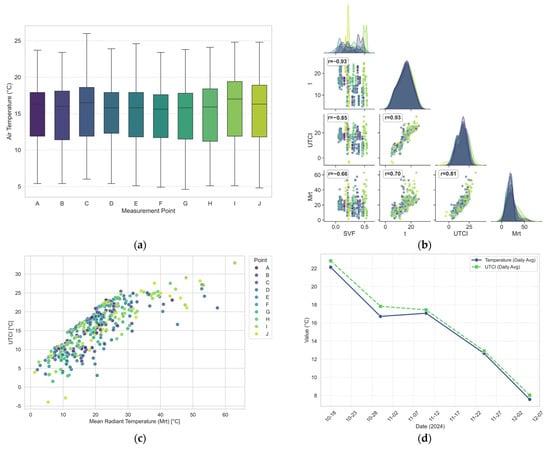
Figure 7.
(a) Boxplot of Temperature Distribution Across Measurement Points; (b) Spearman’s Correlation Among Meteorological Variables and UTCI; (c) Scatter Plot of MRT and UTCI; (d) Daily Mean Temperature and UTCI Seasonal Trends (October–December). Note: SVF showed significant negative correlation with UTCI (ρ ≈ −0.8).
Subsequently, a Spearman correlation matrix (Figure 7b) was constructed to illustrate the pairwise relationships among air temperature (t), relative humidity (RH), wind speed (V), SVF, MRT, and the UTCI. The analysis revealed a pronounced negative instantaneous correlation between SVF and UTCI (ρ ≈ −0.8), suggesting that in cold seasons, a higher SVF is typically associated with lower thermal comfort levels—likely due to increased longwave radiative heat loss. Meanwhile, a strong positive correlation was observed between MRT and UTCI (ρ ≈ 0.81), underscoring the dominant role of solar radiation in enhancing perceived thermal conditions. The correlation between air temperature and UTCI was even stronger (ρ ≈ 0.93), confirming the direct and substantial influence of air temperature on human thermal sensation.
In contrast, wind speed (V) exhibited relatively weak correlations with all other variables, with Spearman coefficients ranging from −0.11 to 0.03. This indicates that wind speed had no significant influence within this dataset, possibly due to its inherently complex nature, which is often modulated by factors such as structural shielding, localized wind fields, and directional variability. The influence of SVF on UTCI appears to be multifaceted, potentially mediated by interactions with air temperature, humidity, and wind speed. Therefore, isolating the independent contribution of SVF necessitates controlling for these confounding meteorological variables.
Further insights can be drawn from the scatter plot of MRT versus UTCI (Figure 7c), which shows that as MRT increases from 0 W/m2 to approximately 40 W/m2, UTCI values rise from below 10 °C to above 25–30 °C. This trend not only reinforces the role of radiant temperature as a key driver of thermal comfort but also reveals vertical deviations in UTCI among measurement points under similar radiation conditions. These discrepancies suggest that local environmental factors—such as variations in SVF—may exert independent regulatory effects on thermal conditions.
Throughout the entire observation period (from mid-October to early December), both daily mean air temperature and UTCI exhibited a pronounced downward trend from above 20 °C to about 5 °C. Notably, on certain observation days, the peak UTCI values appeared either earlier or later than the corresponding temperature peaks by approximately 2–3 °C. This temporal lag suggests that, during the cooling process, solar radiation and localized changes in SVF may have partially offset the effects of temperature decline at specific times, thereby enhancing perceived thermal comfort (Figure 7d).
From the perspective of thermal comfort categories, in cold regions, UTCI values between 0 °C and 9 °C are generally categorized as slight cold stress and are considered thermally acceptable for outdoor conditions. Therefore, improvements in UTCI toward this range—driven by increased SVF and solar radiation—are of practical significance for enhancing outdoor thermal comfort in winter urban environments. The preliminary analysis thus indicates that while decreasing air temperature and variations in radiation are the primary drivers of thermal comfort, dynamic changes in SVF also exert an independent and positive influence on UTCI.
To more intuitively demonstrate the impact of vegetation phenological changes on microclimatic indicators, a descriptive statistical and comparative analysis was conducted for the “Plant-affected Group” and the “Non-plant-affected Group,” focusing on two key dimensions: temperature and UTCI.
As shown in Figure 8a,b, the overall distributions of temperature and UTCI exhibit discernible differences between the two groups. The median values in the boxplots for the Non-plant-affected Group (NoPlant) are generally higher than those for the Plant-affected Group (Plant), suggesting that areas with minimal vegetation-induced shading changes tended to experience higher air temperatures and UTCI values during most observation periods.
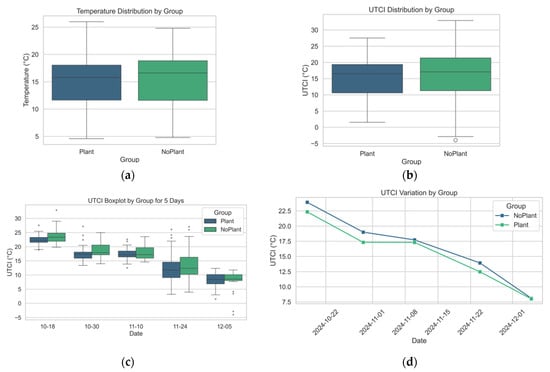
Figure 8.
(a) Temperature Comparison Between Plant and No-Plant Groups; (b) UTCI Comparison Between Plant and No-Plant Groups; (c) Boxplot of UTCI on Selected Sampling Dates by Group; (d) Line Chart Showing UTCI Trend from October to December.
To further examine the temporal evolution of this disparity, Figure 8c presents grouped boxplots of UTCI for five representative dates (October 18, October 30, November 10, November 24, and December 5). Although UTCI values declined over time for both groups, the distributional gap between the NoPlant and Plant groups progressively narrowed in the later stages of the observation period (i.e., November 24 and December 5). This trend is illustrated more clearly in Figure 8d, which shows a time series of UTCI values: while the NoPlant group consistently exhibited higher UTCI values than the Plant group, the intergroup difference steadily diminished over time. This pattern suggests that, as leaf fall progressed, the Plant group likely benefited from increased SVF, thereby enhancing solar radiation exposure and gradually narrowing the thermal comfort gap relative to the NoPlant group.
In summary, both the overall statistical analysis of all measurement points and the group-based comparison reveal that, although SVF is instantaneously negatively correlated with UTCI at the full-sample scale, leaf-fall-induced increases in SVF are associated with a relative improvement in UTCI over time under the same cold background conditions. However, due to the overarching influence of climatic background factors such as temperature, solar radiation, and wind speed, the independent contribution of SVF remains challenging to quantify directly. The grouping results indicate that, with the progression of autumn and winter leaf-fall events, the Plant group experienced a greater increase in SVF, accompanied by a reduction in the UTCI difference between the two groups, highlighting the potential of deciduous canopy loss to enhance local thermal conditions during cold seasons.
3.3. Temporal Evolution: STL Decomposition
To gain deeper insights into the temporal dynamics of microclimatic indicators at each measurement point, this study employed Seasonal-Trend Decomposition based on Loess (STL) to analyze the time series data of SVF and UTCI for both the Plant-affected and Non-plant-affected groups. STL is a non-parametric decomposition technique that utilizes locally weighted regression (Loess) to separate the original time series into three distinct components: long-term trend, seasonal variation, and residual noise. This method enables the disentanglement of gradual trends and periodic fluctuations while capturing short-term stochastic disturbances in the dataset [27].
For each measurement point, independent time series of SVF and UTCI were constructed based on the sampling frequency and characteristics of the collected data. A fixed periodicity parameter was applied accordingly. The STL decomposition results revealed that, for the Plant-affected Group (including points A, C, D, E, F, G, and H), the seasonal component of SVF exhibited a distinct upward trend throughout the sampling period. At several points, SVF values increased from approximately 0.09 in the early stages to around 0.29 by the end of the observation period, indicating that the progression of deciduous leaf fall led to a substantial increase in sky openness. This upward trend in the seasonal SVF component reflects the canopy loss associated with phenological changes, while the trend component captures the gradual shift in local climatic conditions during late autumn and early winter (Figure 9a). In contrast, the Non-plant-affected Group (points B, I, and J) showed relatively narrow SVF fluctuations (e.g., 0.38 to 0.48), with limited seasonal variability and minimal long-term trend changes (Figure 9b).
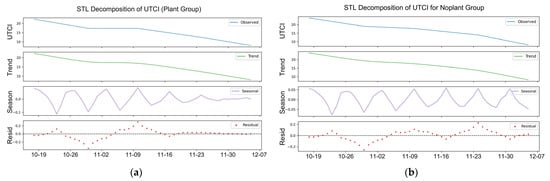
Figure 9.
(a) STL Decomposition of SVF Time Series for Plant-affected Group; (b) STL Decomposition of SVF Time Series for Non-plant-affected Group.
Similar patterns were observed in the decomposition of UTCI. The Plant-affected Group displayed more pronounced periodic modulation in UTCI, consistent with the mechanism by which leaf fall reduces shading and enhances local thermal conditions. The STL decomposition of the UTCI time series also revealed a gradual improvement in thermal comfort that aligned with the increasing SVF in the Plant-affected Group. This improvement in the trend component stands in contrast to the overall regional temperature decline during the same period, while the residual component captured short-term variability associated with meteorological fluctuations. The seasonal and trend components for both groups closely aligned with actual climatic background conditions, such as declining solar exposure and ambient temperature, thereby validating the effectiveness of STL decomposition in isolating periodic and long-term temporal dynamics.
Based on the above results, regarding the temporal dynamics of the leaf-fall process and its influence on SVF, the combined evidence from data preprocessing, point classification, and STL decomposition confirms a distinct upward trend in SVF within the Plant-affected Group during late autumn to early winter, while the Non-plant-affected Group exhibits relatively stable SVF values. This pattern indicates that deciduous canopy loss significantly reduces local visual obstruction, thereby increasing sky openness and facilitating greater solar radiation access. Additionally, STL decomposition showed that although both groups experienced seasonal fluctuations, the Plant group demonstrated a localized upward trend in SVF that contrasted with the background decline in ambient temperature, suggesting that the leaf-fall process may partially buffer local thermal stress caused by low temperatures.
In summary, the STL decomposition not only provided a detailed temporal characterization of the effects of deciduous tree leaf fall on the local microclimate of the urban plaza, but also established a robust data foundation for subsequent quantitative modeling using ARIMAX and GAM. These models will enable the disentanglement of external climatic influences and facilitate precise quantification of the independent effects of vegetation phenological changes on thermal comfort.
3.4. Quantitative Modeling: ARIMAX and GAM Analysis
To further investigate the independent influence of changes in Sky View Factor (SVF) resulting from deciduous tree leaf fall on thermal comfort (UTCI) in the urban plaza, this study employed two quantitative modeling approaches: the AutoRegressive Integrated Moving Average with Exogenous variables (ARIMAX) model [28] and the Generalized Additive Model (GAM) [29,30]. Both models are designed to isolate the effects of macro-scale climatic variations and to quantify the independent contribution of local SVF changes induced by vegetation phenology. In addition, they are capable of capturing potential nonlinear relationships and temporal dependencies among the variables.
In the ARIMAX model, UTCI was specified as the response variable, while temperature, humidity, wind speed, and SVF were included as exogenous predictors. This structure aims to disentangle the independent effect of SVF variation, which is primarily driven by leaf fall, from the broader climatic background (Figure 10). The time series was first subjected to unit root testing, and the optimal lag order was determined through analysis of the autocorrelation function (ACF) and partial autocorrelation function (PACF). Based on this evaluation, an AR(1) and MA(1) structure was adopted, and first-order differencing (d = 1) was applied when necessary to ensure stationarity. To ensure the independence of explanatory variables, all inputs were standardized, and multicollinearity was assessed.
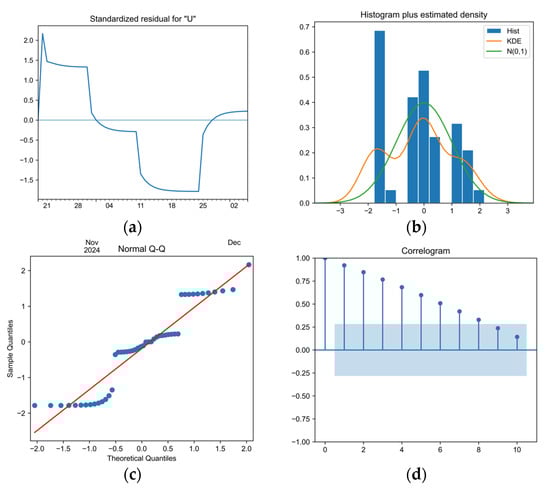
Figure 10.
Diagnostic plots of residuals from the ARIMAX model, including (a) standardized residuals, (b) histogram with kernel density and normal distribution curves, (c) normal Q-Q plot, and (d) correlogram.
Model fitting results indicated that, after accounting for overarching climatic influences, the SVF coefficient was approximately 445.65 (p < 0.001), signifying a statistically significant positive association between SVF increase and UTCI improvement. This finding confirms that SVF enhancement resulting from leaf fall independently contributes to improving local thermal comfort. The model’s Akaike Information Criterion (AIC) and Bayesian Information Criterion (BIC) were −1042.95 and −1029.85, respectively. To assess model adequacy, residual diagnostics were performed using the Ljung–Box test for white noise and the Jarque–Bera test for normality. The results indicated that the residuals conformed to the white noise assumption, thereby supporting the structural validity of the ARIMAX model.
To capture potential nonlinear relationships between UTCI, SVF, and other meteorological variables, this study further employed a Generalized Additive Model (GAM), as shown in Figure 11. The model fits smooth functions to the explanatory variables and uses Generalized Cross-Validation (GCV) to automatically determine the optimal degree of smoothness. Specifically, in the coding implementation, the model adopted a form such as s(variable, n_splines = 20, lam = 0.6), and iterative tuning was conducted to derive a reasonable smooth function representing the marginal effect of SVF on UTCI. The final model yielded an effective degrees of freedom (EDF) of approximately 12.04.

Figure 11.
(a) Partial effect of time on UTCI (GAM); (b) Partial effect of SVF on UTCI (GAM).
During model development, sensitivity analysis of the spline degrees of freedom was performed by varying the number of splines and the penalization parameter (λ), ensuring that the results remained stable across different parameter settings. Upon completion of model fitting, the pseudo-R2 reached 0.9998, indicating that the GAM effectively captured complex nonlinear relationships between variables after removing the influence of overall climatic background conditions. Diagnostic evaluations, including residual scatter plots (Figure 12a) and Q-Q plots (Figure 12b), confirmed the randomness and approximate normality of the residuals. In addition, the model’s predictive performance was validated through k-fold cross-validation, further reinforcing the robustness and reliability of the GAM approach.
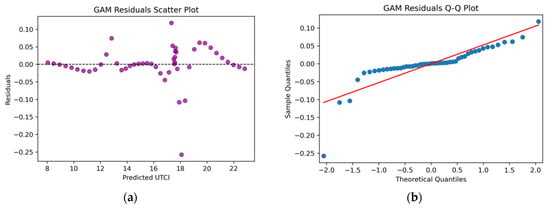
Figure 12.
(a) Residual Plot of GAM Model; (b) Q-Q Plot of GAM Model Residuals.
From the perspective of the relationship between UTCI and thermal comfort improvement, both ARIMAX and GAM model consistently demonstrated that changes in SVF contributed significantly and independently to UTCI variation. After controlling for seasonal trends and broader climatic influences, a strong correlation was observed between leaf-fall-induced increases in SVF and enhanced thermal comfort (i.e., higher UTCI values within a cold environment, corresponding to reduced cold stress). These results offer quantitative evidence for the role of vegetation phenological changes—particularly leaf fall—in altering physical processes that affect human thermal perception. They also affirm the active function of deciduous canopy transitions in regulating localized outdoor thermal environments.
The ARIMAX model, based on a linear time-series framework, provides a direct and interpretable estimation of the influence of exogenous variables on UTCI. While its parameter estimates are straightforward and easily explainable, the model may be susceptible to instability in the covariance matrix under certain conditions. In contrast, the GAM model employs smooth functions to flexibly capture nonlinearities and interaction effects between SVF and UTCI. Although this approach enables more accurate modeling of complex relationships, the selection of smoothing parameters introduces a degree of subjectivity.
To enhance the reproducibility of the results, sensitivity analyses were conducted for both models, examining the robustness of outcomes under varying parameter settings. Furthermore, cross-validation techniques were employed to evaluate the consistency of model performance and predictive accuracy. Through comparative analysis, it is evident that the ARIMAX model effectively quantifies the linear contributions of meteorological variables, including SVF, whereas the GAM model is better suited for uncovering nonlinear trends and subtle interactions among localized factors. Together, the two models offer complementary perspectives and jointly confirm the independent contribution of increased SVF—driven by leaf fall—to improvements in UTCI during the autumn and winter seasons.
In summary, both models converge to confirm that leaf-fall-induced increases in SVF play a statistically significant and physically meaningful role in improving wintertime UTCI, thereby reinforcing the interpretation that vegetation phenology is a key driver of microclimatic regulation in cold-region urban plazas.
3.5. Intergroup Differences and Discussion of the Leaf-Fall Effect
This section synthesizes findings from the STL decomposition, ARIMAX model, and GAM model to explore differences in climatic indicators between the Plant-affected and Non-plant-affected groups. The analysis further discusses the role of vegetation phenological changes—particularly leaf fall—in regulating microclimatic conditions and thermal comfort within urban plazas.
First, in terms of intergroup comparison, data analysis revealed that the Plant-affected Group exhibited a markedly increasing trend in SVF from late autumn to early winter. This group demonstrated more pronounced seasonal fluctuations and a stronger upward long-term trend in SVF than the Non-plant-affected Group. Results from the ARIMAX model indicated that, after controlling for broader climatic background variations, the increase in SVF within the Plant group significantly contributed to the improvement of thermal comfort as measured by UTCI. The GAM model further corroborated this finding, illustrating a positive nonlinear relationship between SVF and UTCI through smooth function fitting. Together, these results clearly demonstrate the practical impact of deciduous leaf fall in regulating local microclimates and enhancing thermal comfort.
Second, from the perspective of temporal dynamics and microclimatic mechanisms, as ambient temperatures declined and solar altitude angles decreased with seasonal progression, the increase in SVF due to leaf fall enhanced direct solar radiation exposure in localized areas. This increase in solar gain helped alleviate cold-related thermal discomfort during winter. The seasonal rise in SVF within the Plant-affected Group enabled leafless zones to receive more solar radiation, contributing to elevated UTCI values. This phenomenon reveals the underlying mechanism by which vegetation phenology, specifically canopy loss, modulates thermal conditions at the micro-scale.
It is important to note, however, that short-term variability in wind speed, the occurrence of extreme weather events, and discontinuities in data collection may introduce certain limitations to model performance in capturing transient effects. These factors may constrain the precise quantification of the absolute contribution of leaf-fall-induced SVF changes, suggesting the need for cautious interpretation of short-term fluctuations in the analysis.
Finally, in terms of overall mechanisms, implications, and future directions, the findings indicate that deciduous tree leaf fall in cold-region urban plazas significantly increases local sky openness during the autumn–winter transition, thereby enhancing solar radiation receipt and improving outdoor thermal comfort. These results provide theoretical support for urban planning and landscape design, suggesting that in cold climates, the strategic placement of deciduous tree species or the adoption of flexible canopy designs could facilitate seasonal optimization of the thermal environment. From a design standpoint, such strategies embody the principle of seasonal complementarity: providing shading in summer while enabling solar access in winter.
Future research could build upon this work by expanding the spatial and temporal scope of data collection and integrating multi-source datasets (e.g., remote sensing, UAV-based thermal mapping, and long-term automatic monitoring) to more comprehensively assess the combined influence of meteorological factors on urban microclimate regulation. Moreover, coupling these observational and modeling approaches with numerical simulations or human-subject thermal perception studies would further advance the quantitative understanding of complex urban thermal environments and strengthen the scientific basis for climate-responsive urban design.
4. Conclusions
Through field measurements conducted during the autumn and winter seasons in Beiyang Plaza at Tianjin University, coupled with multi-model analyses, this study examined the impact of vegetation phenological changes on local microclimatic conditions and outdoor thermal comfort in cold-region urban plazas. The findings demonstrate that the deciduous leaf-fall process significantly increased the Sky View Factor (SVF), thereby enhancing solar radiation reception and improving outdoor thermal comfort during the winter months.
1. Quantification of Leaf-Fall Benefits: Descriptive statistics and preliminary comparative analyses revealed significant differences between the Vegetation-affected and Non-plant-affected groups in key microclimatic indicators. During the leaf-fall period, the Vegetation-affected group exhibited a marked increase in SVF (rising from approximately 0.09 to 0.29), indicating that canopy loss effectively reduced shading and allowed greater solar radiation penetration. Correspondingly, UTCI values showed an improving trend relative to the background temperature decline. Crucially, this phenology-driven improvement raised thermal conditions from “extreme cold stress” closer to the acceptable threshold of 7.7 °C identified for residents in similar cold regions (e.g., Beijing) [31], confirming the positive regulatory role of leaf fall in alleviating cold stress under low-temperature conditions.
2. Validation of Temporal and Causal Mechanisms: Time-series decomposition (STL) further revealed a distinct upward trend in SVF values from late autumn to early winter in areas heavily influenced by vegetation. This confirmed that the leaf-fall process reduced the shading effect of tree canopies and enhanced surface-level solar radiation reception. Furthermore, quantitative analyses using ARIMAX and GAM models demonstrated a statistically significant association between SVF increases due to leaf fall and improvements in UTCI. This relationship remained robust even after controlling for macroclimatic influences, providing strong evidence of the substantial and independent role of vegetation phenological dynamics in modulating local thermal environments. From a methodological perspective, the complementary insights offered by the linear ARIMAX model and the non-linear GAM model enhanced the robustness and credibility of these conclusions.
3. Climate-Responsive Design Strategies: Addressing the need for concrete design guidance in cold regions, this study proposes that landscape architecture should move beyond general greening to adopt a “seasonally adaptive” approach. Based on the quantitative findings, three specific strategies are recommended:
Dynamic Species Selection: Priority should be given to deciduous species with distinct seasonal morphometry—specifically those with high Leaf Area Index (LAI) in summer for cooling but low Branch Area Index (BAI) in winter—to maximize the “winter-warming” effect without compromising summer shading, as highlighted by Song et al. (2025) [32].
Asymmetric Spatial Configuration: Strategies to increase spatial openness should focus on the sun-facing sides of plazas. Consistent with Sun et al. (2024), tall deciduous trees should be concentrated on the Northern boundaries to maximize South-facing solar penetration during the leaf-off period [33].
Creation of Solar Pockets: Landscape elements should be organized to create microclimates that are sheltered from prevailing winter winds but geometrically open to the south, leveraging the increased permeability of deciduous canopies.
4. Limitations and Future Directions: At the data acquisition level, this study is subject to certain limitations regarding measurement point distribution and sampling periods. For instance, the current spatial coverage may not fully capture the microclimatic variability across the entire plaza, and the focus on the transition season precludes a comprehensive full-year assessment. Similarly, while the grouping strategy based on SVF variation was grounded in statistical analysis, the threshold setting involved an element of subjectivity. Future research should integrate multi-source datasets, such as high-dynamic-range (HDR) sky imaging, to dynamically model cloud cover effects and expand the temporal scope to a full annual cycle.
At the methodological level, both ARIMAX and GAM models exhibited some instability in parameter estimation, with localized anomalies remaining unresolved. This suggests that under the complex conditions of urban thermal environments, the robustness and generalizability of existing models require further enhancement. Certain model parameters demonstrated sensitivity to data noise and extreme weather conditions (e.g., sudden cold fronts), which may lead to deviations under varying sampling scenarios. Consequently, these limitations restrict the direct applicability of the models to other urban contexts without local calibration.
Future research should further advance along several key directions:
Data Expansion: Efforts should be made to broaden the spatial scope by incorporating additional urban plazas and datasets from diverse climatic regions to enhance representativeness.
Model Refinement: Future studies could explore deep learning approaches, such as Long Short-Term Memory networks (LSTM), to better capture the nonlinear and spatiotemporal interactions among climatic variables.
Cross-Scale Evaluation: Developing a comprehensive assessment framework that links localized analyses (plaza-level) with broader urban-scale assessments would facilitate the exploration of underlying mechanisms governing thermal environment regulation across scales. Such investigations will strengthen the scientific basis for climate-responsive urban design, ensuring that vegetation strategies effectively balance the conflicting thermal demands of summer and winter.
Author Contributions
Conceptualization, Y.W. and Y.T.; Methodology, Y.W., Y.T. and Y.L.; Software, Y.W.; Validation, Y.W., Y.T. and Y.L.; Formal analysis, Y.W.; Investigation, Y.W., R.C. and T.H.; Resources, Y.T. and R.C.; Data curation, Y.W. and T.H.; Writing—original draft, Y.W.; Writing—review & editing, Y.T., Y.L., R.C. and T.H.; Visualization, Y.W.; Supervision, Y.T.; Project administration, Y.T.; Funding acquisition, Y.T. All authors have read and agreed to the published version of the manuscript.
Funding
This research received no external funding.
Institutional Review Board Statement
This study does not involve human participants or animal experiments.
Data Availability Statement
The data that support the findings of this study are available from the corresponding author upon reasonable request.
Conflicts of Interest
The authors declare that they have no known competing financial interests or personal relationships that could have appeared to influence the work reported in this paper.
References
- Elkhazindar, A.; Kharrufa, S.N.; Arar, M.S. The Effect of Urban Form on the Heat Island Phenomenon and Human Thermal Comfort: A Comparative Study of UAE Residential Sites. Energies 2022, 15, 5471. [Google Scholar] [CrossRef]
- Zheng, G.; Xu, H.; Liu, F.; Lin, X.; Wang, S.; Dong, J. Study Roadmap Selection Based on the Thermal Comfort of Street Trees in Summer: A Case Study from a University Campus in China. Sustainability 2024, 16, 4407. [Google Scholar] [CrossRef]
- Liu, Z.; Xu, W.; Hu, C.; Zhao, C.; Yang, T.; Xi, T.; Wang, Q. Differences in Outdoor Thermal Comfort between Local and Non-Local Tourists in Winter in Tourist Attractions in a City in a Severely Cold Region. Atmosphere 2023, 14, 1306. [Google Scholar] [CrossRef]
- He, X.; Shao, L.; Tang, Y.; Wu, S. Improving children’s outdoor thermal comfort: A field study in China’s severely cold regions. Urban Clim. 2023, 50, 101620. [Google Scholar] [CrossRef]
- Xiong, K.; He, B.-J. Wintertime outdoor thermal sensations and comfort in cold-humid environments of Chongqing China. Sustain. Cities Soc. 2022, 84, 104203. [Google Scholar] [CrossRef]
- Redweik, P.; Catita, C.; Brito, M. Solar Energy Potential on Roofs and Facades in an Urban Landscape. Sol. Energy 2013, 97, 332–341. [Google Scholar] [CrossRef]
- Feng, X.; Wen, H.; He, M.; Xiao, Y. Microclimate effects and influential mechanisms of four urban tree species underneath the canopy in hot and humid areas. Front. Environ. Sci. 2023, 11, 1108002. [Google Scholar]
- Gao, X.; Li, C.; Cai, Y.; Ye, L.; Xiao, L.; Zhou, G.; Zhou, Y. Influence of scale effect of canopy projection on understory microclimate in three subtropical urban broad-leaved forests. Remote Sens. 2021, 13, 3786. [Google Scholar] [CrossRef]
- Aalto, L.; Maeda, E.; Heiskanen, J.; Aalto, E.K.; Pellikka, P. Strong influence of trees outside forest in regulating microclimate of intensively modified Afromontane landscapes. Biogeosciences 2021, 18, 4529–4545. [Google Scholar] [CrossRef]
- Xue, S.; Chao, X.; Wang, K.; Wang, J.; Xu, J.; Liu, M.; Ma, Y. Impact of Canopy Coverage and Morphological Characteristics of Trees in Urban Park on Summer Thermal Comfort Based on Orthogonal Experiment Design. Forests 2023, 14, 2098. [Google Scholar] [CrossRef]
- De Frenne, P.; Lenoir, J.; Luoto, M.; Scheffers, B.R.; Zellweger, F.; Aalto, J.; Ashcroft, M.B.; Christiansen, D.M.; Decocq, G.; De Pauw, K.; et al. Forest microclimates and climate change: Importance, drivers and future research agenda. Glob. Change Biol. 2021, 27, 2279–2297. [Google Scholar] [CrossRef] [PubMed]
- Duan, W.; Jin, A.; Liu, X.; Li, H. Seasonal Variations and Spatial Mechanisms of 2D and 3D Green Indices in the Central Urban Area. Ecol. Indic. 2025, 178, 113828. [Google Scholar] [CrossRef]
- Xu, J.; Jin, Y.; Ling, Y.; Sun, Y.; Wang, Y. Exploring the Seasonal Impacts of Morphological Spatial Pattern of Green Spaces on the Urban Heat Island. Sustain. Cities Soc. 2025, 125, 106352. [Google Scholar] [CrossRef]
- Zellweger, F.; De Frenne, P.; Lenoir, J.; Vangansbeke, P.; Verheyen, K.; Bernhardt-Römermann, M.; Baeten, L.; Héndoux, F.; Syens, M.; Van Loo, M.; et al. Forest microclimate dynamics drive plant responses to warming. Science 2020, 368, 772–775. [Google Scholar] [CrossRef] [PubMed]
- Gong, F.-Y.; Zeng, Z.-C.; Zhang, F.; Li, X.; Ng, E.; Norford, L.K. Mapping Sky, Tree, and Building View Factors of Street Canyons in a High-Density Urban Environment. Build. Environ. 2018, 134, 155–167. [Google Scholar] [CrossRef]
- Shata, R.O.; Mahmoud, A.; Fahmy, M. Correlating the sky view factor with the pedestrian thermal environment in a hot arid university campus plaza. Sustainability 2021, 13, 468. [Google Scholar] [CrossRef]
- Dirksen, M.; Ronda, R.; Theeuwes, N.; Pagani, G. Sky view factor calculations and its application in urban heat island studies. Urban Clim. 2019, 29, 100498. [Google Scholar] [CrossRef]
- Tartarini, F.; Schiavon, S. pythermalcomfort: A Python package for thermal comfort research. SoftwareX 2020, 12, 100578. [Google Scholar] [CrossRef]
- Wang, B.; Yi, Y. Developing an adapted UTCI (Universal Thermal Climate Index) for the elderly population in China’s severe cold climate region. Sustain. Cities Soc. 2021, 69, 102813. [Google Scholar] [CrossRef]
- Zhao, H.; Shi, J.; Qi, X.; Wang, X.; Jia, J. Pyramid Scene Parsing Network. In Proceedings of the 2017 IEEE Conference on Computer Vision and Pattern Recognition (CVPR), Honolulu, HI, USA, 21–26 July 2017; pp. 2881–2890. [Google Scholar]
- Yi, P.; Liu, L.; Huang, Y.; Zhang, M.; Liu, H.; Bedra, K.B. Study on the coupling relationship between thermal comfort and urban center spatial morphology in summer. Sustainability 2023, 15, 5084. [Google Scholar] [CrossRef]
- Zheng, B.; Li, J. Evaluating the annual effect of the sky view factor on the indoor thermal environment of residential buildings by Envi-met. Buildings 2022, 12, 787. [Google Scholar] [CrossRef]
- Chen, Q.; Cheng, Q.; Chen, Y.; Li, K.; Wang, D.; Cao, S. The influence of sky view factor on daytime and nighttime urban land surface temperature in different spatial-temporal scales. Remote Sens. 2021, 13, 4117. [Google Scholar] [CrossRef]
- Li, G.; Ren, Z.; Zhan, C. Sky view factor-based correlation of landscape morphology and the thermal environment of street canyons. Build. Environ. 2020, 169, 106587. [Google Scholar] [CrossRef]
- Wang, L.; Hou, C.; Zhang, Y.; He, J. Measuring solar radiation and spatio-temporal distribution in different street network direction through solar trajectories and street view images. Int. J. Appl. Earth Obs. Geoinf. 2024, 132, 104058. [Google Scholar] [CrossRef]
- Krake, T.; Klötzl, D.; Hägele, D.; Weiskopf, D. Uncertainty-aware seasonal-trend decomposition based on Loess. IEEE Trans. Vis. Comput. Graph. 2025, 31, 1496–1512. [Google Scholar] [CrossRef]
- Mehmood, M.S.; Zafar, Z.; Sajjad, M.; Hussain, S.; Zhai, S.; Qin, Y. Time series analyses and forecasting of surface urban heat island intensity using ARIMA model in Punjab, Pakistan. Land 2022, 12, 142. [Google Scholar] [CrossRef]
- Gangwisch, M.; Ludwig, S.; Matzarakis, A. Modeling the normalized urban heat island for the city of Karlsruhe by linking urban morphology and green infrastructure. Atmosphere 2024, 15, 125. [Google Scholar] [CrossRef]
- Hjort, J.; Suomi, J.; Käyhkö, J. Extreme urban-rural temperatures in the coastal city of Turku, Finland: Quantification and visualization based on a generalized additive model. Sci. Total Environ. 2016, 569, 507–517. [Google Scholar] [CrossRef]
- Ravindra, K.; Rattan, P.; Mor, S.; Aggarwal, A.N. Generalized additive models: Building evidence of air pollution, climate change and human health. Environ. Int. 2019, 132, 104987. [Google Scholar] [CrossRef]
- Lai, D.; Guo, D.; Hou, Y.; Lin, C.; Chen, Q. Studies of outdoor thermal comfort in northern China. Build. Environ. 2014, 77, 110–118. [Google Scholar] [CrossRef]
- Song, L.; Tang, Z.; Zhang, X.; Wang, Z.; Hong, B. Assessing Effects of Seasonal Variations in 3D Canopy Structure Characteristics on Thermal Comfort in Urban Parks. Urban For. Urban Green. 2025, 112, 128901. [Google Scholar] [CrossRef]
- Sun, L.; Xie, C.; Qin, Y.; Zhou, R.; Wu, H.; Che, S. Study on Temperature Regulation Function of Green Spaces at Community Scale in High-Density Urban Areas and Planning Design Strategies. Urban For. Urban Green. 2024, 101, 128511. [Google Scholar] [CrossRef]
Disclaimer/Publisher’s Note: The statements, opinions and data contained in all publications are solely those of the individual author(s) and contributor(s) and not of MDPI and/or the editor(s). MDPI and/or the editor(s) disclaim responsibility for any injury to people or property resulting from any ideas, methods, instructions or products referred to in the content. |
© 2025 by the authors. Licensee MDPI, Basel, Switzerland. This article is an open access article distributed under the terms and conditions of the Creative Commons Attribution (CC BY) license.