Article

Study on Creep Compression Characteristics of Pressure-Bearing Graded Crushed Rock

1
School of Safety Science and Engineering, Xi’an University of Science and Technology, Xi’an 710054, China
2
College of Energy and Chemical Engineering, Shaanxi Energy Institute, Xianyang 712000, China
3
Department of Mechanical Engineering, College of Engineering, Shantou University, Shantou 515063, China
*
Author to whom correspondence should be addressed.
Buildings 2026, 16(1), 116; https://doi.org/10.3390/buildings16010116
Submission received: 2 December 2025 / Revised: 23 December 2025 / Accepted: 24 December 2025 / Published: 26 December 2025
(This article belongs to the Special Issue Advanced Research on Cementitious Composites for Construction)

Abstract

To study the creep compression characteristics and evolution mechanism of pressure-bearing graded crushed rock under constant load. Creep compression tests of crushed rock were conducted using the self-developed confined compression test system under different Talbot indexes and axial stresses. The axial displacement, void ratio, mass distribution, fractal dimension, and fragmentation of crushed rock during creep compression were analyzed. And the void ratio-fractal dimension model of crushed rock under pressure was established. The results reveal three-stage characteristics in axial displacement and void change, which correspond to rapid, attenuation, and stable change processes. The axial displacement and fragmentation amount are positively correlated with the axial stress and Talbot index, while the porosity is negatively correlated with them. The fractal dimension shows a positive correlation with axial stress and a negative correlation with the Talbot index. Additionally, a theoretical model was established to characterize the dynamic correlation between void ratio and fractal dimension during compression process, and its accuracy was verified, with a maximum error of only 0.0819. The research findings can provide insights for stability prediction and deformation control of crushed rock in engineering applications such as building foundation pits, ground treatment, and coal mine goafs.

1. Introduction

The durability and stability of engineering materials under different environmental conditions are crucial for engineering applications [1,2,3]. Crushed rock is a crucial engineering material used in various projects, including backfilling of building foundation pits, constructing transportation subgrades, and treating goafs [4,5]. In practice, crushed rock is often subjected to sustained loading from overlying structures, exhibiting significant time-dependent deformation characteristics that can affect the safety and stability of engineering structures. Therefore, an in-depth study of the creep deformation characteristics of crushed rock under constant sustained loading is crucial for accurately assessing the long-term stability of engineering projects, preventing delayed disasters, and ensuring engineering safety.
In recent years, scholars have conducted extensive research on the compression deformation and fragmentation characteristics of crushed rock. Ma [6,7] and Zhang et al. [8] carried out mechanical tests on crushed rock under cyclic loading and unloading conditions, investigating the variations in compression modulus, void ratio, and energy density under the influence of Talbot index and axial stress. Feng [9,10], Li [11,12], and Fan et al. [13] performed compression tests on crushed rock with different particle size ranges. They analyzed the deformation and fragmentation characteristics of rocks with varying particle sizes and revealed the fragmentation mechanisms of crushed rock. Hu [14], Yadav [15], Zhang [16], and Yuan et al. [17] employed numerical simulations to analyze the stress transmission process and fragmentation characteristics of crushed rock from a microscopic perspective, elucidating the compression and fragmentation process. Wang et al. [18] used CT scanning technology to explore the intrinsic relationship between microscopic-scale behavior and macroscopic response of crushed rock blocks under uniaxial compression, revealing their progressive failure process. Zhang [19], Zhou [20], Zhang [21], and Li et al. [22] investigated the compression deformation and energy dissipation characteristics of crushed rock under the influence of particle size, lithology, and overlying load. Li [23], Zhang [24], and Tian et al. [25,26] conducted pressure-bearing characteristic tests on crushed rock under different Talbot indices, analyzed the pressure-bearing behavior and mass variation characteristics of rock particles before and after compression, and clarified the fractal characteristics of crushed rock influenced by the Talbot index. The void structure of crushed rock directly affects the overall stability of engineering projects. Xu [27], Zhang [28], and Ma et al. [29,30] measured the evolution of the void structure in crushed rock with different particle size ranges under varying axial displacements. Li [31] and Li et al. [32,33] studied the compression characteristics of crushed rock considering time effects, deriving the influence of axial stress, creep time, and moisture content on the creep deformation parameters of crushed rock.
In summary, the existing research results mostly focus on the compression deformation characteristics of crushed rock under instantaneous loading conditions. However, there are relatively few studies on the creep mechanical properties of crushed rock under constant load, which is more prevalent in engineering. Based on this, this paper takes the crushed rock with different Talbot indexes as the research object, and carries out the creep compression test of broken rock through the confined compression device of crushed rock. The influence of axial stress and Talbot index on the axial displacement, porosity, fractal dimension and the variation law of fragmentation amount in the creep compression process of crushed rock is analyzed, and the theoretical model of porosity-fractal dimension of crushed rock is established. The research results have certain significance for predicting the long-term stability of related projects and preventing and controlling hysteresis disasters.

2. Experimental Methodology

2.1. Experimental Setup

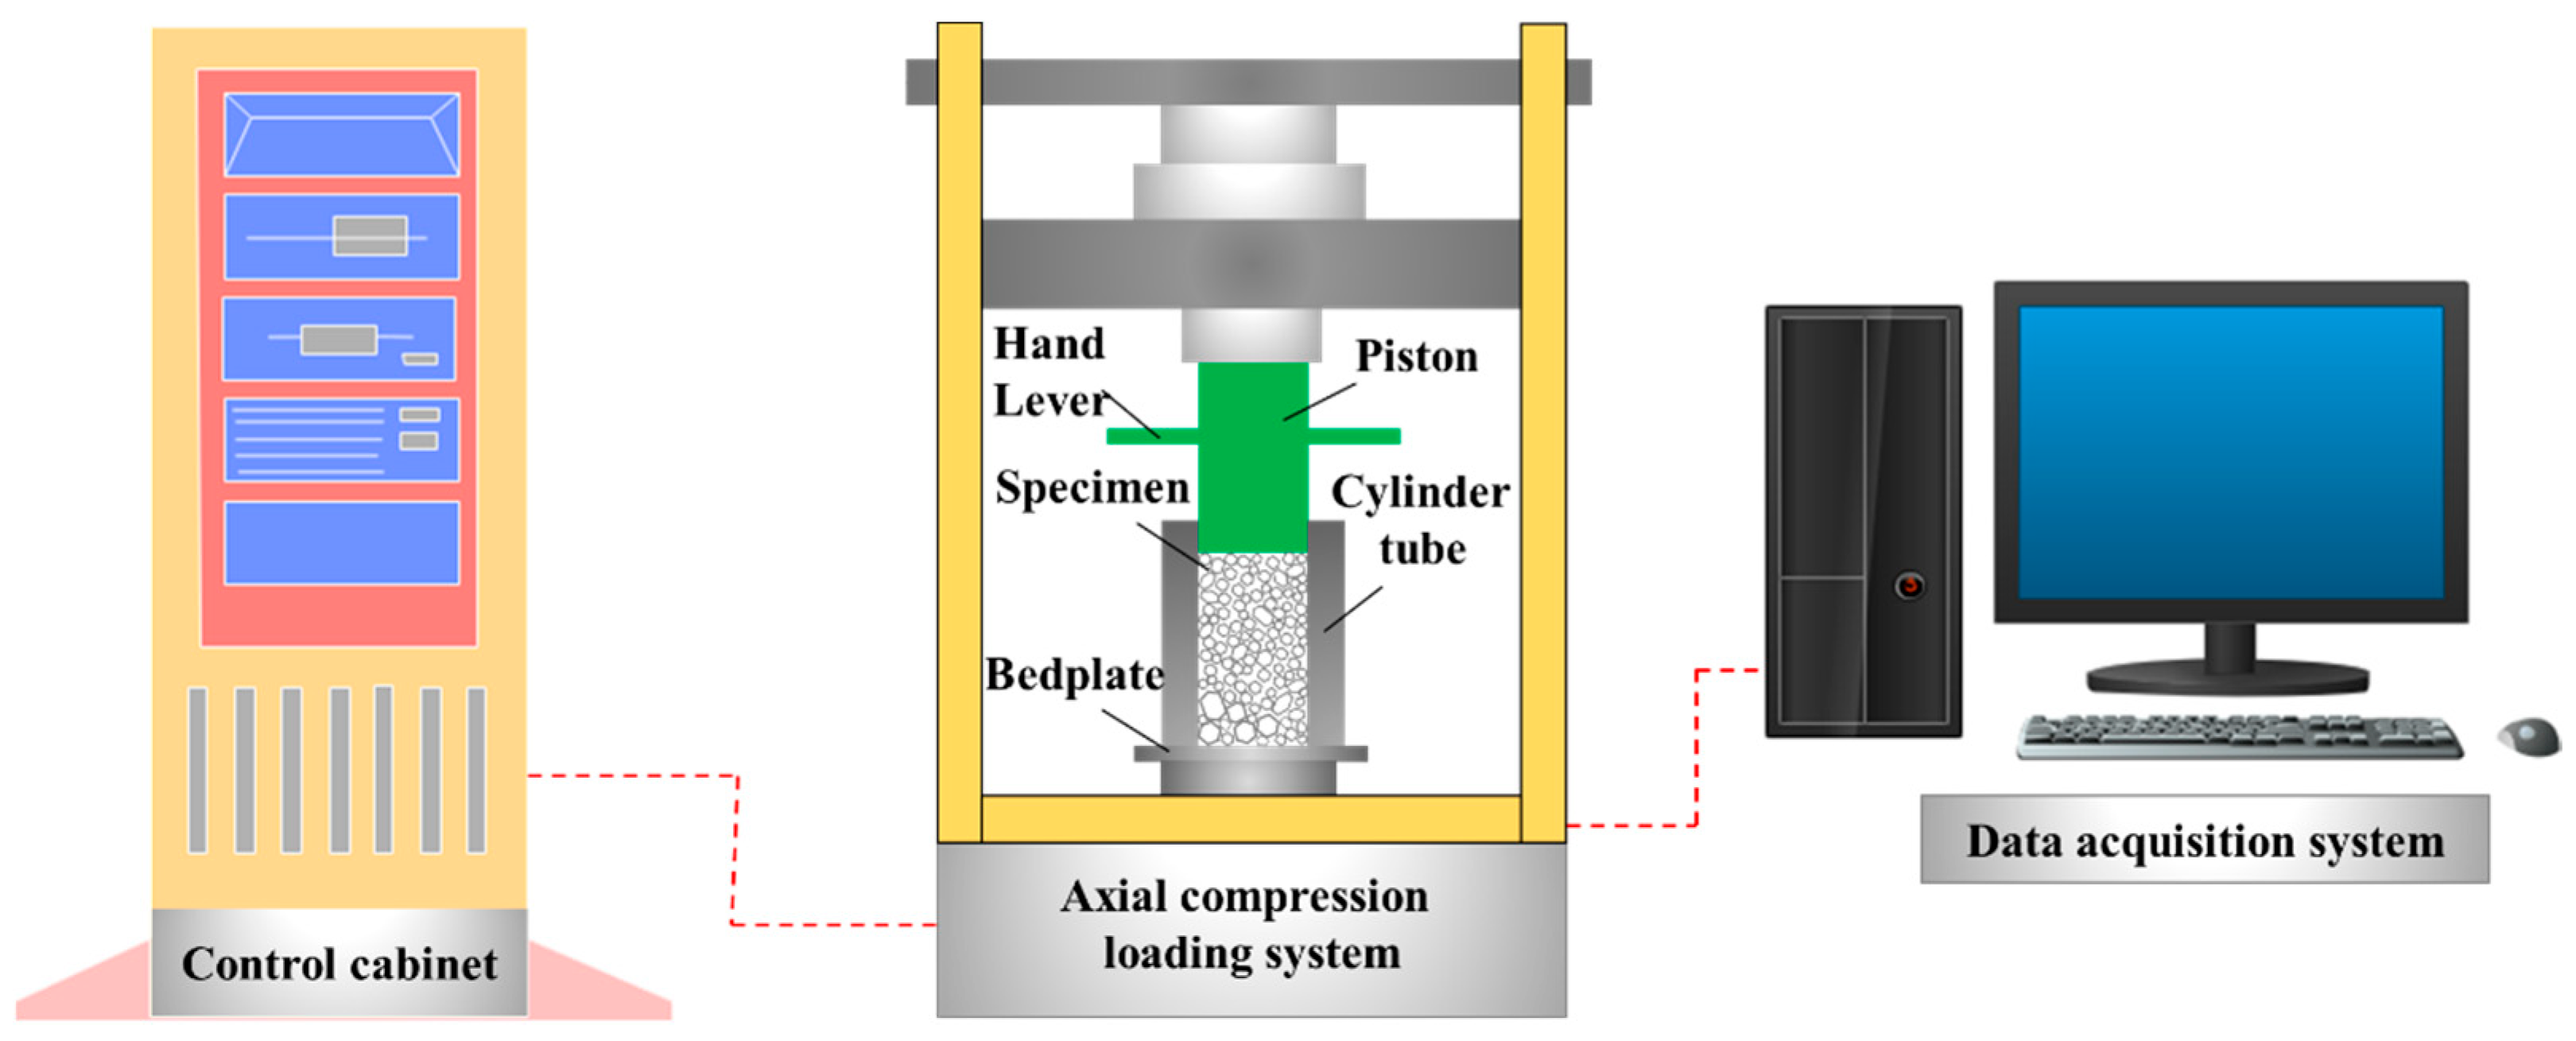
The experimental system, illustrated in Figure 1, primarily consists of a deep coal-rock dynamic disaster multi-field coupling test system, a confined compression device for crushed rocks, a computer-based data acquisition system, a sieving device, and an electronic balance. The confined compression device for crushed rocks comprises a compression cylinder, a piston, a handwheel, and a base, with the cylinder having internal dimensions of φ 100 mm × L 200 mm. The deep coal-rock dynamic disaster multi-field coupling test system provides the axial loading for the compression device, with a maximum capacity of 2000 kN. The computer-based data acquisition system controls the multi-field coupling test system and records all necessary experimental data in real-time. The sieving device and electronic balance are utilized for sieving the specimens into different particle size ranges and recording their mass before and after testing.

2.2. Sample Preparation

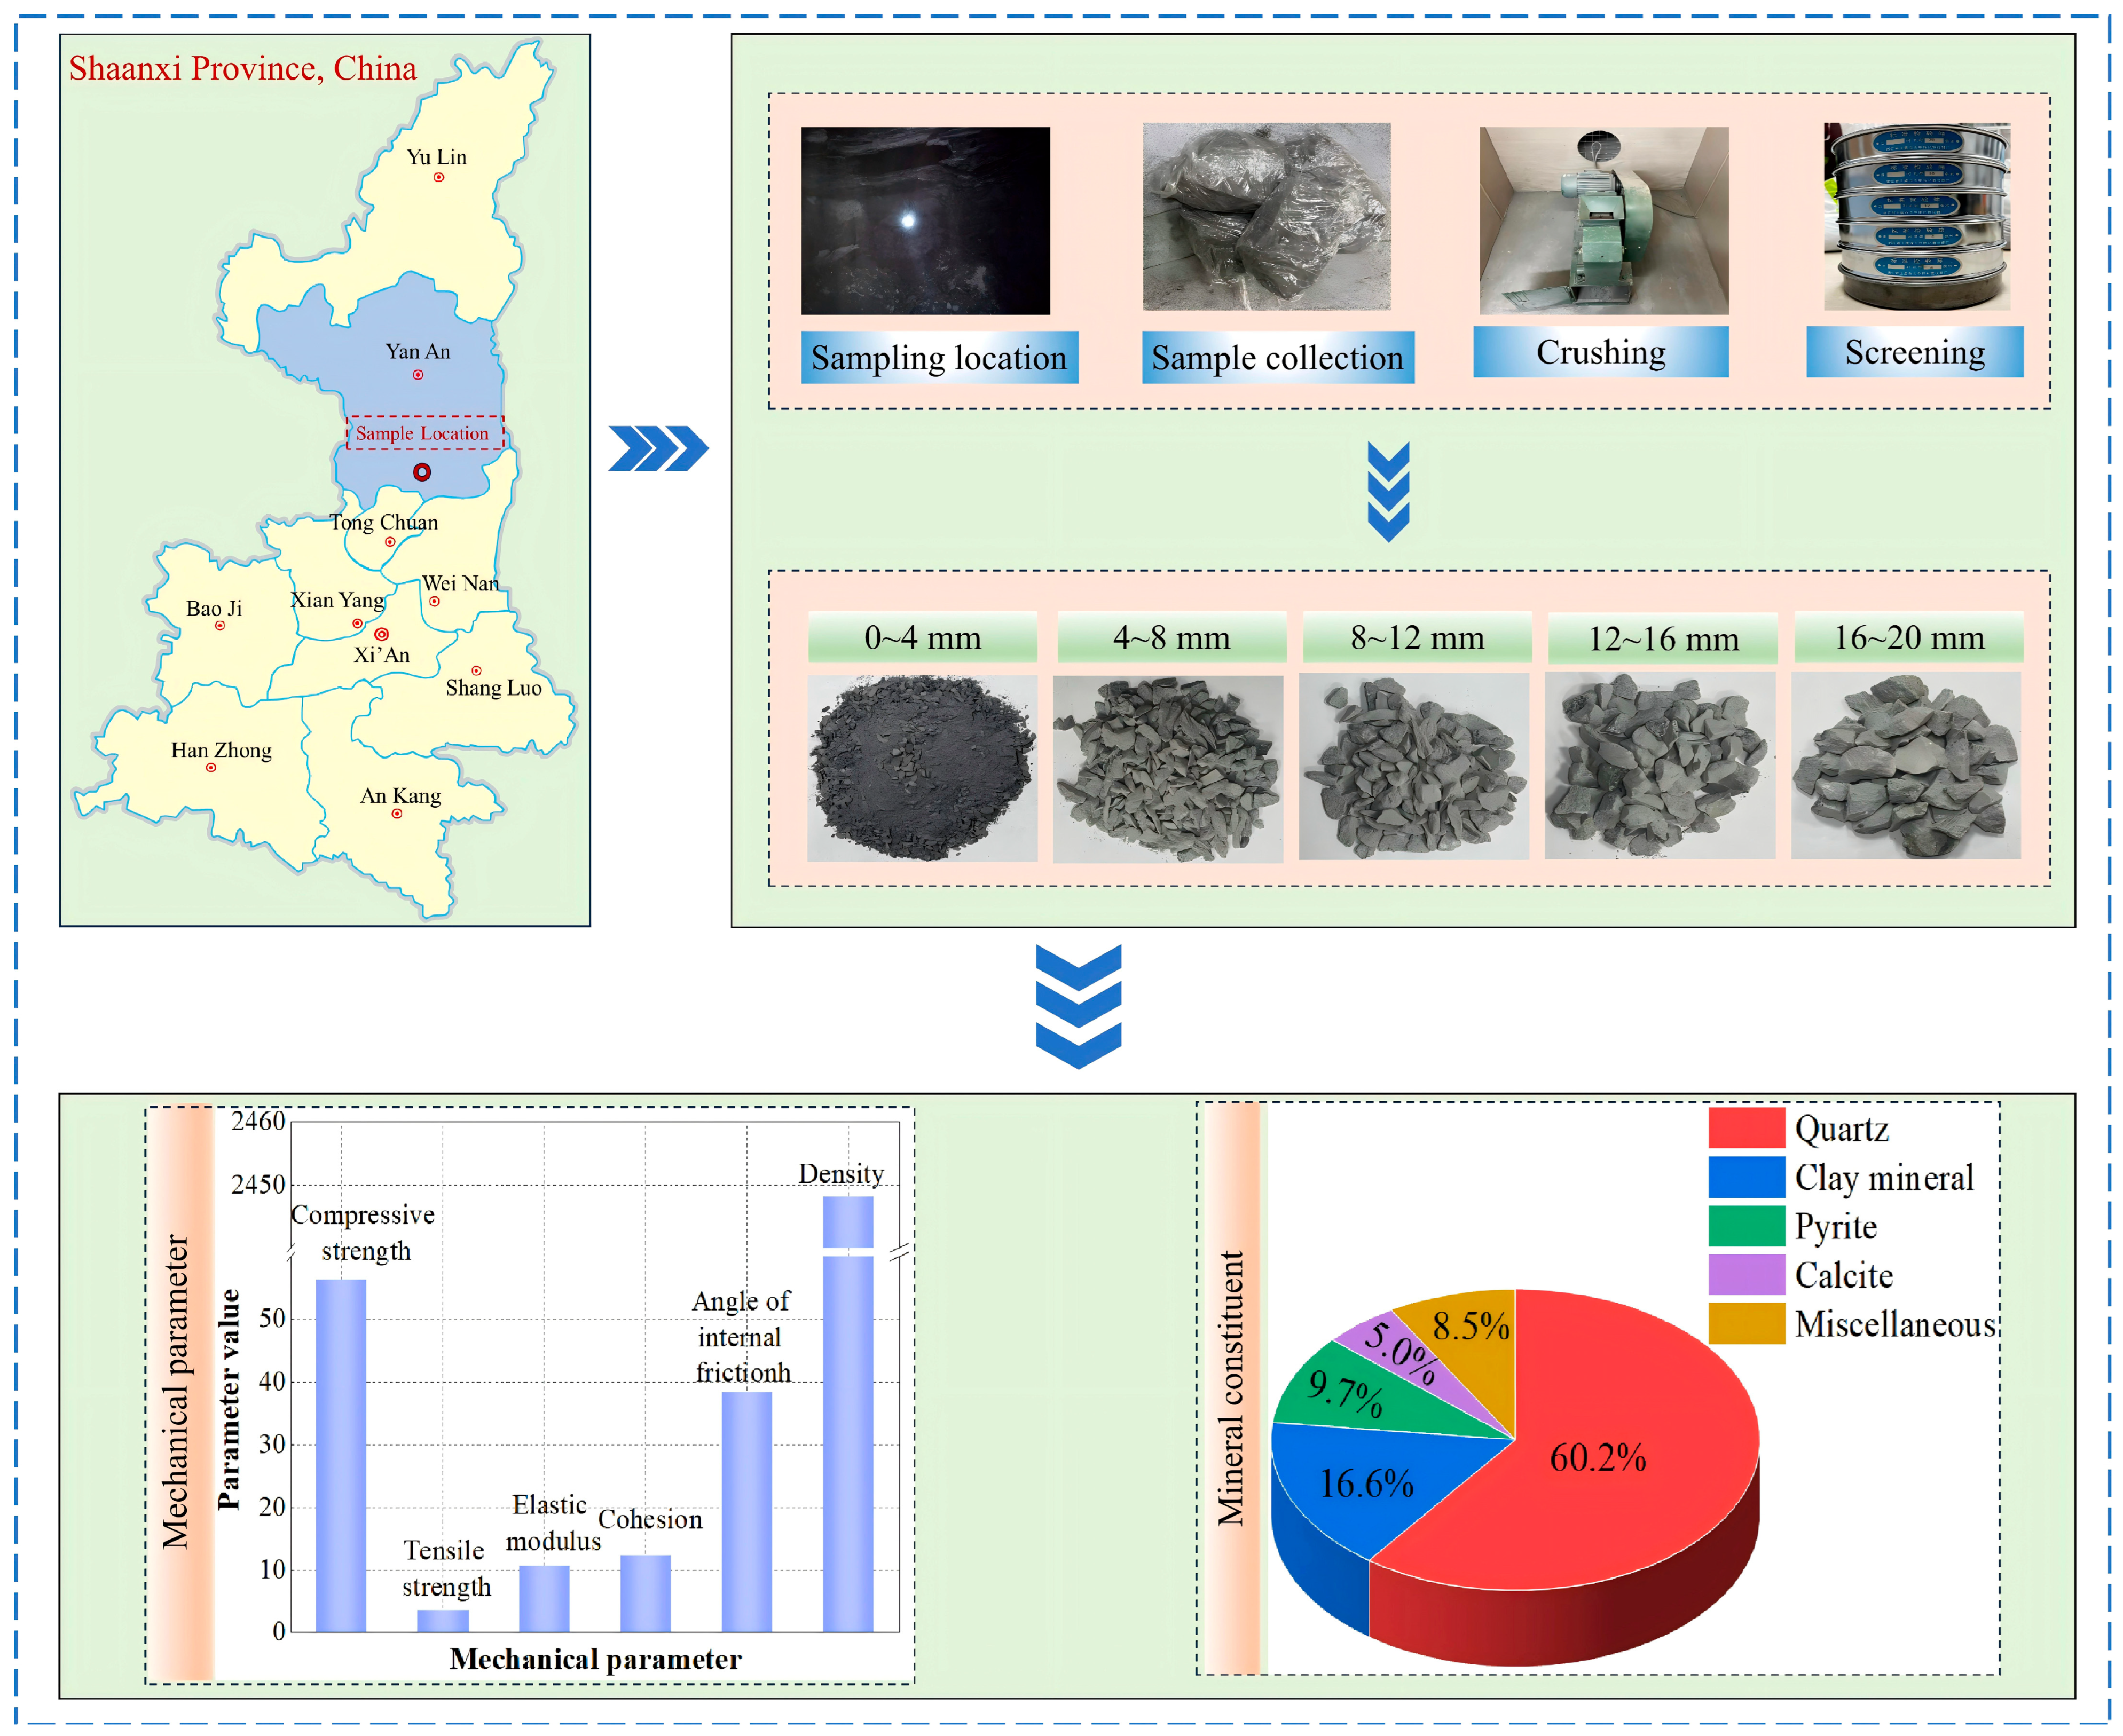
The test samples were collected from a site in Huangling, Shaanxi Province. Prior to testing, basic mechanical parameters and the mass fractions of major mineral components of the rock were obtained through mechanical tests and X-ray diffraction analysis. In line with practical engineering conditions, the collected large rock blocks were crushed before the experiment. The crushed material was then sieved into five particle size ranges: 0~4 mm, 4~8 mm, 8~12 mm, 12~16 mm, and 16~20 mm. The sample preparation process is illustrated in Figure 2. In actual engineering, fill bodies consist of crushed rock particles of various sizes with a random distribution, making it difficult to fully and accurately monitor the particle size distribution on-site. Therefore, the samples used in this test were mixtures of rocks from the different size ranges mentioned above, with the mass fraction of each range proportioned according to the Talbot formula [25].
M d M t = ( d D ) n × 100 %
where d is particle size of the sample (mm); D is maximum particle size, (mm); Md is mass of the sample with a particle size less than or equal to d (g); Mt is total mass of the sample, (g); and n is Talbot index.
Based on the volume of the cylinder, the mass of each sample was set at 2.2 kg. Accordingly, Table 1 presents the mass percentage of each particle size range for different Talbot indexes. It can be observed that as the Talbot index n increases, the proportion of large particles progressively increases, while that of small particles decreases, resulting in a less steep gradient in the mass distribution across the different size ranges.

2.3. Experimental Program

This study employed a graded loading approach to investigate the effects of the Talbot index and axial stress on the void structure evolution and fractal characteristics of crushed rocks. The axial stress was increased incrementally by 2 MPa per stage. Axial stress levels of 2, 4, 6, 8, and 10 MPa; Talbot indexes of 0.2, 0.4, 0.6, and 0.8; and a creep duration of 4 h at each stress level, as detailed in Table 2. To ensure reliability, each test condition was repeated three times, and the average result was used for analysis.
The experimental procedure began with system setup and calibration. To minimize friction-induced errors, lubricant was applied to the inner wall of the cylinder and the piston surface. The prepared mixture of particles was then poured into the cylinder and sealed, after which the initial height (h0) was recorded. The cylinder was positioned on the test platform, and the loading head was adjusted to ensure proper alignment and contact. A preload of 1.5 kN was applied to stabilize the specimen. The axial stress was subsequently increased to the target level at a rate of 0.05 MPa/s and maintained constant for the 4 h creep period. After creep completion, the stress was raised to the next level. Upon concluding all stress stages, the test data were saved, and the specimen was sieved to determine the mass distribution across particle size ranges. This procedure was repeated for all specimens until the entire test matrix was completed.

3. Results and Analysis

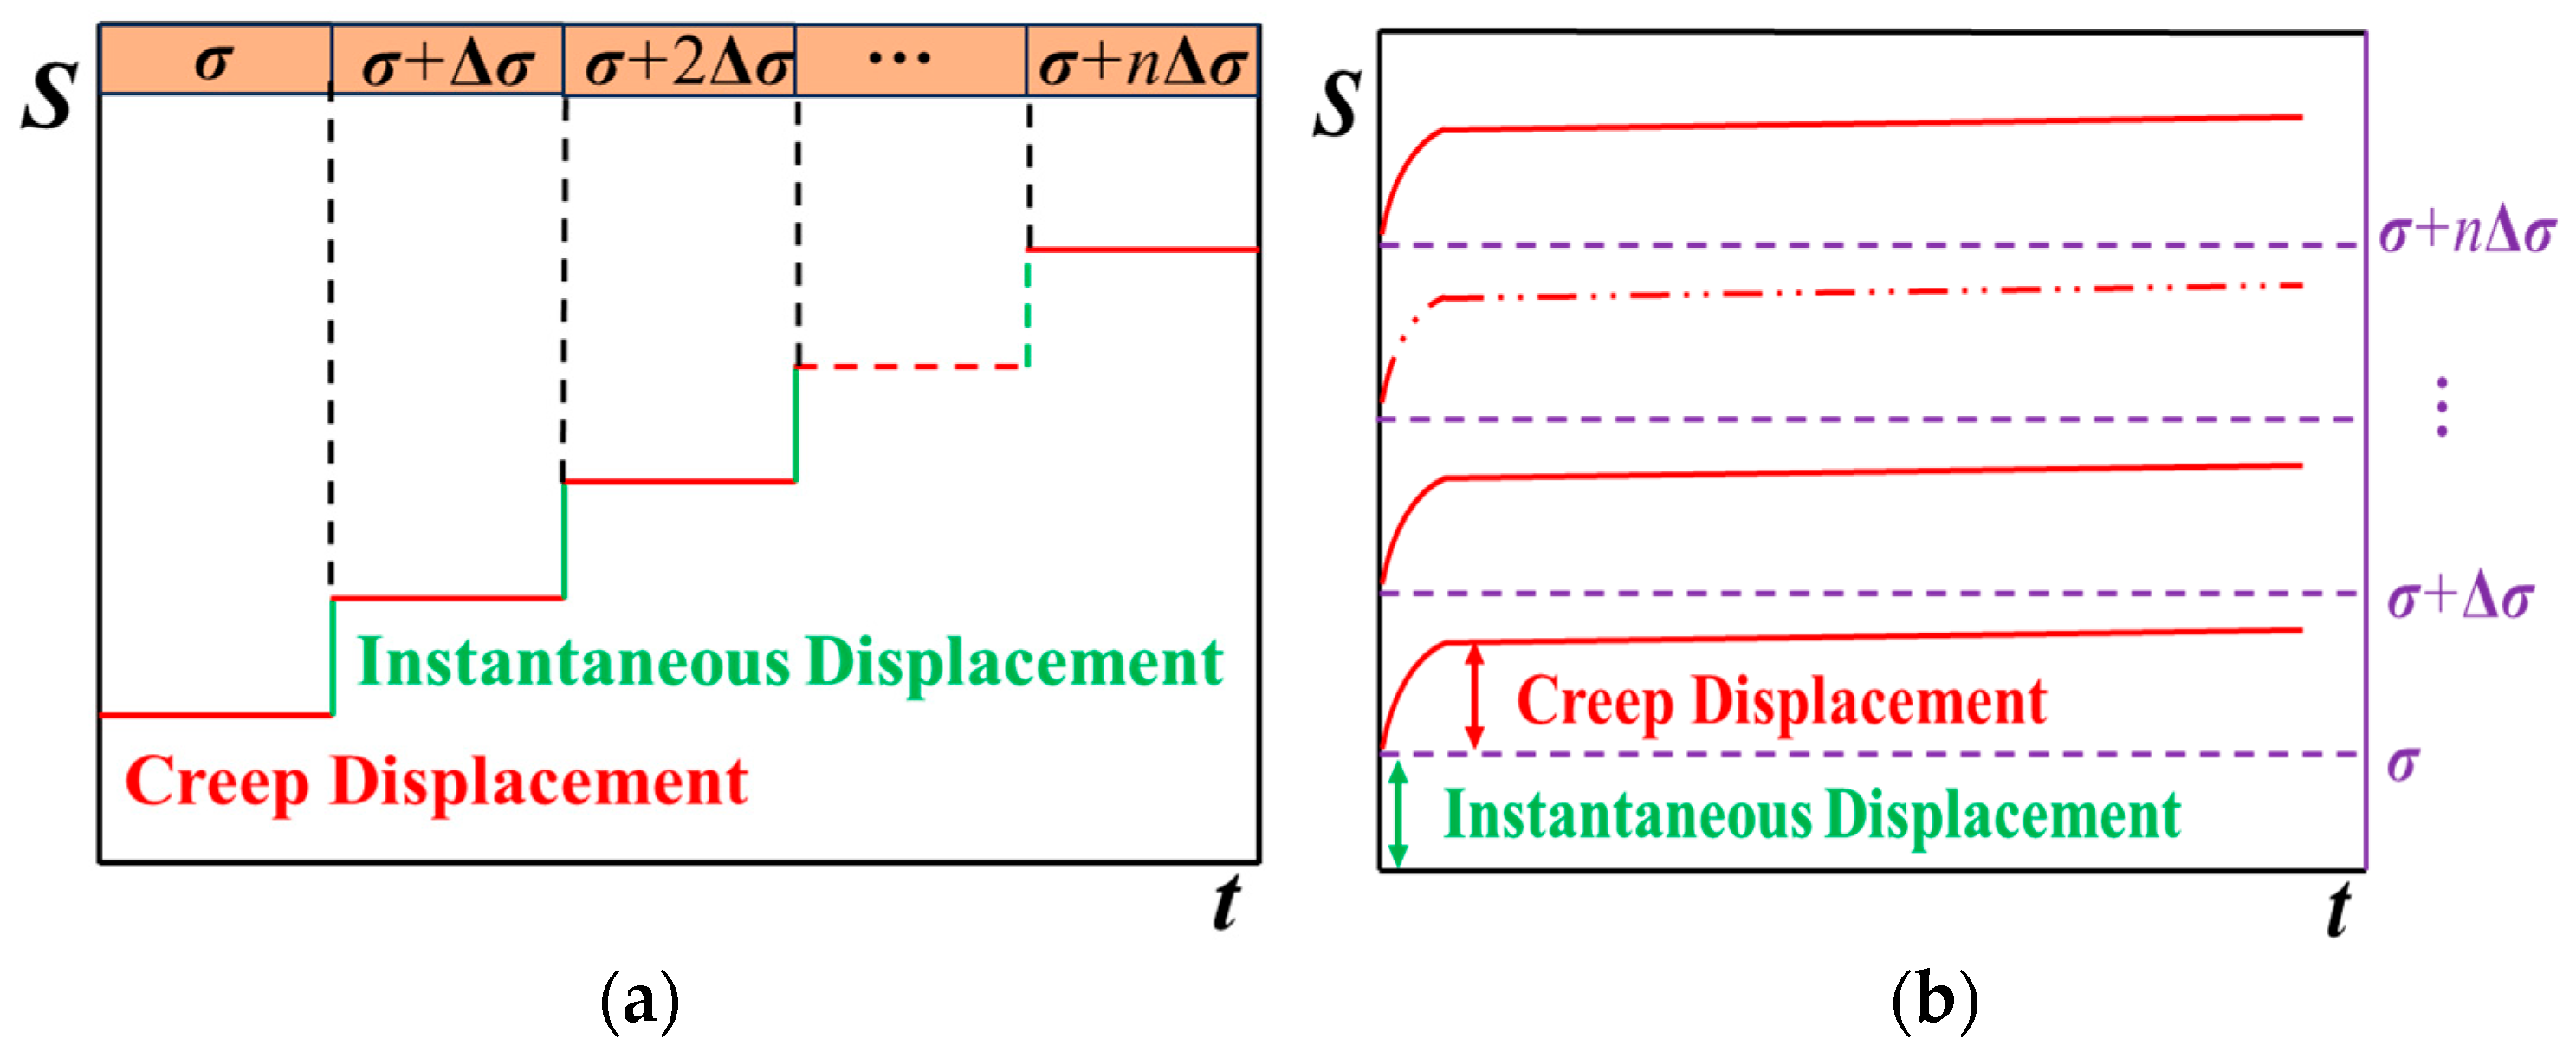
The creep compression process of crushed rocks differs from that of intact rock specimens. Under laterally confined conditions, the deformation occurs predominantly in the axial direction. Throughout the creep process, the sample exhibits only the decelerating and steady-state creep stages, without progressing into the accelerating creep stage. To clearly characterize the parameter variations during each stage of compression, the experimental data were processed using Chen’s loading method according to the graded loading scheme [34]. The resulting creep compression curves of the crushed rock specimens under each stress level are presented in Figure 3.

3.1. Creep Deformation Characteristics

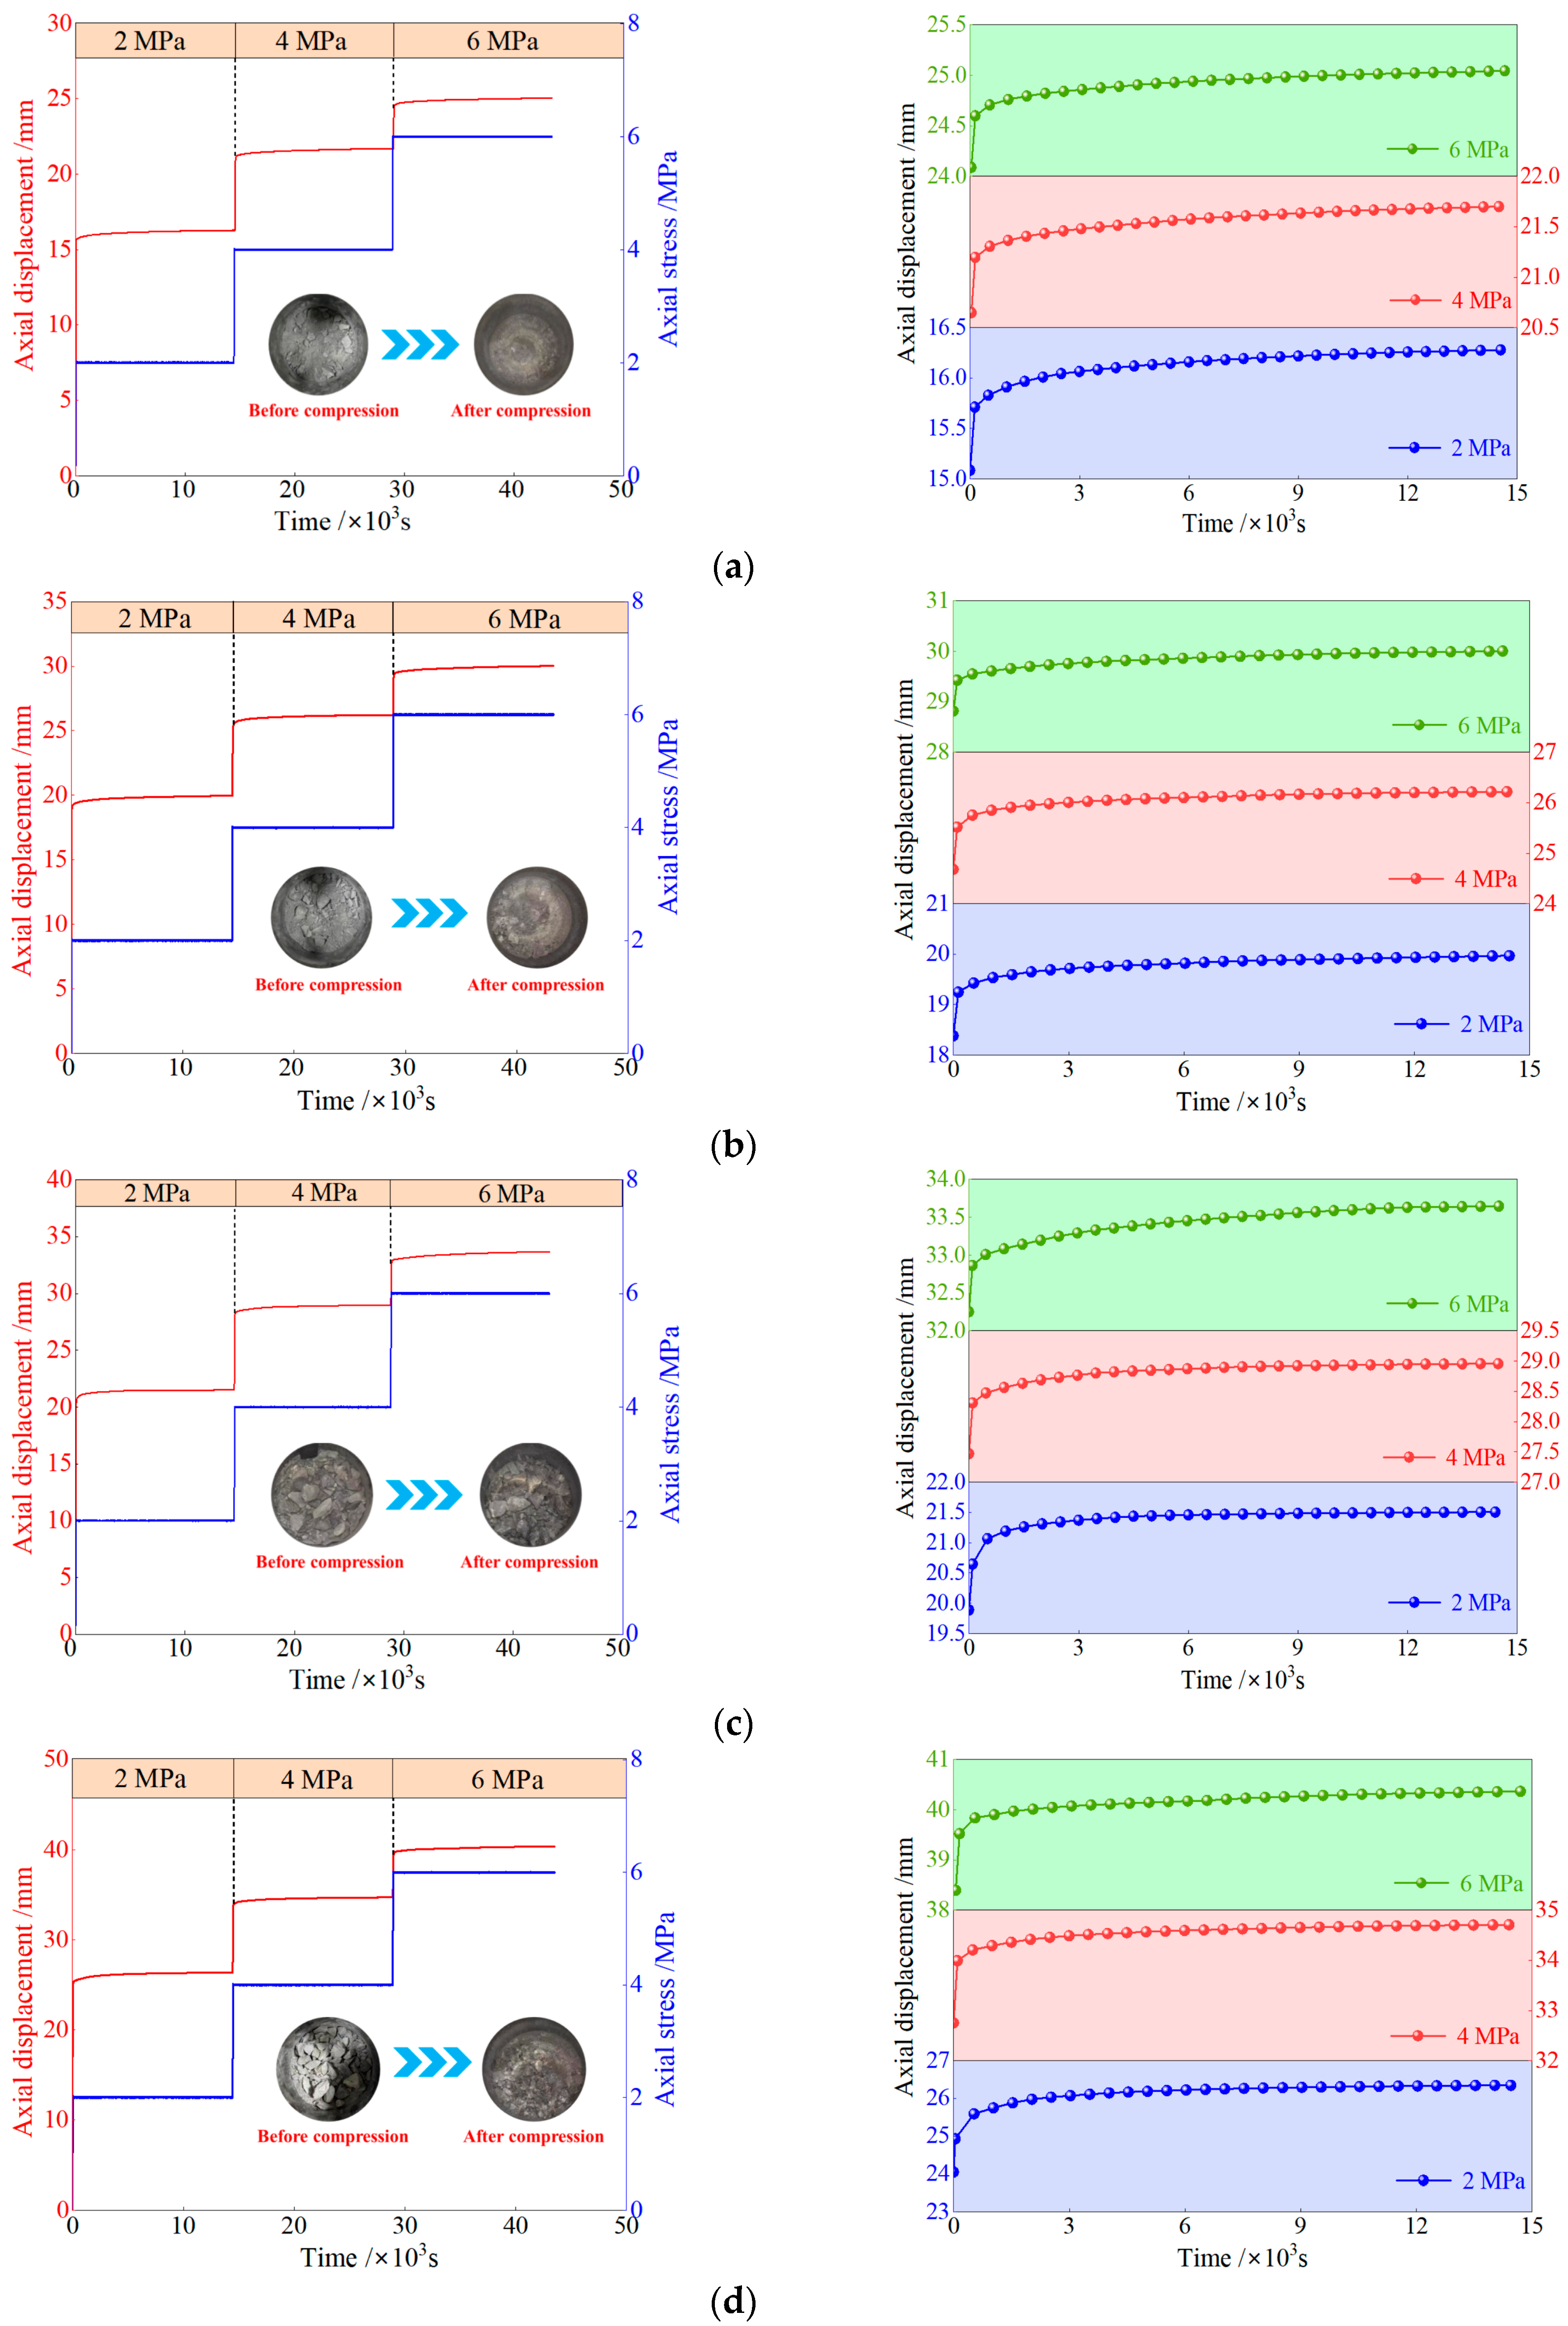
Figure 4 illustrates the axial displacement versus time curves for crushed rocks with different Talbot indexes. Under each applied stress level, the creep compression curves consistently exhibit three distinct stages: rapid instantaneous deformation, decelerating creep, and steady-state creep. During the rapid instantaneous deformation stage, the specimen displacement increases rapidly with the applied axial stress. In the decelerating creep stage, the rate of displacement gradually decreases over time. Finally, in the steady-state creep stage, the displacement progressively stabilizes with time. For a given Talbot index, the axial displacement shows a positive correlation with the axial stress; specifically, a higher stress results in greater displacement. Conversely, under a constant axial stress, the axial displacement increases with the Talbot index. The increments of both instantaneous displacement and creep displacement for crushed rocks with different Talbot indexes at each stress level are summarized in Table 3.
As can be seen from Table 3, both the instantaneous displacement and the creep displacement of crushed rocks with different Talbot indexes increase with rising axial stress levels. However, the rate of this increase gradually diminishes. Taking n = 0.4 as an example, when the axial stress increased from the initial unloaded state to 2, 4, and 6 MPa, the corresponding increments in instantaneous displacement were 18.38, 4.68, and 2.59 mm, respectively, while the creep displacement increments were 1.62, 1.54, and 1.19 mm, respectively. Compared to the values at 2 MPa, the cumulative instantaneous displacement increased by factors of 1.25 and 1.41, and the cumulative creep displacement increased by factors of 1.93 and 2.69, respectively. Under the same axial stress, a larger Talbot index results in greater instantaneous and creep displacements. For instance, at σ = 6 MPa, with Talbot indexes of 0.2, 0.4, 0.6, and 0.8, the instantaneous displacements were 2.39, 2.59, 3.29, and 3.78 mm, respectively, and the creep displacements were 0.96, 1.19, 1.40, and 1.88 mm, respectively. Relative to the values at n = 0.2, the instantaneous displacement increased by factors of approximately 1.08, 1.38, and 1.58, and the creep displacement increased by factors of about 1.24, 1.46, and 1.96, respectively.
The underlying mechanism for this behavior can be explained as follows. In the initial uncompacted state, the crushed rock specimen is loosely packed with significant interparticle voids. The particles exhibit irregular shapes with sharp edges and corners, and the interparticle friction is relatively low. Consequently, the overall resistance to compression is weak, and the stability is poor. This explains why both the instantaneous and creep displacements are substantial at the initial stress level, accounting for approximately 69.04~71.77% and 37.19~38.72% of their final cumulative values, respectively. As the creep process continues, the particles undergo rearrangement, sliding, and compaction, which reduces the void space. This leads to enhanced specimen stability and a consequent gradual reduction in the rate of creep displacement accumulation. When the stress is increased to the next level, the instantaneous displacement increases further. However, due to the densification and stability improvement achieved during the previous loading and creep stages, the increase in both instantaneous and creep displacements becomes smaller compared to that at the initial stress level. With subsequent loading and creep cycles, the crushed rock particles experience grinding, fragmentation, and breakage. Their sharp edges are worn down, leading to a more rounded or elliptical shape. This process further densifies the specimen by reducing internal voids, thereby significantly enhancing its load-bearing capacity. As a result, the increments of both instantaneous and creep displacement are further reduced, and the time required for the specimen to reach the steady-state creep stage in each subsequent step is progressively shortened.
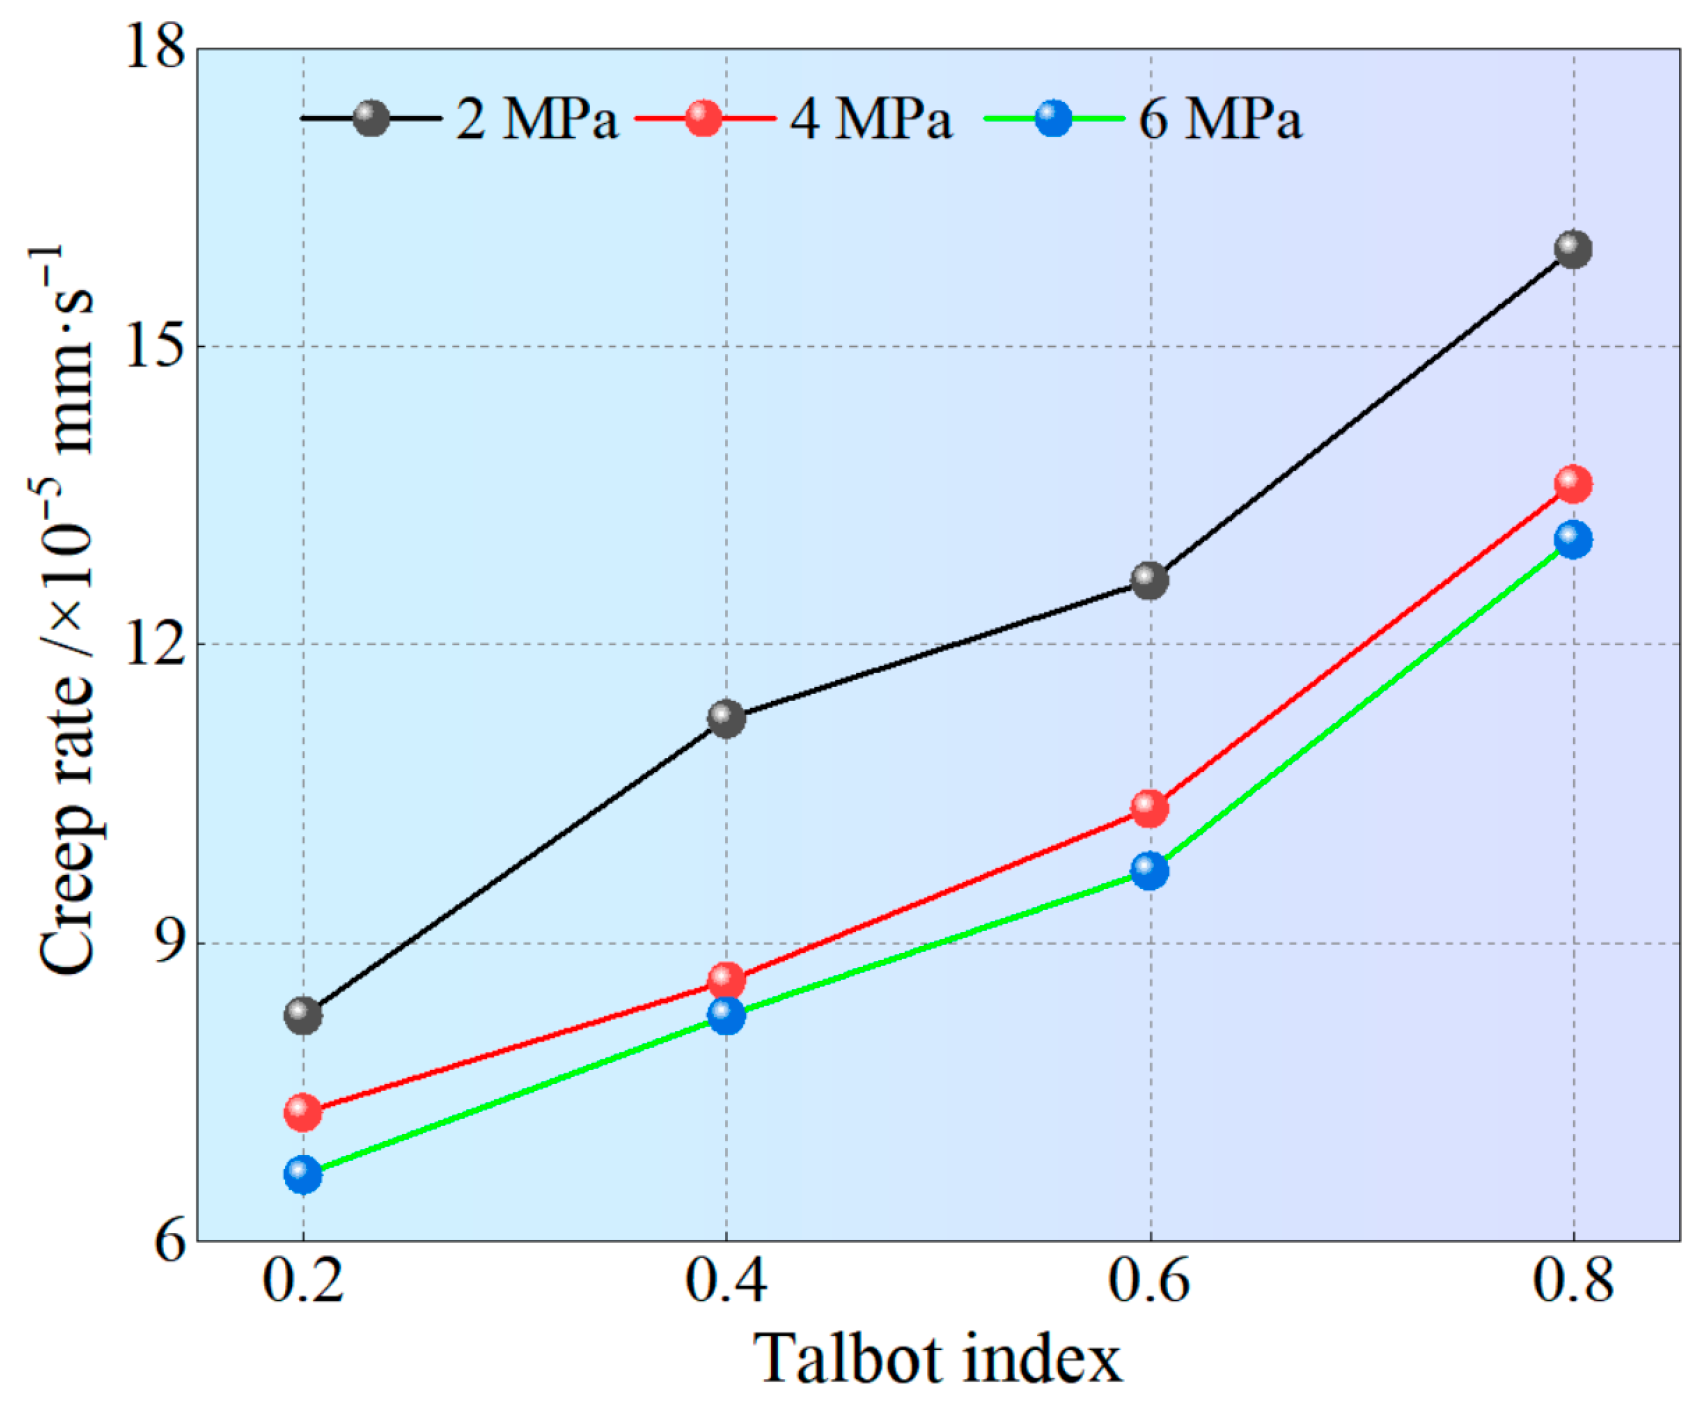
Figure 5 illustrates the variation characteristics in creep rate of crushed rock influenced by different Talbot indexes and axial stresses. It shows that, under consistent axial stress conditions, the creep rate of these samples increases with the increase in Talbot index. Taking σ = 6 MPa as an example, when the Talbot index n = 0.2, 0.4, 0.6, and 0.8, the creep rate of the sample is 6.67 × 10⁻⁵, 8.26 × 10⁻⁵, 9.72 × 10⁻⁵, and 13.06 × 10⁻⁵ mm/s, respectively. The creep rate of the sample is 1.24, 1.46, and 1.96 times higher than that of n = 0.2. This is because the smaller the Talbot index is, the greater the proportion of small rock in the sample. This results in smaller voids formed by the hinge between the rock structures in the sample, and the more evenly the stress is distributed across a large number of contact points under the stress state. The closely packed rock particles enhance deformation resistance, resulting in a lower creep rate. Under the same Talbot index, the creep rate of broken rock decreases as the level of axial loading stress increases. Taking n = 0.6 as an example, the creep rates of the specimens are 12.64 × 10⁻⁵, 10.35 × 10⁻⁵, and 9.72 × 10⁻⁵ mm/s for the initial unpressurized state to the axial stress of 2, 4, and 6 MPa, respectively. The creep rates of the samples are 81.88% and 76.90% when σ = 2 MPa. This is because with the increase in axial stress, the void ratio within the sample decreases, leading to a continuous reduction in compressible space. The meshing ability between rock particles increases, contributing to the overall stability of the specimen’s structure and significantly increasing its bearing capacity. This exhibits clear hardening characteristics, which in turn causes a decrease in the creep rate of the sample.

3.2. Evolution Characteristics of Void Structure

The voids formed by rock-to-rock contact can reflect the stability of the overall fill structure. Compared with intact rock, crushed rock exhibits a larger void structure and lower bearing capacity. Consequently, the void ratio serves as a key parameter for characterizing both the bearing capacity and the compaction density of crushed rock. A lower void ratio indicates a more stable structure and greater resistance to compression. The void ratio is calculated using Equation (2):
φ = 1 m ρ A ( h 0 S )
where φ is the void ratio; m is the mass of the specimen in the cylinder (kg); h0 is the initial height of the specimen (m); ρ is the density of the specimen (kg/m3); S is the axial displacement (m); A is the cross-sectional area of the cylinder (m2).
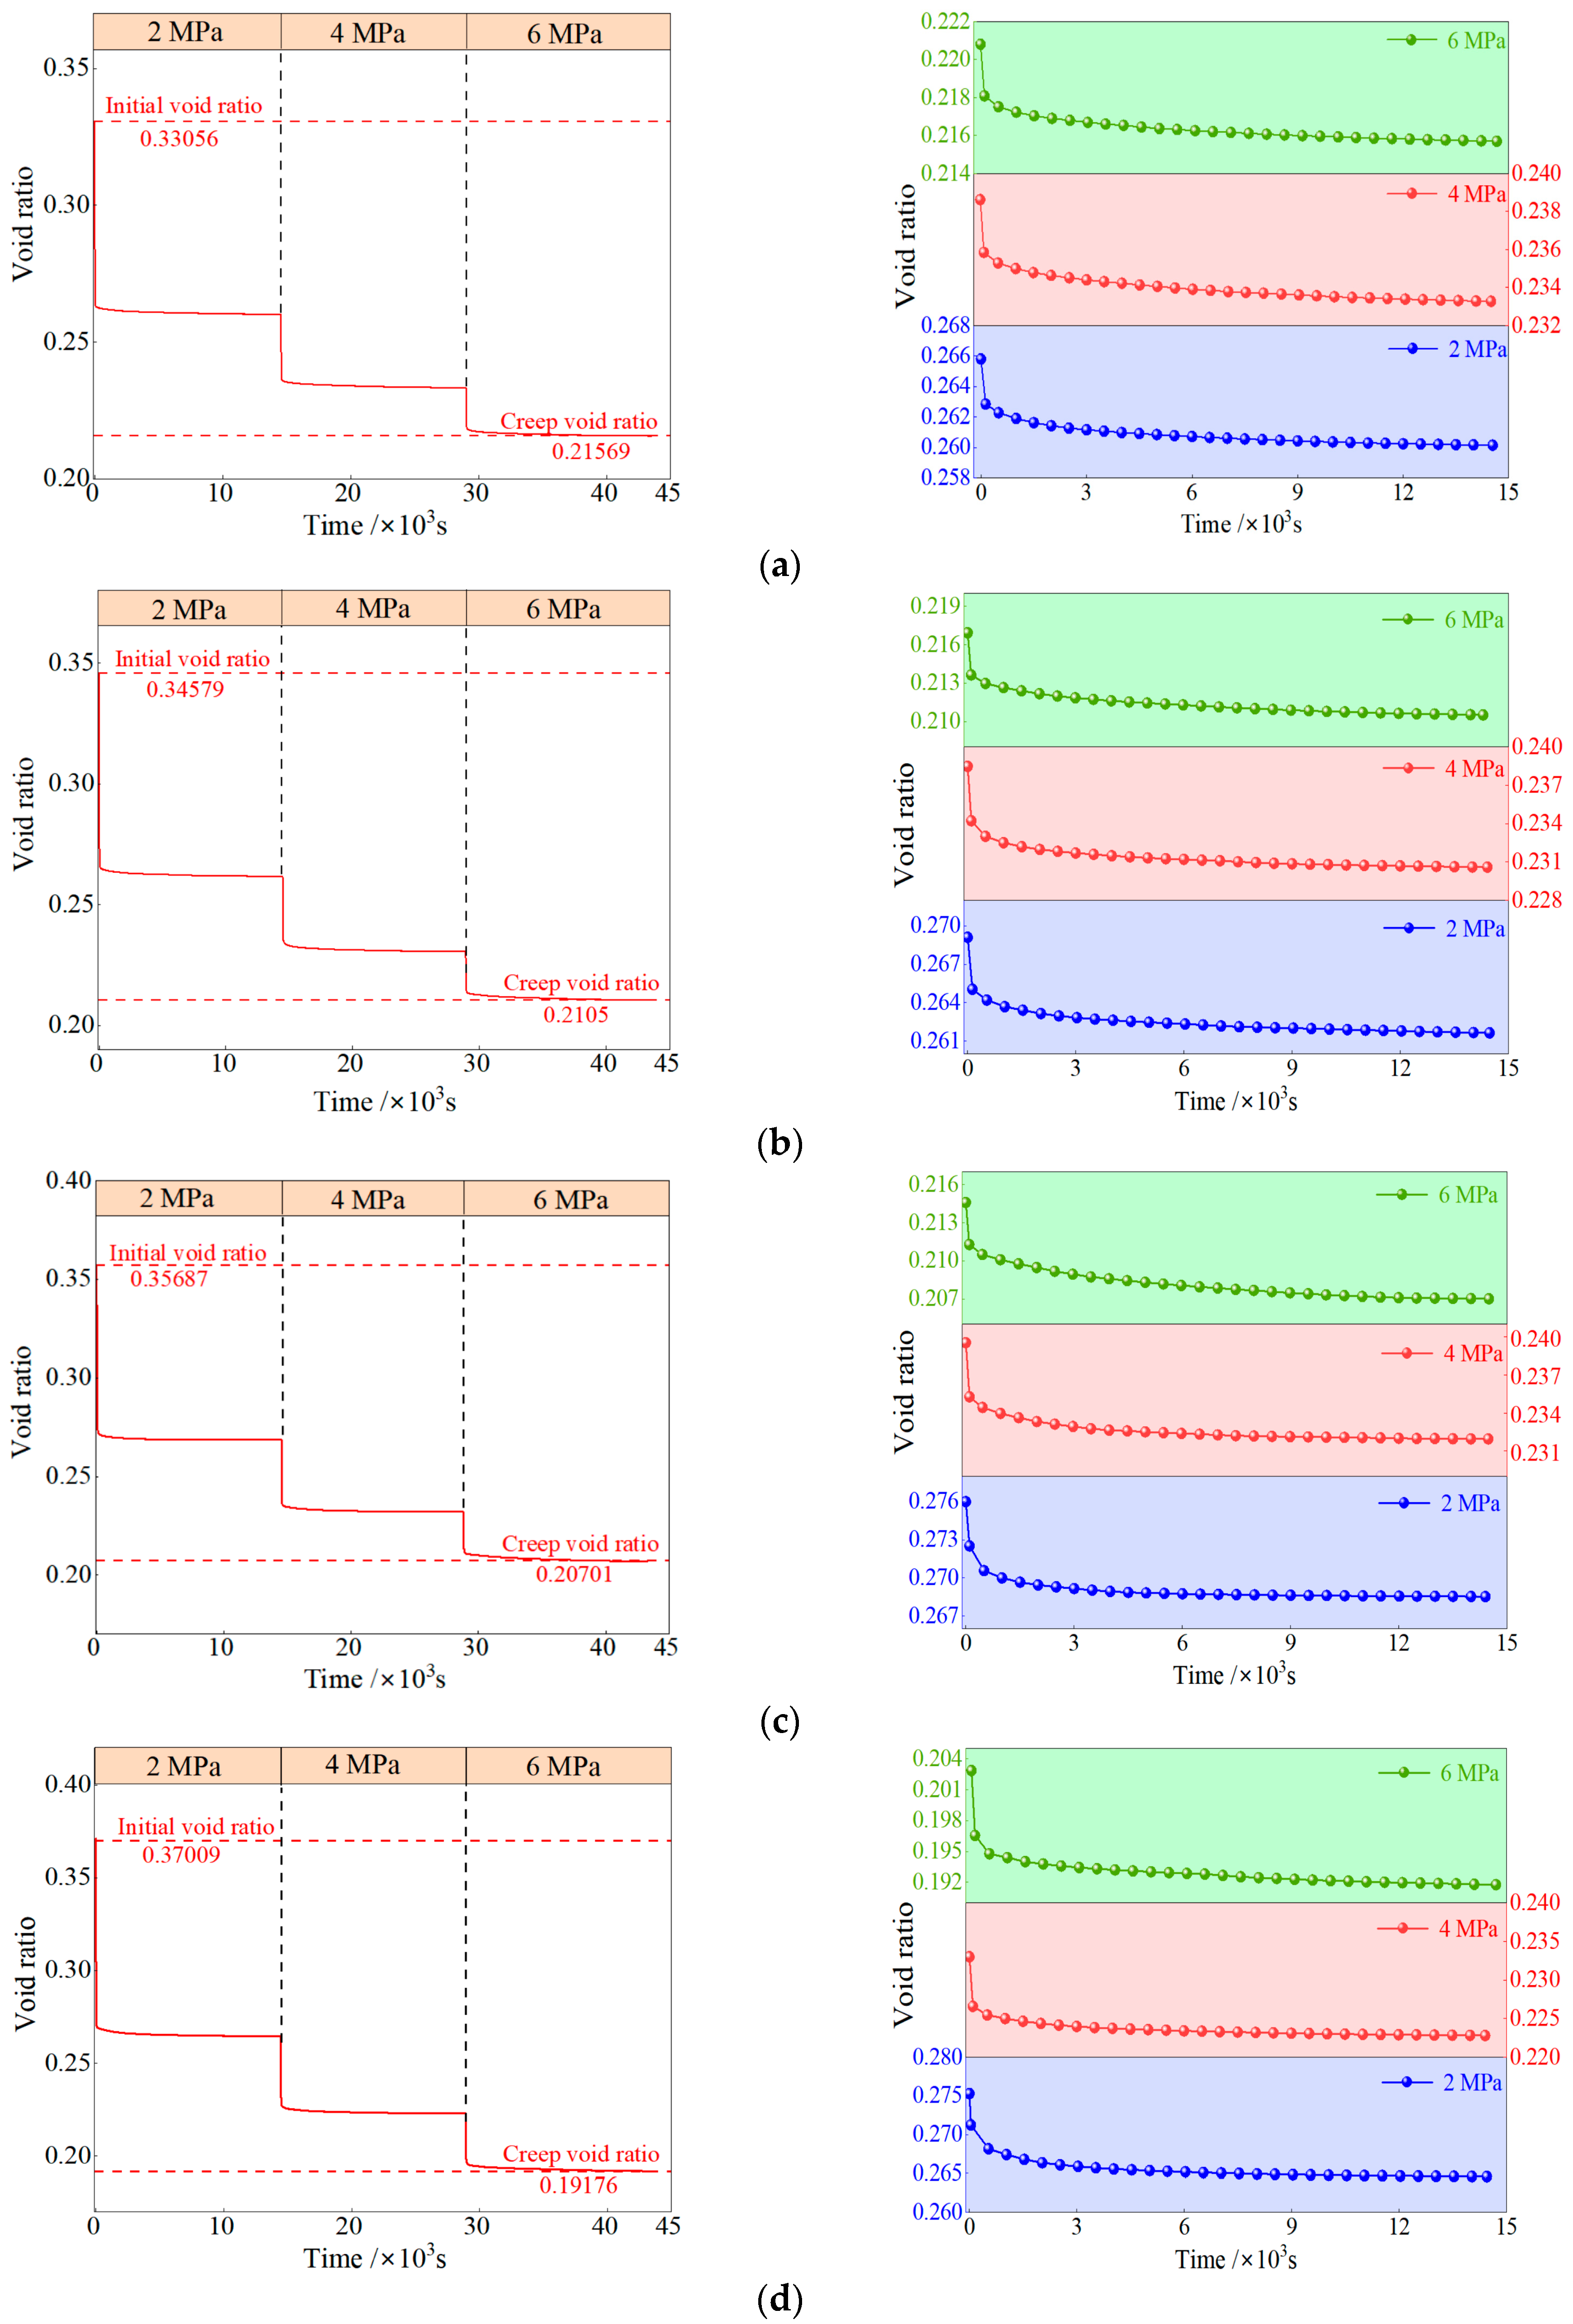
As shown in Figure 6, the variation in the void ratio of the crushed rock exhibits distinct stage-wise characteristics, which demonstrate a clear correlation with its displacement pattern. Specifically, the void ratio evolution can be divided into three stages: a sharp decrease, a gradual decrease, and stabilization. These stages correspond, respectively, to the rapid instantaneous deformation, decelerating creep, and steady-state creep stages observed in the displacement curve. In the initial unloaded state, the sample exhibits the highest void ratio, which shows a positive correlation with the Talbot index. A larger Talbot index results in a higher initial void ratio. For instance, at Talbot indices of 0.2, 0.4, 0.6, and 0.8 in the initial unloaded state, the measured initial void ratios are 0.33056, 0.34579, 0.35687, and 0.37009, respectively. Relative to the value at n = 0.2, these represent increases by factors of approximately 1.05, 1.08, and 1.12. This trend occurs because a higher Talbot index indicates a greater proportion of large particles and a wider particle size distribution, which facilitates the formation of more void spaces. With increasing axial stress and creep time, the void ratio gradually decreases. Notably, a higher Talbot index leads to a lower final void ratio after compression. For example, at Talbot indexes of n = 0.2, 0.4, 0.6, and 0.8, the final void ratios after compression are 0.21569, 0.2105, 0.20701, and 0.19176, respectively. Relative to the value at n = 0.2, these correspond to 0.9759, 0.9597, and 0.8891 times the reference value. This behavior can be attributed to the fact that a higher Talbot index, characterized by a greater content of large particles, increases the likelihood of particle breakage under compressive deformation. The resulting smaller particles cover a wider size range and are more effective at filling void spaces, thereby enhancing the load-bearing capacity of the specimen and reducing its void ratio.
To further quantify the variation patterns of instantaneous and creep-induced void ratio reduction during the compression of crushed rocks, the creep test results were analyzed using the “Chen’s loading method.” Combined with Equation (2), this analysis yielded clusters of void ratio variation curves under graded loading and the corresponding parameters for crushed rocks with different Talbot indexes, as shown in Figure 7 and Table 4.
As observed from Table 4, the reductions in both the instantaneous void ratio and the creep-induced void ratio for crushed rocks with different Talbot indexes gradually decrease as the axial stress level increases. However, the magnitude of this decrease diminishes progressively. Taking n = 0.2 as an example, when the axial stress increased from the initial unloaded state to 2, 4, and 6 MPa, the corresponding reductions in instantaneous void ratio were 0.0647, 0.0215, and 0.0124, respectively, while the reductions in creep-induced void ratio were 0.0057, 0.0054, and 0.0052, respectively. Compared to the reduction observed at the 2 MPa stress level, the subsequent reductions in instantaneous void ratio were lower by 112.23% and 120.37%, respectively, and the reductions in creep-induced void ratio were lower by 105.56% and 109.62%, respectively.
Under identical axial stress conditions, a larger Talbot index leads to greater reductions in both the instantaneous and creep-induced void ratios. For instance, at σ = 6 MPa, with Talbot indexes of n = 0.2, 0.4, 0.6, and 0.8, the reductions in instantaneous void ratio were 0.0124, 0.0136, 0.0174, and 0.0253, respectively, and the reductions in creep-induced void ratio were 0.0052, 0.0064, 0.0075, and 0.0111, respectively. Relative to the values for n = 0.2, the reductions in instantaneous void ratio were greater by factors of approximately 1.10, 1.40, and 2.04, and the reductions in creep-induced void ratio were greater by factors of about 1.23, 1.44, and 2.13.

3.3. Fragmentation Characteristics

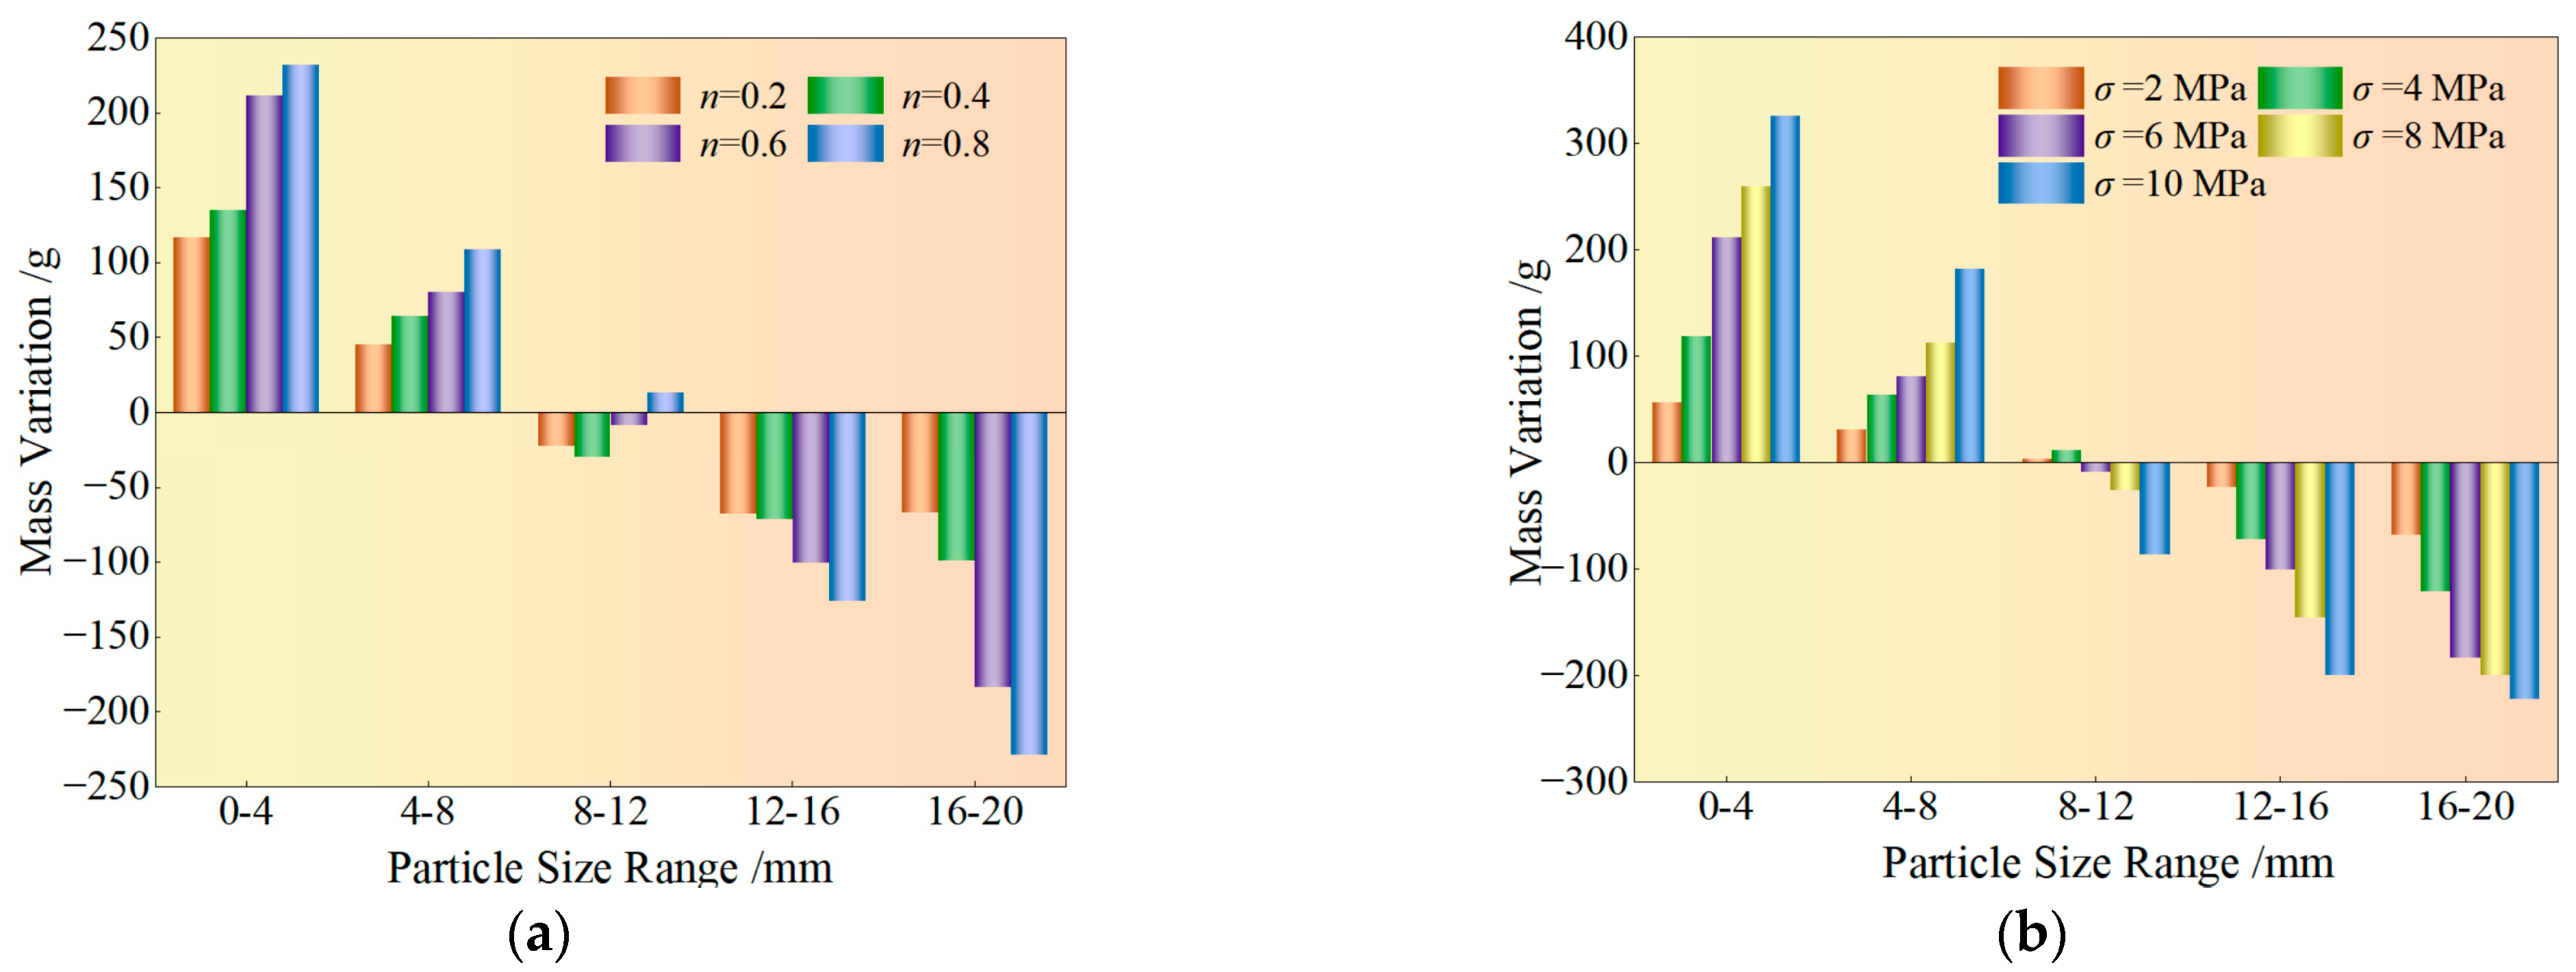
The mass variation in sample before and after creep compression under different Talbot indexes and axial stresses is shown in Figure 7. From Figure 7a, it can be observed that as the Talbot index increases, the mass of crushed rocks in the 0~4 mm and 4~8 mm size ranges show an increasing trend. A larger Talbot index leads to a greater mass increase in the 0–4 mm and 4~8 mm size ranges, with the increase in the 0~4 mm range being more pronounced than that in the 4~8 mm range. Taking the mass increase in the 0~4 mm size range as an example, the mass increased by 116.74, 135.04, 211.36, and 231.72 g for n = 0.2, 0.4, 0.6, and 0.8, respectively. Conversely, the mass of crushed rocks in the 12~16 mm and 16~20 mm size ranges exhibit a decreasing trend, with the mass loss in the 16~20 mm range being greater than that in the 12~16 mm range. Taking the mass decrease in the 16~20 mm size range as an example, the mass decreased by 66.92, 99.18, 183.16, and 228.3 g for n = 0.2, 0.4, 0.6, and 0.8, respectively. The mass variation in the 8~12 mm size range is relatively minor. The underlying mechanism for this behavior is that a higher Talbot index corresponds to a greater proportion of large-sized particles, which are more susceptible to deformation and fragmentation. The 0~4 mm and 4~8 mm size ranges represent the finer fractions in the test; during compression, particles from other size ranges can fracture, break, or undergo abrasion, transforming into these smaller fractions. The 12~16 mm and 16~20 mm size ranges represent the coarser fractions. They continuously undergo deformation and fragmentation during compression, transforming into smaller size ranges, resulting in a significant decrease in their own mass. The 8~12 mm size range, being an intermediate fraction, experiences opposing effects: on one hand, its own particles break down into smaller sizes under load, leading to a mass decrease; on the other hand, it can gain mass from the breakdown of larger particles, resulting in a relatively small net mass change.
From Figure 7b, it can be seen that with increasing axial stress, the mass of crushed rocks in the 0~4 mm and 4~8 mm size ranges increase, while the mass in the 12~16 mm and 16~20 mm size ranges decrease. Furthermore, a higher axial stress leads to a greater mass increase in the 0~4 mm and 4~8 mm size ranges and a greater mass decrease in the 12~16 mm and 16~20 mm size ranges. Taking the mass increase in the 4~8 mm size range and the mass decrease in the 12~16 mm size range as examples, for σ = 2, 4, 6, 8 and 10 MPa, the mass in the 4~8 mm range increased by 31.02, 64.12, 80.72, 112.22 and 182.22 g, respectively. In contrast, the mass in the 12~16 mm range decreased by 23.52, 72.42, 100.32, 146.02, and 200.02 g, respectively. The mass in the 8~12 mm size range shows a trend of first increasing and then decreasing.
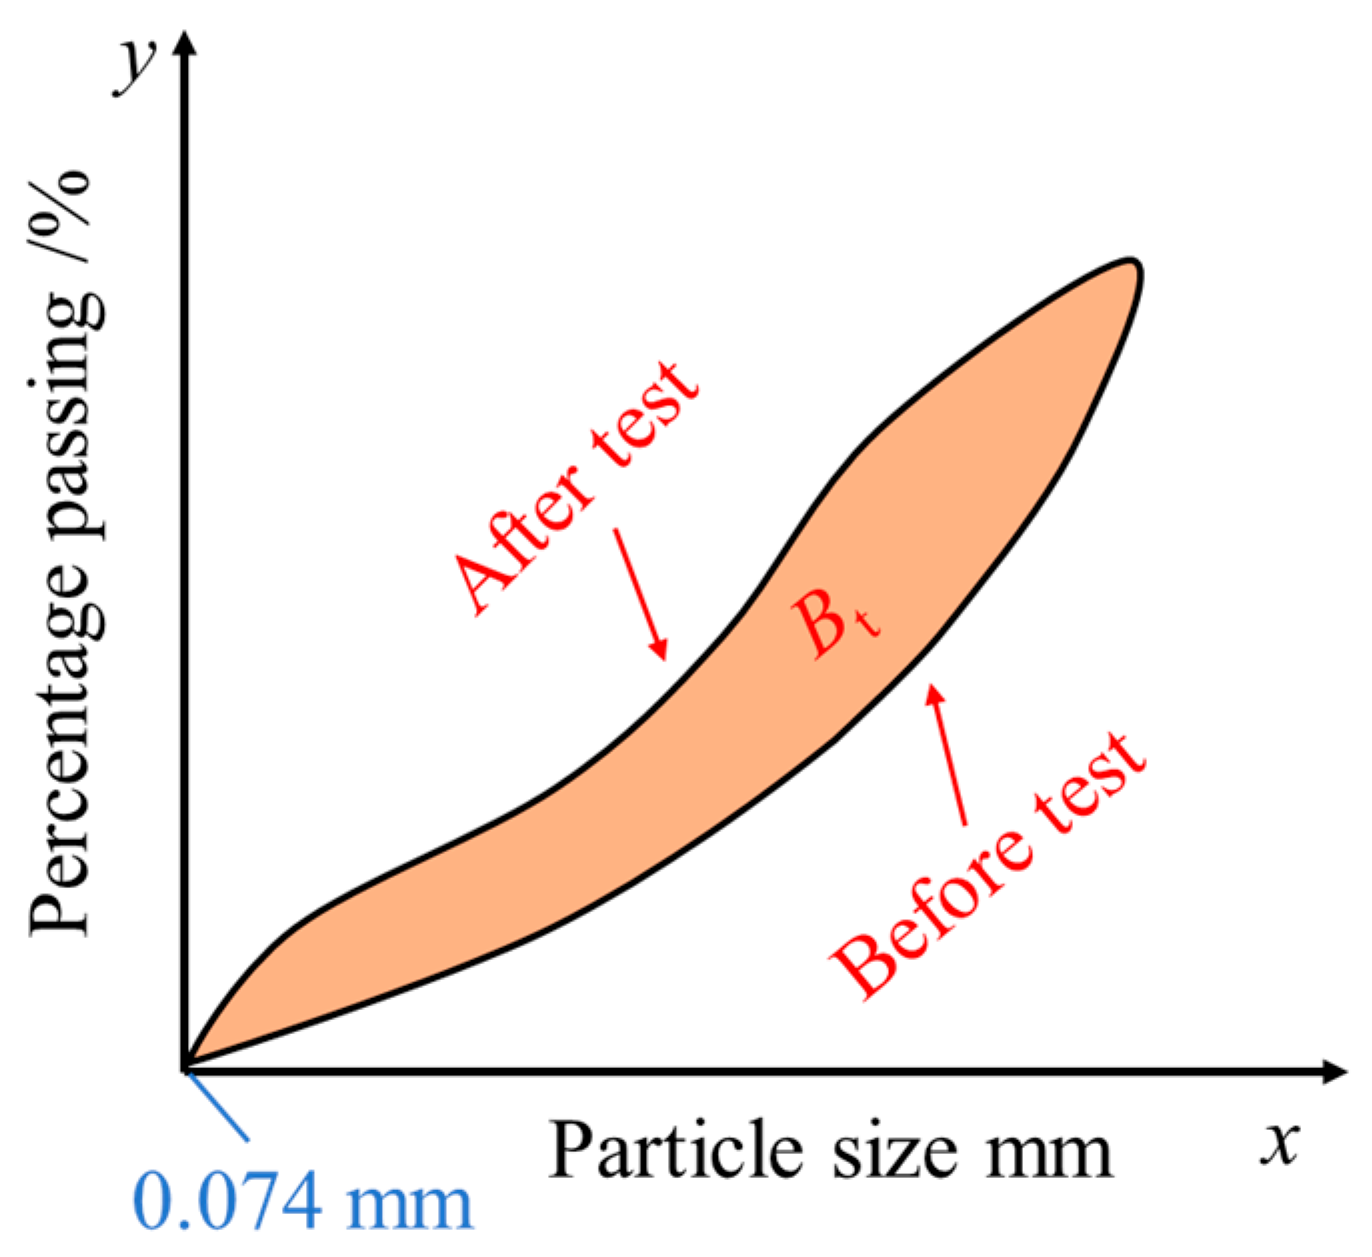
The fragmentation process of rock particles is a dynamic process governed by multiple factors, such as particle shape, size distribution, compaction degree, and void structure. During compression, the confined crushed rocks undergo deformation and breakage, generating smaller particles. To quantitatively describe the degree of fragmentation during compression, Hardin [35] proposed the concept of fragmentation amount. This parameter is characterized by integrating the area enclosed between the gradation curves of the crushed rocks (before and after compression) and the vertical line at x = 0.074 mm. A schematic diagram of the integration area for calculating the fragmentation amount is shown in Figure 8.
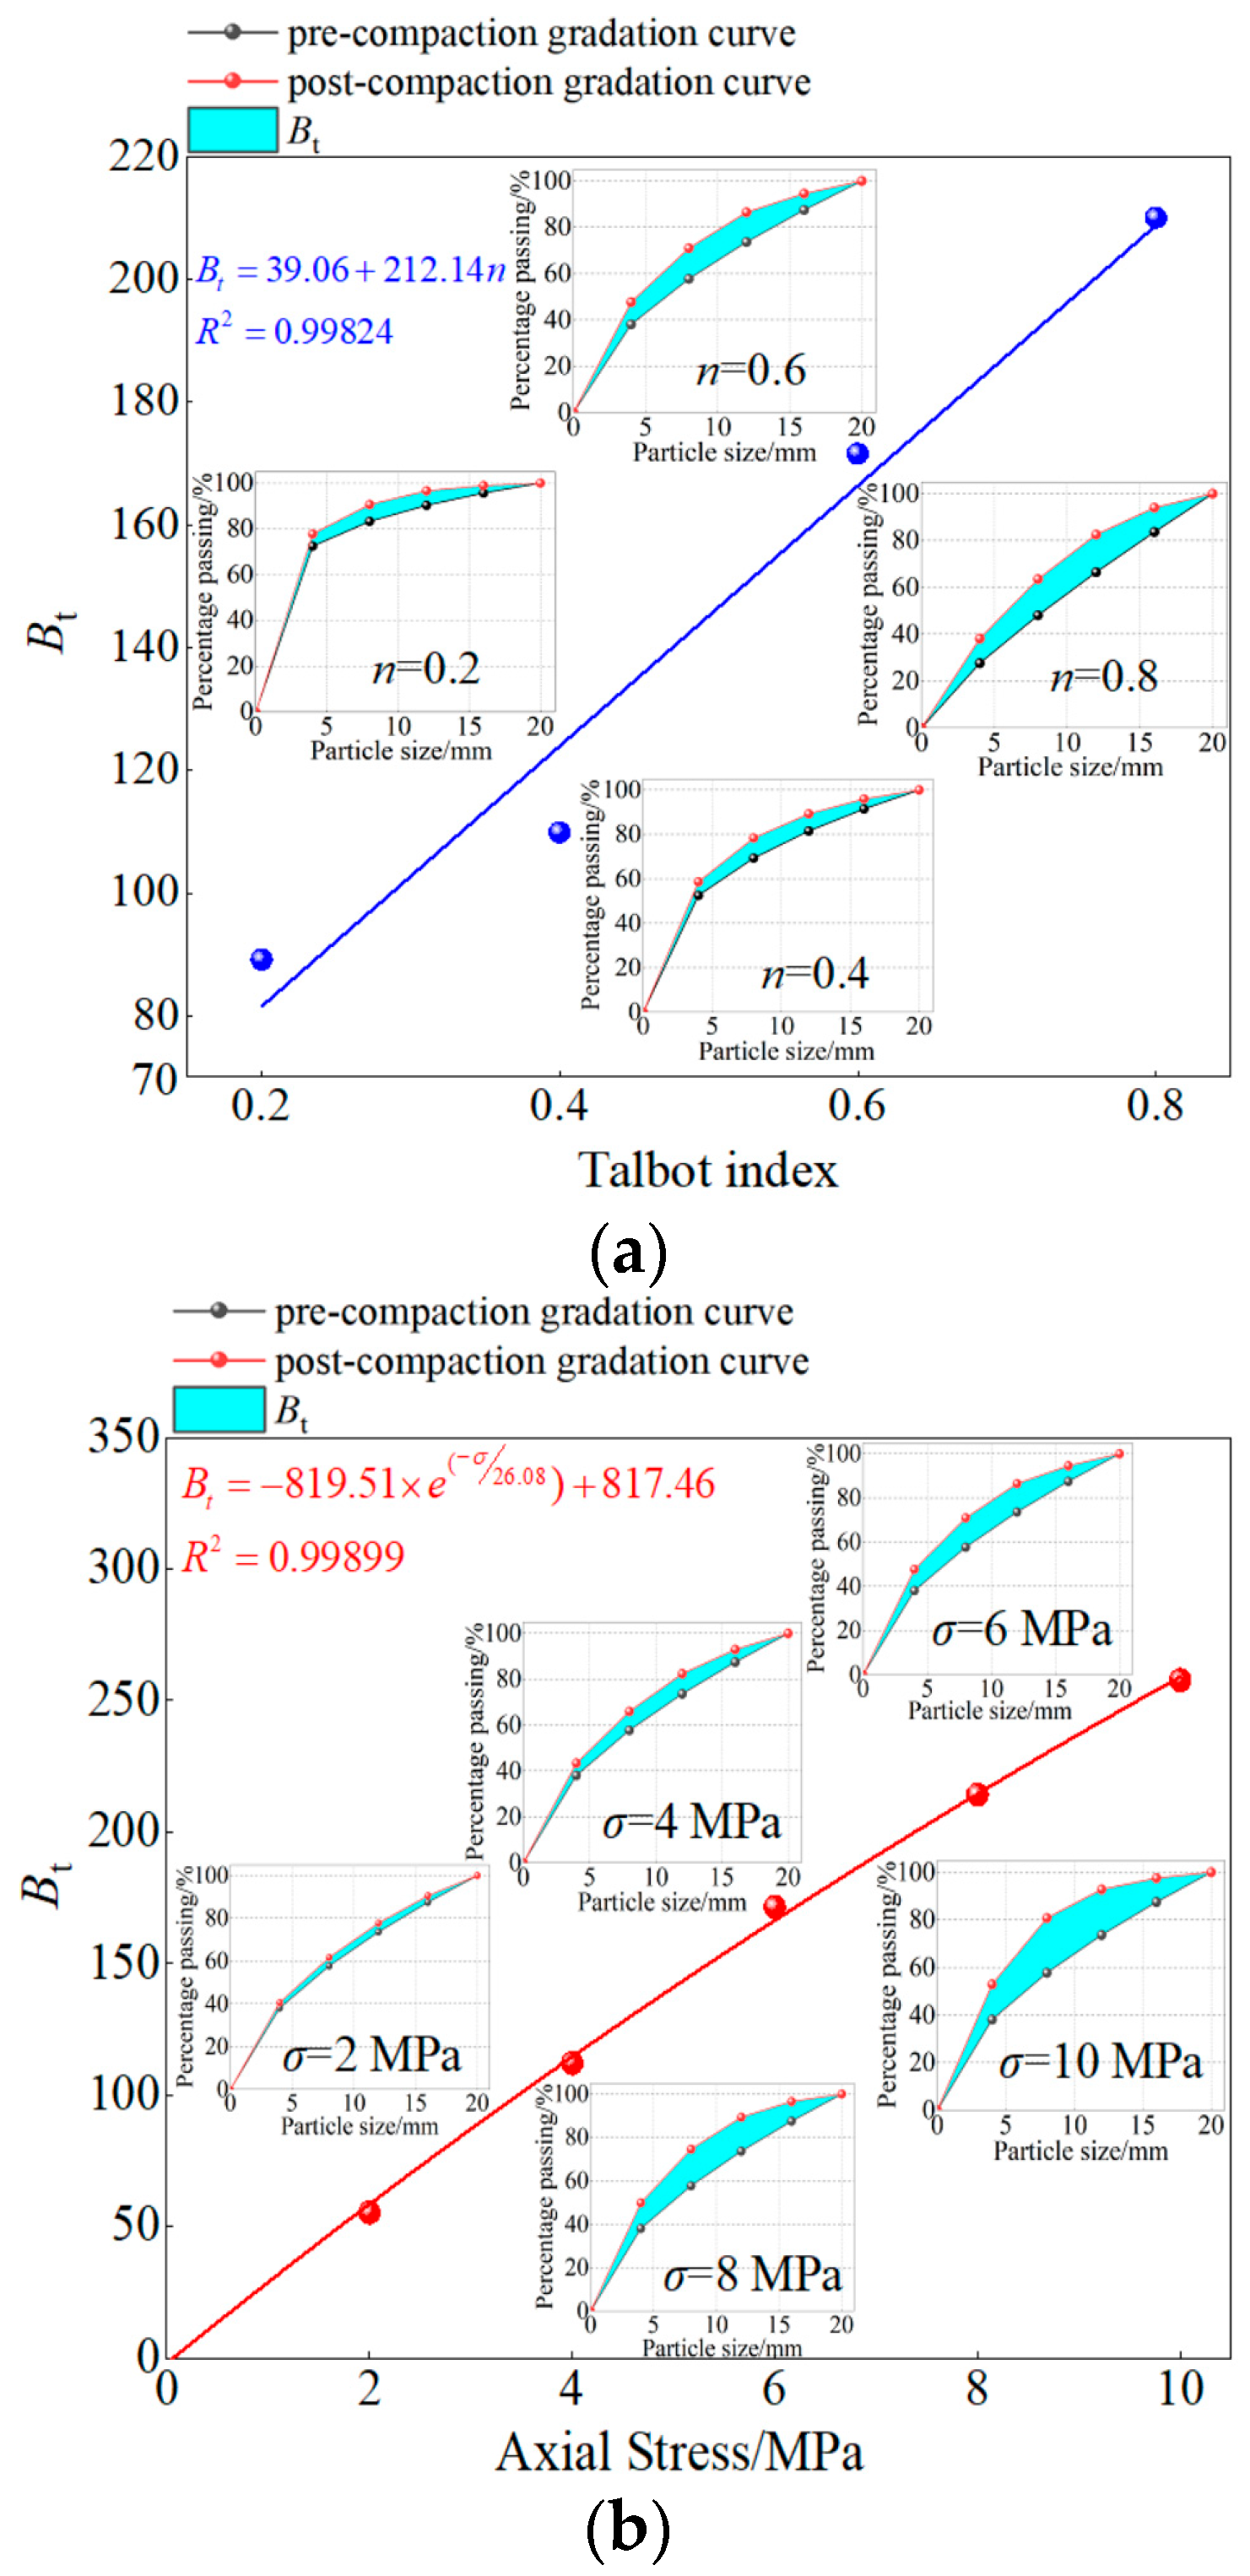
The variation characteristics of the fragmentation amounts of crushed rocks under different Talbot indexes and axial stresses are shown in Figure 9. As observed in Figure 9a, the fragmentation amount exhibits a linear positive correlation with the Talbot index, with a correlation coefficient greater than 0.99. The fragmentation amount increases with increasing Talbot index. For instance, at σ = 6 MPa, compared to the value at a Talbot index of 0.2, the fragmentation amount Bt, increased by 20.76, 82.40, and 120.88 for Talbot indices of 0.4, 0.6, and 0.8, respectively. This correlation exists because a higher Talbot index indicates a greater proportion of large-sized particles in the sample, which are more susceptible to deformation and fragmentation during compression. Consequently, a larger Talbot index results in a greater fragmentation amount.
From Figure 9b, it can be seen that the fragmentation amount shows an exponential positive correlation with the axial stress, also with a correlation coefficient greater than 0.99. This indicates that the fragmentation amount increases with increasing axial stress. Taking a Talbot index of 0.6 as an example, under axial stress levels of 2, 4, 6, 8, and 10 MPa, the fragmentation amounts of the crushed rocks were 55.25, 112.00, 171.52, 214.16, and 257.72, respectively. The corresponding increase rates of the fragmentation amount were 27.62, 28.37, 29.76, 21.32, and 21.78 per MPa, respectively. In the initial compression stage, the irregular crushed rock particles, subjected to compression and interparticle forces, gradually transform into more regular, elliptical-like particles. Deformation and fragmentation primarily involve the breaking off of sharp edges and corners. As the axial stress continues to increase, the main body of the crushed rocks undergoes significant fragmentation, leading to the highest rate of increase in the fragmentation amount. In the later stages of compression, the degree of compaction within the crushed rock sample increases, the void ratio decreases, and the resistance to compression is enhanced. Consequently, further deformation and fragmentation become more difficult, resulting in a diminished rate of increase in the fragmentation amount.

3.4. Fractal Characteristics

The particle size distribution of crushed rocks satisfies the statistical property of self-similarity and exhibits fractal characteristics. Therefore, the fractal dimension can serve as a key parameter to characterize the complexity of grain size variation during the compression process. The mass proportion of particles smaller than a specific size d to the total mass of the specimen can be described by the following expression [36]:
M d ( x < d ) M t = d 3 D d m 3 D d M 3 D d m 3 D
where dm is the minimum particle size in the crushed rock mass; dM is the maximum particle size in the crushed rock mass; D is the fractal dimension of the particle size distribution.
During the compression of the crushed rock mass, friction between particles generates a certain amount of fine particles. Since the size of these fine particles is significantly smaller than the typical particle size of the crushed rock mass, their influence can be considered negligible. Accordingly, Equation (3) can be simplified as follows:
M d ( x < d ) M t = d d M 3 D
Taking the logarithm of both sides of Equation (4) yields:
lg ( M d M t ) = ( 3 D ) lg ( d d M )
As can be seen from Equation (5), a linear correlation exists between lg (Md/Mt) and lg (d/dM), with a slope of 3 − D. The fractal dimension D can therefore be determined.
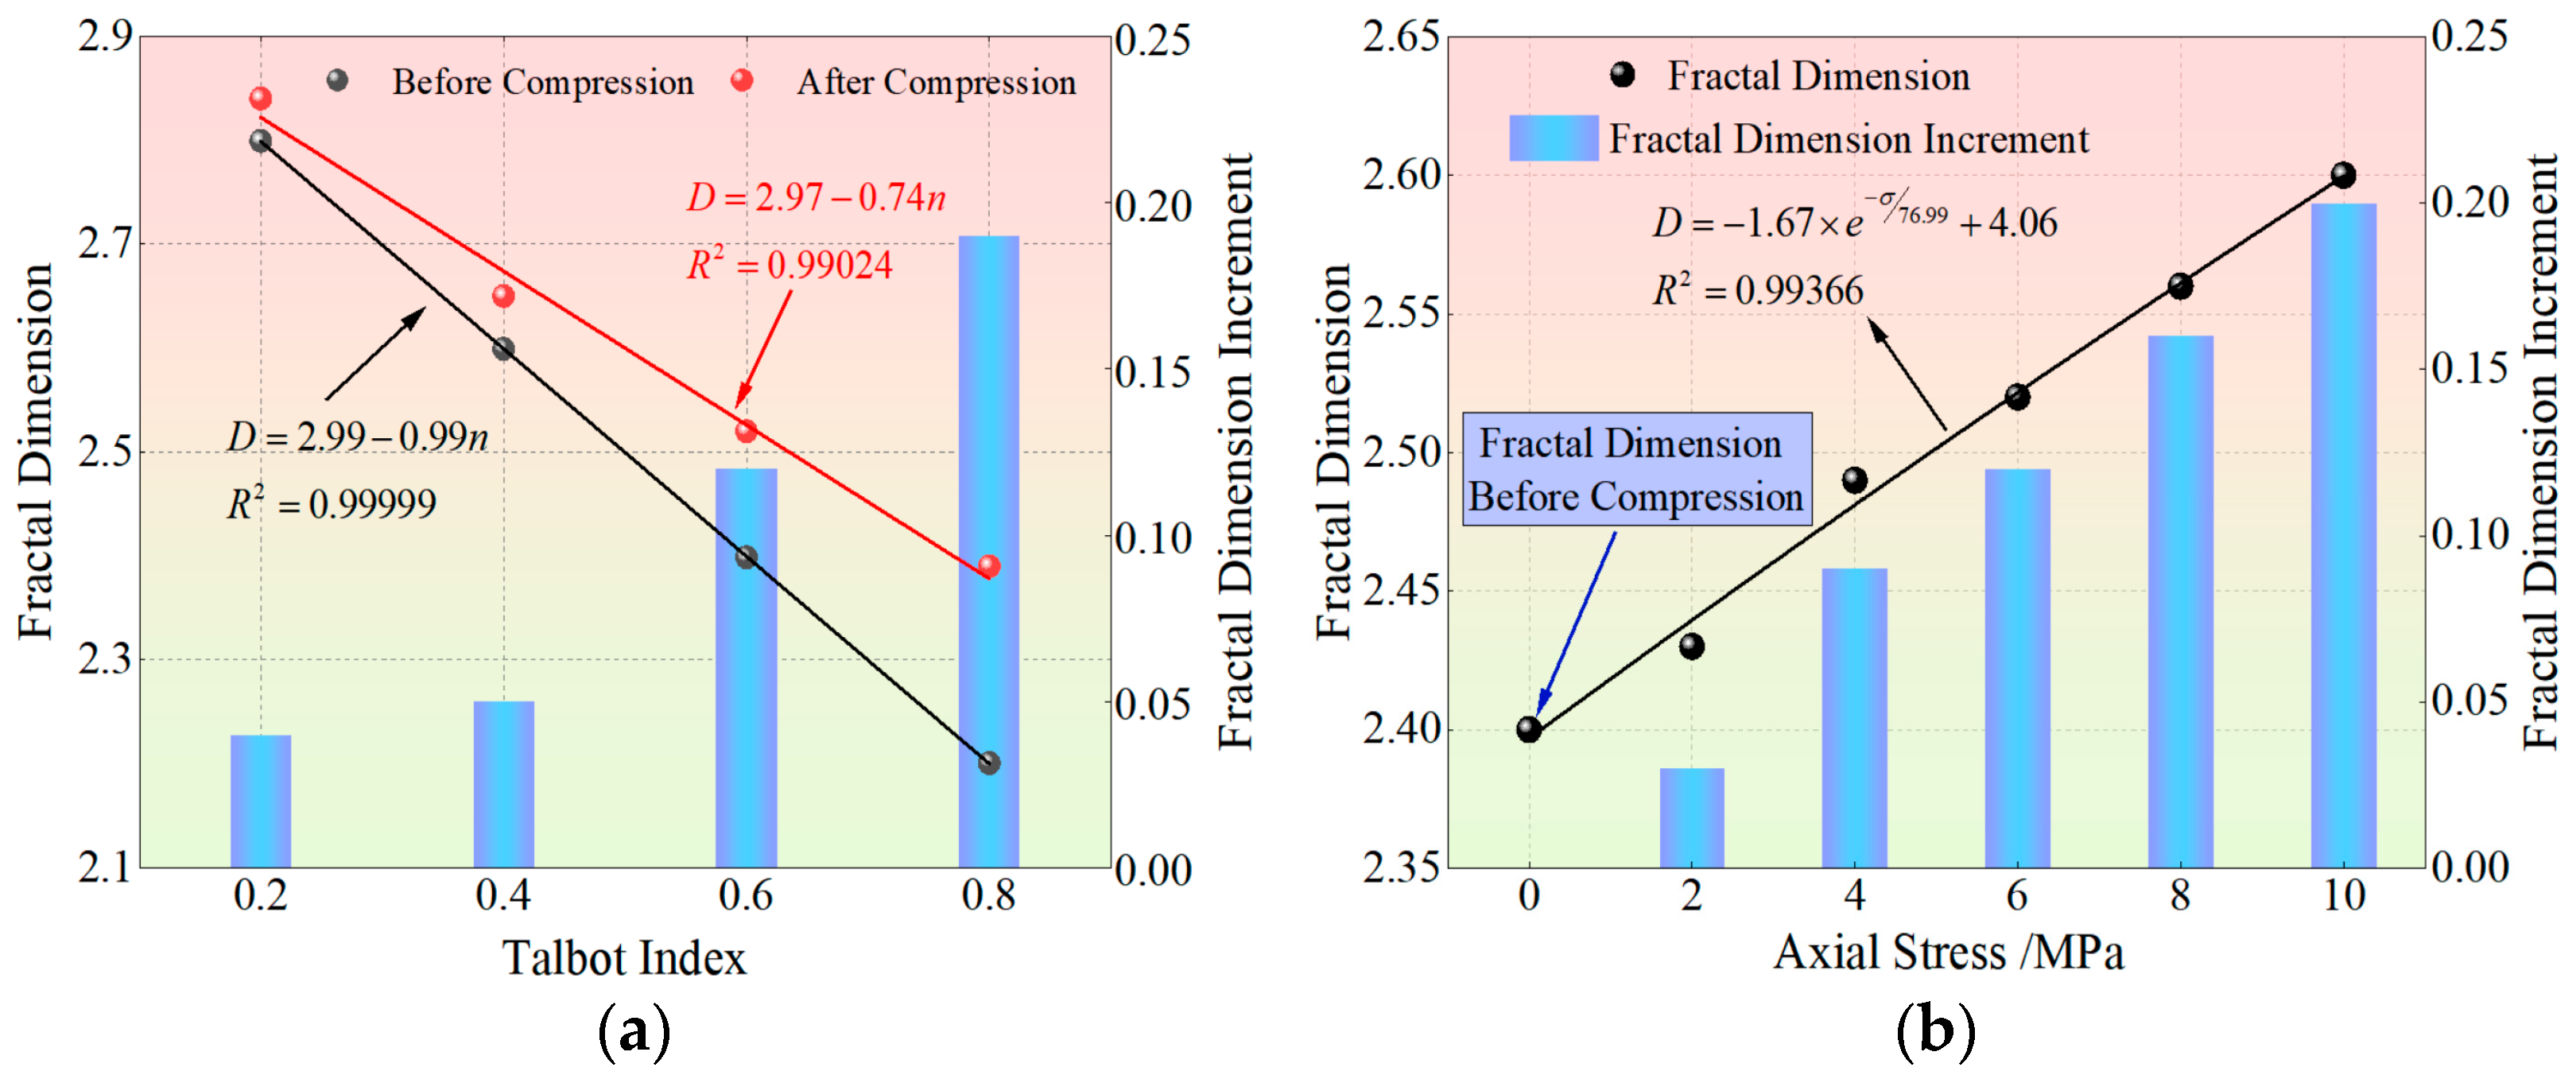
The variation characteristics of the fractal dimension of crushed rocks under creep compression conditions are shown in Figure 10. As shown in Figure 10a, the fractal dimensions, both before and after compression, exhibit a linear negative correlation with the Talbot index, with correlation coefficients all greater than 0.99. The fractal dimension decreases with an increase in the Talbot index. The reduction in the fractal dimension before creep compression is greater than that after creep compression. Taking the increase in the Talbot index from 0.2 to 0.8 as an example, the fractal dimension before creep compression decreased from 2.80 to 2.20, a reduction of 0.60, while after creep compression, it decreased from 2.84 to 2.39, a reduction of 0.45. Before creep compression, as the Talbot index increases, the proportion of crushed rocks in each size range becomes more balanced, leading to an increased overall homogeneity of the specimen and a decrease in structural complexity, thus resulting in a lower fractal dimension. During creep compression, the axial stress is transmitted through the skeletal structure formed by large particles. The small particles, filling the voids within this skeletal structure, remain in a protected state. Most of the stress is absorbed and dispersed by the larger particles, reducing stress concentration on the smaller particles and thereby suppressing the overall fragmentation degree of the specimen. Since a larger Talbot index indicates a greater proportion of large particles, the fractal dimension after creep compression gradually decreases with an increasing Talbot index.
As the Talbot index increases, the increment of the fractal dimension also increases. For Talbot indexes of 0.2, 0.4, 0.6, and 0.8, the increments in the fractal dimension after creep compression, compared to the initial fractal dimension, were 0.04, 0.05, 0.12, and 0.19, respectively. This is because a larger Talbot index corresponds to a greater mass proportion of large particles in the specimen, increasing the likelihood of fragmentation. The resulting fragments exhibit a wider variety of types and more complex shapes, thereby enhancing the internal structural complexity of the crushed rock specimen and leading to a greater increment in the fractal dimension.
As shown in Figure 10b, the fractal dimension of crushed rocks during compression exhibits an exponential correlation with the axial stress, with a correlation coefficient greater than 0.99. This indicates that the fractal dimension increases with increasing axial stress. In the initial uncompressed state, the fractal dimension of the crushed rocks was 2.40. When the axial stress was increased to 2, 4, 6, 8, and 10 MPa, the corresponding fractal dimensions were 2.43, 2.49, 2.52, 2.56, and 2.60, respectively. Compared to the initial value, the increments in the fractal dimension at these stress levels were 0.03, 0.06, 0.12, 0.16, and 0.20, respectively. The corresponding rates of increase were 0.015, 0.015, 0.03, 0.020, and 0.020 per MPa. In the initial loading stage (σ ≤ 4 MPa), the crushed rocks were loosely packed with a large void structure and weak deformation resistance. The dominant mechanisms were compression and sliding between particles, with limited large-scale fragmentation occurring. Breakage was primarily confined to the detachment of particle edges and corners, resulting in the lowest rate of increase in the fractal dimension. As the axial stress continued to increase (4 MPa < σ ≤ 6 MPa), stress concentration effects induced significant deformation and fragmentation of the rock particles. Larger particles were progressively transformed into smaller size ranges, which filled the void spaces within the specimen. This process enhanced the specimen’s deformation resistance and resulted in the highest rate of increase in the fractal dimension. With a further increase in axial stress (σ > 6 MPa), the crushed rocks became increasingly compacted, forming a structure resembling intact rock. The deformation resistance was further improved, leading to a reduction in the rate of increase in the fractal dimension.

4. Discussion

The evolution of the void structure and the re-crushing process of crushed rocks during compression constitute a dynamic process of mutual interaction. As the axial stress continuously increases, the internal volume of the crushed rock specimen is progressively reduced, leading to a higher degree of compaction and a decrease in the void ratio. From a statistical perspective, the particles undergo single or multiple fragmentation events, resulting in a continuous reduction in particle size. This alters the mass distribution across the original particle size ranges. Therefore, the evolution of the void ratio in crushed rocks is inherently linked to the processes of re-crushing and the fractal evolution of the particle size distribution. Consequently, a certain correlation must exist between the dynamic evolution of these two parameters.
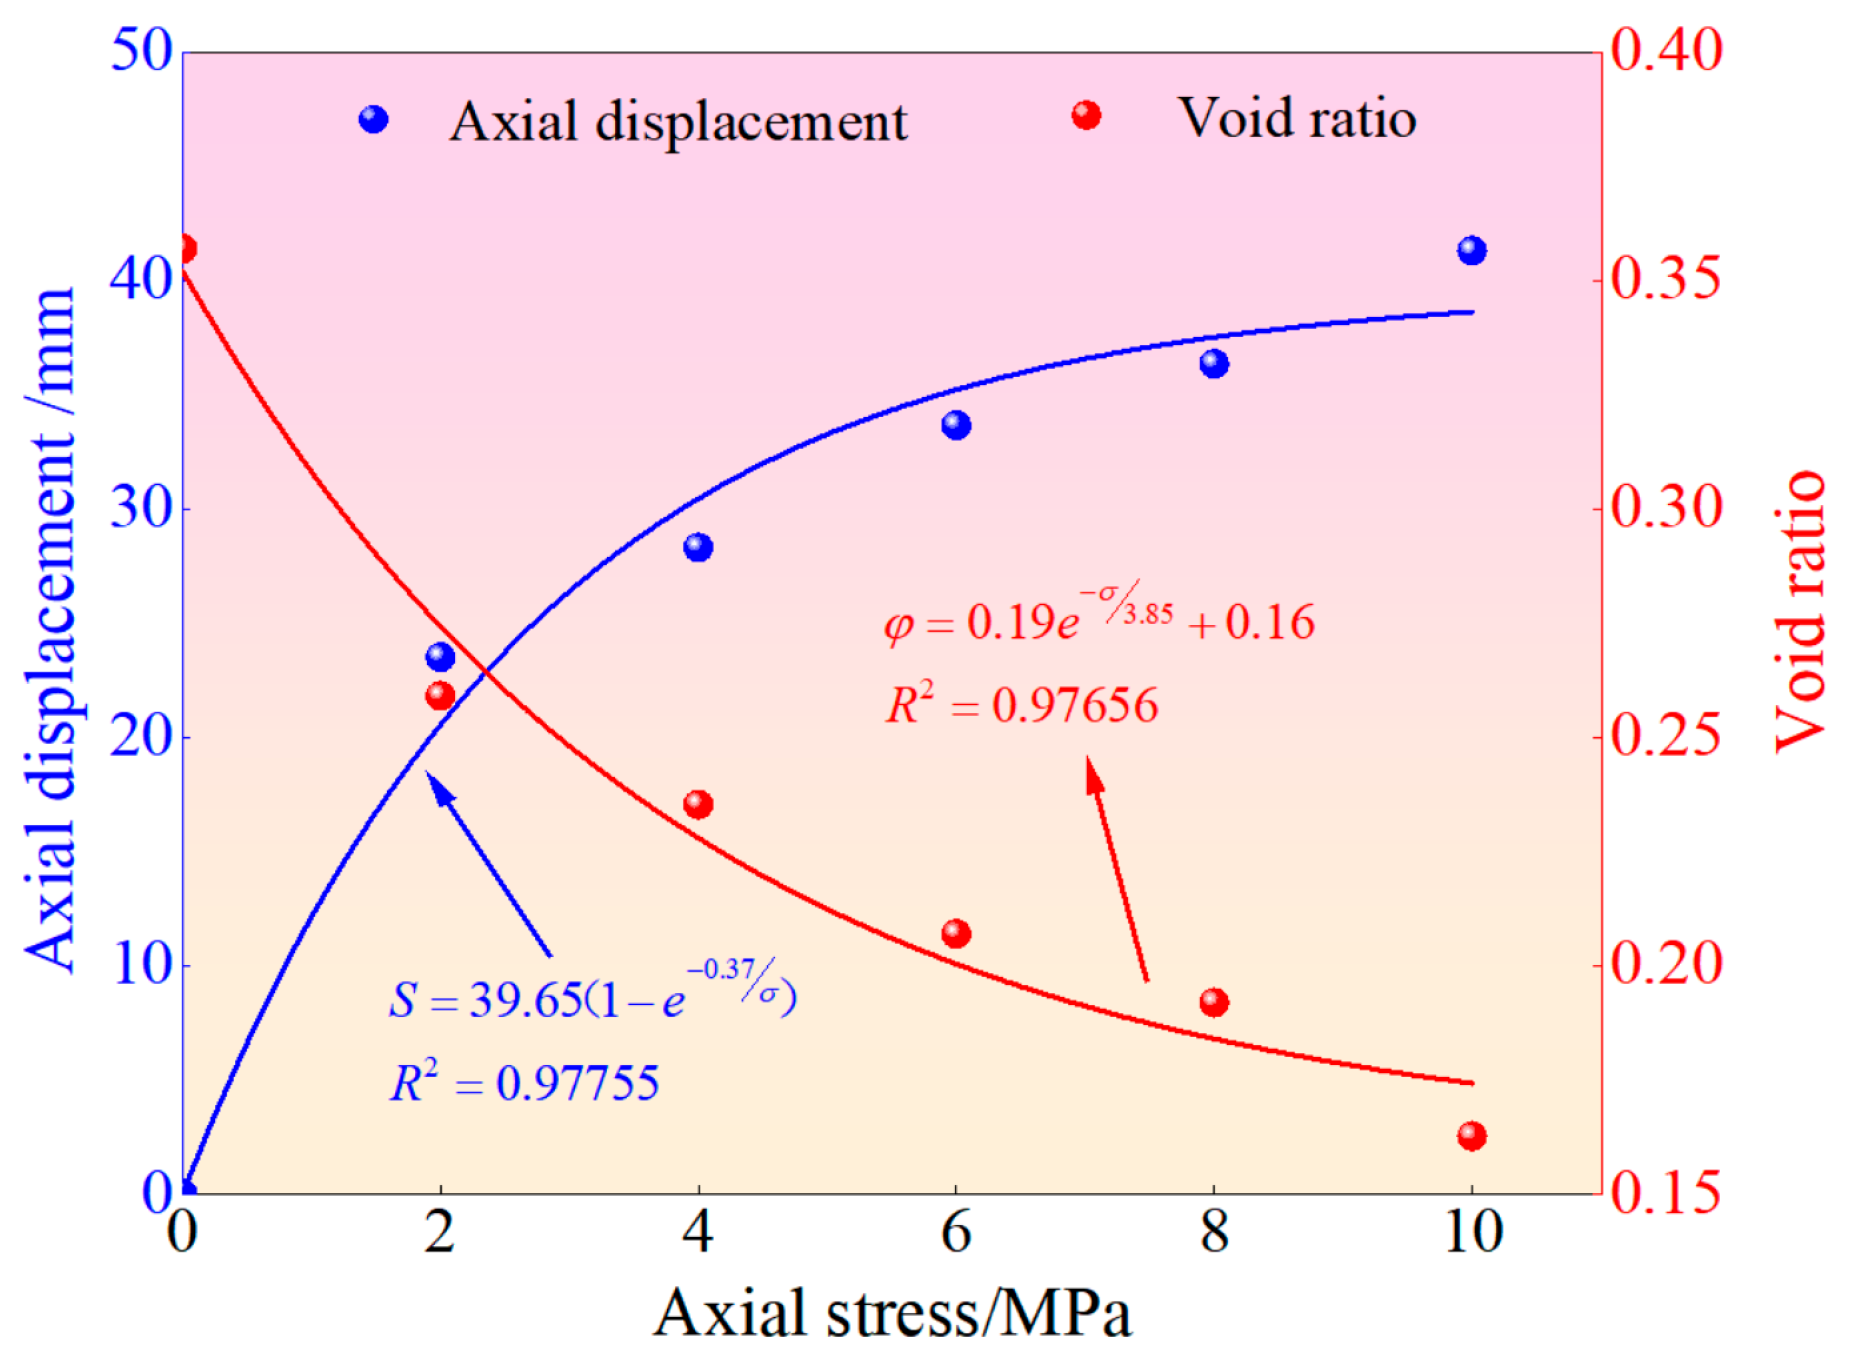
Taking the Talbot index of 0.6 as an example, Figure 11 shows the variations in axial displacement and void ratio of the crushed rocks under different axial stress. As illustrated, both the axial displacement and the void ratio exhibit exponential correlations with the axial stress, with correlation coefficients exceeding 0.97. Specifically, the axial displacement increases exponentially with the axial stress, whereas the void ratio decreases exponentially. Further analysis of the relationships between axial displacement, void ratio, and axial stress reveals that as the axial stress approaches sufficiently high values, the axial displacement tends toward a maximum of 39.65 mm, while the void ratio approaches a minimum of 0.16. Under such conditions, the crushed rocks become tightly compacted and bonded, achieving their maximum resistance to compression.
Based on the results presented in Figure 10 and Figure 11, the relationship between the fractal dimension of crushed rocks and the axial stress can be expressed by Equation (6), while the relationship between the void ratio and the axial stress is given by Equation (7).
D = a 1 e σ a 2 + a 3
φ = b 1 e σ b 2 + b 3
where a1, a2, a3, b1, b2 and b3 are fitting parameters.
By combining Equations (6) and (7) and eliminating the stress variable σ, the void ratio-fractal model, which characterizes the variation between the void ratio and the fractal dimension of crushed rocks, is derived as follows:
φ = b 1 ( D a 3 a 1 ) a 2 b 2 + b 3
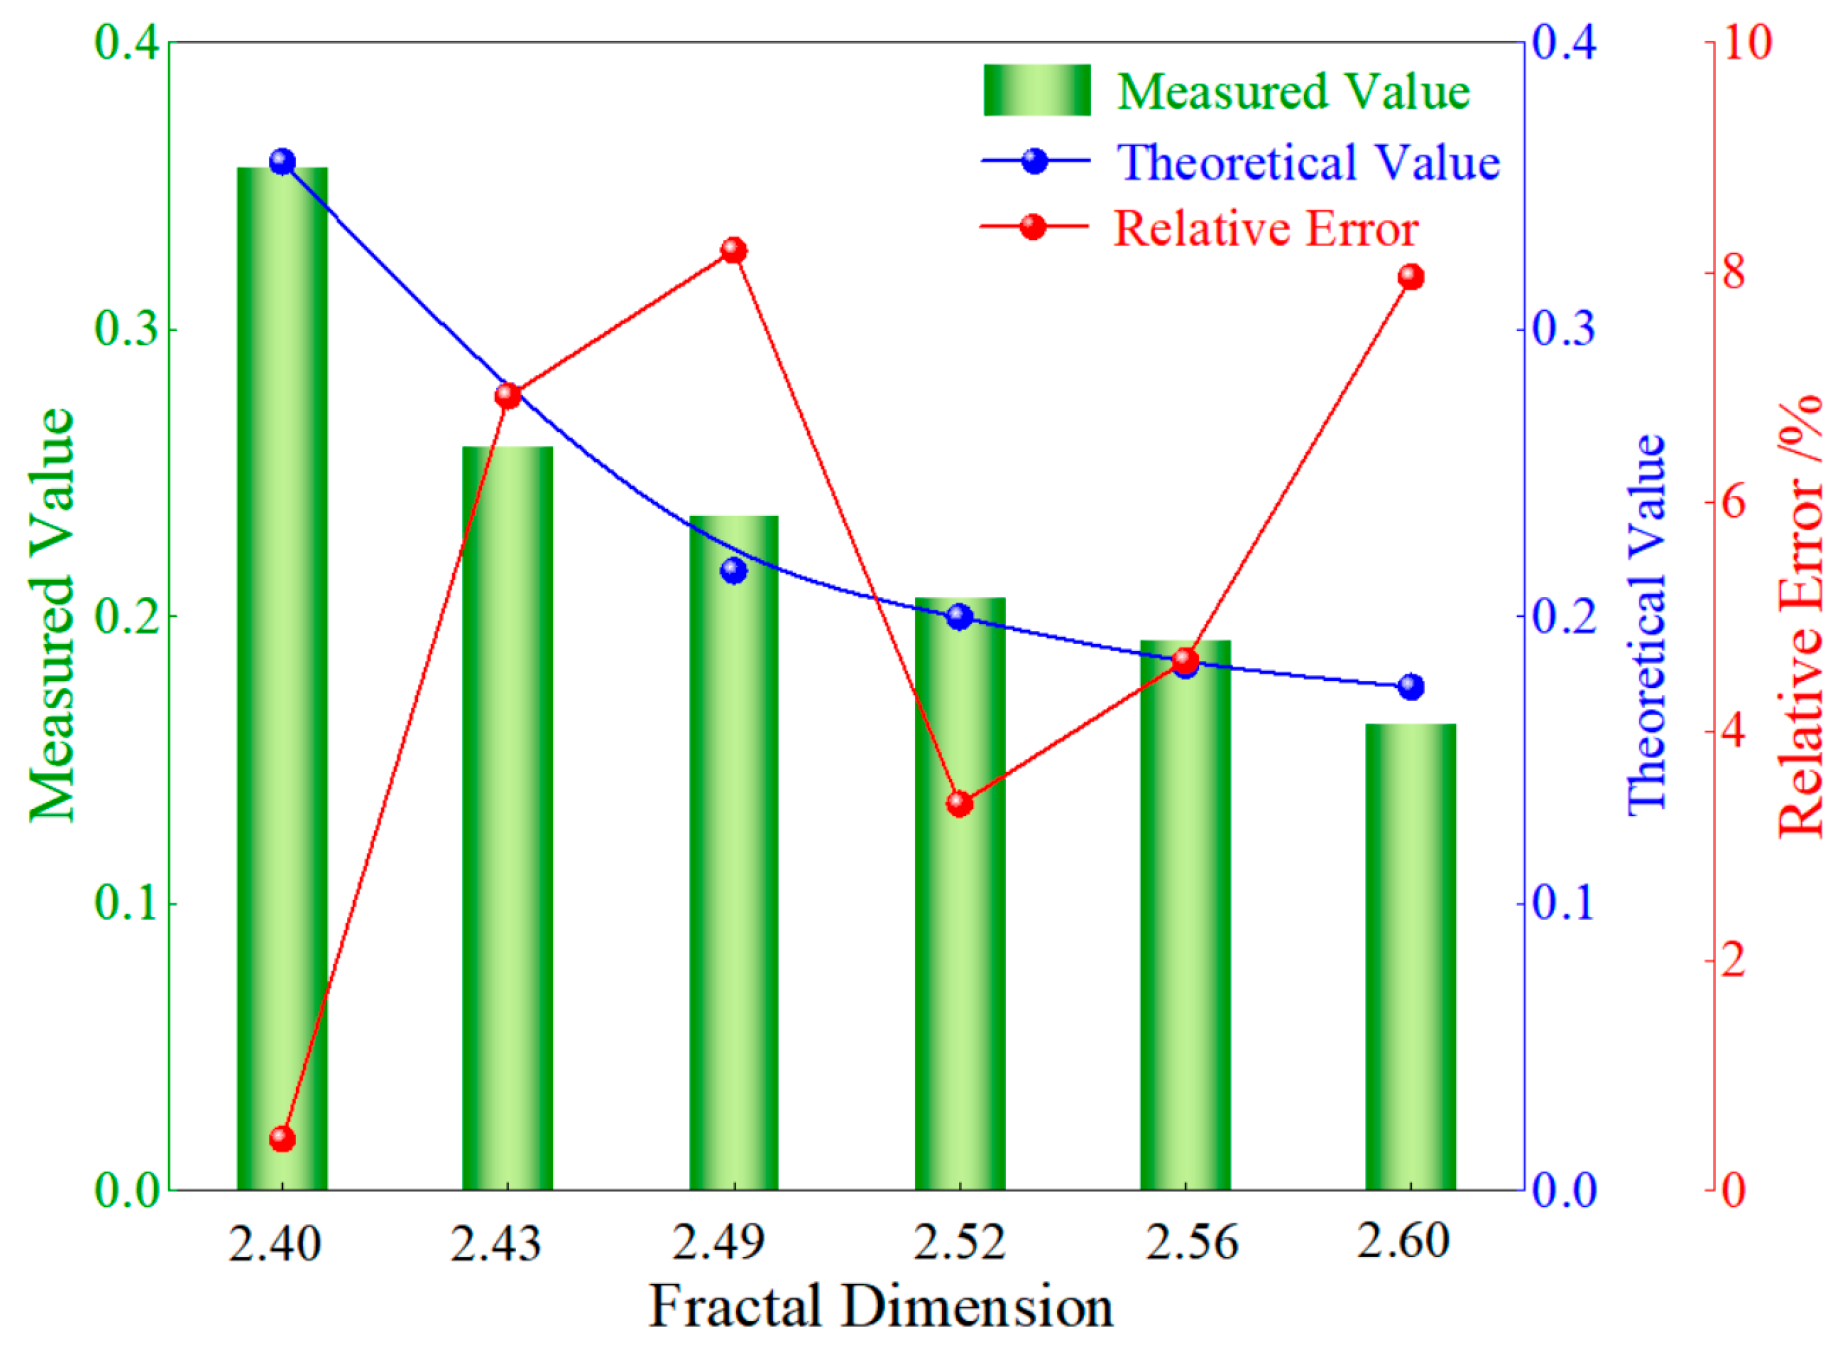
The variation pattern of the void ratio in crushed rocks under different fractal dimensions is shown in Figure 12. As shown in the figure, the void ratio of the crushed rocks continuously decreases as the fractal dimension increases, and the trend of the measured values agrees well with that of the theoretical values. Under different fractal dimensions, the theoretical values of the void ratio are 0.359, 0.277, 0.216, 0.200, 0.183, and 0.176, respectively. The relative errors between the measured and theoretical values are 0.45%, 6.92%, 8.19%, 3.37%, 4.62%, and 7.96%, respectively, with a maximum error of only 8.19%. These small deviations demonstrate the rationality of Equations (5) and (6) within an acceptable error margin, and also confirm the validity of the void ratio–fractal model represented by Equation (8). The relative errors between the theoretical and experimental values are primarily attributed to the irregular shapes of the rock particles in the fractal statistics and the variations during the sieving process. Additionally, the correlation coefficient (fitting accuracy) in the fitting of Equations (6) and (7) is also an important factor contributing to the relative errors.

5. Conclusions

This study investigated crushed rocks with different Talbot indexes. Utilizing a confined compression apparatus, creep compression tests were conducted. The effects of axial stress and Talbot index on the variations in axial displacement, void ratio, fractal dimension, and fragmentation amount during the creep compression of crushed rocks were analyzed. A theoretical model correlating void ratio and fractal dimension for crushed rocks was established. The main conclusions are as follows:
(1)
The axial displacement and void ratio changes during the creep compression of crushed rocks exhibit distinct three-stage characteristics. The axial displacement change can be divided into a rapid instantaneous deformation stage, a decelerating creep deformation stage, and a stable creep deformation stage. These correspond, respectively, to three stages in void ratio change: a sharp decrease, a gradual decrease, and stabilization. Both instantaneous and creep displacements increase with higher Talbot index and axial stress, whereas instantaneous and creep void ratios decrease as the Talbot index and axial stress increase.
(2)
The axial displacement, void ratio, fractal dimension, and fragmentation amount of crushed rocks are significantly influenced by axial stress and the Talbot index. Under the same Talbot index, axial displacement, fractal dimension, and fragmentation amount exhibit a positive correlation with axial stress, while void ratio shows a negative correlation. Under the same axial stress, axial displacement and fragmentation amount are positively correlated with the Talbot index, whereas void ratio and fractal dimension are negatively correlated with it.
(3)
Based on the creep compression tests, the relationship between void ratio and fractal dimension before and after compression was clarified. A theoretical void ratio-fractal dimension model was established. A comparison between the theoretical values from the model and the actual measured values was conducted for verification. The maximum error of the established model was 0.0819. This model reveals the intrinsic connection between the evolution of the void structure and the fractal dimension of rocks during the compression of crushed rock.

Author Contributions

Conceptualization, Y.T. and P.J.; methodology, Y.T. and P.J.; software, S.P.; formal analysis, Y.T. and M.Z.; writing—original draft preparation, Y.T.; funding acquisition, J.Z. All authors have read and agreed to the published version of the manuscript.

Funding

This research was supported by Natural Science Basic Research Program of Shaanxi Province (Nos. 2025JC-YBQN-695) and Natural Science Foundation of Shaanxi Provincial Department of Education (Nos. 24JK0381).

Data Availability Statement

The original contributions presented in this study are included in the article, further inquiries can be directed to the corresponding authors.

Conflicts of Interest

The authors declare no conflict of interest.

References

  1. Liang, X.; Li, W.; Cheng, G.; Wu, Z.; Li, P. Research on the Compaction Characteristics of Cement-Stabilized Soil Under Different Compaction Energies. Buildings 2025, 15, 3132. [Google Scholar] [CrossRef]
  2. Fu, H.; Guo, K.; Wu, Z.; Mai, R.; Chin, C.; Ma, C. Experimental Investigation of a Novel CFRP-Steel Composite Tube-Confined Seawater-Sea Sand Concrete Intermediate Long Column. Int. J. Integr. Eng. 2024, 16, 466–475. [Google Scholar] [CrossRef]
  3. Wu, X.; Ouyang, X.; Tian, J.; Zheng, Y.; Fu, H.; Yuan, J.; Wang, W.; Zuo, Y. Experimental study on mechanical and self-sensing properties of intelligence-function cement-based composite beams under marine erosion environment. Structures 2025, 76, 108950. [Google Scholar] [CrossRef]
  4. Fu, H.; Tian, J.; Chin, C.; Liu, H.; Yuan, J.; Tang, S.; Mai, R.; Wu, X. Axial compression behavior of GFRP-steel composite tube confined seawater sea-sand concrete intermediate long columns. Eng. Struct. 2025, 333, 120157. [Google Scholar] [CrossRef]
  5. Fu, H.; Tian, J.; Chen, S.; Chin, C.; Ma, C. Axial compressive performance of CFRP-steel composite tube confined seawater sea-sand concrete intermediate slender columns. Constr. Build. Mater. 2024, 441, 137399. [Google Scholar] [CrossRef]
  6. Ma, T.; Zou, Q.; Ran, Q.; Kong, F. Compaction and re-crushing characteristics of sandstone granules with different gradations under cyclic loading. Adv. Powder Technol. 2024, 35, 104611. [Google Scholar] [CrossRef]
  7. Ma, T.; Zou, Q.; Chen, J.; Kong, F.; Ran, Q.; Wang, P. Multi-stage evolution characteristics and particle size effect of sandstone granules subjected to cyclic loads. Eng. Fract. Mech. 2024, 312, 110614. [Google Scholar] [CrossRef]
  8. Zhang, C.; Tu, S.; Zhang, L. Analysis of broken coal permeability evolution under cyclic loading and unloading conditions by the model based on the hertz contact deformation principle. Transp. Porous Media 2017, 119, 739–754. [Google Scholar] [CrossRef]
  9. Feng, G.; Fu, Z.; Li, Z.; Qi, T.; Zhao, J.; Fan, W.; Yang, P.; Yang, X.; Yu, Y.; Zhang, H.; et al. Effect of Particle Size on Re-Crushing Characteristics of Crushed Coal during Axial Loading. Powder Technol. 2022, 407, 117675. [Google Scholar] [CrossRef]
  10. Feng, G.; Zhao, J.; Wang, H.; Li, Z.; Fang, Z.; Fan, W.; Yang, P.; Yang, X. Study of the Internal Re-Breaking Characteristics of Broken Limestone during Compression. Powder Technol. 2022, 396, 449–455. [Google Scholar] [CrossRef]
  11. Li, J.; Huang, Y.; Qi, W.; Kong, G.; Song, T. Loose gangues backfill body’s acoustic emissions rules during compaction test: Based on solid backfill mining. Comput. Model. Eng. Sci. 2018, 115, 85–103. [Google Scholar]
  12. Li, J.; Huang, Y.; Zhai, W.; Li, Y.; Yang, S.; Gao, H.; Li, W.; Ma, K.; Wu, L. Experimental Study on Acoustic Emission of Confined Compression of Crushed Gangue under Different Loading Rates: Disposal of Gangue Solid Waste. Sustainability 2020, 12, 3911. [Google Scholar] [CrossRef]
  13. Fan, L.; Liu, S. A conceptual model to characterize and model compaction behavior and permeability evolution of broken rock mass in coal mine gobs. Int. J. Coal Geol. 2017, 172, 60–70. [Google Scholar] [CrossRef]
  14. Hu, S.; Guan, S.; Feng, G.; Li, G.; Han, D.; Guo, H. Numerical simulations of the void distribution characteristics of crushed rock masses in mine gobs. Adv. Powder Technol. 2020, 31, 3928–3936. [Google Scholar] [CrossRef]
  15. Yadav, A.; Behera, B.; Sahoo, S.K.; Singh, G.S.P.; Sharma, S.K. An approach for numerical modeling of gob compaction process in longwall mining. Min. Metall. Explor. 2020, 37, 631–649. [Google Scholar] [CrossRef]
  16. Zhang, C.; Liu, J.; Zhao, Y.; Han, P.; Zhang, L. Numerical simulation of broken coal strength influence on compaction characteristics in goaf. Nat. Resour. Res. 2020, 29, 2495–2511. [Google Scholar] [CrossRef]
  17. Yuan, F.; Tang, J.; Wang, Y.; Li, C.; Kong, L. Numerical simulation of mechanical characteristics in longwall goaf materials. Min. Metall. Explor. 2022, 39, 557–571. [Google Scholar] [CrossRef]
  18. Wang, Y.; Li, C.; Hu, Y. 3D image visualization of meso-structural changes in a bimsoil under uniaxial compression using X-ray computed tomography (CT). Eng. Geol. 2019, 248, 61–69. [Google Scholar] [CrossRef]
  19. Zhang, J.; Li, M.; Liu, Z.; Zhou, N. Fractal characteristics of crushed particles of coal gangue under compaction. Powder Technol. 2017, 305, 12–18. [Google Scholar] [CrossRef]
  20. Zhou, N.; Han, X.; Zhang, J.; Li, M. Compressive deformation and energy dissipation of crushed coal gangue. Powder Technol. 2016, 297, 220–228. [Google Scholar] [CrossRef]
  21. Zhang, P.; Zhang, Y.; Zhao, T.; Tan, Y.; Yu, F. Experimental research on deformation characteristics of waste-rock material in underground backfill mining. Minerals 2019, 9, 102. [Google Scholar] [CrossRef]
  22. Li, M.; Zhang, J.; Zhou, N.; Huang, Y. Effect of particle size on the energy evolution of crushed waste rock in coal mines. Rock Mech. Rock Eng. 2017, 50, 1347–1354. [Google Scholar] [CrossRef]
  23. Li, B.; Liang, Y.; Zhang, L.; Zou, Q. Breakage law and fractal characteristics of broken coal and rock masses with different mixing ratios during compaction. Energy Sci. Eng. 2019, 7, 1000–1015. [Google Scholar] [CrossRef]
  24. Zhang, T.; Liu, N.; Pang, M.; Zhang, X.; Guo, Y.; Zhang, S. Study on re-crushing characteristics of graded broken coal and rock mass during compaction. J. Min. Saf. Eng. 2021, 38, 380–387. [Google Scholar]
  25. Tian, Y.; Lin, H.; Li, S.; Shuang, H.; Ji, P.; Xu, P.; Liu, S.; Zhi, M. Study on Fractal Characteristics of Compaction Deformation and Recrushing of Graded Crushed Rock Masses under Compression. J. Energy Eng. 2025, 151, 04025054. [Google Scholar] [CrossRef]
  26. Tian, Y.; Lin, H.; Li, S.; Shuang, H.; Xu, P.; Liu, S.; Ji, P.; Cui, M. Compression Deformation and Energy Dissipation Characteristics of Crushed Rock Mass Under Lateral Constraint. Coal Geol. Explor. 2025, 53, 151–160. [Google Scholar]
  27. Xu, J.; Liu, S.; Wang, H.; Zhou, N.; Zhang, Y. Experimental study on permeability characteristics of compacted backfill Body after gangue grouting and backfilling in the mining space. Appl. Sci. 2024, 14, 6045. [Google Scholar] [CrossRef]
  28. Zhang, Y.; Zhou, W.; Li, M.; Chen, Z. Experimental study on compression deformation and permeability characteristics of grading broken gangue under stress. Processes 2018, 6, 257. [Google Scholar] [CrossRef]
  29. Ma, D.; Miao, X.; Wu, Y.; Bai, H.; Wang, J.; Rezania, M.; Huang, Y.; Qian, H. Seepage properties of crushed coal particles. J. Pet. Sci. Eng. 2016, 146, 297–307. [Google Scholar] [CrossRef]
  30. Ma, D.; Bai, H.; Chen, Z.; Pu, H. Effect of particle mixture on seepage properties of crushed mudstone. Transp. Porous Media. 2015, 108, 257–277. [Google Scholar] [CrossRef]
  31. Li, S.; Zhang, Q.; Chen, Z. Experimental study of compaction creep model of broken rock. J. Min. World Express 2013, 2, 76–81. [Google Scholar]
  32. Li, M.; Zhang, J.; Gao, R. Mechanical analysis of roof subsidence based on rheological properties of solid backfill materials. Teh. Vjesn. 2018, 25, 152–157. [Google Scholar]
  33. Li, M.; Zhang, J.; Meng, G.; Gao, Y.; Li, A. Testing and modelling creep compression of waste rocks for backfill with different lithologies. Int. J. Rock Mech. Min. Sci. 2020, 125, 104170. [Google Scholar] [CrossRef]
  34. Zhao, L.; Gan, H.; Tang, W.; Zhou, H. Applicability Analysis of Chen’s Method in the Research of TATB-based PBX Creep Behavior. Chin. J. Energetic Mater. 2018, 26, 608–613. [Google Scholar]
  35. Hardin, B.O. Crushing of soil particles. J. Geotech. Eng. 1985, 111, 1177–1192. [Google Scholar] [CrossRef]
  36. Yu, B.; Chen, Z.; Wu, J.; Li, Q.; Ding, Q. Experimental study of compaction and fractal properties of grain size distribution of saturated crushed mudstone with different gradations. Rock Soil Mech. 2013, 5, 1887–1894. [Google Scholar]
Figure 1. Schematic diagram of the experimental system.
Buildings 16 00116 g001
Figure 2. Sample preparation and testing process.
Buildings 16 00116 g002
Figure 3. Displacement-time curve. (a) Overall time-history curve; (b) Stepped time-history curve.
Buildings 16 00116 g003
Figure 4. Creep compression curves of crushed rock with different Talbot indices. (a) n = 0.2; (b) n = 0.4; (c) n = 0.6; (d) n = 0.8.
Buildings 16 00116 g004
Figure 5. Variation in creep rate with the Talbot index.
Buildings 16 00116 g005
Figure 6. Void ratio versus Talbot index during creep compression. (a) n = 0.2; (b) n = 0.4; (c) n = 0.6; (d) n = 0.8.
Buildings 16 00116 g006
Figure 7. Mass variation in crushed rocks during creep compression. (a) Talbot Index; (b) Axial Stress.
Buildings 16 00116 g007
Figure 8. Schematic diagram of the defined area for fragmentation amount.
Buildings 16 00116 g008
Figure 9. Variation in fragmentation amount in crushed rocks during creep compression. (a) Talbot Index; (b) Axial Stress.
Buildings 16 00116 g009
Figure 10. Variation in fractal dimension in crushed rocks during creep compression. (a) Talbot Index; (b) Axial Stress.
Buildings 16 00116 g010
Figure 11. Variation in axial displacement and void ratio under different axial stresses.
Buildings 16 00116 g011
Figure 12. Relationship between void ratio and fractal dimension.
Buildings 16 00116 g012
Table 1. Particle mass distribution across different size ranges under various Talbot indexes.
Talbot IndexMass Percentage/%
0~4 mm4~8 mm8~12 mm12~16 mm16~20 mm
0.272.4810.787.035.354.36
0.452.5316.7812.219.948.54
0.638.0719.6415.9013.8612.53
0.827.5920.4518.4117.2016.35
Table 2. Test Parameters.
SampleTalbot IndexAxial Stress/MPaTime/h
10.264
20.4
30.6
40.8
50.624
64
76
88
910
Table 3. Increments of instantaneous and creep displacement of crushed rocks.
Talbot IndexAxial Stress
/MPa
Instantaneous Displacement Increment/mmCreep Displacement Increment/mm
0.2215.081.19
44.371.05
62.390.96
0.4218.381.62
44.681.24
62.591.19
0.6219.791.82
45.861.49
63.291.40
0.8224.042.30
46.411.96
63.781.88
Table 4. Variation in void ratio in crushed rocks under graded loading conditions.
Talbot IndexAxial Stress
/MPa
Instantaneous Void Ratio VariationCreep Void Ratio Variation
0.220.06470.0057
40.02150.0054
60.01240.0052
0.420.07660.0075
40.02320.0079
60.01360.0064
0.620.08010.0077
40.02900.0076
60.01740.0075
0.820.09570.0107
40.03150.0102
60.02530.0111
Disclaimer/Publisher’s Note: The statements, opinions and data contained in all publications are solely those of the individual author(s) and contributor(s) and not of MDPI and/or the editor(s). MDPI and/or the editor(s) disclaim responsibility for any injury to people or property resulting from any ideas, methods, instructions or products referred to in the content.