Article

Drivers for the Acceptance of Green Housing Insurance from the Perspective of House Owners

1
School of Management, Chongqing University of Science and Technology, Chongqing 401331, China
2
School of Civil and Hydraulic Engineering, Chongqing University of Science and Technology, Chongqing 401331, China
3
School of Engineering, RMIT University, Melbourne, VIC 3000, Australia
*
Author to whom correspondence should be addressed.
Buildings 2025, 15(8), 1241; https://doi.org/10.3390/buildings15081241
Submission received: 1 March 2025 / Revised: 29 March 2025 / Accepted: 8 April 2025 / Published: 9 April 2025

Abstract

In recent years, global climate and environmental issues have become prominent, making green housing a major focus. However, during the development of green housing, there is a tendency to prioritize design while neglecting the operation. Meanwhile, house owners’ green rights and interests during the operation stage are not well protected. In response, some countries have promoted green housing insurance. However, this type of insurance remains immature because of insufficient public awareness, a lack of supporting policies, and limited practical application. These challenges result in low acceptance among house owners, hindering the development of green insurance and green housing sector. To address this issue, this study applies the push–pull theory to establish a driver system for house owners’ acceptance of green housing, considering internal push and external pull drivers. Structural equation modeling (SEM) is then used to analyze the mechanisms that drive house owners’ acceptance. The key findings are as follows: (1) drivers in the pull dimension have a stronger impact on acceptance than drivers in the push dimension; and (2) premium subsidies and economic compensation play a crucial role in driving house owners to accept green housing insurance. This study identifies the key drivers and pathways that influence the acceptance of green housing insurance, providing valuable insights for increasing public recognition and acceptance. The findings can contribute to the development of the green housing industry.

1. Introduction

With the growing severity of global climate change and environmental challenges, green housing has received broad attention as a critical component of sustainable development [1]. Green housing not only refers to the excellent environmental performance of the structure itself but also involves the green transformation of the socioeconomic system and the construction of ecological civilization [2]. However, in recent years, government policies have mainly focused on the design and construction of green housing, while there is a lack of practical experience and effective strategies to address the challenges that arise during the operation stage [3]. In addition, house owners’ green rights and interests during the operation stage are not well protected. Therefore, there is an urgent need for practical measures to support the development of the green housing sector.
Based on the Two Mountains Theory, a Chinese ecological philosophy that equates “lush mountains and clear waters” representing green development with “gold and silver mountains” symbolizing economic development as interdependent goals [4], the Chinese government actively promotes green financial products, including green building insurance. Green building insurance covers risks related to the design, construction, operation, performance, quality, and safety of green buildings, ultra-low-energy buildings, and fabricated buildings [5]. It also includes accidental injury and short-term health insurance for personnel involved in green building projects [5]. In this study, green buildings specifically refer to housing. Therefore, green building insurance is also called green housing insurance. As a financial instrument, green housing insurance can mitigate potential risks during the operation stage and support the efficient operation of green housing. It also provides significant advantages to various stakeholders in the green housing insurance ecosystem. From the government’s perspective, green housing insurance promotes the implementation of the Two Mountains Theory, supports green building development targets, and enhances sustainable governance [6]. For house owners, it ensures the long-term green performance of their housing, reducing financial losses associated with green housing [7]. Meanwhile, for insurance companies, it offers opportunities to enter the green housing insurance market and expand premium income sources [8].
Currently, there is no international standard for major purchasers of green housing insurance [9]. Some researchers have studied the purchase models of green housing insurance, while developers are considered the primary buyers in these researches [5,7]. However, the more appropriate undertaker to buy green housing insurance during the operation stage is not developers but house owners due to the long-term performance of green housing closely linked to owners [10]. Meanwhile, green housing insurance remains underdeveloped, especially in developing countries such as China. Both the industry and the general public have limited awareness of it, and only a few projects have adopted it [11]. This lack of awareness weakens house owners’ willingness to purchase insurance, further hindering the long-term development of green housing insurance and the green housing sector. Therefore, it is necessary to explore ways to promote green housing insurance from the perspective of house owners. The development of green housing in other countries has successively progressed through three stages: energy-efficient housing, ecological housing, and sustainable housing. Architect Paola Soleri first introduced the concept of ecological housing in a research report in 1969 [12]. Later, Ian Lennox McHarg, the founder of the Department of Landscape Architecture and Regional Planning at the University of Pennsylvania, refined the concept by applying ecological principles [13]. With continuous research and technological advancements, green housing has evolved beyond simply energy conservation and continues to advance towards harmonious coexistence with the natural environment [14]. Over time, green housing has gradually developed into an industrial cluster integrating ecology, safety, and energy conservation.
At the beginning of the 21st century, the Housing Industrialization Promotion Center of China’s Ministry of Housing and Urban–Rural Development stated that further progress in green housing and related industries would aim to achieve a balance between the environmental, ecological, social, and economic benefits of green housing [15]. Hu et al. [16] defined green insurance as an institutional insurance arrangement designed to support environmental improvement, climate change adaptation, and resource efficiency in the transition to green development, with a focus on energy conservation and environmental protection. Zona et al. [17] further highlighted that green housing insurance covers renewable energy, green materials, and post-construction coverage losses, providing essential support for the sustainable development of green housing.
Currently, few studies on green housing insurance have explored the insurance of the operation stage, and fewer studies have explored the mechanisms influencing house owners’ acceptance of green housing insurance. Therefore, this study explores the factors affecting house owners’ acceptance of green housing insurance based on the push–pull theory. It analyzes these factors and their functioning mechanisms from push and pull perspectives [18]. In addition, this study investigates effective measures to drive house owners to accept and purchase green housing insurance from multiple perspectives. The goal is to address the challenge of green performance maintenance during the operation stage.
The contributions of this study are described as follows. Firstly, this study focuses on green housing insurance which is an emerging topic with limited research. This study provides new insights for both the theory and practice of green building. Secondly, this study differs in the research scope. Previous studies have mostly focused on the design stage of green housing while paying little attention to the operation stage [3]. In contrast, this study places its core emphasis on the operation stage of green housing and contributes to bridging the existing research gap in this field. Thirdly, this study adopts a unique perspective by focusing on house owners. Based on the push–pull theory, it analyzes both the internal and external factors that influence house owners’ acceptance of green housing insurance. Therefore, this study could improve public recognition and acceptance of green housing insurance, and contribute to the development of green housing insurance. As the insurance develops, it will promote sustainable and stable development of green housing and green buildings throughout their life cycle, ultimately improving people’s quality of life.

2. Understanding the Acceptance of Green Housing Insurance Based on the Push–Pull Theory

2.1. The Influence of the Push–Pull Theory on Acceptance

The acceptance of green housing insurance is a decision made by house owners. There are many factors that influence people’s behaviors, including psychological, environmental, sociocultural, and cognitive factors [19]. These factors are complex and diverse, with varying degrees of influence, making it difficult to control effectively. However, the push–pull theory can solve these challenges.
The push–pull theory originated from the research of British scholar E. G. Ravenstein in the 1880s, who used drivers to study population migration and mobility [20]. In the 1950s, Tolman further classified the drivers of human behavior into internal emotional factors (push) and external cognitive factors (pull) [21]. The push–pull theory is useful for analyzing house owners’ acceptance of green housing insurance, because it integrates internal emotional and external cognitive drivers. This approach considers various key elements such as psychological, social, and environmental factors that influence house owners’ decision-making [22]. Through this integration, the theory can clearly organize complex influencing factors and construct an effective framework for analyzing behaviors.
According to the push–pull theory, the push drivers mainly stem from internal emotional drivers, which are directly related to an individual’s psychological condition and thus influence specific behavior. These drivers range from basic physiological needs to complex psychological needs, working together to shape an individual’s behavior toward a specific goal. Therefore, drivers that can fulfill house owners’ physiological and psychological needs might drive them to accept green housing insurance.
The pull drivers mainly come from external cognitive drivers, including rewards or punishments, social expectations or pressures, and material or monetary incentives [23]. These drivers are all stimulated by the external environment and external forces, contrasting with internal drivers. They influence an individual’s behavior by providing rewards, punishments, or other incentives. Therefore, changes in the external environment might encourage house owners to accept green housing insurance.
In conclusion, through a systematic analysis of the internal push drivers and external pull drivers, the push–pull theory effectively explains the driving mechanism behind house owners’ acceptance of green housing insurance, demonstrating its applicability and explanatory power. This understanding not only clarifies the decision-making process of house owners but also provides a scientific foundation for formulating targeted strategies to encourage people to accept insurance.

2.2. Drivers of the Acceptance of Green Housing Insurance in the Push Dimension

2.2.1. Drivers from Green Housing Characteristics

According to the push–pull theory, purchasing green housing insurance can be encouraged by strengthening the internal influences from push dimension. These influences may come from internal emotional drivers, which must fulfill house owners’ desired physiological and psychological needs. Green housing refers to homes built with sustainable materials and technologies to minimize environmental impacts, while providing a healthy and comfortable living environment for house owners [24]. Thus, the green characteristics of green housing can provide a better living experience, effectively satisfying house owners’ physiological and psychological needs.
To understand the characteristics of green housing, one can refer to the official assessment standard for green buildings issued by the Chinese government in 2019 [25]. According to this standard, green buildings are evaluated from five aspects: safety and durability, health and comfort, environmental livability, living convenience, and resource conservation. In addition, previous research on green housing safety [26] suggests that the safety of green housing extends beyond traditional building structures and components. It also includes health-related and psychological safety, which enhances residents’ overall comfort and well-being. Considering both perspectives, this study combines the first two characteristics from the standard into one category, referred to as the health and safety driver. This category includes the basic structural safety of housing buildings as well as the psychological and physiological safety of the house owners. Meanwhile, the remaining three characteristics remain unchanged. First, the environmental livability driver refers to the outdoor environment of green housing, including the ecological, landscaped, and physical environment. Living convenience driver refers to the house owners’ daily mobility, well-equipped community service facilities, intelligent service systems, and standardized property management services. Resource conservation driver highlights the cost-saving benefits for house owners by reducing water, energy, electricity, and material consumption in daily lives.
In summary, the drivers of green housing characteristics can be categorized into four factors: health and safety, environmental livability, living convenience, and resource conservation.

2.2.2. Drivers from Insurance Function

Insurance serves key functions, such as risk management, that can satisfy house owners’ desired physiological and psychological needs. Some researchers have explored the function of insurance. Yang et al. [5] studied its economic compensation function and found that if issues arise with the quality of the insured person’s green housing or if their rights and benefits associated with green performance are not protected, the insurance provider provides fair economic compensation. Tong [27] explored its risk management function and found that insurance providers not only cover risks but also monitor and minimize potential risks. Alabady and Abu Ghazaleh [28] demonstrated that the order maintenance process carried out by insurance agencies could effectively compensate for insured losses, reduce liability disputes, and ultimately foster harmony.
On the whole, the drivers from the insurance function can be divided into three factors: economic compensation, risk management, and order maintenance.

2.3. Drivers of the Acceptance of Green Housing Insurance in the Pull Dimension

2.3.1. Drivers from Policy Incentives

According to the push–pull theory, house owners’ acceptance of green housing insurance can be increased by strengthening the external influences from the pull dimension. Policy incentives are one type of influence that might drive house owners to accept green housing insurance.
The operations of green housing and insurance rates tend to fluctuate. To maintain financial equilibrium in the green housing insurance industry, financial authorities should provide premium subsidies to help house owners cover parts of the cost. This measure can alleviate the imbalance between supply and demand, making green housing insurance more accessible [29]. Furthermore, government policies play a crucial role in increasing house owners’ acceptance of green housing insurance [30]. Establishing a specialized regulatory institution to monitor the insurance claims process can further enhance trust in the system, ultimately encouraging more house owners to participate [31].
In summary, policy incentives as drivers of green housing insurance can be categorized into three factors: premium subsidies, policies and regulations, and regulatory mechanisms.

2.3.2. Drivers from Social Stimulation

In the pull dimensions, the drivers influencing house owners’ acceptance of green housing insurance can be explored through public awareness and public opinion atmosphere. Currently, green housing is developing, and with increased publicity and real-life examples, house owners begin to recognize its unique benefits. In addition, there is a growing interest in green housing insurance, since it serves as an important safeguard of the long-term stability of green housing [30]. This increased awareness may increase house owners’ acceptance [30]. Furthermore, public advocacy for house owners to voluntarily accept green housing has generated mixed responses. This public opinion may also influence house owners’ decisions [32].
Above all, the drivers of social stimulation can be classified into two factors: public awareness and public opinion atmosphere.

2.4. The Driver System for the Acceptance of Green Housing Insurance

Building on the in-depth analysis of the push–pull theory and its application to house owners’ acceptance of green housing insurance, as discussed in Section 2.1, Section 2.2 and Section 2.3, this study identifies drivers that influence house owners’ acceptance of green housing insurance. These drivers can be categorized into two dimensions, referred to as first-level drivers: the pull dimension and the push dimension. The pull dimension is further divided into two second-level drivers: policy incentives and social stimulation. Policy incentives have three third-level drivers: premium subsidies, policies and regulations, and regulatory mechanisms. Social stimulation has two third-level drivers: public awareness and public opinion atmosphere. The push dimension is divided into two second-level drivers: green housing characteristics and insurance function. Specifically, the green housing characteristics include four third-level drivers: health and safety, environment livability, living convenience, and resource conservation. Insurance functions include three third-level drivers: economic compensation, risk management, and order maintenance. The complete system of drivers is summarized in Table 1.

3. Methods

Through the push–pull theory analysis, a driver system has been developed from two dimensions: push and pull. However, it is necessary to verify whether each driver has a significant impact on house owners’ acceptance of green housing insurance. If so, the drive path and the extent of the influence must be quantified. Structural equation modeling (SEM) can deal with multiple variables and analyze the relationship pathways and mechanisms of influence between them [33]. In this study, SEM is used to precisely reveal the driving mechanism behind the acceptance of green housing insurance and accurately quantify the degree of influence. The questionnaire survey was designed to collect raw data for SEM analysis.

3.1. Questionnaire Survey for Data Collection

In this study, a questionnaire survey (shown in Appendix A and Appendix B) was used to collect primary data for SEM analysis. The questionnaire survey consisted of two sections. The first section collected respondents’ basic information, including age, education, workplace and years of experience, city of residence, and whether they had lived in green housing. The second section collected data on the perceived importance of each driver influencing house owners and other respondents to accept green housing insurance. A 5-point Likert scale was used to present respondents’ views, where 5 represents ‘very important’, and 1 represents ‘negligible’ [34].
In this study, from the perspective of house owners, green housing owners were the main respondents. The criteria for respondent selection were as follows: (1) respondents should be between 22 and 65 years old, and capable of making independent behavioral judgments; (2) respondents should be familiar with the relevant issues of the green housing they live in during its operation stage. Moreover, some respondents were department directors of insurance companies, department directors of property management companies, staff of local construction authorities, and professionals from other institutions, including design organizations, consultant firms and research institutions. These respondents were required to have at least five years of work experience to ensure sufficient expertise in the field.
The survey was primarily conducted in China’s pilot cities for green housing, where green housing initiatives were introduced earlier. The sample was collected through a large-scale distribution of questionnaires in these cities. To ensure the authenticity and validity of the data, part of the survey was conducted on-site, while others were carried out via telephone, email, or online platforms.
In this study, the sample size was determined according to the analysis model employed. SEM typically requires a sample size of 100–200 [35,36]. A total of 361 questionnaires were distributed, and 297 valid responses were collected, with an effective response rate of 82.27%. The valid sample size was at least 5 times the number of measurement items, meeting the statistical requirements of SEM [37]. Table 2 provides an overview of the survey respondents. It shows that green housing owners comprise 80.81% of the sample, while the remaining 19.19% consist of department directors of insurance companies, department directors of property management companies, staff of local construction authorities, and professionals from other institutions, including design organizations, consultant firms and research institutions.

3.2. Structural Equation Modeling (SEM) for Driver Analysis

SEM is a multivariate statistical analysis tool [38]. Its key advantage is the ability to simultaneously assess relationships between multiple variables. By linking latent variables with observed variables, SEM provides a more accurate evaluation of these relationships and enables model testing, thereby improving the reliability of the analysis results [39].
As previously mentioned, SEM can precisely identify the mechanism of each driver’s influence on the acceptance of green housing insurance and accurately quantify the degree of influence [33]. This study uses SEM to further verify whether these drivers significantly impact house owners’ acceptance of green housing insurance, determine the extent of each driver’s influence, and explore the transmission pathways of these effects [40]. The application of SEM in this study followed a structured process. Firstly, hypotheses were formulated as the foundation for SEM analysis. Then, the data from the questionnaire were used to conduct a preliminary simulation of the model. Finally, the model was tested, and the results were analyzed.

4. Analysis of Drivers

4.1. Reliability and Validity Analysis of Survey Data

4.1.1. Reliability Analysis of Survey Data

In general, when adopting the questionnaire survey for data collection, it is necessary to analyze the reliability of survey data to assess the consistency between variables and their corresponding latent variables, thereby evaluating the magnitude of measurement errors [41]. In this study, reliability analysis was conducted using the ‘Statistical Package for Social Sciences (SPSS 27.0)’ which is a commonly used software in this field [42]. Reliability analysis is typically validated using Cronbach’s alpha [43], with a value greater than 0.8 indicating a high level of reliability [44]. The results of the reliability analysis are shown in Table 3. The Cronbach’s alpha for each variable and the overall questionnaire scale was greater than 0.8, confirming strong internal consistency.

4.1.2. Validity Analysis of Survey Data

Moreover, validity analysis is essential in assessing the correlation between different variables that measure the same latent variable [45]. Similarly, SPSS 27.0 was also used for validity analysis. Validity analysis was commonly performed using Kaiser–Meyer–Olkin (KMO) and Bartlett’s Test of Sphericity [46]. According to the established threshold, a KMO value above 0.5 indicates minimal variation in the correlation. In addition, a high value in Bartlett’s Test of Sphericity, with a significance level below 0.001, indicates a strong correlation among the variables [47]. In this study, the KMO value was 0.859. Bartlett’s Test of Sphericity yielded a value of 1792.29, with a significance level of 0.000. These results indicate that the survey questionnaire utilized in this study has strong validity and confirm a significant correlation among the variables.

4.2. Relationships Confirmation and Driver Analysis

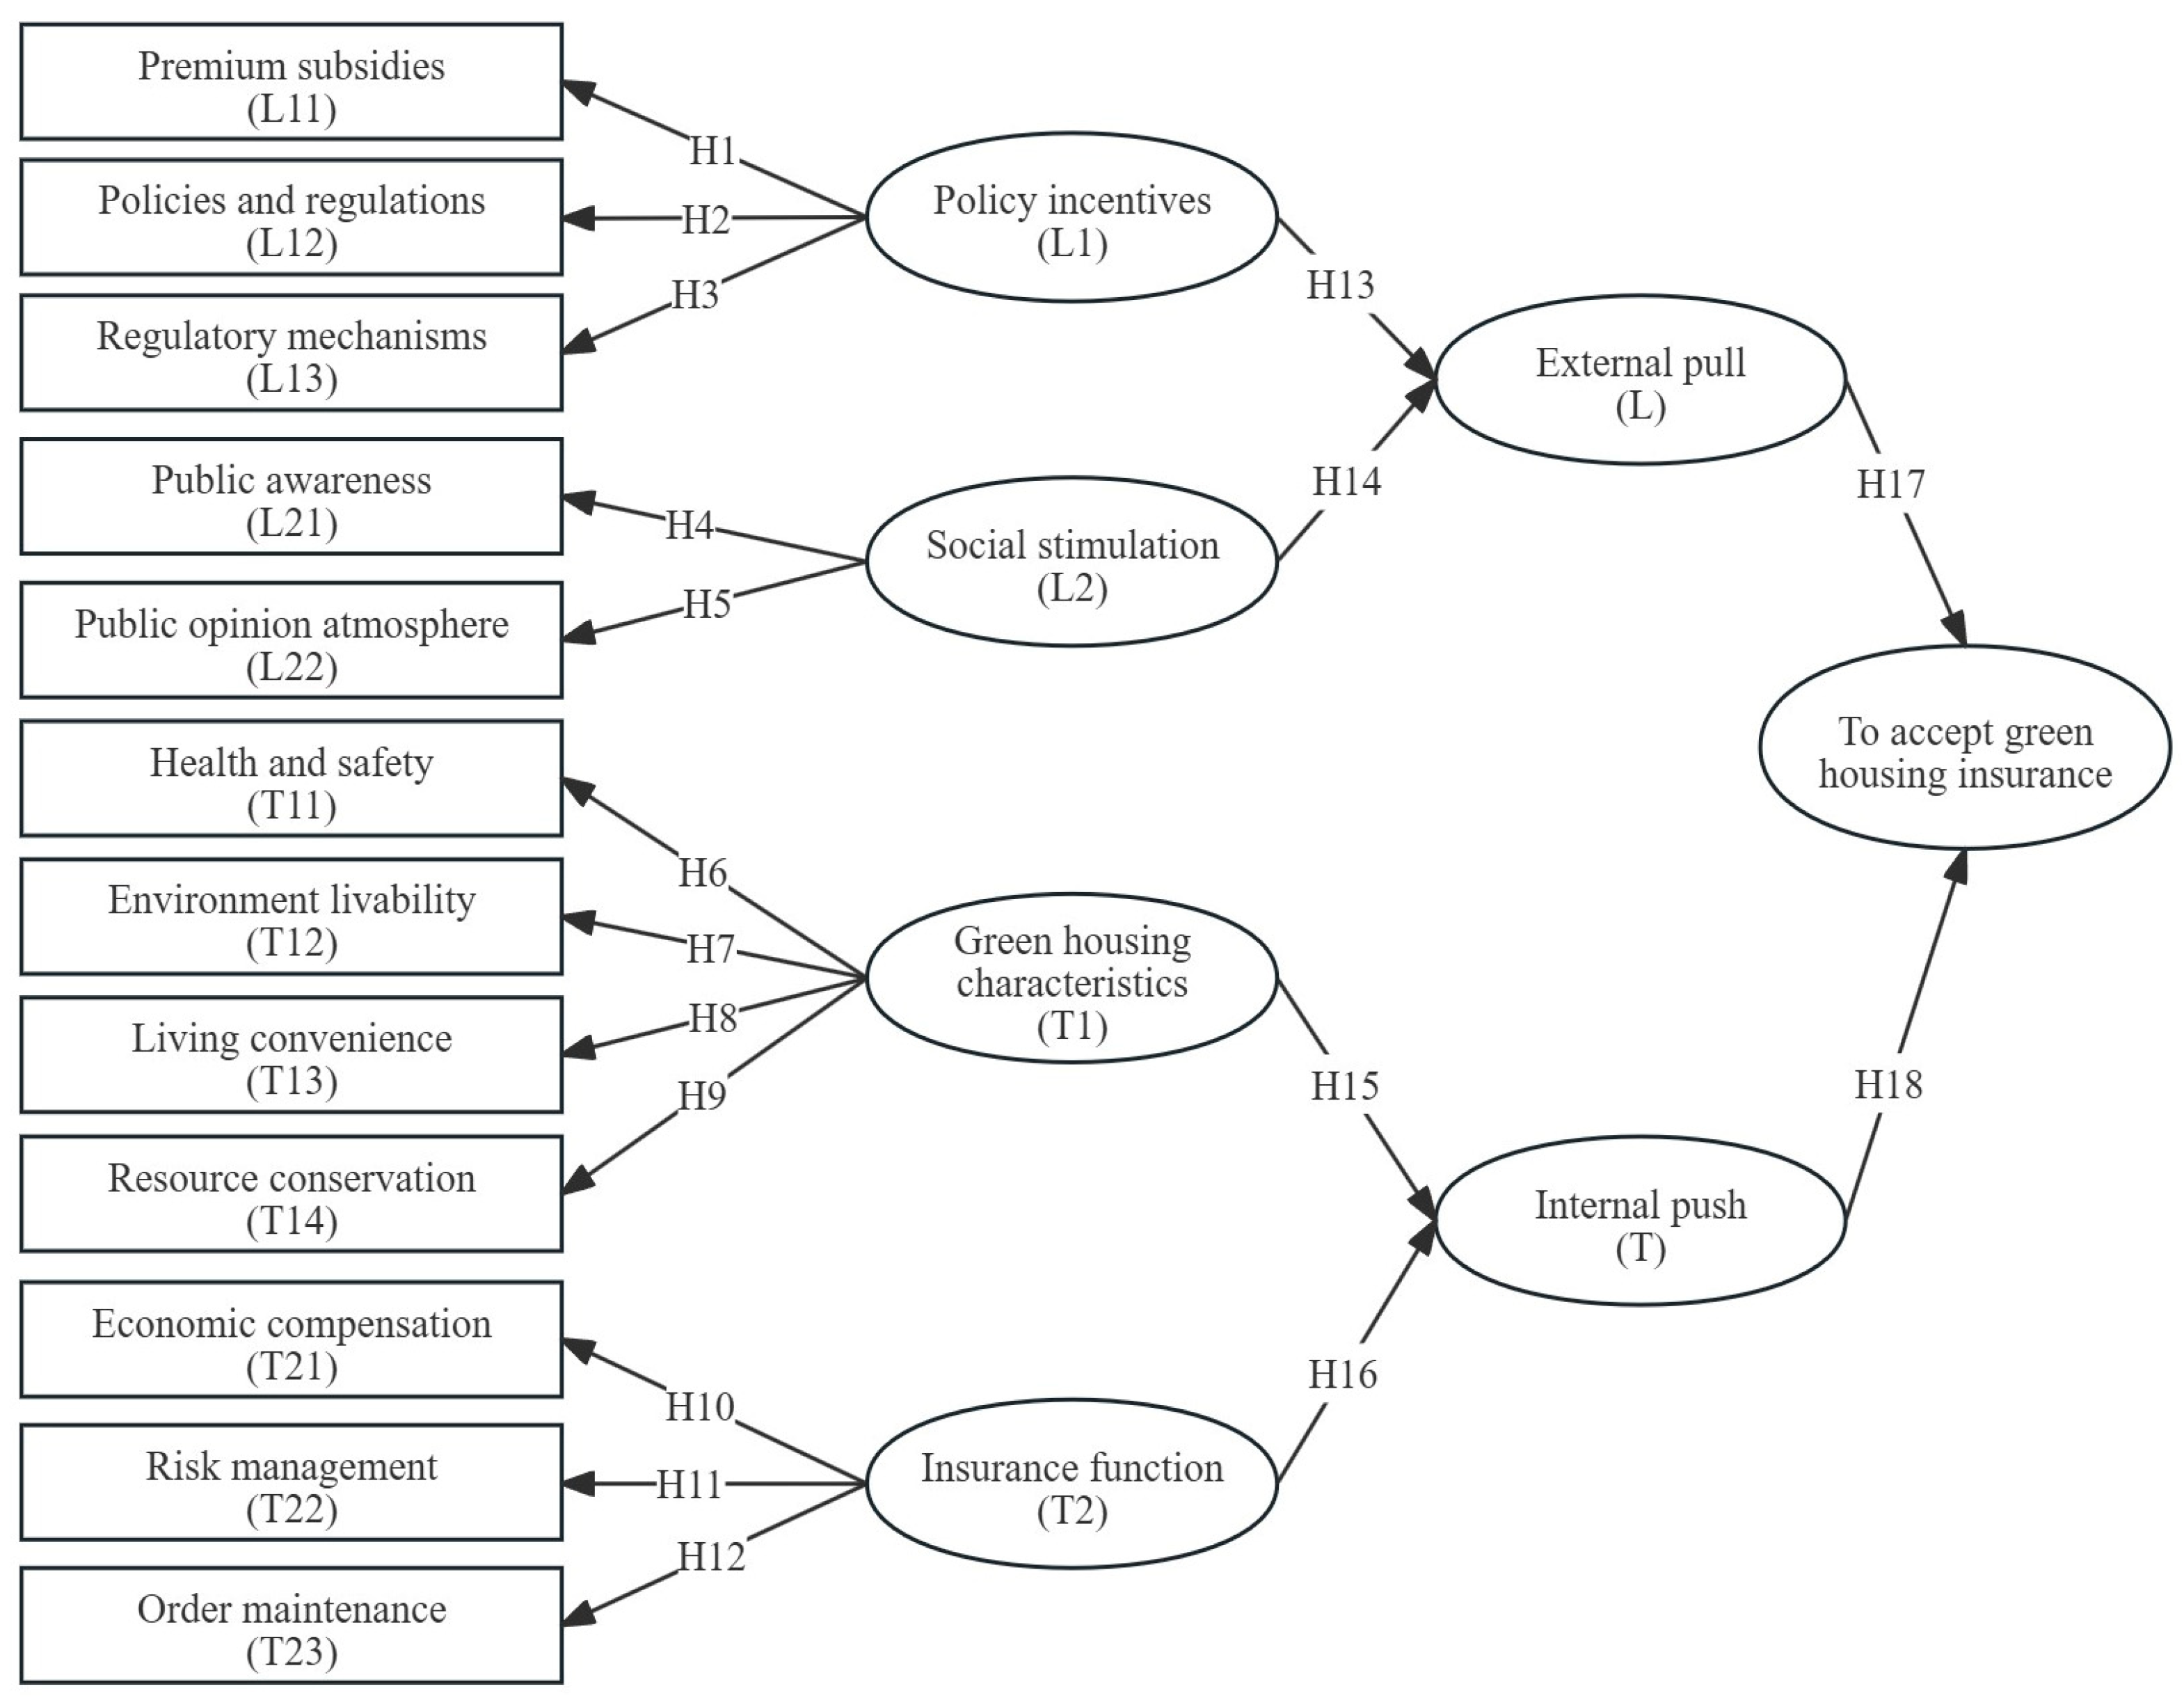
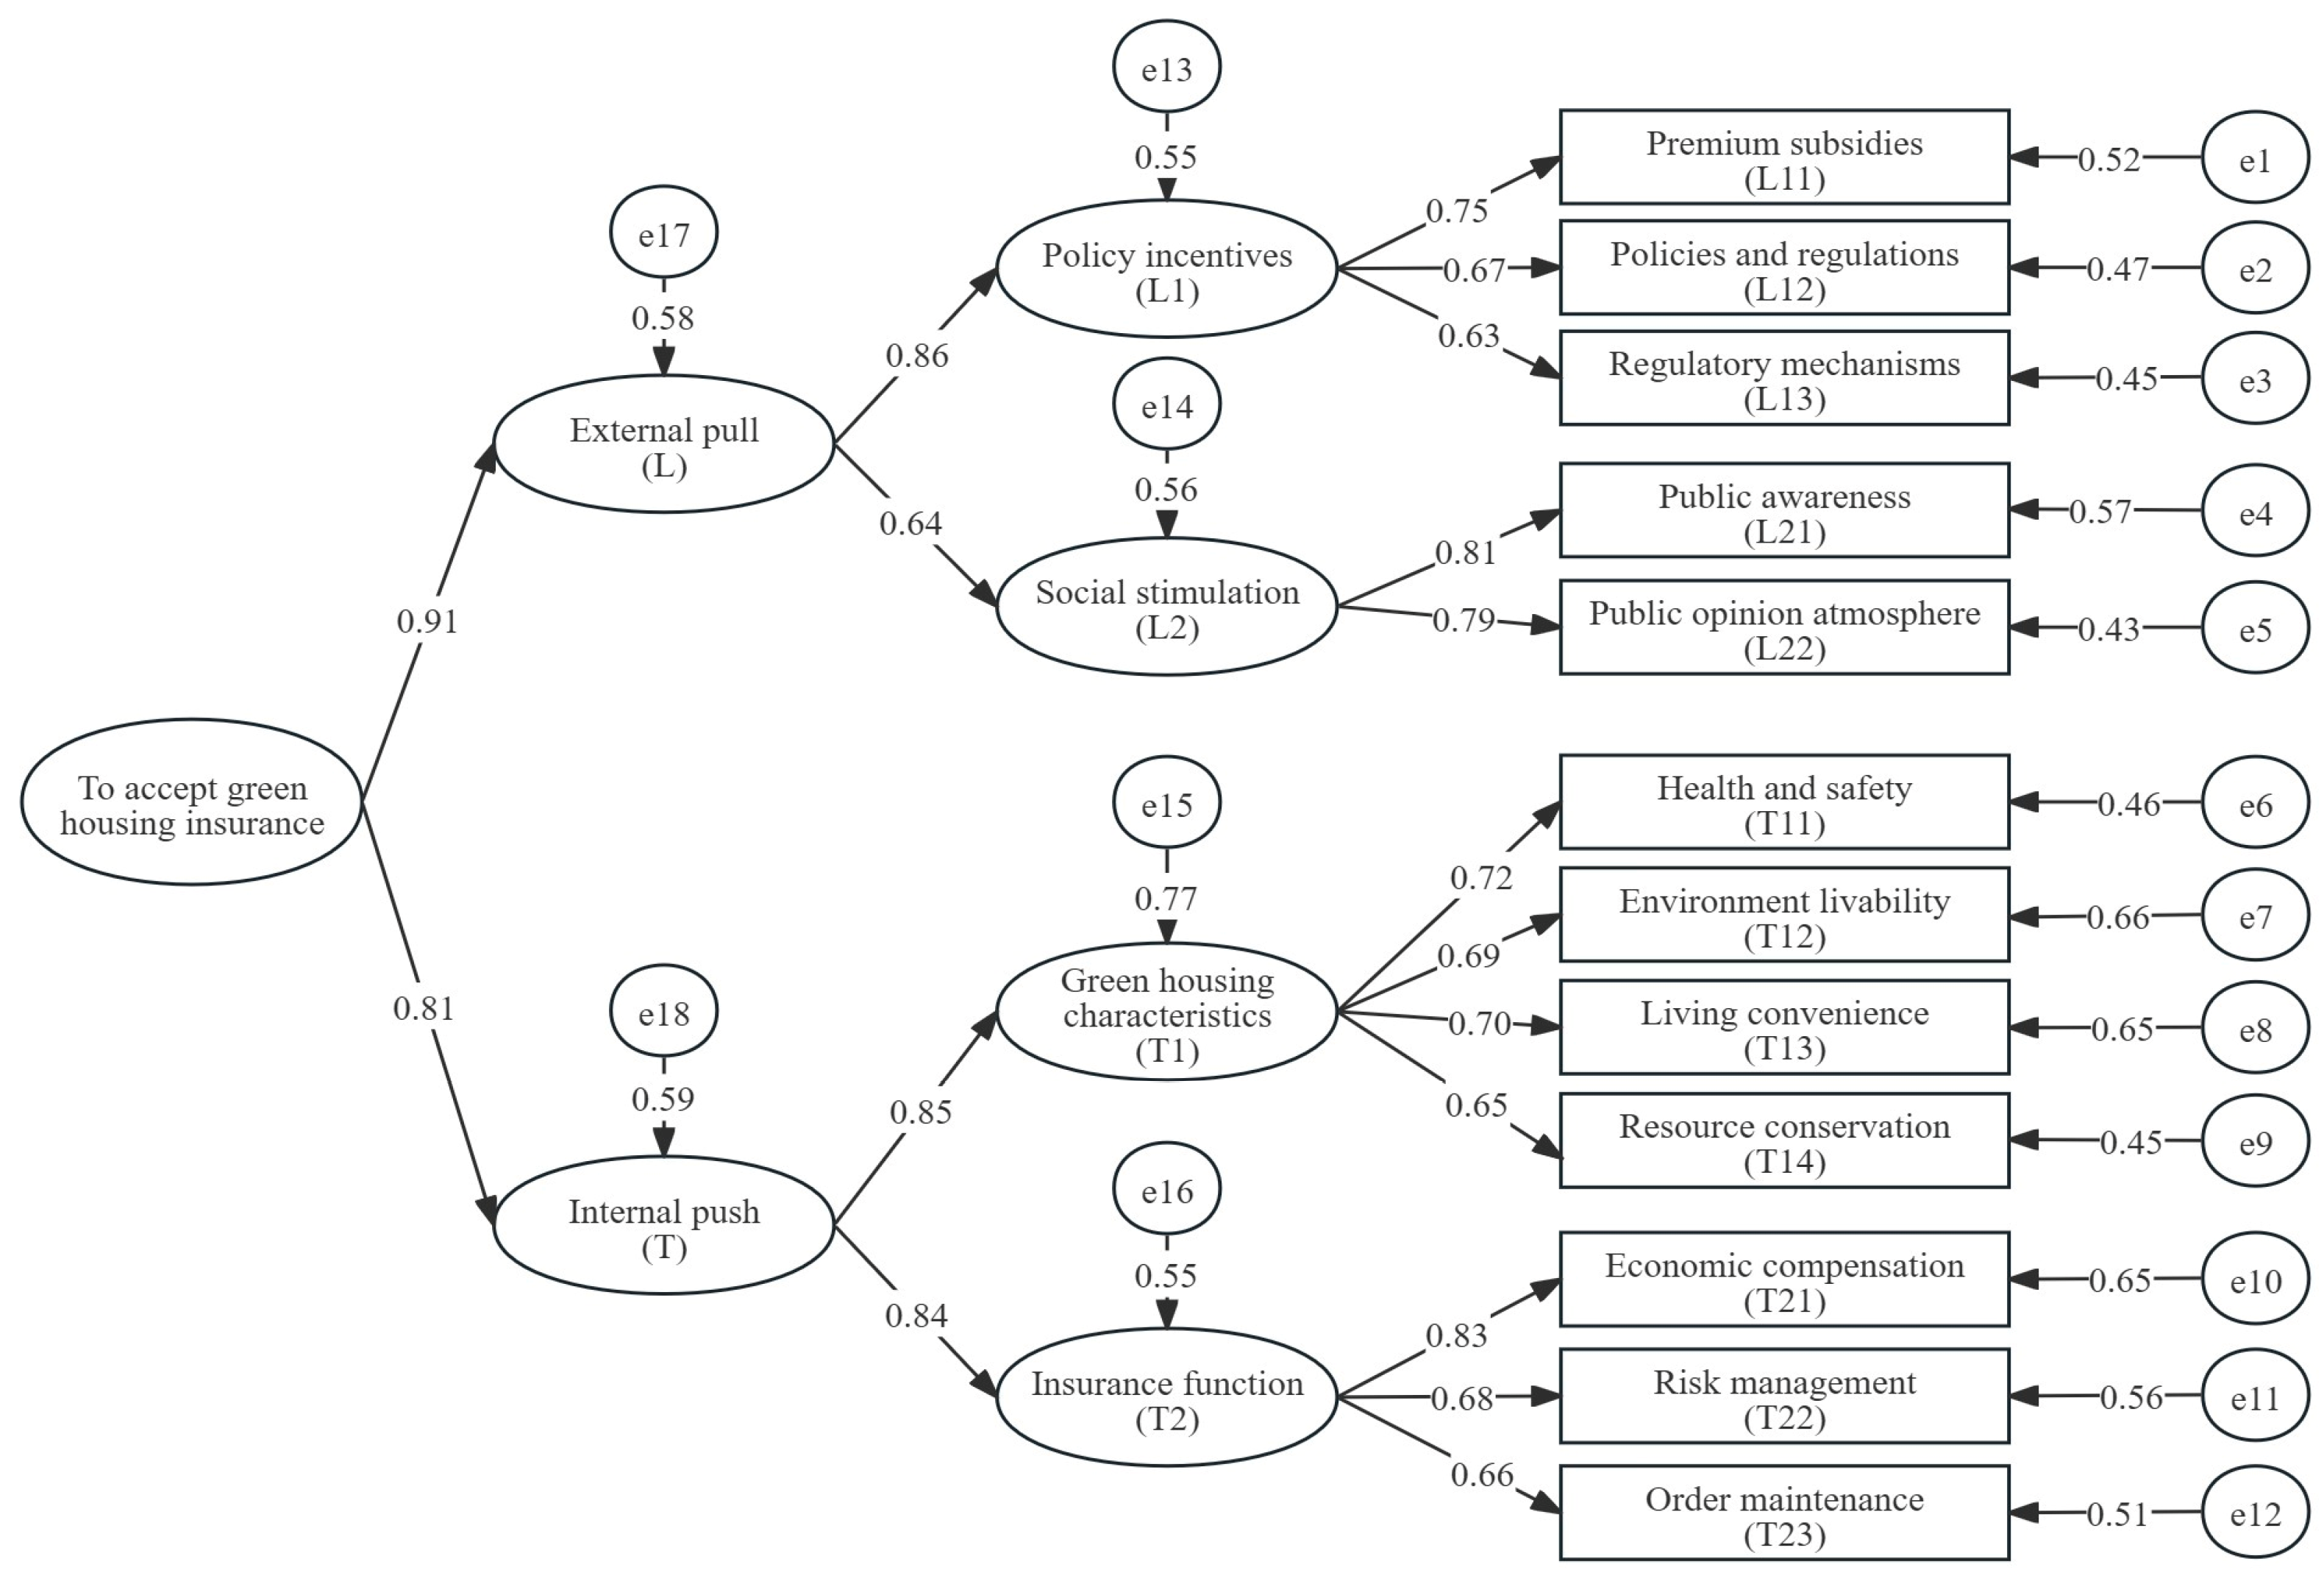
4.2.1. Initial Framework of the Model

Research hypotheses are the basis of SEM analysis, enabling researchers to transform complex real-world problems into measurable research questions and evaluate the validity of those hypotheses [48]. Based on the push–pull theory, the previous sections identified influencing drivers (Table 1), and proposed corresponding hypotheses. The hypotheses for the SEM model are shown in Figure 1.
H1. 
Premium subsidies variable has a positive influence on policy incentives;
H2. 
Policies and regulations variable has a positive influence on policy incentives;
H3. 
Regulatory mechanisms variable has a positive influence on policy incentives;
H4. 
Public awareness variable has a positive influence on social stimulation;
H5. 
Public opinion atmosphere variable has a positive influence on social stimulation;
H6. 
Health and safety variable has a positive influence on green housing characteristics;
H7. 
Environment livability variable has a positive influence on green housing characteristics;
H8. 
Living convenience variable has a positive influence on green housing characteristics;
H9. 
Resource conservation variable has a positive influence on green housing characteristics;
H10. 
Economic compensation variable has a positive influence on insurance function;
H11. 
Risk management variable has a positive influence on insurance function;
H12. 
Order maintenance variable has a positive influence on insurance function;
H13. 
Policy incentives variable has a positive influence on the pull;
H14. 
Social incentives variable has a positive influence on the pull;
H15. 
Green housing characteristics variable has a positive influence on the push;
H16. 
Insurance function variable has a positive influence on the push;
H17. 
The variables within pull dimension have positive influence on acceptance;
H18. 
The variables within push dimension have positive influence on acceptance.

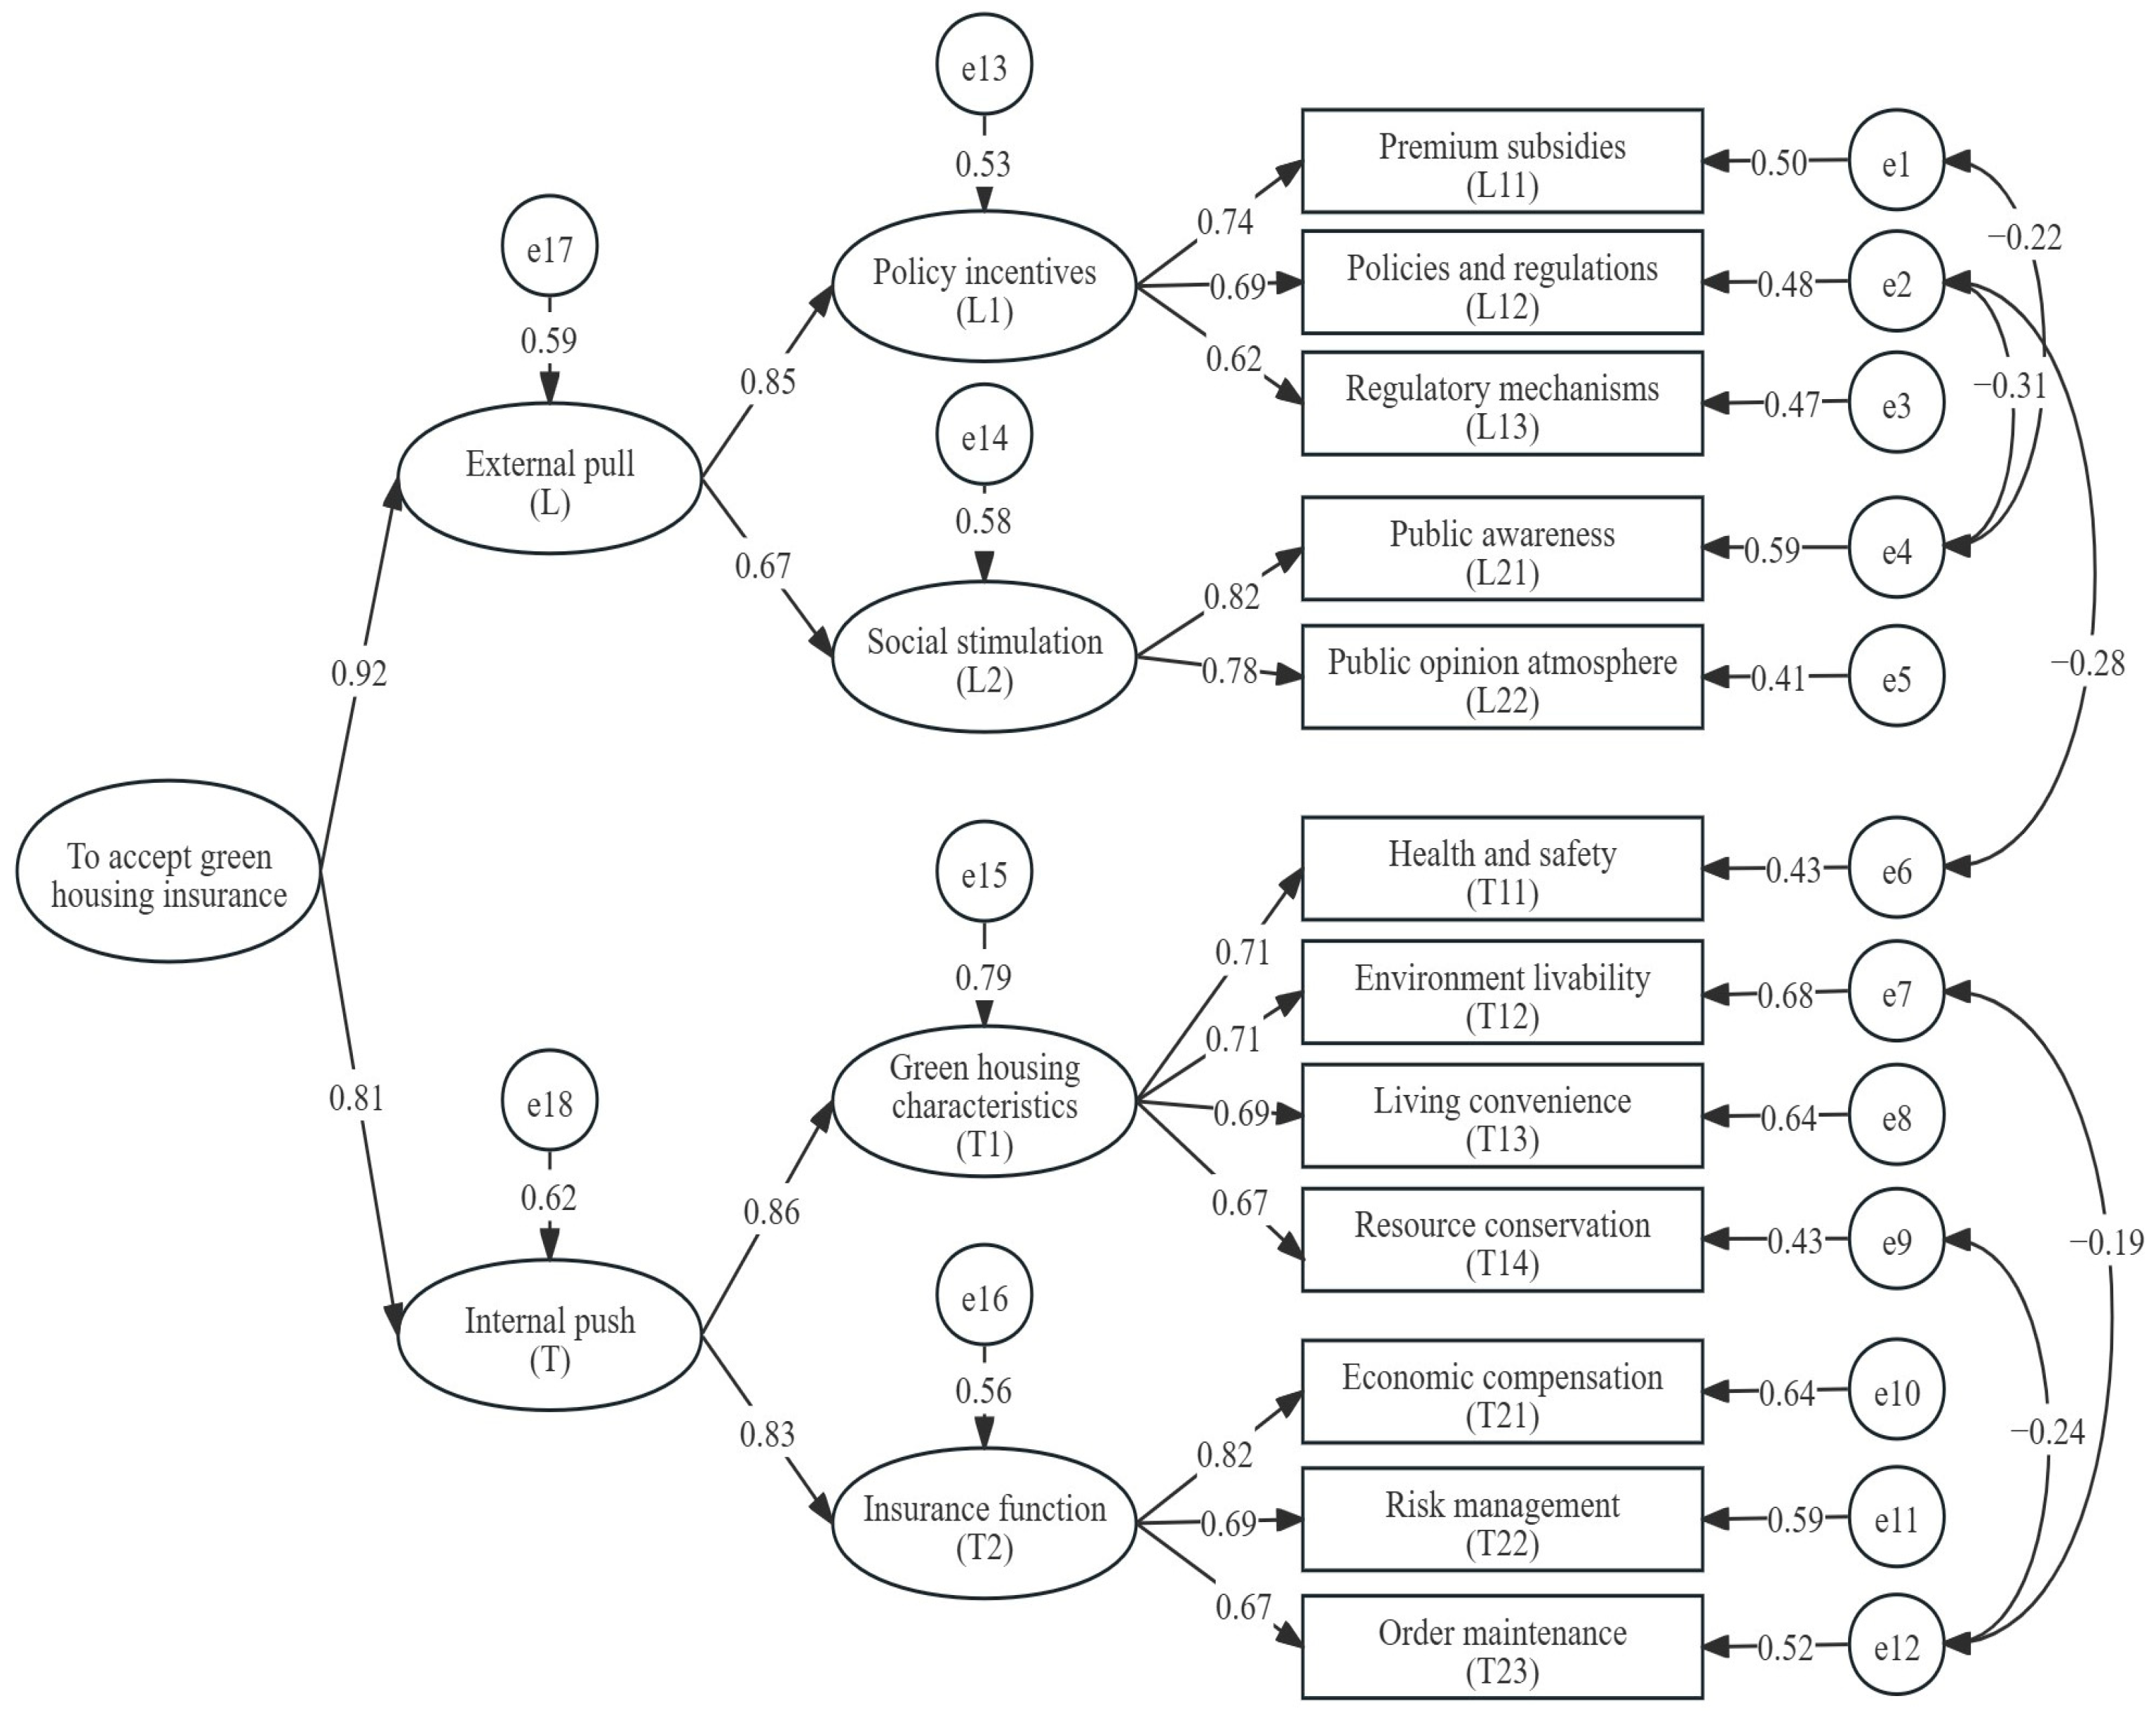
4.2.2. Model Test and Modification

In this study, the relationships between variables were analyzed using ‘AMOS 26.0’. The questionnaire data, which had been processed by ‘SPSS 27.0’, were imported into ‘AMOS 26.0’. The maximum likelihood method was then utilized to generate the standardized path coefficient plots of the initial SEM model (Figure 2). In Figure 2, unobserved latent variables are depicted by ovals, while rectangles stand for observed variables. Arrows illustrate the relationships among variables, and small circles signify residuals or measurement errors [40].
The estimated parameters of the initial hypothesis model all passed the significance test. Additionally, the error variances were all positive, and the standard errors of the variables remained within an acceptable range. These results indicate that this model passed the parametric test [49]. Then, the initial SEM model’s fit was tested. While most goodness-of-fit (GOF) measures met the recommended threshold, some did not. Specifically, the root mean square residual (RMR) (0.063 > 0.05), root mean square error of approximation (RMSEA) (0.061 > 0.05), and relative fit index (RFI) (0.894 < 0.9) failed to reach the recommended thresholds. As a result, the initial SEM model required modification [44]. When the GOF measures of an SEM are unsatisfactory, the model’s GOF can be improved by either adding new paths or adjusting the existing ones [50]. Since all 12 observed variables were established based on the push–pull theory, which has great practical significance, modifications were made by releasing variables instead of deleting them.
The modified SEM model with standardized path coefficients is shown in Figure 3. The model underwent five instances of variable constraint relaxation. In the modified model, all variables were paired, and the covariance between each pair was significant at the 0.001 level. In addition, a Student’s t-test was performed, and the estimated variables were significant at the 0.001 level [51]. Therefore, these findings suggest that the modified SEM model provides a better fit (Table 4).

4.2.3. Hypothesis Verification

In the SEM model, standardized path coefficients are used to measure the correlation degree between two variables. These coefficients are obtained by standardizing the path coefficient, with values ranging from −1 to 1 and an ideal range of 0.6 to 0.9. A higher absolute value of the standardized path coefficient indicates a stronger correlation between the two variables [52].
The standardized path coefficients and covariance estimation results of the modified SEM model are shown in Table 5. All standardized path coefficient values exceed 0.6, and the significance difference is less than 0.01, indicating that all the standardized path coefficients and covariances are statistically significant [53]. These findings confirm that all 18 hypotheses (H1–H18) proposed in this study are valid.

4.2.4. Results Analysis

The standardized path coefficient merely reflects the direct effect between variables. It fails to fully capture the overall influence, making it difficult to precisely identify the criticality of variables within the driver system [54]. However, the correlation coefficient provides a more comprehensive measure of the relationship between variables [55]. By accounting for both direct and indirect driving paths, the correlation coefficient provides a more accurate portrayal of each driver’s influence and relative importance on the acceptance of green housing insurance.
Therefore, the correlation coefficient between the drivers and the acceptance of green housing insurance is further utilized to represent the relative importance of each driver. A higher correlation coefficient indicates a stronger correlation between the drivers and the acceptance [56]. In this study, the ‘relative importance weight’ is used to describe the correlation coefficient, which is expressed in Equation (1).
Y i = X i / ( X 1 + X 2 )
Here, Yi represents the relative importance weights of the first-level driver i, while X1 and X2 are the standardized path coefficient of the first-level driver i.
The relative importance weights of the two first-level drivers and their ranking are calculated based on Equation (1) and shown in Table 6. The results show that the ranking of the two first-level drivers with respect to weights is L (0.532) > T (0.468).
The relative importance weight of the second-level drivers are calculated using Equation (2).
Z j = X j Y i
Here, Zj represents the relative importance weights of the second-level driver j, while Xj is the standardized path coefficient of the second-level driver j; j = 1, 2, 3 and 4.
Under Equation (2), the relative importance weight coefficients and rankings of the four second-level drivers are shown in Table 7. The results indicate that the ranking of the four second-level drivers with respect to weight is L1 (0.449) > T1 (0.403) > T2 (0.387) > L2 (0.359).
Similarly, the relative importance weights of the 12 third-level indicators are calculated using Equation (3).
Q f = X f Z i
Qf represents the relative importance weights of the third-level driver f, while Xf is the standardized path coefficient of the third-level driver f; f = 1, 2, 3, …, 11 and 12. The relative importance weights and rankings of the 12 third-level drivers are shown in Table 8.

5. Discussion

5.1. Analysis of the Push–Pull Mechanism and Verification

5.1.1. Comprehensive Analysis of the Push–Pull Mechanism

The relative importance weight is the correlation coefficient between the drivers, which is used to represent their relative importance [57]. According to Table 6, the relative importance weights of the drivers from the pull dimension and push dimension are 0.532 and 0.468, respectively. This indicates that the drivers from the pull dimension have a greater influence on the acceptance of green housing insurance. In other words, the drivers from the pull dimension play a crucial role in driving the acceptance. As a result, the pull dimension serves as the crucial path in the driver system.

5.1.2. Mechanistic Analysis from the Pull Dimension

Starting the analysis with the crucial path, Table 7 shows that the relative importance weight of the policy incentives (driver L1) is 0.449, ranking first among all second-level drivers. This indicates that the influence of policy incentives is stronger than that of social stimulation. Phillips [58] stated that national policy guidance plays a crucial role in ensuring people’s living quality and safeguarding their basic interests and welfare.
At the third level, as shown in Table 8, premium subsidies (driver L11) under the policy incentives ranked highest among all third-level drivers. Research suggests that premium subsidies can significantly increase insurance acceptance rates, supporting the proposition in this study that premium subsidies enhance public recognition and acceptance of green housing insurance. Cai et al. [59] also examined the impact of premium subsidies on insurance demand and found that they effectively promote insurance participation in early-stage markets. However, this research focused on the promotion of agricultural insurance rather than green housing insurance.
Furthermore, at the third level, policies and regulations (driver L12) under policy incentives are ranked third in the overall ranking. Currently, green housing is still in its early stages, and many of its features do not fully meet established requirements. In this situation, house owners urgently require insurance to safeguard their rights and interests. In recent years, government agencies have issued a number of policies and regulations on green finance, but most of them are advisory and voluntary, lacking concrete implementation plans. Policies and regulations specifically related to green housing insurance remain limited, with a lack of innovative incentive mechanisms. In addition, they are ineffective in increasing public acceptance of green housing insurance. Numerous scholars have examined the impact of Policies and regulations on the acceptance of emerging innovations. For example, Ma et al. and Xian et al. demonstrated that well-implemented incentive policies and regulations significantly enhance the acceptance and adoption of emerging innovations [60,61]. However, their research focused on new energy vehicles (NEVs) as the emerging innovation, whereas this study investigates green housing insurance as the target innovation.
Notably, the relative importance weight of the public awareness (driver L21) at the third level ranked fourth among all the third-level drivers. Chawla et al. [62] focused on the energy industry and found a positive correlation between public awareness and consumers’ acceptance of new things. Lippmann [63] suggested that the public perception of green housing or green housing insurance, along with house owners’ evaluations of green housing, significantly influence people’s awareness and emotional identification with green housing, thus, in turn, stimulating them to accept it.

5.1.3. Mechanistic Analysis from the Push Dimension

In the push dimension, as shown in Table 7, green housing characteristics (driver T1) have a stronger influence than insurance function (driver T2). Various studies have shown that green housing characteristics play a significant role in increasing acceptance. Wang et al. [64] confirmed that people are increasingly concerned about environmental protection, health and sustainable development. Similarly, Tseng et al. [65] proposed that healthy and safe green housing can reduce health risks and accident rates, thereby increasing house owners’ acceptance to ensure the continued stability of housing. Furthermore, Oluwagbemiga Paul and Uduma-Olugu [66] found that green housing equipped with smart amenities and community services enhances living convenience and comfort, making house owners more inclined to accept insurance.
Based on Table 8, an analysis of the third-level drivers of the push dimension shows that the economic compensation (T21) driver ranks second in relative importance. This suggests that economic compensation has a significant influence on acceptance. Xiao et al. [67] found that in Wenchuan, China, which suffered an earthquake in 2008, some families received insurance compensation for reconstruction and property replacement, helping them rebuild their lives after the quake through house property insurance. As a result, the purchase rate of property insurance in Wenchuan and surrounding areas increased by about 40% within three years. This highlights the role of economic compensation as a financial safeguard in times of crisis. Ingram [68] also noted that individuals can purchase insurance to seek financial security in adverse situations. These findings align with the conclusion that economic compensation can influence people’s acceptance of green housing insurance.

5.1.4. Verification for the Driver Mechanism

According to the above analysis of the different dimensions, it is evident that drivers in the pull dimension have a greater influence than those in the push dimension. Among these, premium subsidies and economic compensation play a crucial role in driving house owners to accept green housing insurance. Further investigation reveals that some pilot cities in China have already implemented measures such as premium subsidies and economic compensation to encourage house owners and developers to adopt green insurance. For example, the Huzhou Municipal Government in Zhejiang Province, China, provides subsidies of up to 20% of the premium for developers and house owners obtaining green building performance insurance [69]. This initiative has successfully attracted numerous developers to purchase insurance, including the Huzhou Zhenghuang Real Estate Company Limited (Co., Ltd.), which insured its “Zhenghuang Hejin Mansion” project; Huzhou Nantaihu Construction & Development Co., Ltd., which secured coverage for the FH-02-02-08B plot in Phoenix West District; Huzhou Chenchen Real Estate Development & Construction Co., Ltd., which insured the TH-10-01-08B plot in Caotianyang Unit. Similarly, the Guangzhou Municipal Government in Guangdong Province, China, offers a 30% premium subsidy for green insurance, which received a good response [70]. In other words, these government measures, representing drivers in the pull dimension such as providing premium subsidies, have achieved favorable results in increasing public acceptance of green insurance. Thus, this indicates that the outcomes of applying the driver system and SEM model align with real-world scenarios, confirming that the driver system and driver mechanism developed in this study are feasible and rational.

5.2. Policy Suggestions

5.2.1. General Strategy of “Pull-Dominant with Push–Pull Parallelism”

Both the internal emotional push and the external cognitive pull can increase house owners’ acceptance of green housing insurance, with external cognitive pull having a greater influence. Therefore, we propose a general strategy of “pull-dominant with push–pull parallelism”. This strategy prioritizes stimulating house owners’ internal emotions while simultaneously strengthening their external cognition.
Governments at all levels should place greater emphasis on policy incentives and social stimulation to support green housing insurance. For example, the Chinese government can integrate the development of green housing insurance into the next five-year plan and actively promote social awareness initiatives. Hu et al. [71] noted that prior to the release of the “14th Five-Year Plan” for building energy conservation and green building development, green buildings had low public recognition and house owners were largely unaware of them. However, after its implementation, the government not only mandated green building construction through policies but also engaged in various social stimulation efforts, significantly promoting the development of the green building sector.
Meanwhile, as shown in Table 7, under the push dimension, the relative importance weight of the green housing characteristic and insurance function ranks second and third among all second-level drivers. This highlights the need to strengthen green housing characteristics and enhance insurance functions, thereby constantly reinforcing the push effect. Several measures can be implemented to ensure green housing characteristics. Bungau et al. [72] emphasized the importance of considering the surrounding ecological environment, and accurately selecting the site based on green building standards at the planning stage. In the design stage, the use of environmentally friendly materials is essential to creating a healthy living environment. Abdel Hay bin Omera [73] stated that using environmentally friendly materials can promote a healthier living environment. This series of measures can continuously optimize the green housing characteristics, thereby stimulating acceptance.

5.2.2. Stimulate Premium Subsidies

The most direct way to stimulate house owners to accept green housing insurance is to subsidize their insurance premiums [74]. To promote acceptance of green housing insurance, two measures can be taken. The first measure is for the government to lead and subsidize insurance agencies that provide green housing insurance. This strategy has been applied in the U.S. and Malaysia, where the government provides subsidies to insurance agencies. These agencies then offer discounts to LEED-certified green housing, which in turn encourages the acceptance of green housing insurance [28]. Similarly, Shao et al. [75], explored the relationship between subsidies and people’s acceptance of electric vehicles. They also found that this kind of government financial subsidy can effectively boost the acceptance of electric vehicles. While Shao et al.’s research focused on electric vehicles, green housing insurance is also a green product and can adopt the same strategy. The second measure is for the government to directly subsidize individuals who purchase green housing insurance. This measure can directly increase the disposable income of house owners, making insurance more accessible. As mentioned in the verification of the driver mechanism above, such measures have already been tested in some pilot cities for green housing, including Zhejiang Province and Guangzhou in China [69,70]. These initiatives have received positive feedback and have led to increased insurance purchases in these regions.

5.2.3. Innovative Insurance Compensation Forms

In the field of green housing insurance, economic compensation is crucial in influencing acceptance. Both the prepayment mechanism and indirect loss compensation mechanism can significantly enhance its impact. As Adetoyese et al. [76] suggested, prepayment mechanisms can effectively relieve financial pressure. When housing is damaged, insurance agencies provide funding before the final damage assessment, enabling house owners to undertake emergency repairs. This timely assistance reinforces the perceived benefits of insurance, thereby increasing acceptance. Similarly, Alabady and Abu Ghazaleh [28] confirmed that compensation for indirect losses can influence acceptance. In the United States, insurance agencies, such as the Fireman’s Fund, not only cover repair costs but also provide upgrade costs when green facilities are accidentally damaged. This additional compensation increases the overall value of insurance coverage, further driving the acceptance. In Huzhou City, as discussed in Section 5.1.4, an insurance company introduced the Green Building Performance Liability Insurance, reinforcing the guarantee function of insurance. Under this policy, enterprises that purchased insurance but failed to meet the predetermined performance efficiency of green buildings received economic compensation amounting to 10 times the insurance premium [77].

5.2.4. Improve Relevant Policies and Regulations

Currently, there are few government policies and regulations on green finance, and even fewer specifically addressing green housing insurance. This lack of regulation has, to some extent, restricted public awareness and acceptance of green housing insurance. Therefore, improvements are needed in the following areas. First, a comprehensive regulatory system for green housing insurance should be established. This system should clearly define the rights and obligations of green housing insurance buyers, governmental authorities and insurance agencies [74]. Second, incentive policies should be refined. Roberts [78] demonstrated that incentive policies can encourage insurance agencies to invest in research and development (R&D) and promote the diversification of insurance products. This, in turn, enhances public acceptance of green housing insurance and lays the foundation for the further development of green insurance. Third, the China Banking and Insurance Regulatory Commission (CBIRC) should issue regulations for green housing insurance. These regulations should clearly define qualification requirements, business scope, risk assessment standards and management guidelines for insurance agencies. Yu et al. [79] also confirmed that such strict regulation is effective at increasing public acceptance.

5.2.5. Guide Public Awareness

There is limited public awareness of green housing characteristics and the importance of green housing insurance, which limits the acceptance of insurance. To address this, government departments, insurance institutions, and local green building associations can collaborate to organize public awareness activities. These initiatives should aim to educate the public about the benefits of green housing and emphasize the role of green housing insurance in safeguarding these advantages. Similar activities have already been carried out in Guangdong, China, where an energy conservation publicity month activity was held to support green finance, including green housing insurance [80]. Furthermore, demonstration communities can be established to enhance public understanding. Pugnetti et al. [81] suggested that the government can set up showrooms within these communities to showcase real-life examples of how green housing insurance protects sustainable housing. By allowing citizens to experience its benefits firsthand, such initiatives can effectively increase public acceptance of green housing insurance.

6. Conclusions

Based on the push–pull theory, this study explored the drivers from the push dimension and pull dimensions and their mechanisms influencing the acceptance of green housing insurance. The key findings are as follows: firstly, a driver system for green housing insurance acceptance was established, from internal push and external pull dimensions. The system consisted of two first-level drivers, four second-level drivers and twelve third-level drivers. Secondly, an SEM model was developed to analyze the mechanisms influencing house owners’ acceptance. The results indicated the following: (1) drivers in the pull dimension have a greater influence on acceptance than drivers in the push dimension; and (2) premium subsidies and economic compensation play a crucial role in driving house owners to accept green housing insurance.
This study contributes to the existing body of knowledge in the fields of insurance and green building. The research focus is on green housing insurance, an emerging type of insurance that supplements both insurance-related theories and green building theories. Meanwhile, this study focuses on the operation stage of green housing, which was overlooked in previous research, thereby enriching studies on green buildings across their entire life cycle. In addition, based on the push–pull theory, this study examined internal and external behavior drivers and analyzed their driving mechanism using the SEM model. This method can also be applied to the studies of human factors engineering or other people-related fields in construction management. From a practical perspective, the findings of this study are not only applicable to China but also provide valuable insights for the development of green housing insurance in developing countries. For insurance enterprises, the identified driving mechanisms serve as a foundation for analyzing internal and external drivers to accurately define target customer groups. This enables the design of green housing insurance products tailored to the specific needs of local markets. For governments, the policy recommendations proposed in this study offer useful references for formulating industrial policies. Governments in developing countries can adopt these insights to implement effective measures that promote the sustainable growth of the green housing insurance market.
However, this study also has some limitations. During the data collection period, the sample mainly consisted of cities in China where green housing was promoted earlier. These pilot cities generally have a higher level of urban development. According to the Green Building Creation Action Plan [82], all buildings in China are required to transition to green buildings. Consequently, all urban areas will need to adopt life-cycle management for green housing. However, differences in urban development levels may lead to variations in urban management, public awareness, and policy environment. These disparities can impact the operational strategies of the driving mechanism proposed in this study. Therefore, future research could aim to collect data from cities with different development levels, rather than focusing solely on pilot cities for green housing insurance. This broader approach will help refine and enhance the overall strategy. Another limitation of this study is its reliance on statistical analysis of survey data. While the research design is robust, as the respondents have first-hand experience living in green housing, the findings are based on their perceptions. Since these individuals have directly encountered maintenance challenges during the operation phase, their insights align with the research objectives. Future research will increase the sample size and expand the scope of data collection to improve data representativeness. In addition, further studies can explore the practical models for applying green insurance during the operation stage of green buildings, including green housing.

Author Contributions

Conceptualization, Y.S., N.P. and Q.L.; methodology, Y.S., N.P. and Q.L.; software, N.P. and Y.W.; validation, J.L., X.P. and M.M.; investigation, Y.W., J.L., X.P. and M.M.; data curation, N.P., Y.W., J.L. and X.P.; writing—original draft preparation, Y.S. and N.P.; writing—review and editing, Y.S. and N.P.; supervision, Y.S. and Q.L.; project administration, Y.S. and Q.L.; funding acquisition, Y.S. and Q.L. All authors have read and agreed to the published version of the manuscript.

Funding

This research was funded by the Chongqing Municipal Education Commission with grant number No. 23SKGH349.

Institutional Review Board Statement

The study was conducted in accordance with the Declaration of Helsinki, and approved by the Institutional Review Board (or Ethics Committee) of the School of Management Chongqing University of Science and Technology (protocol code: CQUSTSOM20250110 and date of approval: 10 January 2025).

Informed Consent Statement

Informed consent was obtained from all subjects involved in the study.

Data Availability Statement

The data used to support the findings of this study are available from the corresponding author upon request.

Conflicts of Interest

The authors declare no conflicts of interest.

Appendix A

  • Pare 1: Background information (Please tick ✓ in the ☐ that applies to you)
  • Living in a green housing: ☐ Yes ☐ No
  • Living in which city:
  • Gender: ☐ Male ☐ Female
  • Age: ☐ Below 22 ☐ 22–30 ☐ 31–40 ☐ 41–50 ☐ 51–65 ☐ Over 65
  • Educational background: ☐ College degree or below ☐ Bachelor’s degree ☐ Postgraduate degree or above
  • Work institution: ☐ Government departments ☐ Construction industry ☐ Manufacturing enterprises ☐ Service industry ☐ Technology companies ☐ Educational institution ☐ Others
  • Pare 2: Identification of the influencing degree of each driver on the acceptance of green housing insurance (Points present as 5—very important, 4—important, 3—common, 2—unimportant, and 1—negligible. Please tick ✓ in the ☐ that applies to you)
CodeDriversImportance of the Drivers
12345
L11Premium subsidies
L12Policies and regulations
L13Regulatory mechanisms
L21Public awareness
L22Public opinion atmosphere
T11Health and safety
T12Environment livability
T13Living convenience
T14Resource conservation
T21Economic compensation
T22Risk management
T23Order maintenance

Appendix B

  • Pare 1: Background information (Please tick ✓ in the ☐ that applies to you)
  • Profession: ☐ Department directors of insurance companies ☐ Department directors of property management companies ☐ Staffs of local construction authorities ☐ Others institutions (including design organization, consultant firms and research institutions)
  • Working years: ☐ Below 5 years ☐ 5–10 years ☐ 11–20 years ☐ Over 20 years
  • Pare 2: Identification of the influencing degree of each driver on the acceptance of green housing insurance (Points present as 5—very important, 4—important, 3—common, 2—unimportant, and 1—negligible. Please tick ✓ in the ☐ that applies to you)
CodeDriversImportance of the Drivers
12345
L11Premium subsidies
L12Policies and regulations
L13Regulatory mechanisms
L21Public awareness
L22Public opinion atmosphere
T11Health and safety
T12Environment livability
T13Living convenience
T14Resource conservation
T21Economic compensation
T22Risk management
T23Order maintenance

References

  1. Jiang, Y.; Zhang, Y.; Yeganeh, A.; Zhao, D. Resilience of Green Building Supply Chain: Capabilities, Risks and Influence Mechanism. J. Green Build. 2024, 19, 41–69. [Google Scholar] [CrossRef]
  2. Taemthong, W.; Chaisaard, N. An Analysis of Green Building Costs Using a Minimum Cost Concept. J. Green Build. 2019, 14, 53–78. [Google Scholar] [CrossRef]
  3. Wang, Y.; Chen, D.; Tian, P. Research on the Impact Path of the Sustainable Development of Green Buildings: Evidence from China. Sustainability 2022, 14, 13628. [Google Scholar] [CrossRef]
  4. Qian, Y.; Yu, M.; Wang, T.; Yuan, R.; Feng, Z.; Zhao, X. Evolutionary Game and Simulation of Green Housing Market Subject Behavior in China. Comput. Intell. Neurosci. 2022, 2022, 7153270. [Google Scholar] [CrossRef]
  5. Yang, Y.X.O.; Chew, B.C.; Loo, H.S.; Tan, L.H. Green Commercial Building Insurance in Malaysia. In Proceedings of the 5th International Conference on Education, Concept, and Application of Green Technology, Semarang, Indonesia, 5–6 October 2016. [Google Scholar]
  6. Taghizadeh-Hesary, F.; Yoshino, N. Sustainable Solutions for Green Financing and Investment in Renewable Energy Projects. Energies 2020, 13, 788. [Google Scholar] [CrossRef]
  7. Li, S.; Zheng, X.; Zeng, Q. Can Green Finance Drive the Development of the Green Building Industry?—Based on the Evolutionary Game Theory. Sustainability 2023, 15, 13134. [Google Scholar] [CrossRef]
  8. Eling, M. Is the insurance industry sustainable? J. Risk Financ. 2024, 25, 684–703. [Google Scholar] [CrossRef]
  9. Stricker, L.; Pugnetti, C.; Wagner, J.; Zeier Röschmann, A. Green Insurance: A Roadmap for Executive Management. J. Risk Financ. Manag. 2022, 15, 221. [Google Scholar] [CrossRef]
  10. Sun, M.; Han, C.; Nie, Q.; Xu, J.; Zhang, F.; Zhao, Q. Understanding building energy efficiency with administrative and emerging urban big data by deep learning in Glasgow. Energy Build. 2022, 273, 112331. [Google Scholar] [CrossRef]
  11. Wang, S.; Chen, S.; Nah, K. Exploring the Mechanisms Influencing Users’ Willingness to Pay for Green Real Estate Projects in Asia Based on Technology Acceptance Modeling Theory. Buildings 2024, 14, 349. [Google Scholar] [CrossRef]
  12. Grierson, D. Unfinished Business at the Urban Laboratory-Paolo Soleri, Arcology, and Arcosanti. Open House Int. 2016, 41, 63–72. [Google Scholar] [CrossRef]
  13. Yang, R.J.; Zou, P.X.; Wang, J. Modelling stakeholder-associated risk networks in green building projects. Int. J. Proj. Manag. 2016, 34, 66–81. [Google Scholar] [CrossRef]
  14. Jiang, Y.; Xing, Y.; Zhao, D.; Jiao, R. Resale of Green Housing Compensates for Its Premium Pricing: An Empirical Study of China. J. Green Build. 2021, 16, 45–61. [Google Scholar] [CrossRef]
  15. Chen, Y.; Jones, C.A.; Dunse, N.A.; Li, E.; Liu, Y. Housing Prices and the Characteristics of Nearby Green Space: Does Landscape Pattern Index Matter? Evidence from Metropolitan Area. Land 2023, 12, 496. [Google Scholar] [CrossRef]
  16. Hu, Y.; Du, S.; Wang, Y.; Yang, X. How Does Green Insurance Affect Green Innovation? Evidence from China. Sustainability 2023, 15, 12194. [Google Scholar] [CrossRef]
  17. Zona, R.; Roll, K.; Law, Z. Sustainable/green insurance products. In Casualty Actuarial Society E-Forum; Casualty Actuarial Society: Arlington, VA, USA, 2014. [Google Scholar]
  18. Yanghua, H.; Jingbo, C.; Shen, L. Green Technology Innovation under China’s New Development Concept: The Effects of Policy-Push and Demand-Pull on Renewable Energy Innovation. Soc. Sci. China 2023, 44, 158–180. [Google Scholar] [CrossRef]
  19. Nipane, A.P.; Awasthi, A. Interconnection Between Human’s Psychological Elements and Their Influential Mediums and Channels Are Potential Accelerators to Comprehend People’s Inclination Towards Autonomous Vehicles. EasyChair 2021, 5522. Available online: https://easychair.org/publications/preprint/CXWP (accessed on 7 April 2025).
  20. Alexandrovna, P.Y.; Galimovna, S.K. The migration theory’s process of formation and development in the globalizing world. Opción Rev. Cienc. Humanas Soc. 2018, 87, 18. [Google Scholar]
  21. Tolman, E.C. Behavior and Psychological Man: Essays in Motivation and Learning; University of California Press: Berkeley, CA, USA, 2023. [Google Scholar]
  22. Sha, C.; Che, T.; Xu, T.; Yang, Z. Antecedents of users’ switching intention to Central Bank Digital Currency: A push-pull-mooring model perspective. Electron. Commer. Res. Appl. 2024, 68, 101467. [Google Scholar] [CrossRef]
  23. Morales-Alonso, G.; Blanco-Serrano, J.A.; Núñez Guerrero, Y.; Grijalvo, M.; Blanco Jimenez, F.J. Theory of planned behavior and GEM framework—How can cognitive traits for entrepreneurship be used by incubators and accelerators? Eur. J. Innov. Manag. 2022, 27, 922–943. [Google Scholar] [CrossRef]
  24. Ganiyu, B.O. Strategy to Enhance Sustainability in Affordable Housing Construction in South Africa. Ph.D. Thesis, Cape Peninsula University of Technology, Cape Town, South Africa, 2016. [Google Scholar]
  25. GB/T 50378—2019; Assessment Standard for Green Building. China Architecture and Building Press: Beijing, China, 2019.
  26. She, Y.; Wu, S.; Wang, Y.; Zhu, Y.; Jiao, L. Habitat Safety Evaluation of Sustainable Housing from the Perspective of Households. J. Green Build. 2023, 18, 189–216. [Google Scholar] [CrossRef]
  27. Tong, L. China Catastrophe Insurance: A Boost to Green Insurance Development under ESG Concept. Acad. J. Bus. Manag. 2022, 4, 11–19. [Google Scholar] [CrossRef]
  28. Alabady, H.S.; Abu Ghazaleh, S.N. Green building insurance. JL Pol’y Glob. 2017, 66, 137. [Google Scholar]
  29. Du, C.; Lou, W.; Qiao, Y.; Zhang, Y. Public Rental Housing and Long-Term Settlement Intention of the Migrants in China: The Mediating Effect of Identity. Buildings 2024, 14, 2774. [Google Scholar] [CrossRef]
  30. Hu, H.; Geertman, S.; Hooimeijer, P. The willingness to pay for green apartments: The case of Nanjing, China. Urban Stud. 2014, 51, 3459–3478. [Google Scholar] [CrossRef]
  31. Fang, X.; Lv, Y. Housing prices and green innovation: Evidence from Chinese enterprises. Manag. Decis. 2023, 61, 3519–3544. [Google Scholar] [CrossRef]
  32. Li, S.; Zhao, T.; Zhang, G.; Zhou, Y.; Qu, S.; Sun, X.; Li, J.; Zhang, S. Willingness to pay for earthquake insurance for rural houses and its influencing factors in Xinjiang, China. Int. J. Disaster Risk Reduct. 2024, 103, 104340. [Google Scholar] [CrossRef]
  33. Westland, J.C. Structural equation models. Stud. Syst. Decis. Control 2015, 22, 152. [Google Scholar]
  34. Orogun, B.; Issa, M.H. Evaluating the Health and Safety Maturity of Sustainable Building Projects Using a Sustainable Health and Safety Maturity Model. J. Green Build. 2023, 18, 57–78. [Google Scholar] [CrossRef]
  35. Siswadi, Y.; Jufrizen, J.; Saripuddin, J.; Farisi, S.; Sari, M. Organizational Culture and Organizational Citizenship Behavior: The Mediating Role of Learning Organizations and Organizational Commitment. J. Ris. Bisnis Dan Manaj. 2023, 16, 73–82. [Google Scholar] [CrossRef]
  36. Guenther, P.; Guenther, M.; Ringle, C.M.; Zaefarian, G.; Cartwright, S. Improving PLS-SEM use for business marketing research. Ind. Mark. Manag. 2023, 111, 127–142. [Google Scholar] [CrossRef]
  37. Yin, J.; Qiu, X. AI technology and online purchase intention: Structural equation model based on perceived value. Sustainability 2021, 13, 5671. [Google Scholar] [CrossRef]
  38. Kineber, A.F.; Massoud, M.M.; Hamed, M.M.; Alhammadi, Y.; Al-Mhdawi, M.K.S. Impact of Overcoming BIM Implementation Barriers on Sustainable Building Project Success: A PLS-SEM Approach. Buildings 2023, 13, 178. [Google Scholar] [CrossRef]
  39. Li, C.; Zhang, Y.; Xu, Y. Factors Influencing the Adoption of Blockchain in the Construction Industry: A Hybrid Approach Using PLS-SEM and fsQCA. Buildings 2022, 12, 1349. [Google Scholar] [CrossRef]
  40. Wang, C.; Wood, L.C.; Teo, L.T. Tropical Vertical Greenery Systems: Irrigation Systems, Biophysical Characteristics, and Influential Criteria. J. Green Build. 2016, 11, 57–90. [Google Scholar] [CrossRef]
  41. Kalkbrenner, M.T. Alpha, Omega, and H Internal Consistency Reliability Estimates: Reviewing These Options and When to Use Them. Couns. Outcome Res. Eval. 2021, 14, 77–88. [Google Scholar] [CrossRef]
  42. Rajput, S. Methods of reliability and validity. In An SPSS Guide for Tourism, Hospitality and Events Researchers; Routledge: London, UK, 2020; pp. 243–264. [Google Scholar]
  43. Alhammadi, Y.; Radzi, A.R.; Alias, A.R.; Rahman, R.A. Modeling Workplace Well-Being Factors in Infrastructure Construction Projects: PLS-SEM Approach. Buildings 2024, 14, 2289. [Google Scholar] [CrossRef]
  44. Fan, L.; Xiong, Y.; Peng, Y. Assessing Accessible Travel Satisfaction in Old Communities: A SEM Study. Buildings 2024, 14, 1273. [Google Scholar] [CrossRef]
  45. Cheung, G.W.; Cooper-Thomas, H.D.; Lau, R.S.; Wang, L.C. Reporting reliability, convergent and discriminant validity with structural equation modeling: A review and best-practice recommendations. Asia Pac. J. Manag. 2023, 41, 745–783. [Google Scholar] [CrossRef]
  46. Bolukbas, N.; Gol, G. Surgical Anxiety Questionnaire: Turkish validity and reliability. Psychol. Health Med. 2024, 29, 1652–1663. [Google Scholar] [CrossRef]
  47. Shrestha, N. Factor analysis as a tool for survey analysis. Am. J. Appl. Math. Stat. 2021, 9, 4–11. [Google Scholar] [CrossRef]
  48. Awang, Z. Research Methodology and Data Analysis, 2nd ed.; UiTM Press: Shah Alam, Malaysia, 2012. [Google Scholar]
  49. Cribbie, R.A.; Fiksenbaum, L.; Keselman, H.J.; Wilcox, R.R. Effect of non-normality on test statistics for one-way independent groups designs. Br. J. Math. Stat. Psychol. 2012, 65, 56–73. [Google Scholar] [CrossRef] [PubMed]
  50. Henseler, J.; Sarstedt, M. Goodness-of-fit indices for partial least squares path modeling. Comput. Stat. 2012, 28, 565–580. [Google Scholar] [CrossRef]
  51. Paunova, R.; Ramponi, C.; Kandilarova, S.; Todeva-Radneva, A.; Latypova, A.; Stoyanov, D.; Kherif, F. Degeneracy and disordered brain networks in psychiatric patients using multivariate structural covariance analyzes. Front. Psychiatry 2023, 14, 1272933. [Google Scholar] [CrossRef]
  52. Shin, D.S.; Jeong, B.Y. Older Female Farmers and Modeling of Occupational Hazards, Wellbeing, and Sleep-Related Problems on Musculoskeletal Pains. Int. J. Environ. Res. Public Health 2022, 19, 7274. [Google Scholar] [CrossRef]
  53. Trafimow, D.; Rice, S.; MacDonald, J.A. An investigation of the accuracy of standardized path coefficients. J. Gen. Psychol. 2011, 138, 201–214. [Google Scholar] [CrossRef]
  54. Kaewanuchit, C.; Sawangdee, Y. A Path Analysis of Mental Health Among Thai Immigrant Employees in Pranakron Si Ayutthaya Province. J. Immigr. Minor Health 2016, 18, 871–877. [Google Scholar] [CrossRef]
  55. Pandove, D.; Goel, S.; Rani, R. General correlation coefficient based agglomerative clustering. Clust. Comput. 2018, 22, 553–583. [Google Scholar] [CrossRef]
  56. Ghali, Z.Z. Effect of utilitarian and hedonic values on consumer willingness to buy and to pay for organic olive oil in Tunisia. Br. Food J. 2020, 122, 1013–1026. [Google Scholar] [CrossRef]
  57. She, Y.; Shen, L.; Jiao, L.; Zuo, J.; Tam, V.W.Y.; Yan, H. Constraints to achieve infrastructure sustainability for mountainous townships in China. Habitat Int. 2018, 73, 65–78. [Google Scholar] [CrossRef]
  58. Phillips, D. Quality of Life: Concept, Policy and Practice; Routledge: London, UK, 2006. [Google Scholar]
  59. Cai, J.; De Janvry, A.; Sadoulet, E. Subsidy policies and insurance demand. Am. Econ. Rev. 2020, 110, 2422–2453. [Google Scholar] [CrossRef]
  60. Ma, S.-C.; Fan, Y.; Feng, L. An evaluation of government incentives for new energy vehicles in China focusing on vehicle purchasing restrictions. Energy Policy 2017, 110, 609–618. [Google Scholar] [CrossRef]
  61. Xian, Y.; Wang, Q.; Fan, W.; Da, Y.; Fan, J.-L. The impact of different incentive policies on new energy vehicle demand in China’s gigantic cities. Energy Policy 2022, 168, 113137. [Google Scholar] [CrossRef]
  62. Chawla, Y.; Kowalska-Pyzalska, A. Public awareness and consumer acceptance of smart meters among Polish social media users. Energies 2019, 12, 2759. [Google Scholar] [CrossRef]
  63. Lippmann, W. Public Opinion; Routledge: London, UK, 2017. [Google Scholar]
  64. Wang, Y.; Feng, Y.; Han, K.; Zheng, Z.; Dai, P. Analysis of the Temporal and Spatial Patterns of Residential Prices in Qingdao and Its Driving Factors. Buildings 2025, 15, 195. [Google Scholar] [CrossRef]
  65. Tseng, M.-L.; Li, S.-X.; Lin, C.-W.R.; Chiu, A.S.F. Validating green building social sustainability indicators in China using the fuzzy delphi method. J. Ind. Prod. Eng. 2022, 40, 35–53. [Google Scholar] [CrossRef]
  66. Oluwagbemiga Paul, A.; Uduma-Olugu, N. Exploring the symbiotic relationship between smart technologies and thermal comfort in urban environments. Soc. Sci. Humanit. Open 2024, 10, 100943. [Google Scholar] [CrossRef]
  67. Xiao, Y.; Olshansky, R.; Zhang, Y.; Johnson, L.A.; Song, Y. Financing rapid community reconstruction after catastrophic disaster: Lessons from the 2008 Wenchuan earthquake in China. Nat. Hazards 2019, 104, 5–30. [Google Scholar] [CrossRef]
  68. Ingram, J.D. The changing role of liability insurance: Contract of indemnity or source of compensation? FDCC Q. 2001, 51, 269. [Google Scholar]
  69. Wang, A.; Wang, C.; Chu, Z. Research on the Path of Green Finance to Help Green Building Development Under the Background of “Double Carbon”. In Novel Technology and Whole-Process Management in Prefabricated Building, 5th International Prefabricated Building Seminar on Frontier Technology and Talent Training, Chongqin, China, 21–22 September2023; Springer: Singapore, 2023; pp. 589–599. [Google Scholar]
  70. Feng, L.; Sun, Z. The Impact of Green Finance Pilot Policy on Carbon Intensity in Chinese Cities—Based on the Synthetic Control Method. Sustainability 2023, 15, 11571. [Google Scholar] [CrossRef]
  71. Hu, Q.; Xue, J.; Liu, R.; Qiping Shen, G.; Xiong, F. Green building policies in China: A policy review and analysis. Energy Build. 2023, 278, 112641. [Google Scholar] [CrossRef]
  72. Bungau, C.C.; Bungau, T.; Prada, I.F.; Prada, M.F. Green Buildings as a Necessity for Sustainable Environment Development: Dilemmas and Challenges. Sustainability 2022, 14, 13121. [Google Scholar] [CrossRef]
  73. Abdel Hay bin Omera, A. The use of green building materials in enhancing sustainable architecture. Int. J. Adv. Res. Plan. Sustain. Dev. 2024, 6, 51–70. [Google Scholar] [CrossRef]
  74. Lee, W.Y.; Fung, D.W.H. Current deficiencies and reinforcement of institutional pillars for reform in the green insurance market: A systematic review. Eur. J. Sustain. Dev. Res. 2023, 7, 13634. [Google Scholar] [CrossRef]
  75. Shao, L.; Yang, J.; Zhang, M. Subsidy scheme or price discount scheme? Mass adoption of electric vehicles under different market structures. Eur. J. Oper. Res. 2017, 262, 1181–1195. [Google Scholar] [CrossRef]
  76. Adetoyese, L.; Ngozi Samuel, U.; Munachi Chikodili, U.; Portia, O. Role and effectiveness of advance payment guarantees in construction contracts. World J. Adv. Sci. Technol. 2024, 6, 88–102. [Google Scholar] [CrossRef]
  77. Zhang, W.; Zhao, D. China Pilot Zone for Green Financial Reform and Innovation. In Green Finance in China; Contributions to Finance and Accounting; Springer: Berlin/Heidelberg, Germany, 2024; pp. 71–93. [Google Scholar]
  78. Roberts, R.L. The Relationship Between Rewards, Recognition and Motivation at an Insurance Company in the Western Cape. Ph.D. Thesis, University of the Western Cape, Cape Town, South Africa, 2005. [Google Scholar]
  79. Yu, E.P.-y.; Luu, B.V.; Chen, C.H. Greenwashing in environmental, social and governance disclosures. Res. Int. Bus. Financ. 2020, 52, 101192. [Google Scholar] [CrossRef]
  80. Dongguan Green Building Association China. Policy Promotion of the Coordinated Development of Green Building Industry and Green Finance and the Launch Ceremony of the Energy Conservation Publicity Month in the Construction Field of Dongguan in 2024. Available online: https://mp.weixin.qq.com/s?__biz=MzIxNjQ3Mzk1NA==&mid=2247645263&idx=1&sn=c27a02ee8b539ecf49d85a61b4022113&chksm=962acbe34099d408917162425d81531c3efc02efd820363eb2625f1c8543914858c11a7e77ad&scene=27 (accessed on 23 March 2025).
  81. Pugnetti, C.; Gebert, T.; Hürster, M.; Huizenga, E.; Moor, M.; Stricker, L.; Winistörfer, H.; Zeier Röschmann, A. Leading the Green Insurance Revolution; ZHAW School of Management and Law: Winterthur, Switzerland, 2022. [Google Scholar]
  82. Ministry of Housing and Urban–Rural Development; National Development and Reform Commission; Ministry of Education; Ministry of Industry and Information Technology; People’s Bank of China; China Banking and Insurance Regulatory Commission. The Green Building Creation Action Plan. Available online: https://www.gov.cn/zhengce/zhengceku/2020-07/24/content_5529745.htm (accessed on 24 January 2025).
Figure 1. Research hypotheses for SEM model.
Buildings 15 01241 g001
Figure 2. Standardized path coefficients of the initial SEM model.
Buildings 15 01241 g002
Figure 3. Standardized path coefficients of the modified SEM model.
Buildings 15 01241 g003
Table 1. Driver system for the acceptance of green housing insurance.
Objective LayersFirst-Level DriversSecond-Level DriversThird-Level Drivers
DimensionsCodeDriversCodeDriversCode
Driver system for the acceptance of green housing insurancePullLPolicy incentivesL1Premium subsidiesL11
Policies and regulationsL12
Regulatory mechanismsL13
Social stimulationL2Public awarenessL21
Public opinion atmosphereL22
PushTGreen housing characteristicsT1Health and safetyT11
Environment livabilityT12
Living convenienceT13
Resource conservationT14
Insurance functionT2Economic compensationT21
Risk managementT22
Order maintenanceT23
Table 2. Profile of questionnaire survey respondents.
Basic
Information
CategorySurvey MethodsFrequency of Valid RespondentsRatio
(%)
Basic InformationCategoryFrequency of Valid RespondentsRatio (%)
ProfessionOwners of green housingDistributed on-site and website24080.81Age22–303615.00
31–5018075.00
51–652410.00
Total240100
Department directors of property management companiesDistributed on-site and website134.37Working years5–10 years1526.32
Department directors of insurance companiesFace-to-face, telephone and email3110.44
11–20 years2849.12
Staff of local construction
authorities
Face-to-face, telephone and email72.36
Over 20 years1424.56
Others institutions including design organizations, consultant firms and research institutionsWebsite and telephone62.02
Total-297100Total57100
Table 3. Results of the scale reliability analysis.
Driver VariablesCronbach’s Alpha
Premium subsidies0.896
Policies and regulations0.900
Regulatory mechanisms0.898
Public awareness0.901
Public opinion atmosphere0.898
Health and safety0.891
Environment livability0.888
Living convenience0.895
Resource conservation0.891
Economic compensation0.900
Risk management0.897
Order maintenance0.902
Overall scale variables0.904
Table 4. GOF measures of the modified SEM model.
Index NameGOF MeasuresInitial SEMRecommended LevelsEvaluation
Absolute fit indexX2/df1.9731.00–3.00Acceptable
Goodness-of-fit index (GFI)0.945>0.9Acceptable
Adjusted goodness-of-fit index (AGFI)0.904>0.9Acceptable
Root mean square residual (RMR)0.032<0.05Acceptable
Root mean square error of approximation (RMSEA)0.042<0.05Acceptable
Comparative fit indexNormed fit index (NFI)0.903>0.9Acceptable
Comparative fit index (CFI)0.904>0.9Acceptable
Relative fit index (RFI)0.922>0.9Acceptable
Parsimony fit indexAkaike information criterion (AIC)96.426Smaller is betterAcceptable
Consistent akaike information criterion (CAIC)187.339Smaller is betterAcceptable
Table 5. Standardized path coefficients and covariance estimates of the modified SEM model.
Path RelationshipStandardized Path CoefficientsS.E.C.R.p
LAccept green housing insurance0.916
TAccept green housing insurance0.8060.1229.609***
T1Push dimension0.8620.1107.789***
T2Push dimension0.8260.12110.278***
L1Pull dimension0.845
L2Pull dimension0.6740.12410.254***
L11Policy incentives0.744
L12Policy incentives0.6910.11313.201***
L13Policy incentives0.6180.1689.433***
L21Social stimulation0.822
L22Social stimulation0.7800.0857.671***
T11Green housing characteristics0.714
T12Green housing characteristics0.7080.07310.271***
T13Green housing characteristics0.6940.08710.385***
T14Green housing characteristics0.6700.1129.178***
T21Insurance function0.823
T22Insurance function0.6900.0969.661***
T23Insurance function0.6680.08210.048***
Note: *** indicates the standardized regression path coefficient and the covariance difference are significantly different at 0.0001 level.
Table 6. Relative importance weights of first-level drivers.
First-Level DriversStandardized Path Coefficients
( X i )
Relative Importance Weights
( Y i )
Ranking
L0.9160.5321
T0.8060.4682
Table 7. Relative importance weights of second-level drivers.
Second-Level DriversStandardized Path Coefficients
( X j )
Relative Importance Weights
( Z j )
Ranking
L10.8450.4491
L20.6740.3594
T10.8620.4032
T20.8260.3873
Table 8. Relative importance weights of third-level drivers.
Second-Level Drivers
( Z j )
Third-Level DriversStandardized Path Coefficients
( X f )
Relative Importance Weights
( Q f )
Ranking in AllRanking Within Each Dimension
L1
(0.449)
L110.7440.33411
L120.6910.31132
L130.6180.27893
L2
(0.359)
L210.8220.29541
L220.7800.28072
T1
(0.403)
T110.7140.28851
T120.7080.28662
T130.6940.28073
T140.6700.270104
T2
(0.387)
T210.8230.31821
T220.6900.267112
T230.6680.258123
Disclaimer/Publisher’s Note: The statements, opinions and data contained in all publications are solely those of the individual author(s) and contributor(s) and not of MDPI and/or the editor(s). MDPI and/or the editor(s) disclaim responsibility for any injury to people or property resulting from any ideas, methods, instructions or products referred to in the content.

