Abstract
Educational buildings are recognized as one of the largest consumers of electrical energy. Inadequate lighting can also have negative physical and psychological effects on these environments. Therefore, optimal lighting design that meets electrical energy needs while providing visual comfort is essential. Reducing glare, primarily caused by artificial lighting in educational environments, is particularly important. Glare can lead to discomfort and eye fatigue, adversely affecting learning performance. To measure and assess this phenomenon, the “Unified Glare Rating (UGR)” metric is employed, which helps designers accurately evaluate the level of glare caused by lighting. This paper examines the parameters of height and surface reflectance as variable factors to achieve an optimal design that reduces lamp demand and minimizes glare, using a three-phase methodology: (1) using Dialux software, two primary scenarios—varying heights (2.5 and 3 m) and reflectance coefficients (ceiling, walls, floor)—were examined, (2) across 100 simulations followed by correlation and regression analyses to assess the effect of each reflectance coefficient (ceiling, walls, floor) on illuminance and the UGR, and (3) energy performance evaluation. Results demonstrate trade-offs: reducing lamps from 15 to 9 lowered energy use by 40% but increased UGR from 13 to 18 (approaching the discomfort threshold of 19), while 12 lamps achieved a balance—20% energy savings, a UGR of 14, and uniformity of 0.67. Surface reflectance emerged as critical, with high-reflectance ceilings (≥85%) and walls (≥80%) contributing 50.9% and 32% to illuminance variance, respectively. This study concludes that multi-parameter optimization—integrating height, lamp quantity, and reflectance—is essential for energy-efficient classroom lighting with acceptable glare levels, providing actionable guidelines for urban educational environments constrained by artificial lighting dependency.
1. Introduction
In today’s world, one of the main challenges in buildings is the challenge of energy consumption. In this regard, artificial lighting is known as one of the major factors in energy consumption. Studies show that buildings are significantly dependent on artificial lighting, and due to this dependence, it constitutes almost 40% of the global annual electricity consumption [1]. Educational buildings, classified as non-residential structures, represent 17% of total energy consumption [2]. Of this amount, across various components of educational buildings, classrooms account for approximately 50% of total energy consumption [3]. Studies have shown that energy consumption in schools varies widely and can range from 86 to 272 kWh per square meter. These differences are due to the design, construction, and operation of the buildings [4]. Additionally, it is reported that 93% of energy consumption in schools comes from electricity, while only 7% is from fossil fuels, including gas. This data highlights the need for strategies to optimize energy consumption and reduce dependence on fossil resources [5]. Research has shown that by using different lighting control methods, significant energy savings can be realized. Estimates suggest that these savings can reach 50% or more. This not only reduces energy costs but also advances environmental sustainability by conserving natural resources and cutting greenhouse gas emissions—potentially by 40% in educational buildings with optimized designs [6]. While lighting design encompasses both natural and artificial sources, this study focuses specifically on artificial lighting optimization due to prevalent daylight obstructions in urban educational settings, such as those in dense cities like Taipei, where surrounding structures limit natural light availability. Although daylighting through windows or clerestories could enhance energy efficiency, its practical integration is constrained in this context, prompting a targeted investigation into artificial solutions. This work serves as a foundational step toward holistic classroom design, with plans to incorporate broader environmental factors like daylight, ventilation, and acoustics in future research, building on the artificial lighting framework established here.
In building design, in addition to considering energy issues, one of the key principles is to create a sense of comfort and security for the occupants. To achieve sustainable design, approaches must optimize energy consumption while ensuring occupant comfort and well-being. Visual comfort, as an essential element of indoor environmental quality, plays a critical role in reducing fatigue, improving health, alertness, and attention, and increasing satisfaction with indoor environments [7]. Among key parameters affecting visual comfort, glare control is especially important [8]. Glare—categorized into discomfort glare and disability glare—can reduce concentration, efficiency, and visibility, leading to long-term health issues. Accurate measurement of discomfort glare remains challenging due to its subjective nature, necessitating tools like the Unified Glare Rating (UGR) and Visual Comfort Probability (VCP) for assessment [9].
Given the dual priorities of energy efficiency and visual comfort, this study investigates two main parameters: height and surface reflectance, which are critical variables in classroom lighting design. The primary contributions include developing an integrated approach to balance energy use, glare, and light uniformity, offering actionable design guidelines for urban classrooms where artificial lighting dominates—a gap underexplored in prior work. The primary objective is to integrate these variables to achieve optimal lighting solutions that enhance visual comfort while reducing electrical energy demand.
Literature Review and Research Gap
In the context of visual comfort and energy efficiency, due to the importance of lighting on electrical energy consumption and user health, many studies have been conducted by researchers in this field.
Studies show that factors such as ceiling height, surface reflectance, and lamp configurations are influential on both topics.
Prior research has extensively explored energy-saving strategies in lighting systems. Studies highlight that the choice of lighting technologies can significantly impact the management and optimization of energy consumption. Replacing traditional light sources with energy-efficient lighting technologies, such as light-emitting diodes (LEDs), is considered a strategy to enhance energy savings in spaces and improve visual comfort [10,11,12]. Studies also show that automated lighting controls [13,14,15,16] and lighting retrofits can reduce energy use by 29–38% in educational buildings [17]. For instance, Hassouneh et al. [18] demonstrated that dimmers could save 10–60% of energy depending on space type and usage patterns. Recent studies reinforce these findings. In 2023, Alfaoyzan and Almasri [19] reported a 44% reduction in university building energy use with LED and sensor upgrades, while in 2024 Miranda et al. [20] achieved 35% savings in classrooms by integrating LEDs with daylight controls, though their focus included unobstructed settings, unlike the urban constraints in this study.
Height is also a key parameter in lighting design, directly affecting the number of lamps, light uniformity, and energy consumption. Studies show that as ceiling height increases, the distance between the light source and the work surface increases, necessitating the use of more or higher-powered lamps to compensate for reduced illuminance. For example, in a study where ceiling height varied from 2.5 to 4.5 m, it was found that every 0.5 m increase in height requires 8–10% more lamps to maintain the desired level of illumination [21].
Similarly, in a study by Ciampi et al. [22], the performance of lighting in a historic building was investigated, and low-cost solutions for saving energy were proposed. The results of the study show that as the height is reduced, the number of lamps required for lighting also decreases, resulting in a reduction in the number of lamps by between 19.5 and 23.5%.
In another study, it was shown that increasing the height from 2.5 to 3 m leads to an 8 to 10 percent increase in lamps required to achieve the necessary 500 lux, and the author also replaced semi-direct LED lamps with asymmetric lenses instead of fluorescent lamps, resulting in a 20% reduction in electrical energy consumption while meeting the UGR standard limit of less than 19 [23]. Alshibani [24] further validated this, reporting an 8–10% increase in lamp demand with a 0.5 m height increase in school buildings, emphasizing height’s role in energy trade-offs.
In another study using virtual reality simulations, it was shown that classrooms with a ceiling height of 4.8 m require 17.3% more lamps to achieve similar performance scores compared to a ceiling height of 3 m. This increased need for lamps is due to reduced light uniformity in taller ceilings [25].
Another study emphasizes increased learning performance in classrooms below 3.5 m due to reduced light scattering [26].
Visual comfort has also been a focal point, with glare control emerging as a critical factor. Architectural features such as window design, surface reflectivity, and material choices significantly influence light distribution and glare.
A study by Jafarian et al. [27] has shown that the choice of wood for interior surface finishes can influence the uniformity of light and overall lighting quality in a space. Additionally, a study by Michael et al. [28] suggests using light-colored and reflective materials for furniture to enhance the distribution of light indoors. Furthermore, research by Makaremi et al. [29] shows that the reflective properties of interior surfaces, particularly walls, play a significant role in enhancing light uniformity.
Other studies indicate that adjusting the reflectivity of interior surfaces (ρ) and the transmittance coefficient of windows (τ) significantly impacts energy consumption and light quality [30].
In this regard, another study reported a 32.6% reduction in artificial lighting energy consumption using glass with a transmittance coefficient of 0.8 and horizontal shading devices [31].
In another study, titled “Efficient Daylighting: The Importance of Glazing Transmittance and Room Surface Reflectance”, the author focused on vertical illuminance and wall reflectance (70–80%) for circadian rhythms. To maintain 300 lux in a room, it is suggested that for rooms with a height of 3 m or more, adaptive glazing that allows 80% of sunlight to pass through (τ = 0.8) be used to ensure comfort for users and keep glare below 19.
In this study, the combination of increasing the wall reflectance coefficient (ρ = 80%) with optimized lamp density resulted in a 32% reduction in energy consumption [32].
In another study titled “Effect of Surface Reflectance on Lighting Efficiency in Interiors”, it was shown that a 10% increase in ceiling reflectance (from 70 to 80) results in a 15 to 18% reduction in lighting power density (LPD). Additionally, increasing floor reflectance (ρ = 40–50%) leads to a balance between energy consumption and visual comfort by reducing glare [33]. Baglivo et al. [34] extended this, demonstrating that a 90% ceiling and 80% wall reflectance in schools reduced LPD by 32%, highlighting the synergy of reflectance and artificial lighting in obstructed environments. Beyond artificial lighting, daylighting’s potential in unobstructed classrooms has been explored; for instance, in 2023, Papadakis, N. and Katsaprakakis, D. A. [35] showed that reflective surfaces and shading reduced energy use by 62–77% in Mediterranean schools, suggesting a need for comparative studies across classroom types—an aspect deferred here to focus on urban constraints.
Despite the undeniable effects of surface reflectance and height on light quality and their impact on energy consumption, and despite the advancements made in previous research, the following limitations exist in the literature:
- -
- Unidimensional focus on parameters: Most studies have only examined separate factors such as lamp configurations, surface reflectivity, or ceiling height, ignoring the combined effects of these parameters on multi-objective criteria (such as light uniformity, glare control, and energy consumption).
- -
- Focus on natural light: Although the impact of architectural features (such as surface reflectivity) on natural light has been widely examined, the role of these parameters under artificial lighting conditions is still not fully recognized. Recent work, such as that of Awang, Mariah et al. [36], achieved 40% savings with smart controls but overlooked height and reflectance interactions, reinforcing this gap.
- -
- Lack of integrated frameworks: The simultaneous impact of ceiling height, surface reflectivity, and lamp density on energy consumption and visual comfort has rarely been analyzed. Moreover, broader classroom design considerations—such as acoustics or unobstructed layouts—are seldom integrated with lighting studies, limiting applicability to diverse educational settings.
This research introduces a novel, holistic approach by investigating the combined influence of height, surface reflectance coefficients, and the number of lamps on classroom lighting performance. Key contributions include (1) quantifying the synergistic effects of height and reflectance on energy and glare control in artificial lighting contexts, (2) providing optimized design parameters for urban classrooms with limited daylight, and (3) laying a foundation for future multi-parameter studies incorporating daylight and acoustics.
To this end, a mixed simulation-statistical methodology was employed to answer three key questions:
- (1)
- How does the combination of surface reflectance coefficients (ceiling, wall, floor) and room height affect the performance of the lighting system?
- (2)
- What combination of surface reflectance coefficients within the specified range of the EN 12464-1 standard [37] has the best impact on the design case being investigated (classroom), and what has been the impact of each surface?
- (3)
- How can a balance be created among the conflicting criteria of illumination, glare, and energy consumption?
In this regard, simulations were initially conducted using Dialux software for two different heights (2.5 and 3 m) and various combinations of reflectance coefficients. Then, using extensive simulations (100 scenarios) with correlation analysis and multiple regression analysis in Excel, the correlation and contribution of each parameter to changes in performance criteria were quantified.
The results showed that high-reflectance surfaces (e.g., ceilings: 90%, walls: 80%) can reduce lighting power density (LPD) while maintaining illuminance uniformity. This led to the interaction of height parameters with the demand for lamp quantity and uniformity.
The results indicated that at a height of 2.5 m and a combination of ceiling reflectance at 90%, wall reflectance at 80%, and floor reflectance at 40%, along with 12 semi-direct lamps, not only does it provide uniform lighting of 500 lux, but it also limits glare to below the threshold of 19 UGR. This research also demonstrated that intelligent design and establishing interactions among various parameters not only lead to over 40% energy savings and cost reductions but also have a significant impact on reducing carbon emissions (e.g., 300.67 kg CO2/year per classroom) while ensuring visual comfort through effective glare control (UGR < 19), as validated through 100 detailed simulations and advanced statistical analyses.
Furthermore, the findings highlight the critical interplay between design parameters and provide specific guidelines on multi-objective criteria (glare control, light uniformity, energy consumption) that can serve as a useful guide for lighting designers and engineers to design more efficient and sustainable lighting systems by considering all influencing factors.
2. Materials and Methods
This research is based on a classroom at the National Taipei University of Technology as a sample to evaluate the parameters under investigation, including glare and energy consumption. To achieve this goal, Dialux evo 12.1 software (DIAL GmbH, Lüdenscheid, Germany) was used.
Although this study is based on a typical classroom environment found in many educational institutions, the classroom examined in this research is located in the Sixth Academic Building. The position of the building is shown in Figure 1.
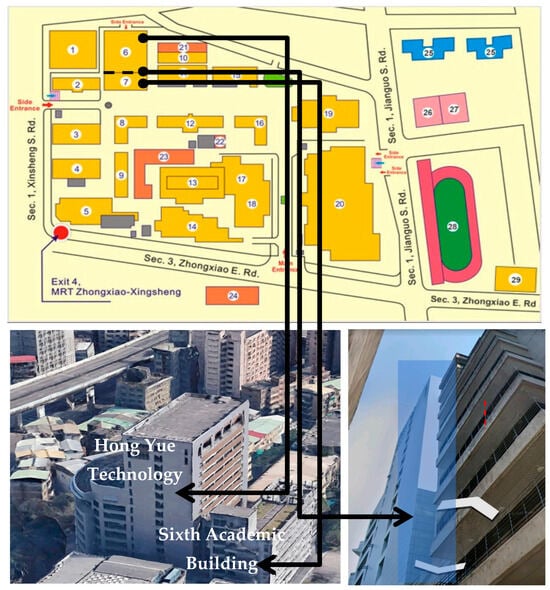
Figure 1.
Location of the Sixth Academic Building (number 7) and Hong Yu Building (number 6) at National Taipei University of Technology (source: Google Earth, 2025) [38,39].
The selected classroom has dimensions of 8 m × 7 m (56 m2) with ceiling heights of 2.5 m and 3 m, chosen because these reflect typical urban university classroom sizes in Taiwan, aligning with NTUT architectural standards and common educational building layouts [38]. These dimensions accommodate 24 students, consistent with average class sizes in higher education, and the height range (2.5–3 m) represents standard ceiling heights in modern and renovated school buildings, allowing us to test height’s impact on lighting design [21]. Classrooms in this building face serious limitations in utilizing natural light, even during daylight hours and peak usage times, due to its proximity to the tall Hong-Yue Technology Research Building, which is directly in front of its windows. To address daylight potential and its limitations an initial daylight assessment was conducted for this classroom using Dialux. Simulations evaluated daylight availability at noon (12 p.m.) under two conditions: with obstruction (adjacent Hong-Yue building) and without. Per EN 12464-1 standards [37], a classroom for adult education requires 500 lux. Without obstruction, daylight provided an average of 239 lux ranging from 31.4 to 1853 lux as shown in Figure 2, where the color scale represents illuminance levels (in lux), with blue indicating lower values and orange indicating higher values, falling short of the standard due to Taiwan’s predominantly cloudy and rainy climate, where overcast conditions prevail approximately 60% of the year [5]. This variability, combined with the site’s latitude (25° N), limits daylight reliability, though it reduces artificial lamp demand during daytime compared to obstructed conditions. With obstruction, daylight contribution dropped to an average of 1.66 lux ranging from 0.19 to 0.66 lux, as shown in Figure 3, where the color scale represents illuminance levels (in lux), with dark blue indicating lower values (around 0.19 lux) and lighter shades indicating higher values, a reduction of over 99% in illuminance. This near-total loss renders the classroom dark during the day, necessitating full reliance on artificial lighting, Figure 4 and Figure 5 show light distribution renderings in both positions. These findings reflect a broader urban challenge in Taiwan, where narrow streets, dense building layouts, and close proximities—often less than 5 m apart—obstruct daylight in many structures, as observed in Taipei’s compact urban fabric [40]. Consequently, this study prioritizes artificial lighting strategies to ensure visual comfort and energy efficiency, addressing real-world constraints in such urban educational environments.
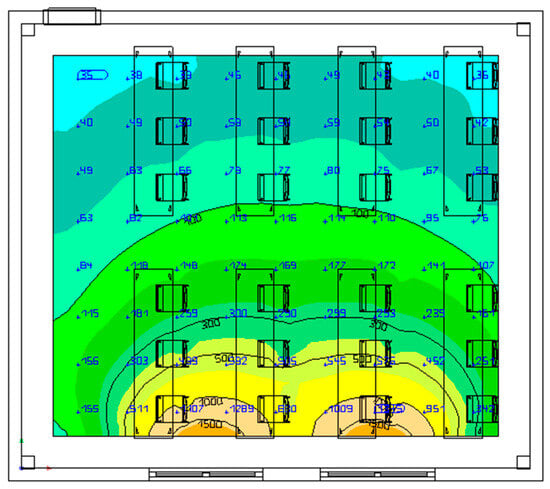
Figure 2.
Daylight distribution/without obstruction.

Figure 3.
Daylight distribution/with obstruction.
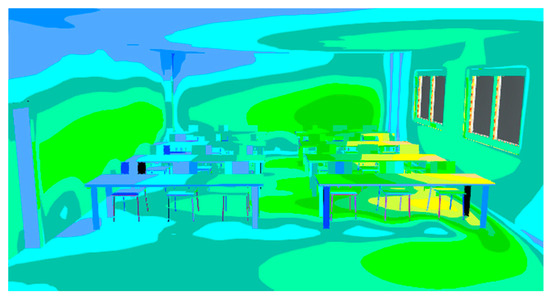
Figure 4.
Visual representation of daylight distribution/without obstruction.
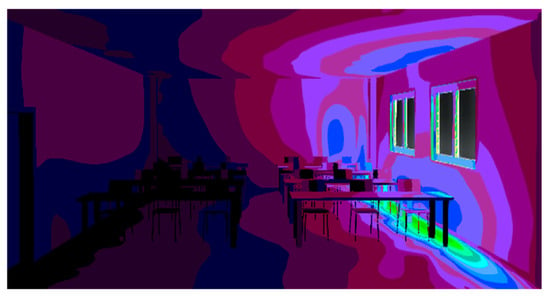
Figure 5.
Visual representation of daylight distribution/with obstruction.
2.1. Lighting Standards
To design indoor lighting for various applications, specific standards must be followed. EN 12464-1 [37] specifies that for different applications in educational buildings, the required illuminance varies from 300 lux to 750 lux, depending on the type of usage, as shown in Table 1 [20]. This study focuses on the lighting design for a university classroom intended for adults, including evening classes.

Table 1.
Lighting specifications for different classes.
2.2. Research Methodology Framework
This study employs an integrated three-phase methodology combining lighting simulation, statistical analysis, and energy performance calculation:
Phase 1: Lighting Simulation in Dialux
- -
- Collected all case study parameters (room dimensions, surface reflectance, luminaire specifications).
- -
- Conducted validation tests comparing simulated vs. measured data.
- -
- Performed main simulations under two ceiling heights (2.5 m/3 m) with varying reflectance coefficients.
Phase 2: Statistical Analysis
- -
- Applied multiple linear regression in Excel to quantify parameter impacts.
- -
- Conducted ANOVA to verify model significance.
Phase 3: Energy Performance Calculation (IPMVP Option A)
Energy savings were quantified following the International Performance Measurement and Verification Protocol (IPMVP) using a three-step approach:
- Baseline Energy Consumption
- -
- N = Number of luminaires
- -
- P = Power per luminaire
- -
- = Daily operational hours
- -
- = Monthly working days
- 2.
- Operational Savings Calculation
- 3.
- Carbon Emission Reduction
2.3. Unified Glare Rating (UGR)
The UGR (Unified Glare Rating) is one of the most important goals of lighting design, aiming to create an environment with the least amount of glare. The UGR serves as a standard index for quantitatively assessing glare in indoor environments. Since glare can lead to decreased concentration, eye fatigue, and consequently reduced productivity, designers can create a more efficient and comfortable environment for occupants by controlling UGR. Many factors can influence the UGR value, including the type of light source (size and shape), the reflectivity of surfaces, and the observer’s position. The UGR calculation formula is based on the GUT model and is calculated as follows:
= background luminance (cd/m2), excluding the contribution of the glare sources.
= luminance of the luminaire (cd/m2).
3 = solid angle subtended at the observer’s eye by the luminaire (steradians).
p = Guth position index.
The UGR values can range from 10 to 30, each carrying different meanings regarding glare assessment, as shown in Figure 6.
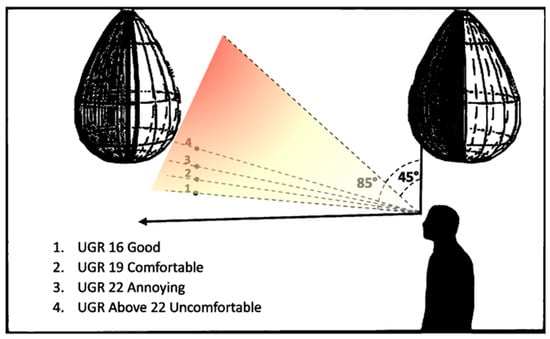
Figure 6.
Unified Glare Index and its effect on visual comfort.
The UGR lower 16 is considered good, and up to 19 is acceptable, although it indicates higher glare levels. However, 19 is the threshold; values above this lead to increasing discomfort due to glare, reaching the “annoying” and “uncomfortable” levels, thus becoming unacceptable for suitable design. While 10 to 16 is good and up to 19 is acceptable, lower UGR values are preferable, indicating less glare. Therefore, various standards, such as CIE 117 [41], provide specific definitions for different UGR values [20], as presented in Table 2.

Table 2.
UGR values.
There are also software tools available that allow designers to evaluate lighting quality before the actual project implementation. These software tools measure the UGR, including AGI32, Revit, and Dialux. Among these, Dialux, which specializes in lighting design, is one of the most reputable software for evaluating lighting and the UGR, allowing for optimized lighting design through simulation [15,42].
2.4. Lighting Setup
As mentioned, this research involved simulations performed using Dialux software (version 12.1). The research design was experimental–analytical. The independent variables in this research included room height and reflectance coefficients of the ceiling, walls, and floor. The steps were carried out as follows:
2.4.1. Project Information Collection
- Classroom Simulation
As stated earlier, this study simulated a real classroom at the National Taipei University of Technology in Taipei. The room’s dimensions are detailed in Figure 7. A rectangular room with dimensions of 8 by 7 m has an area of 56 square meters. It can accommodate 24 students, and the room is designated for adult education at the university, with classes held in the afternoons as well. The height of the room varied across two scenarios: one scenario with a height of 2.5 m and another scenario with a height of 3 m. The calculations focused solely on artificial lighting conditions, excluding natural light.
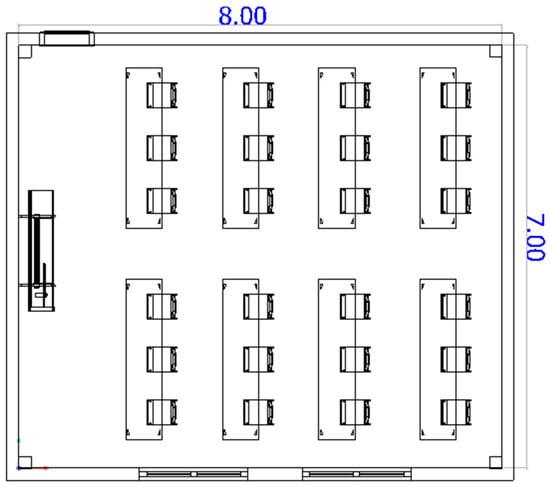
Figure 7.
Geometric dimensions of the classroom.
- Surface Reflectance Coefficients
Different surfaces have varying degrees of light reflectance, which impacts how light is distributed and, consequently, the overall appearance of the space. Reflectance coefficients significantly affect glare and brightness in a location. The European standard EN 12464 [37] specifies appropriate reflectance ranges for ceilings, floors, and walls, as shown in Table 3 [43]. In this research, each scenario was initially set with the lowest standard limit and then evaluated at the highest standard limit.

Table 3.
Reflectance range recommended values of surface.
2.4.2. Lamp Selection
Dialux software provides a comprehensive library of various lamps and their specifications for different applications, facilitating the selection of the appropriate option. The lamp selected for this study is an Indirect/Direct LED lamp with a power rating of 29.0 W, chosen after comparing it with alternatives like 36W fluorescent lamps (80–100 lm/W) and higher-wattage LEDs (e.g., 40 W, 110 lm/W). The 29W LED, manufactured by Current, offers superior luminous efficacy (124.1 lm/W) compared to fluorescents (20–30% less efficient), reducing energy use, and its indirect/direct design minimizes glare (UGR < 19) more effectively than direct-only lighting. It also provides a Color Rendering Index (CRI) of 80, ensuring accurate color perception critical for educational settings, and a Correlated Color Temperature (CCT) of 3500K, offering a warm yet neutral tone that balances comfort and alertness per EN 12464-1 standards [37]. Higher-wattage LEDs (e.g., 40 W) were avoided as they exceeded the required 500 lux, wasting energy without improving comfort, while lower-wattage options (e.g., 20 W) risked insufficient uniformity. Its availability in Dialux’s library ensured accurate simulation. The light distribution curves are illustrated in Figure 8. The lamp configuration was manually arranged in a grid pattern to ensure uniform illuminance of 500 lux across the 56 m2 classroom area, meeting EN 12464-1 standards [37]. This manual approach optimized lamp numbers (9–15) based on height and reflectance variations, ensuring even light distribution and glare control tailored to desk layouts, unlike automated placement, which might not account for specific classroom needs. According to the given standards, light can be positioned in the space either manually or automatically in Dialux. For this research, manual positioning was utilized. The classroom standards were entered into Dialux based on Table 1, and manual methods were employed for light distribution.
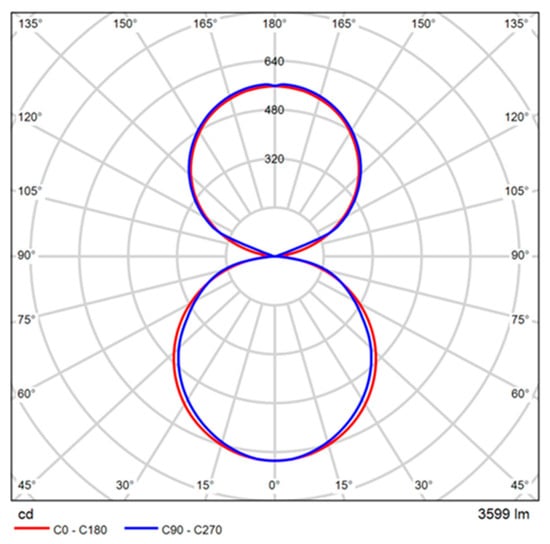
Figure 8.
Indirect/direct LED.
2.4.3. Glare Assessment
To evaluate glare within the classroom using Dialux, two methods exist: the Surface Calculation method and the Point Calculation method. The Point Calculation method is primarily used for assessing glare on a specific object and point. Since this study aims to calculate the overall glare in the classroom, the Surface Calculation method was employed. The Concluding Surface method in Dialux 11 was utilized, which involved the following:
- -
- Drawing a rectangle covering all desks.
- -
- Considering a step width of 15 degrees for seated students, allowing for eye movement without head lifting.
- -
- Viewing angles ranged from 0 to 180 degrees, representing a full-frontal view.
Glare calculation points were established at 9 points on the x-axis and 8 points on the y-axis, which were automatically suggested by Dialux. However, the number of points can also be manually adjusted, typically based on the number of rows and objects present. Alternatively, the automatic suggestions from Dialux, which usually propose more points, can be accepted. UGR measurements were taken at an eye level of 1.2 m, corresponding to seated students (Figure 9).
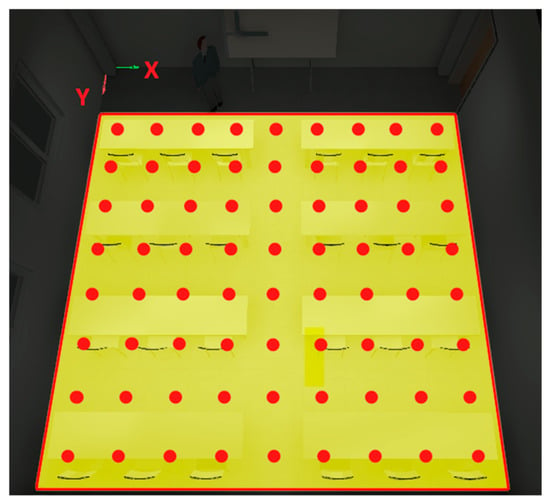
Figure 9.
Measurement points.
3. Results
In this study, simulations were conducted under two scenarios. The first scenario was investigated at a height of 3 m, while the second scenario was analyzed at a height of 2.5 m. Each scenario was examined with different reflectance coefficients—high and low—for the ceiling, walls, and floor surfaces. Prior to initiating the scenarios, a validation process was conducted using Dialux to ensure that the simulation results accurately represent real-world conditions. The purpose of these scenarios was to analyze the effects of surface reflectance coefficients and height on glare and lamp requirements in a classroom. Ultimately, the goal was to achieve an optimal design that balances visual comfort while reducing electrical energy consumption.
3.1. Model Validation
To establish the reliability of the Dialux simulation prior to conducting experiments with the new 29 W LED lamps, a validation process was performed using the classroom’s original fluorescent lighting. This step aimed to confirm that Dialux can accurately represent real-world conditions in the Sixth Academic Building classroom at the National Taipei University of Technology, an 8 m × 7 m space with obstructed daylight. The validation was conducted under post-sunset conditions to isolate the artificial light output, with blinds drawn to eliminate ambient light interference. The classroom was originally equipped with 15 fluorescent lamps (36W, 90 lm/W, CRI 70, CCT 4000K), mounted on the ceiling at a height of 3 m. Following EN 12464-1 standards [37], a 60 cm × 60 cm horizontal grid was established at 85 cm above the floor—representing the standard working plane height for desks. Illuminance levels at 12 evenly distributed points were measured using a calibrated lux meter (Konica Minolta CL-200, range: 0.1–99,990 lx, accuracy: ±2%, resolution: 0.1 lx), reflecting a typical 24-student layout. Additionally, surface reflectance coefficients were measured with a Colorstrike device to ensure identical conditions in the simulation: ceiling at 0.80, walls at 0.75, and floor at 0.29. These parameters, along with the fluorescent lamp specifications, were input into Dialux to replicate the real classroom setup, and illuminance values at the same 12 points were simulated. Table 4 compares the measured and simulated illuminance values. The measured average illuminance was 432 lux, while the simulated average was 440 lux, with deviations attributed to minor real-world factors (e.g., lamp aging or surface imperfections). Validation metrics included the following: (i) percentage error (|e|%), calculated as (|simulated − measured|/measured) × 100; (ii) root mean square error (RMSE); (iii) coefficient of determination (R2); and (iv) Willmott’s index of agreement (d). The percentage error ranged from 0.23% to 3.38%, averaging 1.85%. The RMSE was 8.14 lx, indicating low discrepancy. The R2 value of 0.96 showed a strong correlation between measured and simulated data, and Willmott’s d of 0.97 (near 1) confirmed excellent agreement. These results align with acceptable thresholds (e.g., RMSE < 10 lx, R2 > 0.95, d > 0.9), demonstrating that Dialux reliably replicates the classroom’s original fluorescent lighting conditions and is a valid tool for the subsequent experimental scenarios with the new LED lamps.

Table 4.
Comparison of measured and simulated illuminance with original fluorescent lamps.
3.2. First Scenario
All experiments were conducted at a height of 3 m using semi-direct lamps.
- First Case
In the first case, the reflection coefficients of the surfaces were set as follows: walls = 0.5, floor = 0.2, and ceiling = 0.7. A total of 15 lamps were installed, resulting in an illumination level of 455 lux. The uniformity was measured at 64, indicating that the light distribution in the room ranged from 291 to 541 lux. The Unified Glare Rating (UGR) was 16, which met the standard requirements, as shown in Figure 10 and Figure 11.
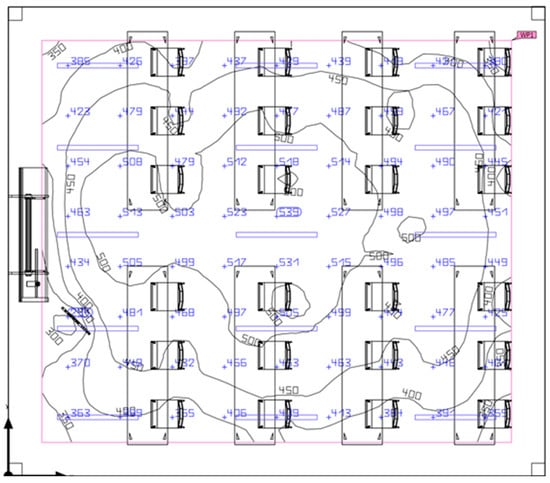
Figure 10.
Scenario 1, case 1/light distribution.
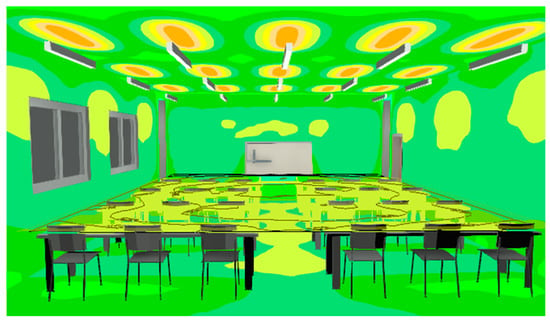
Figure 11.
Visual Representation of Light Distribution/case 1.
- Second Case
In the second case, similar to the first case, the same number of light bulbs were used, which is 15 bulbs. Only the reflection factors have changed and increased, with walls at 0.8, the floor at 0.4, and the ceiling at 0.9. In this case, we reached 621 lux in the room, with uniformity at 68, and the dispersion in the room ranged from 423 to 710 lux, resulting in a UGR of 13, as shown in Figure 12 and Figure 13.
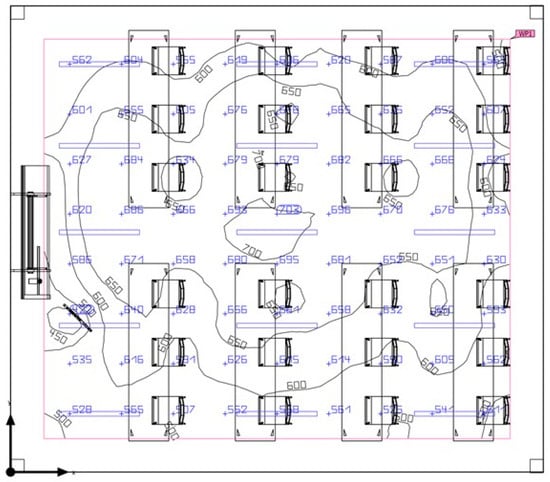
Figure 12.
Scenario 1, case 2/light distribution.
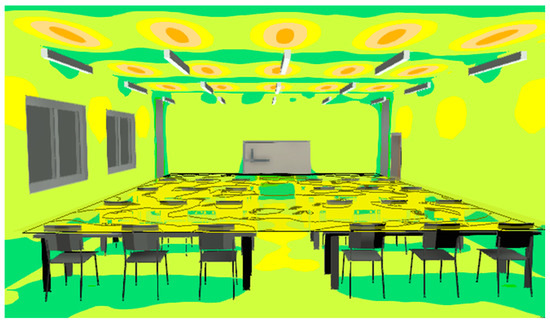
Figure 13.
Visual representation of light distribution/case 2.
- Third case
In the third case, since the room illumination with 15 lamps in the previous case exceeded the standard of 500 lux, conditions were suitable to reduce the number of lamps. With a high reflectance coefficient of the surfaces, the illumination was achieved with 12 lamps, resulting in a brightness of 510 lux. Uniformity reached 65, with a variation between 331 and 604, and the Unified Glare Rating (UGR) was 15, as shown in Figure 14 and Figure 15.
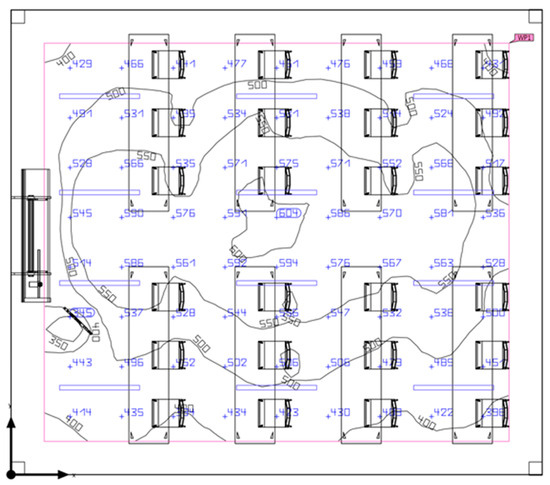
Figure 14.
Scenario 1, case 3/light distribution.
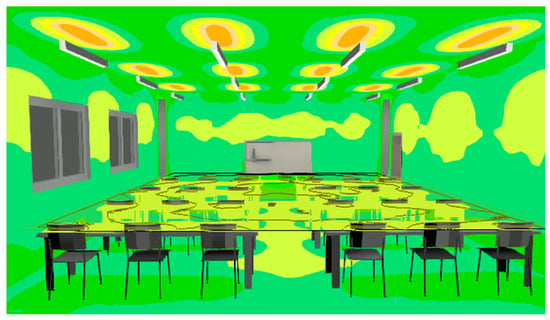
Figure 15.
Visual representation of light distribution/case 3.
Table 5 presents the conditions for each of the three cases in the first scenario, focusing on uniformity, the UGR, the number of lamps, and the illumination level (lux) provided in the room.

Table 5.
First scenario.
3.3. Second Scenario
This scenario was also evaluated in three cases. The height in all examined cases is 2.5 m, and, similar to the first scenario, semi-direct lamps were used.
- First case
In the initial condition of this scenario, similar to the first case of the first scenario, it was initially conducted with low reflection factors, walls = 0.5, the floor = 0.2, and the ceiling = 0.7. With the installation of 12 lamps, an illumination level of 498 lux was achieved. In this case, the uniformity was 59, with the lux distribution in the room varying from 293 to 640, and the UGR was 19, as shown in Figure 16 and Figure 17.
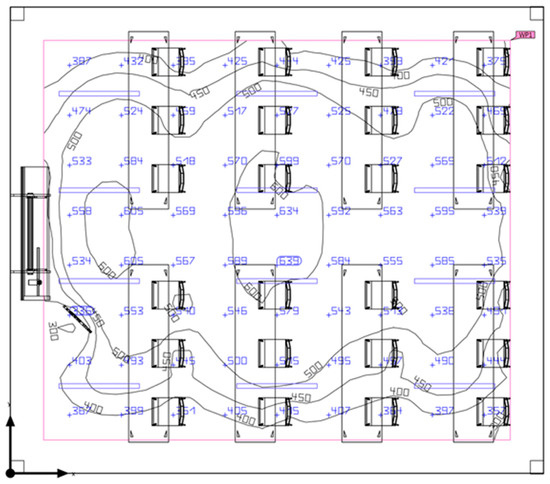
Figure 16.
Scenario 2, case 1/light distribution.
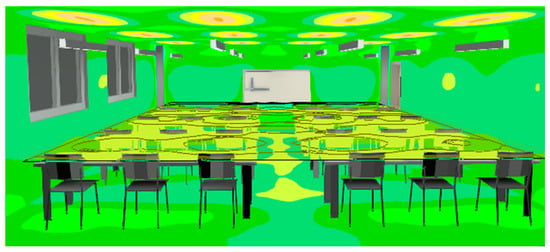
Figure 17.
Visual representation of light distribution/case 1.
- Second Case
In the second case, the experiment was conducted with the same number of lamps as in the first case, which is 12. However, the reflection factors were increased: walls = 0.8, floor = 0.4, and ceiling = 0.9. As a result, the illumination level in the room reached 682 lux, with a uniformity of 67. The light distribution varied between 456 and 838, and the UGR was 14, as shown in Figure 18 and Figure 19.
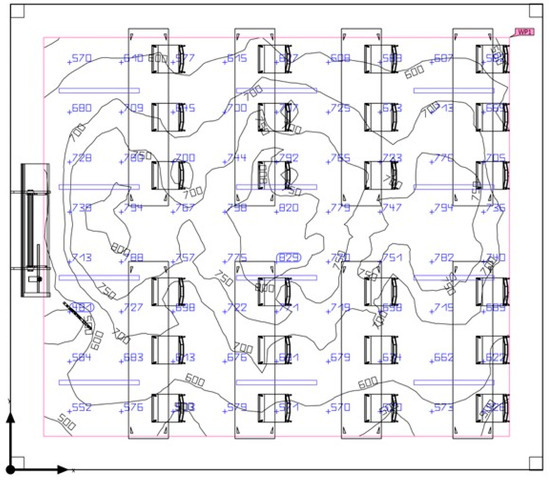
Figure 18.
Scenario 2, case 2/light distribution.
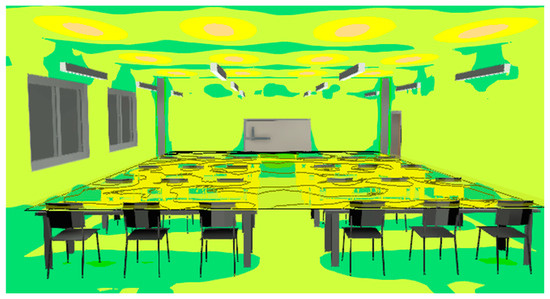
Figure 19.
Visual representation of light distribution/case 2.
- Third Case
Despite meeting the standards in the previous case, the illumination level exceeded the required standards for the room. This allowed for the use of fewer lamps. Therefore, in this third case, the number of lamps was reduced to 9, resulting in an illumination level of 524 lux. In this situation, the uniformity was 60, and the light distribution in the room varied from 317 to 666 lux, with a UGR of 18, as shown in Figure 20 and Figure 21.
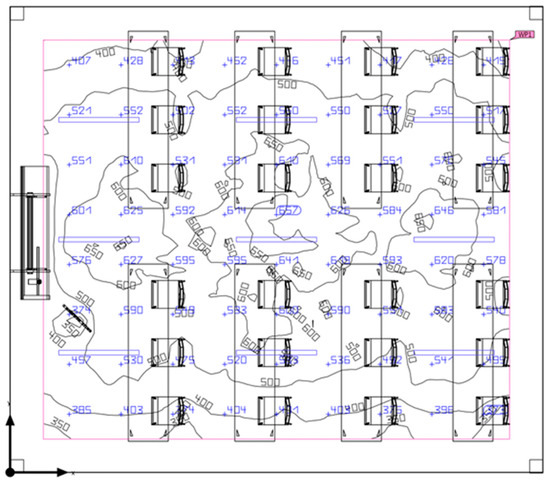
Figure 20.
Scenario 2, case 3/light distribution.
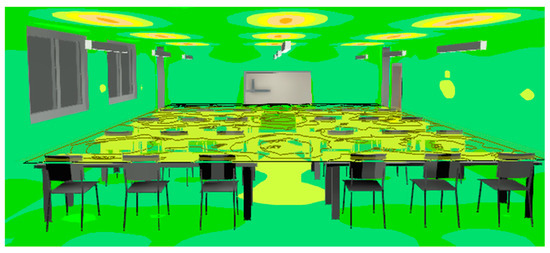
Figure 21.
Visual representation of light distribution/case 3.
Table 6 shows the conditions in each of the three cases of the second scenario, similar to the first scenario, regarding uniformity, the UGR, number of lamps, and illumination (lux) provided in the room.

Table 6.
Second scenario.
3.4. Analysis and Comparison of the Results of the Two Scenarios
3.4.1. Glare Analysis Using UGR
Glare depends on various factors such as the angle of view, the brightness (i.e., the amount of light emitted from the source), and the distance from the light source. There are different criteria for measuring glare; for artificial light sources, the UGR is one of them, while for natural light, DGP and DGI are among the criteria. These metrics allow for the assessment of the amount of light that may cause discomfort to the eyes. In this study, a classroom simulation was conducted to calculate the glare from artificial light using the UGR metric.
The UGR results were presented using the Conclusion Surface Dialogues method in each scenario with three cases in Table 4 and Table 5. For the analysis of the obtained UGR results, the CIE standard was utilized, as presented in Table 2.
The UGR limitations range from 10 to 30. A lower UGR indicates less glare, with a UGR of 10 suggesting that glare will go unnoticed, while a UGR of 30 can cause significant distraction. Values above 19 generally indicate serious glare, and in fact, 19 is the red line. The results of this study indicate that indirect lamps are inherently a good choice for classrooms, as glare above the red line was not produced in any of the scenarios.
In the first scenario, the first case with a height of 3 m and a low reflectance coefficient resulted in a UGR of 16, indicating that glare is perceptible. In the second case, under similar conditions to the first, but with an increased reflectance coefficient, the UGR was 13, indicating that the level of glare is only slightly perceptible and is at a good and high standard. In the third case, all conditions were similar to the previous case, meaning with high reflectance of surfaces, but the number of lamps was reduced. The UGR in this case was 15, which is still slightly perceptible but somewhat close to being fully perceptible. It remains at a good standard, although not as high as in the previous case, and the glare is more noticeable, yet it has not reached the level of full perceptibility.
In the second scenario, at a height of 2.5 m, in the first case, the reflectance factor was low, resulting in a UGR of 19, which is at the standard threshold and only acceptable, but not an ideal condition in terms of glare. In the second case of the second scenario, with the same conditions as the first, the reflectance factor of the ceiling, wall, and floor surfaces was increased, resulting in a UGR of 14, which is at the standard level of just perceptibility and is quite good. In the third case of the second scenario, with the high reflectance factor maintained, the number of lamps was reduced from 12 to 9, resulting in a UGR of 18, which falls into the perceptible range but is very close to 19, indicating it is just acceptable.
In terms of glare, the best condition is the second case of the first scenario (at a height of 3 m), which has a high reflectance factor and 15 lamps, resulting in a UGR of 13. In this case, by simply increasing the reflectance factor of the ceiling, wall, and floor surfaces compared to the first case of the first scenario, the UGR improved from 16 to 13, indicating a reduction of 3 units of glare and highlighting the role of the reflectance factor in improving glare. Additionally, by reducing the number of lamps from 15 to 12 in the third case of the first scenario, the UGR increased from 13 to 15. Although this value is still acceptable, it represents an increase of 2 units compared to the second case of the first scenario.
The worst condition in terms of glare is related to the first case of the second scenario, where the height is 2.5 m and the reflectance factor is low, resulting in a UGR of 19. This is 5 units higher than the second case of the same scenario, where the UGR is 14 due to an increased reflectance factor with the same number of 12 lamps. In the third case, by reducing the number of lamps from 12 to 9, the UGR increased from 14 to 18.
These results indicate that surfaces with high reflectance can distribute light better and prevent the concentration of light in one area. Additionally, the number of lamps also affects the level of glare and light distribution.
When comparing the first case of the first scenario with the first case of the second scenario, where both conditions maintained the same reflectance factor but were conducted at different heights (3 m for the first case and 2.5 m for the second), it is observed that the UGR in the first case of the first scenario is 16, while in the first case of the second scenario, it is 19. The change in height from 3 m to 2.5 m leads to an increase of 18.75% in UGR. This demonstrates the significant impact of height on glare in the environment.
Ultimately, optimizing lighting conditions requires attention to all three factors: height, reflectance factor, and the number of lamps. All three factors must be managed simultaneously to improve light quality, control glare, and maintain optimal conditions.
3.4.2. Request for the Number of Lamps
In terms of the number of lamps, the best scenario is the third case of the second scenario, where with a high reflectance coefficient and a height of 2.5 m, achieved 524 lux in the room using 9 lamps. If compare this with the first case of the same scenario, by simply increasing the reflectance coefficient, the number of lamps decreased from 12 in the first case to 9 in the third case, which means a 25% reduction in the number of lamps. This reduction directly leads to lower electricity consumption, and consequently, reduced electricity costs, which can have significant positive financial savings in the long term. However, this reduction impacts visual comfort: in scenario 2, case 3 (9 lamps), the UGR rose to 18 and uniformity dropped to 0.60, compared to scenario 2, case 2 (12 lamps), where 682 lux was achieved with a UGR of 14 and uniformity of 0.67—both within standards (UGR < 19, uniformity > 0.6), but the latter offers better glare control and light distribution at the cost of three additional lamps.
Overall, in terms of the number of lamps, better results were achieved at a lower height compared to a higher one. The worst case in terms of the number of lamps was in the first case of the first scenario, where even with 15 lamps, the required lux level for the room, which should be 500 lux according to standards, was not met, reaching only 455 lux with the stated number of lamps.
Ultimately, just by increasing the reflectance coefficient from the first case of the first scenario with 15 lamps to 12 lamps in the third case of the same scenario, we observed a 20% reduction in the number of lamps. As a result, regardless of height, merely increasing the reflectance coefficient led to a 20 to 25% reduction in the number of lamps across each scenario. This reduction, while efficient, must be balanced with visual comfort, as seen in scenario 1, case 2 (15 lamps, 3 m height), where high reflectance yielded an optimal UGR of 13 but required 66% more lamps than scenario 2, case 3.
Additionally, if we compare the best cases in terms of the least number of lamps from each scenario at two different heights of 2.5 and 3 m, in the third case of the first scenario at a height of 3 m, there were 12 lamps, while in the third case of the second scenario at a height of 2.5 m, there were 9 lamps. This indicates a reduced need for lamps at a lower height, showing a 25% decrease from the third case of the first scenario to the third case of the second scenario, though the lower height and fewer lamps increased glare perceptibility unless mitigated by high reflectance.
These results highlight the significant role of the reflectance coefficient and height, and their impact on the number of lamps required.
Energy Savings from Lamp Reduction
Considering the power of each lamp, which is 29 watts, and the usage hours of the classroom, which extend until 9 PM (meaning a daily operating time of 12 h from 9 a.m. to 9 p.m.), with 24 working days in a month and electricity cost in Taiwan: USD 0.12 per kilowatt-hour [30].
In the first scenario, where there is a 20% reduction in lamps from 15 to 12:
- -
- The initial annual consumption is 1503.36 kilowatt-hours, and the annual consumption after the reduction is 1202.69 kilowatt-hours.
This results in an energy saving of 300.67 kilowatt-hours (20% reduction) and a cost saving of USD 36.08 per year.
In the second scenario, the reduction in lamps from 12 to 9 in cases one to three:
- -
- The initial annual consumption with 12 lamps in case one is 1202.69 kilowatt-hours, and the annual consumption after the reduction to 9 lamps in case three is 902.02 kilowatt-hours. In this scenario, the energy consumption reduction is also 300.67 kilowatt-hours, resulting in a cost saving of USD 36.08 per year.
Thus, from the first scenario in case one (15 lamps in the initial state) to the second scenario in case three (with reduced height and increased surface reflectance), there will be an energy saving of 601.34 kilowatt-hours and a cost saving of USD 72.16 per year.
These savings results can lead to significant savings in the long term, especially when implemented in a large number of classrooms. Table 7 and Figure 22. summarizes the results from scenarios 1 to 2.

Table 7.
Energy consumption and savings from lamp reduction.
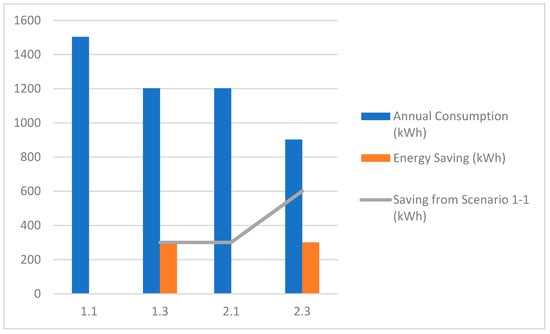
Figure 22.
Energy consumption and cost savings across classroom lighting scenarios.
Descriptions of Scenarios:
- -
- Scenario 1-1: Initial state with a height of 3 m and low reflectance.
- -
- Scenario 1-3: First improvement with increased reflectance at a height of 3 m.
- -
- Scenario 2-1: Second improvement with a height reduction to 2.5 m and low reflectance.
- -
- Scenario 2-3: Final improvement with a height reduction to 2.5 m and increased reflectance.
- -
- Savings from scenario 1-1: The amount of energy and cost savings compared to the initial state (scenario 1-1).
Analysis of Results
With the increase in reflectance and the decrease in height, the number of lamps and energy consumption significantly decreases. The highest savings are achieved in scenario 2-3, where both the height is reduced and the reflectance is increased.
Additionally, Figure 23 shows the impact of each factor—height and surface reflectance—on savings.
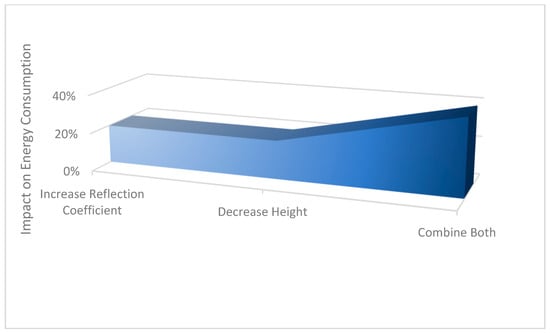
Figure 23.
Impact of ceiling height and surface reflectance on energy savings.
Increasing the reflectance alone (without changing the height) led to a 20% reduction in energy consumption, comparing scenario 1-1 (height 3 m, low reflectance) with Scenario 1-3 (height 3 m, high reflectance). Also, reducing the height (with constant reflectance) had a 20% impact on energy consumption, comparing scenario 1-1 (height 3 m, low reflectance) with scenario 2-1 (height 2.5 m, low reflectance). The combined effect of reducing height and increasing reflectance, comparing scenario 1-1 (height 3 m, low reflectance) with scenario 2-3 (height 2.5 m, high reflectance), resulted in a 40% energy saving. Therefore, considering that the combination of these two factors has a multiplied effect, if the goal is maximum optimization, combining height reduction and increased reflectance is essential.
3.4.3. Balanced Design
In the previous sections, we examined the optimal lighting conditions regarding glare and the number of lamps used. While the second case from the first scenario demonstrated the best glare conditions, it required 15 lamps to achieve the necessary illumination in the room, which was more than in other cases.
When considering both the number of lamps and energy efficiency, the third case from the second scenario emerged as the best option. It minimized the number of lamps to 9 while achieving 524 lux, slightly exceeding the standard for a room. However, this scenario was optimal in only one aspect, as it exhibited poor glare performance compared to other cases, with a Unified Glare Rating (UGR) of 18.
The goal of this study is to find an optimal design that balances energy efficiency and visual comfort. Among the analyzed cases, the second case from the second scenario, which utilized 12 lamps, achieved a UGR of 14 and provided 682 lux. Although it had a higher number of lamps than the third case, the glare level was very satisfactory, only one unit away from the best glare condition examined, while using three fewer lamps.
The results indicate that increasing the reflectance coefficient of surfaces reduces UGR values. Additionally, increasing the number of lamps can also lead to a decrease in the UGR. Conversely, reducing the distance between lamps and the working area tends to increase the UGR, though lower heights can reduce the number of lamps needed. To achieve an appropriate design, it is essential to manage all these factors effectively.
However, despite the fact that the second case from the second scenario was the best and most balanced case, more experiments were needed for a more accurate result regarding the final decision on the reflectance coefficient of surfaces. Therefore, 100 simulations were conducted with different reflectance coefficients in this case, as presented in Table 8, Table 9, Table 10, Table 11 and Table 12. Each surface was simulated with all ranges from high to low, and for clearer results, the data were divided into five categories. The first category had a ceiling reflectance of 90, tested with all ranges of wall reflectance, namely 50, 60, 70, and 80, and all ranges for floor reflectance, which were 20, 25, 30, 35, and 50. The second category had a ceiling reflectance of 85, the third category 80, the fourth category 75, and the fifth category 70, with each category being tested similarly to the first with various ranges for walls and floors. The results are presented in five diagrams for each category.

Table 8.
Results with a ceiling reflectance of 90.

Table 9.
Results with a ceiling reflectance of 85.

Table 10.
Results with a ceiling reflectance of 80.

Table 11.
Results with a ceiling reflectance of 75.

Table 12.
Results with a ceiling reflectance of 70.
The results of Figure 24, Figure 25, Figure 26, Figure 27 and Figure 28 clearly indicate the impact of lighting and room uniformity on glare, where high levels of lighting and uniformity significantly reduced glare. However, the worst conditions in these 100 simulations were related to cases where the reflectance of all surfaces was low. Worse still were cases where the ceiling and wall reflectance were low, and only the floor reflectance was increased, resulting in the worst conditions in terms of uniformity. This led to a decline in uniformity and poor glare conditions, where glare increased, even with the positive impact of increasing the level of brightness, which is evident in Figure 24, highlighting the drop in uniformity and increase in glare.
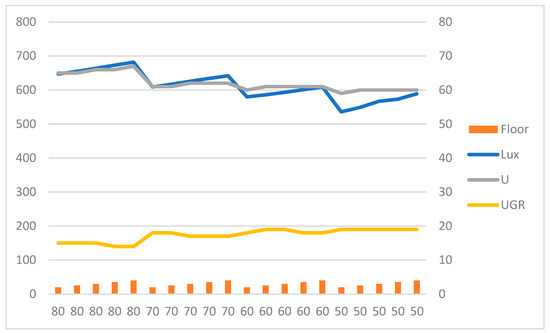
Figure 24.
Ceiling reflectance of 90.
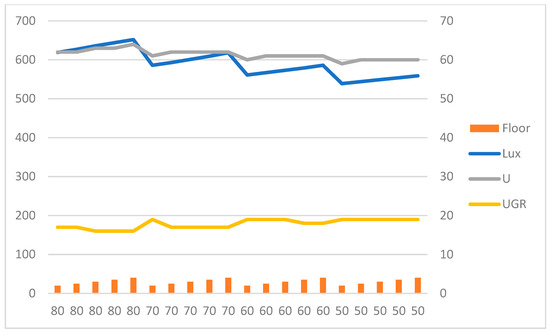
Figure 25.
Ceiling reflectance of 85.
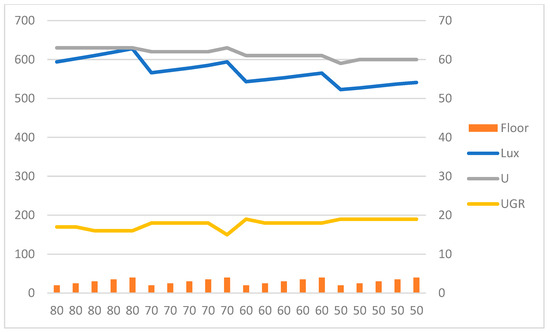
Figure 26.
Ceiling reflectance of 80.
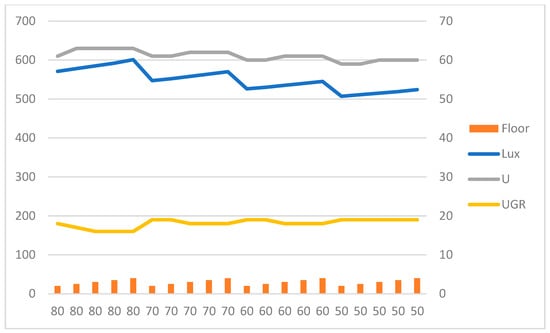
Figure 27.
Ceiling reflectance of 75.
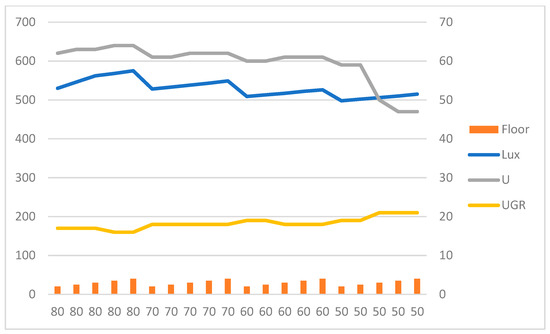
Figure 28.
Ceiling reflectance of 70.
The results indicate that when the floor has high reflectance while the ceiling and walls have low reflectance, it leads to poor lighting outcomes. Among the 100 scenarios, the worst were 1. Ceiling 70, wall 50, floor 40. 2. Ceiling 70, wall 50, floor 35. 3. Ceiling 70, wall 50, floor 30. This is because the high reflectance of the floor causes light to be repeatedly reflected between the floor and the light sources, leading to glare and reduced light quality.
However, when the ceiling and wall surfaces have high reflectance, they help distribute light uniformly throughout the room and reduce the amount of light reflected between the floor and light sources. This situation creates a more uniform and comfortable lighting environment.
Furthermore, when the floor also has high reflectance in this scenario, it enhances the quality of light by reflecting the light distributed by the ceiling and walls, creating a more uniform and comfortable environment. This is evident in the scenarios, with the best scenarios being 1. Ceiling 90, wall 80, floor 40 (the best were in the range of 90 for the ceiling and 80 for the wall), and then 2. Ceiling 85, wall 80, floor 40. 3. Ceiling 85, wall 80, floor 35. This result shows that the reflectance of the ceiling, wall, and floor surfaces is interconnected, and optimizing the reflectance of one surface can significantly impact the overall quality of light.
The Impact of the Reflectance Coefficient of Each Surface Individually
In this section of the research, to assess the impact of each surface—ceiling, wall, and floor—individually on the illumination level of the room, data from 100 previous entries were analyzed using correlation analysis, multiple linear regression, and analysis of variance (ANOVA).
- Correlation Analysis
Correlation analysis helps identify initial relationships between the reflectance coefficient and the illumination level. The results of the correlation analysis can also serve as a basis for conducting more advanced analyses, such as regression analysis. These analyses can help us examine more precise effects under controlled conditions. In correlation analysis, a value of 1 indicates perfect correlation, and values between 0 and 1 indicate significant correlation; the closer this number is to one, the stronger the correlation, while a value of zero indicates no correlation between the variables. The results of the correlation analysis are presented in Table 13 and Figure 29.

Table 13.
Correlation of surface reflectance and illuminance.
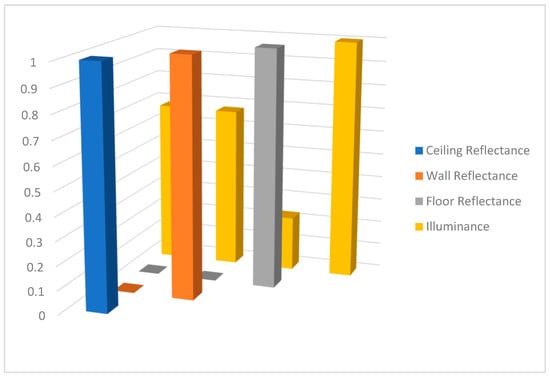
Figure 29.
Reflectance vs. illuminance correlation.
Analysis of Results
Ceiling Reflectance Coefficient and Light Level:
- -
- A positive and significant correlation (0.680) is observed between the ceiling reflectance coefficient and the light level. This indicates that as the ceiling reflectance coefficient increases, the light level also increases.
Wall Reflectance Coefficient and Light Level:
- -
- There is also a positive and significant correlation (0.675) between the wall reflectance coefficient and the light level. Similar to the ceiling, an increase in the wall reflectance coefficient contributes to an increase in light.
Floor Reflectance Coefficient and Light Level:
- -
- A weak correlation (0.228) is observed between the floor reflectance coefficient and the light level. This indicates that the effect of the floor reflectance coefficient on light is less than that of the ceiling and walls.
No Correlation Between Variables:
- -
- It is also observed that there is no correlation (value 0) between the ceiling and wall reflectance coefficients. This indicates that these two variables operate independently of each other. This means that if the ceiling reflectance coefficient increases or decreases, this change will not affect the wall reflectance coefficient; similarly, a change in the wall reflectance coefficient will not affect the ceiling reflectance coefficient. This can be significant for interior space design, as this independence allows for the improvement of each of these two variables (ceiling and wall) independently, without worrying about their mutual effects on each other.
Correlation results clearly show that the ceiling and wall reflectance coefficients are key factors in determining light levels. Improving the reflectance of these surfaces can lead to increased lighting in interior spaces. On the other hand, the floor reflectance coefficient has less impact, and greater attention should be paid to the effects of the ceiling and walls in lighting designs.
- 2.
- Regression Analysis
This section presents the findings from the regression analysis used to investigate the relationship between independent and dependent variables.
The regression model reveals how effectively the independent factors explain variations in the dependent variable, which in this case is, illuminance.
Figure 30, Predictive Accuracy and Data Overview of the Regression Model. The regression model shows that Multiple R equals 0.984714, indicating a very strong correlation between the independent and dependent variables. Additionally, R Square equals 0.969662, suggesting that approximately 96.97% of the variability in the dependent variable (illuminance) is explained by the independent variables. This high R Square value indicates the model’s strong predictive power.
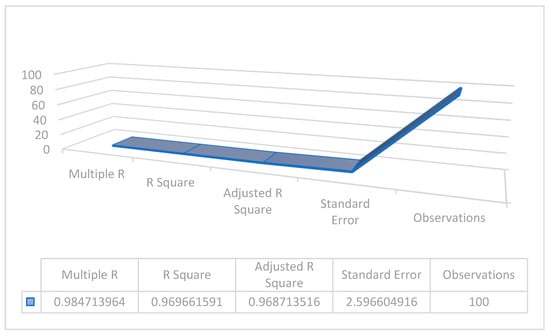
Figure 30.
Regression model predictive power.
The Adjusted R Square value of 0.968714 assures us that the model has accurately assessed the variables, and considering the Standard Error of 2.596605, the model’s predictions are also reliable. The number of observations in the analysis, which represents the volume of data used in this research, is 100.
The Adjusted R Square value of 0.9881 further confirms that the model has accurately evaluated the variables, and with a Standard Error of 2.96063, the model’s predictions remain reliable.
ANOVA analysis
To determine whether the results are significant, the Significance F (p-value) value in the output must be considered. If the p-value is less than 0.05, the null hypothesis can be rejected. This means that at least one group’s mean differs from the others.
- -
- p-value < 0.05, The results are significant, and the null hypothesis can be rejected.
- -
- p-value ≥ 0.05, The results are not significant, and the null hypothesis cannot be rejected.
As shown in Table 14, the F value equals 1022.769 and the Significance F (p-value) equals 1.06 × 10−72. This value is much less than 0.05, so the null hypothesis of equal means is rejected, indicating that at least one of the means significantly differs from the others.

Table 14.
ANOVA results summary.
Additionally, Table 15. shows the p-values of the coefficients for the reflectance of the ceiling, wall, and floor.

Table 15.
p-values of reflectance coefficients for ceiling, wall, and floor.
The table shows that all variables are clearly less than 0.05, indicating the significant impact of all independent variables on the dependent variable, namely illuminance.
The impact of each variable is illustrated in Figure 31, with the intercept coefficient equal to 31.942. This value represents the baseline illuminance when none of the independent variables have an effect.
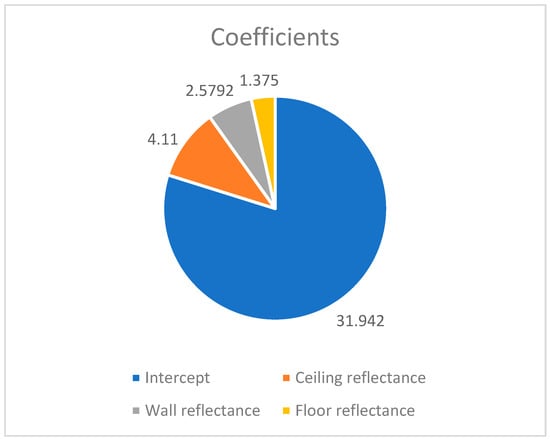
Figure 31.
Impact of reflectance coefficients on illuminance.
Descriptions of Impact of Reflectance Coefficients on Illuminance:
Ceiling reflectance: for each unit increase in this variable, illuminance increases by an average of 4.11 units. Wall reflectance: for each unit increase in this variable, illuminance increases by an average of 2.5792 units. Floor reflectance: for each unit increase in this variable, illuminance increases by an average of 1.375 units.
The findings indicate that the regression model derived from this research is very strong and explains approximately 97% of the variations in illuminance. Additionally, the significant effects of all independent variables (ceiling, wall, and floor reflectance) on illuminance were confirmed. These findings are consistent with the results of the correlation analysis.
The results of the coefficients indicate how much the fixed variables impact the dependent variable, and if the impacts are calculated as percentages:
Ceiling reflectance accounts for about 50.9% of the impacts on illuminance, wall reflectance about 32.0% and floor reflectance accounts for about 17.0% of the impacts on illuminance.
This shows that the reflectance of different surfaces has varying effects on illuminance, with ceiling reflectance having the greatest impact among the surfaces, which designers should pay special attention to.
4. Discussion
The aim of this research was to achieve optimal indoor lighting for a classroom, focusing on a design that balances visual comfort and energy efficiency. While previous studies have primarily focused on the single-factor impact of parameters such as height or surface reflectance [11,29,44], this study addressed the complex interaction of three factors—height, surface reflectance, and the number of lamps—to achieve optimal design in a classroom. Previous studies have highlighted the importance of research in providing well-lit indoor environments, especially in settings such as educational and office spaces where individuals spend considerable time and require adequate concentration.
Studies indicate that in today’s world, 20% of individuals spend most of their time indoors under low or inappropriate lighting with minimal physical activity, leading to irregular and short sleep patterns. These factors can disrupt chronobiology, potentially resulting in fatigue, mood disorders, and reduced cognitive function. Research also suggests that prolonged chronodisruption may indirectly increase the risk of cardiovascular diseases through stress and metabolic changes [45,46], though direct evidence linking lighting alone to such outcomes remains limited. Furthermore, chronodisruption can negatively affect melatonin and cortisol levels, with cortisol being a regulator of stress-related functions. Proper lighting conditions are a crucial factor in achieving an optimal indoor environment [45,47]. Studies on the impact of lighting on students have shown that adequate lighting in educational environments not only positively affects students’ learning and performance but also contributes to improving their psychological and physiological well-being [48,49,50]. Conversely, inadequate lighting can lead to temporary physiological issues such as headaches and concentration problems [40,51,52], as well as psychological issues that negatively affect mood and motivation. In severe cases, it can even lead to permanent problems such as damage to the visual system [40,53]. Visual comfort indices examine the relationship between human needs and lighting conditions by considering four main factors: glare, uniformity, quantity, and quality of light. Controlling glare is a key parameter for achieving visual comfort [54,55,56].
The present study demonstrated that optimizing the three factors—height, surface reflectance, and the number of lamps—can lead to up to 40% energy savings while maintaining glare control (UGR < 19). Our results revealed that ceiling reflectance contributes 50.9% to illuminance variance, while walls account for 32% and floors 17%, aligning with Makaremi et al. [29] and Singh et al. [33] on multi-surface reflectance effects. However, contrary to Montoya et al. [11] and Ciampi et al. [22] focusing solely on height reduction, we demonstrate that optimal lighting requires balanced reflectance ratios (ceiling:90%, walls: 80%, floor: 40%) combined with height adjustments to simultaneously control UGR (<19) and energy use.
In this research, in addition to complying with EN standards in terms of quantitative and visual parameters to achieve a standard design, the selection of lamps was also examined based on qualitative parameters CRI and CCT.
According to the specifications of the selected lamps, a CRI above 80 and a CCT of approximately 3700 Kelvin were recorded, indicating compliance with qualitative standards.
Furthermore, the selected lamps were of the semi-direct type, and in terms of glare—considered a visual parameter—even in the worst-case scenario between the two main scenarios, the glare level did not exceed the standard limit of 19.
This indicates the correct selection of lamp type and its compatibility with lighting design standards, as also shown in previous studies, which demonstrate that indirect lamps inherently provide better light dispersion in a space compared to direct lamps and produce less glare [29].
Research indicates a correlation between uniformity and glare: higher uniformity reduces glare, while lower uniformity—when light dispersion in the room is insufficient—increases glare.
As observed in Figure 32, a decrease in uniformity from 68 to 59 leads to a 35.7% increase in UGR (from 13 to 19). This finding aligns with studies [44,53] that report an inverse relationship between uniformity and glare. However, the innovation of this research lies in discovering the moderating role of surface reflectance. Increasing the reflectance of ceiling, wall, and floor surfaces can improve uniformity up to 67 and reduce UGR to 14, even at a lower height (2.5 m).
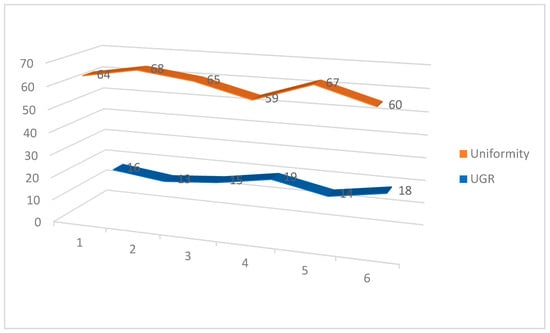
Figure 32.
Relationship between uniformity and UGR.
Studies also show that simple measures, such as reducing height, can decrease the number of lamps [11], which aligns with the current study. If we compare the first case of the first scenario with the first case of the second scenario, both under the same conditions—namely, low reflection factors of ceiling, wall, and floor surfaces—only the height differs. In the first case of the first scenario, 15 lamps were installed at a height of 3 m, which even fell short of the required lux for the room. However, in the first case of the second scenario, 12 lamps were installed, which provided the necessary lux for the room. This means that the number of lamps was reduced by 20% due to the change in height.
However, it is noteworthy that when the height is greater, more lamps are needed to achieve the required lux in the room, despite having better uniformity. Conversely, when the height is lower, fewer lamps are required, but uniformity decreases, leading to an increase in glare.
As mentioned, changing the height resulted in a 20% reduction in the number of lamps. However, in terms of visual comfort, in the first case of the first scenario with a height of 3 m, we had better uniformity at 64 and glare at 16. In the first case of the second scenario with a height of 2.5 m, the uniformity was 59, which is slightly below the standard minimum of 60, and the glare was 19, which is at the threshold of the standard, meaning it is only acceptable. This indicates that at a height of 3 m compared to a height of 2.5 m, under equal testing conditions, the change in height had an impact of approximately 7.81% on uniformity and resulted in an 18.75% increase in glare, changing from 16 to 19.
To address the performance conflict between the number of lamps and visual comfort at height, the reflectance of surfaces is recognized as a key parameter in this research. Increasing the reflectance of ceiling, wall, and floor surfaces can effectively enhance light uniformity.
In both scenarios, as the reflectance of these surfaces increases, uniformity improves, leading to a reduction in glare. We observe an increase in uniformity from the first case to the second, and consequently, glare decreases.
By combining height reduction and increased reflectance, the third case of the second scenario is identified as the most optimal case in terms of energy and cost savings. Table 16.

Table 16.
Cost comparison between base and optimal scenarios.
As shown in Table 16, implementing the optimal scenario (2-3) not only reduces the initial cost by 40% but also achieves a saving of USD 781 over 10 years. This figure, scaled to a school with 20 classrooms, reaches USD 15,632, demonstrating the high economic viability of this design.
Increasing surface reflectance and reducing height not only reduces the demand for lamps and saves energy and costs but can also directly have a significant impact on reducing carbon emissions.
In the case studied in this research, conducted in Taiwan, the carbon intensity is considered to be 0.5 kg CO2 per kilowatt-hour on average [57].
To calculate the reduction in carbon emissions resulting from energy savings, we employed the following formula: (2)
- -
- CER = Carbon Emission Reduction
- -
- ES = Energy Savings
- -
- CI = Carbon Intensity
As shown in Table 6, energy savings of 300.67 kWh/year were achieved from scenario 1-1 to 1-3 and from 2-1 to 2-3 in each scenario. From 1-1 to 2-3 (combining increased surface reflectance and reduced height), energy savings reached 601.34 kWh/year. Based on the values obtained, Table 17 shows the reduction in carbon emissions.

Table 17.
Carbon emission reduction.
The results indicate that increasing reflectance alone (scenario 1-1 to 1-3) or reducing height alone (scenario 2-1 to 2-3) each leads to a reduction of 150.34 kg CO2 per year. The combination of reducing height and increasing reflectance (from scenario 1-1 to 2-3) results in a reduction of 300.67 kg CO2 per year, demonstrating a two-fold impact on carbon emission reduction.
These impacts are significant at larger scales; when scaled to 100 classrooms, this strategy could save 30.07 tons of CO2/year, which is approximately equivalent to removing 6.5 gasoline-powered vehicles from the road annually. (Based on an average emission of 4.6 tons CO2 per vehicle per year, [EPA]) [46].
These findings highlight the importance of lighting design strategies with sustainability goals in educational buildings.
Although the third case of the second scenario is the most optimal in terms of energy, it has a UGR of 18 in terms of visual comfort, which, despite passing the standard, is very close to the undesirable threshold of 19. While this case can also be considered acceptable because it meets visual comfort standards, the second case of the third scenario, with a UGR of 14, is better within the standard. It only consumes 300 kWh more than the third case. If user visual comfort is the priority, this case is recommended. However, this case still achieved energy reduction compared to the initial state.
Present Study Limitations and Future Work
Simulation vs. Real World: The study used a simulation (Dialux) rather than a real classroom. Simulations, while useful, have limitations. For example, to assess the impact of human factors such as student interaction and behavior, further research in real classrooms is necessary to examine the effects of various strategies on users.
Artificial Light Focus: This research focused solely on artificial light due to the obstructed daylight in the selected classroom, caused by the adjacent Hong-Yue Technology Research Building. While daylighting via windows or clerestories could potentially double energy savings to 80% in unobstructed settings [31], its exclusion isolates the role of artificial lighting in constrained urban environments. Future research should integrate these findings with daylighting strategies—such as optimizing window placement or adding clerestories—to maximize energy efficiency and enhance student well-being.
Limited Scale: This study was conducted on a single 8 m × 7 m classroom with obstructed daylight due to adjacent buildings. Generalizing the results to classrooms with different dimensions or unobstructed daylight access—such as those with larger windows or no nearby obstructions—requires further research. Future studies should include such classrooms for comparative analysis, evaluating artificial lighting against hybrid designs to broaden the applicability of these findings.
5. Conclusions
By examining the interaction of three crucial variables—height, surface reflectance coefficients, and number of lamps—this study aimed to optimize classroom lighting by balancing visual comfort and energy efficiency. Two main simulations were conducted with different ceiling heights (2.5 m and 3 m) and varying surface reflectance coefficients. Additionally, correlation and regression analysis of 100 scenarios were performed.
The results show that optimizing these factors can lead to significant improvements in both energy savings and visual comfort, with a potential 40% reduction in energy use while maintaining acceptable glare levels (UGR < 19).
Key Findings:
- Impact of Surface Reflectance: The model’s good predictive power was indicated by the regression analysis’s R square of 0.969662. It was found that light intensity increases by 4.11 units for every unit increase in ceiling reflectance and by 2.5792 units for every unit increase in wall reflectance. Furthermore, light intensity rises by 1.375 units for every unit increase in floor reflectance. Light uniformity and glare were greatly enhanced by raising the reflectance coefficients of the floor, walls, and ceiling. the largest influence was caused by the ceiling reflectance (50.9%), which was followed by the walls (32.0%) and the floor (17.0%). It was discovered that the best surfaces for improving light distribution and lowering glare were those with high reflectivity (ceiling ≥ 85%, walls ≥ 80%, and floor ≥ 40%). Furthermore, the correlation analysis indicated that wall and ceiling reflectance coefficients do not correlate with one another, but they do have the strongest correlation with light intensity. This discovery gives designers greater creative freedom. Furthermore, in each case (from scenario 1-1 to 1-3 and from scenario 2-1 to 2-3), merely increasing the reflectivity of surfaces resulted in a 20% decrease in energy usage. These findings demonstrate important role of surface reflectance for both visual comfort and energy efficiency.
- Effect of Height: By reducing the height from 3 m to 2.5 m, 20–25% fewer bulbs were needed, which resulted in a 20% energy decrease from scenario 1-1 to scenario 2-1. However, the necessity to balance height with reflectance and lamp placement is highlighted by the fact that this height reduction also slightly reduced uniformity and increased glare by 18.75%.
- Energy Savings: This study achieved a 40% reduction in energy consumption by combining a higher surface reflectivity with a lower height. Only nine bulbs were utilized in the most energy-efficient scenario (scenario 2, case 3), which saved 601.34 kWh annually and reduced carbon emissions by 300.67 kg CO2.When scaled to 100 classrooms this strategy could save 30.07 tons of CO2 a year, which is the same as taking 6.5 gasoline-powered vehicles off the road.
- Economic Benefits: Compared to the baseline scenario, the optimized design (scenario 2, case 3) saved USD 781.60 over a ten-year period and reduced initial costs by 40%. Over ten years, this amounts to a USD 15,632 savings for a school with 20 classrooms.
- Visual Comfort: Scenario 1, case 2 provided the best visual comfort, with a UGR of 13, high reflectance coefficients, and 15 bulbs. Scenario 2, case 2, with 12 lamps and a UGR of 14, is displayed to be the most balanced option, providing both energy efficiency and excellent visual comfort.
Recommendations for Design:
- Prioritize Ceiling: To optimize light distribution and minimize glare, ceiling reflectance, as the top priority (with a 50.9% contribution to lighting), should be increased as much as possible to ≥85%.
- Optimize Height:
- -
- For glare-sensitive areas (such as children’s classrooms), use a height of 3 m while keeping surface reflectivity high, as this reduces the need for a greater number of lamps.
- -
- Height of 2.5 m: The optimal option for reducing energy consumption by 20% to 25%, provided that high-reflectance surfaces are used. The combination of both reduced costs by up to 40% and provided a desirable UGR of 14.
- 3.
- Lamp Placement: To obtain the required illumination and uniformity, use accurate simulations to determine the number of lights after determining the height and surface reflectance.
- 4.
- Combined Strategies: To achieve the optimal balance between energy savings and visual comfort, use a mixture of lower height and higher surface reflectance (reflectance coefficients: ceiling 90, walls 80, floor 40), as recommended in this study.
Additionally, avoid high reflectance coefficients for the floor (30,40) while the reflectance coefficients for the ceiling and walls are below 80.
It should be noted that there is no single design that yields the best results in terms of energy and visual comfort. However, through the interaction of various parameters, optimal designs can be achieved, allowing for the best decisions based on the needs of the space and priorities. In this context, surface reflectance coefficients play a key role in creating interaction between the contradictions of height, the number of lamps, glare, and energy consumption, effectively acting as a controller. This allows glare issues to be managed at lower heights while controlling lamp demand at higher heights.
Concluding Remarks:
This research highlights the importance of a holistic approach to artificial lighting design, where energy efficiency and visual comfort are optimized simultaneously. By optimizing ceiling height, surface reflectance, and lamp placement significant energy savings and improved lighting quality can be achieved, contributing to both economic and environmental sustainability. These efforts reduce carbon footprints by 30.07 tons of CO2 annually across 100 classrooms, aligning with broader environmental goals. This study lays the groundwork for integrated design optimization, with future work planned to address additional factors such as daylight integration, acoustics, and thermal comfort, enhancing the overall classroom environment. These findings provide valuable guidelines for designing energy-efficient and visually comfortable educational spaces, with potential applications in other indoor environments as well.
Author Contributions
Writing—original draft, S.A.; Supervision, C.-C.C. All authors have read and agreed to the published version of the manuscript.
Funding
This research received no external funding.
Data Availability Statement
Data are contained within the article.
Conflicts of Interest
The authors declare no conflict of interest.
References
- Gordon, L. Energy saving claims for lighting controls in commercial buildings. Energy Build. 2016, 133, 489–497. [Google Scholar]
- Geraldi, M.S.; Melo, A.P.; Lamberts, R.; Borgstein, E.; Yukizaki, A.Y.G.; Maia, A.C.B.; Soares, J.B.; Santos, A.D., Jr. Assessment of the energy consumption in non-residential building sector in Brazil. Energy Build. 2022, 273, 112371. [Google Scholar] [CrossRef]
- Bernardo, H.; Antunes, C.H.; Gaspar, A.; Pereira, L.D.; da Silva, M.G. An approach for energy performance and indoor climate assessment in a Portuguese school building. Sustain. Cities Soc. 2017, 30, 184–194. [Google Scholar] [CrossRef]
- Pereira, D.L.; Raimondo, D.; Corgnati, S.P.; Da Silva, M.G. Energy consumption in schools–A review paper. Renew. Sustain. Energy Rev. 2014, 40, 911–922. [Google Scholar] [CrossRef]
- Wang, J.C. Energy consumption in elementary and high schools in Taiwan. J. Clean. Prod. 2019, 227, 1107–1116. [Google Scholar] [CrossRef]
- Erhorn, H.; Erhorn-Kluttig, H.; Reiß, J. Plus energy schools in Germany–Pilot projects and key technologies. Energy Procedia 2015, 78, 3336–3341. [Google Scholar] [CrossRef]
- Mahdavinejad, M.; Bazazzadeh, H.; Mehrvarz, F.; Berardi, U.; Nasr, T.; Pourbagher, S.; Hoseinzadeh, S. The impact of facade geometry on visual comfort and energy consumption in an office building in different climates. Energy Rep. 2024, 11, 1–17. [Google Scholar] [CrossRef]
- Aghajari, S.; Chen, C.-C. The Effectiveness of Lighting Design for Improved Patient Care Considering Energy Conservation. Eng. Proc. 2024, 55, 91. [Google Scholar] [CrossRef]
- Kostic, A.; Djokic, L. Subjective impressions under LED and metal halide lighting. Light. Res. Technol. 2014, 46, 293–307. [Google Scholar] [CrossRef]
- Doulos, L.T.; Tsangrassoulis, A.; Kontaxis, P.A.; Kontadakis, A.; Topalis, F.V. Harvesting daylight with LED or T5 fluorescent lamps? The role of dimming. Energy Build. 2017, 140, 336–347. [Google Scholar] [CrossRef]
- Montoya, F.G.; Peña-García, A.; Juaidi, A.; Manzano-Agugliaro, F. Indoor lighting techniques: An overview of evolution and new trends for energy saving. Energy Build. 2017, 140, 50–60. [Google Scholar] [CrossRef]
- Dubois, M.-C.; Blomsterberg, Å. Energy saving potential and strategies for electric lighting in future North European, low energy office buildings: A literature review. Energy Build. 2011, 43, 2572–2582. [Google Scholar] [CrossRef]
- Xu, L.; Pan, Y.; Yao, Y.; Cai, D.; Huang, Z.; Linder, N. Lighting energy efficiency in offices under different control strategies. Energy Build. 2017, 138, 127–139. [Google Scholar] [CrossRef]
- Yun, Y.G.; Kim, H.; Kim, J.T. Effects of occupancy and lighting use patterns on lighting energy consumption. Energy Build. 2012, 46, 152–158. [Google Scholar] [CrossRef]
- Lim, G.-H.; Keumala, N.; Ghafar, N.A. Energy saving potential and visual comfort of task light usage for offices in Malaysia. Energy Build. 2017, 147, 166–175. [Google Scholar] [CrossRef]
- ul Haq, M.A.; Hassan, M.Y.; Abdullah, H.; Rahman, H.A.; Abdullah, M.P.; Hussin, F.; Said, D.M. A review on lighting control technologies in commercial buildings, their performance and affecting factors. Renew. Sustain. Energy Rev. 2014, 33, 268–279. [Google Scholar] [CrossRef]
- Tahsildoost, M.; Zomorodian, Z.S. Energy retrofit techniques: An experimental study of two typical school buildings in Tehran. Energy Build. 2015, 104, 65–72. [Google Scholar] [CrossRef]
- Hassouneh, K.; Al-Salaymeh, A.; Qoussous, J. An approach to apply the concept of green building for a building in Jordan. Sustain. Cities Soc. 2015, 14, 456–462. [Google Scholar] [CrossRef]
- Alfaoyzan, A.F.; Almasri, R.A. Benchmarking of energy consumption in higher education buildings in Saudi Arabia to be sustainable: Sulaiman Al-Rajhi University case. Energies 2023, 16, 1204. [Google Scholar] [CrossRef]
- Miranda, D.T.; Barreto, D.; Flores-Colen, I. An Evaluation of the Luminous Performance of a School Environment Integrating Artificial Lighting and Daylight. Sustainability 2024, 16, 1426. [Google Scholar] [CrossRef]
- Luo, J.; Yan, G.; Zhao, L.; Zhong, X.; Su, X. Evaluation of design parameters for Daylighting performance in secondary School classrooms based on field measurements and physical simulations: A case study of secondary School classrooms in Guangzhou. Buildings 2024, 14, 637. [Google Scholar] [CrossRef]
- Ciampi, G.; Rosato, A.; Scorpio, M.; Sibilio, S. Retrofitting solutions for energy saving in a historical building lighting system. Energy Procedia 2015, 78, 2669–2674. [Google Scholar] [CrossRef]
- Dong, W.; Qi, R.; Zhang, W.; Liu, X.; Huang, K. Research on Optimization of University Classroom Lighting Environment Based on Computer Simulation. J. Electr. Syst. 2024, 20, 100–108. [Google Scholar] [CrossRef]
- Alshibani, A. Prediction of the energy consumption of school buildings. Appl. Sci. 2020, 10, 5885. [Google Scholar] [CrossRef]
- Zhang, Y.; Liu, C.; Li, J.; Jing, X.; Shi, J.; Gao, W. The effect of classroom size and ceiling height on college students’ learning performance using virtual reality technology. Sci. Rep. 2024, 14, 15341. [Google Scholar] [CrossRef] [PubMed]
- Zaman, A.; Sikha, A.A.; Bhattacharjee, A. Optimization of Lighting Design in Classroom to Create Energy-Efficient and Visually Comfort Lighting Scenario. In International Conference on Research into Design; Springer Nature: Singapore, 2023; pp. 329–342. [Google Scholar]
- Jafarian, H.; Demers, C.M.H.; Blanchet, P.; Laundry, V. Effects of interior wood finishes on the lighting ambiance and materiality of architectural spaces. Indoor Built Environ. 2018, 27, 786–804. [Google Scholar] [CrossRef]
- Michael, A.; Heracleous, C.; Thravalou, S.; Philokyprou, M. Lighting performance of urban vernacular architecture in the East-Mediterranean area: Field study and simulation analysis. Indoor Built Environ. 2017, 26, 471–487. [Google Scholar] [CrossRef]
- Makaremi, N.; Schiavoni, S.; Pisello, A.L.; Asdrubali, F.; Cotana, F. Quantifying the effects of interior surface reflectance on indoor lighting. Energy Procedia 2017, 134, 306–316. [Google Scholar] [CrossRef]
- Alkhalidi, A.; Shammout, S.; Khawaja, M.K. Effect of Surface Finish Reflectance on Energy Consumed by Lighting. Rigas Teh. Univ. Zinat. Raksti 2021, 25, 907–916. [Google Scholar] [CrossRef]
- AL-Mowallad, E.A.M.S.; Huang, X.; Lu, Z.; Li, X.; Wu, K.; Zhu, Z.; Liu, G. Assessment and Improvement of Daylighting Quality in Classrooms with Double-Side Windows. Buildings 2024, 14, 3501. [Google Scholar] [CrossRef]
- Escobar, I.; Aporta, J.; Sanchez-Cano, A. Efficient Daylighting: The Importance of Glazing Transmittance and Room Surface Reflectance. Buildings 2024, 14, 3108. [Google Scholar] [CrossRef]
- Singh, R.; Rawal, R. Effect of surface reflectance on lighting efficiency in interiors. In Proceedings of the 12th Conference of International Building Performance Simulation Association, Sydney, Australia, 14–16 November 2011. [Google Scholar]
- Baglivo, C.; Bonomolo, M.; Congedo, P.M. Modeling of light pipes for the optimal disposition in buildings. Energies 2019, 12, 4323. [Google Scholar] [CrossRef]
- Papadakis, N.; Al Katsaprakakis, D. A review of energy efficiency interventions in public buildings. Energies 2023, 16, 6329. [Google Scholar] [CrossRef]
- Awang, M.; Tham, C.S.; Ruddin, N.M.B.; Rahman, M.A.A.; Hamidon, N.; Ahmad, F.; Musa, K.; Nagapan, S.; Rahman, M.S.A. Assessment of energy saving potential and lighting system in teaching building. J. Adv. Res. Fluid Mech. Therm. Sci. 2020, 65, 159–169. [Google Scholar]
- EN 12464-1; Light and Lighting—Lighting of Work Places—Part 1: Indoor Work Places. European Committee for Standardization (CEN): Brussels, Belgium, 2021.
- National Taipei University of Technology. Campus Map. National Taipei University of Technology. Available online: https://www-en.ntut.edu.tw/p/404-1006-37132.php?Lang=en (accessed on 26 February 2025).
- Google. National Taipei University of Technology. Google Earth. Available online: https://earth.google.com (accessed on 26 February 2025).
- Ho, M.-C.; Chiang, C.-M.; Chou, P.-C.; Chang, K.-F.; Lee, C.-Y. Optimal sun-shading design for enhanced daylight illumination of subtropical classrooms. Energy Build. 2008, 40, 1844–1855. [Google Scholar] [CrossRef]
- CIE 117; Discomfort Glare in Interior Lighting. Commission Internationale de l’Éclairage (CIE): Vienna, Austria, 1995.
- Jain, K.; Kumar, N.K.; Kumar, K.S.; Thangappan, P.; Manikandan, K.; Magesh, P.; Ramesh, L.; Sujatha, K. Lighting electrical energy audit and management in a commercial building. In Proceedings of the 2nd International Conference on Intelligent Computing and Applications: ICICA 2015, Plaine Magnien, Mauritius, 24–25 September 2020; Springer: Singapore, 2016; pp. 463–474. [Google Scholar]
- Liu, J.; Li, Z.; Zhang, Z.; Xie, L.; Wu, J. Evaluation and Optimization of Interior Circadian Daylighting Performance for the Elderly in Traditional Dwellings: A Case Study in Western Hunan, China. Sustainability 2024, 16, 3563. [Google Scholar] [CrossRef]
- Petrinska, I.; Ivanov, D.; Georgiev, V. Influence of the light distribution of luminaires and the room surfaces’ reflectance on the illumination levels, uniformity and glare in indoor lighting systems. In Lux Junior 2019, Proceedings of the 14. Internationales Forum für den lichttechnischen Nachwuchs, Ilmenau, Germany, 6–8 September 2019; Dörnfeld/Ilm: Ilmenau, Germany, 2019; pp. 63–70. [Google Scholar]
- Martín; Simón, C.; Sánchez-Muniz, F.J. Cronodisrupción y desequilibrio entre cortisol y melatonina¿ Una antesala probable de las patologías crónicas degenerativas más prevalentes? J. Negat. No Posit. Results 2017, 2, 619–633. [Google Scholar]
- Vetter, C.; Devore, E.E.; Wegrzyn, L.R.; Massa, J.; Speizer, F.E.; Kawachi, I.; Rosner, B.; Stampfer, M.J.; Schernhammer, E.S. Association between rotating night shift work and risk of coronary heart disease among women. JAMA 2016, 315, 1726–1734. [Google Scholar] [CrossRef]
- Sterling, P.; Joseph, E. Handbook of Life Stress, Cognition and Health; Fisher, S., Reason, J., Eds.; John and Wiley and Sons: Hoboken, NJ, USA, 1988. [Google Scholar]
- Bullen, P.A. Adaptive reuse and sustainability of commercial buildings. Facilities 2007, 25, 20–31. [Google Scholar] [CrossRef]
- Maria, S.Y.; Prihatmanti, R. Daylight characterisation of classrooms in heritage school buildings. Plan. Malays. 2017, 15. [Google Scholar]
- Winterbottom, M.; Wilkins, A. Lighting and discomfort in the classroom. J. Environ. Psychol. 2009, 29, 63–75. [Google Scholar] [CrossRef]
- Lee, S.K.; Kim, H.J.; Kang, J. From uniformity to sustainable diversity: Exploring the design attributes of renovating standardized classrooms in Korea. Sustainability 2019, 11, 5669. [Google Scholar] [CrossRef]
- Shapiro, M.; Roth, D.; Marcus, A. The Effect of Lighting on the Behavior of Children Who Are Developmentally Disabled. J. Int. Spec. Needs Educ. 2001, 4, 19–23. [Google Scholar]
- Bullough, J.D. Spectral sensitivity for extrafoveal discomfort glare. J. Mod. Opt. 2009, 56, 1518–1522. [Google Scholar] [CrossRef]
- Bullough, J.D.; Fu, Z.; Van Derlofske, J. Discomfort and Disability Glare from Halogen and HID Headlamp Systems; No. 2002-01-0010. SAE Technical Paper, 2002. Available online: https://www.sae.org/publications/technical-papers/content/2002-01-0010/ (accessed on 26 February 2025).
- Flannagan, M.J.; Sivak, M.; Ensing, M.; Simmons, C.J. Effect of Wavelength on Discomfort Glare from Monochromatic Sources; University of Michigan, Ann Arbor, Transportation Research Institute: Ann Arbor, MI, USA, 1989. [Google Scholar]
- Ko, F.-K.; Huang, C.-B.; Tseng, P.-Y.; Lin, C.-H.; Zheng, B.-Y.; Chiu, H.-M. Long-term CO2 emissions reduction target and scenarios of power sector in Taiwan. Energy Policy 2010, 38, 288–300. [Google Scholar] [CrossRef]
- U.S. Environmental Protection Agency (EPA). Greenhouse Gas Emissions from a Typical Passenger Vehicle. 2021. Available online: https://www.epa.gov/greenvehicles/greenhouse-gas-emissions-typical-passenger-vehicle (accessed on 1 January 2024).
Disclaimer/Publisher’s Note: The statements, opinions and data contained in all publications are solely those of the individual author(s) and contributor(s) and not of MDPI and/or the editor(s). MDPI and/or the editor(s) disclaim responsibility for any injury to people or property resulting from any ideas, methods, instructions or products referred to in the content. |
© 2025 by the authors. Licensee MDPI, Basel, Switzerland. This article is an open access article distributed under the terms and conditions of the Creative Commons Attribution (CC BY) license (https://creativecommons.org/licenses/by/4.0/).