Abstract
Residential areas are the basic unit related to the living quality of urban residents, and their comfort is one of the key concerns of residents. Greening has always been an important means to improve the living environment of residential communities. In this paper, ENVI-met V4 simulation software is verified and used to discuss the influence of the residential scale and green ratio on the outdoor thermal environment. By comparing the difference in outdoor thermal comfort with or without greening measures in residential blocks of different scales, the effects of vegetation on optimizing the outdoor thermal comfort of different scale residential blocks are investigated. The meteorological parameters selected for this case study analysis include a wind speed of 2.5 m/s at 10 m height and an air temperature range of 28 °C to 35 °C. The results show that the wind speed and air temperature in the residential area are less affected by the residential scale and more affected by the greening rate. There are obvious differences in the improvement in outdoor thermal comfort by vegetation at different times. With the increase in residential area scale, the improvement effect of vegetation on outdoor thermal comfort also increases, which in 5 × 5 blocks residential area is 0.2–0.5 °C, higher than that in 2 × 2 blocks small-scale residential area. A modified index, PET (Physiological Equivalent Temperature) drop per green ratio, is proposed for cost performance. Reasonable and feasible greening suggestions for residential buildings are summarized.
1. Introduction
Urban heat island refers to the phenomenon of urban microclimate differences in which the temperature in the urban area is significantly higher than the temperature in the suburbs [1]. Since the heat island phenomenon was first observed and recorded, the exploration of its genesis and the research of its specific influence mechanism have been ongoing [2], but most of them are concentrated on a larger horizontal spatial scale (20–200 km) [3], and there is less research on small-scale phenomena. Research on urban heat island mitigation at the micro-scale (<2 km) of residential blocks is the most lacking.
The residential block is one of the important basic units of the city. The design of the residential block’s microenvironment directly affects the outdoor thermal comfort of residents and the quality and willingness of outdoor activities [4]. Architectural layout and greening are critical factors in the microclimate of the residential area. Building layout and geometric configuration significantly influence the urban microclimate by altering radiative and convective heat exchange characteristics within residential areas, making them among the most common factors affecting wind–thermal environments [5,6,7,8,9].
Vegetation in residential areas affects microclimate and thermal comfort by providing shade (tall trees), changing the albedo of the underlying surface (lawns), and changing the radiation, temperature and humidity, airflow, and other parameters of the whole residential area through transpiration [10,11,12]. In terms of the impact of green space on the microenvironment, a number of studies have shown that increasing green space can significantly improve the outdoor thermal and humid environment [13], but the effect of increasing green space is not linear. Most studies on the impact of green areas and vegetation coverage on outdoor thermal comfort focus on local scale, such as parks and green spaces [14,15], but there are few studies on residential area scale. The coupling effect of the two factors of residential block scale and vegetation on outdoor thermal comfort also lacks study.
Among the common indices for assessing outdoor thermal environments, the Physiological Equivalent Temperature (PET) [16,17,18] and Universal Thermal Climate Index (UTCI) [19,20] are widely adopted. While both metrics offer valuable insights, UTCI is sensitive to changes in wind speed and radiation, leading to potential discrepancies under extreme climate conditions. PET is particularly suited for this study due to its strong capability to evaluate human thermal responses, especially in heat-sensitive regions such as subtropical urban areas. PET’s physiological basis—integrating air temperature, humidity, wind speed, and mean radiant temperature—provides a comprehensive assessment of thermal stress, making it highly relevant for evaluating the cooling effects of greening strategies in residential blocks.
ENVI-met is a widely used software for studying the impact of greening on outdoor environments [21,22,23]. The origins of ENVI-met can be traced back to 1998, when Bruse and Fleer at the University of Mainz, Germany, developed a simulation model for outdoor built environments [24]. The software is based on computational fluid dynamics (CFD) and thermodynamics, incorporating key urban climate factors such as atmosphere, buildings, soil, vegetation, and water bodies into its modeling framework. As a result, ENVI-met offers high accuracy and computational efficiency in simulating outdoor environments at small to medium scales. The reliability of ENVI-met simulations has been verified [25,26].
In this paper that aims to compare the difference in outdoor thermal comfort with or without greening measures in residential blocks of different scales, the effects of vegetation on optimizing the outdoor thermal comfort of different scale residential blocks are investigated, and the reasons for this phenomenon from the perspectives of wind speed and temperature are further analyzed. A reasonable geometric model of residential area is firstly established according to the relevant local norms and standards of Shanghai, and the meteorological boundary conditions are determined according to the observation data of local meteorological stations. Secondly, ENVI-met software is used to simulate the influence of vegetation on the outdoor environment and thermal comfort of different residential scales under different greening rates. Finally, the PET drop per green ratio index (ΔPET) is proposed to quantify the thermal comfort improvement per unit increase in greening rate. Based on the simulation results, the optimization potential of outdoor thermal comfort in residential areas of different sizes is analyzed from the perspective of comfort and cost performance, and the optimal solution of greening rate selection is explored in order to provide practical, reasonable, and feasible greening suggestions for residential buildings. This research follows the steps outlined in Figure 1.
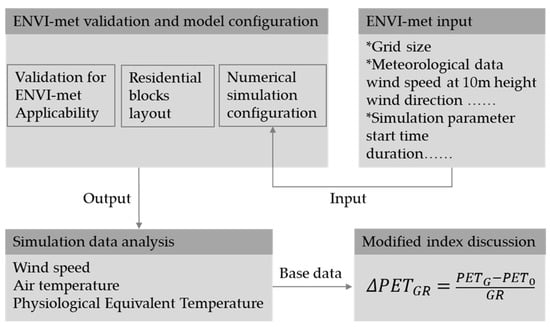
Figure 1.
Study framework.
2. Methods
2.1. Validation for ENVI-met Applicability
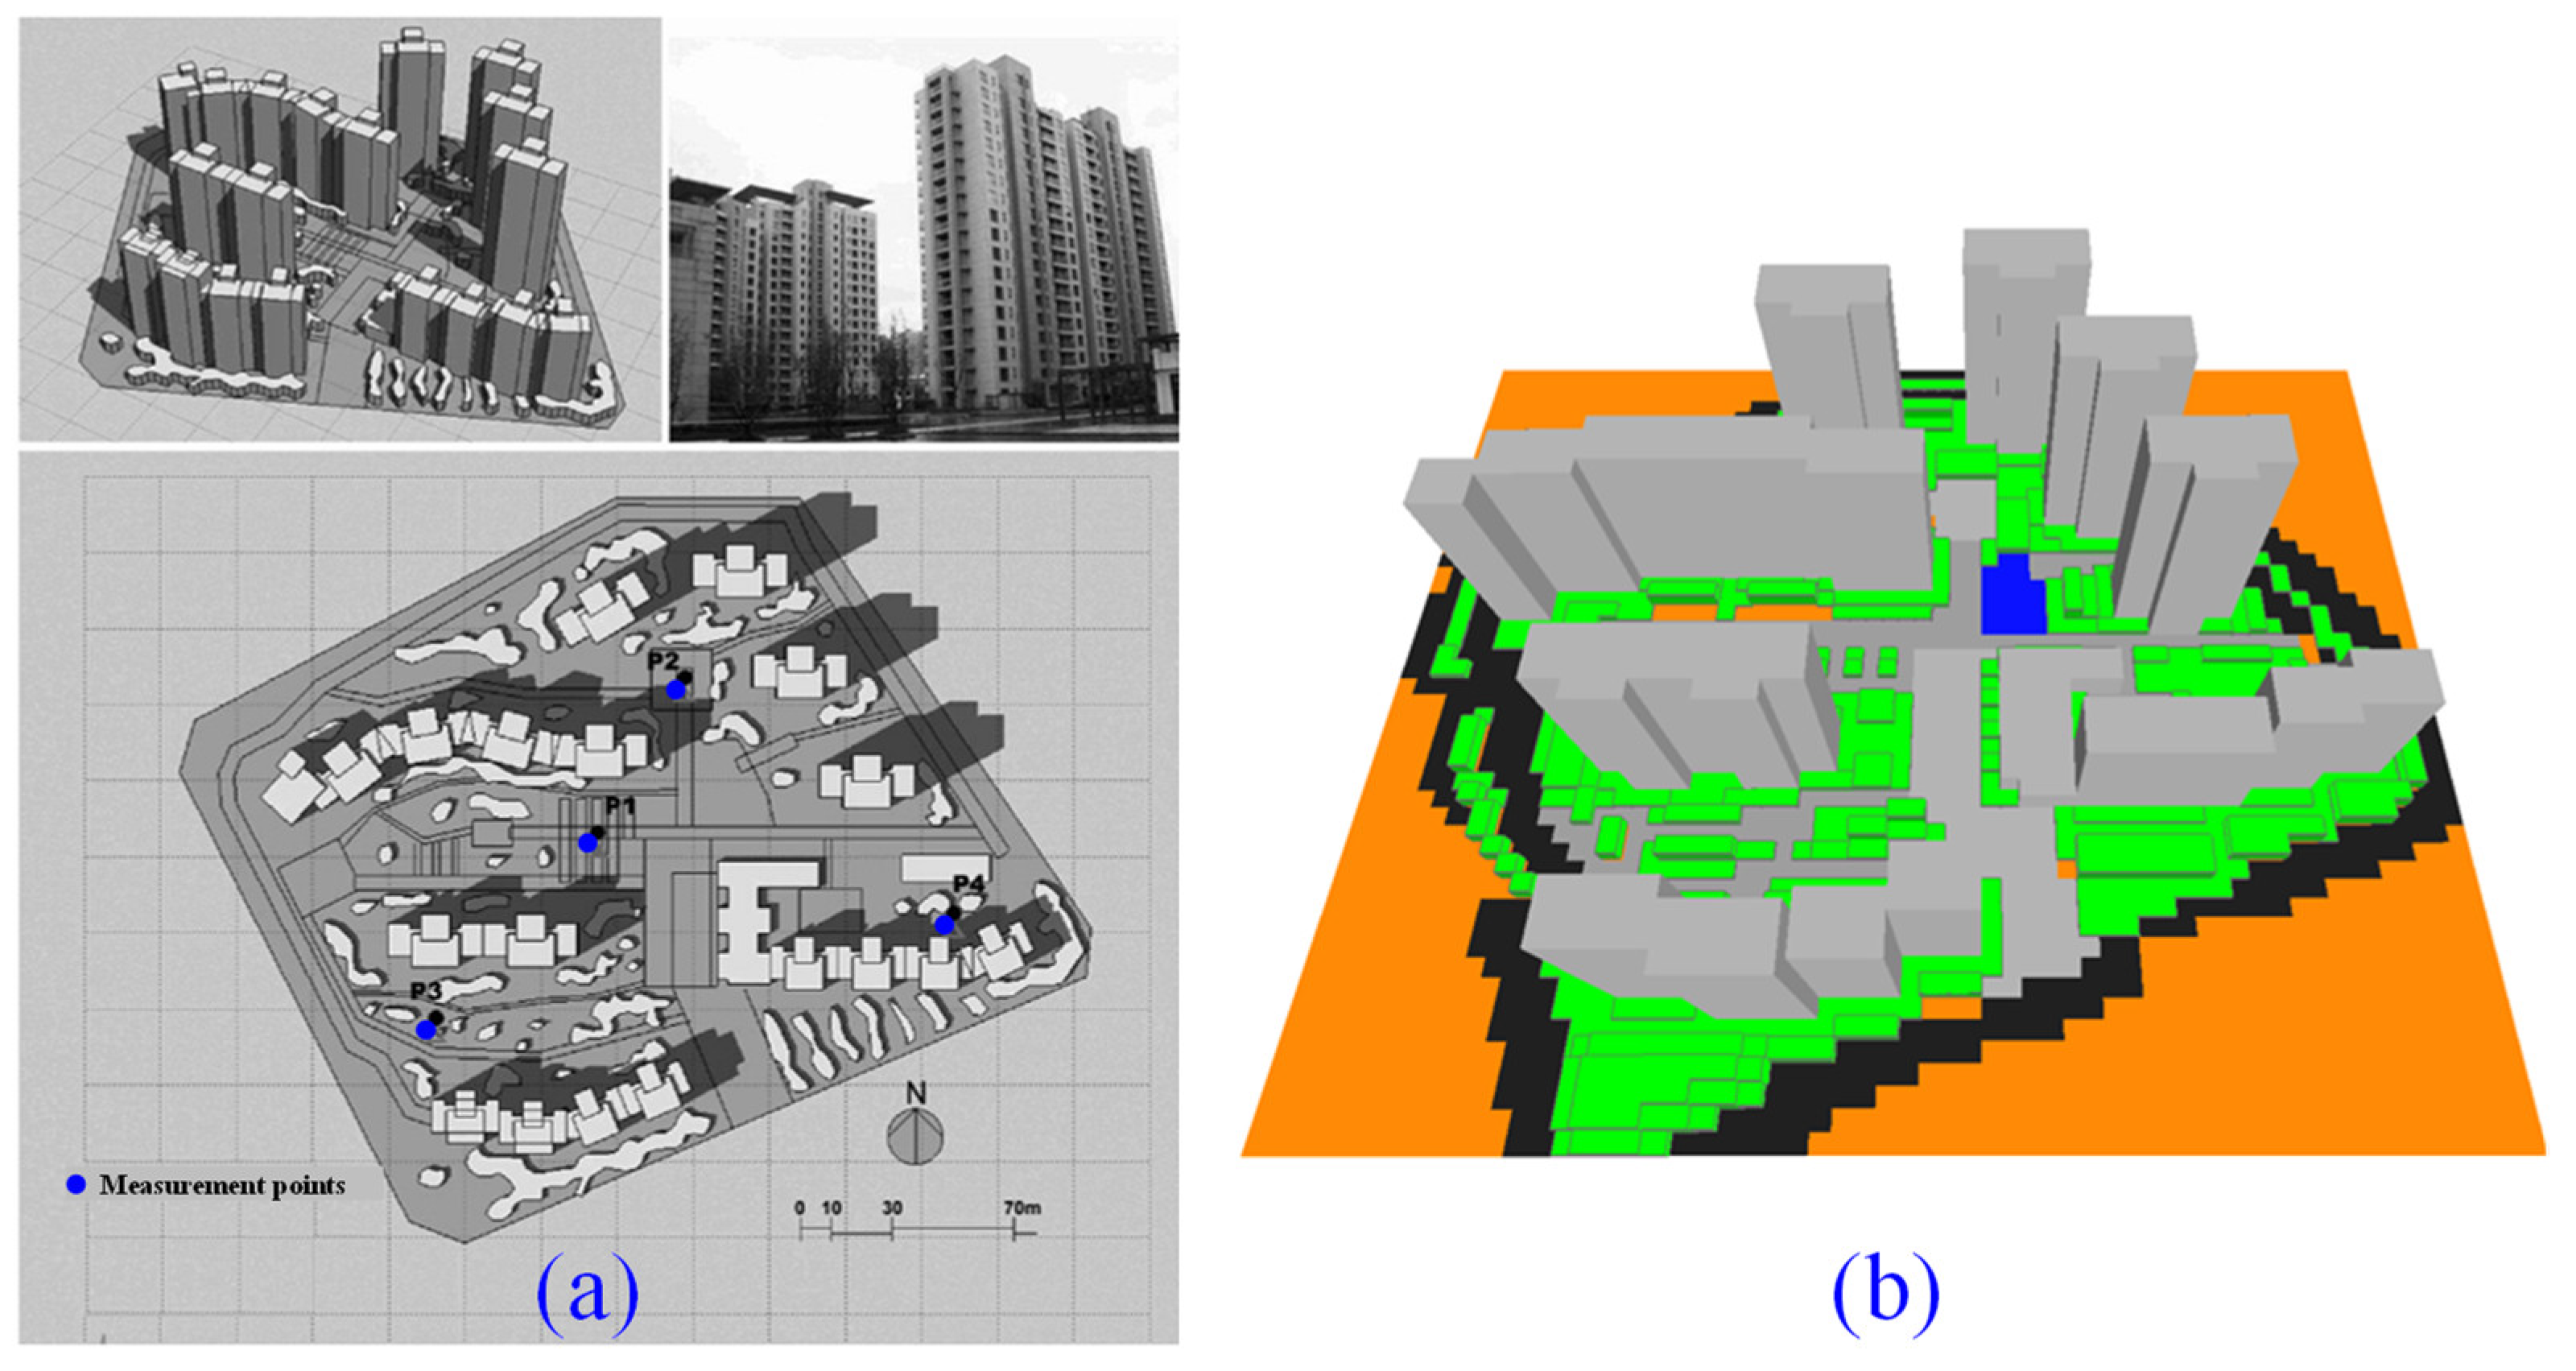
In order to verify the applicability of ENVI-met, this paper selects the field measurement data of Yang et al. [27] in a residential district of Pudong New Area, Shanghai, for the validation of the numerical methods. In Figure 2, the residential district is located in the suburban area of Pudong New Area, Shanghai, with an area of about 4.61 ha. The total building area is about 11.8 × 10⁴ m2, and the plot ratio is 2.56. There is a green area in the center of the district, and the greening rate is about 35%. The orientation of buildings is north–south; their façades are gray plastered, and the ground is mostly composed of concrete or asphalt. Four points (P1–P4), as shown in Figure 2a, were selected in the district to continuously measure the air temperature and wind speed from 1:00 p.m. to 9:00 p.m. on 5 August 2008. The numerical simulation settings in this paper were based on the meteorological parameters provided by Yang et al. [27].
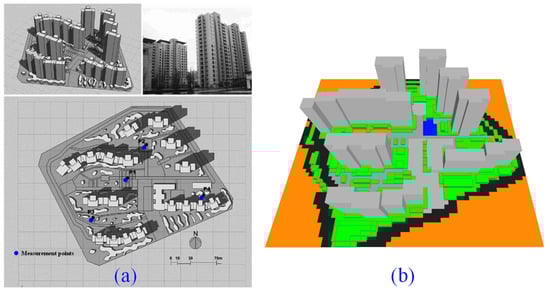
Figure 2.
Schematic diagram of the 3D model of field measurement and numerical simulation. (a) Measurement point locations (Yang et al. 2011 [27]); (b) Numerical simulation model (Green areas represent vegetation. Blue areas represent artificial water bodies).
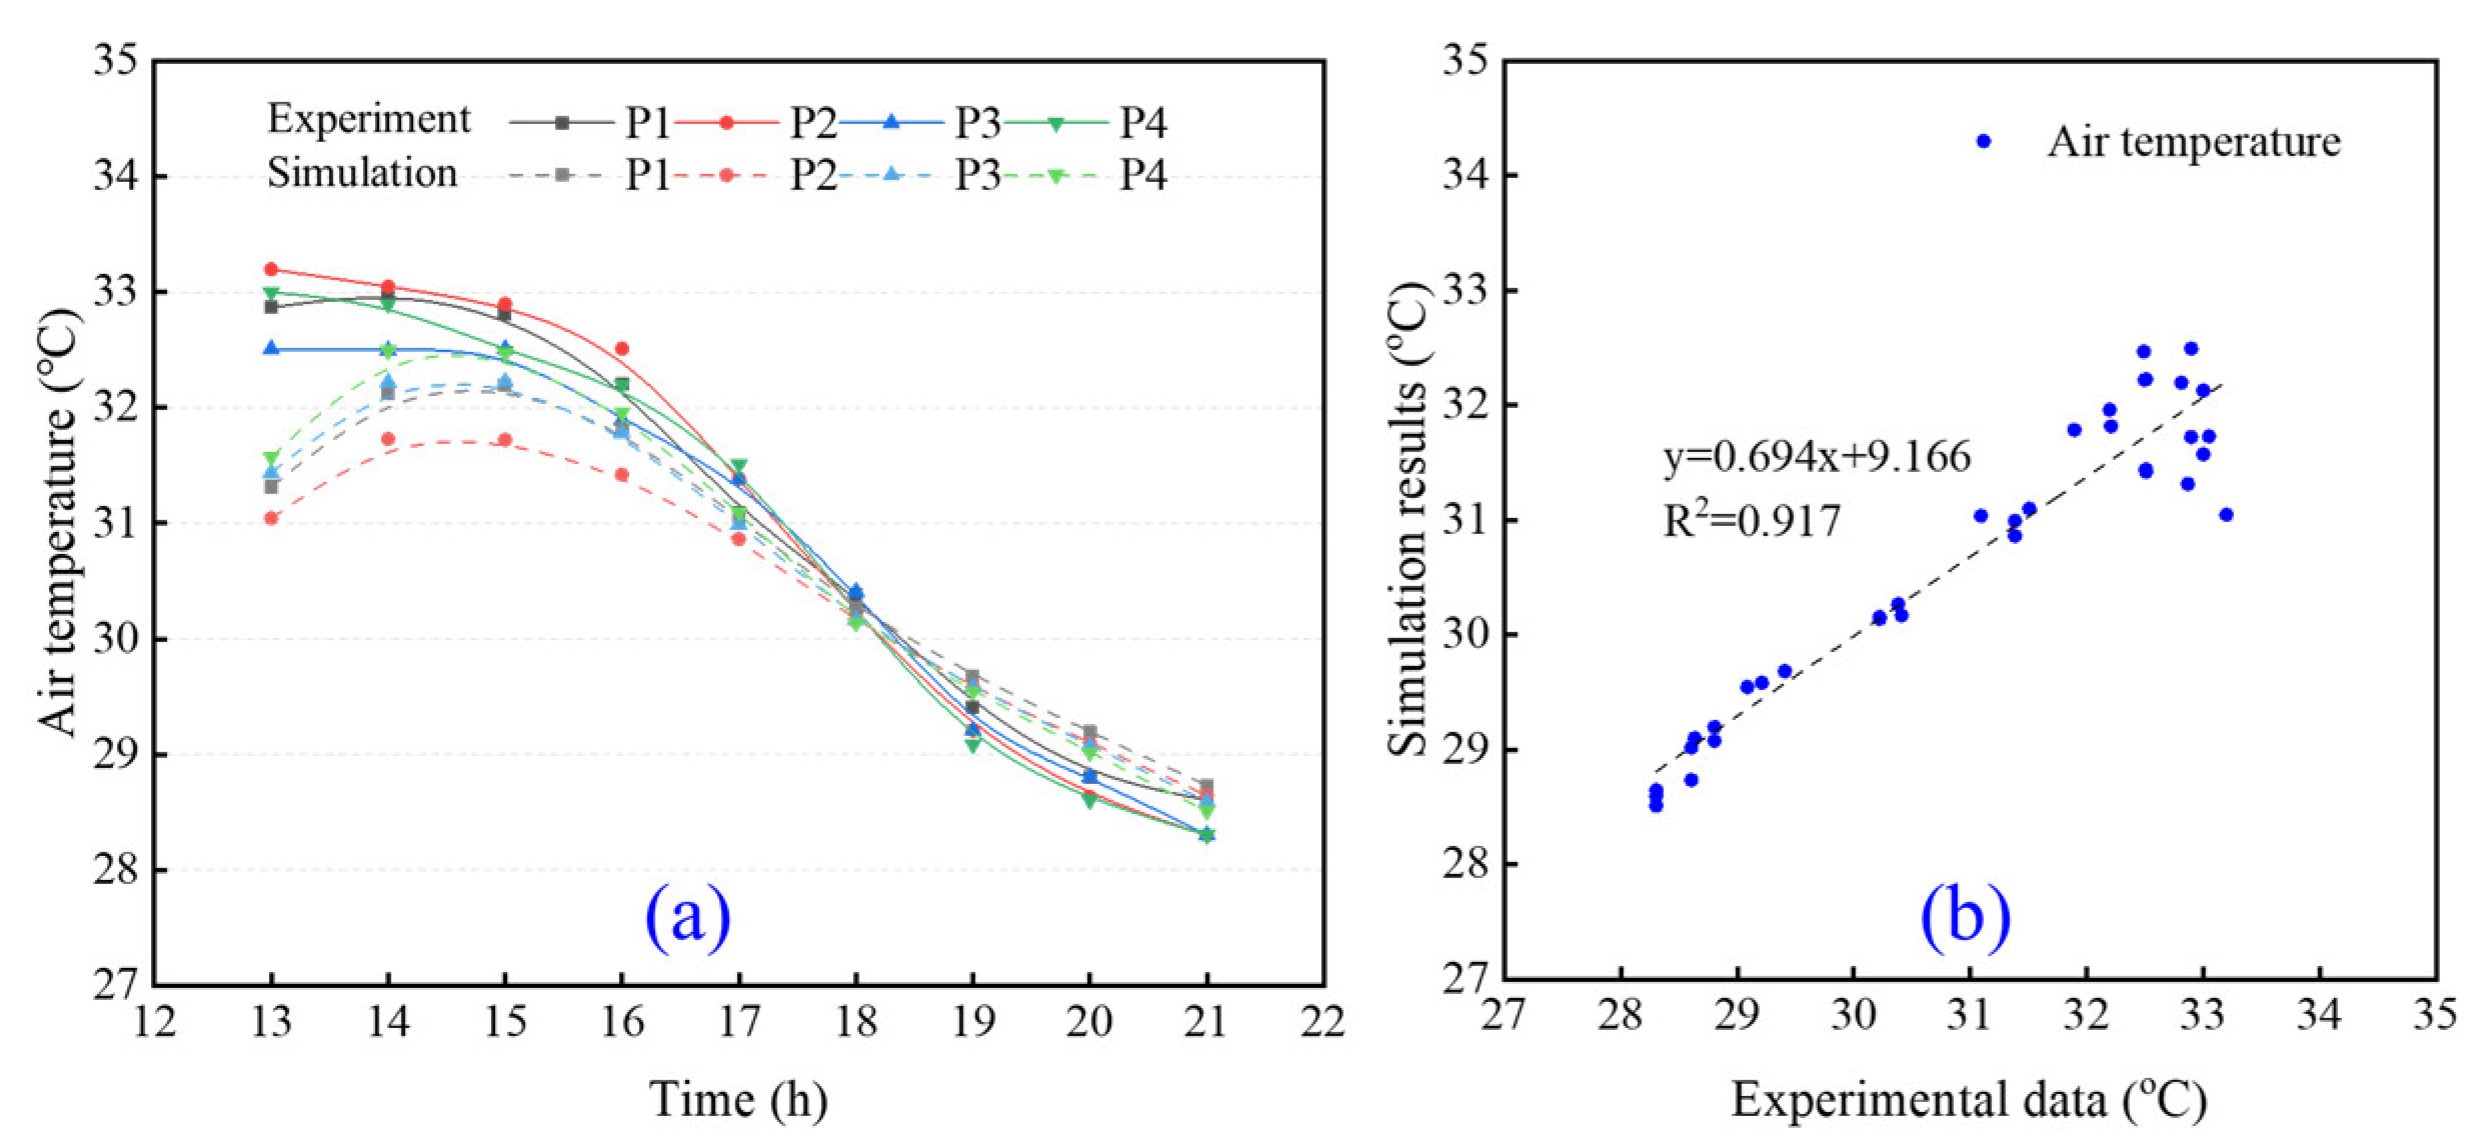
Figure 3 shows the numerical simulation results of air temperature compared with experimental data. The deviations between simulation results of air temperature at noon and the experimental data are relatively large, among which the deviation of measurement point P2 is about 2 °C, corresponding to a relative error of 6.4%, while the simulated result in the evening and at night are in good agreement with experimental data. It can also be seen from Figure 3b that simulation results at low temperatures (≤32 °C) agree well with the experimental data, and the value of R2 is 0.917 in terms of the linear fit of the simulation results. The validation results in this paper show that it is feasible to apply ENVI-met for outdoor microclimate simulation.
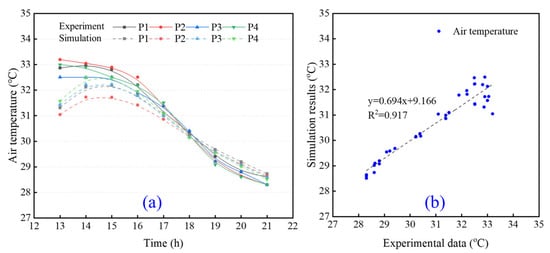
Figure 3.
Comparison between numerical simulation results and field-measured data. (a) Air temperature; (b) Comparison of deviations between the simulation results and experimental data for air temperature.
2.2. Residential Blocks Layout
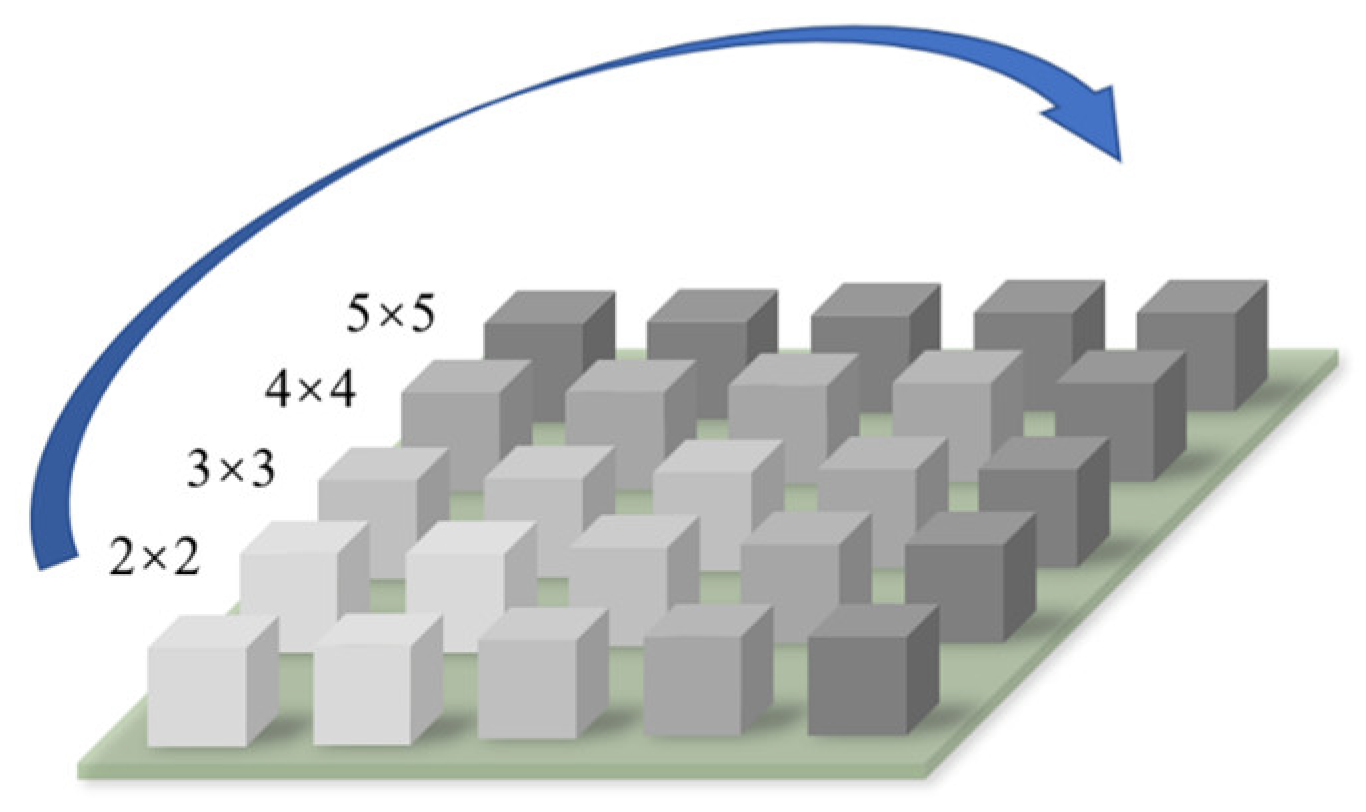
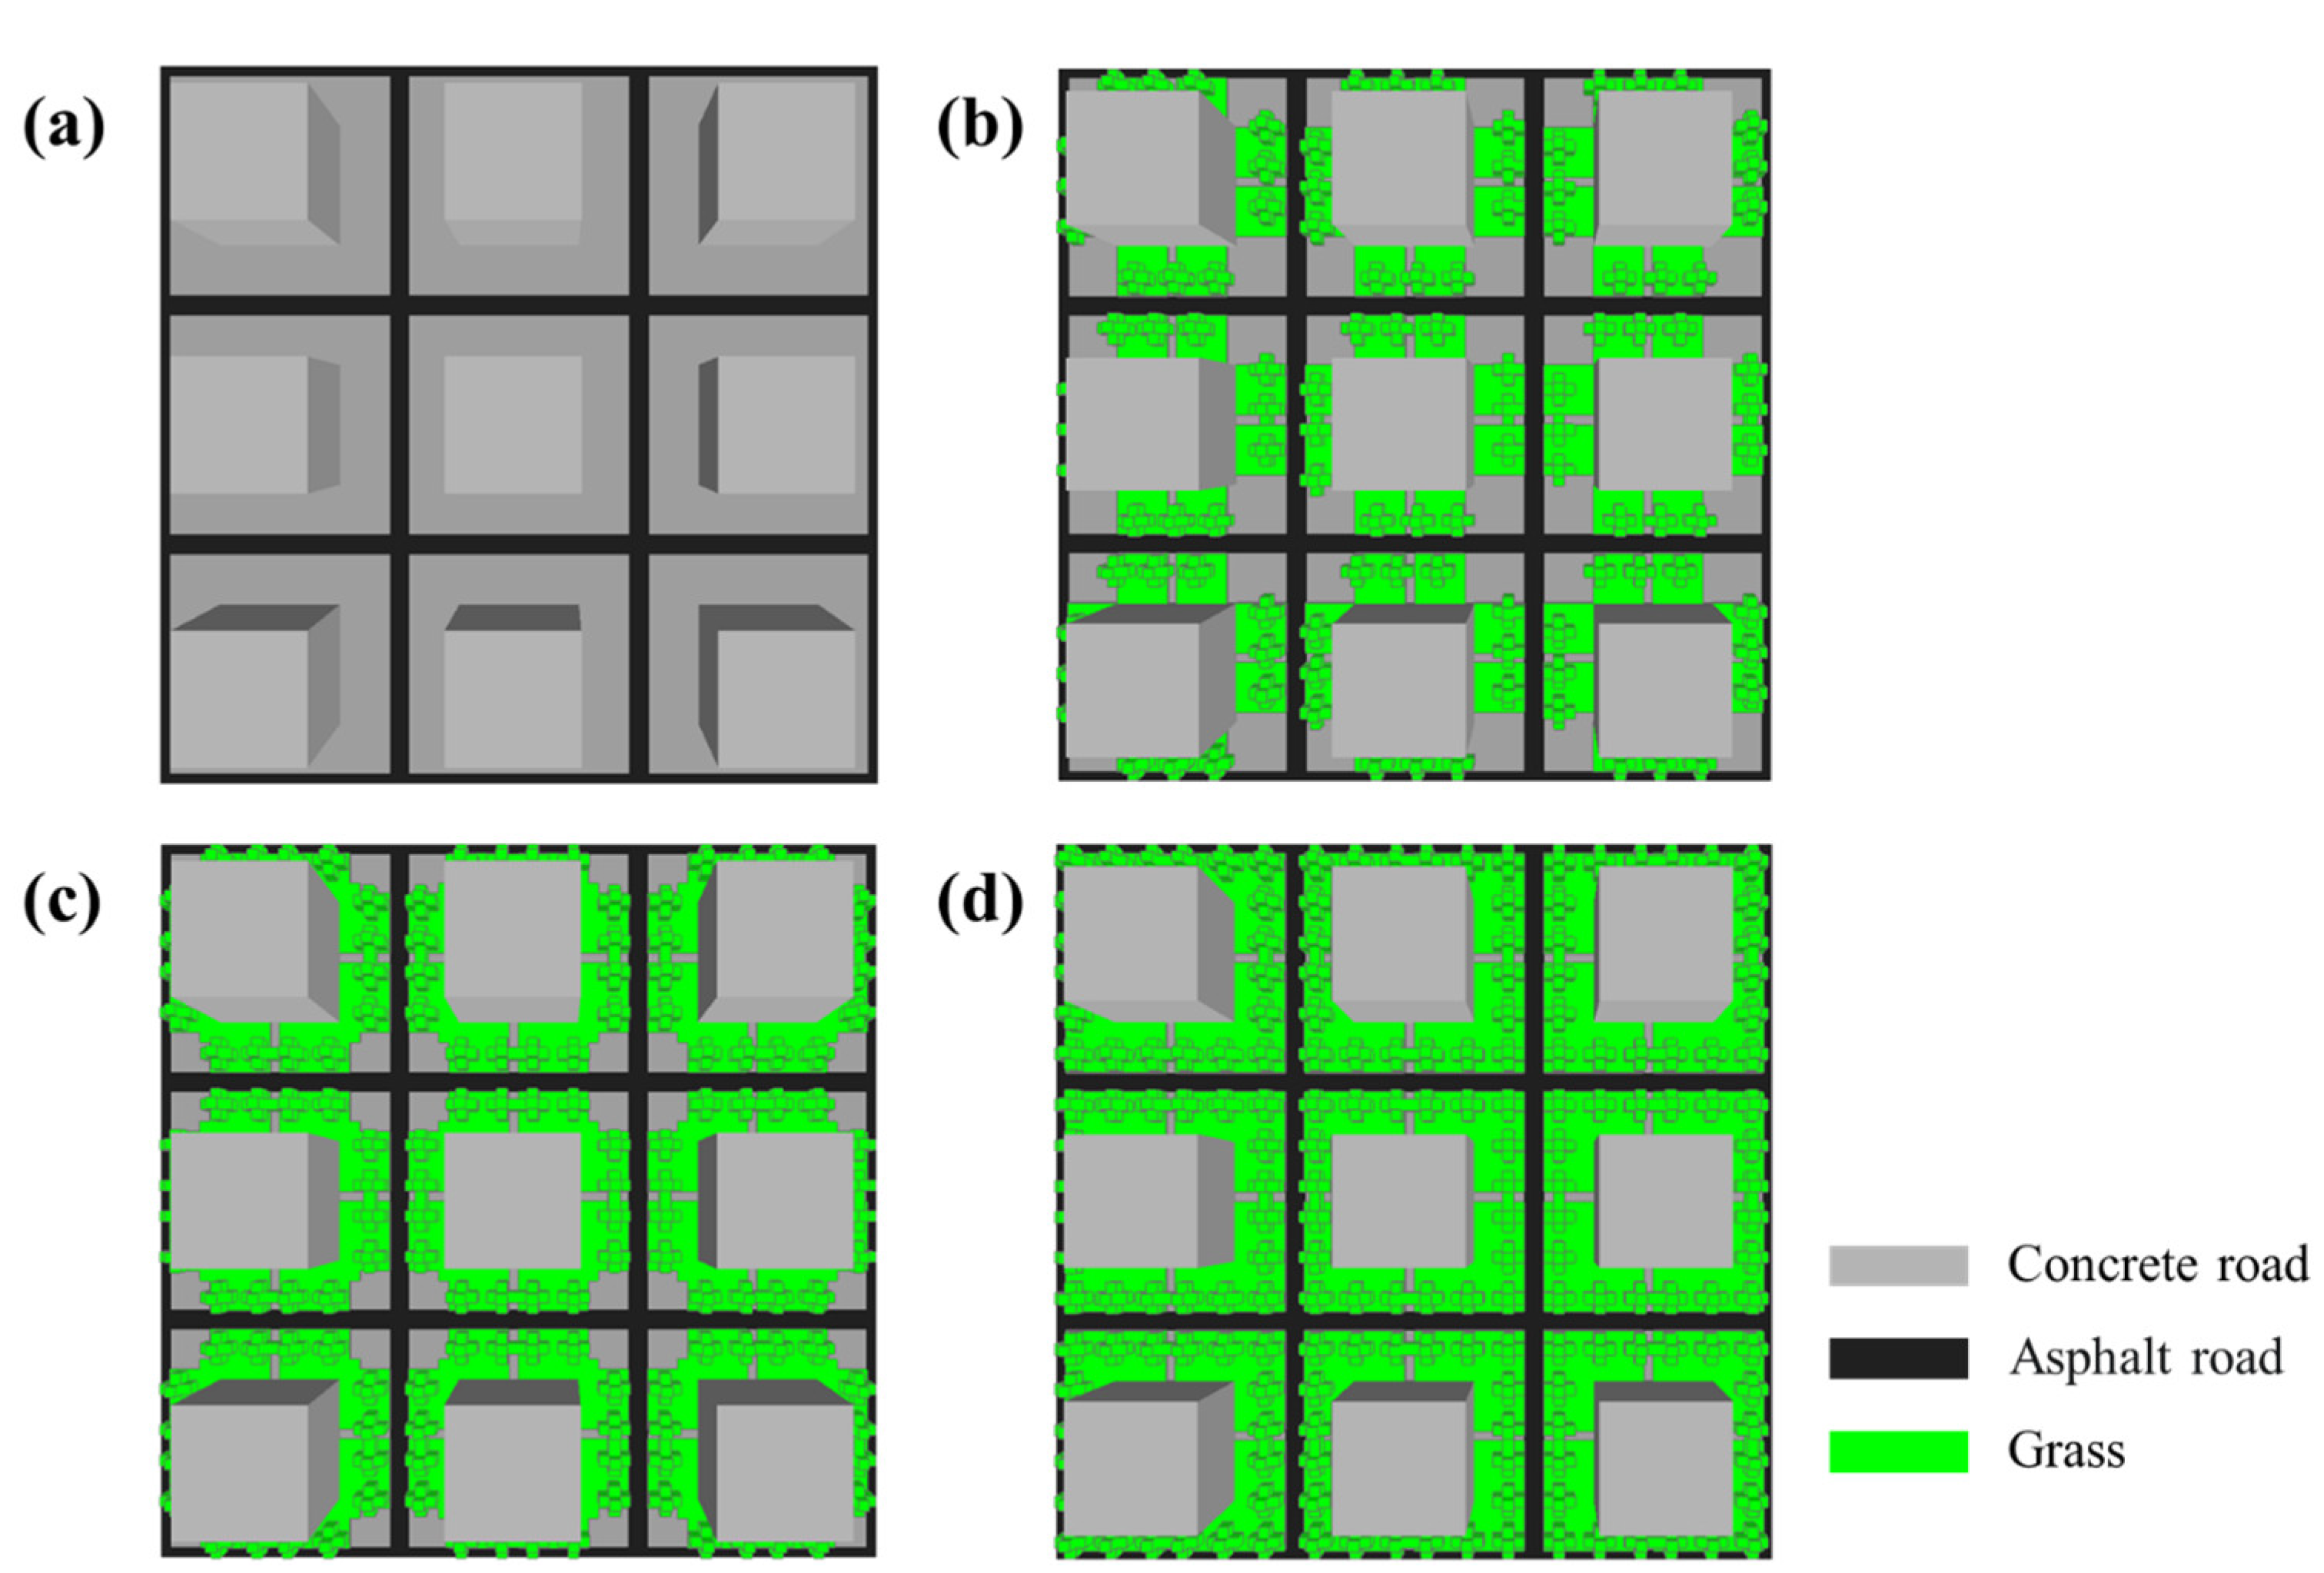
Shanghai, China’s largest economic center, is situated at the southeast end of the Yangtze River Delta with the longitude of 121°46′ E and latitude of 31°22′ N. According to the relevant regulations of Shanghai city planning [28,29,30], as shown in Figure 4, a series of idealized residential blocks of increasing scale have been established. The simulated scenarios are based on the following simplifications and assumptions: (1) The distance between the buildings is 24 m; the height of the middle-rise residential block is 18 m, corresponding to the height/width ratio (H/W) of 0.75. The length and width of the residential building are both 24 m, so the building coverage of the residential block is 25%; (2) The main roads in the residential block are asphalt pavements with a width of 4 m, and the branch roads connecting the main road and the building are concrete pavements with a width of 2 m; (3) As shown in Figure 5 (modeled in ENVI-met V4), in the base cases without any greening, all the underlying surfaces except the road surface are bare soil, while in the greening cases, the original soil is covered with grass and planted with deciduous trees, featuring a height of 5.0 m and a canopy width of 3.0 m.

Figure 4.
The layout of different-scale residential blocks (The direction of the arrow indicates an increase in blocks area from small to large).

Figure 5.
Model domain for the study area (3 × 3): (a) base case; (b) green ratio 35%; (c) green ratio 45%; (d) green ratio 55%.
By comparing the difference in outdoor thermal comfort with or without greening measures in residential blocks of different scales, the effects of vegetation on optimizing the outdoor thermal comfort of different scale residential blocks are investigated.
2.3. Numerical Simulation Configuration
The simulation study by ENVI-met V4 numerical modeling refers to the meteorological data of Shanghai Jiading Meteorological Bureau on 1 August 2020. Meteorological data and some important thermophysical properties used in the configuration file of the ENVI-met model are listed in Table 1. The resolution of the horizontal grids in the simulation domain was 2 m, and the vertical grid size was also 2 m, whereby the lowest vertical grid was divided into five equidistant sub-grids of 0.4 m. The simulation starts at 7 am and runs for a continuous period of 12 h. The computational time step was set to 2 s to ensure numerical stability. Output files were generated hourly (3600 s) to minimize storage demands while capturing diurnal thermal patterns.

Table 1.
Meteorological data and some important thermophysical properties for the configuration file.
3. Results
Wind speed and air temperature are two key parameters affecting outdoor thermal comfort, which is quantified in this study through the PET index. The transpiration of vegetation cools the surrounding air, while the existence of a tree canopy increases the flow resistance and reduces the wind speed around the trees. Low wind speed and low air temperature influence PET in opposite directions: wind speed decreases PET by reducing heat dissipation, while low temperature increases PET by lowering thermal comfort. From the perspectives of wind speed and air temperature, this section examines the effects of these two factors, influenced by vegetation, on the outdoor thermal comfort of different-scale residential blocks.
3.1. Wind Speed
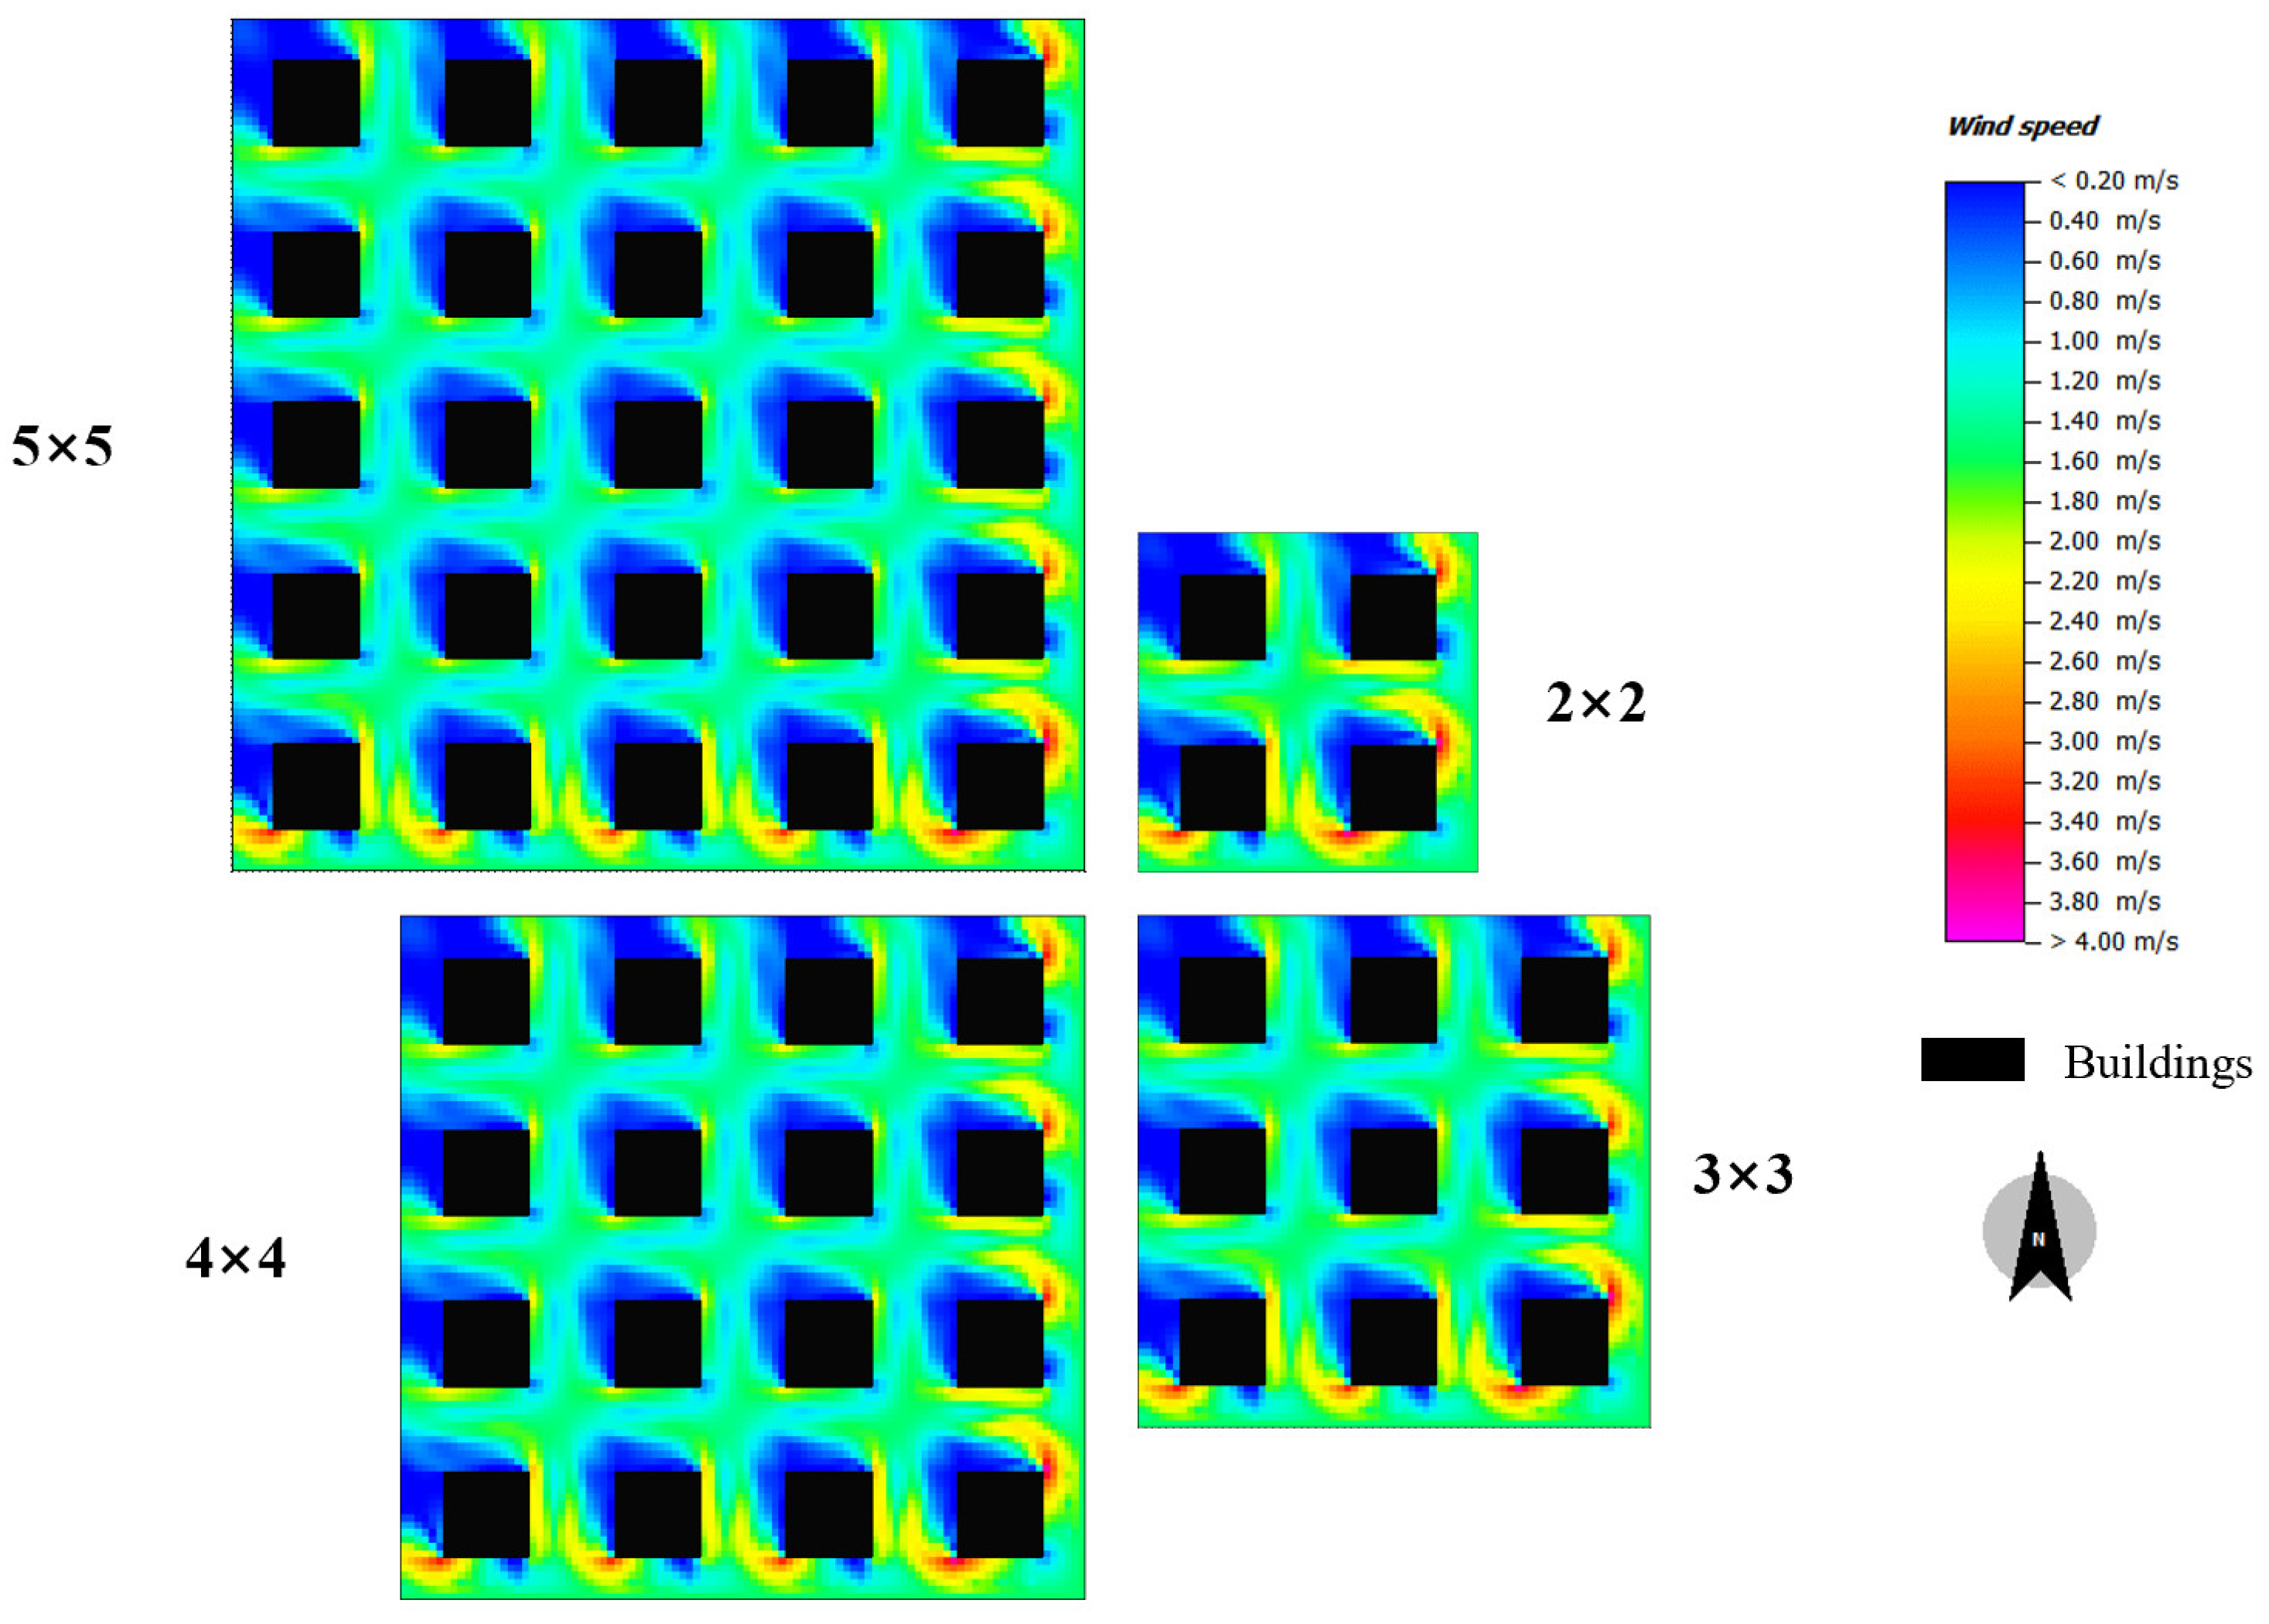
The wind speeds at the height of 1.4 m in different scale residential blocks at 9:00 a.m. are shown in Figure 6, Figure 7, Figure 8 and Figure 9. Vegetation and buildings are two important parts of underlying surface roughness in residential blocks. However, they have different influences on the approaching wind. After the incoming wind flow passes around the building, there will be a large pressure difference between the building’s windward façade and leeward façade. Meanwhile, the influence of buildings on the turbulent dissipation of incoming flow is not obvious, so the wind flows back to the original wind speed in the wake zone downstream of the building. As shown in Figure 6, in conditions without vegetation, there will be two obvious high-speed flows, like wings, around the first row of residential buildings in the windward direction. The wind speed of the flow around the wall is about 3.2 m/s; then, it gradually drops to about 2.2 m/s and can extend to the adjacent residential buildings on the same side. The incoming flow of 1.6 m/s quickly returns to its initial speed as it passes through the building so that the wind speed in most areas of the residential area is equal to the initial wind speed of the incoming flow. Although the existence of circumfluence can be observed in almost every residential building in the non-vegetated condition, there is obvious high-wind-velocity circumfluence only in the first row of the windward direction, and a small area of the windward vortex is formed in the front of the building, and a large area of backflow is formed in the rear of the building. However, with the expansion of the scale of residential areas, the characteristics of flow around buildings have not changed significantly. At the same time, due to the low density of buildings, the obstructing effect of buildings on airflow is not obvious. Even if the scale of residential areas increases and the number of buildings increases, the wind speed in the residential space is almost equal to the incoming wind speed. Meanwhile, because the first row of buildings in the windward direction has high wind speed flow around them, the influence distance is long. The smaller the residential area, the greater the impact of flow wings, and the higher the average wind speed within the area. With the increase in the scale of the residential area, the proportion of the area affected by the flow around the front row of buildings is becoming smaller, so the average wind speed in the residential area also decreases.
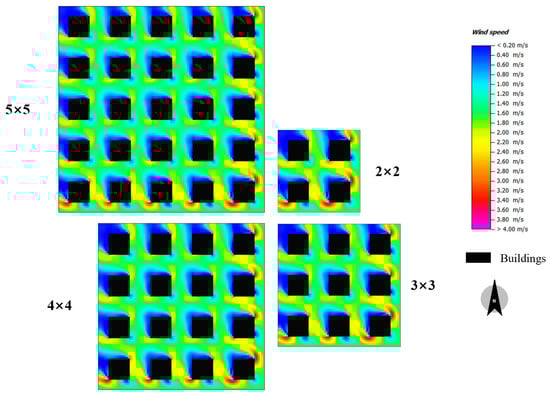
Figure 6.
Wind speed in base cases for different-scale residential blocks (GR = 0%).
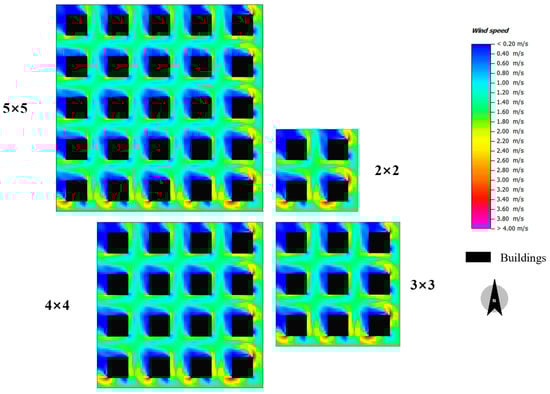
Figure 7.
Wind speed in greening cases for different-scale residential blocks (GR = 35%).
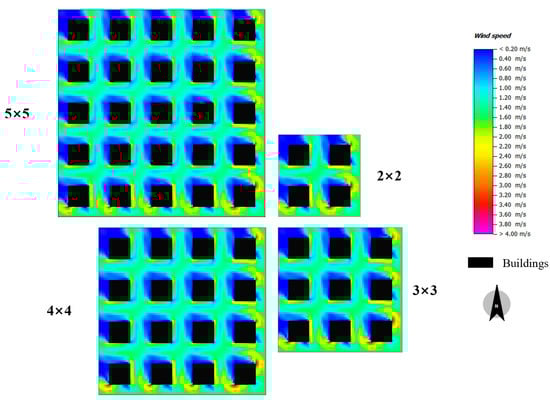
Figure 8.
Wind speed in greening cases for different-scale residential blocks (GR = 45%).
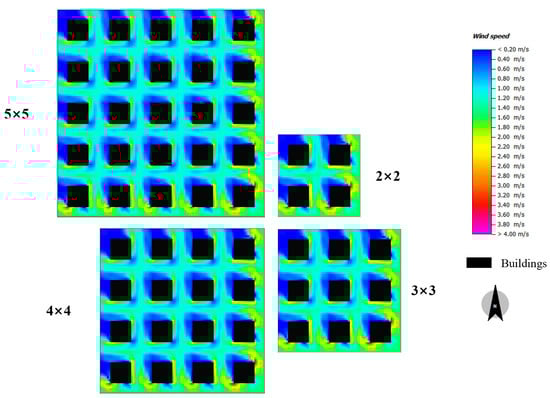
Figure 9.
Wind speed in greening cases for different-scale residential blocks (GR = 55%).
Different from buildings, airflow does not flow around the canopy of vegetation. The canopy with dense vegetation is composed of many branches and leaves, and airflow can pass through these pores. Therefore, in terms of airflow, vegetation is not an obstacle like a building but a porous medium. The wind speed can be restored to its initial speed after passing around the building but will be reduced after passing through the vegetation. As shown in Figure 7, when the green ratio is 35%, the flow wings are curved due to the vegetation. Meanwhile, the flow wings rapidly decrease after leaving the building wall, and the wind speed rapidly decreases to 2 m/s after passing through the vegetation, thus further shortening the extended distance and further expanding the area of the backflow at the rear of the building. As described above, the canopy of vegetation has a good wind protection effect, and the turbulent kinetic energy is dissipated when the air flows through the whole residential area. The downstream wind speed cannot recover from the incoming wind speed. When the scale of the residential area is expanded, the amount of vegetation in the residential area is further increased, so the average wind speed in the residential area also decreases.
As shown in Figure 6, Figure 7, Figure 8 and Figure 9, when the greening ratio of the residential area increases, the average wind speed in the residential area gradually decreases. For the 3 × 3 blocks configuration, the average wind speeds at 1.4 m height are 1.65 m/s, 1.27 m/s, 1.16 m/s, and 1.08 m/s at greening rates of 0%, 35%, 45%, and 55%, respectively. Since most vegetation is arranged along both sides of the road, in the high greening ratio condition, it is found that there is an obvious banded quiet wind area in the center of the residential area, as shown in Figure 9. With the increase in the greening rate, the wind speed of flow wings on both sides also decreases, and the influence distance is shortened. The decrease in the overall wind speed in the residential area has a negative effect on the thermal comfort of the residential area in summer.
3.2. Air Temperature
The radiation absorption rate of air is low, and its direct energy from solar radiation is little, so the effect of solar radiation on directly raising the temperature of air is poor. From the perspective of energy transfer, the rise in the air temperature in the residential area system mainly depends on the energy transfer between air and surfaces. For example, the building’s exterior walls, roof, and roads exhibit higher temperatures than the ambient air during daytime due to their high solar radiation absorption rate and substantial thermal mass, which results from high specific heat capacity combined with high density. This is attributed to the absorption of large amounts of solar radiation by these surfaces. Therefore, the temperature of these surfaces will be significantly higher than the air temperature. The air temperature will rise by convection heat transfer with these surfaces. The mass and energy exchange between vegetation and the atmosphere also has a significant impact on air temperature. The transpiration of vegetation reduces the air temperature around the vegetation in the form of latent heat.
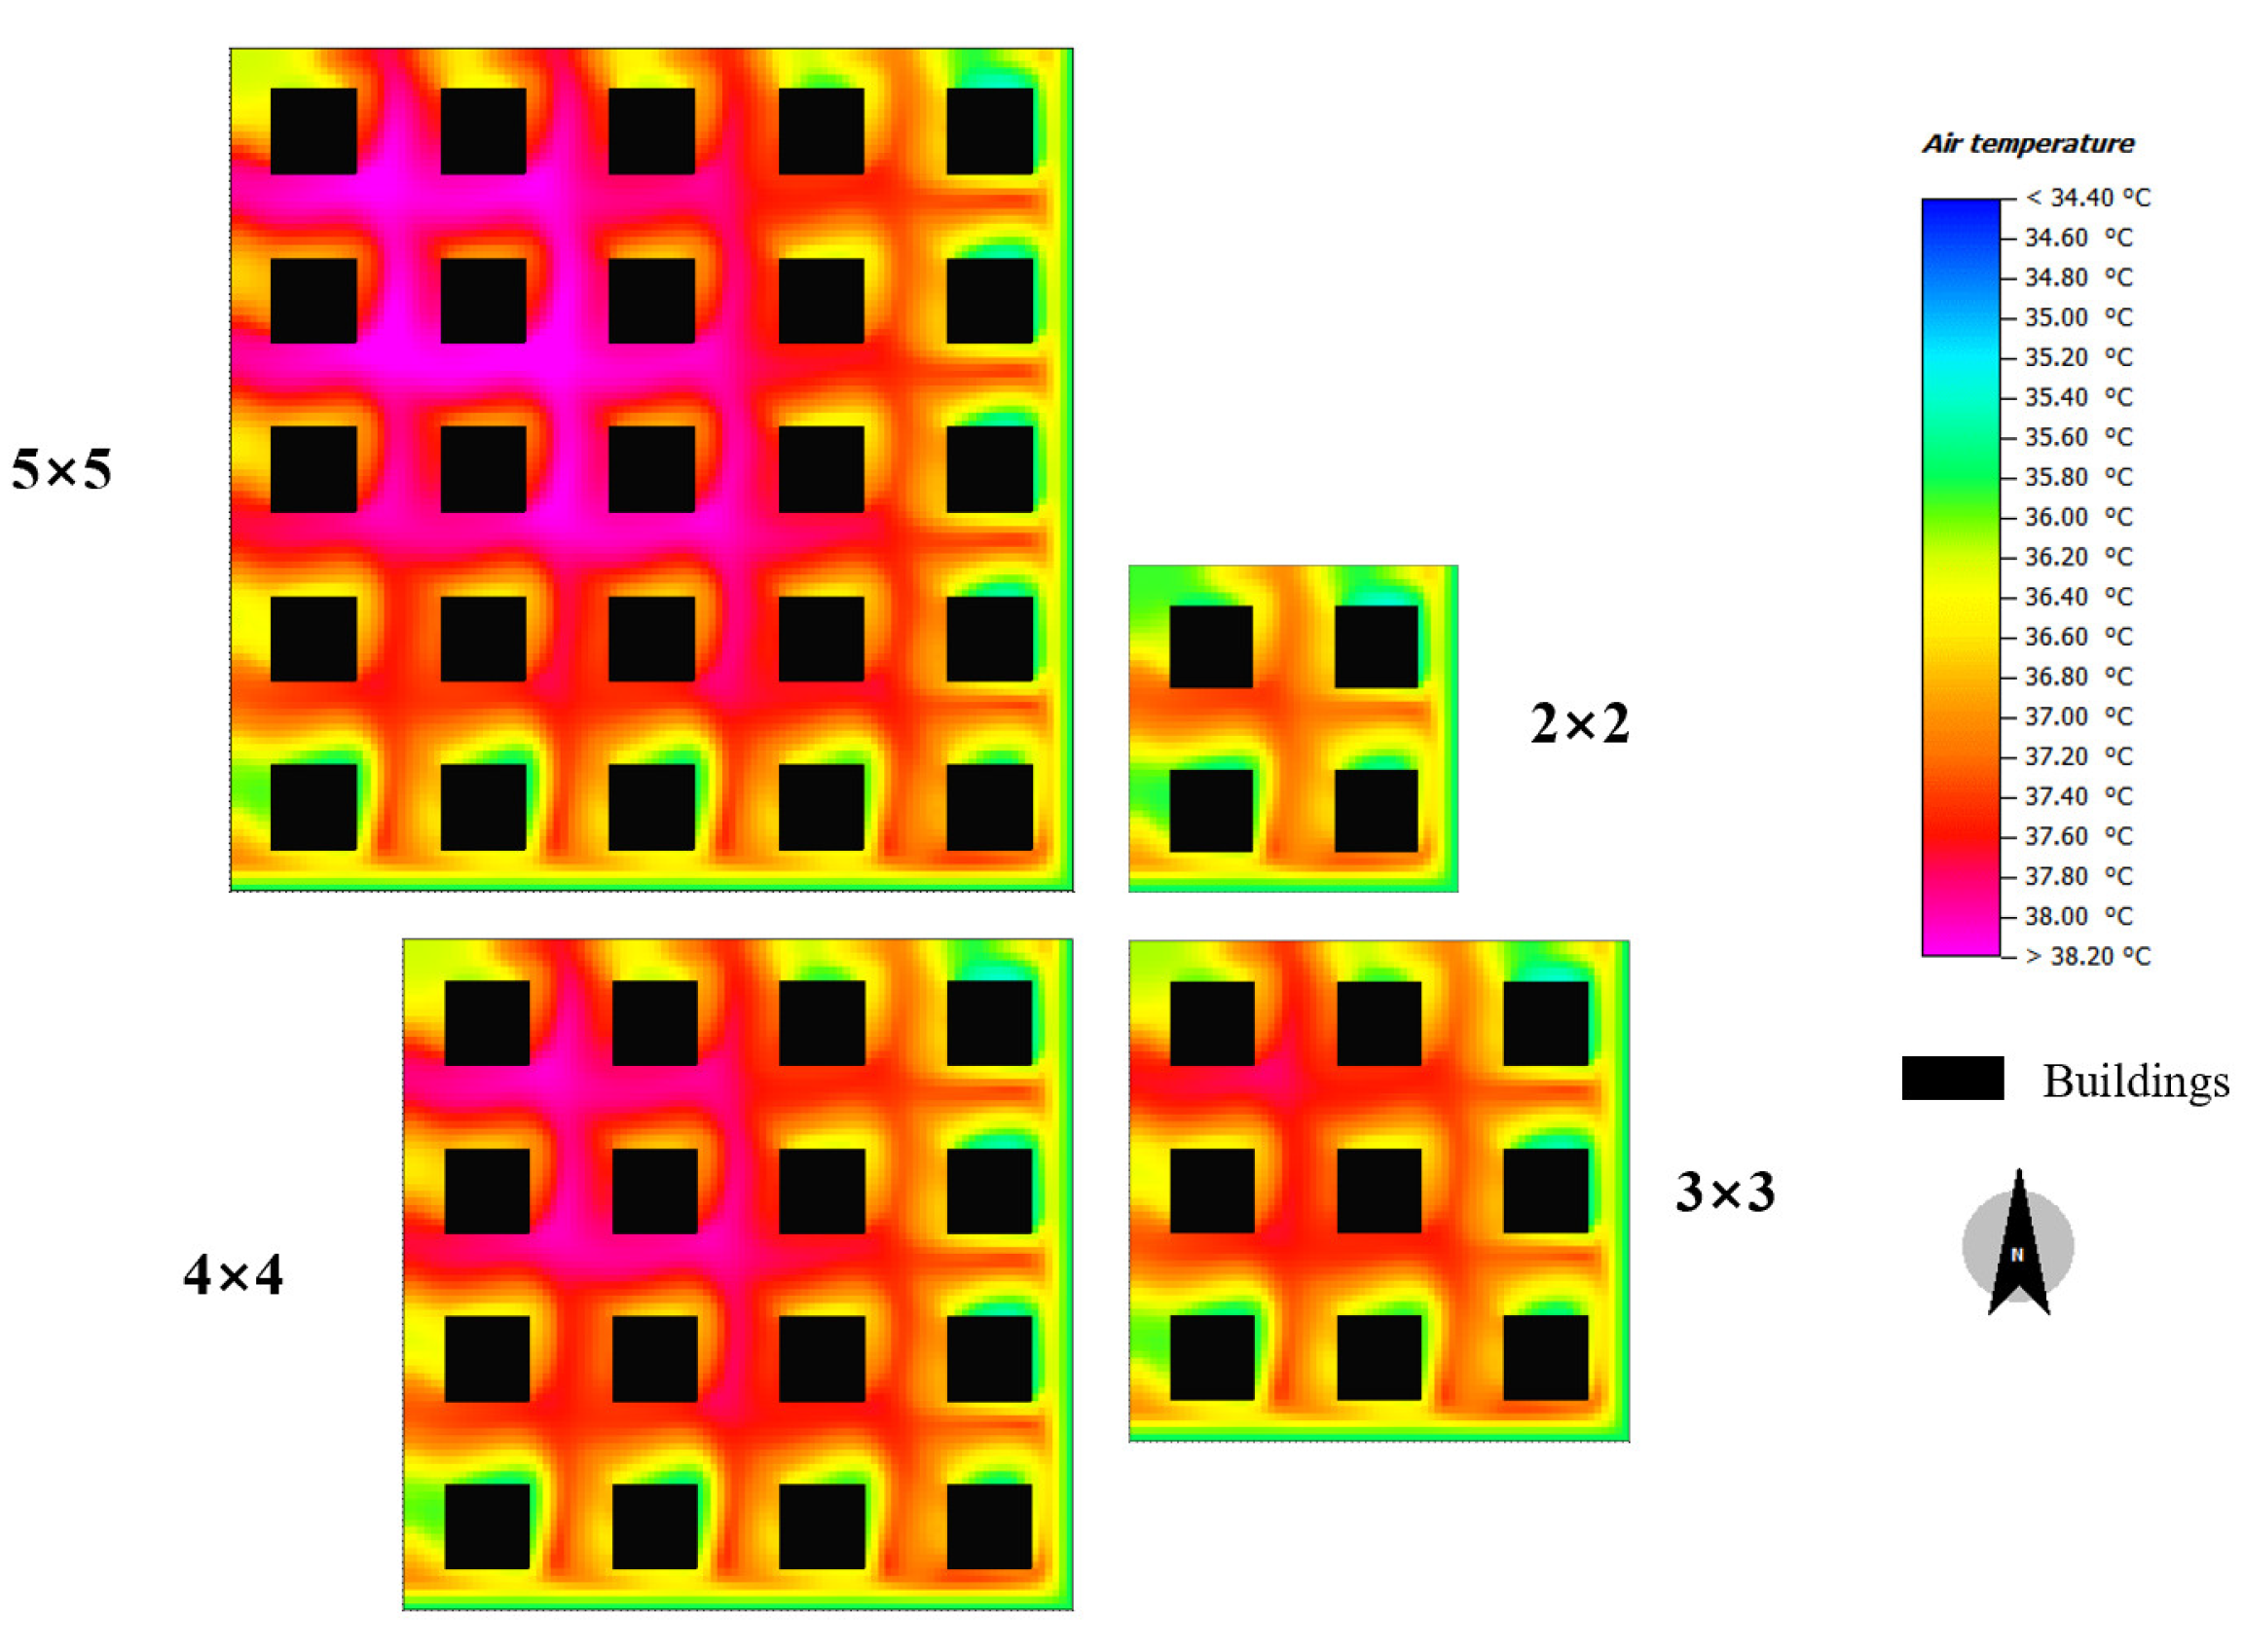
The air temperature at the height of 1.4 m in different scale residential blocks at 14:00 are shown in Figure 10, Figure 11, Figure 12 and Figure 13. It can be seen that the area with high temperature is mainly concentrated in the pavement part of the residential area and presents a band. Therefore, the high-temperature part of the temperature color map divides the entire residential area into a checkerboard structure. The main reason is that among many underlying surface materials, asphalt has a low albedo, which is 0.2 in this study, so the surface temperature of asphalt pavement will be higher than that of other underlying surfaces. Combined with the above description of airflow, the wind speed of residential pavement is low, so the efficiency of energy exchange between high-temperature air and surrounding materials is low, resulting in high temperatures above the asphalt pavement. This is also similar to our actual situation; when we walk on the black asphalt in summer, we often feel heat waves, but when we walk on the greenbelt, we feel cooler. From the figure, we also found that the temperature on the south side of the building was higher than that on the north side. The main reason is that the southern wall has a longer sunshine duration during the day than the northern wall, so the temperature of the southern wall is higher, and the temperature of the southern side is also higher.

Figure 10.
Air temperature in base cases for different-scale residential blocks (GR = 0%).

Figure 11.
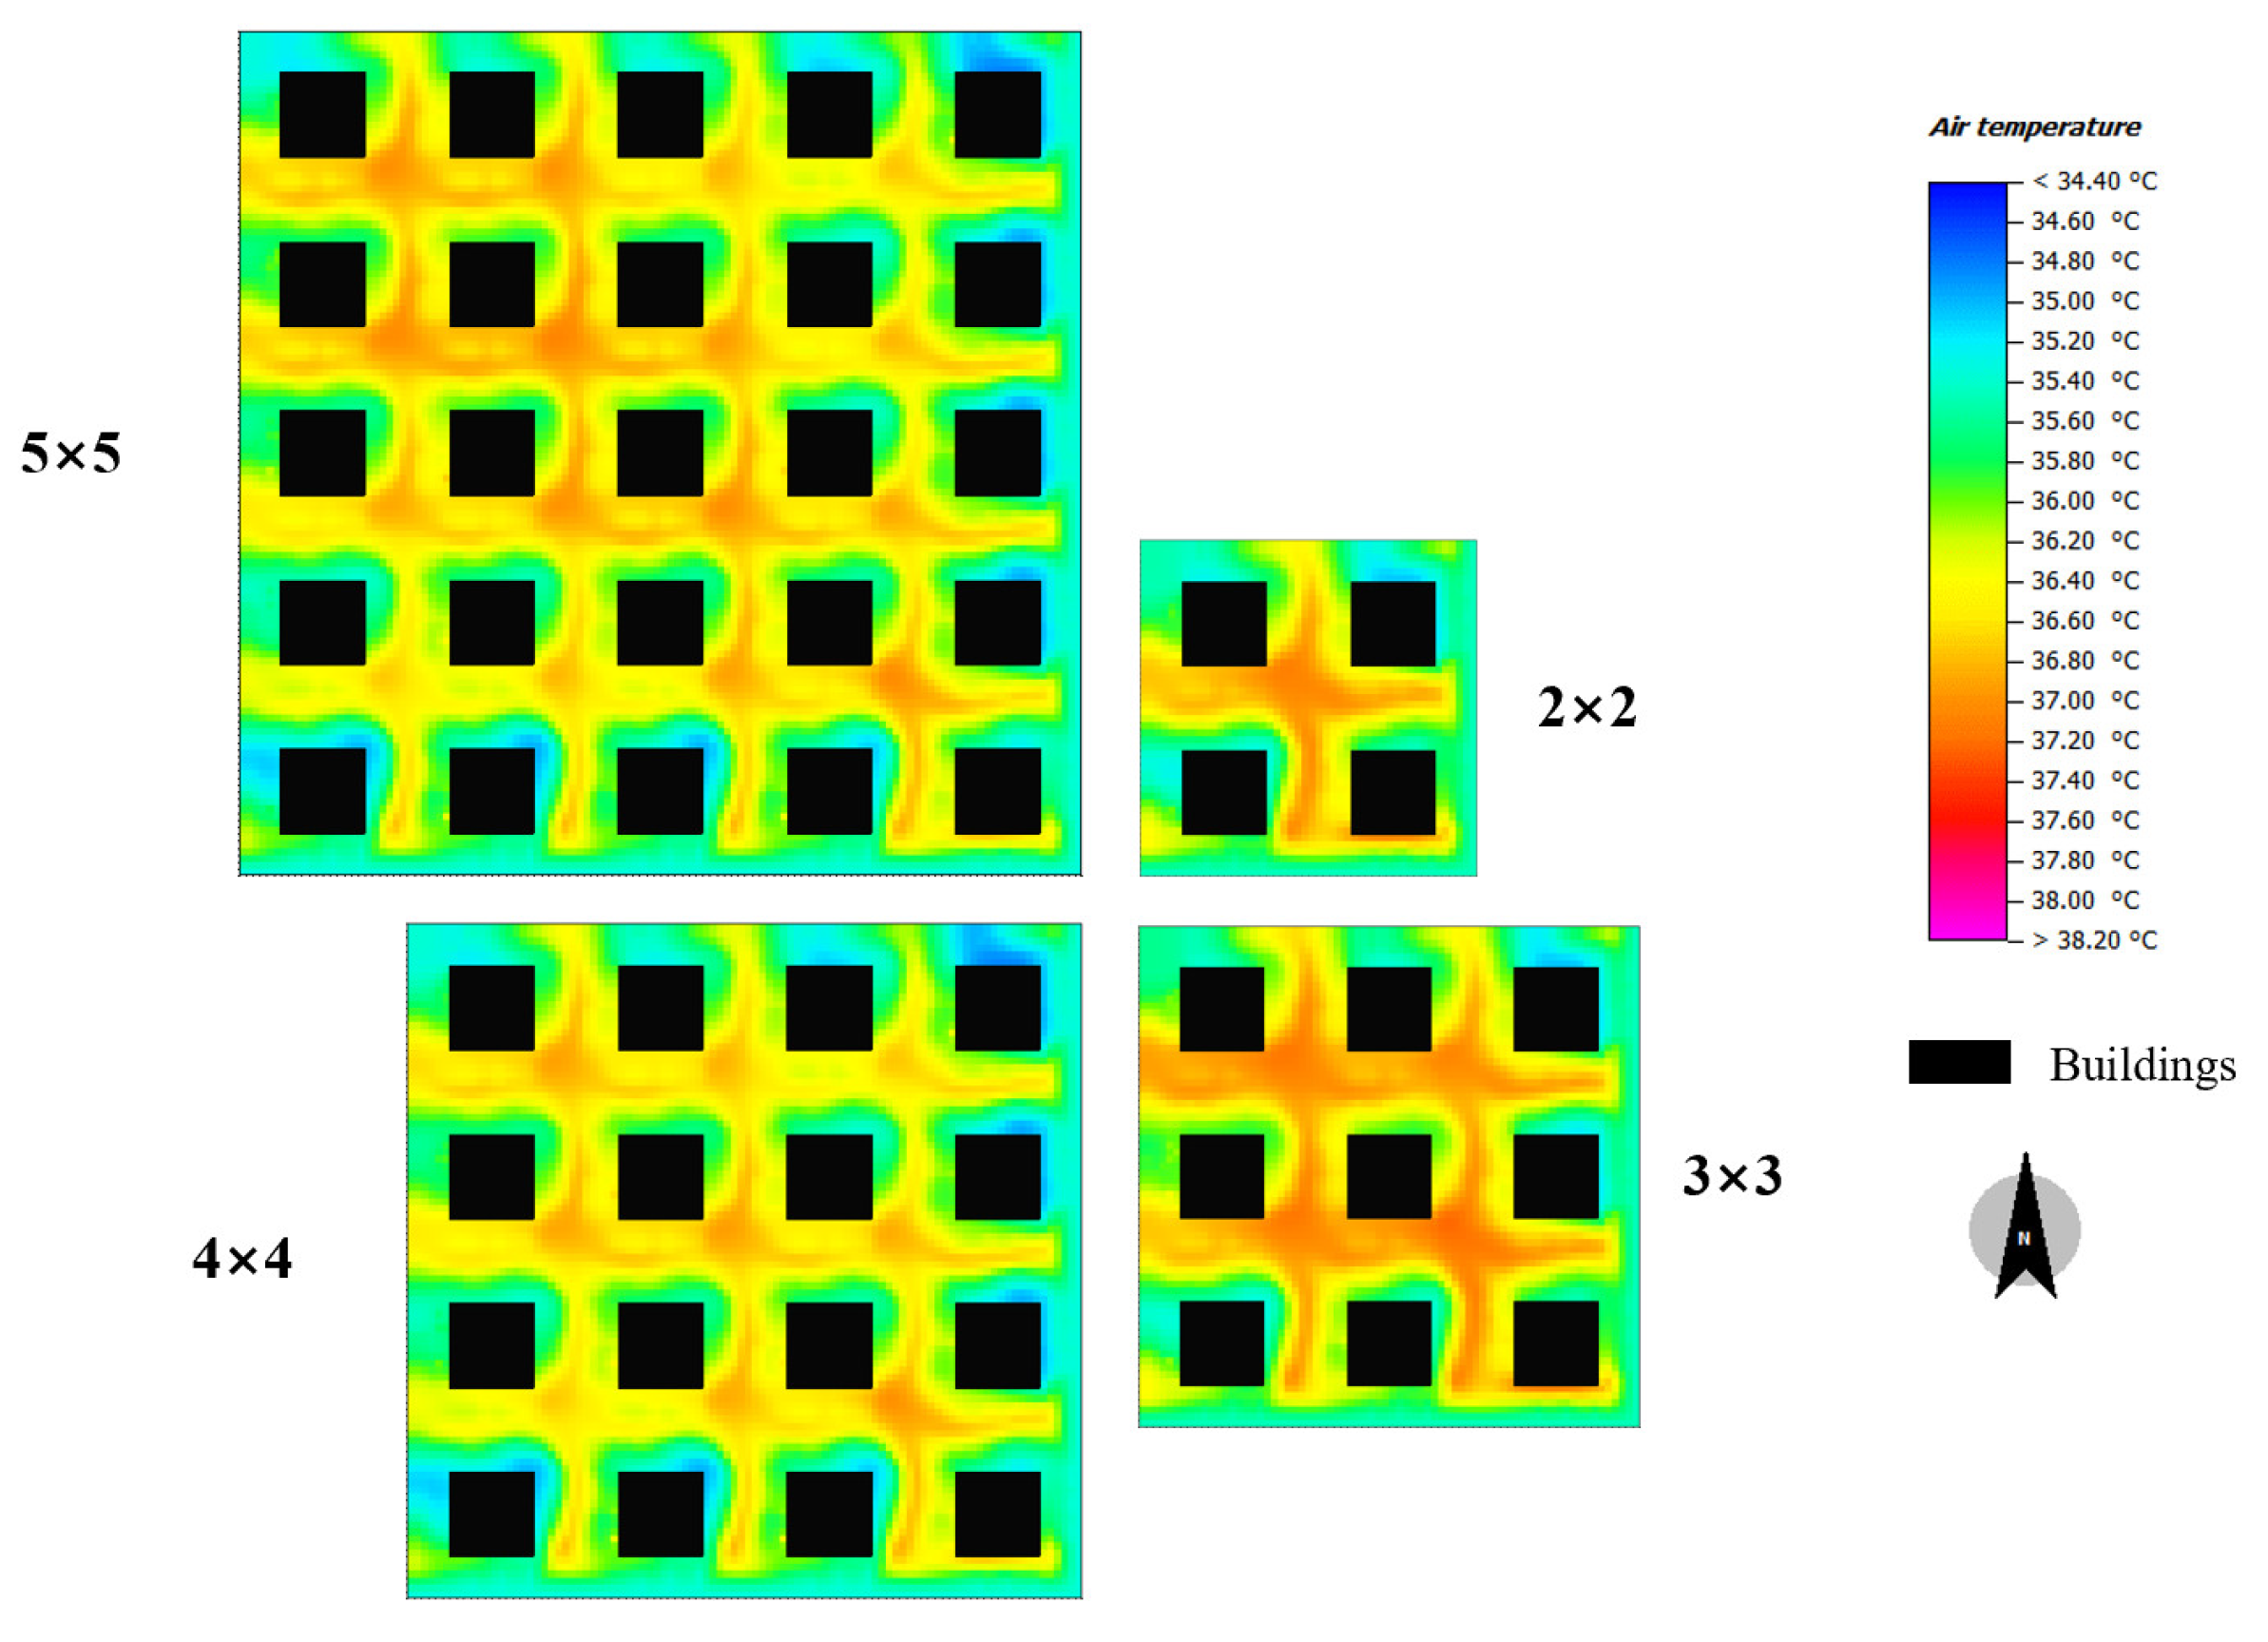
Air temperature in greening cases for different-scale residential blocks (GR = 35%).

Figure 12.
Air temperature in greening cases for different-scale residential blocks (GR = 45%).
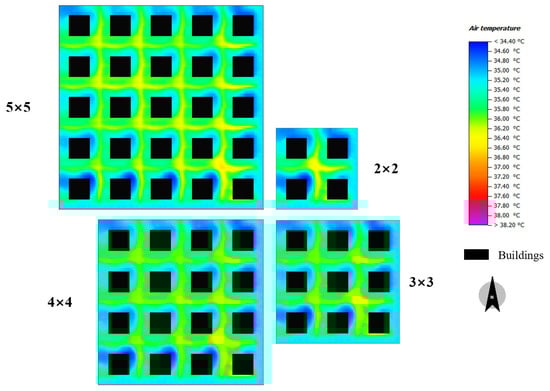
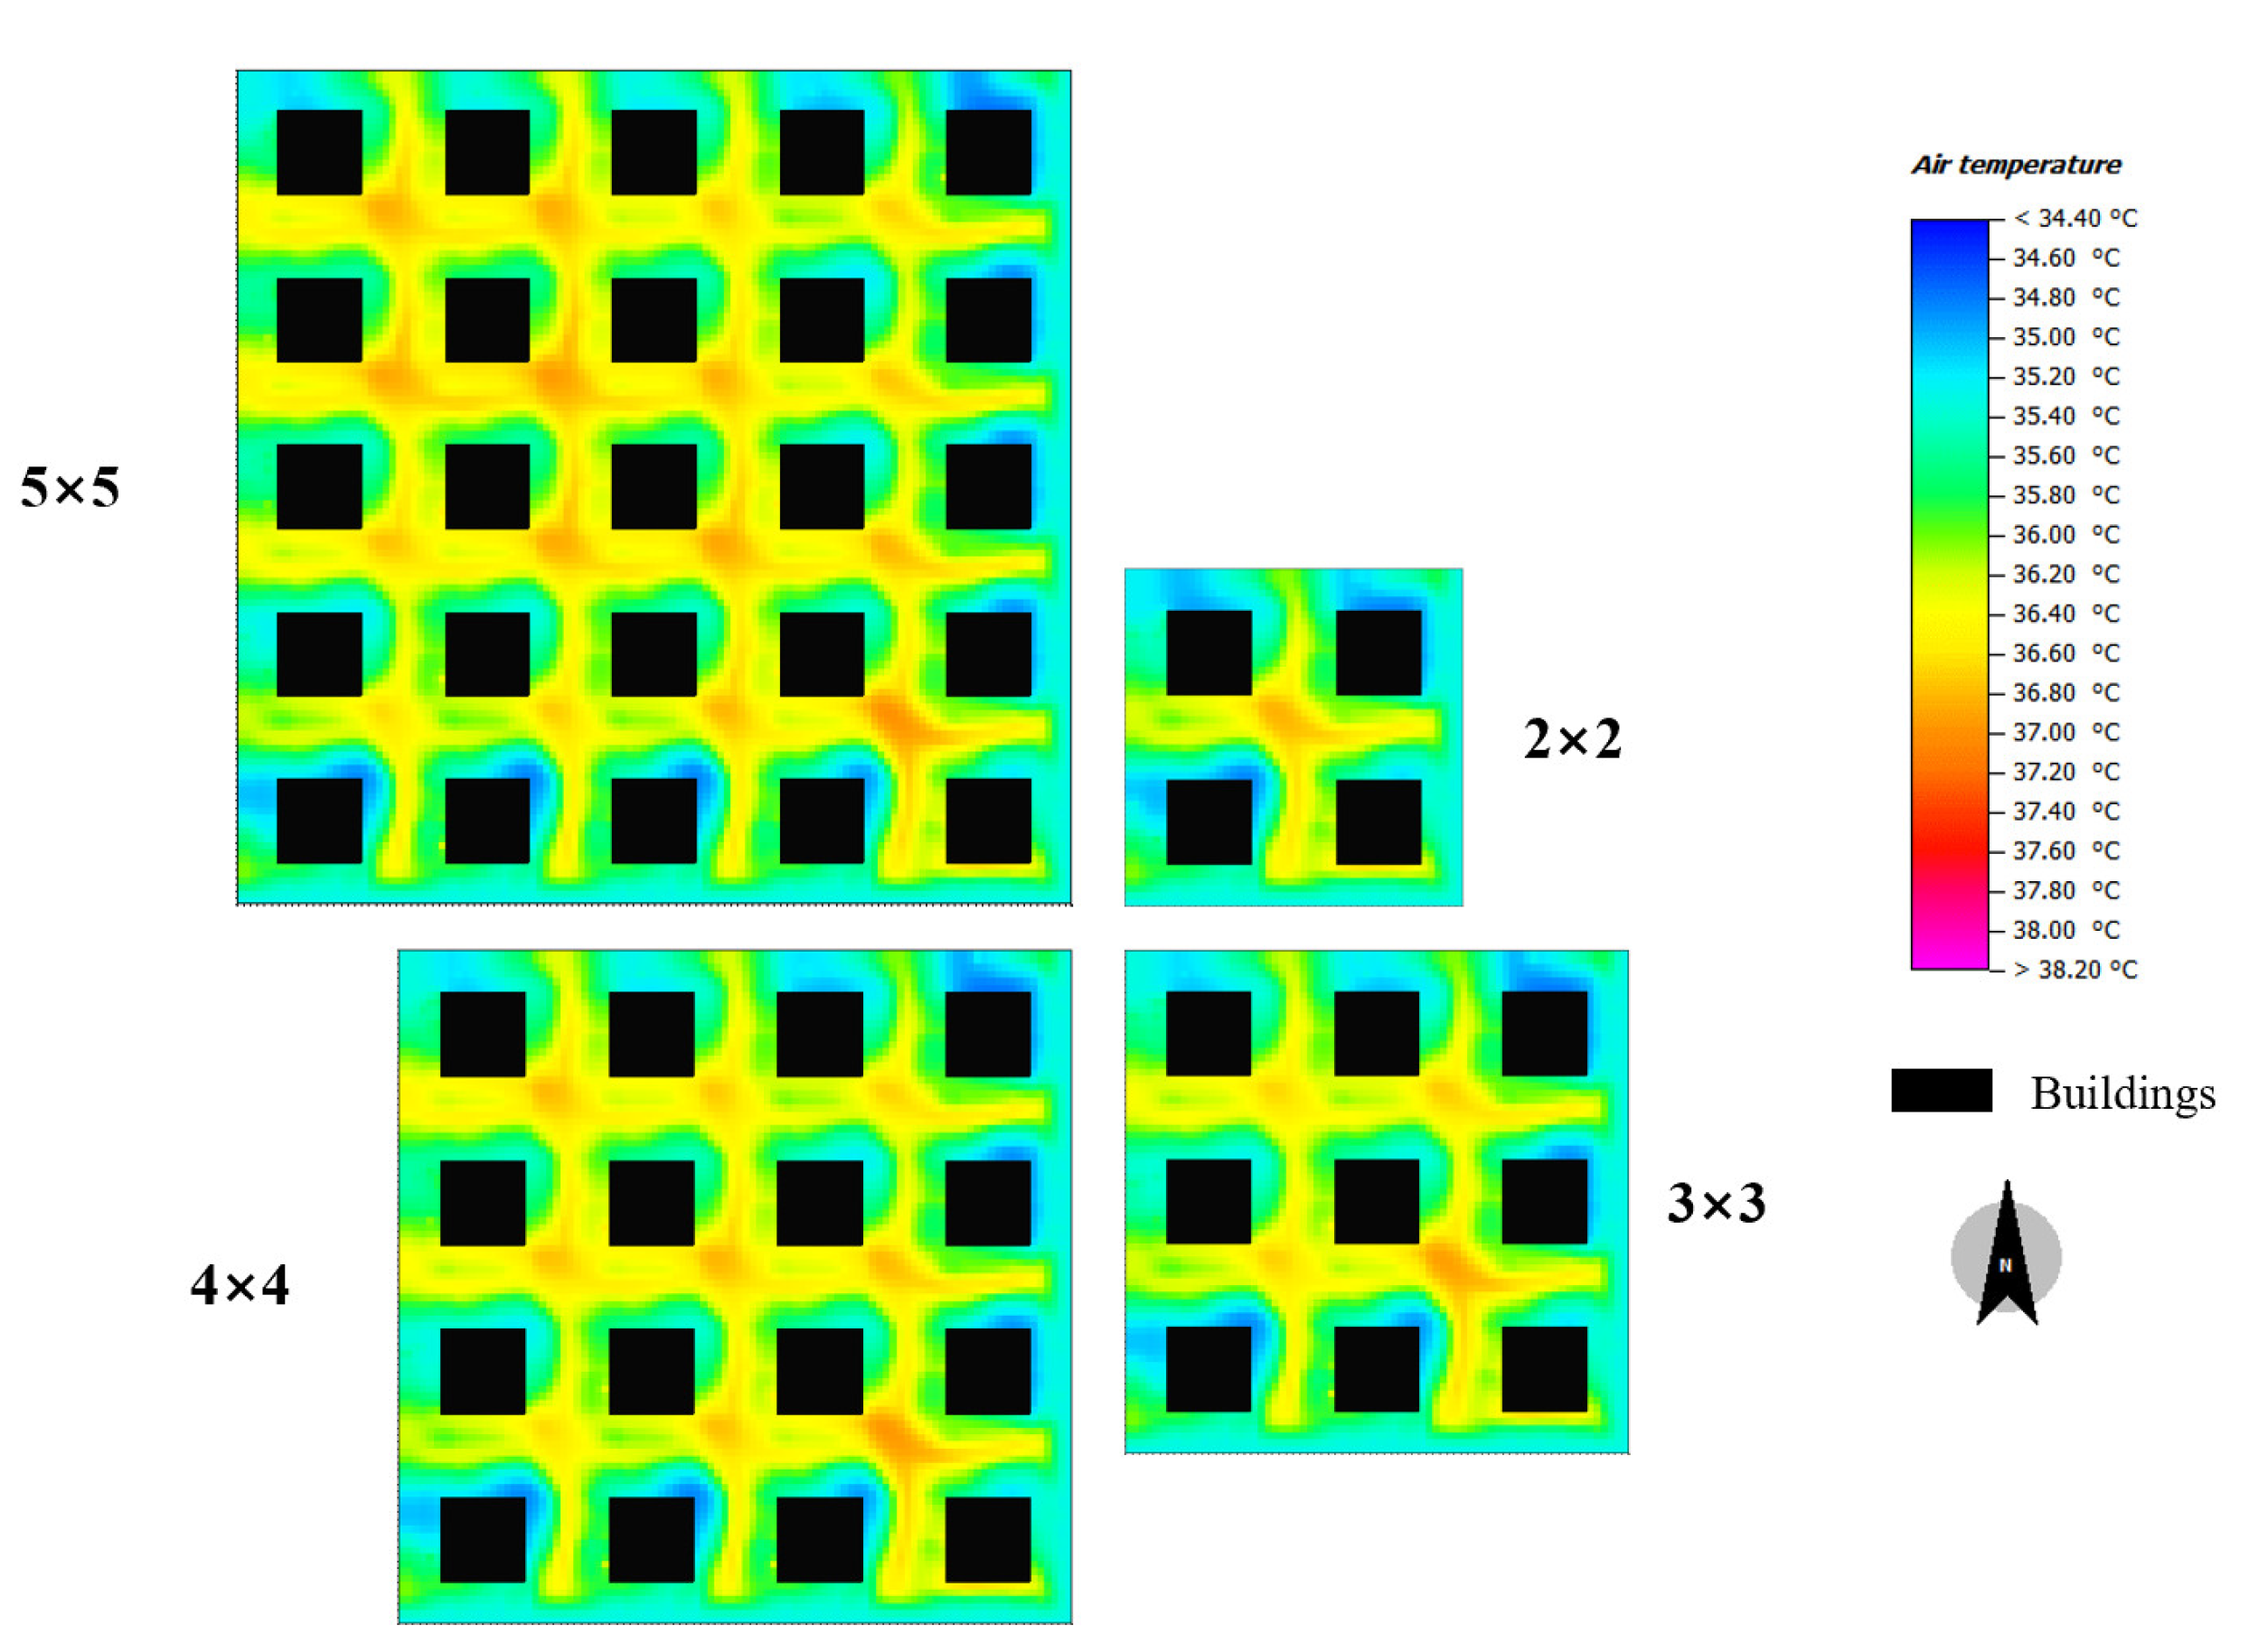
Figure 13.
Air temperature in greening cases for different-scale residential blocks (GR = 55%).
With the increase in the scale of residential areas, the temperature of residential areas under different green ratios shows different rules. As shown in Figure 10, in the non-vegetated condition, there is almost no means to control the temperature. As the incoming flow passes in the residential area, it is continuously heated by the surrounding surfaces, so the downstream air temperature is significantly higher than the initial temperature of the incoming flow. After the addition of vegetation, the cooling effect of vegetation is obvious. The higher the green ratio, the lower the temperature of residential areas. Compared with the condition without vegetation, the temperature in the residential area decreased by more than 2 °C in the condition with a 55% green ratio. In the conditions with vegetation, the temperature did not rise as the scale of residential areas increased as in the conditions without vegetation. There is almost no significant temperature difference in different scales. The possible reason is that vegetation has a strong ability to regulate climate and can maintain the surrounding environment in a relatively stable state within its physiological bearing range. Moreover, the influence range of vegetation cooling effect is relatively limited, and vegetation can only regulate air temperature in a small area. Therefore, with the increase in the residential scale in vegetation conditions, the air temperature in the residential area does not rise significantly due to the longer heat exchange between air and surfaces, nor did it decrease with the increase in the total area of green space, maintaining a relatively stable level. Therefore, it is believed that the existence of vegetation reduces the differences within residential areas, and the thermal parameters inside residential areas develop toward homogenization.
Air temperatures at 09:00 and 17:00 under different scenarios are also analyzed, revealing trends similar to those at 14:00. As the greening rate increases, residential area temperatures decrease, with a reduction of approximately 1 °C at a 55% greening rate, which is slightly lower than the decrease observed at 14:00. No significant differences in air temperature distribution were found across residential blocks of varying scales.
3.3. Outdoor Thermal Comfort
In the PET evaluation calculated in this paper, air temperature, relative humidity, wind speed, mean radiant temperature, clothing, and activity level of people will be used as input parameters to obtain PET value. In the evaluation of the outdoor environment of the entire residential block, the mean PET of all grids with a height of 1.4 m on the pavement is used to evaluate the overall thermal comfort of the residential block. PET of base cases and greening cases in all-scale residential blocks are compared to investigate the effect of greening measures on increasing outdoor thermal comfort in all-scale residential blocks.
The mean PET at the height of 1.4 m in different-scale residential blocks is shown in Figure 14. Three representative moments are selected, which are 9:00 in the morning when the temperature rises. The highest temperature of the day is at 14:00, and in the evening, at sunset, people are more active at 17:00. The mean PET is highest at 14:00, 15% to 18% higher than at other times. This is because solar radiation is stronger at 14:00 than at other times; thus, the air temperature will be higher. At 14:00, with the increase in the residential scale, the PET showed a gradual rising trend for the condition without greening, while in the vegetation condition, the PET showed a slight fluctuation but no obvious change on the whole. The main reason is that in the case of no greening, the air temperature is obviously high, and vegetation has no cooling effect on the residential area. With the increase in the residential scale, the air receives more sensible heat flux from various surfaces, so the thermal comfort also deteriorates, and the PET rises. In the case of greening, a part of sensible heat obtained by air will be offset by the latent heat of vegetation transpiration, but the influence of vegetation is limited. Therefore, in residential areas of different sizes, the thermal comfort of the community could remain almost unchanged under the same green ratio.
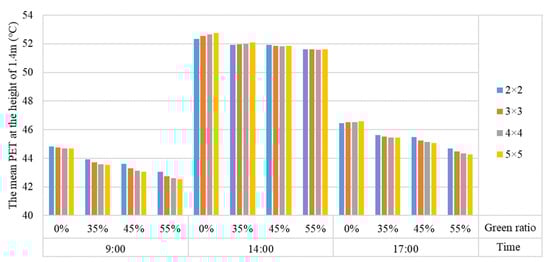
Figure 14.
The mean PET at a height of 1.4 m in different-scale residential blocks.
By comparing the effect of different green ratios on the overall thermal comfort of residential, it is found that the greater the green ratio, the lower the PET and the more comfortable the overall thermal comfort. The relationship between PET and green ratio is not a negative correlation function. In the conditions of 35% and 45% green ratio, the PET has little difference. When the green ratio reaches 55%, the PET decreases significantly, which indicates that the improvement effect on outdoor thermal comfort by a high green ratio is better than that of a low green ratio. The main reason may be related to the local scale and group effect of green space. In the case of a low greening rate, due to the consideration of each unit, the limited green space is cut into many small areas. With the improvement in the greening rate, the area of original small-scale green space is further increased, and large-scale green space is gradually formed. The improvement in thermal comfort by concentrated green space is better than that of small-scale dispersed green space, so the PET under the condition of a high greening rate is significantly lower than that under the condition of a low greening rate.
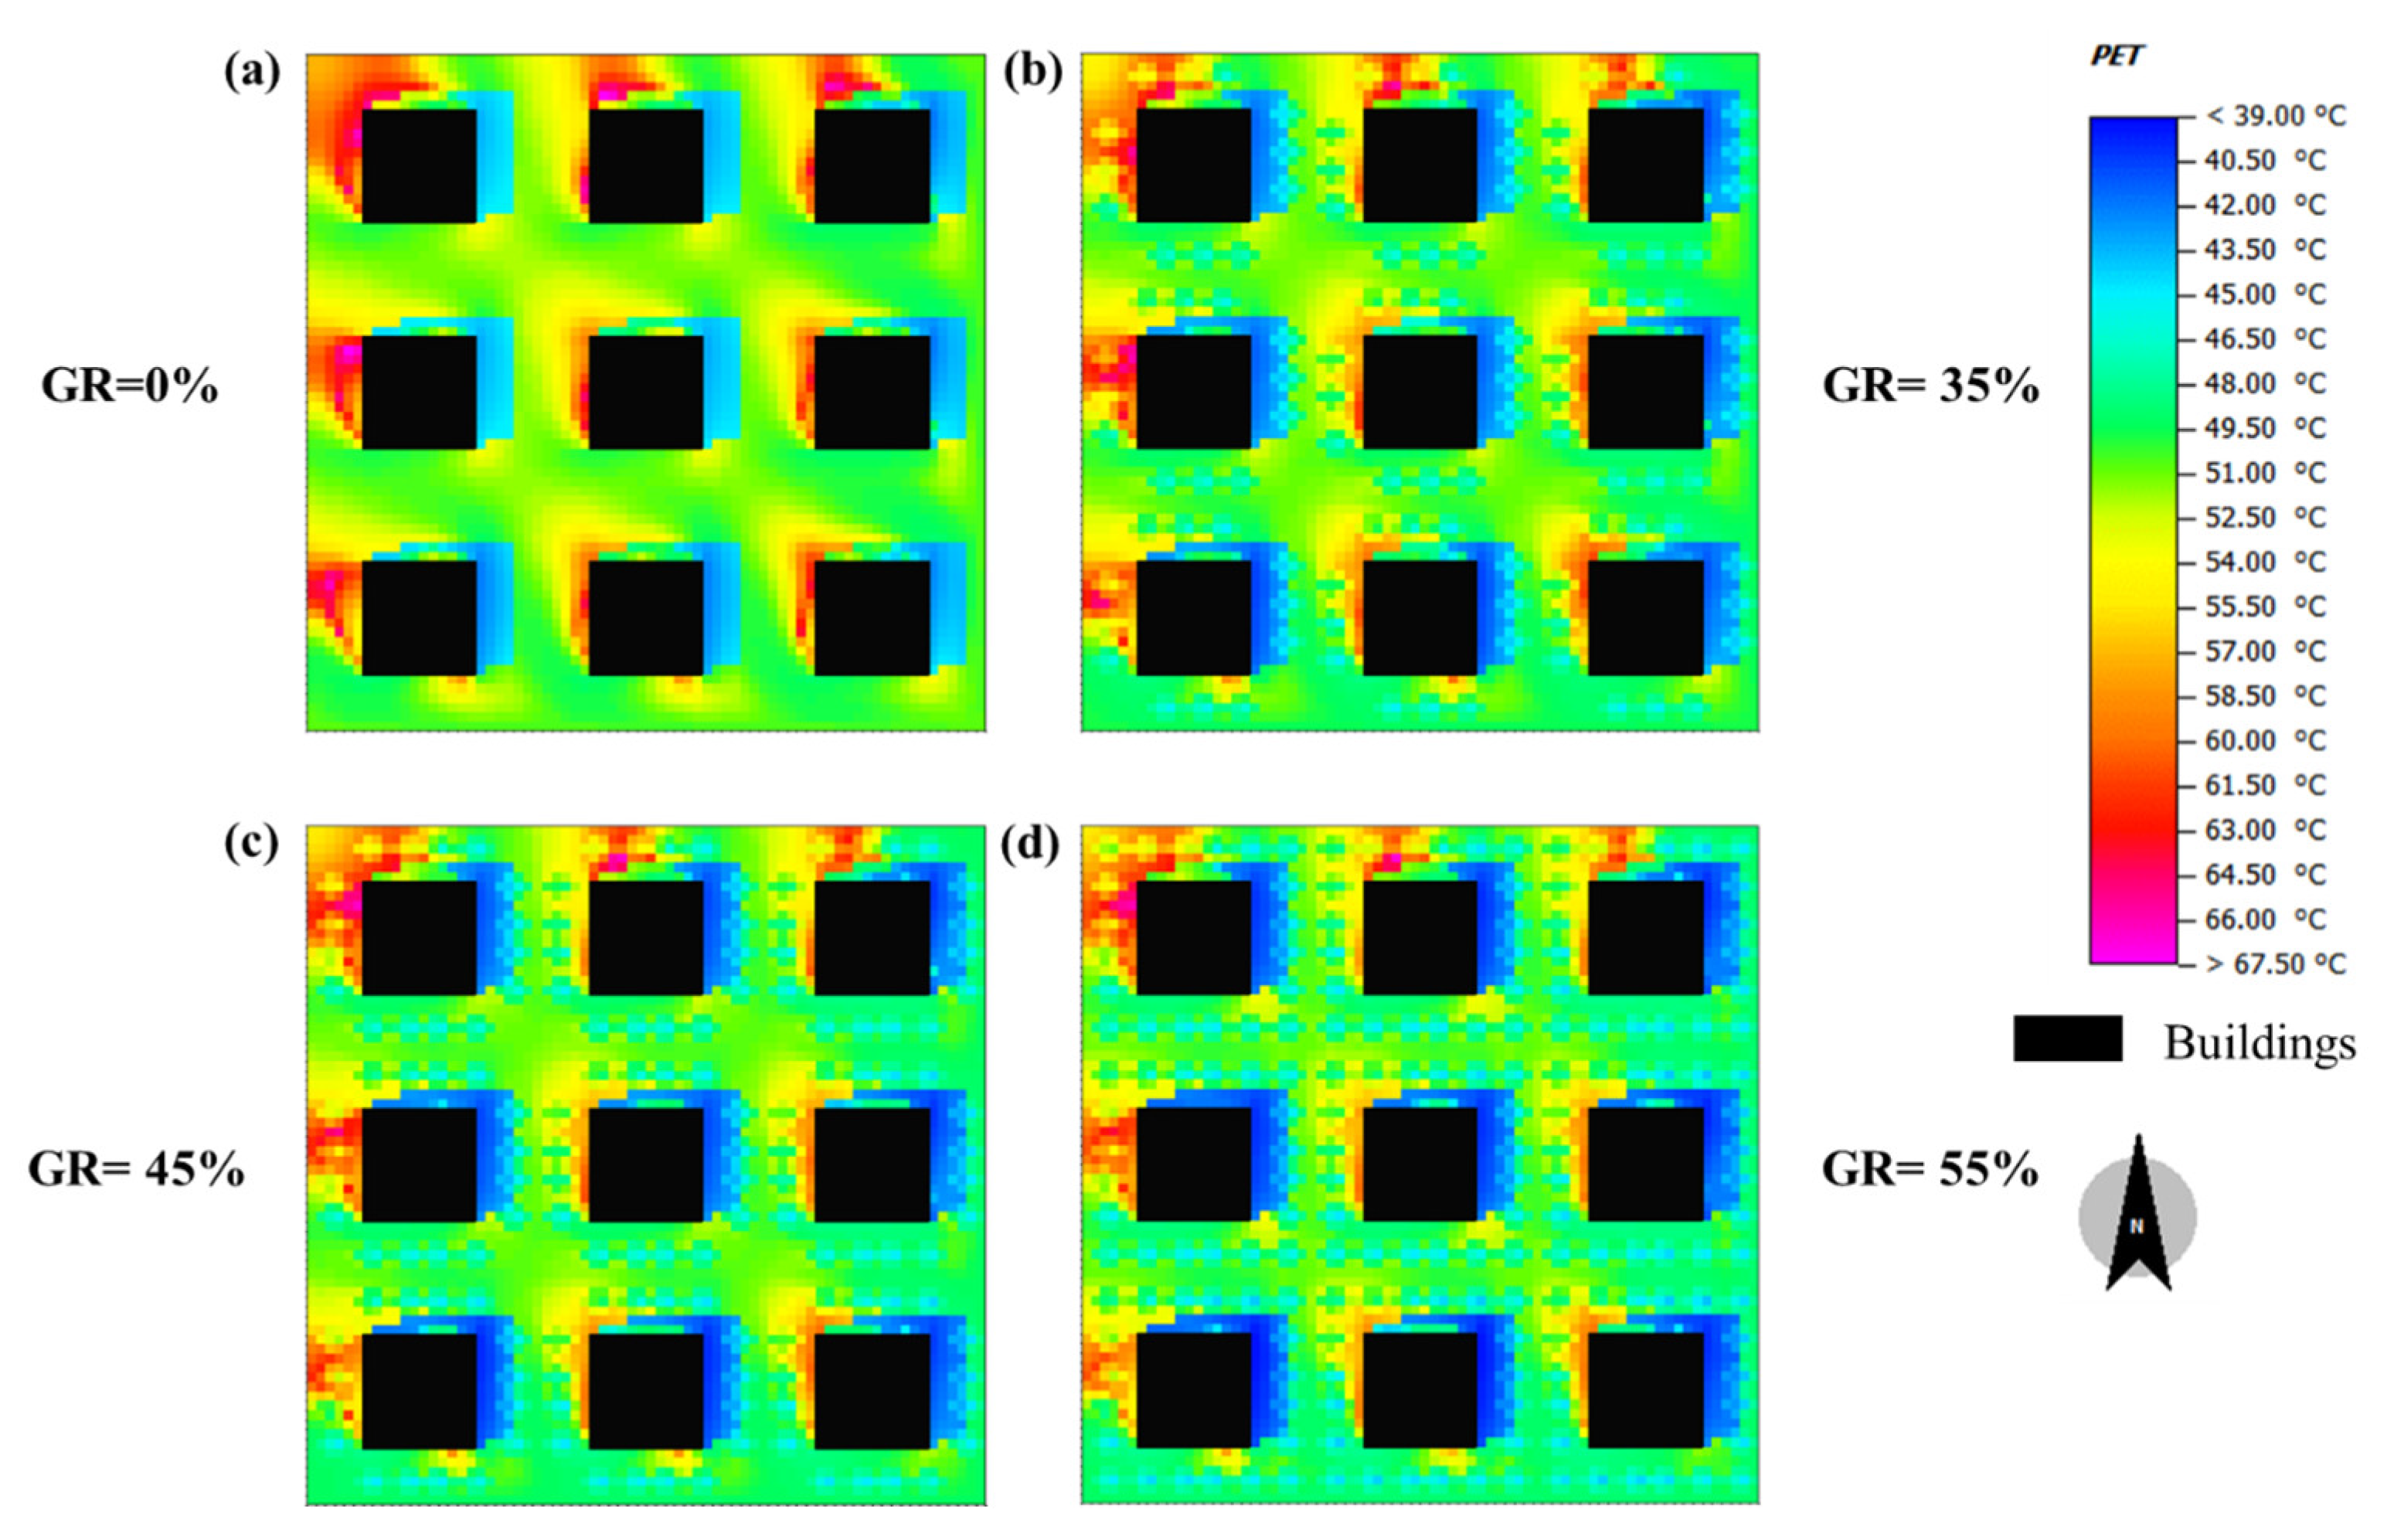
The influence of the green ratio on the local outdoor thermal comfort is shown in Figure 15, which shows the change in PET with the greening rate in the 3 × 3 scale residential area. It can be seen from the figure that PET in the residential area is mainly divided into three regions, among which the area with the highest temperature is the wake area on the lee side of the building. Due to the low wind speed (<0.2 m/s) and the absence of buildings or vegetation around this area, the direct sunlight is relatively strong, so this area has the highest PET. The area with the lowest temperature is the shadow of the building. The building in this area blocks almost all the solar radiation and only receives the short-wave radiation reflected by the surrounding walls. Therefore, the average radiation temperature in this area is low, and the PET is, thus, the lowest. In other areas, mainly composed of vegetation and pavement, the PET under the green shade is 2 °C lower than in the surrounding area but still higher than in the building-shaded area. The shade of the trees provides less thermal comfort than the shaded area of the building. With the increase in the green ratio, the shade provided by vegetation is also larger. For the building wake area with poor thermal comfort and the area not covered by the building shadow, the presence of vegetation will significantly improve the thermal comfort of the area. It can be seen from the no greening condition that the uniformity of thermal comfort in the residential area is poor, while in the condition with a 55% green ratio, vegetation not only improves the outdoor thermal comfort but also makes the overall thermal comfort of the residential area more uniform.

Figure 15.
The impact of green ratio on the outdoor PET (3 × 3).
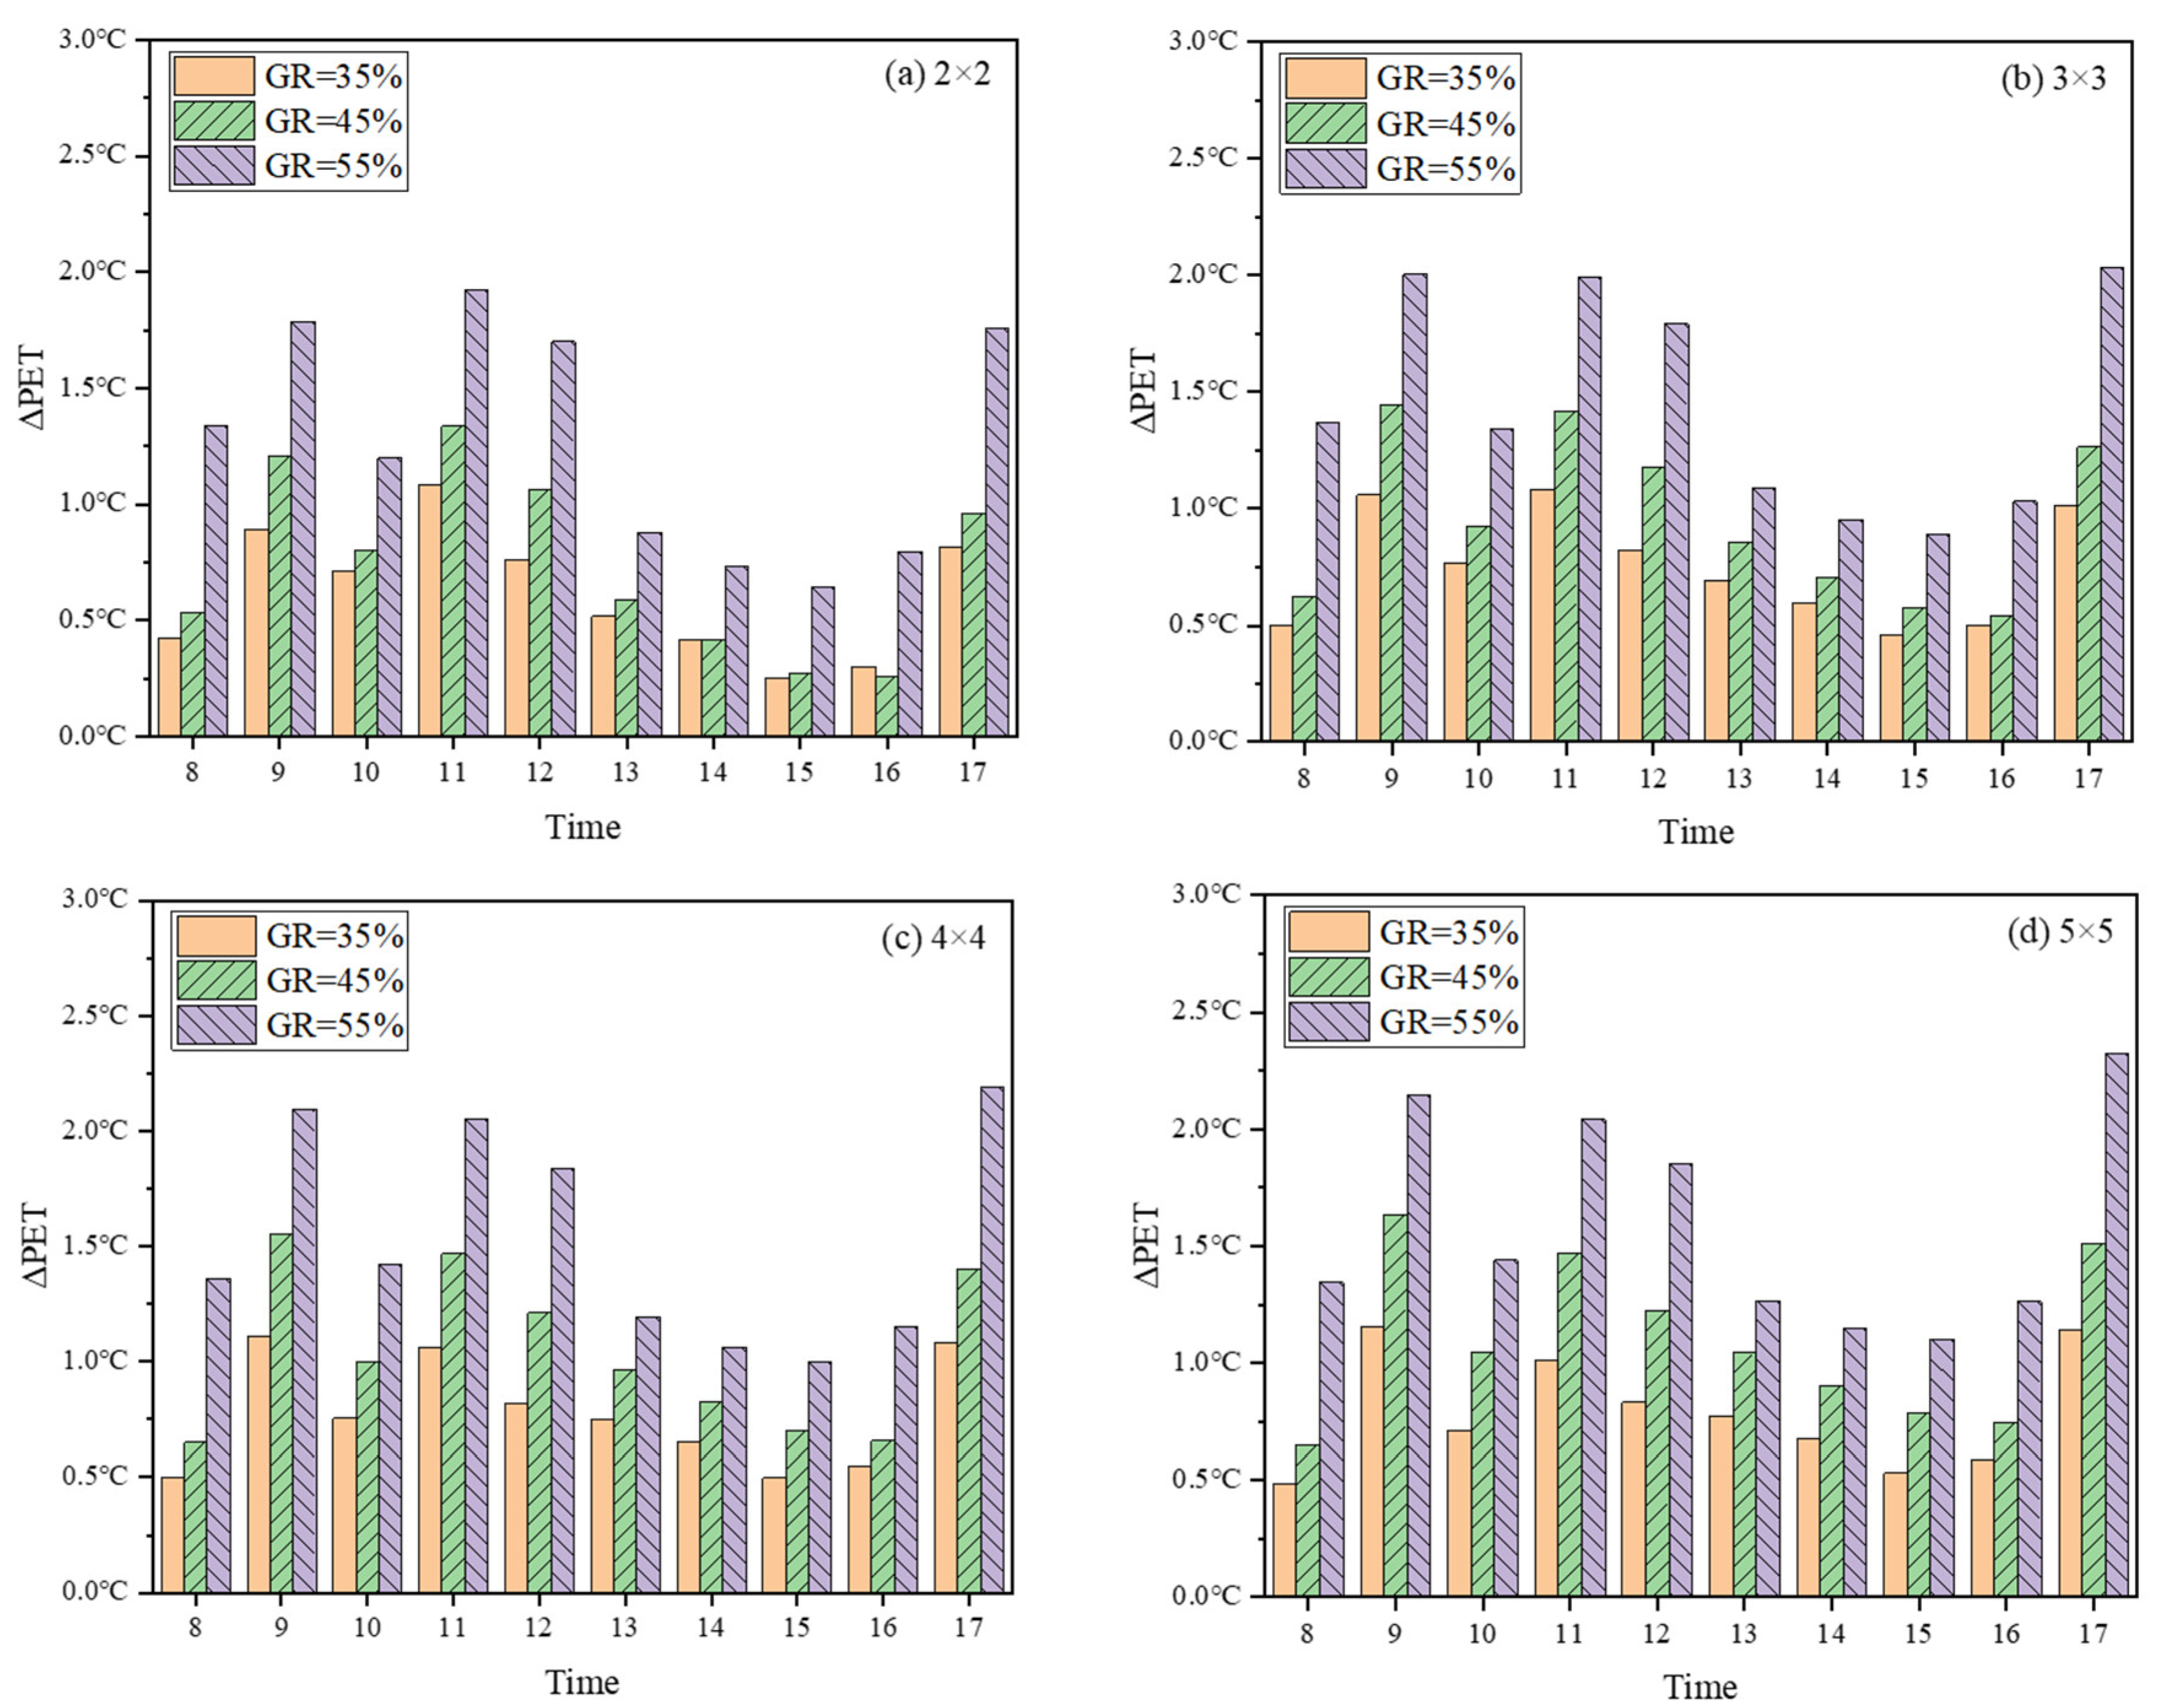
Greening has a good performance in improving the outdoor thermal comfort of residential areas, as shown in Figure 16, which shows the improvement effect of greening rate on outdoor thermal comfort of different residential scales, in which the improvement effect is represented by the difference between the average PET of residential areas under no greening condition and the greening condition, represented by ΔPET. As can be seen from this figure, vegetation has a great difference in the improvement in outdoor thermal comfort at different times. During the period from noon to sunset, the improvement effect of vegetation on outdoor thermal comfort is obviously weaker than at other times, and the PET only decreases by 0.5–1.2 °C during this time, while the PET decreases by 1–2 °C at other times. This may be due to the fact that afternoon is the hottest time period of the day, and the favorable effects of vegetation on thermal comfort mainly include the shading effect of tree shade and the transpiration effect of vegetation leaves. As the sun’s height angle is higher in the afternoon, the shaded area of vegetation is smaller, and the area that can be sheltered is further reduced. Meanwhile, vegetation protects itself at higher temperatures. Leaf pores will be closed to reduce water evaporation and avoid water loss. At this time, the transpiration of vegetation will be further weakened, and the effect of cooling and humidification will be weaker than at other times. Therefore, the improvement effect of vegetation on thermal comfort in the afternoon is obviously poor. In terms of the improvement effect of different greening rates on outdoor thermal comfort, the higher the greening rate, the better the improvement in outdoor thermal comfort, which is also in line with common sense. However, there is no simple linear relationship between ΔPET and the greening rate. It can be seen from the figure that 35% and 45% of greening conditions have similar improvement effects on outdoor thermal comfort. The improvement effect of 55% greening condition on outdoor thermal comfort has been significantly improved, which has been improved by about 70–120% compared with 35% greening condition and about 20–90% compared with 45% greening condition. The possible reasons are related to the local scale and group effect of green space, as mentioned above. From the perspective of the residential area scale, with the increase in residential area scale, the improvement effect of vegetation on outdoor thermal comfort also increases. Compared with a small residential area of 2 × 2, the improvement effect of vegetation on thermal comfort of a 5 × 5 residential area increases by 0.2–0.5 °C. The main reason may be the larger scale of the residential area, and the outdoor thermal comfort without green plants is worse. Secondly, the total area of green land also increases with the residential scale, and the incoming flow in the downwind area of the residential area passes the cooling and humidification treatment of the vegetation in front of the residential area. Under the coordinated role of the overall vegetation in the residential area, the improvement in the thermal comfort of the vegetation is also enhanced.
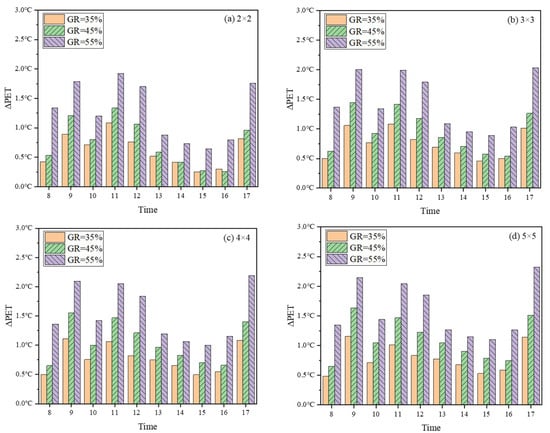
Figure 16.
The decrease in mean PET after greening in different-scale residential blocks.
4. Discussion
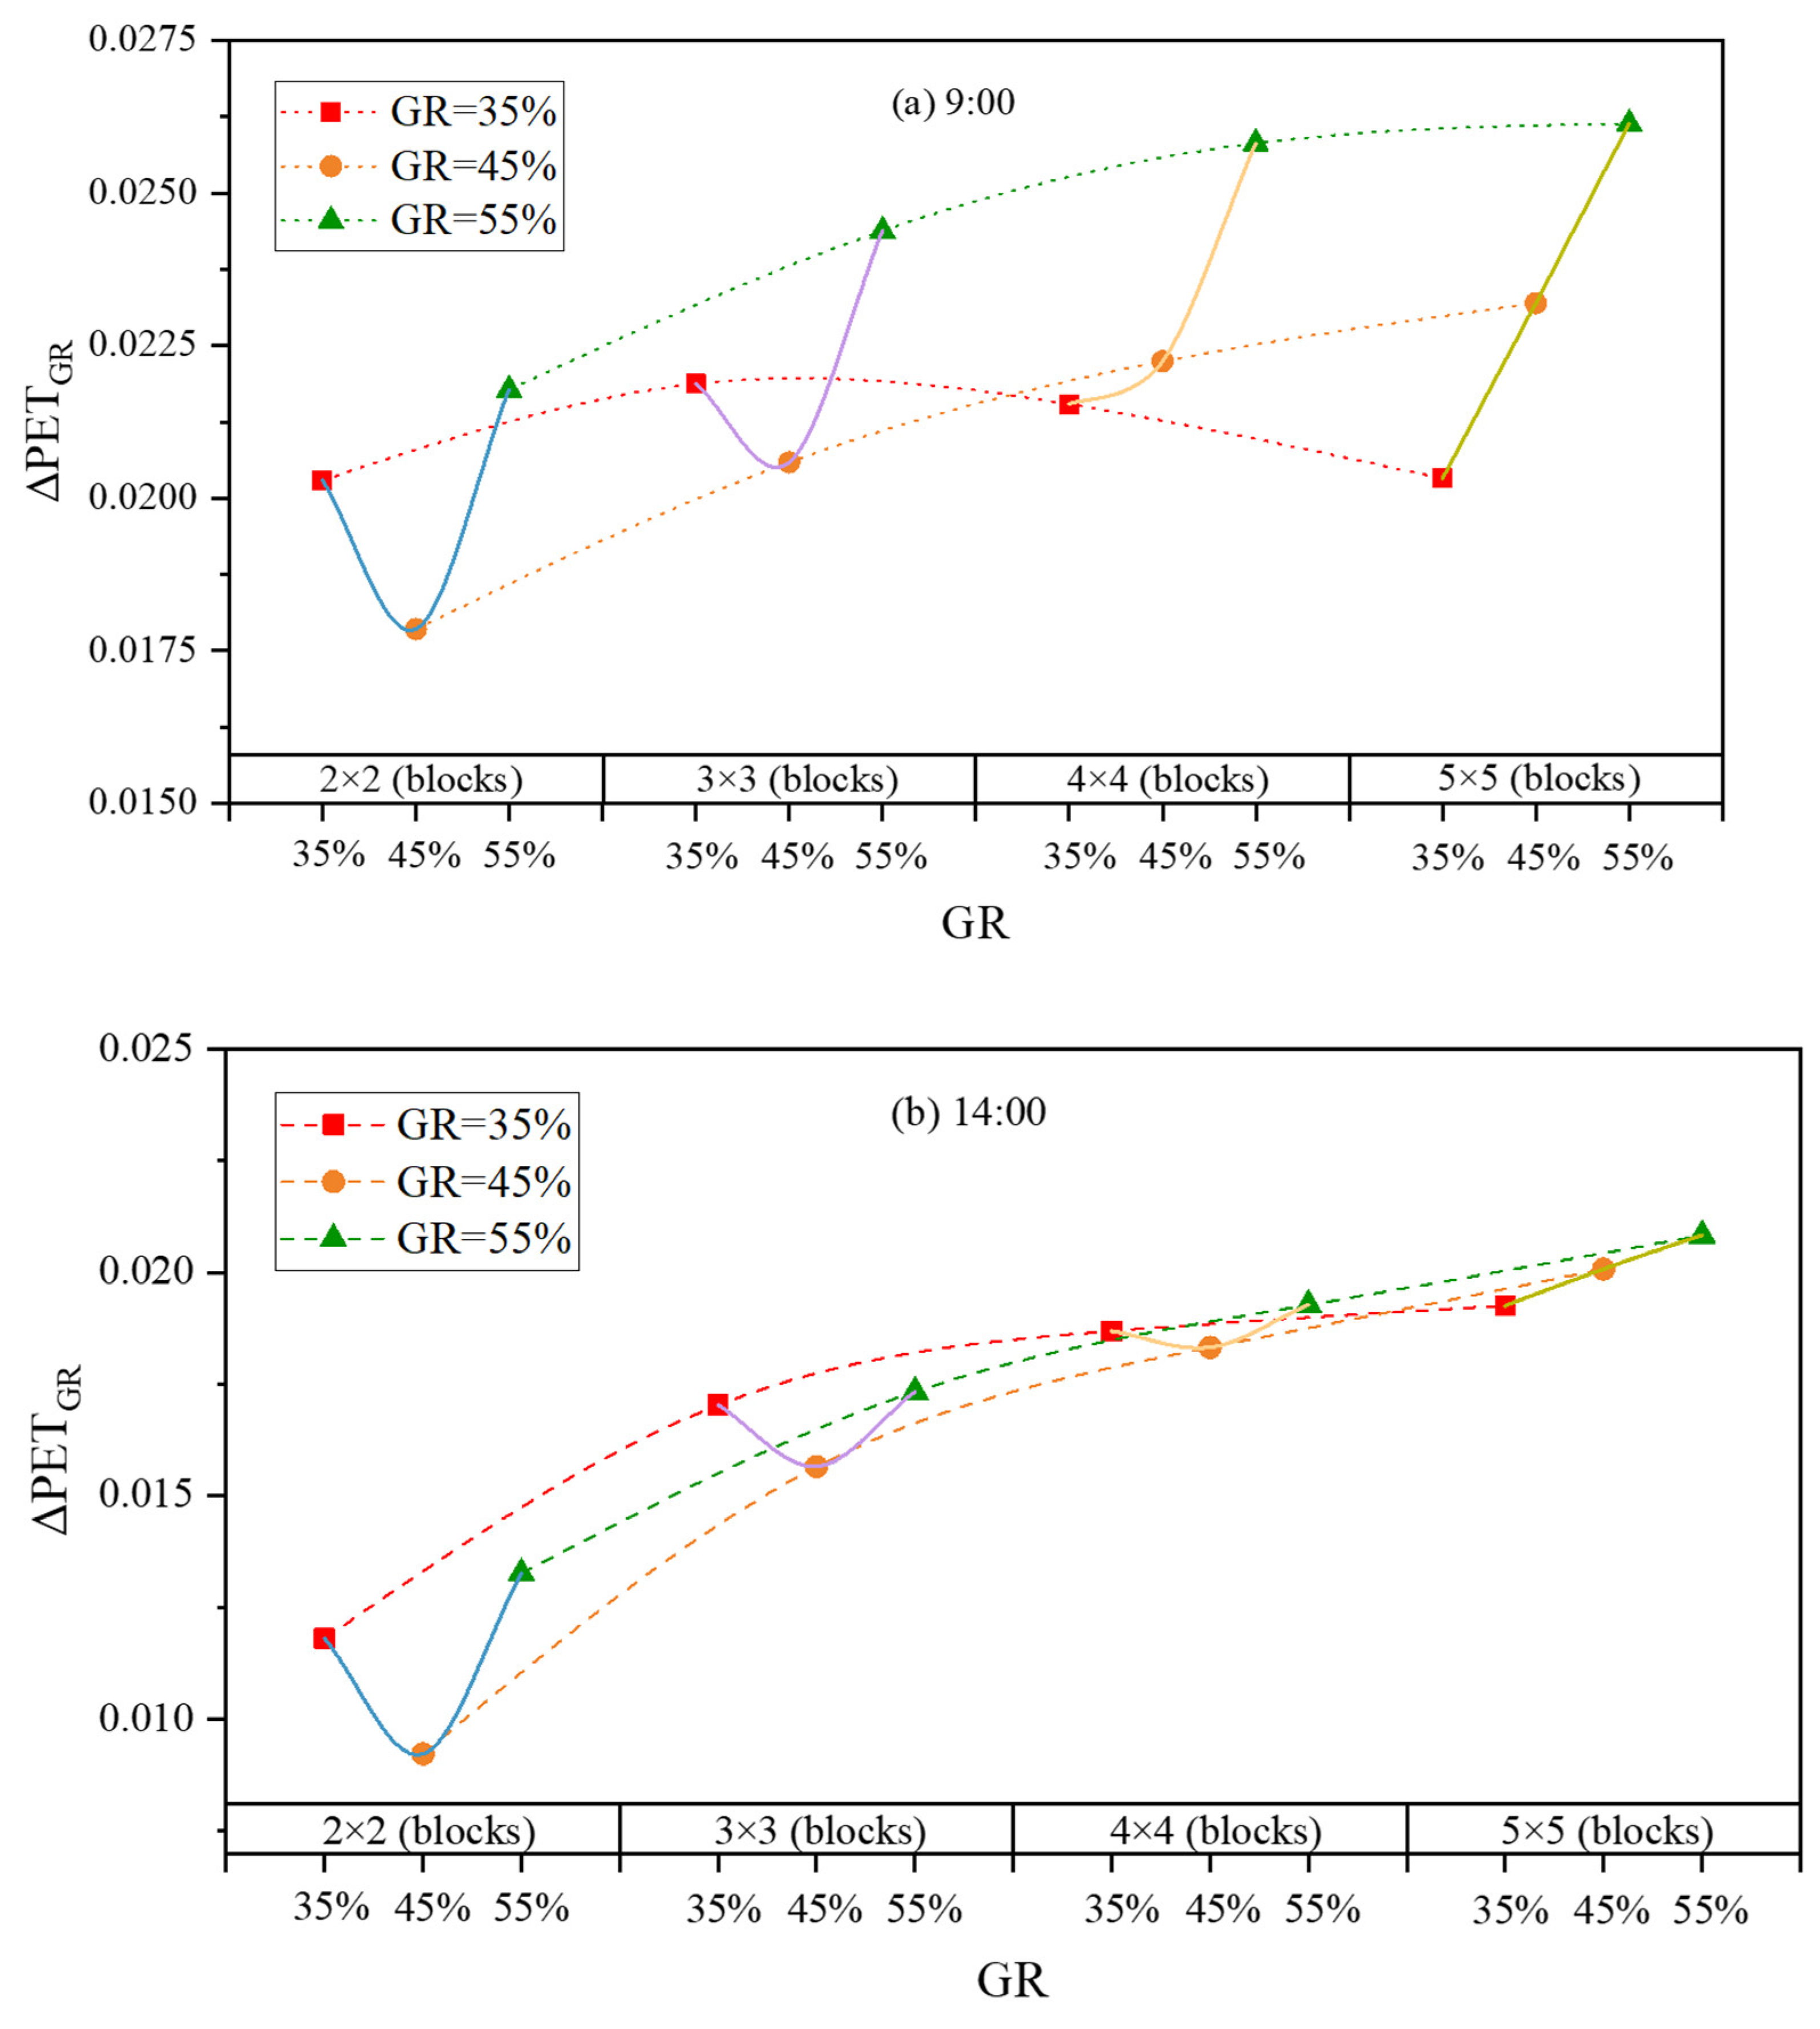
This part will analyze the improvement potential and cost performance of green ratio on thermal comfort of different scale residential areas. The optimal solution of green ratio under different scale residential areas is analyzed from the perspective of thermal comfort effect and greening cost. In this part, a new index, the PET drop per green ratio, will be proposed to quantify the cost performance of the residential area’s green ratio on improving outdoor thermal comfort. This index is calculated by the following Equation (1):
In this formula, ΔPETGR is used to represent the PET drop per green ratio. PETG represents the PET at the height of the human body in the pedestrian area of the residential under a certain greening condition, unit °C. PET0 represents the PET at the height of the human body in the pedestrian area of the residential under a non-greening condition, unit °C. GR indicates the Green ratio, expressed in %.
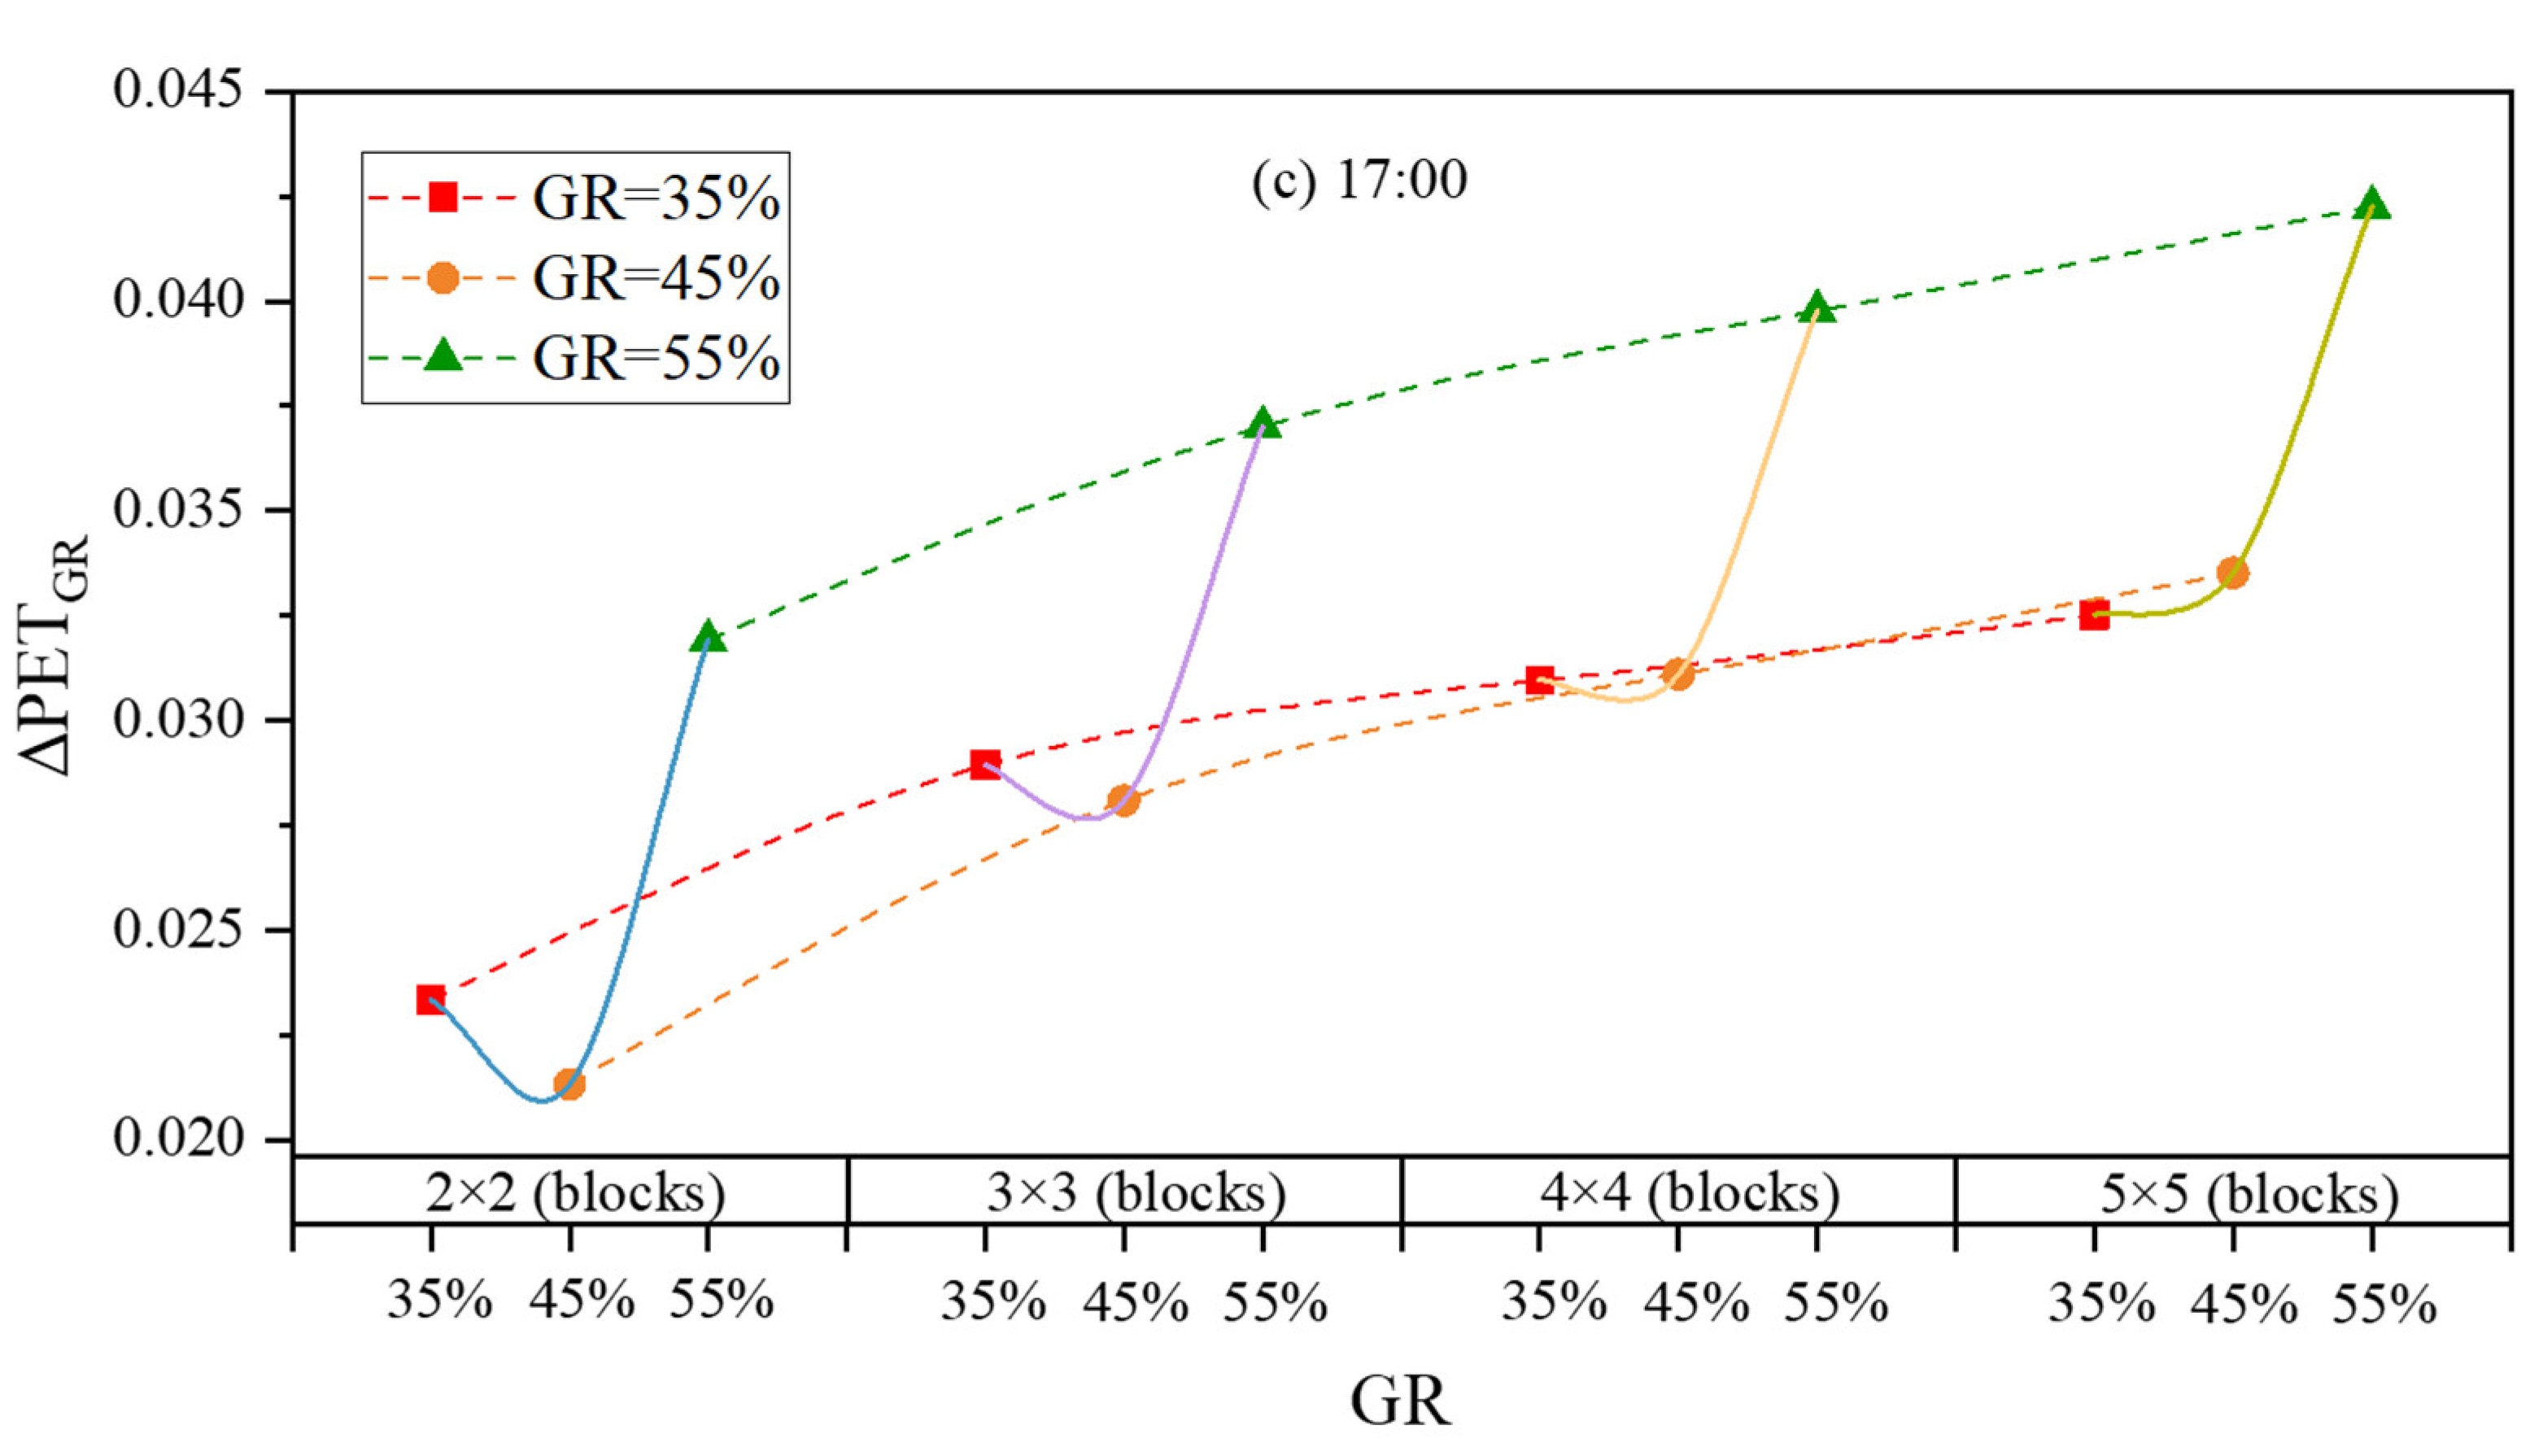
Figure 17 shows the PET drop per green rate corresponding to each green ratio in different residential areas. It can be seen from Figure 17a that at 9:00 a.m., under the condition of 35% green ratio, ΔPETGR shows a trend of first rising and then decreasing, while under the conditions of 45% and 55% green ratio, ΔPETGR show an upward trend, and the rising rate gradually slows down with the increase in the residential area scale. Comparing the conditions with different green ratios, it is found that when the green ratio is 55%, ΔPETGR is the highest, which means that a 55% green ratio can not only obtain a lower PET temperature but also a higher return on investment cost. As shown in Figure 17b, ΔPETGR of a 35% green ratio basically remains unchanged after the residential area reaches a certain scale (4 × 4), while the greening conditions of 45% and 55% still maintain a relatively high growth rate. In the relationship between ΔPETGR and green ratio, it is found that ΔPETGR under 45% green ratio is the lowest among all greening rates, except in 5 × 5 residential blocks, while ΔPETGR under 35% and 55% greening condition is similar. This also means that in the case of not pursuing the improvement effect of outdoor thermal comfort, the economy and return on investment effect of the selection of a green rate are given priority, and a low green rate of 35% is more advantageous. However, ΔPETGR difference of 35% and 55% in greening conditions gradually increases with the scale of residential areas, and the advantage of low greening rate in large-scale residential areas is gradually weakened. The time 17:00 is when outdoor activities are more frequent. It can be seen from Figure 17c that ΔPETGR of high green ratio is the highest, while 35% greening in small-scale settlements is better than 45% greening, and 45% greening in large-scale settlements is better than 35% greening.
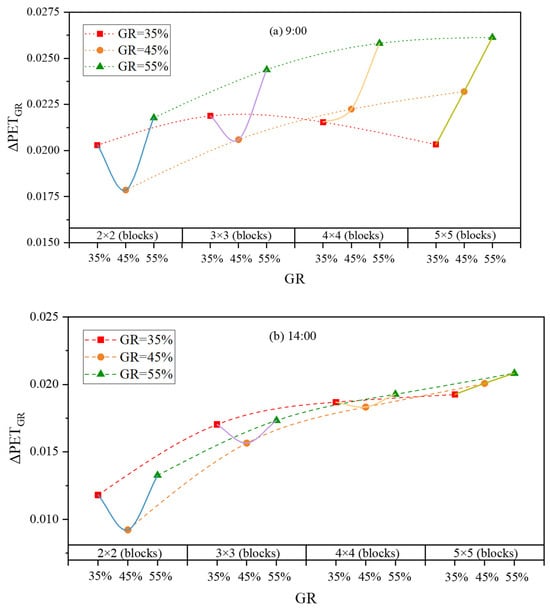
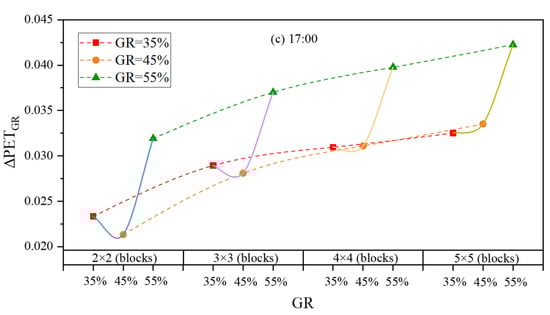
Figure 17.
ΔPETGR temperature drop in different-scale residential areas at different times.
5. Conclusions
In urban planning, the centralization of land functions is becoming more and more obvious, especially in the construction of new cities; the emergence of large-scale residential areas or housing clusters makes the renewal of urban components appear a new trend. With the improvement in life quality, most new residential buildings are designed to improve the residential environment, so outdoor thermal comfort has received extensive attention. The government has only set a minimum for community greening, and developers also position the community greening rate according to actual needs. Therefore, the law between the green ratio and the scale of residential areas is not clear in terms of improving the effect of outdoor thermal comfort. With numerical simulation as the research method and Shanghai as the research site, this paper uses ENVI-met software to simulate the effect of green ratio on outdoor thermal comfort of different scale residential areas in summer. From the perspective of comfort and cost performance, the optimization potential of outdoor thermal comfort of different-scale residential areas is analyzed, and the optimization of the green ratio is explored. The main conclusions are as follows:
The wind speed and temperature in residential areas are less affected by the residential scale, and there is no significant difference in the distribution of the overall wind field and temperature field in different-scale residential areas in time and space. Vegetation is an important component of the roughness and wind thermal environment regulation in residential areas. The wind speed in the residential area decreased by 0.2–0.4 m/s, and the temperature decreased by 1–3 °C, with the increase in the green ratio.
In the comparison of the effect of different greening rates on the overall thermal comfort of residential areas, it is found that the greater the greening rate, the lower the PET, but the relationship between PET and greening rate is not a negative correlation function. There is little difference in PET under the conditions of 35% and 45% greening rate. The improvement effect of 55% greening condition on thermal comfort is about 70–120% higher than that of 35% greening condition and about 20–90% higher than that of 45% greening condition.
Vegetation has a great difference in the improvement in outdoor thermal comfort at different times. Compared with other time periods, the improvement effect of vegetation on outdoor thermal comfort is obviously weaker from noon to sunset, and the PET only decreases by 0.5–1.2 °C during this time, while the PET decreases by 1–2 °C at other times.
With the increase in residential area scale, the improvement effect of vegetation on outdoor thermal comfort also increases, which in 5 × 5 residential area is 0.2–0.5 °C, which is higher than that in 2 × 2 small-scale residential area.
The following suggestions are made for residential design. When outdoor thermal comfort is given priority, the higher the greening rate, the better the improvement in thermal comfort. Considering the cost performance of the improvement in outdoor thermal comfort, the high green ratio is preferred when the time of morning and evening is emphasized. When the focus is on the afternoon, the low greening rate is more economical. Furthermore, the PET drop per green ratio of large-scale residential areas is greater, so large-scale residential areas can be selected as far as possible in the planning. If the cost is further pursued, the low greening rate is a better choice, but when the scale of residential areas further increases, the advantages of the low greening rate are no longer obvious and need to be carefully selected.
In this study, only the influence of residential area scale and green ratio on outdoor thermal comfort is considered. However, many factors, such as building layout, building height, and vegetation type, will have an impact on outdoor thermal comfort. Additionally, the simulation period is another factor; this study focuses on a 12-h daytime period of a typical summer day for analysis. Overall, the conclusions and suggestions in this paper have certain limitations and need to be further explored.
Author Contributions
Conceptualization, Z.L., R.L. and M.L.; funding acquisition, N.G.; investigation, D.M. and Z.L.; methodology, D.M., R.L. and X.S.; resources, N.G.; supervision, N.G.; writing—original draft, D.M.; writing—review and editing, D.M., Z.L., R.L., M.L., X.S. and N.G. All authors have read and agreed to the published version of the manuscript.
Funding
This work is supported by the National Natural Science Foundation of China under project number 52078353, the Research Scheme of Research Grant Council of Hong Kong SAR, China (No. T22-504/21R), International Cooperation project of Science and Technology Commission of Shanghai Municipality (No. 22200711400), and the Fundamental Research Funds for the Central Universities.
Data Availability Statement
The data presented in this study are available upon request from the corresponding author. The original data are not publicly available.
Conflicts of Interest
The authors declare that they have no known competing financial interests or personal relationships that could have appeared to influence the work reported in this paper.
References
- Oke, T.R. Boundary Layer Climates; Wiley: New York, NY, USA, 1978. [Google Scholar]
- Manoli, G.; Fatichi, S.; Schläpfer, M.; Yu, K.; Crowther, T.W.; Meili, N.; Burlando, P.; Katul, G.G.; Bou-Zeid, E. Magnitude of urban heat islands largely explained by climate and population. Nature 2019, 573, 55–60. [Google Scholar]
- Imhoff, M.L.; Zhang, P.; Wolfe, R.E.; Bounoua, L. Remote sensing of the urban heat island effect across biomes in the continental USA. Remote Sens. Environ. 2010, 114, 504–513. [Google Scholar]
- Liu, J.; Niu, J.; Xia, Q. Combining measured thermal parameters and simulated wind velocity to predict outdoor thermal comfort. Build. Environ. 2016, 105, 185–197. [Google Scholar]
- Andreou, E. Thermal comfort in outdoor spaces and urban canyon microclimate. Renew. Energy 2013, 55, 182–188. [Google Scholar]
- Lee, H.; Mayer, H.; Chen, L. Contribution of trees and grasslands to the mitigation of human heat stress in a residential district of Freiburg, Southwest Germany. Landsc. Urban Plan. 2016, 148, 37–50. [Google Scholar]
- Asfour Omar, S. Prediction of wind environment in different grouping patterns of housing blocks. Energy Build. 2010, 42, 2061–2069. [Google Scholar]
- Bourbia, F.; Boucheriba, F. Impact of street design on urban microclimate for semi arid climate (Constantine). Renew. Energy 2010, 35, 343–347. [Google Scholar]
- Kubota, T.; Miura, M.; Tominaga, Y.; Mochida, A. Wind tunnel tests on the relationship between building density and pedestrian-level wind velocity: Development of guidelines for realizing acceptable wind environment in residential neighborhoods. Build. Environ. 2008, 43, 1699–1708. [Google Scholar]
- Lin, B.; Li, X.; Zhu, Y.; Qin, Y. Numerical simulation studies of the different vegetation patterns’ effects on outdoor pedestrian thermal comfort. J. Wind Eng. Ind. Aerodyn. 2008, 96, 1707–1718. [Google Scholar]
- Li, R.; Zeng, F.; Zhao, Y.; Wu, Y.; Niu, J.; Wang, L.L.; Gao, N.; Shi, X. CFD simulations of the tree effect on the outdoor microclimate by coupling the canopy energy balance model. Build. Environ. 2023, 230, 109995. [Google Scholar] [CrossRef]
- Wang, Y.; Bakker, F.; de Groot, R.; Wortche, H.; Leemans, R. Effects of urban trees on local outdoor microclimate: Synthesizing field measurements by numerical modelling. Urban Ecosyst. 2015, 18, 1305–1331. [Google Scholar] [CrossRef]
- Bowler, D.E.; Buyung-Ali, L.; Knight, T.M.; Pullin, A.S. Urban greening to cool towns and cities: A systematic review of the empirical evidence. Landsc. Urban Plan. 2010, 97, 147–155. [Google Scholar]
- Arnfield, A.J. Two decades of urban climate research: A review of turbulence, exchanges of energy and water, and the urban heat island. Int. J. Climatol. 2003, 23, 1–26. [Google Scholar]
- Chen, Y.; Deng, S.; Hou, Y.; Yan, Q. Impact of environmental elements in classical Chinese gardens on microclimate and their optimization using ENVI-MET simulations. Energy Build. 2025, 329, 115238. [Google Scholar]
- Hoppe, P. The physiological equivalent temperature—A universal index for the biometeorological assessment of the thermal environment. Int. J. Biometeorol. 1999, 43, 71–75. [Google Scholar] [PubMed]
- Walther, E.; Goestchel, Q. The P.E.T. comfort index: Questioning the model. Build. Environ. 2018, 137, 1–10. [Google Scholar]
- Jayasooriya, V.M.; Sirimanne, A.P.; Silva, R.M.; Muthukumaran, S. Role of Urban Trees in Enhancing the Thermal Comfort of Rapidly Urbanizing Cities: An Analysis of Tropical Asian Tree Species Based on Physiological Equivalent Temperature (PET). Arboric. Urban For. 2024, 50, 326–345. [Google Scholar]
- Nie, T.; Lai, D.; Liu, K.; Lian, Z.; Yuan, Y.; Sun, L. Discussion on inapplicability of Universal Thermal Climate Index (UTCI) for outdoor thermal comfort in cold region. Urban Clim. 2022, 46, 101304. [Google Scholar]
- Mahdavinejad, M.; Shaeri, J.; Nezami, A.; Goharian, A. Comparing universal thermal climate index (UTCI) with selected thermal indices to evaluate outdoor thermal comfort in traditional courtyards with BWh climate. Urban Clim. 2024, 54, 101839. [Google Scholar]
- Rui, L.; Buccolieri, R.; Gao, Z.; Gatto, E.; Ding, W. Study of the effect of green quantity and structure on thermal comfort and air quality in an urban-like residential district by ENVI-met modelling. Build. Simul. 2018, 12, 183–194. [Google Scholar]
- Feng, L.; Shuai, L.; Zhou, Y.; Zhang, X.; Sun, J. Improving the green space arrangement in residential areas from the perspective of tree leaf temperature utilizing scenario simulation in ENVI-met. Sci. Total Environ. 2024, 918, 170650. [Google Scholar] [PubMed]
- Liu, Z.; Cheng, W.; Jim, C.Y.; Morakinyo, T.E.; Shi, Y.; Ng, E. Heat mitigation benefits of urban green and blue infrastructures: A systematic review of modeling techniques, validation and scenario simulation in ENVI-met V4. Build. Environ. 2021, 200, 107939. [Google Scholar]
- Bruse, M.; Fleer, H. Simulating surface–plant–air interactions inside urban environments with a three dimensional numerical model. Environ. Model. Softw. 1998, 13, 373–384. [Google Scholar]
- Salata, F.; Golasi, I.; Vollaro, R.D.L.; de Lieto Vollaro, A. Urban microclimate and outdoor thermal comfort. A proper procedure to fit ENVI-met simulation outputs to experimental data. Sustain. Cities Soc. 2016, 26, 318–343. [Google Scholar]
- Alsaad, H.; Hartmann, M.; Hilbel, R.; Voelker, C. ENVI-met validation data accompanied with simulation data of the impact of facade greening on the urban microclimate. Data Brief 2022, 42, 108200. [Google Scholar]
- Yang, F.; Lau, S.S.Y.; Qian, F. Thermal comfort effects of urban design strategies in high-rise urban environments in a sub-tropical climate. Archit. Sci. Rev. 2011, 54, 285–304. [Google Scholar]
- Shanghai Municipal People’s Government. Technical Guidelines for Regulatory Detailed Planning in Shanghai; Shanghai Municipal People’s Government: Shanghai, China, 2015.
- Shanghai Municipal People’s Government. Technical Regulations on Urban Planning Management of Shanghai Municipality; Shanghai Municipal People’s Government: Shanghai, China, 2010.
- Shanghai Municipal People’s Government. Regulations of Shanghai Municipality on Greening Work; Shanghai Municipal People’s Government: Shanghai, China, 2007.


Disclaimer/Publisher’s Note: The statements, opinions and data contained in all publications are solely those of the individual author(s) and contributor(s) and not of MDPI and/or the editor(s). MDPI and/or the editor(s) disclaim responsibility for any injury to people or property resulting from any ideas, methods, instructions or products referred to in the content. |
© 2025 by the authors. Licensee MDPI, Basel, Switzerland. This article is an open access article distributed under the terms and conditions of the Creative Commons Attribution (CC BY) license (https://creativecommons.org/licenses/by/4.0/).