Article

A Study on the Effect of Nighttime Light Intrusion on the Phase Shift of Human Rhythms

1
School of Infrastructure Engineering, Dalian University of Technology, Dalian 116024, China
2
School of Architecture & Fine Art, Dalian University of Technology, Dalian 116024, China
*
Author to whom correspondence should be addressed.
Buildings 2025, 15(6), 946; https://doi.org/10.3390/buildings15060946
Submission received: 7 January 2025 / Revised: 1 March 2025 / Accepted: 6 March 2025 / Published: 17 March 2025
(This article belongs to the Section Building Energy, Physics, Environment, and Systems)

Abstract

In China’s mixed-use commercial and residential areas, artificial lighting in commercial and service sectors is prevalent, leading to heightened nocturnal light exposure and exacerbating light intrusion issues that disrupt nighttime activities and rest. To evaluate its impact on residents’ health, this study conducted two experiments. The results showed prolonged nighttime light exposure inhibits melatonin secretion, causing circadian rhythm phase shifts and delays. Among factors affecting color brightness strobe, color had a more significant impact on human rhythm phase shifts. Thus, managing dynamic light intrusion should prioritize regulating colored light. Additionally, as even minimal illuminance from intrusive light disrupts human rhythms, lowering existing illuminance limits for light intrusion is advisable.

1. Introduction

Circadian rhythm refers to the cyclical variation in biological activities occurring approximately every 24 h, commonly referred to as a rhythm. A relatively stable diurnal alternation is essential for maintaining the continuity and stability of the human body’s circadian rhythm. Research indicates that light serves as a significant external timing cue for the human circadian system [1]. However, the advent of artificial lighting has disrupted these natural rhythms. The prevalence of artificial light during the nighttime has led to a divergence from natural circadian patterns, resulting in substantial light intrusion issues that disrupt circadian rhythms and adversely affect sleep quality. Studies have demonstrated that such disruptions in circadian rhythms may contribute to the onset of various diseases, including cancer, and are closely linked to mental health disorders [2]. Consequently, investigating the impact of light intrusion on circadian rhythm phases and optimizing environments conducive to healthy sleep is a critical area of inquiry for promoting human health, with considerable practical implications.
Numerous studies have investigated the impact of light on sleep both in China and internationally. Prior research indicates that artificial light exposure during the nighttime is influenced by several factors, including light intensity, spectral composition, color temperature, and the history of light exposure (such as duration and timing). Each of these factors may significantly affect circadian rhythms and, consequently, sleep health. In terms of light intensity, McIntyre I.M. et al. [3] conducted experiments examining five different light intensities (3000 lx, 1000 lx, 500 lx, 350 lx, and 200 lx) and discovered that the maximum inhibition of melatonin secretion was 71% at 3000 lx, 67% at 1000 lx, 44% at 500 lx, 38% at 350 lx, and 16% at 200 lx. This study demonstrated a direct correlation between light intensity and the degree of melatonin inhibition. Similarly, Mari Yokoi et al. [4] from Japan performed a controlled experiment comparing melatonin suppression at 2800 lx and 120 lx, revealing that exposure to high-intensity light during the night significantly suppressed melatonin secretion and mitigated the natural decline in body temperature. Rüger Melanie et al. [5] examined melatonin suppression at light levels of less than 10 lx, 100 lx, and 5000 lx, finding that substantial reductions in melatonin suppression and subjective feelings of drowsiness occurred at intensities up to 5000 lx. These findings suggest that higher light intensities are associated with greater melatonin suppression compared to lower intensities. Additionally, it has been observed that individuals are less prone to drowsiness in brightly lit environments. Mariana G. Figueiro et al. [6] provided high rhythmic stimulus lighting in an office setting, resulting in participants reporting decreased drowsiness, increased energy, and heightened alertness. A domestic study by Yan Yonghong et al. [7] also indicated a significant reduction in fatigue among students exposed to high illumination levels ranging from 750 to 1000 lx. Correspondingly, brainwave index tests conducted in this study revealed a positive correlation between increased illumination and personnel arousal. Regarding spectral energy distribution, the existing literature suggests that the human circadian system exhibits heightened sensitivity to short-wave light while being less responsive to long-wave light [8,9]. Some studies have further indicated that short-wave light can immediately mitigate the adverse effects of sleep deprivation and circadian rhythm disruptions on alertness [10]. Brainard et al. [11] identified that short-wave light within the wavelength range of 446 to 477 nm is particularly effective in regulating melatonin secretion. Wang et al. [12] conducted experiments using various LED wavelengths, including blue (470 nm), blue-green (497 nm), green (525 nm), amber (595 nm), and red (660 nm) and found that blue-green (497 nm) LEDs resulted in the most significant inhibition of melatonin, with an average delay of 42 min. The influence of blue light on biological rhythms was further corroborated by Liu Na et al. [13] in a controlled experiment utilizing 470 nm blue light irradiation.
The Japanese Society for Physiological Anthropology initiated a series of investigations in the 1990s focusing on the correlation between the color temperature of fluorescent lighting and various human physiological indicators, including heart rate, brain wave activity, and basal body temperature [14,15,16]. In a study conducted by Taotao Ru et al. [17], the impact of the correlated color temperature (CCT) of ambient lighting on subjective daytime alertness and task performance was examined. The findings indicated that there were no significant differences in subjective alertness and task performance between the low CCT group and the high CCT group; however, a reduction in negative effects was observed. Conversely, Young’s research comparing high and low color temperature conditions among submarine crews demonstrated that the crews exhibited enhanced performance and improved sleep quality when exposed to high-color temperature light sources [18]. Additionally, Tomoaki’s evaluation of sleep architecture under varying color temperature light sources revealed a significant reduction in stage 4 sleep at elevated color temperatures of 6700 K compared to lower temperatures of 3000 K during the initial sleep phase [19]. Domestic studies have similarly indicated that students demonstrate greater learning efficiency under fluorescent lighting conditions characterized by medium and high color temperatures in comparison to low color temperatures [20] and that exposure to higher color temperature light is associated with decreased subjective drowsiness and increased alertness [21].
In general, most of the current domestic and international studies focus on the impact level of daytime light exposure, and there are fewer studies on the impact of nighttime light on sleep. Studies on the effects of nighttime light exposure also tend to use bright light and study the effects caused by exposure to indoor light environments. However, the intrusion of outdoor light sources into indoor light sources at night can also affect residents and cause uncomfortable distraction [22,23]. ISSN distinguishes between the following two types of light intrusion definitions: one type is non-essential lighting from adjacent geographic areas, and the other type is lighting with excessive illumination in the field of view. Domestically, in the Specification for Limits of Light Intrusion from Outdoor Lighting (GB/T 35626-2017) [24], the maximum value of light intrusion caused by spillover light in residential areas is stipulated, and the Evaluation Criteria for Healthy Communities (T/CECS 650-2020) [25] makes provisions for the color of the light from functional outdoor lighting sources in the community, the vertical illuminance produced by the external surface of windows in residential buildings, and the average luminance of community advertisements and signage illumination. For the problem of light intrusion, H. Na, J.-T. Kim et al. of Kyung Hee University, Korea, studied and analyzed the intrinsic causes of light intrusion caused by street lighting in residential areas, which are mainly the type of luminaire, the height of the luminaire pole, and the width of the street, and proposed appropriate measures to improve the situation [26]. Zhao Yuchan of National Cheng Kung University selected road and park streetlights as the intrusive light sources for the study, and through the measurement of illuminance in the windows of the residences immediately adjacent to the streetlight side, it was concluded that the intrusive light sources of the streetlights mainly caused serious intrusive light to the households on the first and second floors [27]. Huang Guangyou explores mainly selected advertising signs as an intrusive light source for research, on-site testing of advertising sign area, intrusive time, installation height, and other information, while measuring the illuminance inside the building, compared with the norms of the certainty of the existence of an intrusive light situation and its harmfulness, and finally based on the intrusive light point of view of the control of advertising signage recommendations [28]. In addition, Yu Juan et al. [29] conducted a questionnaire survey on 33 cities or regions in 20 provinces and municipalities; the results of the survey showed that 69.5% of the residents believed that “sleep and rest” were the most deeply affected. Li Na et al. [30] selected 17 residents of residential buildings in Beijing and Tianjin who were disturbed by the light from LED advertising screens and conducted a questionnaire survey; the questionnaire data showed that most of the residents thought that they were affected by the light intrusion from LED advertising screens, and those who thought that LED advertising screens that were “strong” and “serious” interfered with their lives accounted for 51% of the residents. Therefore, we cannot ignore the role of intrusive outdoor light on the rhythm. The research on light intrusion in residential areas is mainly focused on field measurements and subjective surveys at this stage, and the impact of light intrusion mostly stays in qualitative research, lacking quantitative research. Based on this, this study focuses on the extent of the effect of outdoor light intrusion on the phase shift of human circadian rhythms. The purpose of this study is to quantify the effect of light intrusion on human circadian rhythm phase shift, to optimize the sleep environment, and to provide data support for light intrusion prevention and control.
In the preliminary stage of this study, the on-site research and statistics of the LED advertising screen set up around the residential area in Dalian, such as spatial location, area size, opening and closing time, photometric parameters, and other basic data, to grasp the current situation of its setup and the range of values of the various intrusion factors, and to obtain the light parameters of the opening position of the residential building’s windows where the light intrusion problem exists, including the window’s vertical illuminance, horizontal illuminance, the window’s brightness of the visible source and the intrusion parameters such as the area, and other parameters. The questionnaires were distributed to the households to fully understand the subjective feelings of the residents in Dalian who are affected by the light intrusion of LED advertising screens, and to summarize the degree of influence of the light intrusion of LED advertising screens around the residential area, the factors of light intrusion, and the main types of light intrusion affecting the activities of the residents, etc. Then, combining with the existing conditions in the laboratory, we reproduce the boundary conditions of different outdoor light environments in the laboratory and evaluate the influence of different light environment conditions on the phase shift of human circadian rhythms through sleep monitoring equipment and sleep diaries.

2. Preliminary Research

This study used subjective questionnaires and objective field measurements to conduct a pre-survey of ordinary billboards, LED dynamic advertising screens, and the residents who live with them. The field measurements started on 8 June 2021 and ended on 18 June 2021. The weather was sunny and cloudless from 20:00 to 23:00, with artificial lighting active at night. The questionnaire survey was conducted for two groups: students in the light-intrusive dormitory area of Dalian University of Technology and residents in light-intrusive residential areas of Dalian City.

2.1. Research Subjects

2.1.1. Selection of Field Measurement Objects

The focus of this research is on the illumination of advertising signs along the commercial street of the Beishan dormitory at Dalian University of Technology, as well as the LED advertising screens located in the mixed-use commercial and residential areas of the Dalian neighborhood (refer to Figure 1). The selection of these objects was based on the quantitative analysis of nighttime light imagery utilizing ArcGIS Desktop 10.8. The extracted luminance values were overlaid on a satellite image, allowing for the identification and filtration of areas exhibiting high brightness levels. Ultimately, eight LED advertising screens, along with their adjacent residential zones, were chosen for analysis (see Table 1). These selected advertising screens exhibit varying degrees of light intrusion issues, serving as a representative sample for this study.

2.1.2. Subjective Questionnaire Respondents

The questionnaire survey was conducted in two distinct phases. The initial phase aimed to evaluate the sources of nighttime illumination and the current sleep patterns of individuals. This phase employed a random distribution method for the questionnaires, with a mixed-use commercial and residential area in Dalian selected for on-site distribution. A total of 100 questionnaires were disseminated, resulting in the retrieval of 74 valid responses. The sample comprised 35 males and 39 females, with demographic data indicating that 20% of participants were over the age of 50, 33% were between the ages of 35 and 50, and 47% were under 35 years old.
The second phase of the survey aims to understand the subjective perception of the affected population towards the source of the problem. Therefore, in this phase, the questionnaire was sent to people who have been living in the study area for more than one year to ensure that there is a relatively balanced mix of people of all ages and genders. The questionnaires were distributed among households to understand the experiences of Dalian residents who have been disturbed by LED advertising displays.

2.2. Research Methodology

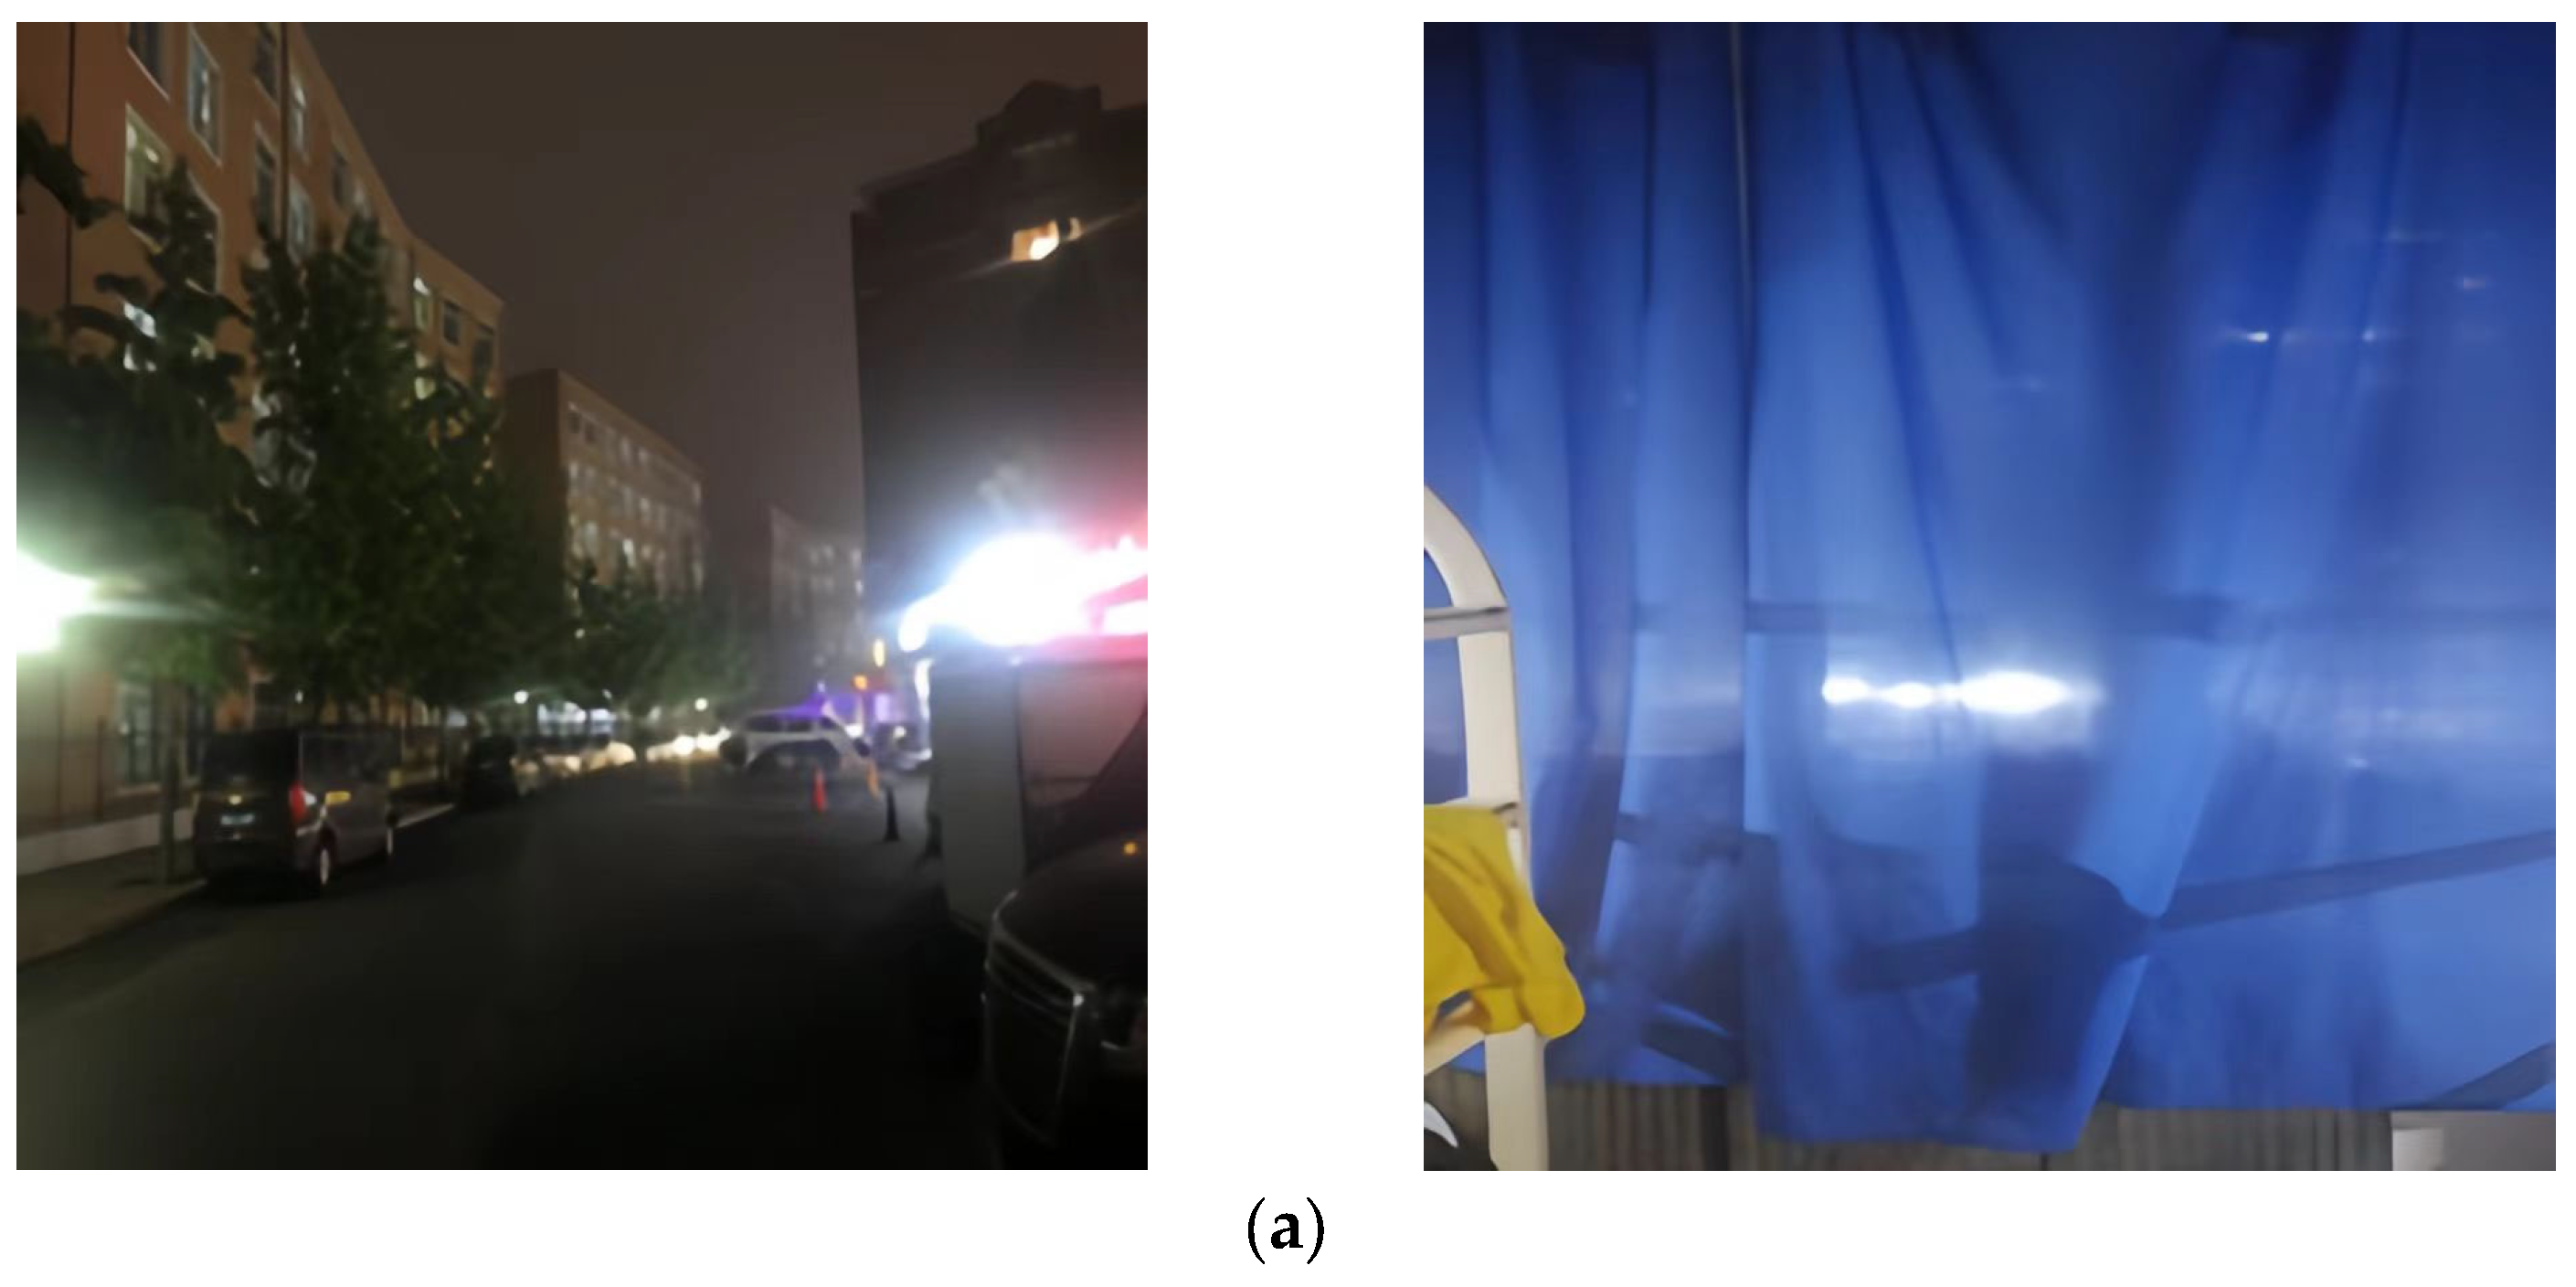
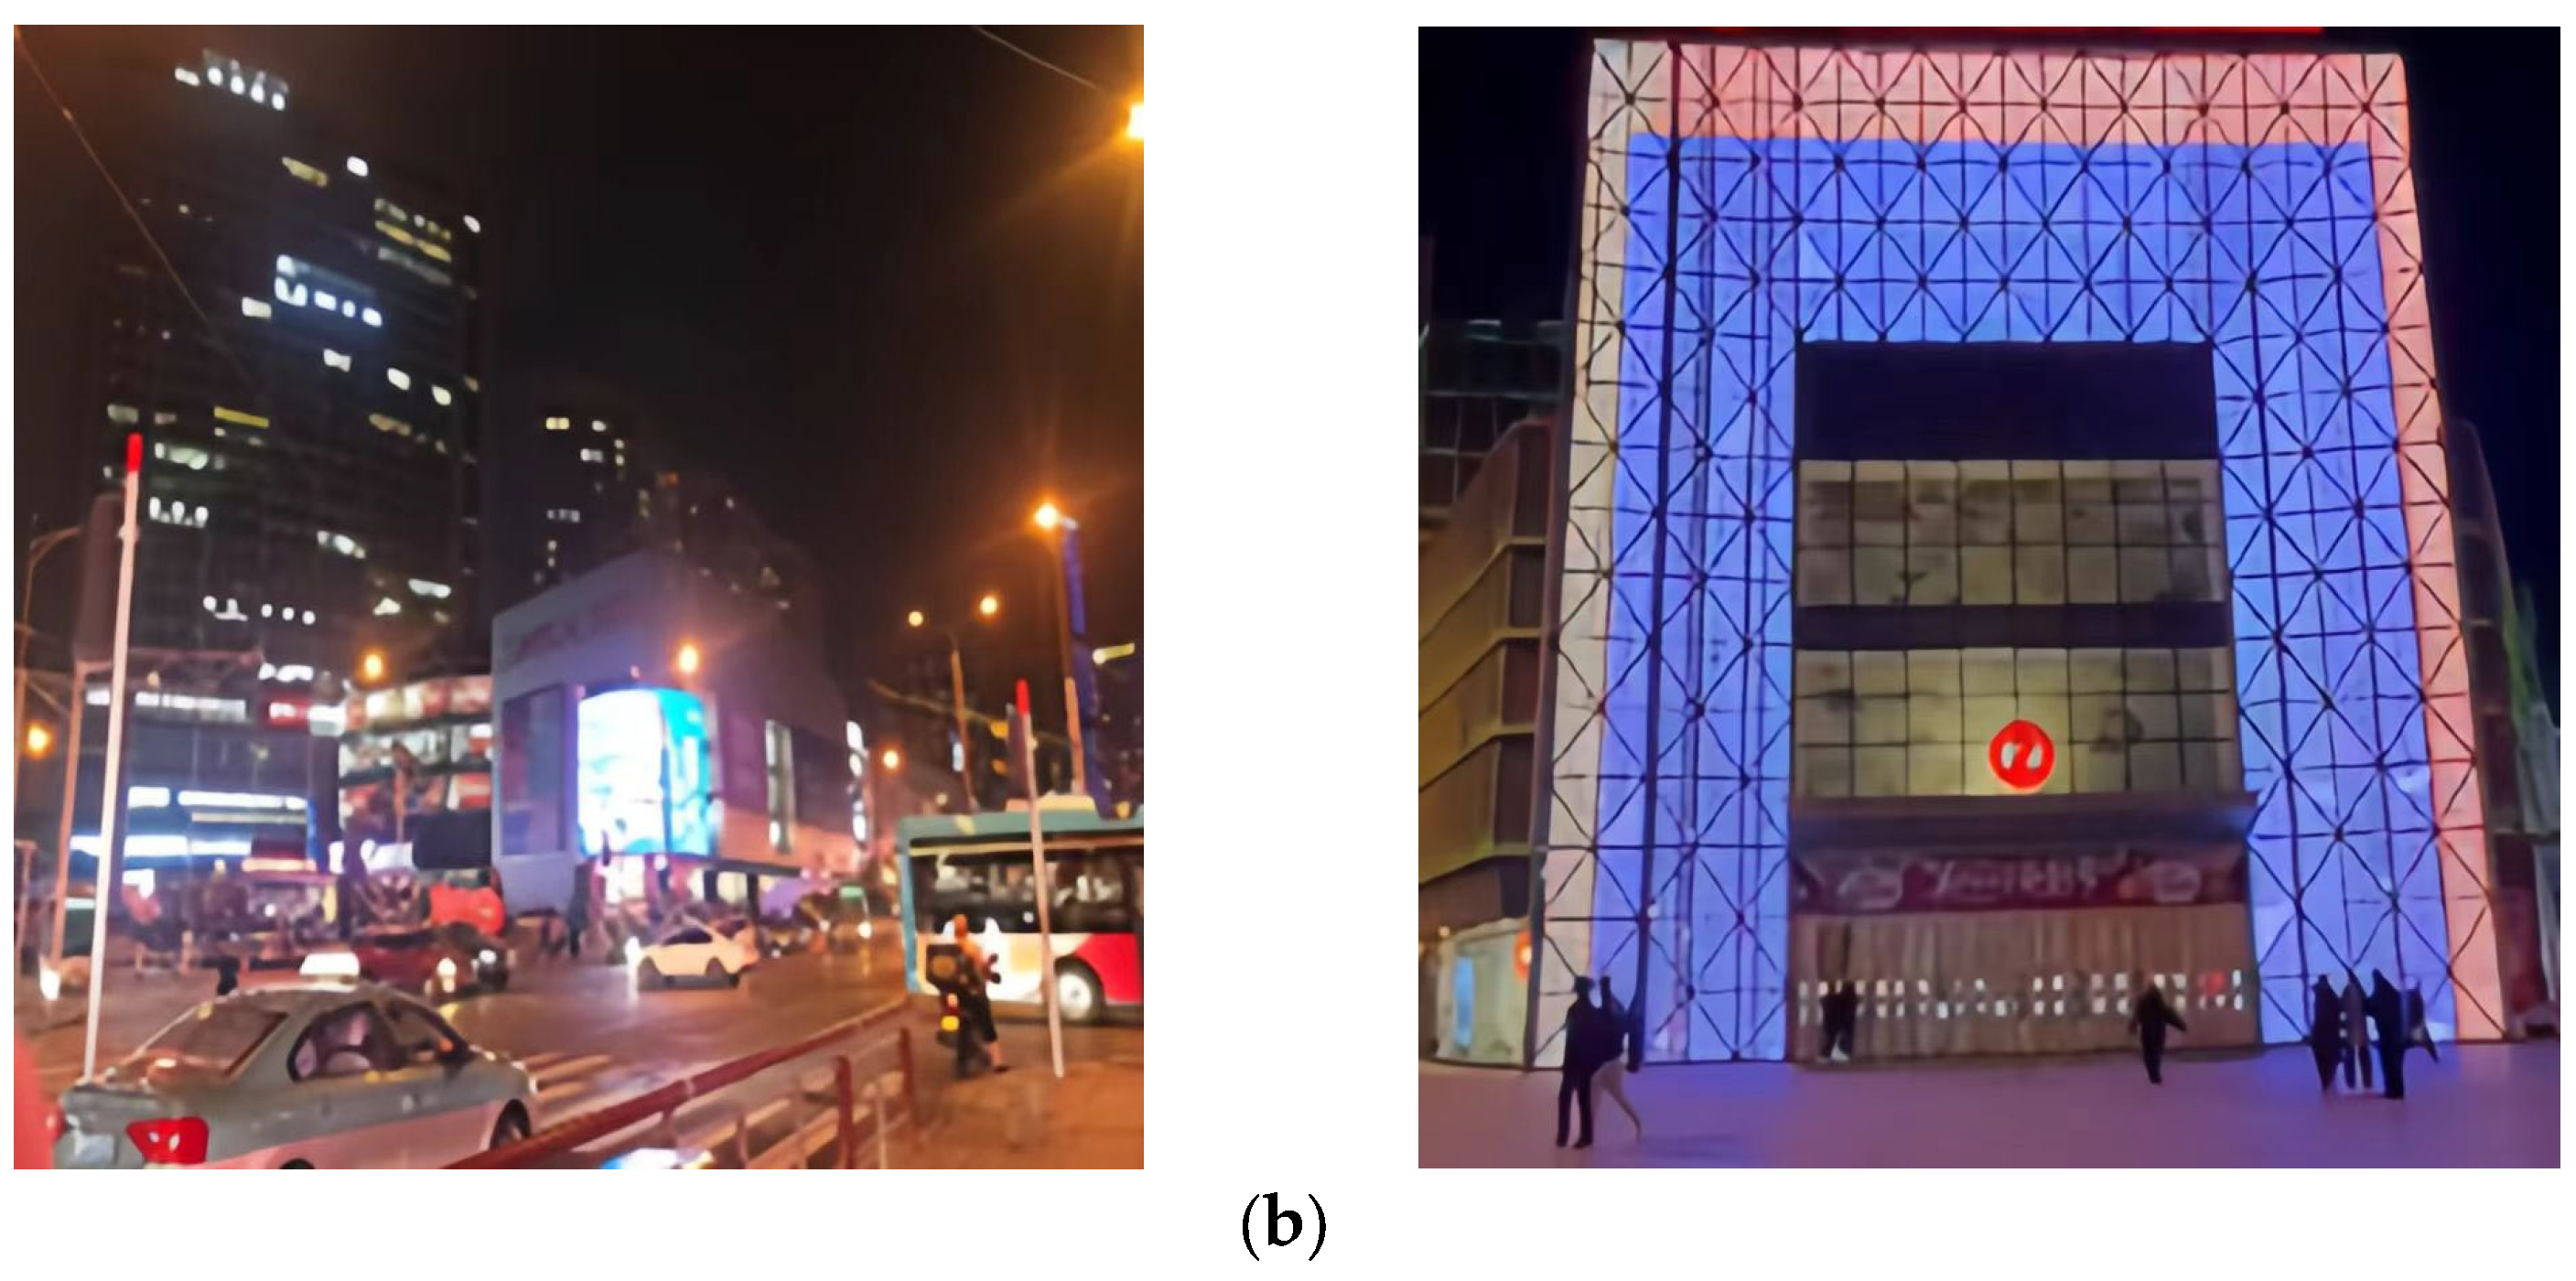
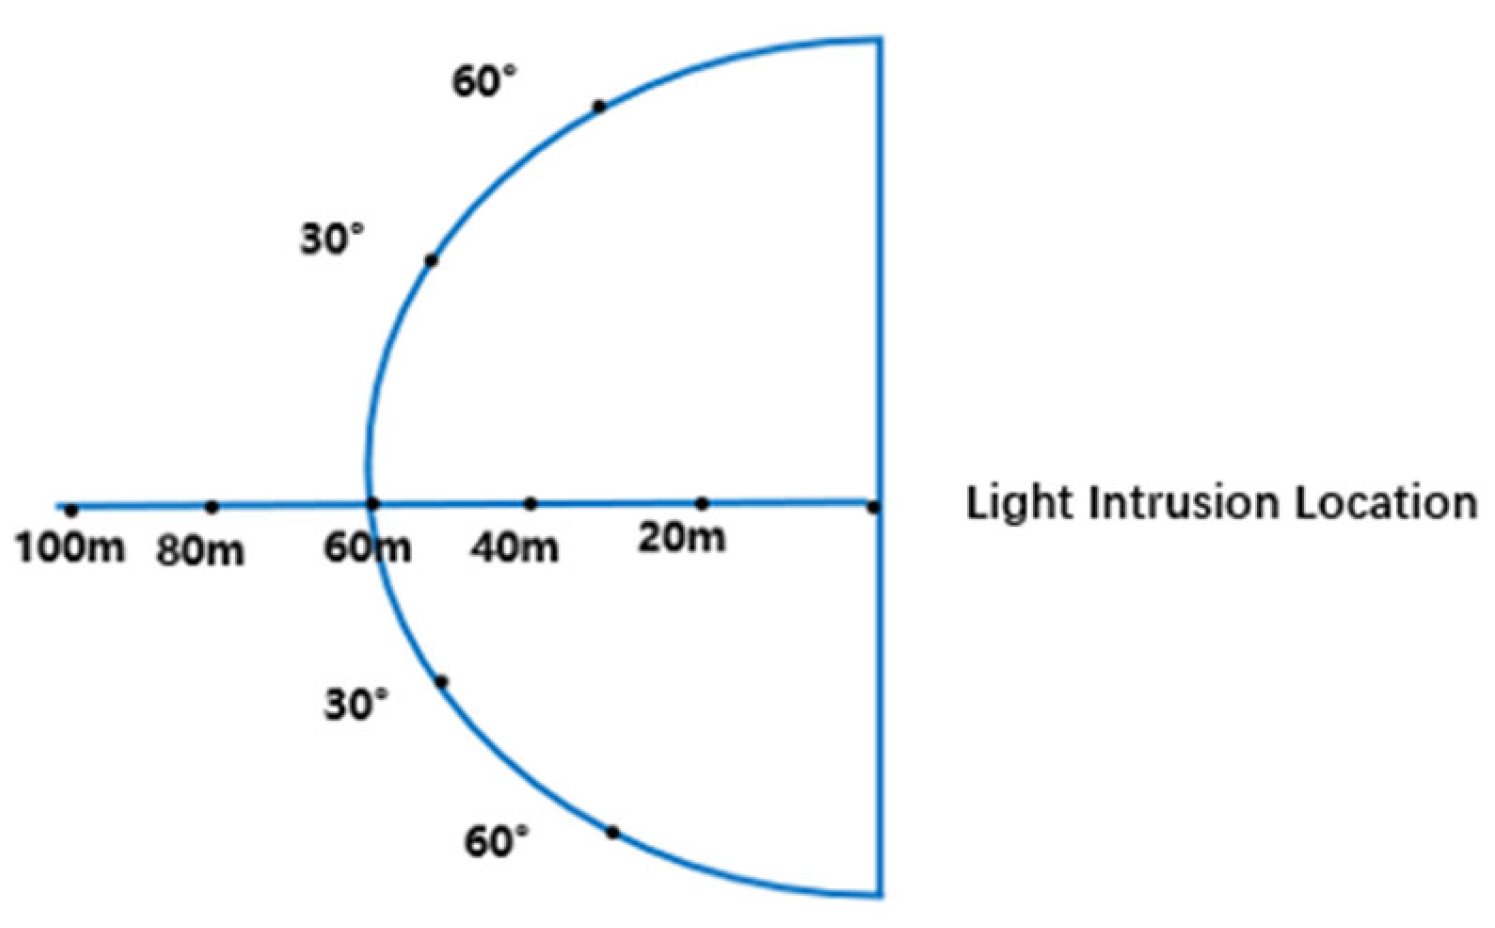
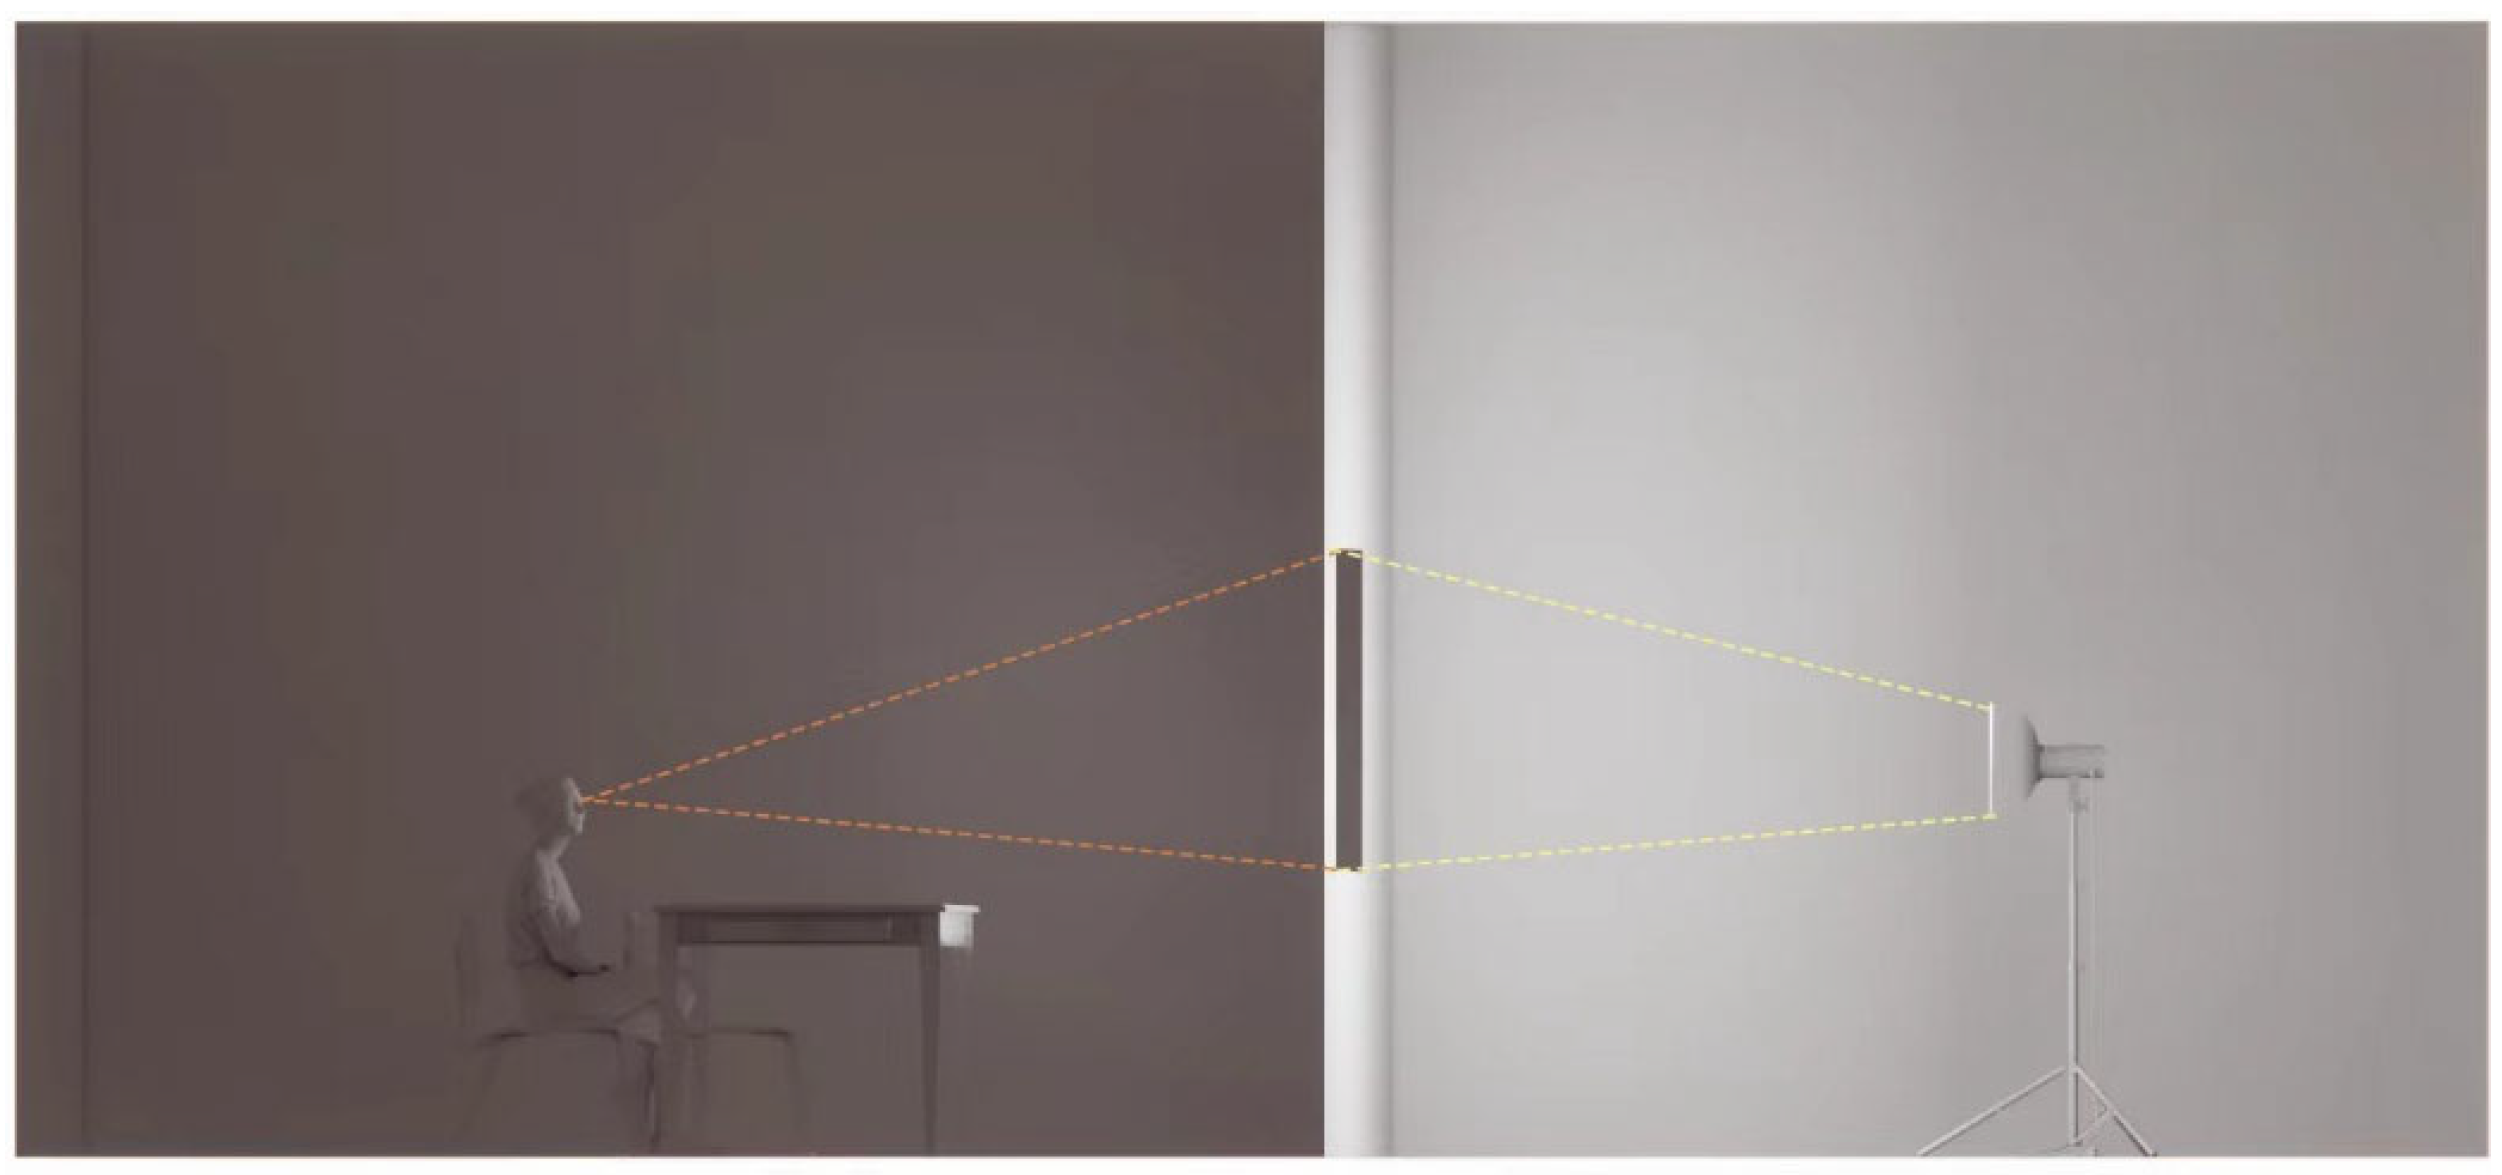
2.2.1. Field Measurements

The instruments utilized in the field test comprised the CA-2500 2D color luminance meter (Konica Minolta, Tokyo, Japan), the CL-500A illuminance meter (Konica Minolta, Tokyo, Japan), and a laser range finder (Delixi, Yueqing City, China), with detailed specifications provided in Table 2. The data gathered encompassed vertical illuminance, color temperature, dominant wavelength, and spectral illuminance within a residential area. Additionally, parameters such as road dimensions, the area of the LED advertisement screen, the distance from the light source to the measurement point, as well as the brightness and color characteristics of the LED display were documented. For data that could not be directly measured within the community, adjustments were implemented by modifying the measurement distance and angle. The CA-S20W software facilitated the analysis of the spatial distribution of luminance, color temperature, and chromaticity of LED displays at various angles and distances. A five-point sampling test method was employed, as illustrated in Figure 2. In establishing the deployment program, considerations were made regarding the distance between the monitoring point and the LED screen, as well as the angle of observation. The monitoring points were strategically positioned in as many locations as feasible; where site conditions permitted, points were deployed up to 100 m away, as the influence of illumination beyond this distance is minimal. It was ensured that deployment points were adequately distributed at angles of −30°, −60°, 0°, 30°, and 60° along the same half-circle arc. During the collection of LED illumination data, the distance was maintained within a semicircle of equal distance, with the 2D color luminance meter positioned at a height of 1.5 m. Measurements were taken at angles of −30°, −60°, 0°, 30°, and 60°, where 0° corresponds to the position of the illuminance meter directly facing the LED screen. Given that the illumination and brightness of the LED screen fluctuate randomly with color variations, multiple sets of data were recorded to ensure a comprehensive analysis, ultimately yielding maximum, average, and minimum values.

2.2.2. Questionnaire

(1)
Questionnaire design for a survey on sources of nocturnal light exposure and the current status of human sleep.
To exclude the interference of other factors affecting sleep on the results of the questionnaire as much as possible, this subjective survey investigated the basic situation of the residents through the screening questionnaire and excluded the invalid data brought by other common factors such as age, work intensity, chronic diseases, and other factors that have a serious impact on the quality of sleep. The screening questionnaire settings are shown in Table 3. The subjective questionnaire was set up in Table 4.
(2)
Questionnaire design for the subjective perception of the infested population towards the source of infestation.
This part of the questionnaire was designed to fully understand the subjective feelings of the residents in Dalian who are affected by the light intrusion of LED advertising screens, and to summarize the extent of the impact of light intrusion from LED advertising screens around the residential area, the factors of light intrusion, the main types of light intrusion affecting the activities of the residents, the time of day of the light intrusion, and the colors of the advertising screens that the residents are fed up with. The questionnaire settings are shown in Table 5.

2.3. Survey Results

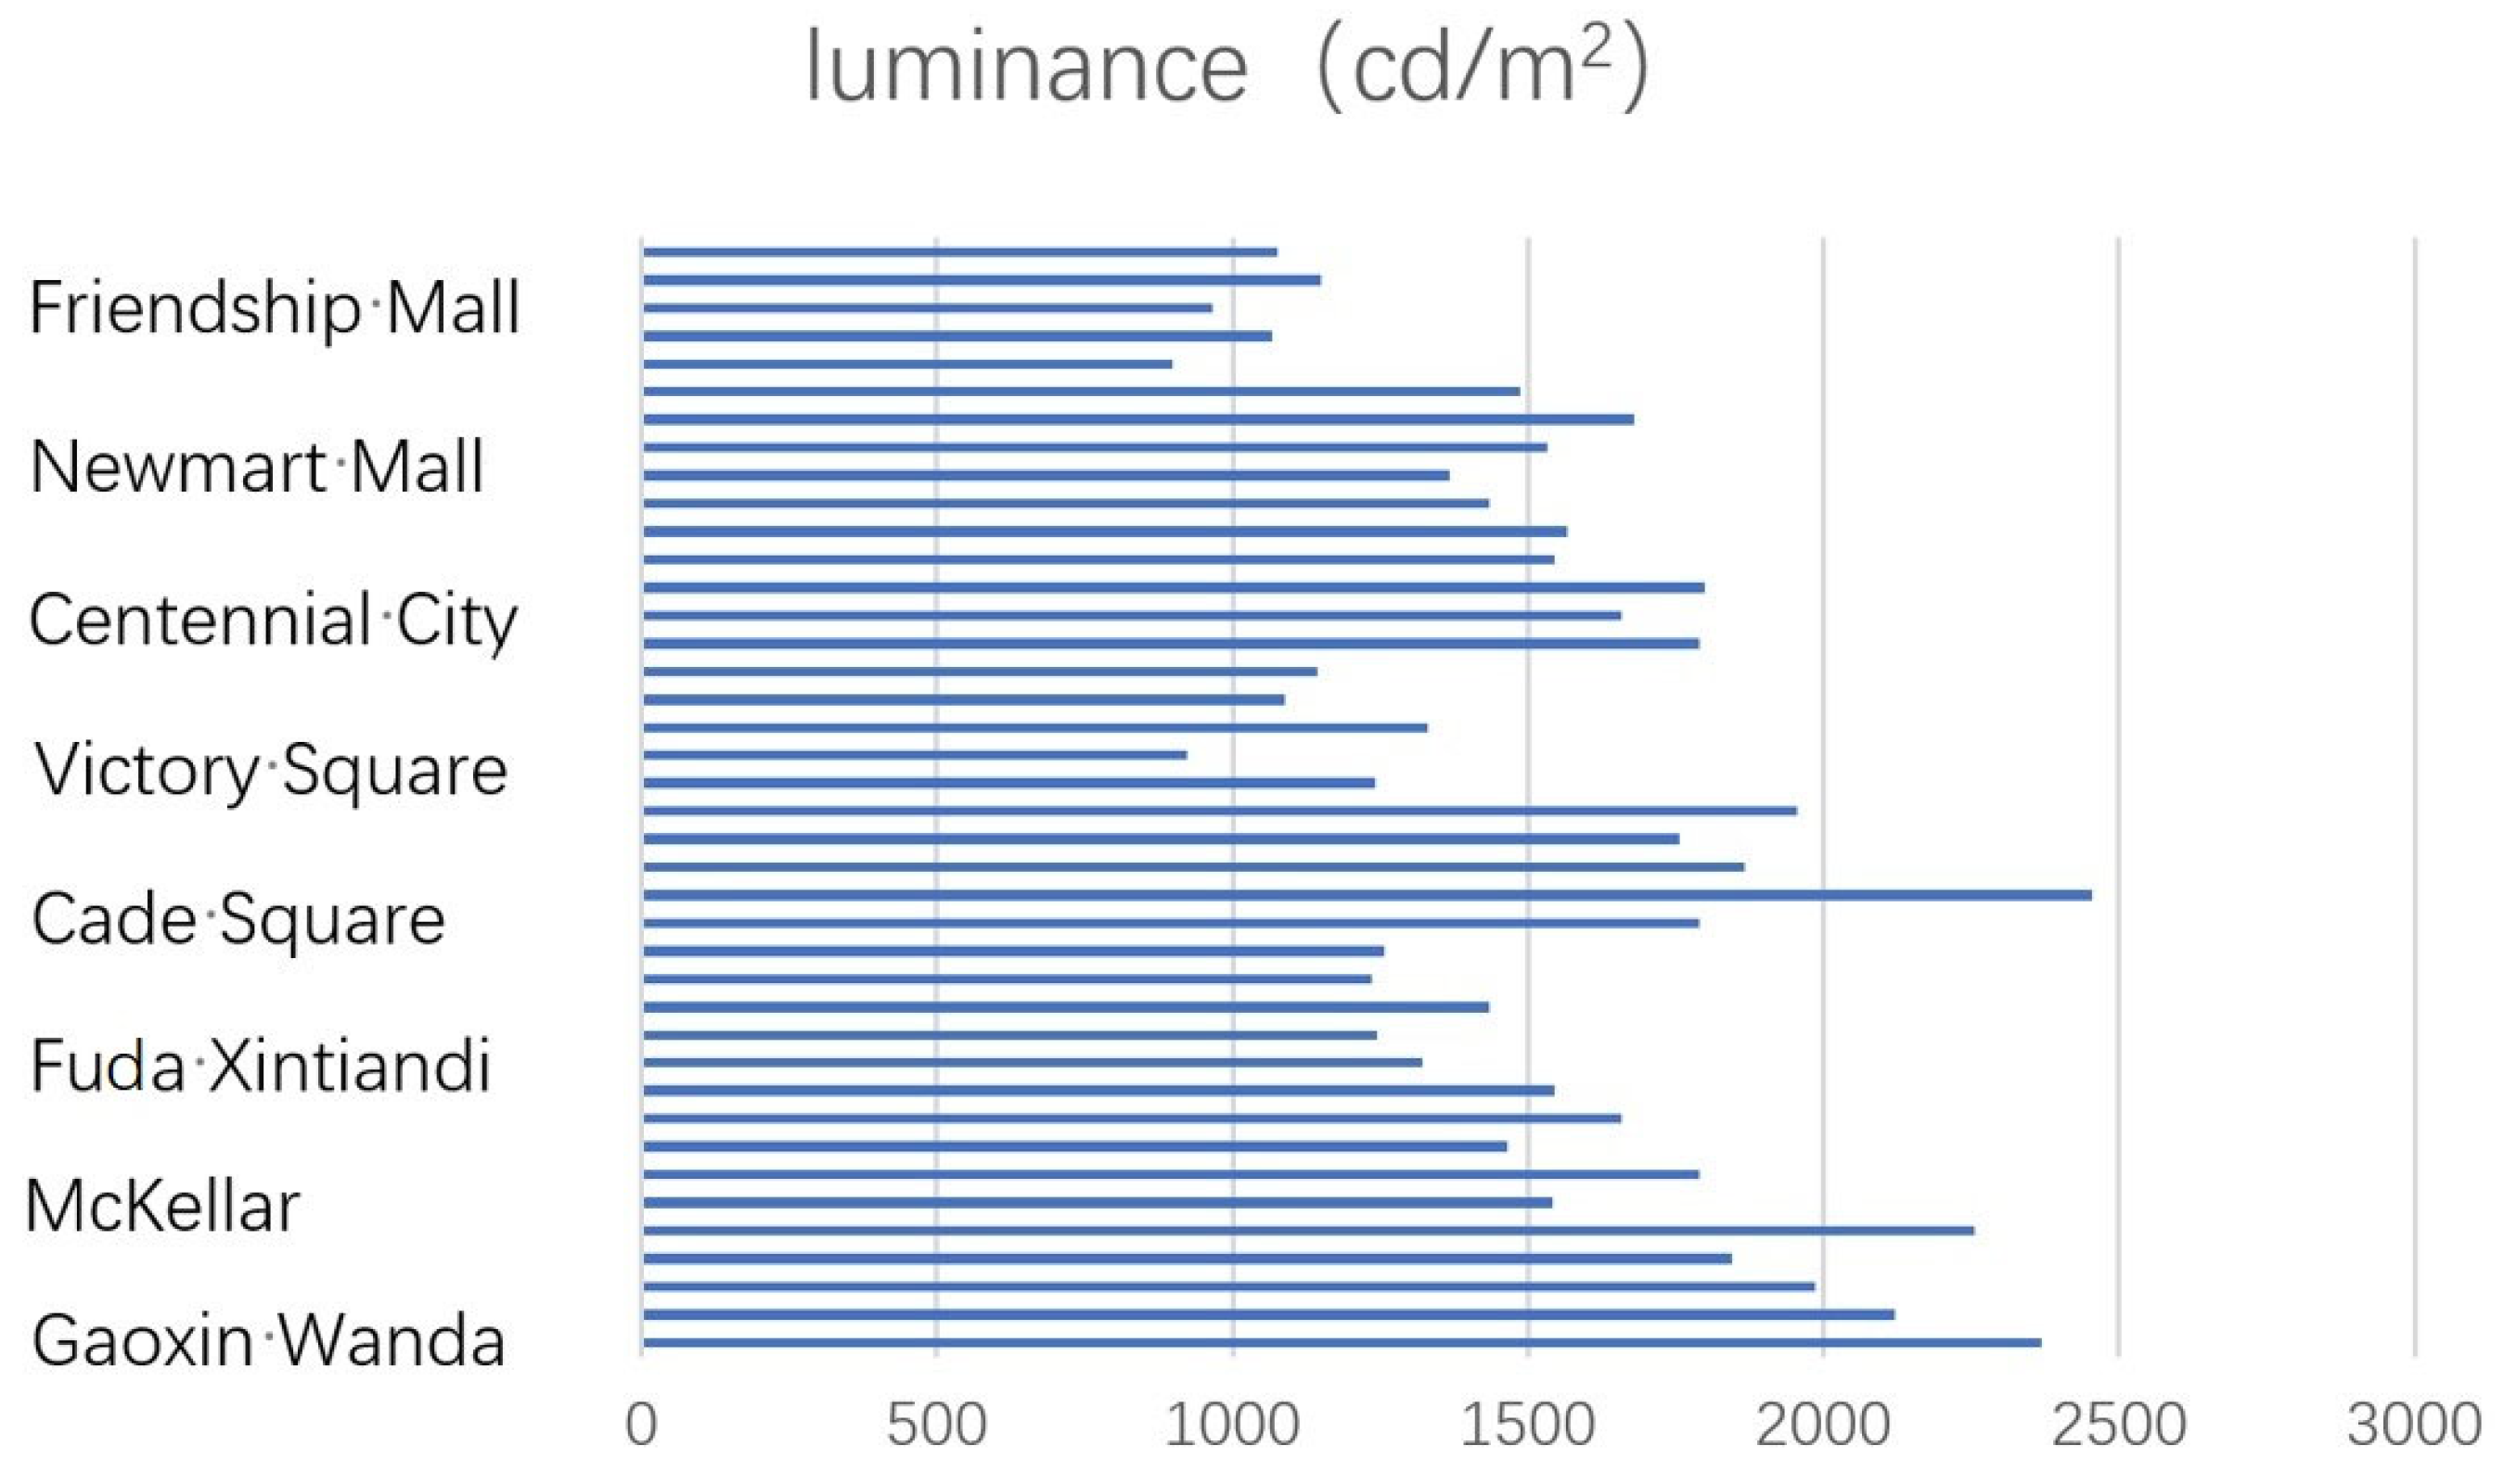
2.3.1. Actual Measurement Results

(1)
LED advertising screen brightness
The measurement data presented in Figure 3 indicate that the advertising screen exhibits a significantly high brightness level, reaching a maximum of 2456 cd/m2. During the testing process, it was observed that the brightness of the screen fluctuated rapidly, transitioning abruptly between dark and light states. Such variations have the potential to adversely impact the well-being of nearby residents, particularly regarding their sleep quality. The findings of this assessment revealed that the brightness levels consistently exceeded the established standards.
(2)
Screen change frequency
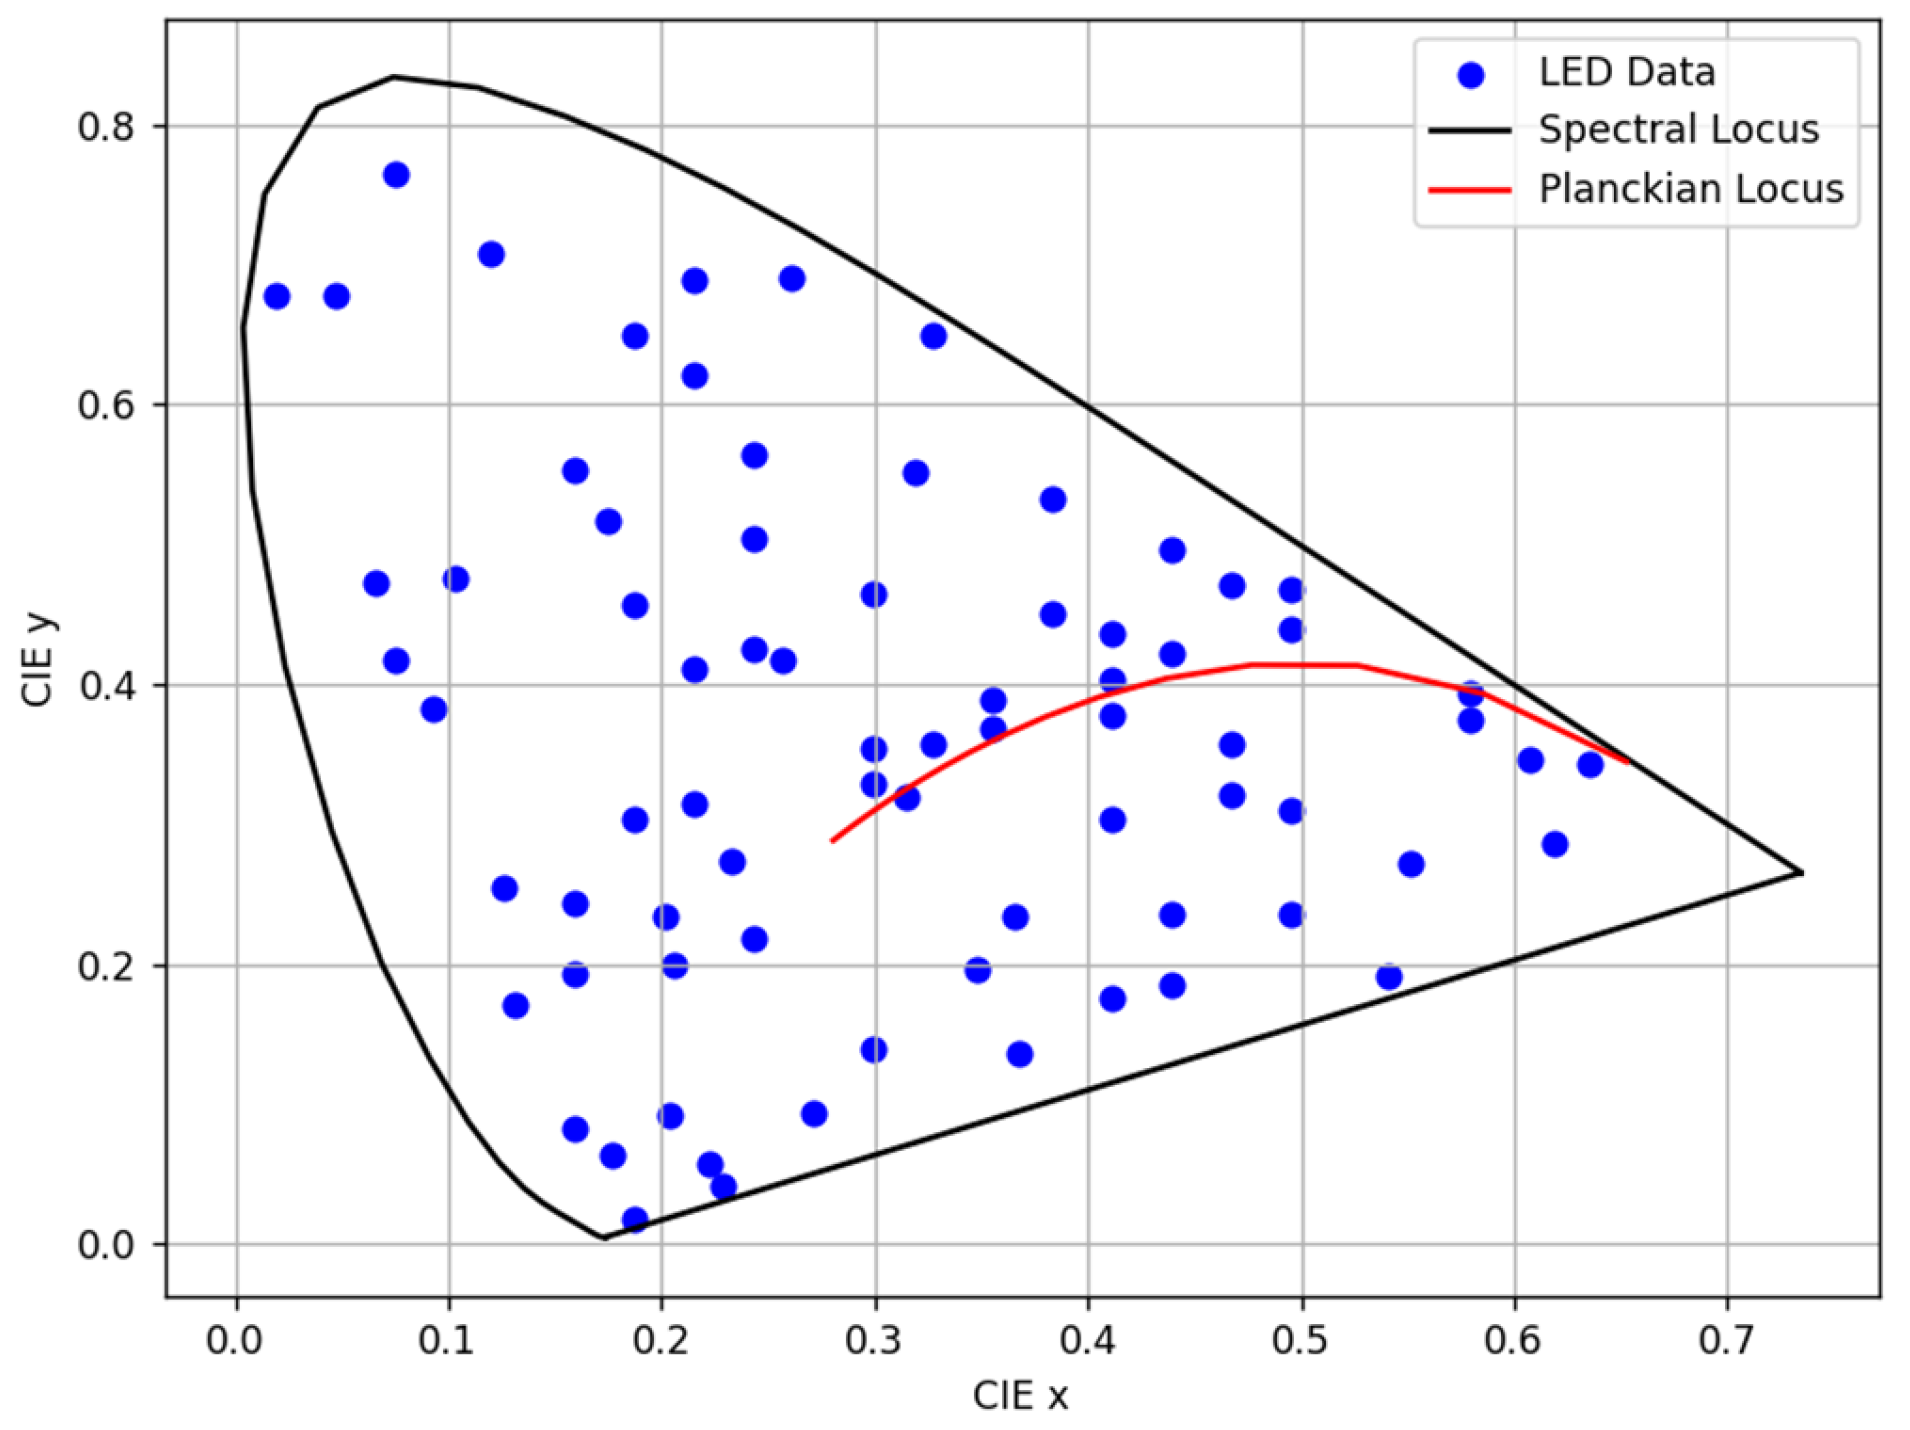
According to the existing research results of dynamic lighting [31], combined with the research field situation, the dynamic form is defined as the following five: extension, flashing, color change, jumping, and sliding. The dynamic frequency of the corresponding LED advertising screen was obtained through the measurement, and according to the statistics, the dynamic frequency range was limited to 0.25–4 Hz, as shown in Table 6.
(3)
LED advertising screen color and light data
Since the color of the LED advertising screen changes rapidly, we randomly measured and recorded the luminance and chromaticity coordinates of each color change. The color coordinates of the intruding light of the LED advertising screen obtained from the on-site test are plotted as shown in Figure 4. Due to the image noise during the on-site shooting, abnormal data have been excluded from Figure 4.

2.3.2. Questionnaire Data Results
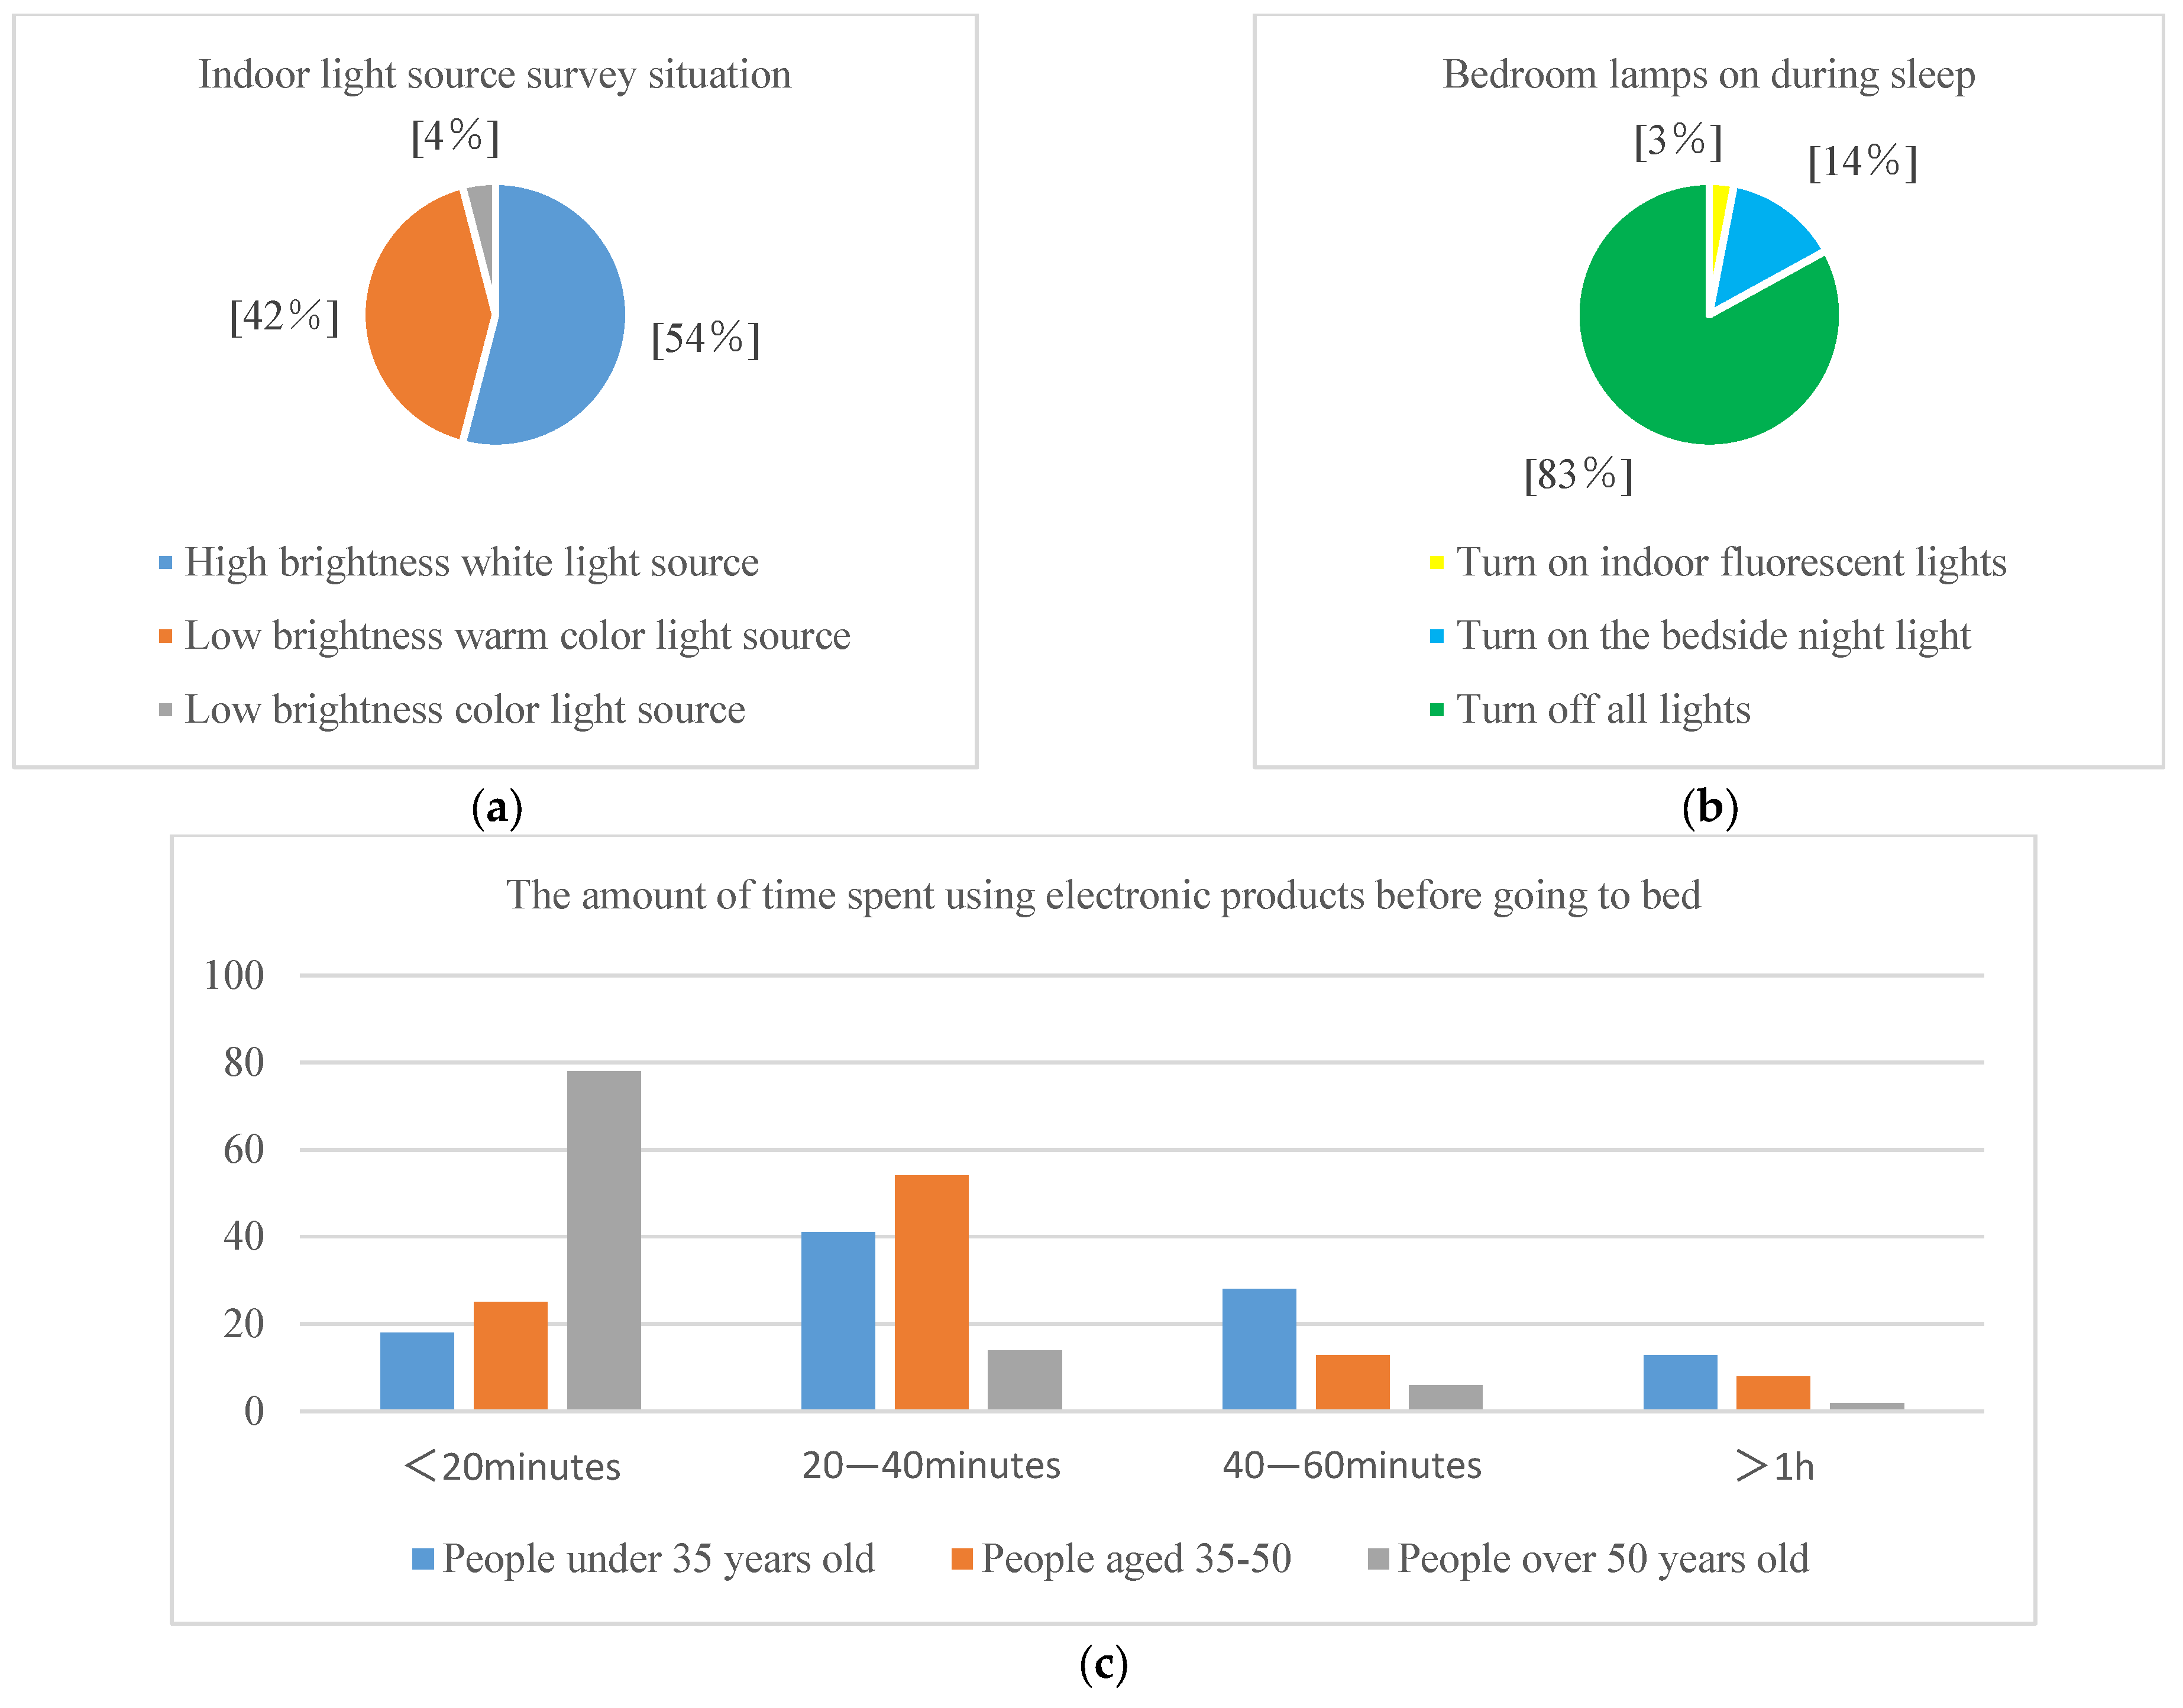
(1)
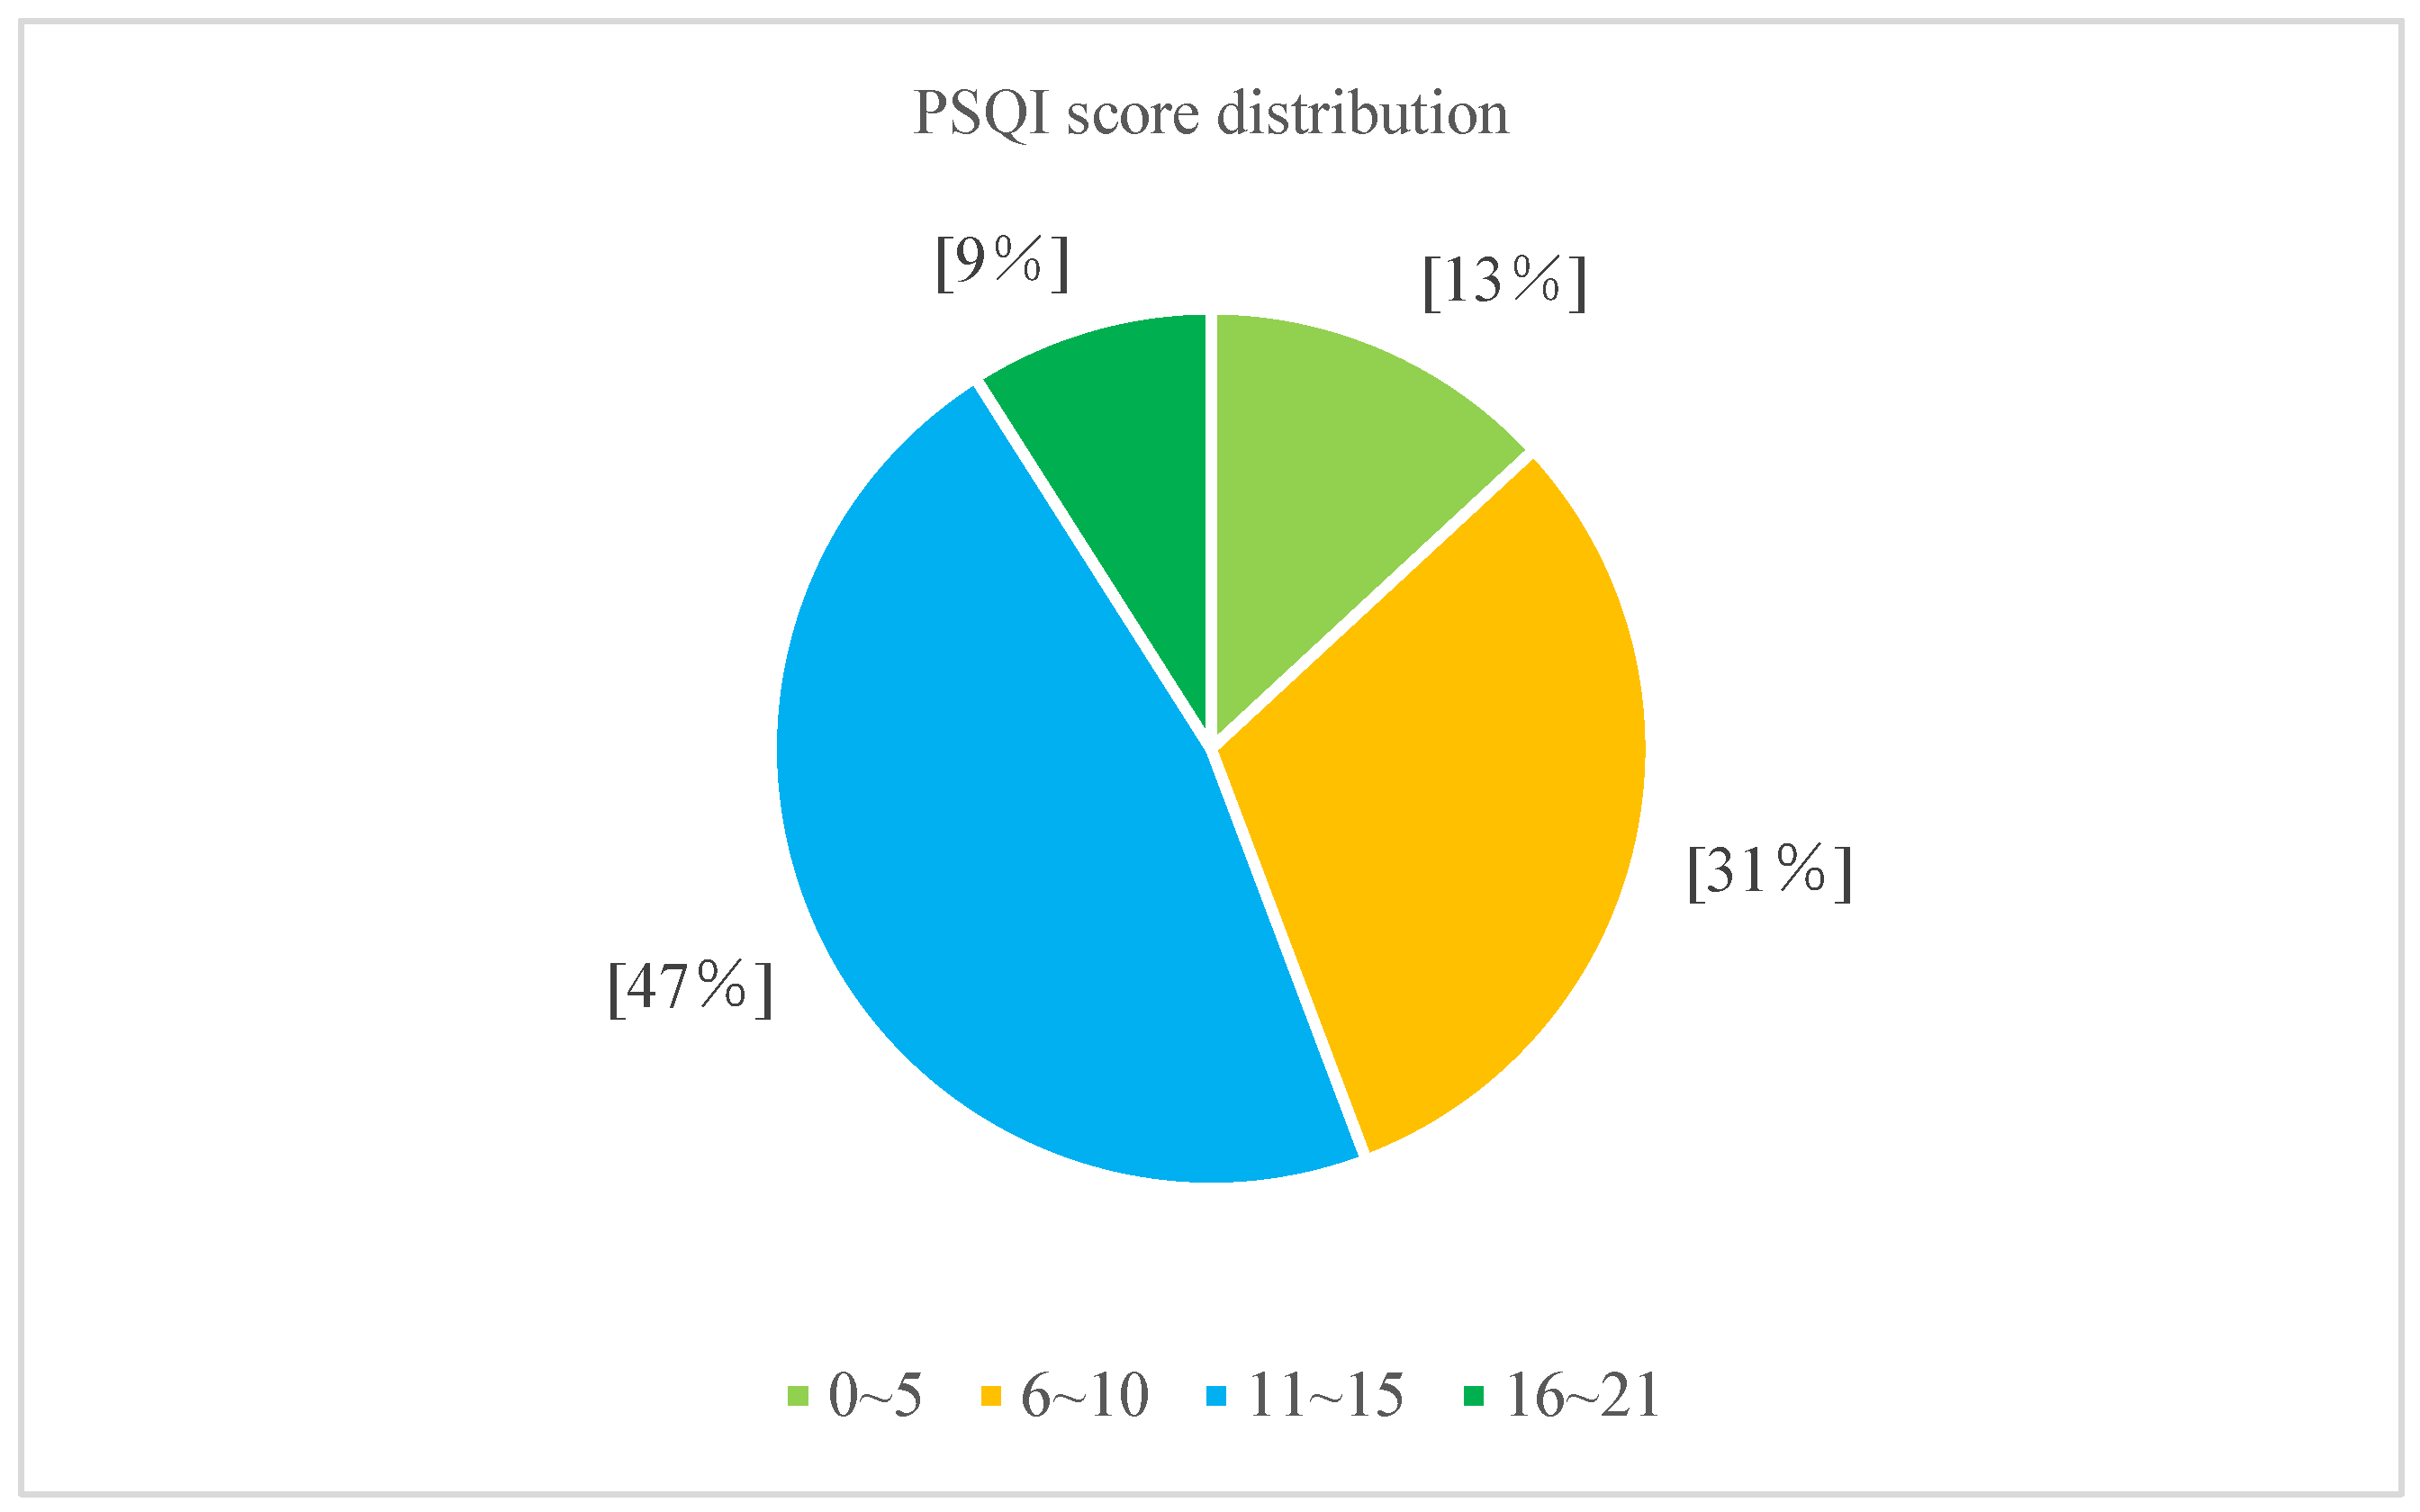
Data analysis of the questionnaire on sources of nocturnal light exposure and the current state of human sleep.
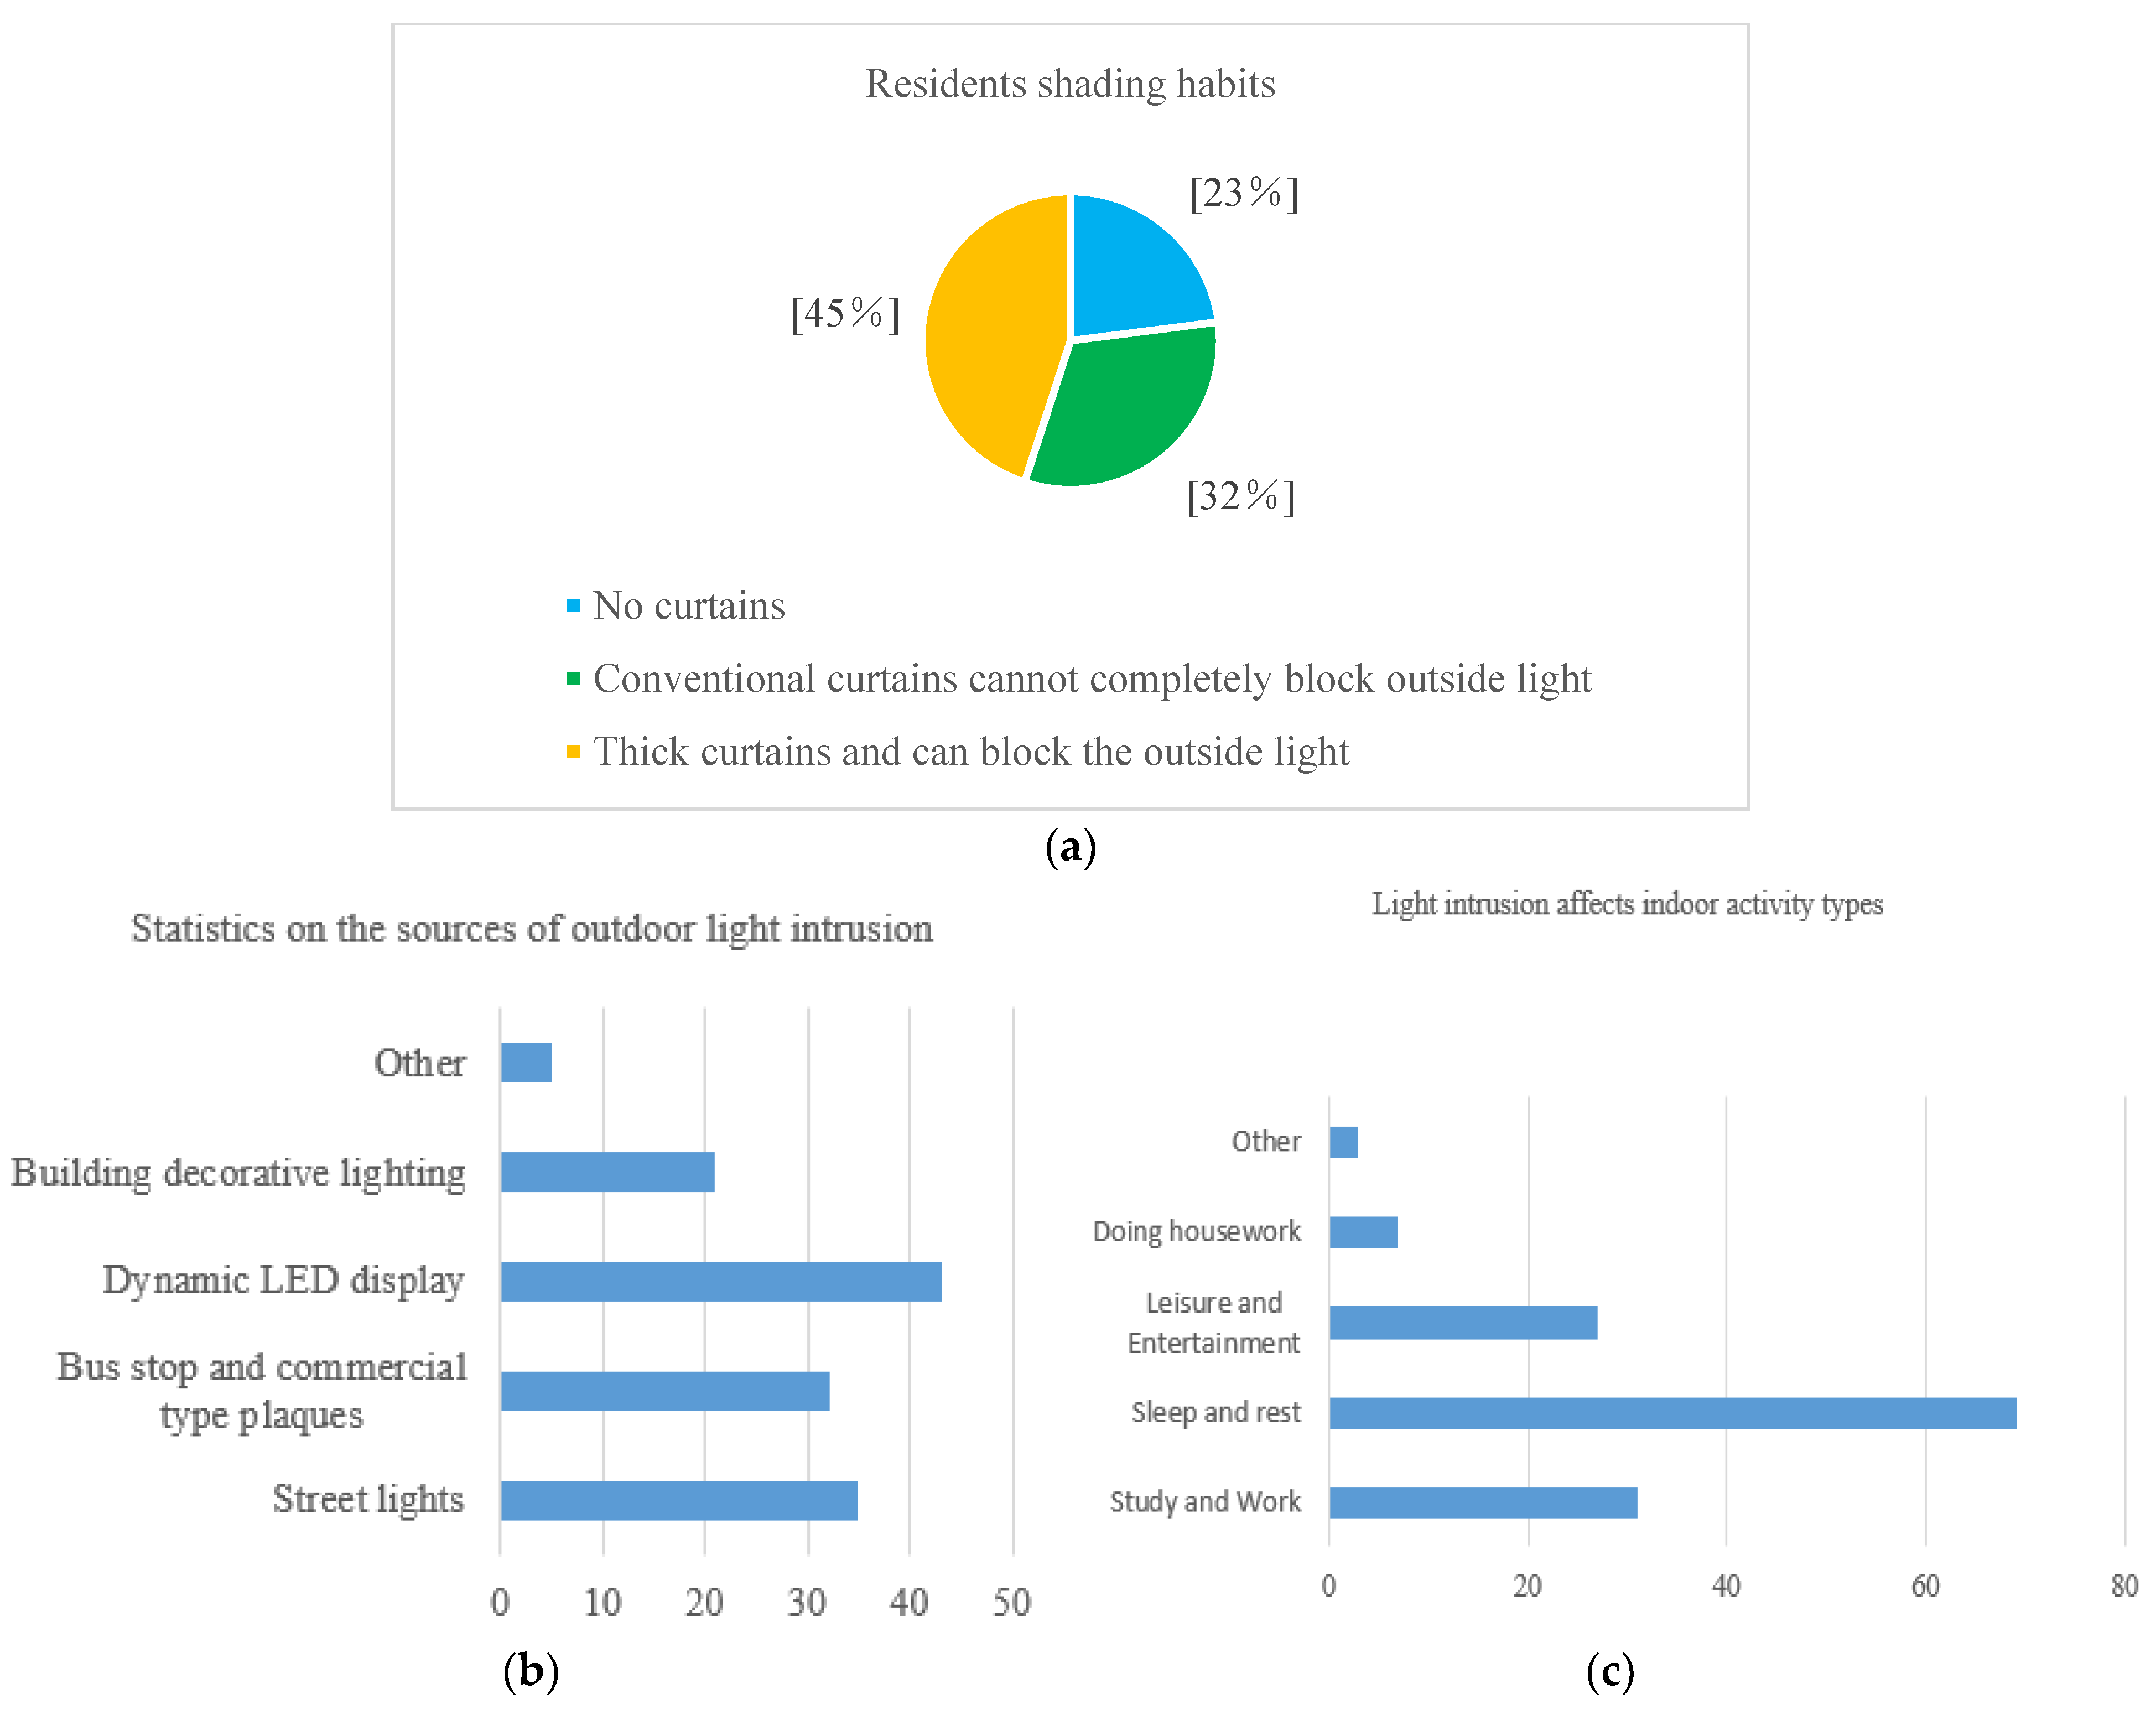
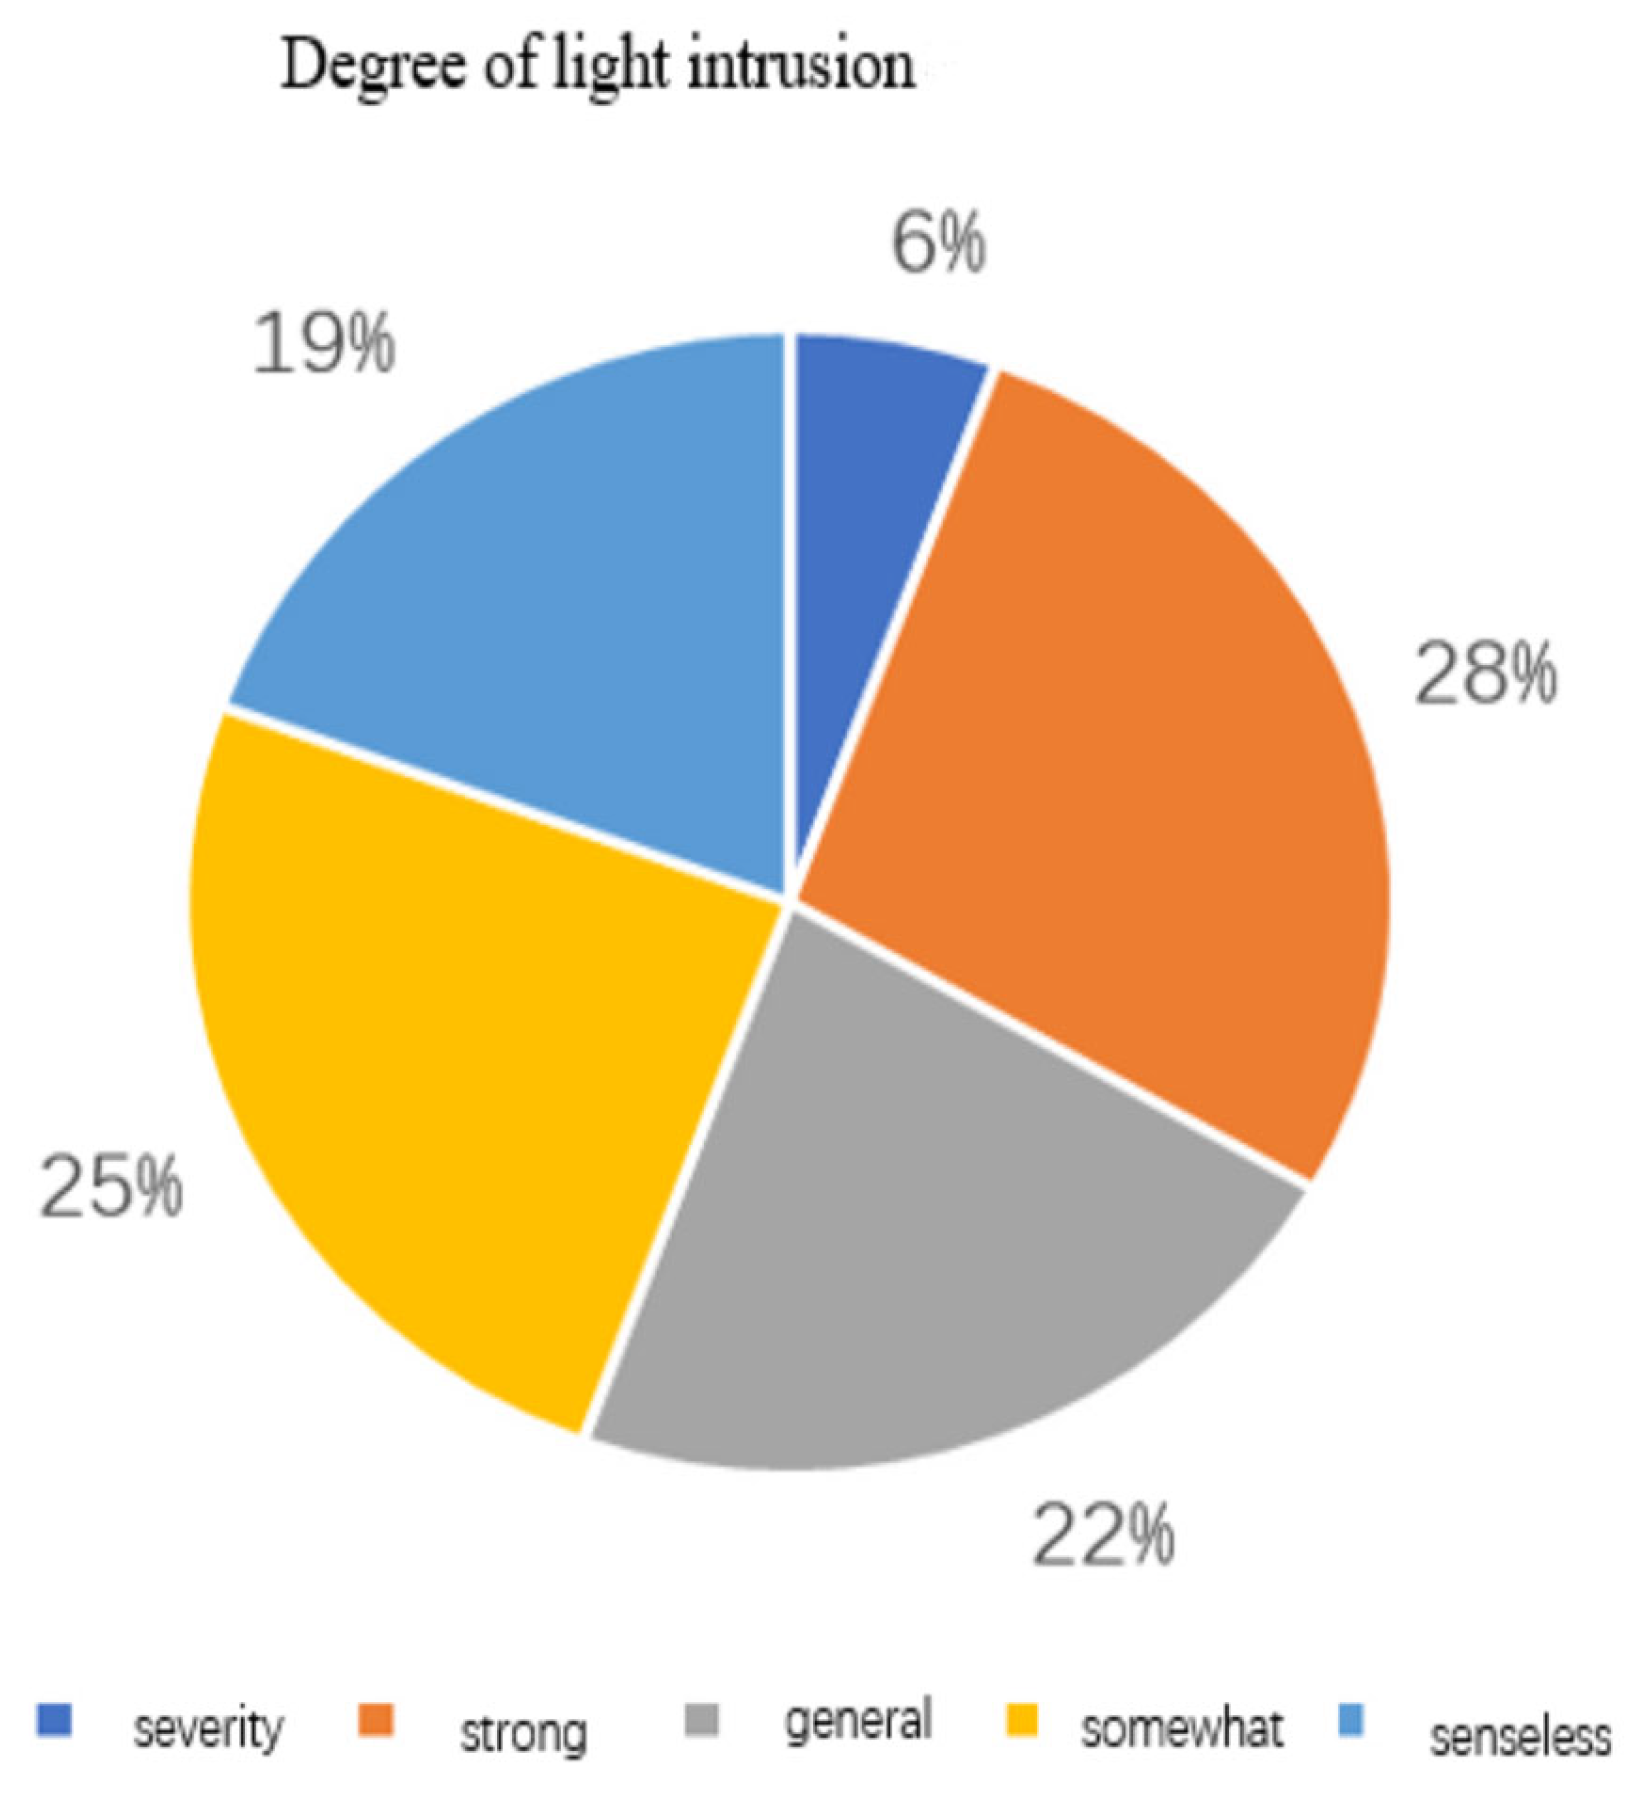
As shown in Figure 5, the results of the light environment survey before going to bed show that 54% of residents use high-brightness white light sources. The results of having the lamps on during sleep show that most residents prefer a dark environment; only 3% of residents are used to sleeping in a well-lit environment and another 14% are used to turning on the bedside night light when they sleep. In addition, the results of the survey on the use of electronic products before going to bed showed that people under 50 years of age use electronic products before going to bed concentrated in durations between 20 and 60 min, and people over 50 years of age use electronic products for durations of less than 20 min, or even before going to bed without the use of electronic products.
As illustrated in Figure 6, the findings from the survey regarding residents’ shading practices indicate that a considerable number of individuals utilize curtains to mitigate the influx of external light, perceiving them as an effective solution for this purpose. Nevertheless, 23% of respondents refrain from employing curtains to obstruct light, primarily due to concerns regarding potential interference with indoor ventilation. Additionally, 32% of residents reported using traditional curtains, expressing the belief that these do not entirely prevent external light penetration. The survey results concerning the sources of outdoor light disturbance reveal that over half of the participants feel they are subjected to light nuisance. The predominant sources identified for this outdoor light intrusion include commercial signage, dynamic LED displays, and street lighting. Regarding the types of indoor activities adversely affected by light intrusion, respondents indicated that such disturbances are particularly likely to disrupt sleep and rest.
(2)
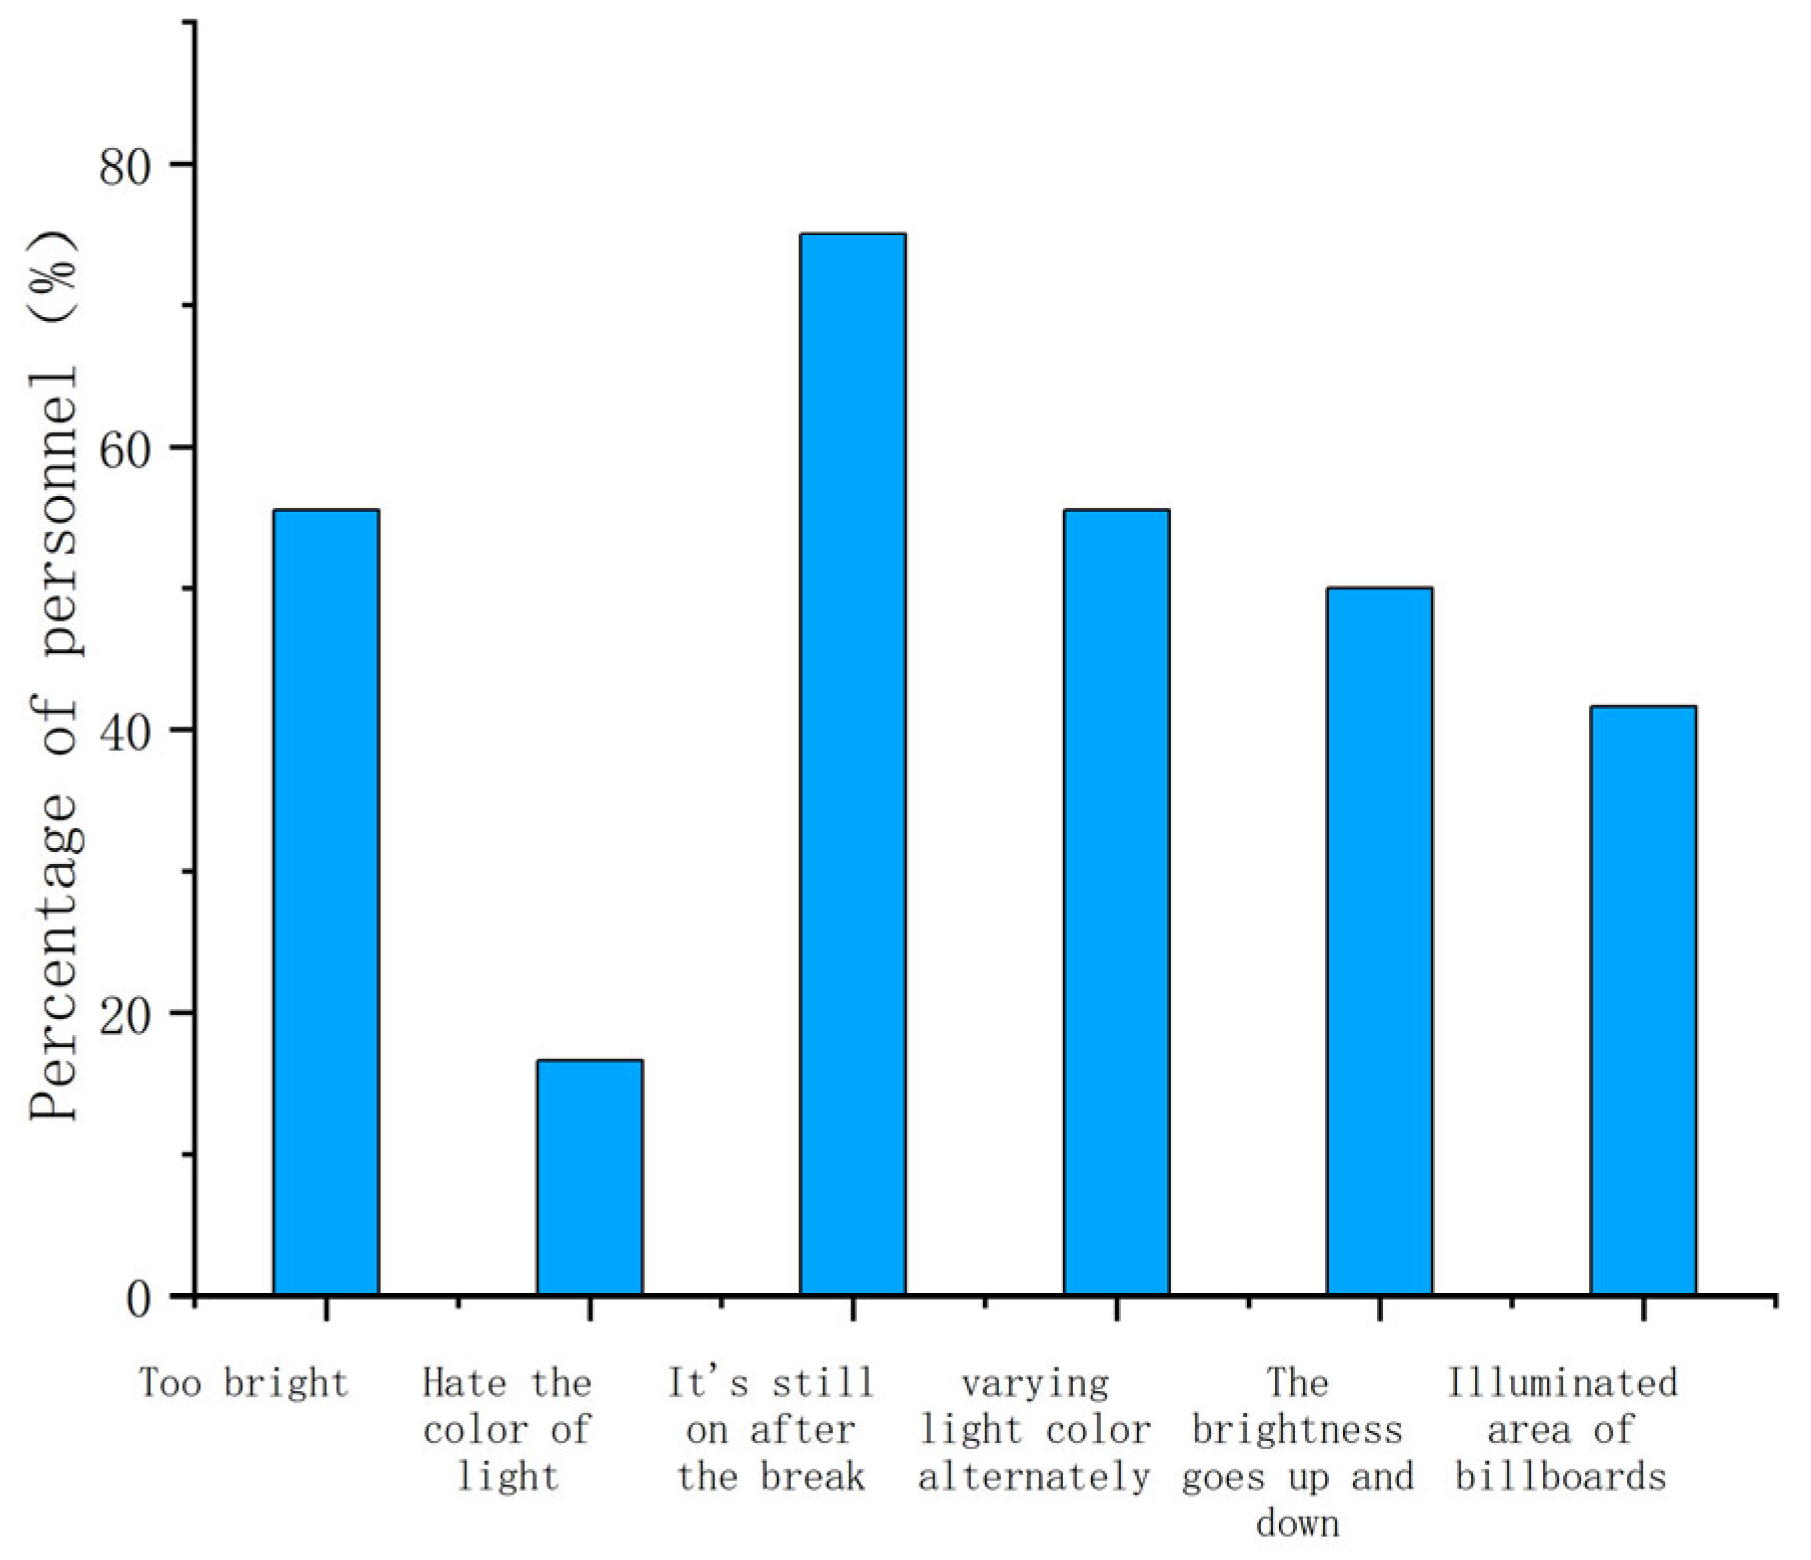
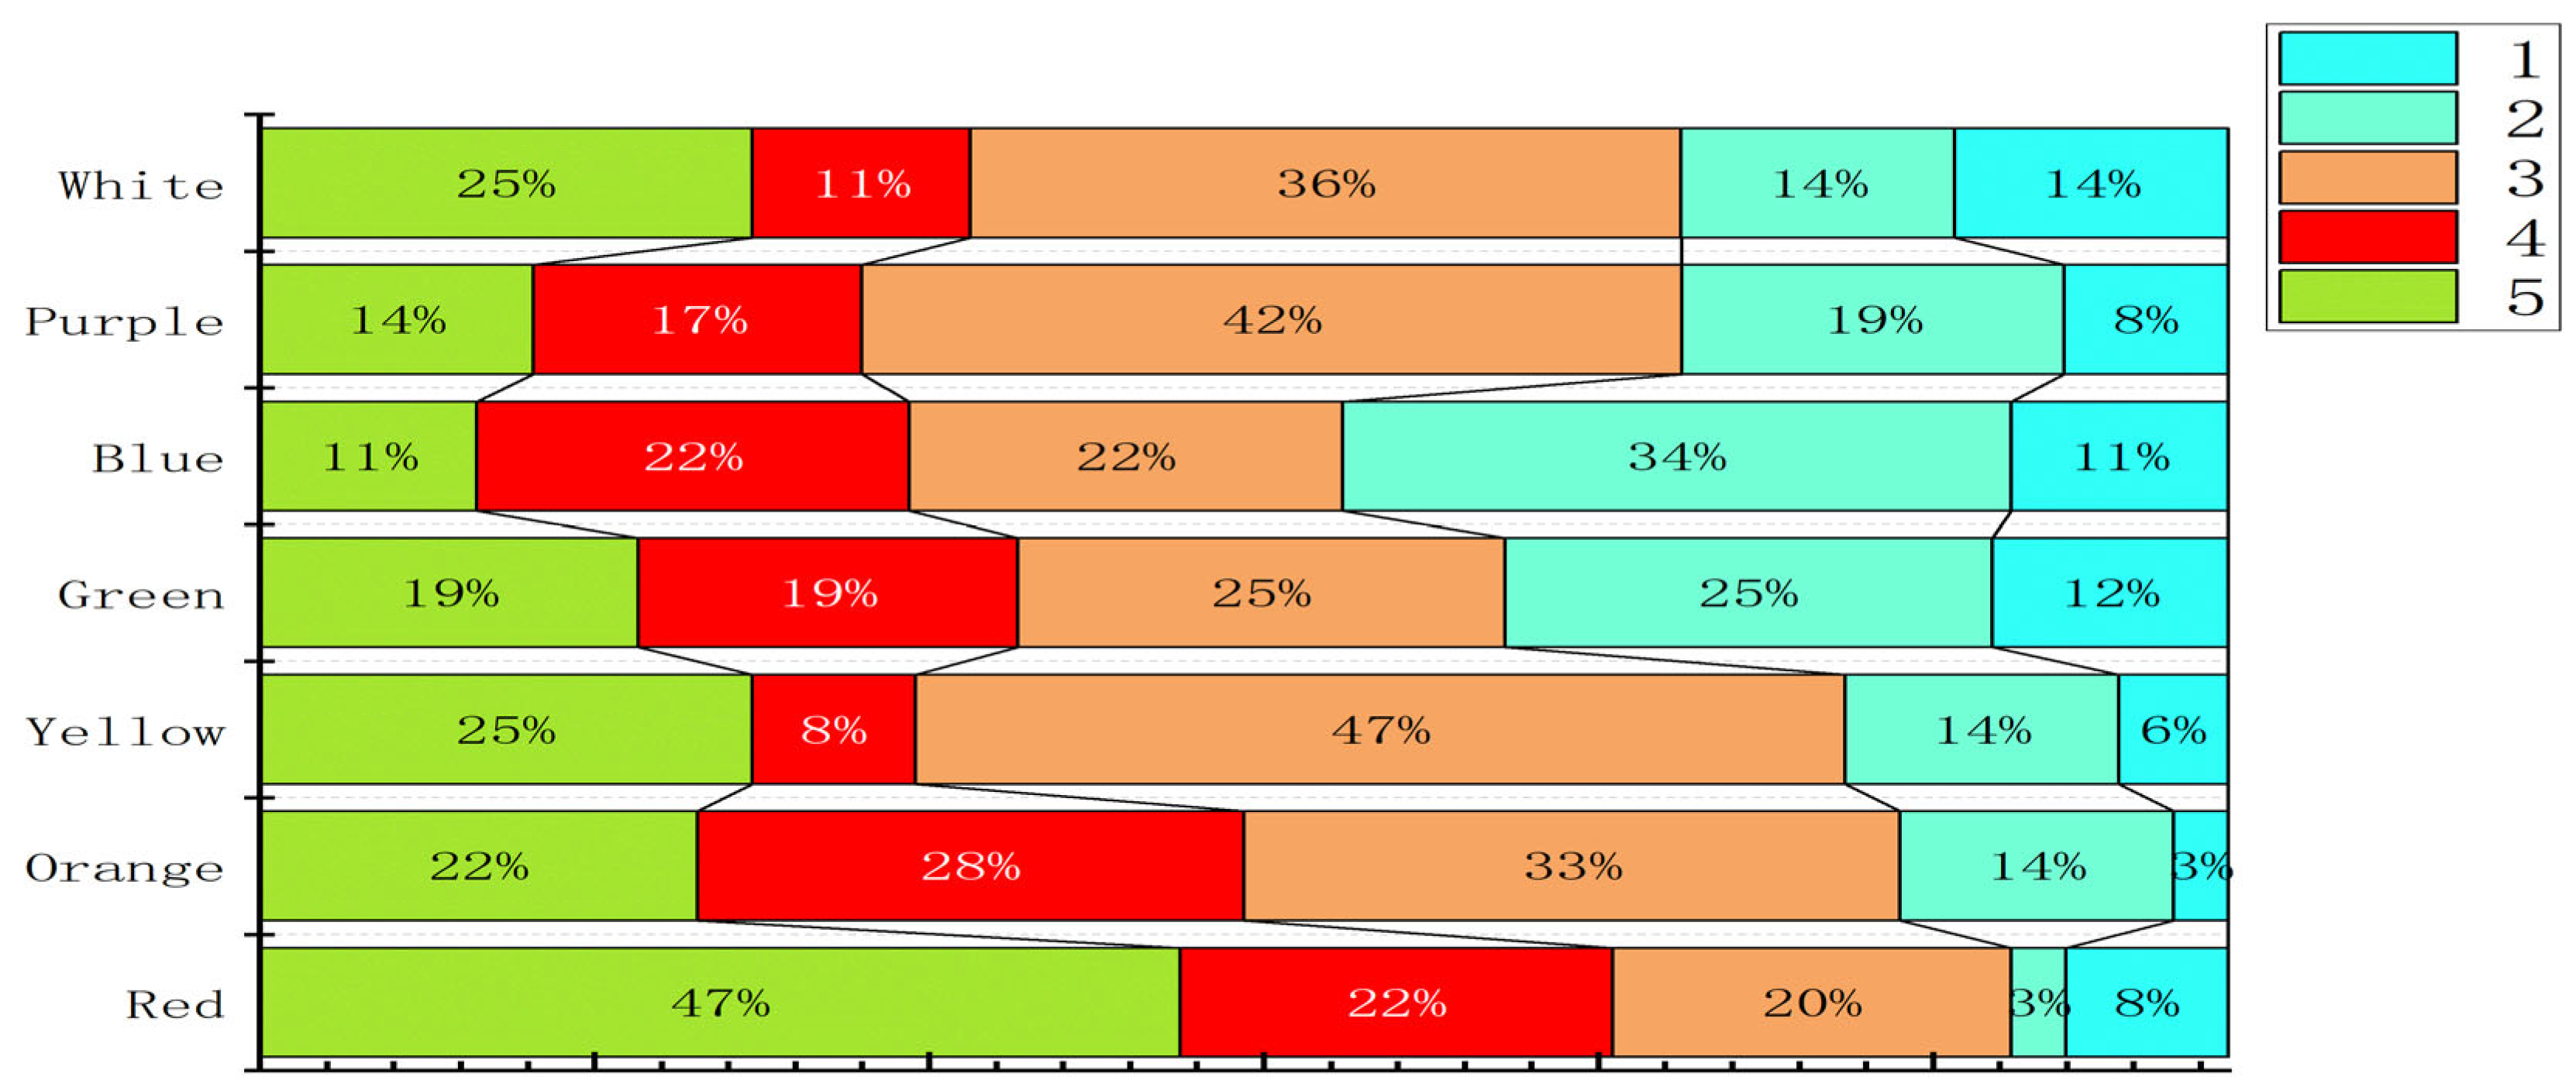
Analysis of questionnaire data on the subjective perception of the infestation source by the infested population.
For intrusive LED advertising screens, subjective feeling survey results show that more than half of the respondents think that light is intrusive on their lives to varying degrees (Figure 7); 75% of the respondents think that the billboard is still very bright after their rest, affecting sleep, while half of the respondents chose the brightness of the billboard, the color of the light, the light-emitting area as a factor that affects sleep (Figure 8). In addition, as shown in Figure 9, the results of the survey on the annoyance of light sources showed that the most annoying colors for everyone were red, yellow, and white light sources.
The Pittsburgh Sleep Quality Assessment Scale was used with the residents to assess the quality of the respondents’ sleep over the past month. As shown in Figure 10, 47% of the respondents considered their sleep quality in the past month to be average, 31% considered their sleep quality to be fair, 13% considered their sleep quality to be good, and 9% considered their sleep quality to be poor.

2.4. Summary

In this test, the maximum brightness of the advertising screen exceeded the limit, with the highest brightness up to 2456 cd/m2; its color is mainly blue, red, and yellow; the longest intrusion time reaches 15 h; and the range of dynamic frequency is limited to 0.25–4 Hz. In addition, the illuminance value at the window shows a decreasing trend with the increase in floor height. The overall range is 2~12 lx and the illuminance distribution is not uniform. The questionnaire results showed that the luminance of the intrusion source, the luminous area, the angle, and the distance from the brighter light source were significantly related to sleep quality. However, because the size of the intrusion source, the distance, and angle from the occupants were limited by the experimental conditions, the subsequent experiments focused on the effects of the color, strobe, luminance, and intrusion illuminance of the intrusion source on human circadian rhythm.

3. Experimental Methods

3.1. Subjects

The first experiment investigated the impact of the color-frequency brightness of outdoor light sources and their cumulative effects on the phase shift of human circadian rhythms before 11:00 PM. A sample of six college students, comprising four males and two females, participated in this study, with mean ages (±standard deviation, SD) of 24.14 ± 2.15 years for males and 24.42 ± 1.98 years for females. Before the experiment, the physical characteristics of the participants were assessed, specifically their height (Ht) and weight (Wt). The male participants exhibited a mean height of 178.56 ± 5.47 cm and a mean weight of 66.45 ± 5.86 kg, while the female participants had a mean height of 166.34 ± 4.35 cm and a mean weight of 54.45 ± 4.53 kg.
The second experiment focused on the effects of an indoor low-light environment caused by an outdoor light source on the phase shift of human rhythms. A cohort of eight university students, comprising four males and four females, was recruited for the experiment. The mean ages of the participants were 24.14 years (±standard deviation, SD = 2.15) for males and 24.42 years (±SD = 1.98) for females. The height and weight of male subjects were 178.56 ± 5.47 cm and 66.45 ± 5.86 kg, respectively; the height and weight of female subjects were 166.34 ± 4.35 cm and 54.45 ± 4.53 kg, respectively.
The participants in both experiments had an average age of approximately 24 years, with height and weight variations falling within acceptable parameters. Throughout this study, participants maintained a healthy diet, ensured sufficient hydration, and adhered to appropriate sleep practices. Before the experiment, detailed information regarding the procedures and assessment outcomes was provided to the participants through an informed consent form. Additionally, a sleep diary was distributed seven days before the experiment, which participants were required to complete daily, adjusting their sleep schedule to a consistent timeframe of 11:00 p.m. to 7:00 a.m.

3.2. Experimental Program

The first experiment was conducted in the optical laboratory at Dalian University of Technology. This study employed a three-factor, three-level orthogonal design, wherein participants were instructed to arrive at the laboratory by 19:00 and engage in sedentary learning within a simulated environment from 19:00 to 21:00. During the experiment, variations were introduced in the color, frequency, and brightness of the outdoor light source, with the experimental conditions outlined in Table 7. To regulate the experimental variables and mitigate the influence of natural light—characterized by its complexity and variability—opaque blackout curtains were utilized to eliminate external light interference. The configuration of the laboratory is depicted in Figure 11.
The second experiment was conducted within the dormitory of the subjects. The experimental conditions were rigorously maintained: (1) the room was capable of sustaining a constant temperature, humidity, and stable climate; (2) background noise levels were kept between 45 and 55 dB; and (3) the dimensions of the surrounding walls were adequate to obstruct extraneous light. To control the experimental variables and mitigate the influence of natural light, which is inherently variable and complex in composition, opaque thick curtains were installed in the dormitory, complemented by bed curtains to further isolate unnecessary light. The sleeping environment and the arrangement of lighting fixtures within the dormitory are illustrated in Figure 12. The duration of the second experiment spanned a total of three days. One week before the commencement of the experiment, the researchers instructed the participants to avoid napping, maintain a regular night’s sleep, and track their activity using a logging device. On the first night, subjects were instructed to sleep in complete darkness; on the second and third nights, the sleep experiment was conducted with a light fixture positioned on the wall opposite the participants’ heads. This fixture utilized a light-emitting diode (LED) as a broad-spectrum light source, characterized by the following spectral properties: peak wavelength at 463.6 nm, center wavelength at 467.6 nm, center of mass wavelength at 554.3 nm, dominant wavelength at 501.4 nm, correlated color temperature of 5779.1 K, and a general color rendering index of 90.

3.3. Measurements

At the commencement and conclusion of the experiment, the first cohort of experimental subjects underwent measurements of heart rate, blood pressure, and good conduction values, in addition to the collection of saliva samples. Heart rate and blood pressure data were obtained using a smart bracelet, while good conduction values were assessed utilizing a TCM tester. Subjective assessments of the participants’ alertness were conducted using the Karolinska Sleepiness Scale (KSS), which employs a 9-point Likert scale ranging from 1 (extremely alert) to 9 (extremely sleepy). This scale is particularly responsive to variations in drowsiness resulting from sleep deprivation and circadian rhythm fluctuations, as well as the alerting effects of light exposure. Participants’ levels of alertness were evaluated at 30 min intervals, totaling five assessments throughout the two-hour duration of light exposure during the experiment.
In the second experiment, participants engaged in saliva collection at predetermined intervals both prior to and following sleep. Concurrently, subjective data were gathered through a sleep diary and a sleep quality rating scale completed by the participants. This experiment delineated three parameters to construct a sleep quality rating scale aimed at assessing sleep quality: the sleep disturbance index, the arousal index, and sleep onset latency. Each item was evaluated using a Likert-type scale ranging from 1 to 5, with higher scores signifying greater levels of sleep disturbance or arousal issues. The average of two items—“Is it difficult to get up?” and “Do you feel unrefreshed when you wake up?”—measures the awakening index, while the average of four items—“Difficulty falling asleep?”; “Sleep disturbances?”; “Waking up too early and unable to fall back asleep”; and “How many times did you wake up during the night?”—measures the sleep disorder index. The sleep onset latency is the amount of time that passes between falling asleep and going back to sleep.

3.4. Statistical Analysis

In this study, SPSS 27, Origin 2022, and other software were used to conduct correlation analysis between quantitative data and qualitative evaluation, and before analyzing the data, it was necessary to carry out operations such as checking for missing data, eliminating outliers, converting variables, etc. Statistical tests used included independent t-tests, bivariate OLS regression analyses, multiple regression analyses, and so on. Differences in sensitivity between individuals to different light environments during the experiment were excluded by analysis of covariance.

4. Results

The current study compared and assessed various aspects of heart rate, blood pressure, blood oxygen, good conductance values, melatonin concentration, and the Caroline Sleepiness Scale, respectively, to examine the impact of light intrusion on the rhythmic phase shift in humans.

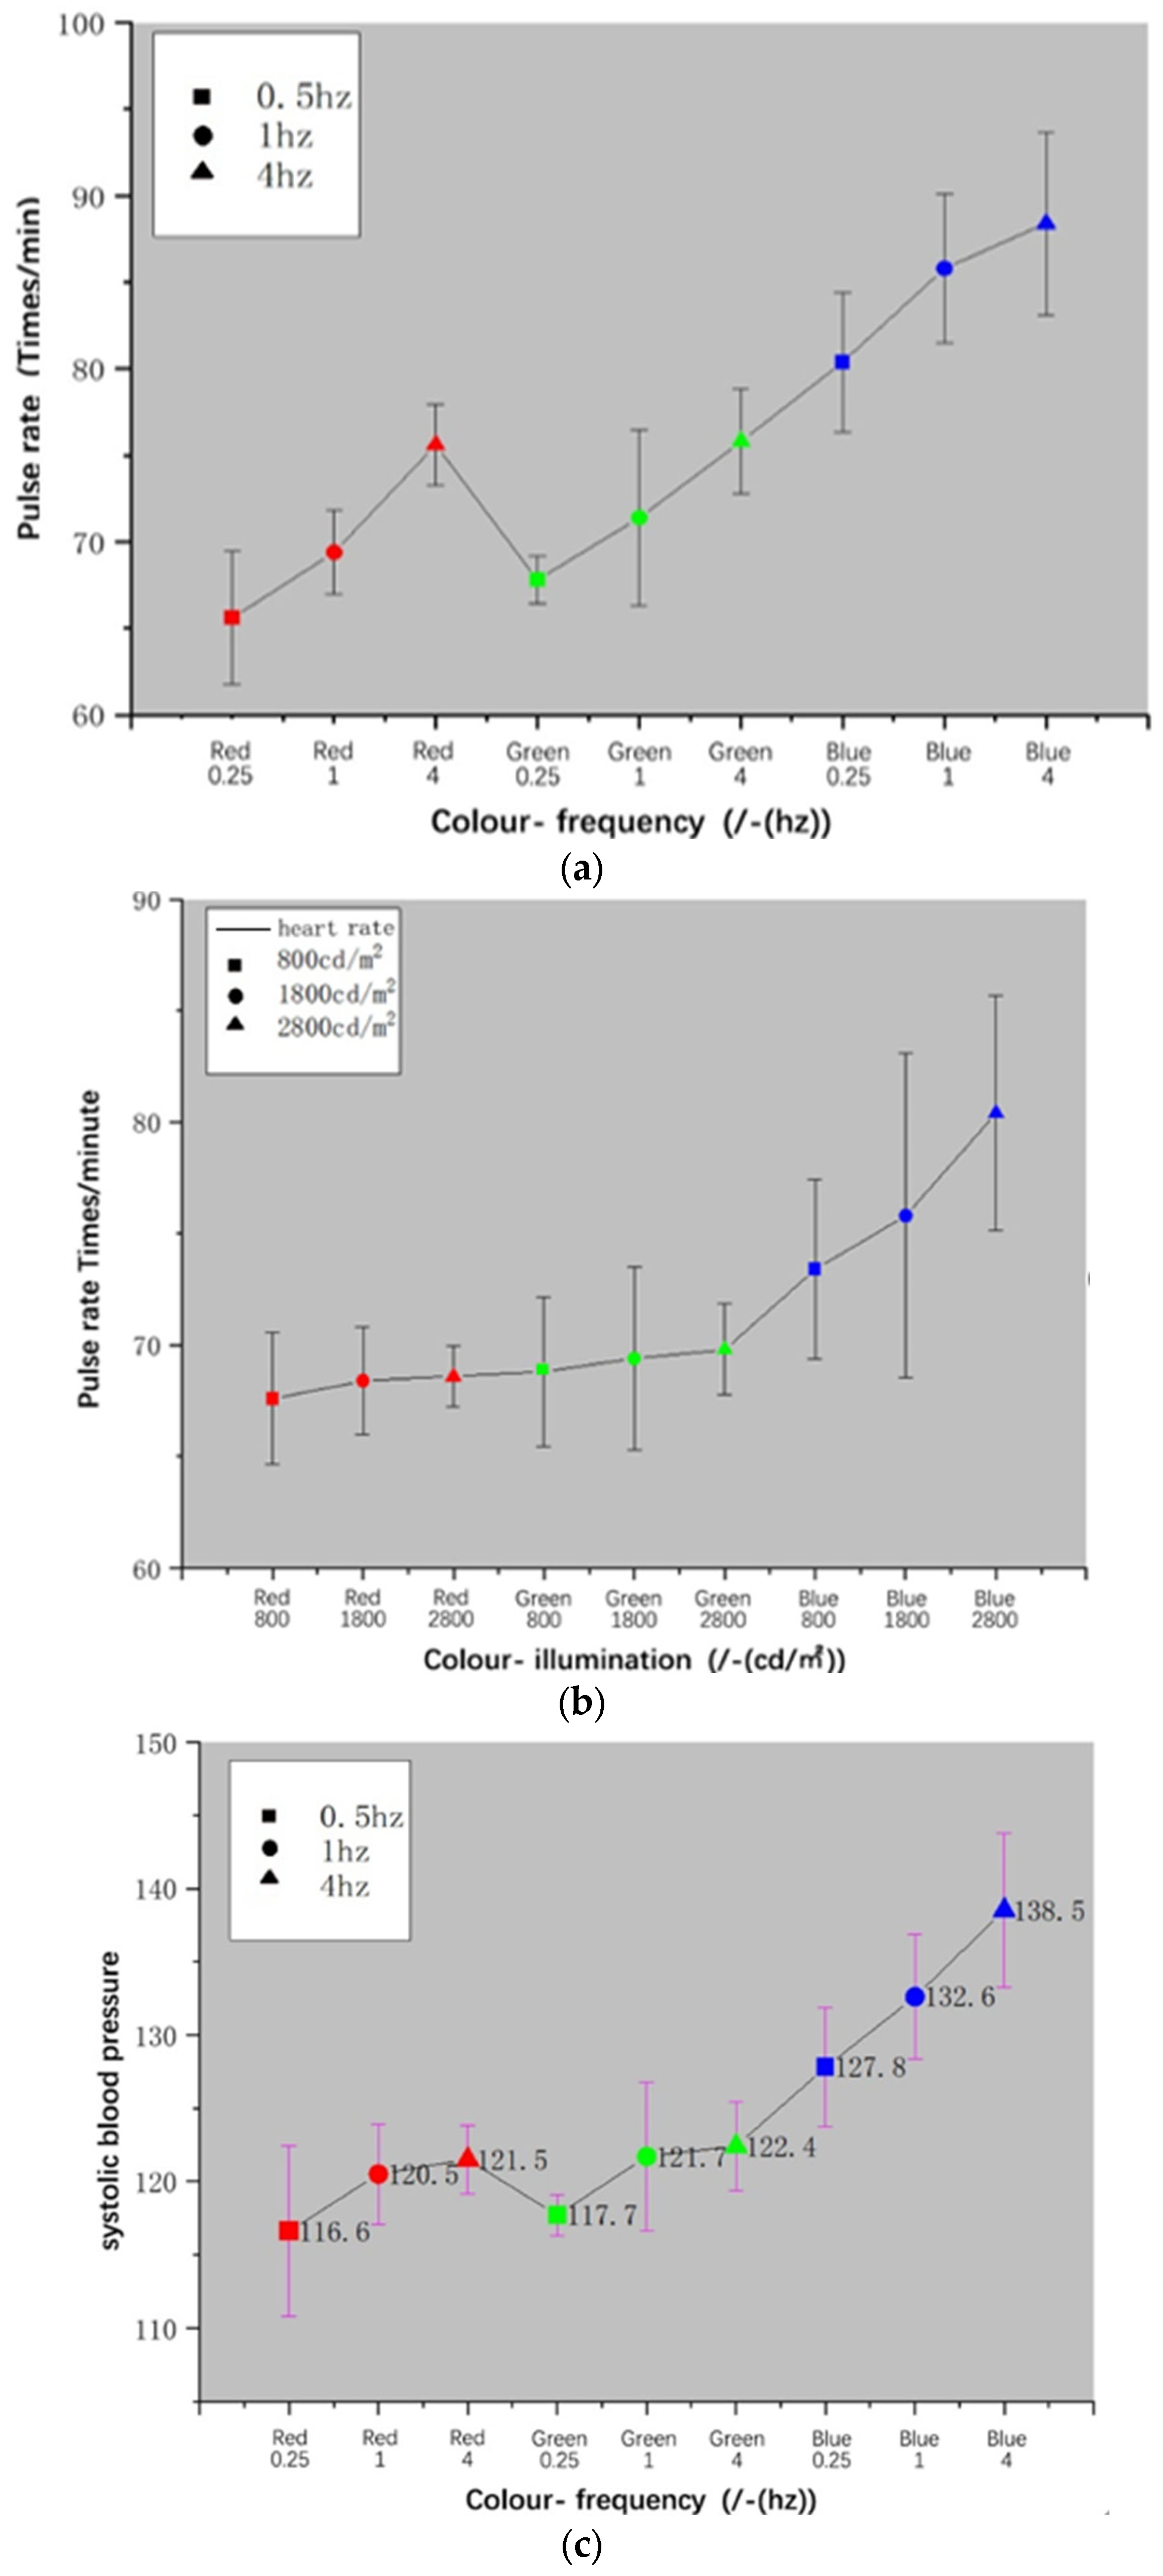
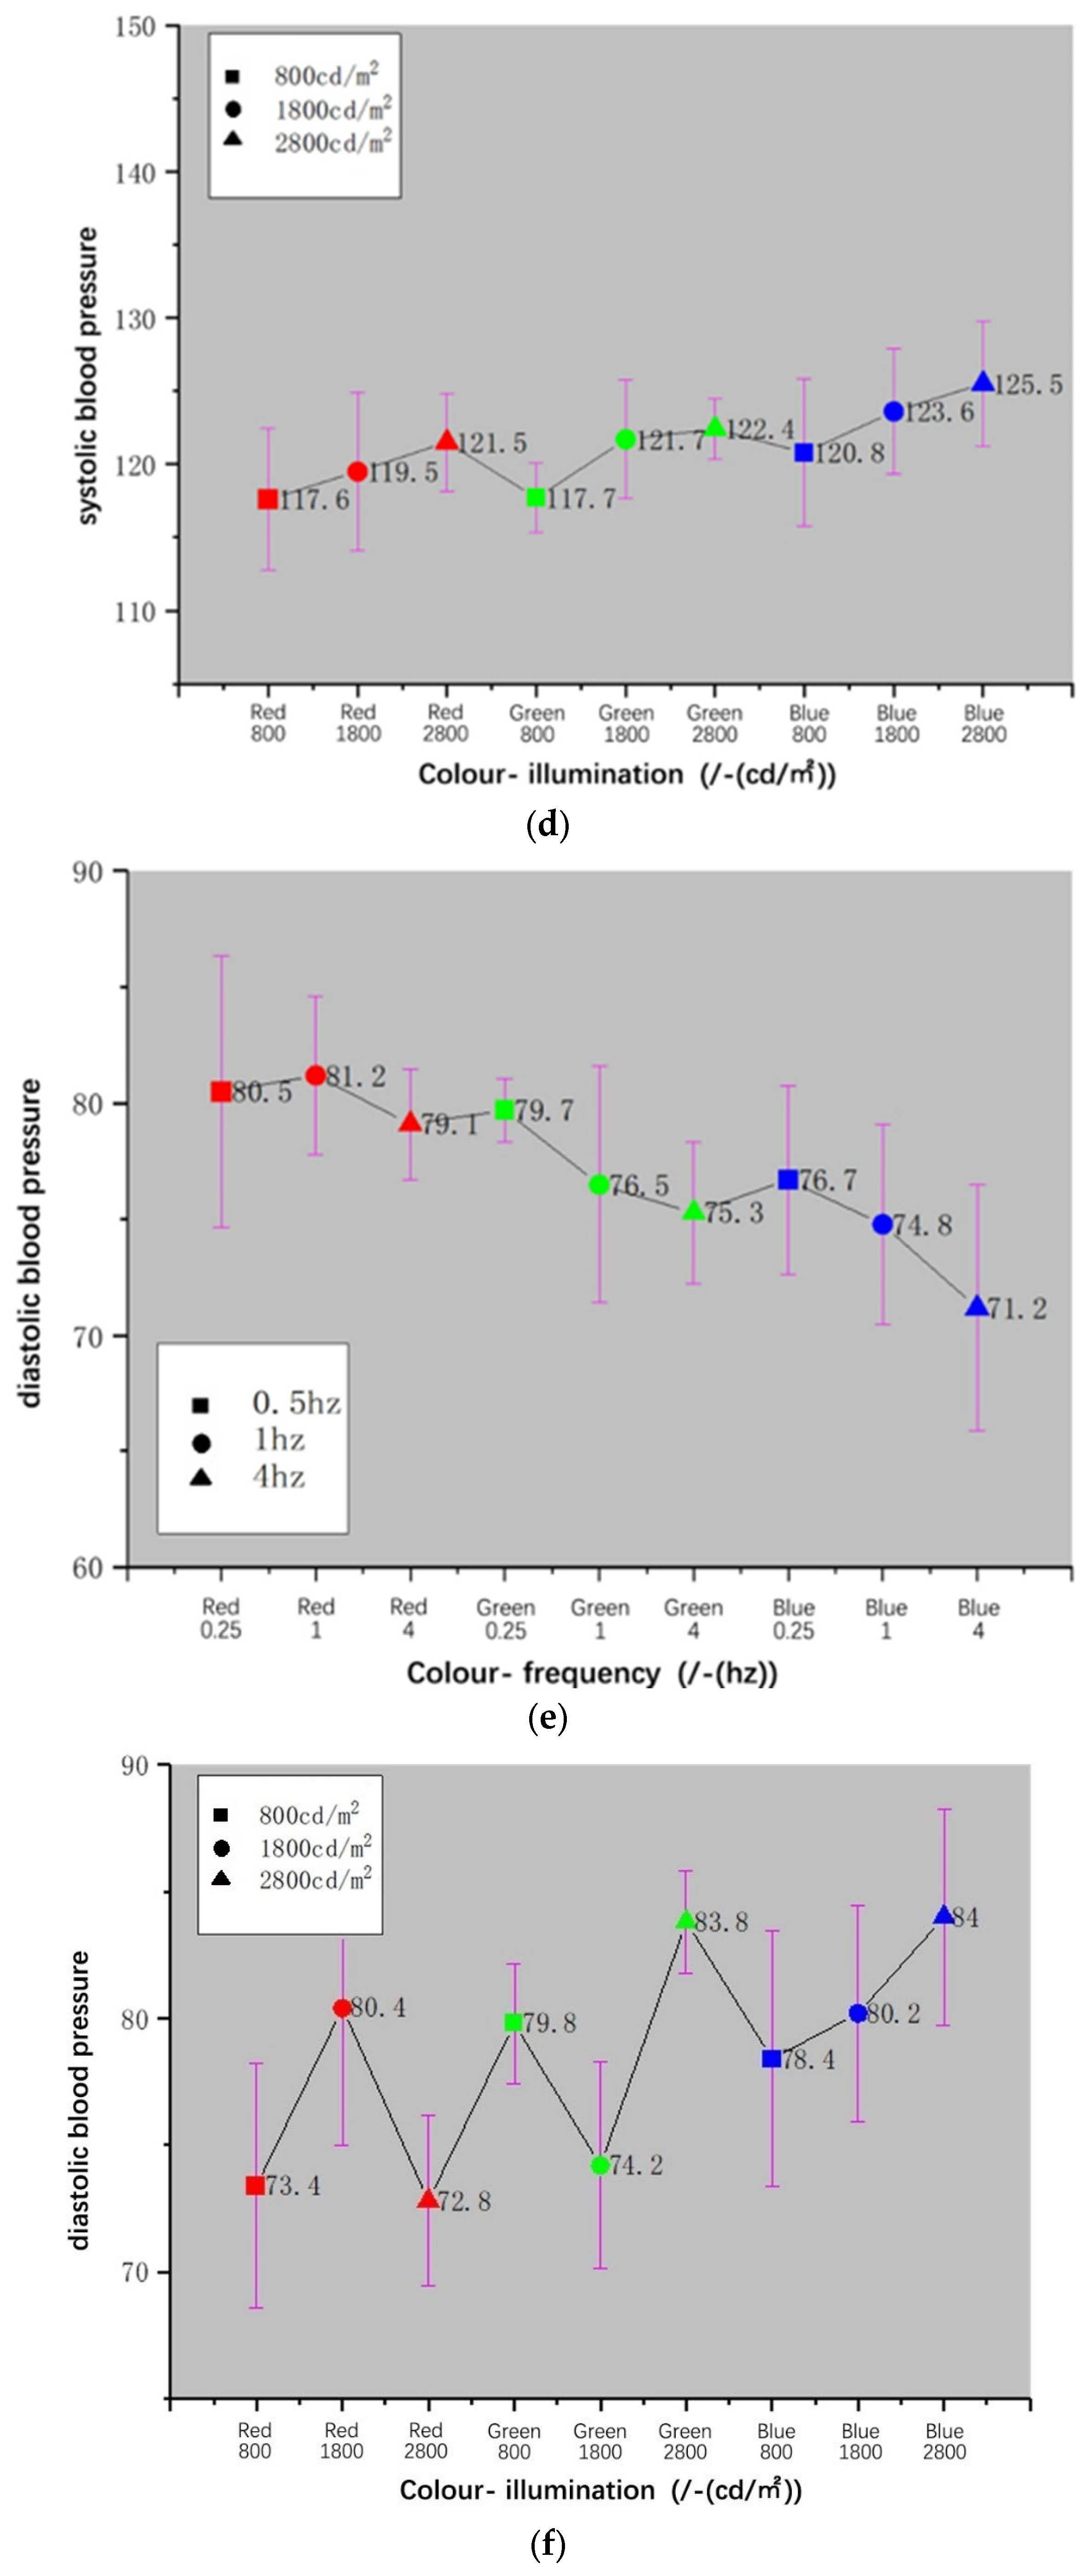
4.1. Analysis of Heart Rate, Blood Pressure, Blood Oxygen, and Good Conductance Values Results

The variations in the subjects’ heart rates, blood pressure, blood oxygen levels, and excellent conductance values during the experiment are shown in Figure 13. The participants were more sedated under low-frequency strobe light, according to a comparison of the participants’ heart rate data, which showed that the individuals under red light at 0.5 Hz had the lowest heart rate values and the subjects under blue light at 2800 Hz had the highest heart rate values. Figure 13a,b show the same color under different strobe conditions, the heart rate value shows a similar trend overall, with the heart rate value showing an upward trend as the strobe increases, and the light source’s wavelength decreases; in the same color conditions, the heart rate value still shows a stable upward trend as the light source’s brightness increases, but in the red light source, the heart rate value does not change much as the brightness increases. The slight variation in heart rate values between blue and green could be attributed to the shorter and closer wavelengths of the two colors. There is no significant impact of inter-experimental variations in heart rate between brightness and frequency, as shown by the covariance analysis: F frequency = 1.348, p = 0.254 > 0.05; F brightness = 0.536, p = 0.478 > 0.05.
The systolic pressure in the red-light group is significantly lower than that in the blue-light group, as shown in Figure 13c–f. However, the diastolic pressure is significantly higher in the red-light group than in the blue-light group, indicating that short wavelengths of light cause an increase in pulse pressure. There was a negative correlation between diastolic blood pressure and frequency, and a positive correlation between systolic blood pressure and frequency. Nevertheless, there was no discernible change in either luminance value. From the analysis of covariance: F color = 0.418, p = 0.659; F frequency = 1.317, p = 0.271; F brightness = 1.182, p = 0.309 (systolic blood pressure); F color = 0.768, p = 0.466; F stroboscopic = 1.245, p = 0.291; F luminance = 0.969, p = 0.381 (diastolic blood pressure); therefore, for the experiment there was no significant effect of the difference between systolic and diastolic blood pressure and color, strobe, and luminance between the experiments.
This study aimed to investigate the impact of various lighting environments on the physiological parameters of the human body. To achieve this, the TCM Meridian Sub-health Detector was employed to evaluate the physiological responses by measuring the 24 good conductance current values of participants. The box plots presented in Figure 13g,h illustrates the variations in good conductance current values among subjects. The findings indicate that exposure to green and blue intrusive light results in higher good conductance values compared to red intrusive light. This suggests that short-wavelength intrusive light enhances the autonomic excitability of the human body. Furthermore, in the same color of interfering light, an increase in frequency resulted in a gradual increase in human BLC (body conductance level) values, suggesting that faster interfering light strobes amplify human excitability. Similarly, under consistent strobe conditions, an increase in brightness also leads to a gradual increase in the BLC value, suggesting that higher brightness levels enhance human excitability. The average results across the nine experimental conditions were analyzed using the extreme difference method, as summarized in Table 8. The findings reveal that the order of influence on good conductance values is as follows: strobe > color > brightness. Covariance analysis yielded an initial F value of 1587.703 (p = 0.000), F for color at 5.410 (p = 0.006 < 0.01), F for frequency at 8.386 (p = 0.000 < 0.01), and F for brightness at 2.359 (p = 0.096). Consequently, after accounting for the significant difference in the initial value, it is evident that both color and frequency exert a significant influence over good conductance values, while brightness has an effect that is not statistically significant.

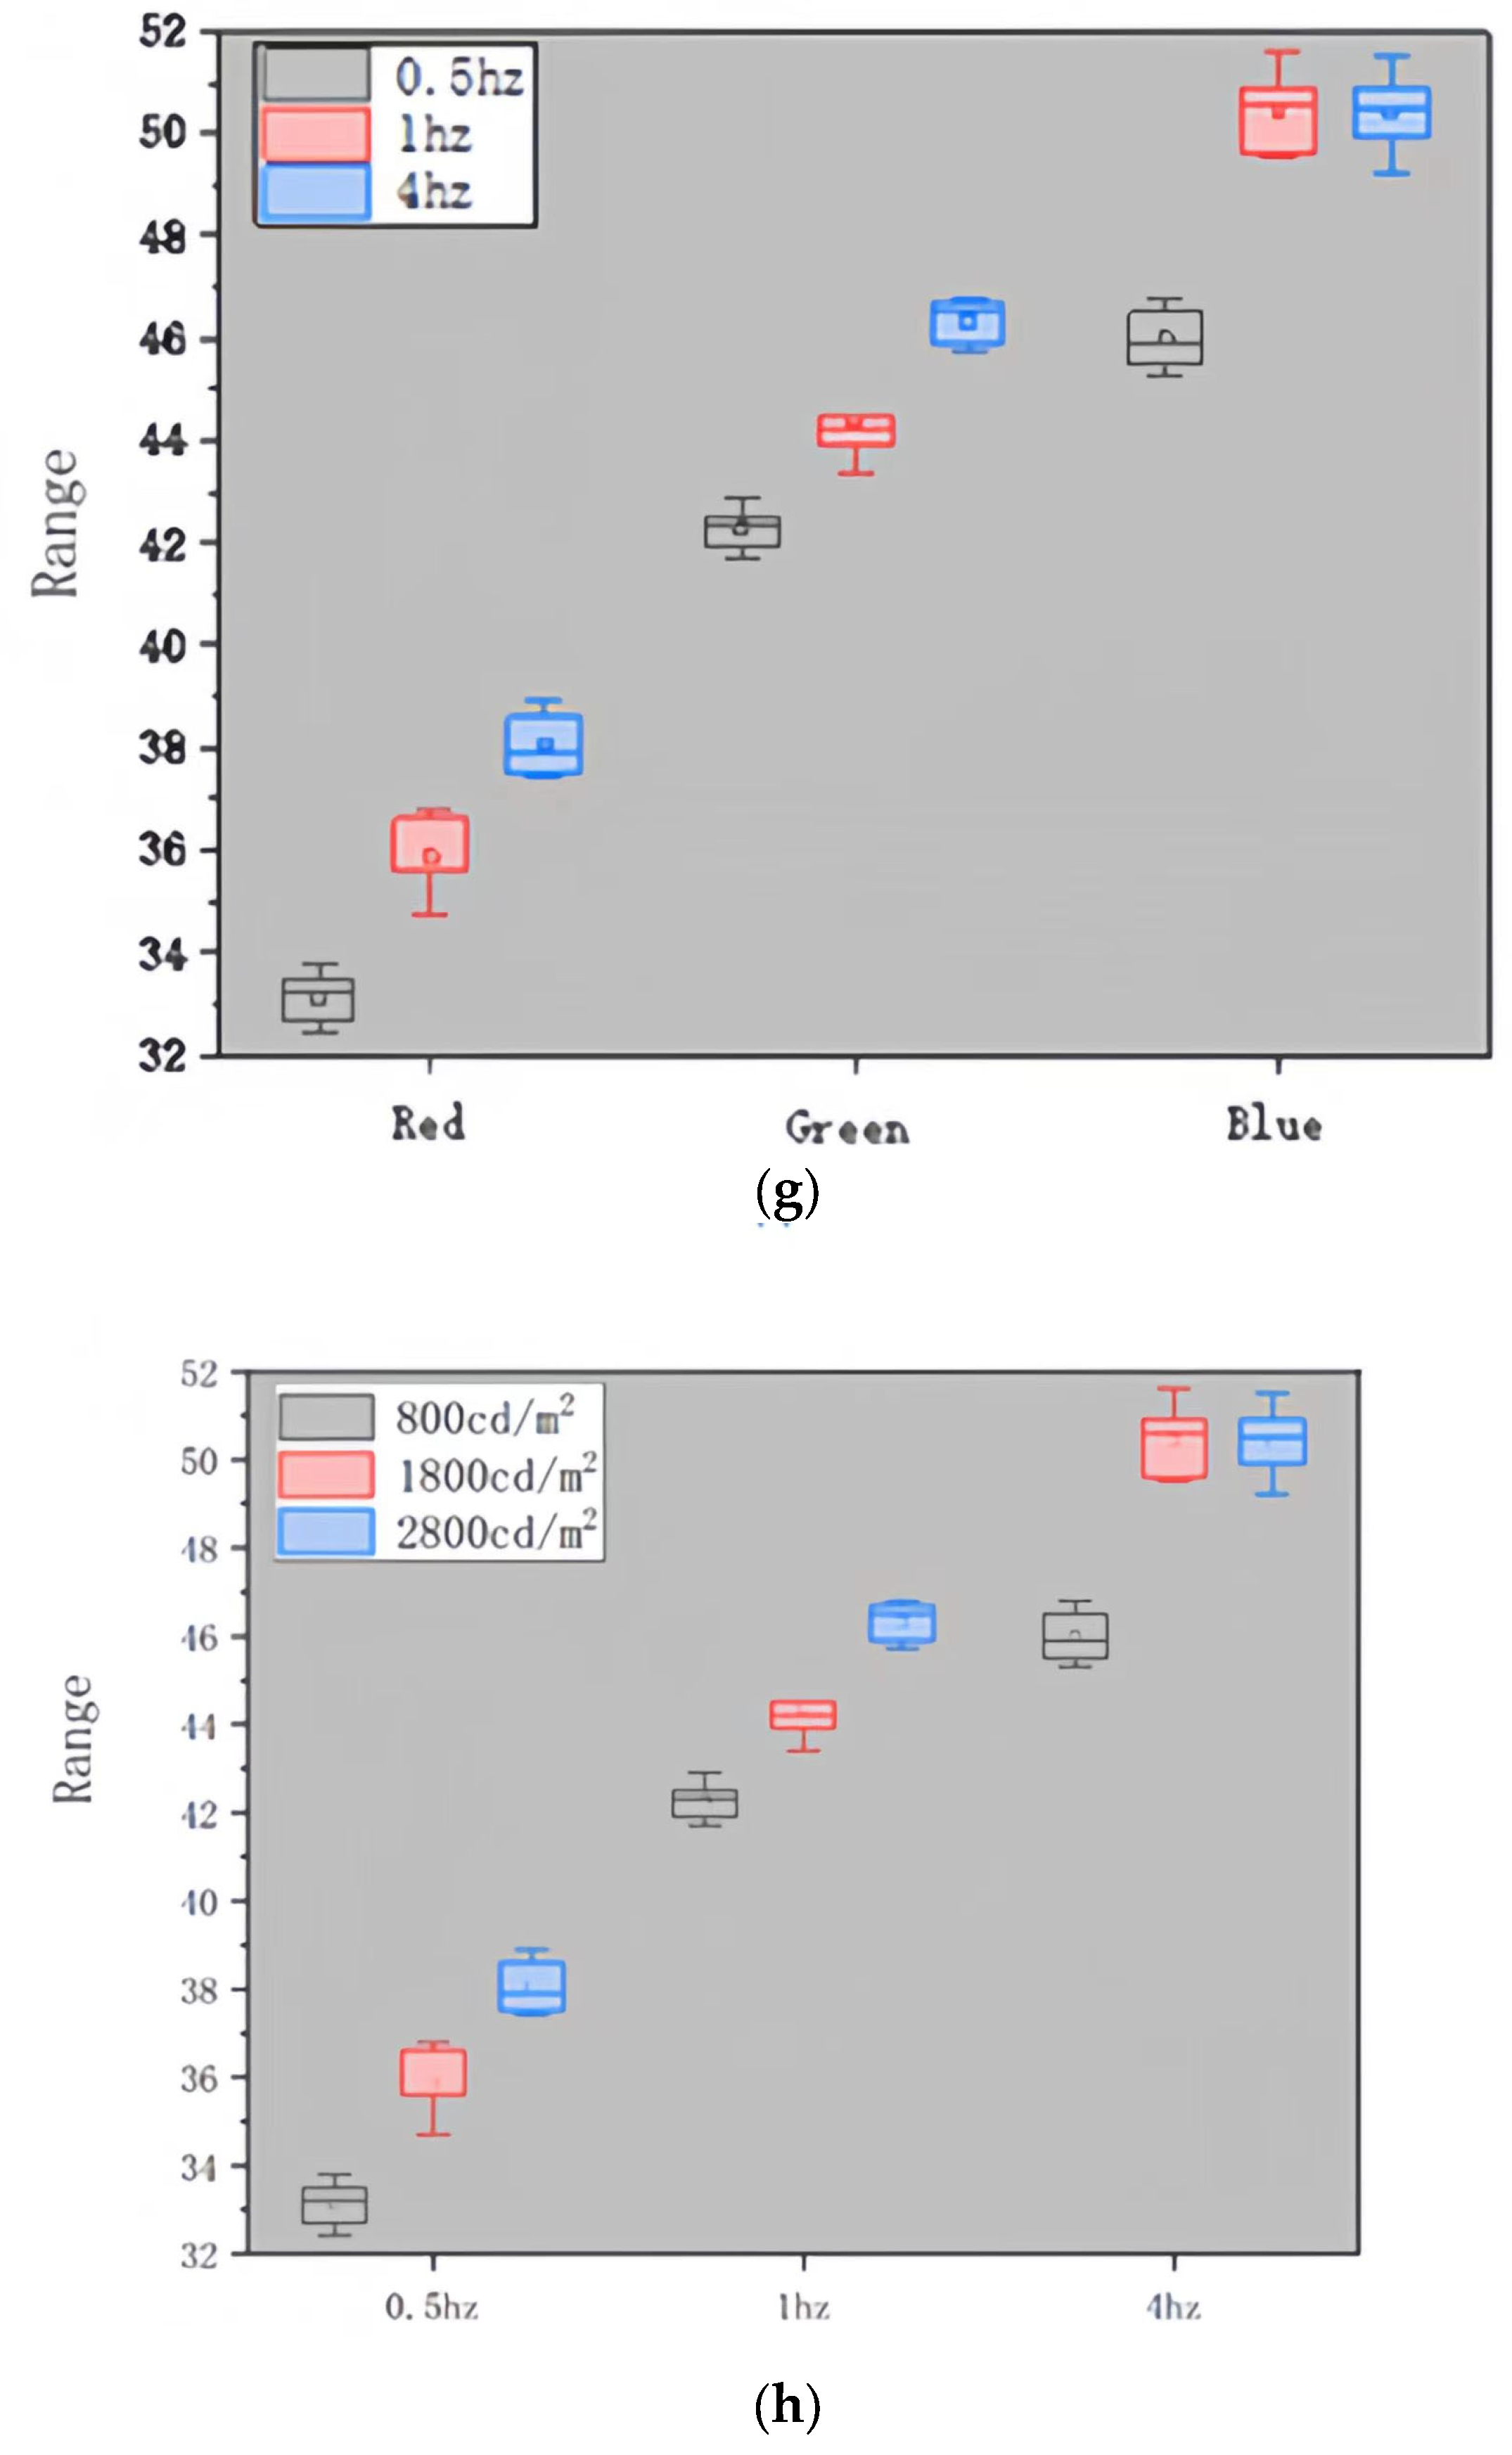
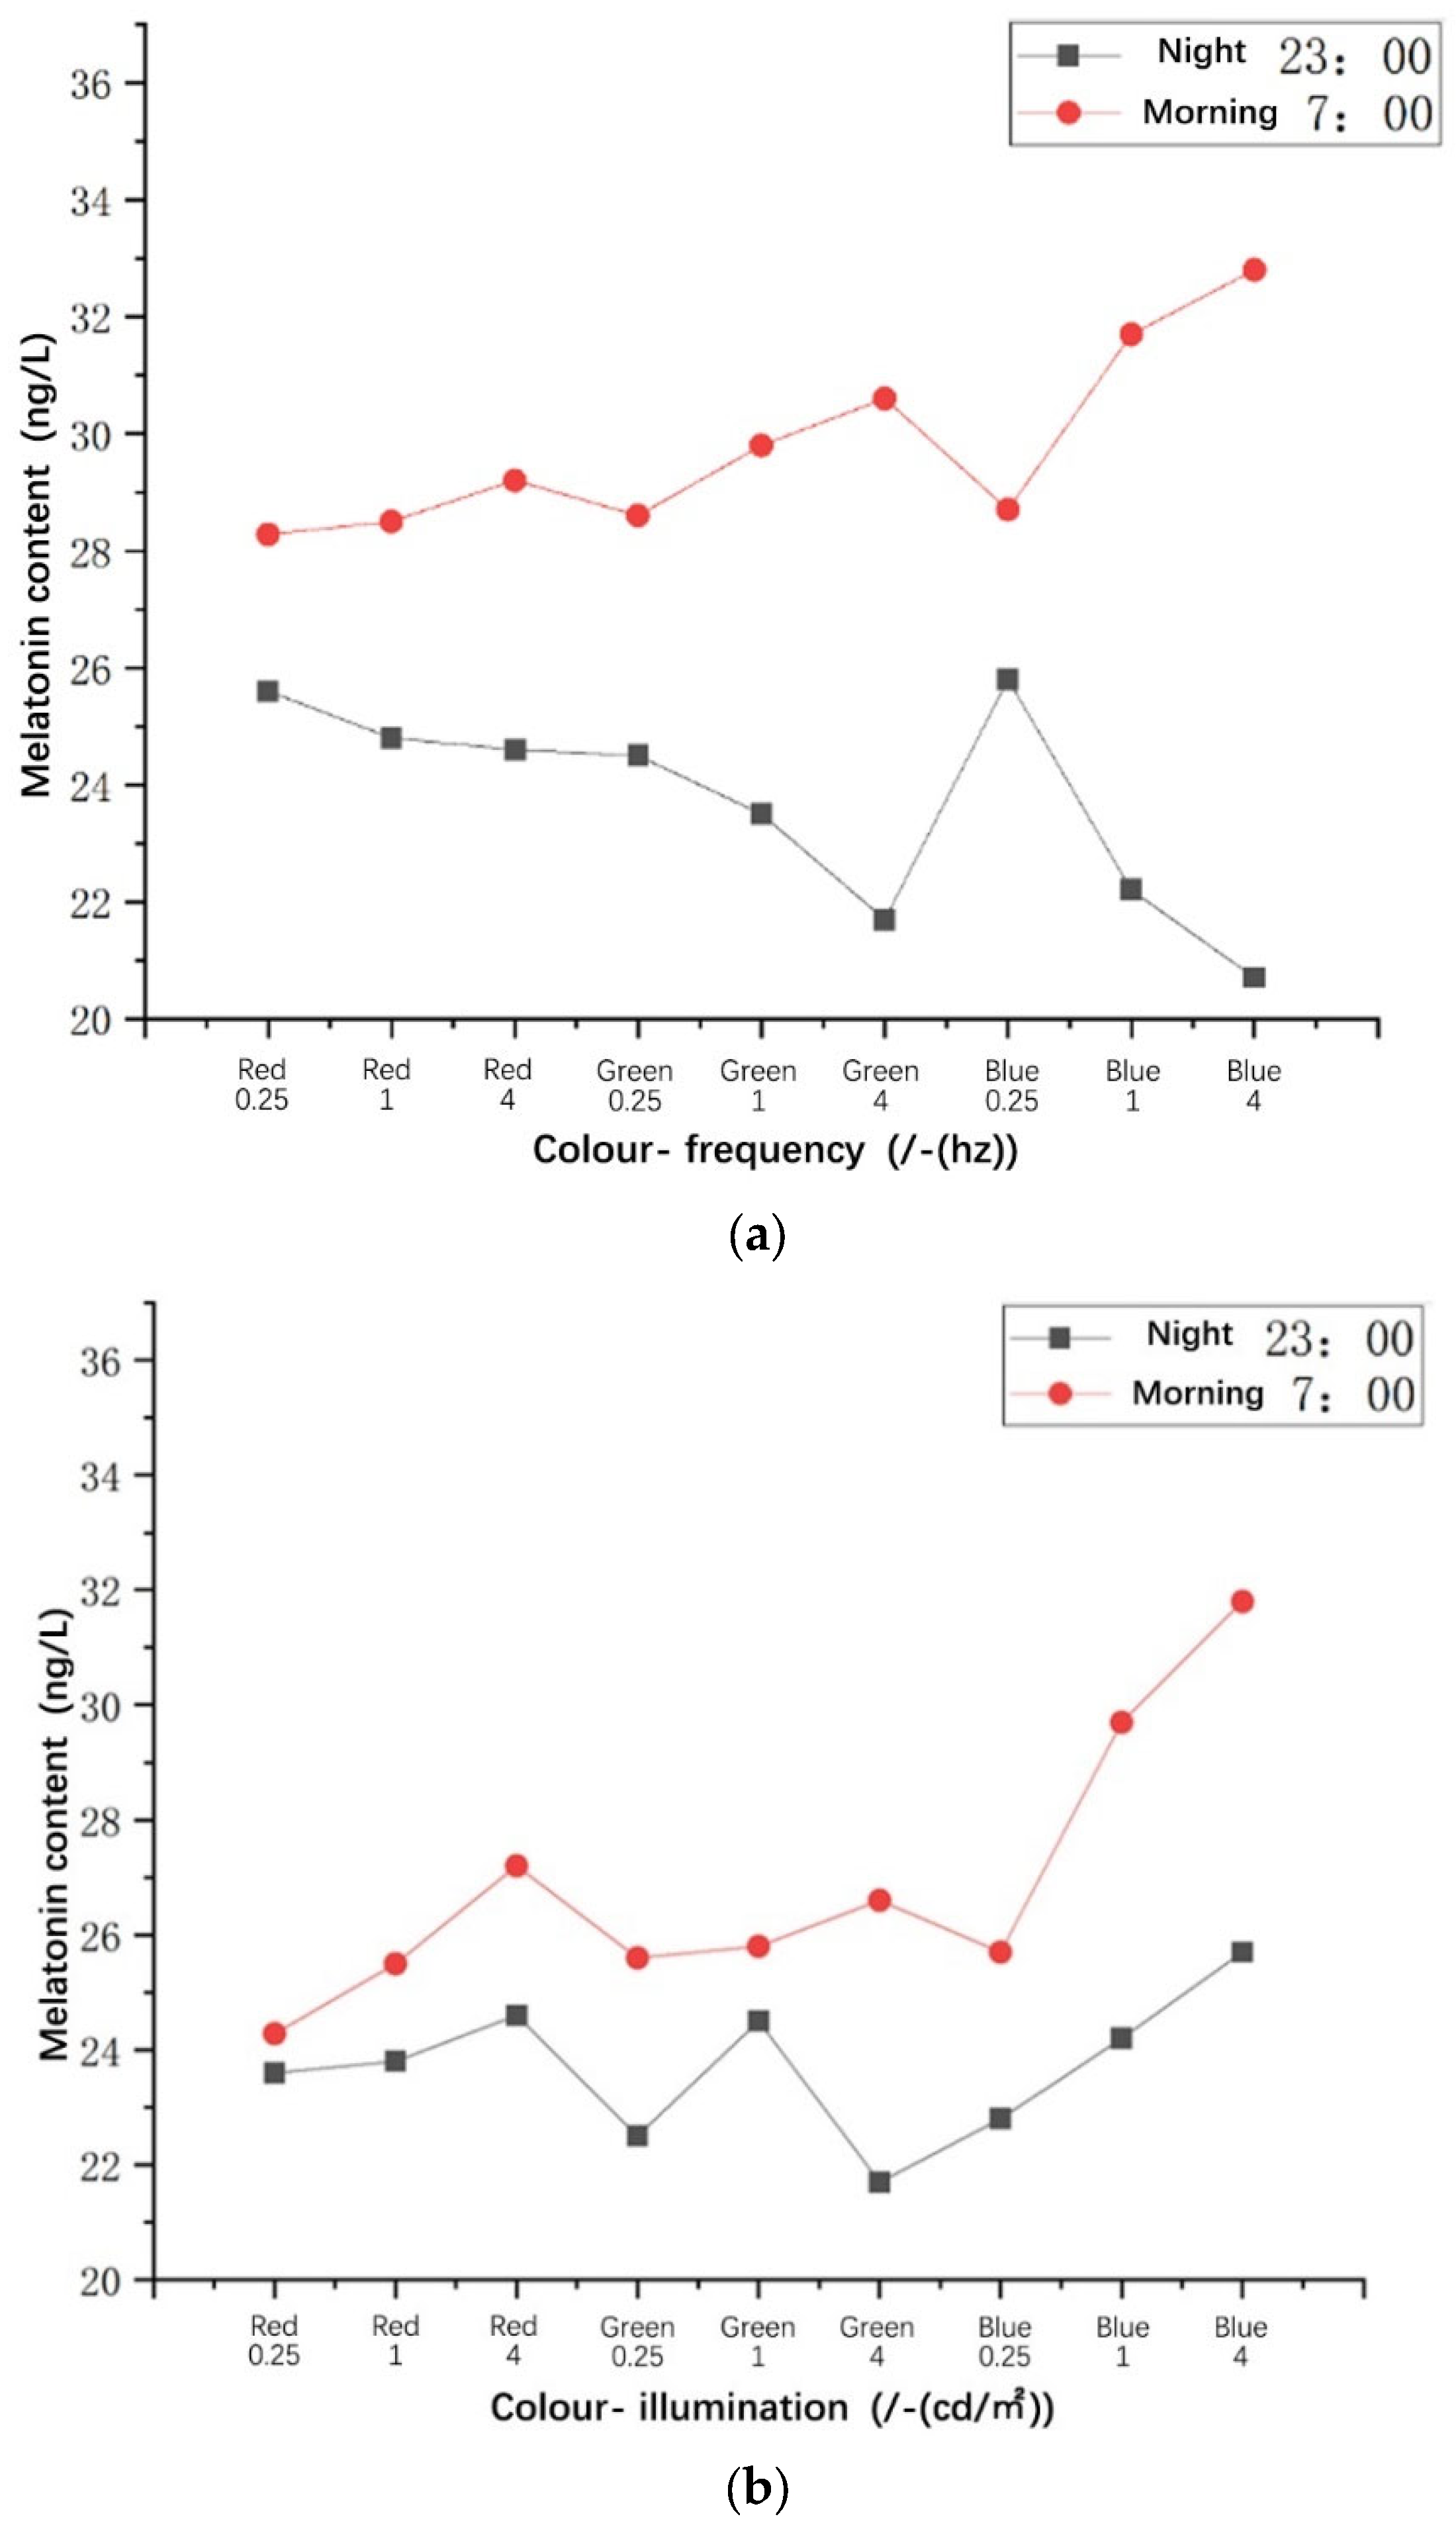
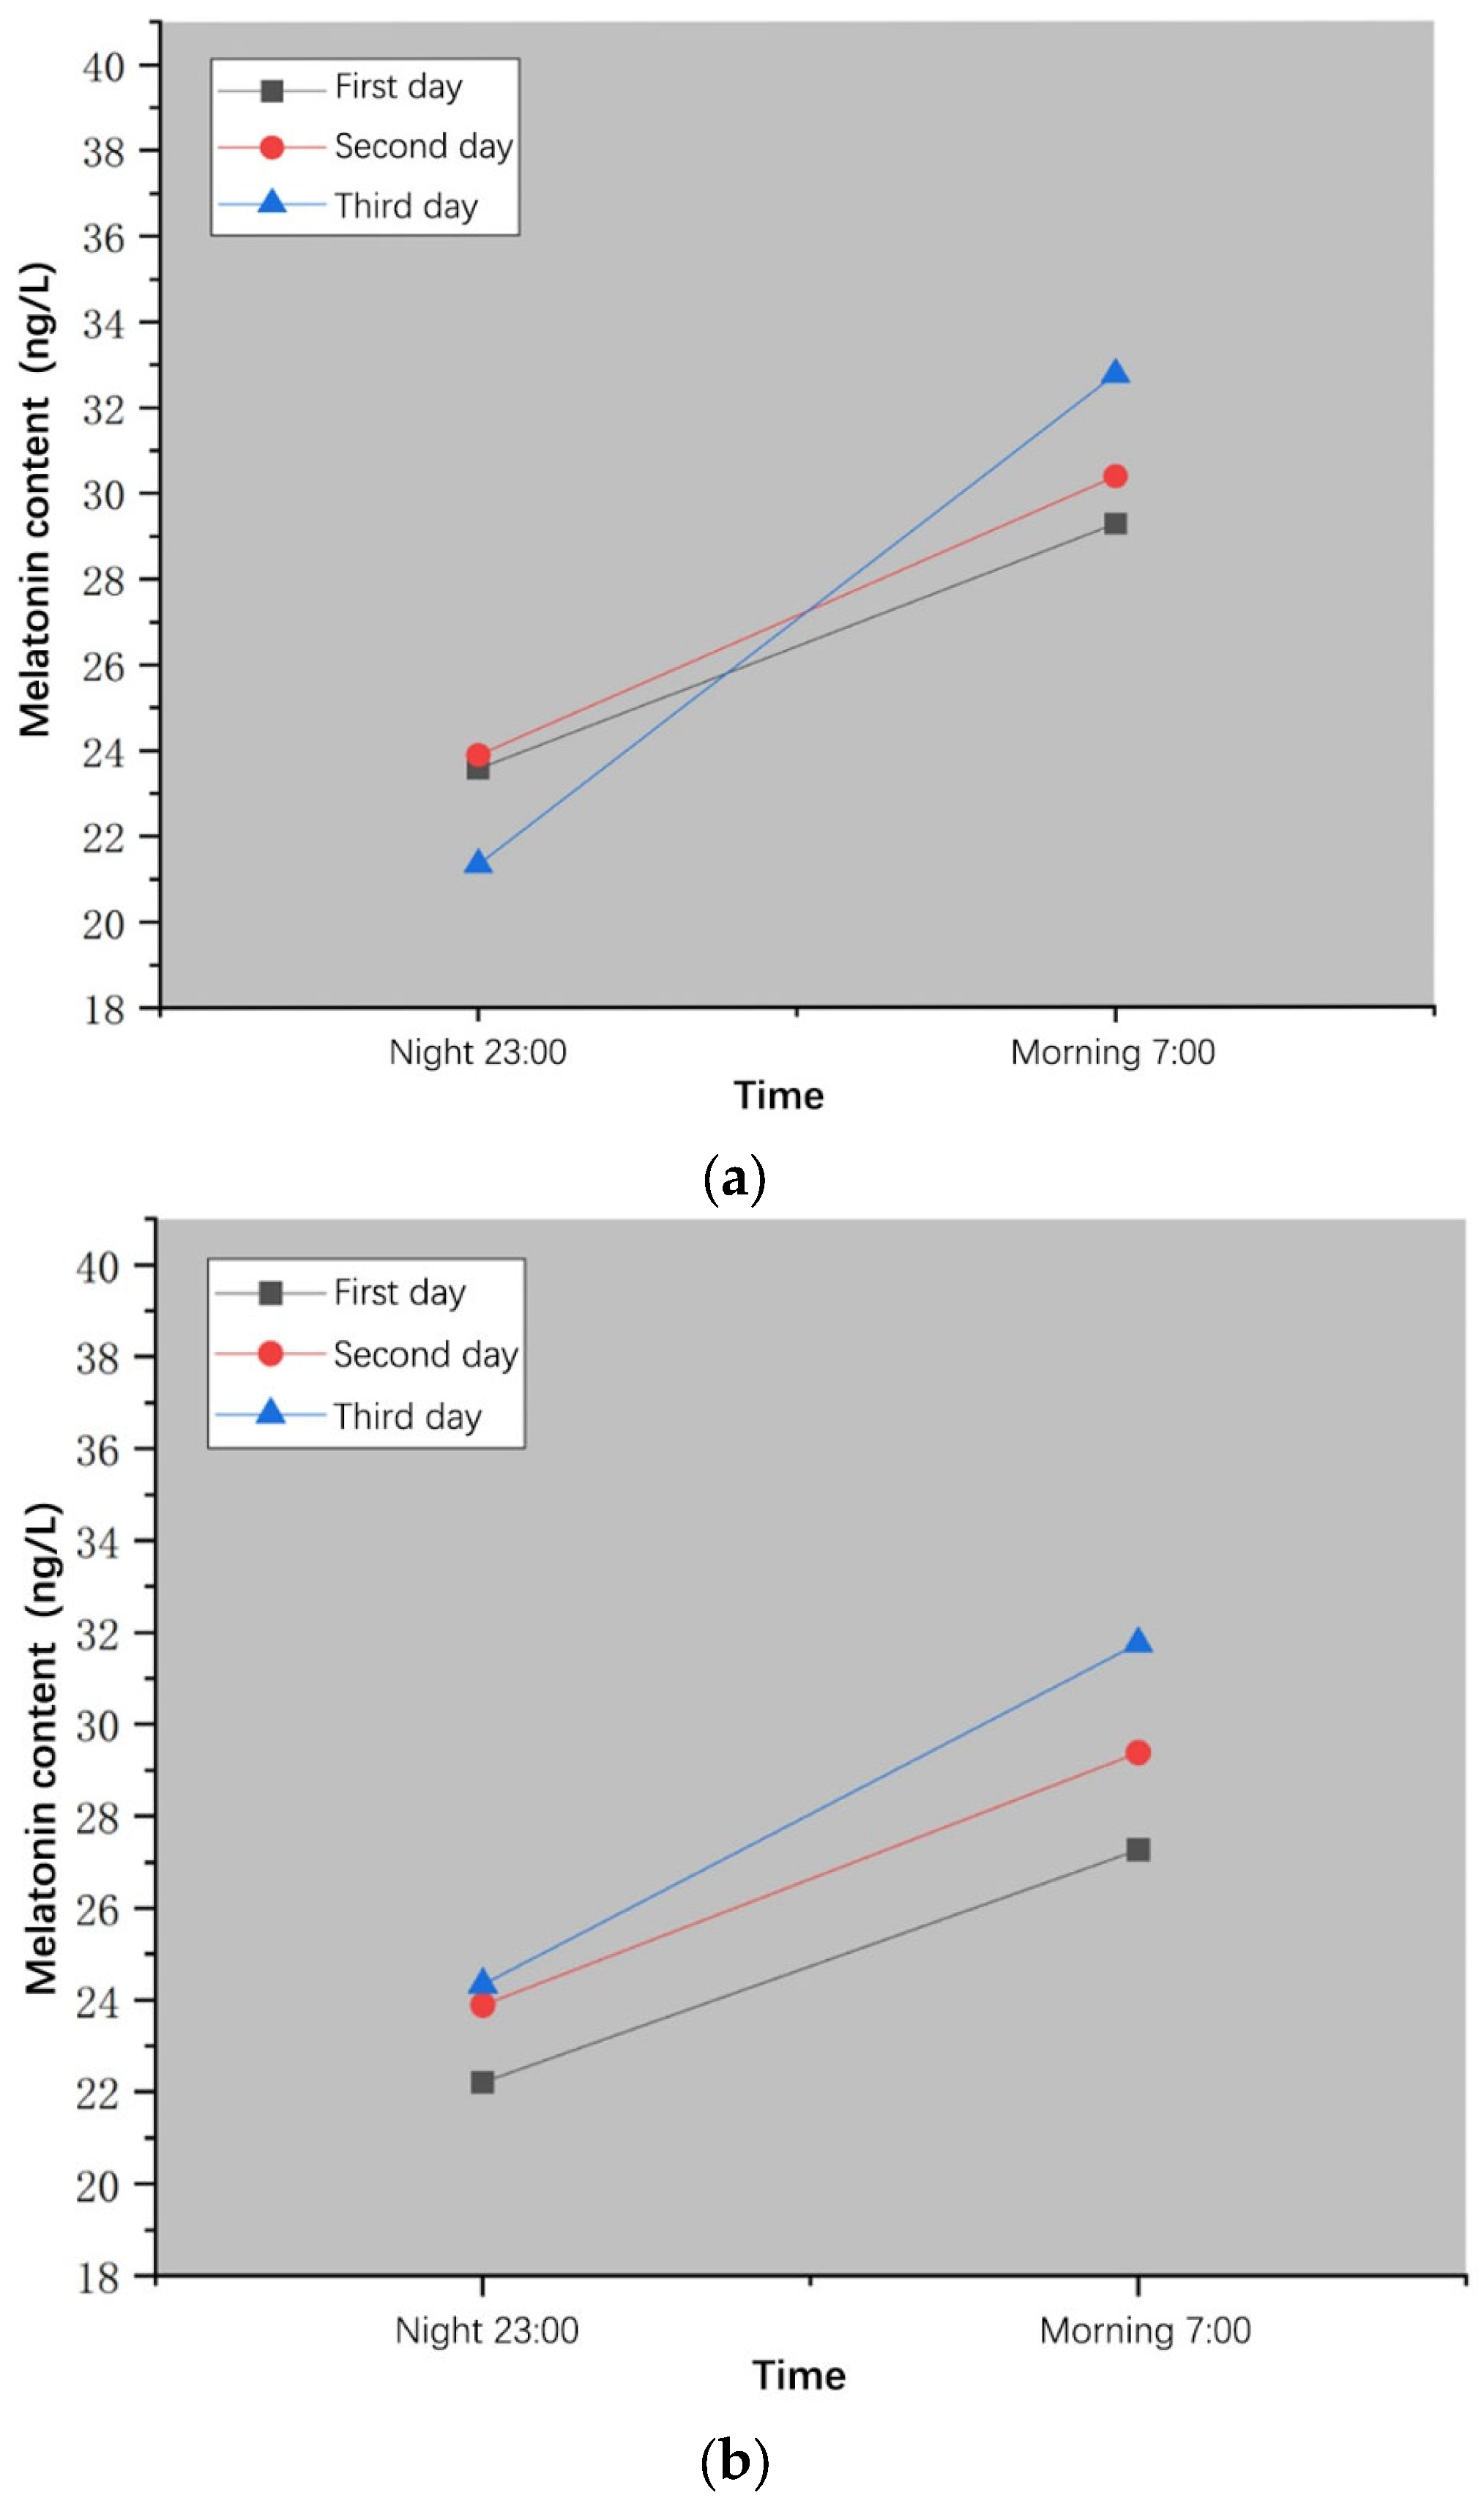
4.2. Analysis of the Physiological Values of the Good Conductor

The pineal gland in the brain secretes melatonin, one of the most significant indicators of circadian rhythms and the most crucial factor in identifying the phase change of the body’s rhythms. A drop in melatonin levels results in alertness, whereas the pineal gland’s production of melatonin causes slumber. Melatonin levels can therefore reveal a person’s propensity for either wakefulness or sleepiness.
Both experiments involved saliva collection and testing of salivary melatonin concentrations at fixed time points before and after the subjects’ sleep. A total of 36 saliva samples were collected in the first experiment and 48 saliva samples were collected in the second experiment.
Figure 14 shows the changes in melatonin content in the morning and evening of the subjects in the first experiment. As can be seen in Figure 14a, under the condition of different stroboscopic flashes of the same color, with the increase in stroboscopic flashes, the melatonin content of the subjects before going to bed showed a decreasing trend, and the melatonin content of waking up showed an increasing trend; under the condition of different luminance of the same color, with the increase in luminance, the melatonin content of the subjects before going to bed showed a decreasing trend, and the melatonin content of waking up showed an increasing trend. The stroboscopic factor in continuous night light inhibits human melatonin secretion and delays human melatonin secretion, which leads to circadian rhythm phase shift and an overall backward delay, so that the sleep time point of the human night is delayed, and the natural waking up time in the morning is delayed. In addition, the blue light and the green light have a greater impact on the human circadian rhythm phase shift, but there is not a big difference between the blue light and the green light, while under the red light, compared with the blue light and the green light, human melatonin secretion appeared to be smoother and values did not fluctuate significantly. Brightness factor in the continuous light before bedtime will inhibit human melatonin secretion, so that human melatonin secretion is delayed, which leads to circadian rhythm phase shift, an overall backwards delay, so that the person’s sleep time point at night is delayed, and the natural waking up time in the morning is delayed. In addition, the same is true for the color factor compared to the brightness factor whereby the human body’s circadian rhythm phase shift produces a greater impact, but the difference between the blue light and the green light is not significant. In contrast, in the red light human melatonin secretion appeared to be smoother, and the values did not fluctuate significantly. From the analysis of covariance, F color = 0.858, p = 0.576; F strobe = 1.145, p = 0.331; F brightness = 0.879, p = 0.361; therefore, the differences in melatonin between experiments had no significant effect on the color, strobe, and brightness.
Figure 15 shows a graph of the changes in melatonin content in the morning and evening of the subjects in the second experiment. Comparison of the salivary melatonin content at 23:00 on the first day under pure dark conditions and at 7:00 a.m. on the second day revealed that the melatonin content of the saliva samples collected at 11:00 p.m. on the second day in the evening, when unaffected by the light source, was roughly the same as that on the previous day, but after a night of dark-light exposure, the salivary melatonin content in the morning increased significantly. Furthermore, the salivary melatonin content at 11:00 p.m. on the third day decreased significantly, indicating that sustained night light inhibits human melatonin secretion, resulting in an affected circadian rhythm. Salivary melatonin was significantly lower at 23:00 on the third day, suggesting that continuous nighttime light exposure suppresses melatonin secretion in humans, leading to a phase shift in circadian rhythms and an overall backward delay. Also, in the two groups of different illumination levels of 5 lx and 10 lx in the sleep environment, the overall trend of the change was the same, but the values did not show a significant difference. It is evident that light has a profound inhibitory effect on melatonin levels and shortens the body’s internal representation of night duration. Thus, exposing oneself to light for prolonged periods late at night disrupts melatonin signaling and may therefore affect sleep, thermoregulation, blood pressure, and glucose homeostasis.

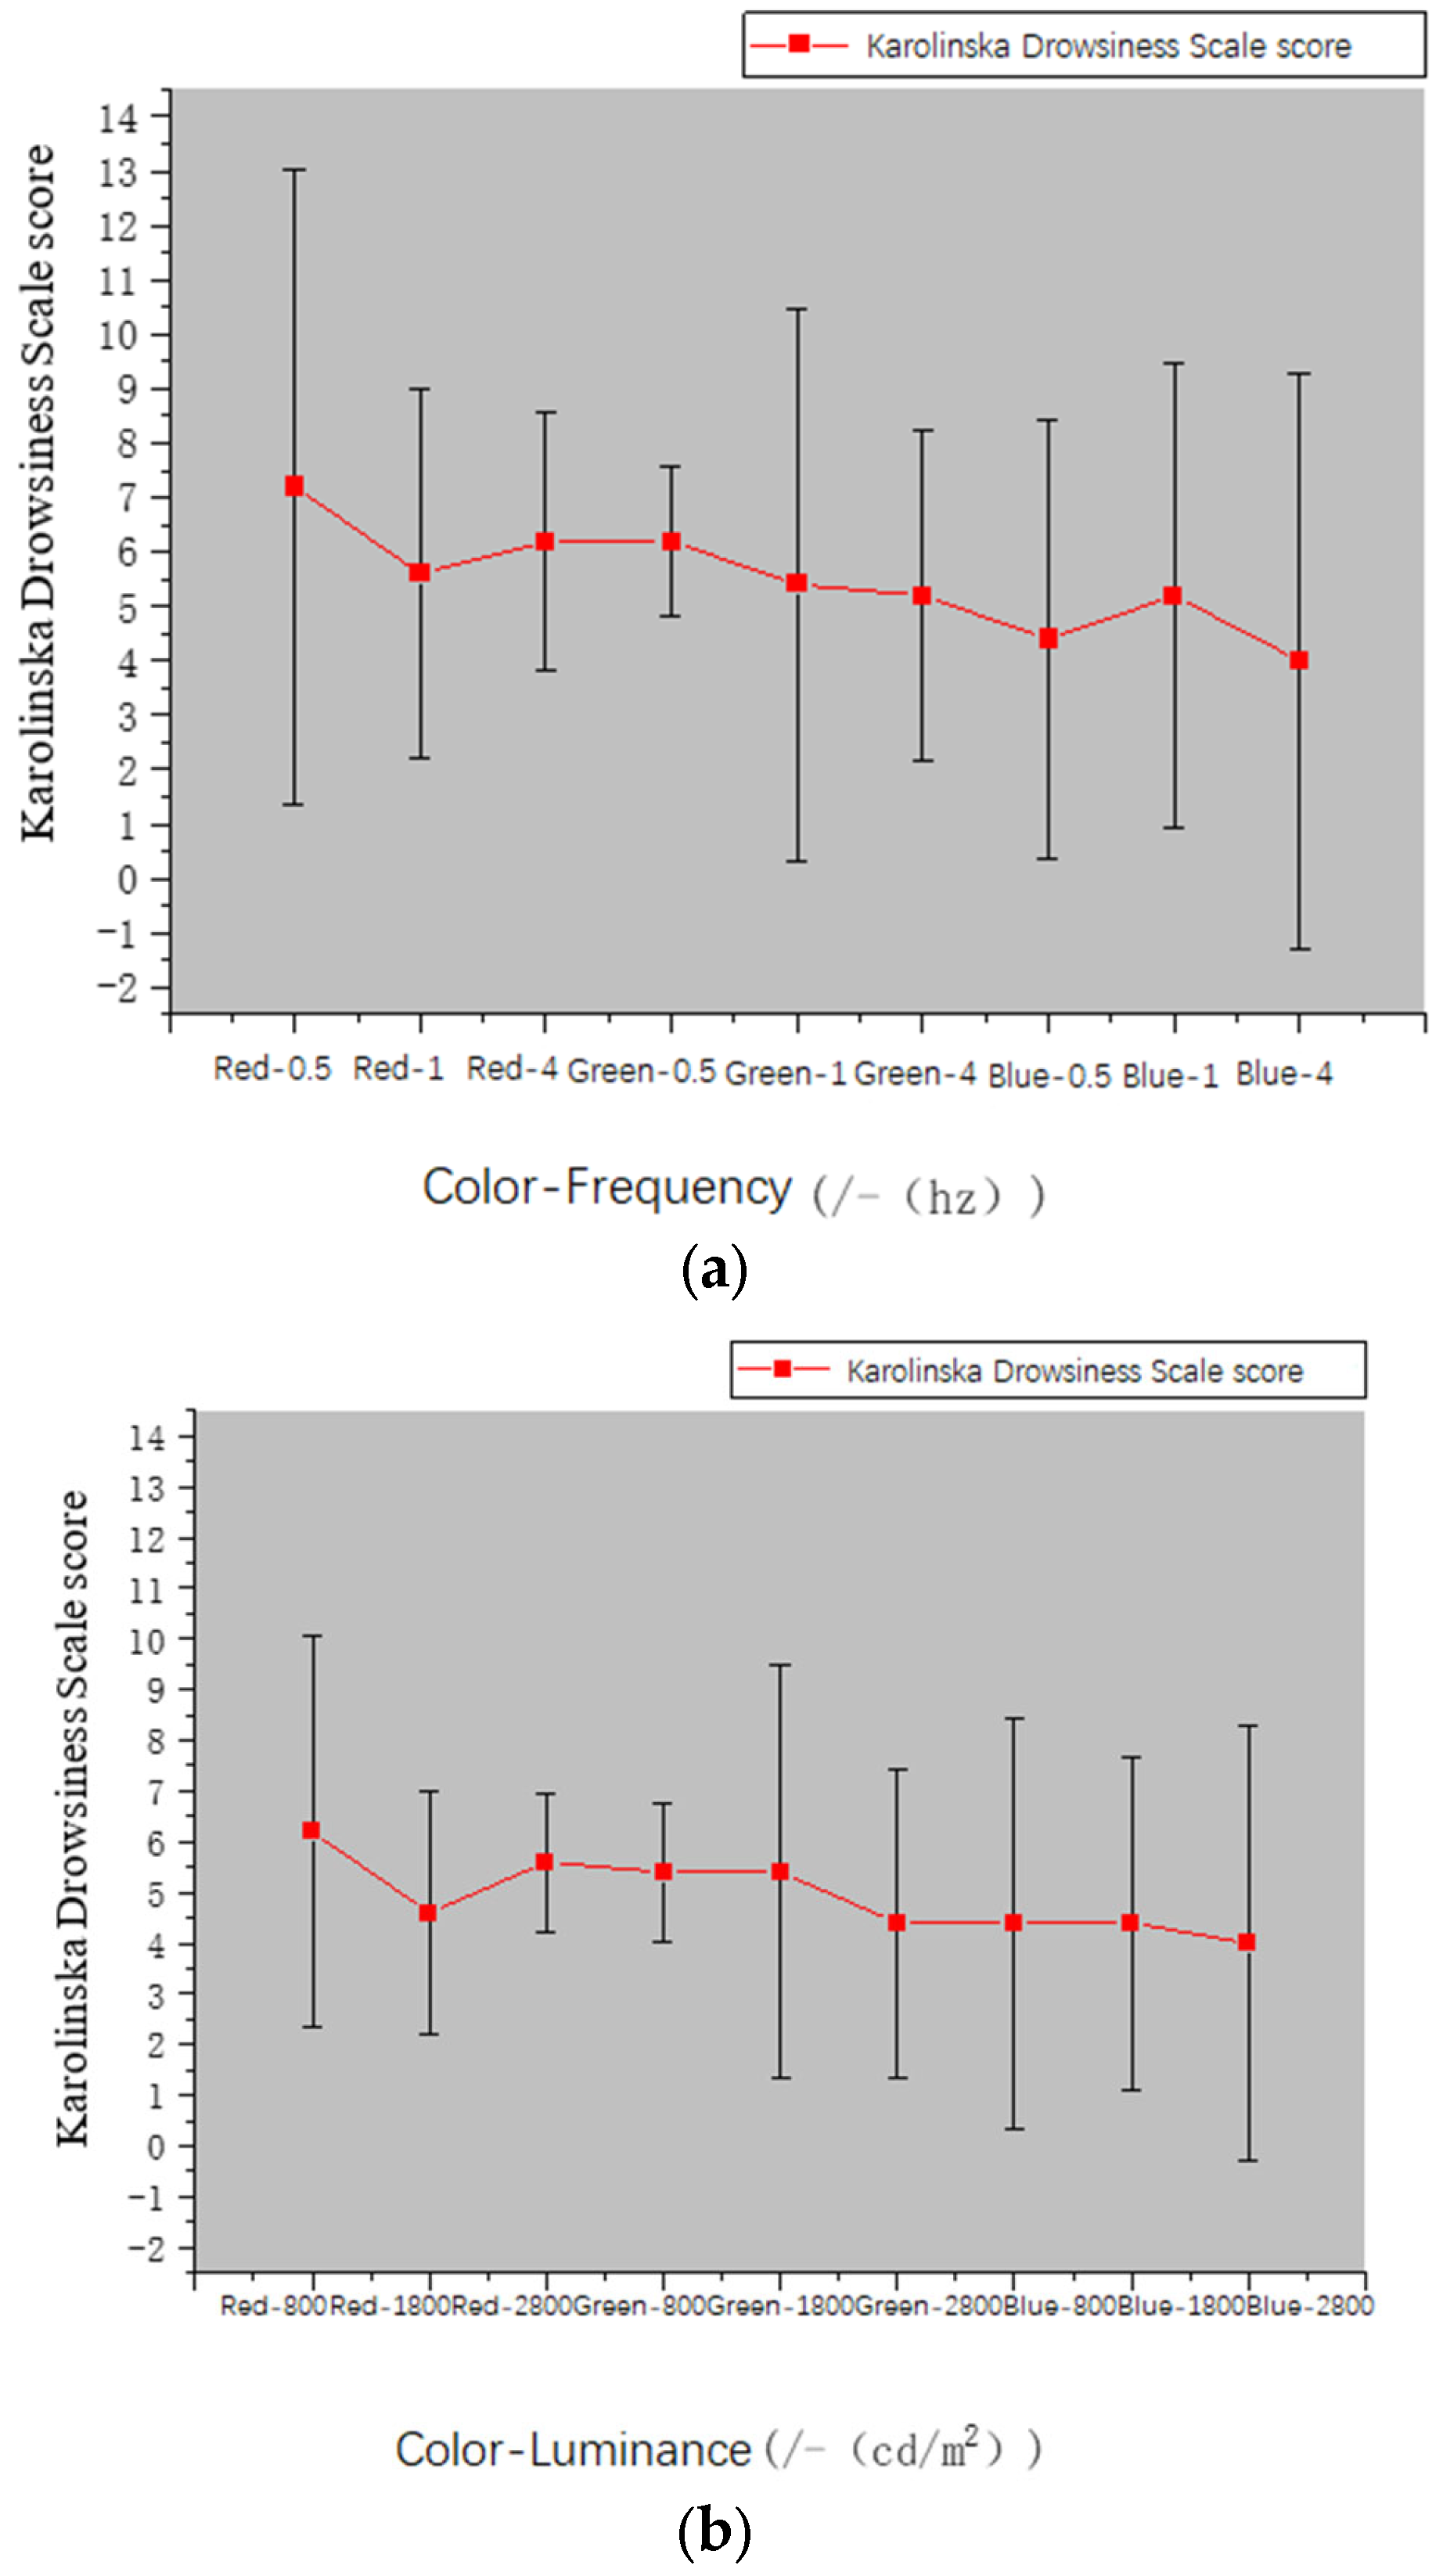
4.3. Subjective Assessment Analysis (KSS Scores)

Figure 16 shows the change in Karolinska’s Sleepiness Scale score. It can be seen that, under the condition of different stroboscopic flashes of the same color, the Karolinska Sleepiness Scale scores show a decreasing trend as a whole; the difference between blue and green is not significant; under the same light source color, the higher the stroboscopic flashes, the lower the scores, which indicates that the frequency is significantly negatively correlated with the Karolinska Sleepiness Scale scores, and that people show a high degree of alertness under the high-frequency stroboscopic flashes; under the condition of the same light source color, the scores still show a steady increasing trend with the increase in light source brightness, which indicates that the high brightness increases the alertness. It is worth mentioning, however, that under the same light source color condition, with the increase in light source brightness, the scores still showed a stable upward trend, indicating that high brightness would increase people’s alertness; however, it is worth mentioning that the blue light source was more alert than the red light source. The analysis of covariance shows that F frequency = 1.458, p = 0.344 > 0.05; F brightness = 0.676, p = 0.548 > 0.05; therefore, there is no significant effect of illumination and frequency on the differences in the Karoska Drowsiness Scale scores between experiments.

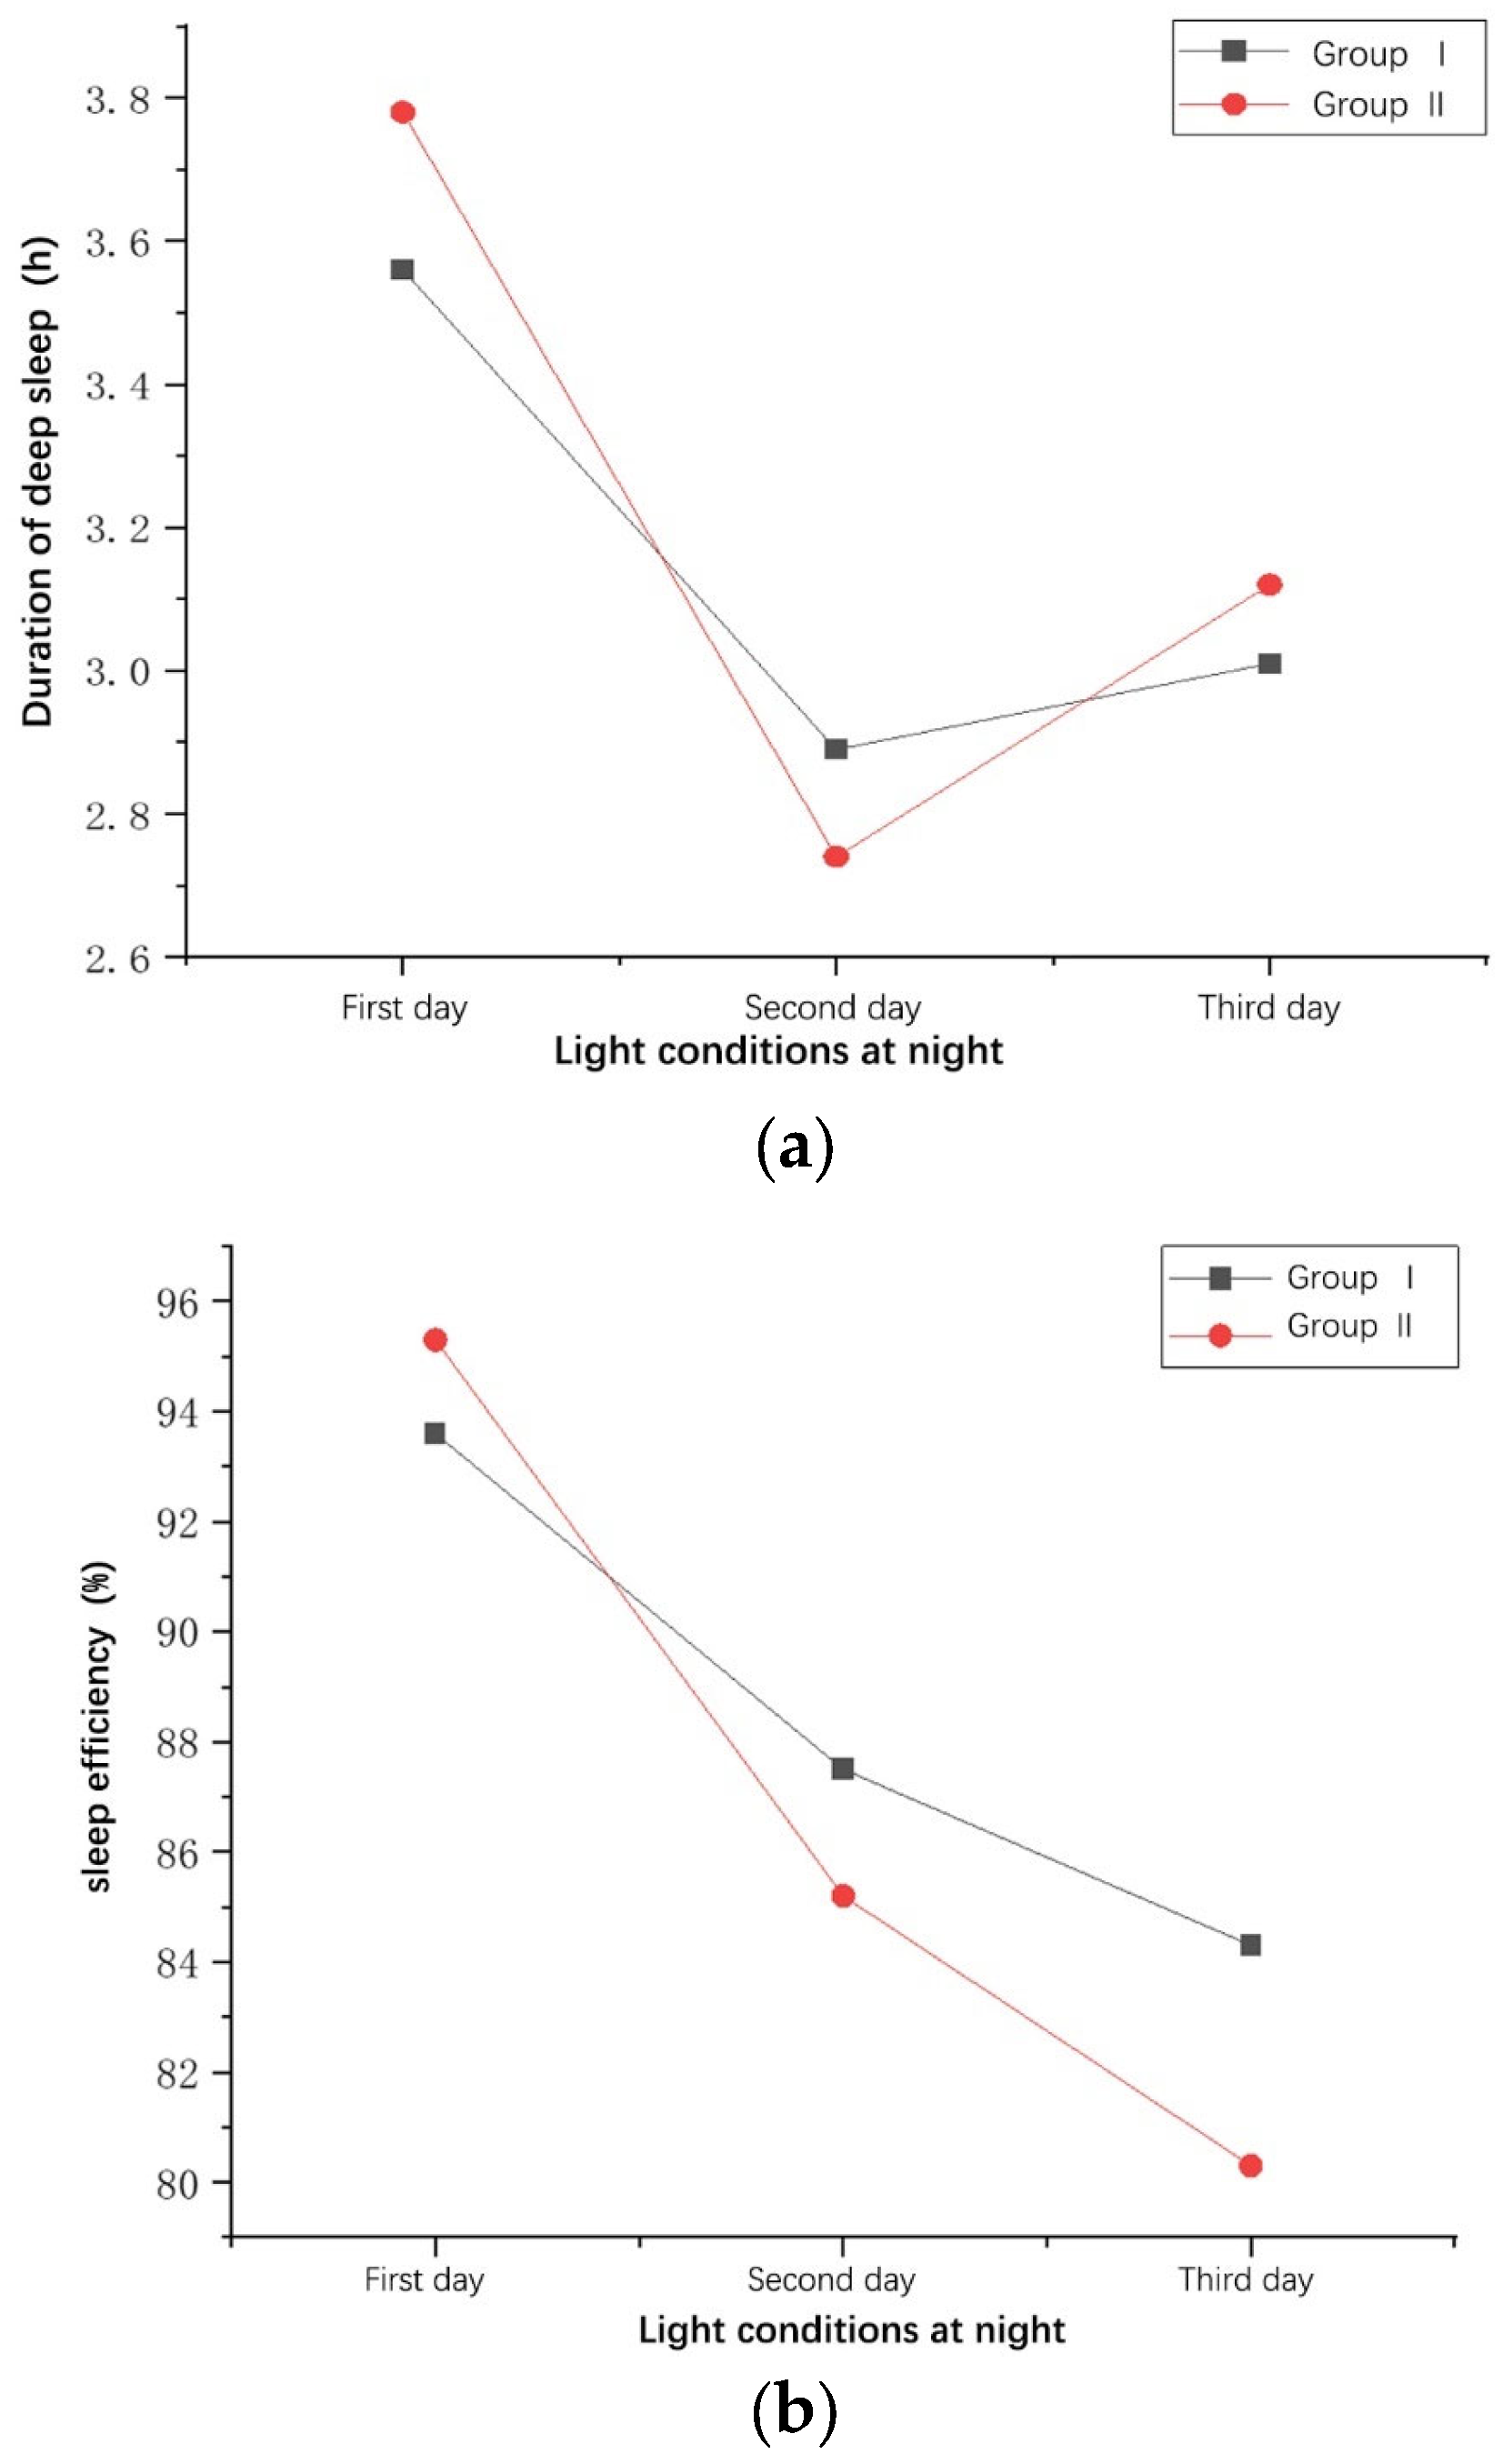
4.4. Results of Sleep Parameter Analysis

Based on the normality test, we compared the demographic traits and different sleep factors of the two subject groups on the second (first) night using Student’s t-test or Mann-Whiney test. The variations in sleep characteristics for the two subject groups at 5 and 10 lx are displayed in Figure 17. The length of deep sleep on the second night was significantly shorter than on the first day, and the length of deep sleep on the third day did not differ significantly from the second day, according to Figure 17a, which uses the data from the first day as a baseline. In contrast, the overall trend was the same in the two groups of sleep environments with varying illumination levels at 5 lx and 10 lx, but the values did not show any significant differences.
Sleep Efficiency = (actual sleep time/all laying time) × 100%,
was the formula used to calculate sleep efficiency. The overall trend was the same in the two sets of sleep environments with different illuminations of 5 lx and 10 lx, but as Figure 17b illustrates, the sleep efficiency of the second night significantly decreased in comparison to the first day, and the sleep efficiency of the third day also showed a significant downward trend in comparison to the second day. Although the values did not reveal a significant difference, the general tendency was the same in the two groups with a varying illumination of 5 lx and 10 lx sleep environments. The quality of human sleep can be significantly impacted by a sleep environment with low illumination.

5. Discussion

Light is a major factor in advancing or delaying circadian rhythms, and factors such as light illuminance [3,7], spectral distribution [33,34], and exposure duration may affect human circadian rhythms and thus sleep quality. The present study consists of two experiments: Experiment 1 focuses on the effects of the color frequency brightness of outdoor light sources and their combined effects on the phase shift of human rhythms before 11:00 p.m., and Experiment 2 focuses on the effects of the indoor low illuminance environment caused by outdoor light sources on the phase shift of human rhythms. Research has shown that continuous nighttime light will inhibit human melatonin secretion and delay human melatonin secretion, which will lead to a phase shift of circadian rhythms, and the overall delay backward, so that people’s nighttime sleep time is delayed, and the natural waking up time in the morning is delayed. Most of the current studies on the effects of nighttime artificial light (LAN) exposure on humans have used bright light, and relatively few studies have examined the effects of dLAN (nighttime artificial light low illuminance environment) exposure. In this study, we reproduced different outdoor light environment boundary conditions in the laboratory and assessed the extent of the effect of low outdoor illuminance (5 lx, 10 lx) on the phase shift of circadian rhythms in humans by using a sleep monitoring device as well as a sleep diary, taking into account the existing conditions in the laboratory. The low illumination will still inhibit the secretion of melatonin and delay the secretion of melatonin, which will lead to the phase shift of the circadian rhythm. The human body’s sleep time at night will be delayed, and the natural waking time in the morning will be delayed. The overall trend is the same in two groups of sleeping environments with different illuminance levels of 5 lx and 10 lx, but the values do not show a big difference, and we analyze the possible reasons for this and the difference in the values of illuminance levels of 5 lx and 10 lx is small. The possible reasons are that the difference between 5 lx and 10 lx illuminance values is small, which does not show the difference in a short period, and it also shows that even the low illuminance night light environment of 5 lx still affects the secretion of melatonin in the human body, which influences the circadian rhythm of the human body and thus affects the human body’s physical health. In addition, the effect of low illuminance sleep environments on the length of deep sleep showed that, compared to the first night, the duration of deep sleep on the second day was significantly lower. By the third day, the duration of deep sleep was similar to that of the second day. This suggests that the effect of low illuminance on deep sleep duration may not be immediately noticeable. In both groups with illuminances of 5 lx and 10 lx, the overall trend was consistent, although the specific values did not differ significantly. The possible reason for this is that the difference in illuminance values between 5 lx and 10 lx is relatively small and does not show a difference in a short period. Through the calculation of sleep efficiency, it was found that, compared to the first day, the sleep efficiency on the night of the second day decreased significantly, and the sleep efficiency on the third day also showed a significant downward trend compared to the second day, and the low illuminance environment would have an impact on sleep efficiency. However, the overall trend between 5 lx and 10 lx is still the same, so the difference between the two illuminance selections in this experiment is relatively small, and perhaps the duration of the experiment needs to be extended to further explore the difference between the two groups because the duration of light has a significant effect on rhythmic phase shift and subjective drowsiness [35]. Overall, low illumination sleep environments can severely affect human sleep. Although illumination at night can suppress melatonin secretion and delay circadian rhythms, daytime and nighttime light patterns can have a moderating effect [36].
In terms of the effects that the color of the intrusive source, the strobe, the luminance, and the intrusive illuminance have on human circadian rhythms, color has a greater effect on the phase shift of human circadian rhythms than strobe and luminance. The results showed little difference between the effects produced by blue and green light. There was no significant difference between the two groups in terms of melatonin content, blood pressure, and heart rate, probably because the wavelengths of blue and green light sources are closer. Therefore, in subsequent experiments, we can try to extend the experiment time and increase the sample size. Compared with red light, the short wavelengths of blue and green light can cause an increase in systolic blood pressure and a decrease in diastolic blood pressure. In both green and blue infiltrating light, the human body’s good conductance values were higher than those in red infiltrating light, indicating that the human body’s autonomic excitability will be strengthened under the stimulation of short-wavelength infiltrating light. Short-wavelength light immediately attenuates the negative effects of sleep stress and circadian drive on alertness [10] and reduces nocturnal melatonin release [37]. This is consistent with the study of Kenneth Appleman, who found that blue light exposure effectively inhibited melatonin secretion and achieved circadian rhythm changes by comparing two conditions of 3 h blue light exposure and orange light exposure at night, and by filling in the melatonin analysis and subjective sleepiness scale through nocturnal saliva sampling [38]. Therefore, lighting during the daytime needs to be further controlled in subsequent studies. In addition, due to differences in individual responses to light [39], subsequent studies could be improved by increasing the sample size and rigorously screening participants for sleep type. It is necessary to consider age and gender differences.
In terms of the limitations and weaknesses of our research, we foresee improvements in the following areas in the future:
(1)
Control of daytime light: Research has shown that exposure to daylight influences sleep quality [40]. Consequently, light present outside the experimental timeframe may disrupt the experiment’s outcomes. Future studies should aim to regulate light exposure throughout the day to achieve more dependable results.
(2)
Expand the experimental sample size and diversity: We believe that even minimal intrusive light can impact human circadian rhythms, and that color plays a more significant role than other factors. However, our current study has a limited sample size, consisting solely of young students. To enhance the generalizability of our findings, we plan to include a larger and more diverse sample in future research, considering participants with varying characteristics, age groups, and sleep preferences.
(3)
Include subjects with sleep disorders: This study primarily targets young students with normal physiological cycles and good health, excluding those with sleep disorders or late-night habits. In future research, we aim to incorporate individuals with insomnia to investigate a more suitable sleep–light environment for this population.
(4)
Extended experimental time and period to study the cumulative effect of light. The first experiment in this study had a light exposure of two hours, and the second experiment had an experimental period of three days per group, with a limited time in the light environment. Longer cycles of light exposure would have longer-term effects [41]. Therefore, extending the experimental time and period to study the effects of light intrusion on circadian rhythms is more reliable.

6. Conclusions

Two experiments were conducted in this study to explore the effects of light intrusion at night on the phase shift of human rhythms. The results show that light has a profound inhibitory effect on melatonin levels and shortens the body’s internal representation of nighttime duration, severely affecting one’s sleep health. Sustained nighttime light suppresses the body’s melatonin secretion, which delays the body’s melatonin secretion causing an overall backward shift in the rhythm. Even a low light level of 5 lx at night still affects melatonin secretion, which in turn affects circadian rhythms and thus human health. In addition, in the bedtime environment, although the color of the light source and the brightness of the stroboscopic light source can cause the human body rhythm to phase shift, this study found that the color of the influence is greater than other factors. Therefore, in the management of dynamic light intrusion, the focus should be on the color of light intrusion. In addition, very low illuminance lights can also affect human rhythms. So, it is suggested that the relevant light intrusion illuminance limit can be reduced accordingly. For bedrooms, it is recommended to install high blackout curtains to block the intrusion of outdoor light. Alternatively, curtain tracks can be hidden into the ceiling and fit tightly to the wall to ensure a better blockage of outdoor light.

Author Contributions

Conceptualization, J.L.; Methodology, B.Z.; Validation, M.L. (Ming Liu), R.L., L.G. and M.L. (Mingxuan Liu); Formal analysis, J.L. and R.L.; Data curation, J.L. and K.Z.; Writing—original draft, J.L.; Writing—review & editing, B.Z., M.L. (Ming Liu), R.L., K.Z., L.G. and M.L. (Mingxuan Liu); Supervision, B.Z. All authors have read and agreed to the published version of the manuscript.

Funding

The work described in this paper was supported by the National Natural Science Foundation of China (Project No. 52178067).

Institutional Review Board Statement

The study was conducted in accordance with the Declaration of Helsinki, and approved by the Committee of Biological and Medical Ethics, Dalian University of Technology (protocol code DUTSIE250310-07).

Informed Consent Statement

Informed consent was obtained from all subjects involved in the study. Written informed consent has been obtained from the patient(s) to publish this paper.

Data Availability Statement

The datasets used and analysed during the current study are available from the corresponding author on reasonable request.

Acknowledgments

The authors would like to thank the reviewers of a previous draft for their helpful comments.

Conflicts of Interest

The authors declare no conflicts of interest.

References

  1. Tan, D.X.; Zheng, X.; Kong, J.; Manchester, L.C.; Hardeland, R.; Kim, S.J.; Xu, X.; Reiter, R.J. Fundamental issues related to the origin of melatonin and melatonin isomers during evolution: Relation to their biological functions. Int. J. Mol. Sci. 2014, 15, 15858. [Google Scholar] [CrossRef] [PubMed]
  2. Stevens, R.G. Light-at-night, Circadian disruption and breast cancer: Assessment of existing evidence. Int. J. Epidemiol. 2009, 38, 963–970. [Google Scholar] [CrossRef] [PubMed]
  3. McIntyre, I.M.; Norman, T.R.; Burrows, G.D.; Armstrong, S.M. Human Melatonin Suppression by Light is Intensity Dependent. J. Pineal Res. 1989, 6, 149–156. [Google Scholar] [CrossRef] [PubMed]
  4. Yokoi, M.; Aoki, K.; Shimomura, Y.; Iwanaga, K.; Katsuura, T. Exposure to bright light modifies HRV responses to mental tasks during nocturnal sleep deprivation. J. Physiol. Anthr. 2006, 25, 153–161. [Google Scholar] [CrossRef]
  5. Rüger, M.; Gordijn, M.C.; Beersma, D.G.; de Vries, B.; Daan, S. Weak relationships between suppression of melatonin and suppression of sleepiness/fatigue in response to light exposure. J. Sleep Res. 2005, 14, 221–227. [Google Scholar] [CrossRef]
  6. Figueiro, M.G.; Sahin, L.; Roohan, C.; Kalsher, M.; Plitnick, B.; Rea, M.S. Effects of red light on sleep inertia. Nat. Sci. Sleep 2019, 11, 45–57. [Google Scholar] [CrossRef]
  7. Yan, Y.; Yan, N.; Guan, Y.; Zeng, H. Effects of light source colour temperature on brainwave rhythms and learning efficiency. J. Civil Environ. Eng. 2012, 34, 76–79+90. [Google Scholar]
  8. Zeng, K.; Hao, L. Exploration of EEG as an Experimental Method for Light and Emotion—An Experiment on White Light Environment in the Simulated Ward of Cardiology CICU as an Example. China Illum. Eng. J. 2017, 28, 42–47. [Google Scholar]
  9. Hiromi, T. The meaning of the quantity and quality of light in human physiology. J. Illum. Eng. Inst. Jpn. 2000, 84, 46–49. [Google Scholar]
  10. Lockley, S.W.; Evans, E.E.; Scheer, F.A.; Brainard, G.C.; Czeisler, C.A.; Aeschbach, D. Short-wavelength Sensitivity for the Direct Effects of Light on Alertness, Vigilance, and the Waking Electroencephalogram in Humans. Sleep 2006, 29, 161–168. [Google Scholar]
  11. Brainard, G.C.; Hanifin, J.P.; Greeson, J.M.; Byrne, B.; Glickman, G.; Gerner, E.; Rollag, M.D. Action Spectrum for Melatonin Regulation in Humans: Evidence for a Novel Circadian Photoreceptor. J. Neurosci. 2001, 21, 6405–6412. [Google Scholar] [CrossRef] [PubMed]
  12. Wang, Q.; Hao, L.; Zeng, K. Current Research Status and Application Perspectives of Healthy Light Environments. China Illum. Eng. J. 2012, 23, 12–17+63. [Google Scholar] [CrossRef]
  13. Liu, N.; Zhang, N.; Wen, B.-T.; He, Z.-K.; Chen, Z.-Z.; Fan, D.-S.; Shen, Y. Effects of monochromatic LED blue light on circadian rhythms in healthy humans. Chin. J. Tissue Eng. Res. 2009, 13, 5923–5926. [Google Scholar]
  14. Cui, Z.; Hao, L.; Lin, Y. Recent international research developments in physiological mechanisms of circadian rhythms. China Illum. Eng. J. 2014, 25, 4–12. [Google Scholar] [CrossRef]
  15. Deguchi, T.; Sato, M. The effect of color temperature of lighting sources on mental activity level. Ann. Physiol. Anthr. 1992, 11, 37–43. [Google Scholar] [CrossRef]
  16. Kobayashi, H.; Sato, M. physiological responses to illuminance andcolor temperature of lighting. Ann. Physiol. Anthr. 1992, 11, 45–49. [Google Scholar] [CrossRef]
  17. Ru, T.; de Kort, Y.A.W.; Smolders, K.C.H.J.; Chen, Q.; Zhou, G. Non-image forming effects of illuminance and correlated color temperature of office light on alertness, mood, and performance across cognitive domains. Build. Environ. 2019, 149, 253–263. [Google Scholar] [CrossRef]
  18. Young, C.R.; Jones, G.E.; Figueiro, M.G.; Soutière, S.E.; Keller, M.W.; Richardson, A.M.; Lehmann, B.J.; Rea, M.S. At-sea trial of 24-h-based submarine watch standing schedules with high and low correlated color temperature light sources. J. Biol. Rhythm. 2015, 30, 144–154. [Google Scholar] [CrossRef]
  19. Kozaki, T.; Kitamura, S.; Higashihara, Y.; Ishibashi, K.; Noguchi, H.; Yasukouchi, A. Effect of Color Temperature of Light Sources on Slow-wave Sleep. J. Physiol. Anthropol. Appl. Hum. Sci. 2005, 24, 183–186. [Google Scholar] [CrossRef]
  20. Huang, H. A Study of Photobiological Effects in University Classroom Lighting. Ph.D. Thesis, Chongqing University, Chongqing, China, 2010. [Google Scholar]
  21. Liu, Y. Research on the Effect of Light on Human Physiological Rhythms and Its Application. Master’s Thesis, Zhejiang University, Hangzhou, China, 2015. [Google Scholar]
  22. CIE150:2003; Guide on the Limitation of the Effects of Obtrusive Light from Outdoor Lighting Installations. CIE Central Bureau: Vienna, Austria, 2004.
  23. Lewin, I.; FIES, L.C. Light Trespass and Light Pollution. In Proceedings of the IESNA Street and Area Lighting Conference, Minneapolis, MN, USA, 10–13 September 2000; Volume 359, pp. 605–609. [Google Scholar]
  24. GB/T 35626-2017; Specification for the Limitation of Disturbing Light for Outdoor Lighting. Natiosnal Technical Committee for Standardization of Public Facility Services: Beijing, China, 2017.
  25. T/CECS 650-2020; Healthy Community Evaluation Standards. China Engineering Construction Standardization Society (CECS): Beijing, China, 2020.
  26. Na, H.; Kim, J.-T. A Field Investigation on Light Trespass of Residential Buildings by Street Lighting. J. KIEAE 2010, 10, 71–78. [Google Scholar]
  27. Chiu, Y.C. A Study on Light Intrusion of Outdoor Lighting in Residential Areas. Ph.D. Thesis, National Cheng Kung University, Tainan City, Taiwan, 2009. [Google Scholar]
  28. Huang, K.-Y. A study on Light Trespass from Advertising Signs in Mixed Residential Commercial District. Master’s Thesis, National Cheng Kung University, Tainan City, Taiwan, 2010. [Google Scholar]
  29. Yu, J.; Wang, L.; Zhang, M.; Song, J.; Yang, D. Investigation and research on night-time light intrusion in urban residential areas. J. Civ. Environ. Eng. 2015, 37, 114–119. [Google Scholar]
  30. Na, L.; Zhang, M. Investigation and Research on the Problem of Colour Light Intrusion in Outdoor LED Advertising Screens. J. Civ. Environ. Eng. 2016, 38, 148–156. [Google Scholar]
  31. An, P.; Ma, J.; Liu, G.; Zhang, M.Y. Study on the Emotional Expression of Colour and Light in Landscape Lighting of Historic Buildings in Tianjin City. China Illum. Eng. J. 2010, 21, 9–13+25. [Google Scholar]
  32. Commission Internationale de l'Éclairage. CIE 1931 Colorimetric System; CIE Central Bureau: Vienna, Austria, 1931. [Google Scholar]
  33. Ishizawa, M.; Uchiumi, T.; Takahata, M.; Yamaki, M.; Sato, T. Effects of pre-bedtime blue-light exposure on ratio of deep sleep in healthy young men. Sleep Med. 2021, 84, 303–307. [Google Scholar] [CrossRef]
  34. Berman, S.M.; Clear, R. Past Vision Studies can Support a Novel Human Photorecepter. In Proceedings of the CIE Midterm Meeting and International Lighting Cenference, Le’on, Spain, 21 May 2005. [Google Scholar]
  35. Chang, A.M.; Santhi, N.; St Hilaire, M.; Gronfier, C.; Bradstreet, D.S.; Duffy, J.F.; Lockley, S.W.; Kronauer, R.E.; Czeisler, C.A. Human responses to bright light of different durations. J. Physiol. 2012, 590, 3103–3112. [Google Scholar] [CrossRef]
  36. Ricketts, E.J.; Joyce, D.S.; Rissman, A.J.; Burgess, H.J.; Colwell, C.S.; Lack, L.C.; Gradisar, M. Electric lighting, adolescent sleep and circadian outcomes, and recommendations for improving light health. Sleep Med. Rev. 2022, 64, 101667. [Google Scholar] [CrossRef]
  37. Chang, A.-M.; Aeschbach, D.; Duffy, J.F.; Czeisler, C.A. Evening use of light-emitting eReaders negatively affects sleep, circadian timing, and next-morning alertness. Proc. Natl. Acad. Sci. USA 2015, 112, 1232–1237. [Google Scholar] [CrossRef]
  38. Appleman, K.; Figueroa, M.G.; Rea, M.S. Controlling light-dark exposure patterns rather than sleep schedules determines circadian phase. Sleep Med. 2013, 14, 456–461. [Google Scholar] [CrossRef]
  39. Phillips, A.J.; Vidafar, P.; Burns, A.C.; McGlashan, E.M.; Anderson, C.; Rajaratnam, S.M.; Lockley, S.W.; Cain, S.W. High sensitivity and interindividual variability in the response of the human circadian system to evening light. Proc. Natl. Acad. Sci. USA 2019, 116, 12019–12024. [Google Scholar] [CrossRef]
  40. Geerdink, M.; Walbeek, T.J.; Beersma, D.G.M.; Hommes, V.; Gordijn, M.C.M. Short blue light pulses (30 min) in the morning support a sleep-advancing protocol in a home setting. J. Biol. Rhythm. 2016, 31, 483–497. [Google Scholar] [CrossRef]
  41. He, J.W.; Tu, Z.H.; Xiao, L.; Su, T.; Tang, Y.X. Effect of restricting bedtime mobile phone use on sleep, arousal, mood, and working memory: A randomized pilot trial. PLoS ONE 2020, 15, e0228756. [Google Scholar] [CrossRef]
Figure 1. The current situation of the intrusion map. (a) The current situation of the commercial street of Dalian University of Technology and its intrusive windows; (b) the current situation of LED advertising screen in Dalian.
Buildings 15 00946 g001aBuildings 15 00946 g001b
Figure 2. Distribution map of monitoring points.
Buildings 15 00946 g002
Figure 3. LED advertising screen brightness value statistics.
Buildings 15 00946 g003
Figure 4. LED advertising screen light intrusion color coordinate data distribution (based on CIE1931) [32].
Buildings 15 00946 g004
Figure 5. Indoor light source, lamps, and lanterns open. The use of electronic products time survey. (a) Indoor light source survey situation. (b) Bedroom lamps on during sleep. (c) The amount of time spent using electronic products before going to bed.
Buildings 15 00946 g005
Figure 6. Survey of residents’ shading habits, sources of light intrusion, and types of indoor activities affected. (a) Residents’ shading habits; (b) statistics on the sources of outdoor light intrusion; (c) light intrusion affects indoor activity types.
Buildings 15 00946 g006
Figure 7. Degree of influence by outdoor light intrusion.
Buildings 15 00946 g007
Figure 8. LED advertising screen factors that influence sleep quality.
Buildings 15 00946 g008
Figure 9. Level of boredom with different colored light sources entering the room.
Buildings 15 00946 g009
Figure 10. PSQI score distribution.
Buildings 15 00946 g010
Figure 11. Experiment 1 environmental layout mockup.
Buildings 15 00946 g011
Figure 12. Experiment 2 environmental layout mockup.
Buildings 15 00946 g012
Figure 13. Plot of changes in heart rate, blood pressure, blood oxygen, and good conductance values. (a) Comparison of heart rate change under different colors and strobe. (b) Comparison of heart rate change under different colors and brightness. (c) Comparison of systolic blood pressure at different colors and frequencies. (d) Mean and standard errors of systolic blood pressure at different colors and brightness. (e) Mean and standard error of diastolic blood pressure at different colors and frequencies. (f) Mean and standard errors of diastolic blood pressure at different colors and brightness. (g) The good conductive box diagram under different colors and frequencies. (h) Good conductor box diagram at different frequency and luminance.
Buildings 15 00946 g013aBuildings 15 00946 g013bBuildings 15 00946 g013c
Figure 14. Experiment 1 plot of changes in melatonin content. (a) Changes in melatonin content in the morning and evening under different colors and strobes. (b) Changes in melatonin content in the morning and evening under different colors and brightness.
Buildings 15 00946 g014
Figure 15. Experiment 2 plot of changes in melatonin content. (a) Melatonin changes in human body under 5lx low illumination environment (b) Melatonin changes in human body under 10lx low illumination environment.
Buildings 15 00946 g015
Figure 16. Graph of changes in Karolinska Drowsiness Scale scores. (a) Means and standard errors of Karolinska Sleepiness Scale scores for different colors and frequency flashes (b) Means and Standard Errors of Karolinska Drowsiness Scale Scores in Different Colors and Luminance Levels.
Buildings 15 00946 g016
Figure 17. Graph of changes in sleep parameters. (a) Variation in human deep sleep duration in low illumination environment. (b) Change in human sleep efficiency in low illumination environment.
Buildings 15 00946 g017
Table 1. Summary of LED advertising screens and their intrusion into the community.
NumberLED Advertising Screen LocationAffected Neighborhoods
1Dalian Hi-Tech Wanda PlazaSilicon Valley Holiday Community
2Dalian Shaanxi Road McKellarTianxing New Home
3Xi’an Road Tianxing RooseveltChangping District
4CapitaLand Peace PlazaNew Hope Garden
5Victory PlazaWuchang District
6Centennial CityChancery Lane
7New Mart Shopping PlazaLido Garden
8Youyi MallHarmony Garden
Table 2. Instrument parameter information sheet.
Laboratory InstrumentsMeasurement DataMeasurement RangeAccurate
CA-2500 2D Color Brightness MeterTwo-dimensional measurement of luminance distribution and chromaticity distribution of the display.0.05
~
100,000
cd/m2
±3%
CL-500A Illuminance MeterMeasurement of vertical illuminance, color temperature, dominant wavelength, and other parameters of windows in residential areas0.1–100,000 lx (Chromaticity display above 5 lx)±2% ±1 value of the displayed value
laser distance meterMeasurement of the distance between the light source and the measurement point120 m±2 mm
Table 3. Screening questionnaire.
1. Gender: Male ☐  Female ☐
2. Age: 18–35 ☐  35–50  ☐  >50 ☐
3. Do you have a chronic disease: No ☐  Heart Disease ☐  High Blood Pressure ☐  Bone and Joint Disease ☐  Diabetes ☐  Respiratory Disease ☐  Depression ☐  Other ☐
4. Your satisfaction with the heat and humidity in your bedroom in the last month: Very satisfied ☐  Satisfied ☐  Fair ☐  Dissatisfied ☐  Very dissatisfied ☐
5. Your level of fatigue at work in the last month: Stronger ☐  Strong ☐  Moderate ☐  Not strong ☐  Weaker ☐
6. In the last month, your bedtime was         ; Wake up time was         ; The actual sleep time was         
Table 4. Questionnaire on sources of light exposure and sleep status.
1. Your exposure to indoor light sources prior to sleep:
 High brightness white light source ( ) Low brightness warm light source ( ) Low brightness colored light source ( )
2. Your habit of turning on and off the lamps in your bedroom when you sleep:
 Turn on indoor fluorescent lights ( ) Turn on bedside night light ( ) Turn off all lights ( )
3. How long do you use electronic products before going to bed every day?
 Less than 20 min ( ) 20–40 min ( ) 40–60 min ( ) more than 1 h ( )
4. Your usual shading habits:
 Do not pull the curtains ( ) Regular curtains cannot completely block the outside light ( ) Thick curtains and can block the outside light ( )
5. Does your living environment suffer from the intrusion of outdoor light sources? Yes ( ) No ( )
 (1) If so, which aspect do you think is most affected? (Multiple choice)
 Study and work ( ) Sleep and rest ( ) Leisure and entertainment ( ) Housework ( ) Other ( )
 (2) Which of the following factors do you think influence outdoor light? (Multiple choice)
 Street lights ( ) Bus stops and commercial plaques ( ) Dynamic LED display ( ) Building decorative lighting ( )
6. Combined with your living environment, do you think there are other sources of light exposure?
Table 5. Questionnaire on subjective perception of the source of intrusion by the intruded population.
1. What is the degree of influence of outdoor light intrusion on your living environment?
 No feeling ( ) Somewhat ( ) General ( ) Stronger ( ) Severe ( )
2. What do you mind most about the influence of advertisement signboards on you?
 Too bright ( ) Hate the color of the light ( ) Still bright after a break ( ) Alternating colors of light ( ) Brightness fluctuates ( ) The luminous area of the billboard ( )
3. Please rate the degree of annoyance towards the color of light intrusion (1~5 represents the degree of annoyance in increasing order)
 Red ( ) Orange ( ) Yellow ( ) Green ( ) Blue ( ) Purple ( ) White ( )
4. Last 1-month sleep survey: Pittsburgh Sleep Quality PSQI score ( )
Table 6. Five typical dynamic forms and their dynamic frequency survey map.
TypeColor ChangeBlinkingSlidingExtendingJumping
DescriptionOnly refers to color changeOnly refers to alternating light and dark changesSingle change continuous without interruption or position changeSingle change continuous without interruption, starting point position unchanged, or shape changeSingle change with interruption, position, or shape change
Frequency0.25–40.5–41–40.5–41–2
Table 7. Experiment table.
FactorsInfestation Source ColorBlinking FrequencyBrightness
(-)(Hz)(cd/m2)
Scenario 1Red0.25800
Scenario 2Red11800
Scenario 3Red42800
Scenario 4Green0.251800
Scenario 5Green12800
Scenario 6Green4800
Scenario 7Blue0.252800
Scenario 8Blue1800
Scenario 9Blue41800
Table 8. Results of the mean-polarity method of the good conductor complex.
SequenceAverage Value K 1 ¯ R K 2 ¯ R K 3 ¯ RErrorR
139.14844.2344.53241.1565.53542.3452.97643.1331.564
244.236
349.274
439.64541.48743.71243.87643.956
541.934
642.876
744.67845.87646.74545.35644.574
844.578
948.065
Disclaimer/Publisher’s Note: The statements, opinions and data contained in all publications are solely those of the individual author(s) and contributor(s) and not of MDPI and/or the editor(s). MDPI and/or the editor(s) disclaim responsibility for any injury to people or property resulting from any ideas, methods, instructions or products referred to in the content.

