Abstract
As the penetration rate of renewable energy in the power grid increases, the imbalance between power supply and demand has become one of the key issues. Buildings and their heating, ventilation, and air conditioning (HVAC) systems are considered excellent flexible demand response (DR) resources that can reduce peak loads to alleviate operational pressures on the power grid. Centralized chiller plants are regarded as flexible resources with large capacity and rapid adjustability. The direct load control of chiller plants can respond to the power grid within minutes, making them highly suitable for participation in emergency DR. However, existing studies are generally based on simulations and lack experimental research in actual large-scale buildings to demonstrate the effectiveness of this method and provide related lessons learned. This study conducted field experiments on a centralized chiller plant within an industrial building in Guangdong, China. The results indicate that the strategy of shutting down chiller plants is an effective DR measure. It can complete the load reduction process within 15 min, rapidly decreasing the system power by 380~459 kW, with a maximum duration of up to 50 min, without significantly affecting the thermal comfort of indoor occupants. Additionally, the impact of existing control logic on the participation of chiller plants in the DR process is also discussed.
1. Introduction
As the power system develops, the penetration rate of renewable energy is increasingly high to address the challenges posed by the depletion of fossil fuels, the growth in energy demand, and global climate change. However, the substantial generation from renewable energy sources is intermittent and volatile due to changes in weather conditions, which imposes additional pressure on the balance and stable operation of the power grid [,,]. With the rise in residents’ living standards, electricity consumption has been rapidly increasing. Consequently, the supply side is compelled to invest in higher-capacity power generation units to meet electricity demand during peak periods. To address this challenge, the power grid seeks changes from the demand side to reduce power generation capacity requirements, avoid congestion in the transmission and distribution networks, and improve economic efficiency. Therefore, the flexibility of energy-consuming terminals is receiving increasing attention [,,].
Building energy consumption accounts for one-third of global final energy consumption, and heating, ventilation, and air conditioning (HVAC) energy consumption accounts for over 50% of building energy consumption []. Temporarily adjusting the power of HVAC system equipment only affects the thermal comfort of indoor occupants and thus is regarded as an excellent flexibility resource [,,,,,]. There are various types of flexibility resources in buildings that can participate in different types of demand response (DR) programs (price based and incentive based) according to the varying needs of the power grid. Fu et al. and Wang et al. [,] provide a comprehensive review of existing DR programs, resources, and control strategies. Common methods for buildings to participate in DR include utilizing the building thermal mass to pre-cool or pre-heat during off-peak electricity pricing periods [,,], thereby reducing electricity consumption during peak price periods to save costs; resetting indoor temperature setpoints during peak electricity pricing periods to decrease load demand by sacrificing comfort [,]; and using rotating equipment of HVAC systems (such as fans and chiller plants) to participate in ancillary services or emergency interruptions. Lu et al. [] conducted large-scale simulations and analyses on the flexibility of commercial buildings, investigating the impact of different building thermal characteristics, weather conditions, and pricing ratios on optimal pre-cooling behavior. Zhang et al. [] studied the impact of controlling indoor temperature on the energy flexibility of building clusters. The results indicate that peak demand can be reduced by 22~27%. Xue et al. [] developed a rapid demand strategy utilizing building chillers. Results from the TRNSYS [] simulation platform indicate that the overall electrical demand of the building HVAC system can be reduced to 32.04~66.45% of normal operation. Wang et al. [] developed a chilled water temperature control strategy based on machine learning algorithms and validated it on a simulation platform. The results demonstrate that it can provide excellent power tracking capability for frequency regulation services. These studies utilize simulation software to demonstrate that buildings, as effective resources, can interact flexibly with the power grid.
However, the performance demonstrated on the simulation platform is insufficient to fully reflect the real performance of implementing DR strategies in actual buildings. Therefore, some studies have conducted field experiments related to DR. Motegi, N. et al. [] conducted a series of field experiments to facilitate the participation of commercial buildings in DR. The control strategies tested included global temperature adjustment, fan frequency limits, fan quantity reduction, and cooling valve limits. The experimental results indicate that buildings can use various control strategies to reduce the load during peak periods. Chen et al. [] developed an experimental platform consisting of a controllable environmental chamber with two identical rooms, each having an area of 16 m2. This platform was used to study the impact of pre-cooling and temperature setpoint reset strategies on the thermal dynamics of buildings and their DR potential. Huang et al. [] implemented an indoor temperature setpoint reset strategy in five real commercial buildings to explore the thermal inertia of buildings with different scales, ages, and HVAC systems to support the development of DR strategies and proposed a method to quantify the thermal inertia of commercial buildings. Wang et al. [] established a small-scale experimental platform to explore the feasibility of using variable-speed pumps in buildings for grid frequency regulation services and evaluated the tracking performance of the pumps under different frequency regulation signals as well as their impact on indoor comfort. Vrettos, E. et al. [,] tested the developed hierarchical model predictive control (MPC) control strategy to regulate fan speed for participation in grid frequency regulation services at the facility for low-energy experiments (FLEXLAB), which contains two identical 60 m2 cells. Kim et al. [] developed a MPC framework for rooftop units to provide optimal load shifting for buildings and demonstrated two months of MPC experimental results in a conference room. The results indicate that building loads can be significantly shifted, saving over 30% of demand. Ham, S. W. et al. [] developed a low-cost MPC and demonstrated it in K-12 school buildings. The results show a 24% reduction in peak demand and a 16% load-shifting capability while addressing practical challenges caused by user coverage and data resolution issues.
The aforementioned literature indicates that utilizing buildings and their HVAC systems to interact with the power grid in practice is feasible and can provide various types of flexibility services. Depending on the dynamic characteristics of different flexible resources, they can participate in grid DR programs at different time scales. Emergency demand response is one of the common incentive-based demand response programs, which requires participants to rapidly reduce their load at the minute level []. Chillers and their auxiliary equipment in large commercial and office buildings, as interruptible loads, are particularly suitable for participating in emergency DR [,]. Compared to other control strategies (such as indoor temperature adjustment, supply air temperature adjustment, and fan frequency limitation), they can be adjusted rapidly within minutes and can significantly reduce the building’s electricity load [,,]. However, we note that existing studies lack experimental cases of utilizing chillers to participate in emergency DR. This may be because operating chillers can severely impact the normal operation of buildings (for example, causing a shortage of cooling capacity and disordered chilled water distribution), and most building owners do not permit such operations [,].
To address the research gaps, demonstrate the effectiveness of centralized chiller plants participating in emergency DR, and share the lessons learned during the demonstration process, the contributions of this study are as follows:
- A direct load control strategy for the chiller plant was implemented in a large industrial building to demonstrate its performance during emergency DR.
- The DR process was quantified using a set of performance metrics to demonstrate the capability of chillers to participate in emergency DR.
- The experiences and lessons learned during the experiment were discussed, particularly focusing on the impact of the existing control logic on the DR process.
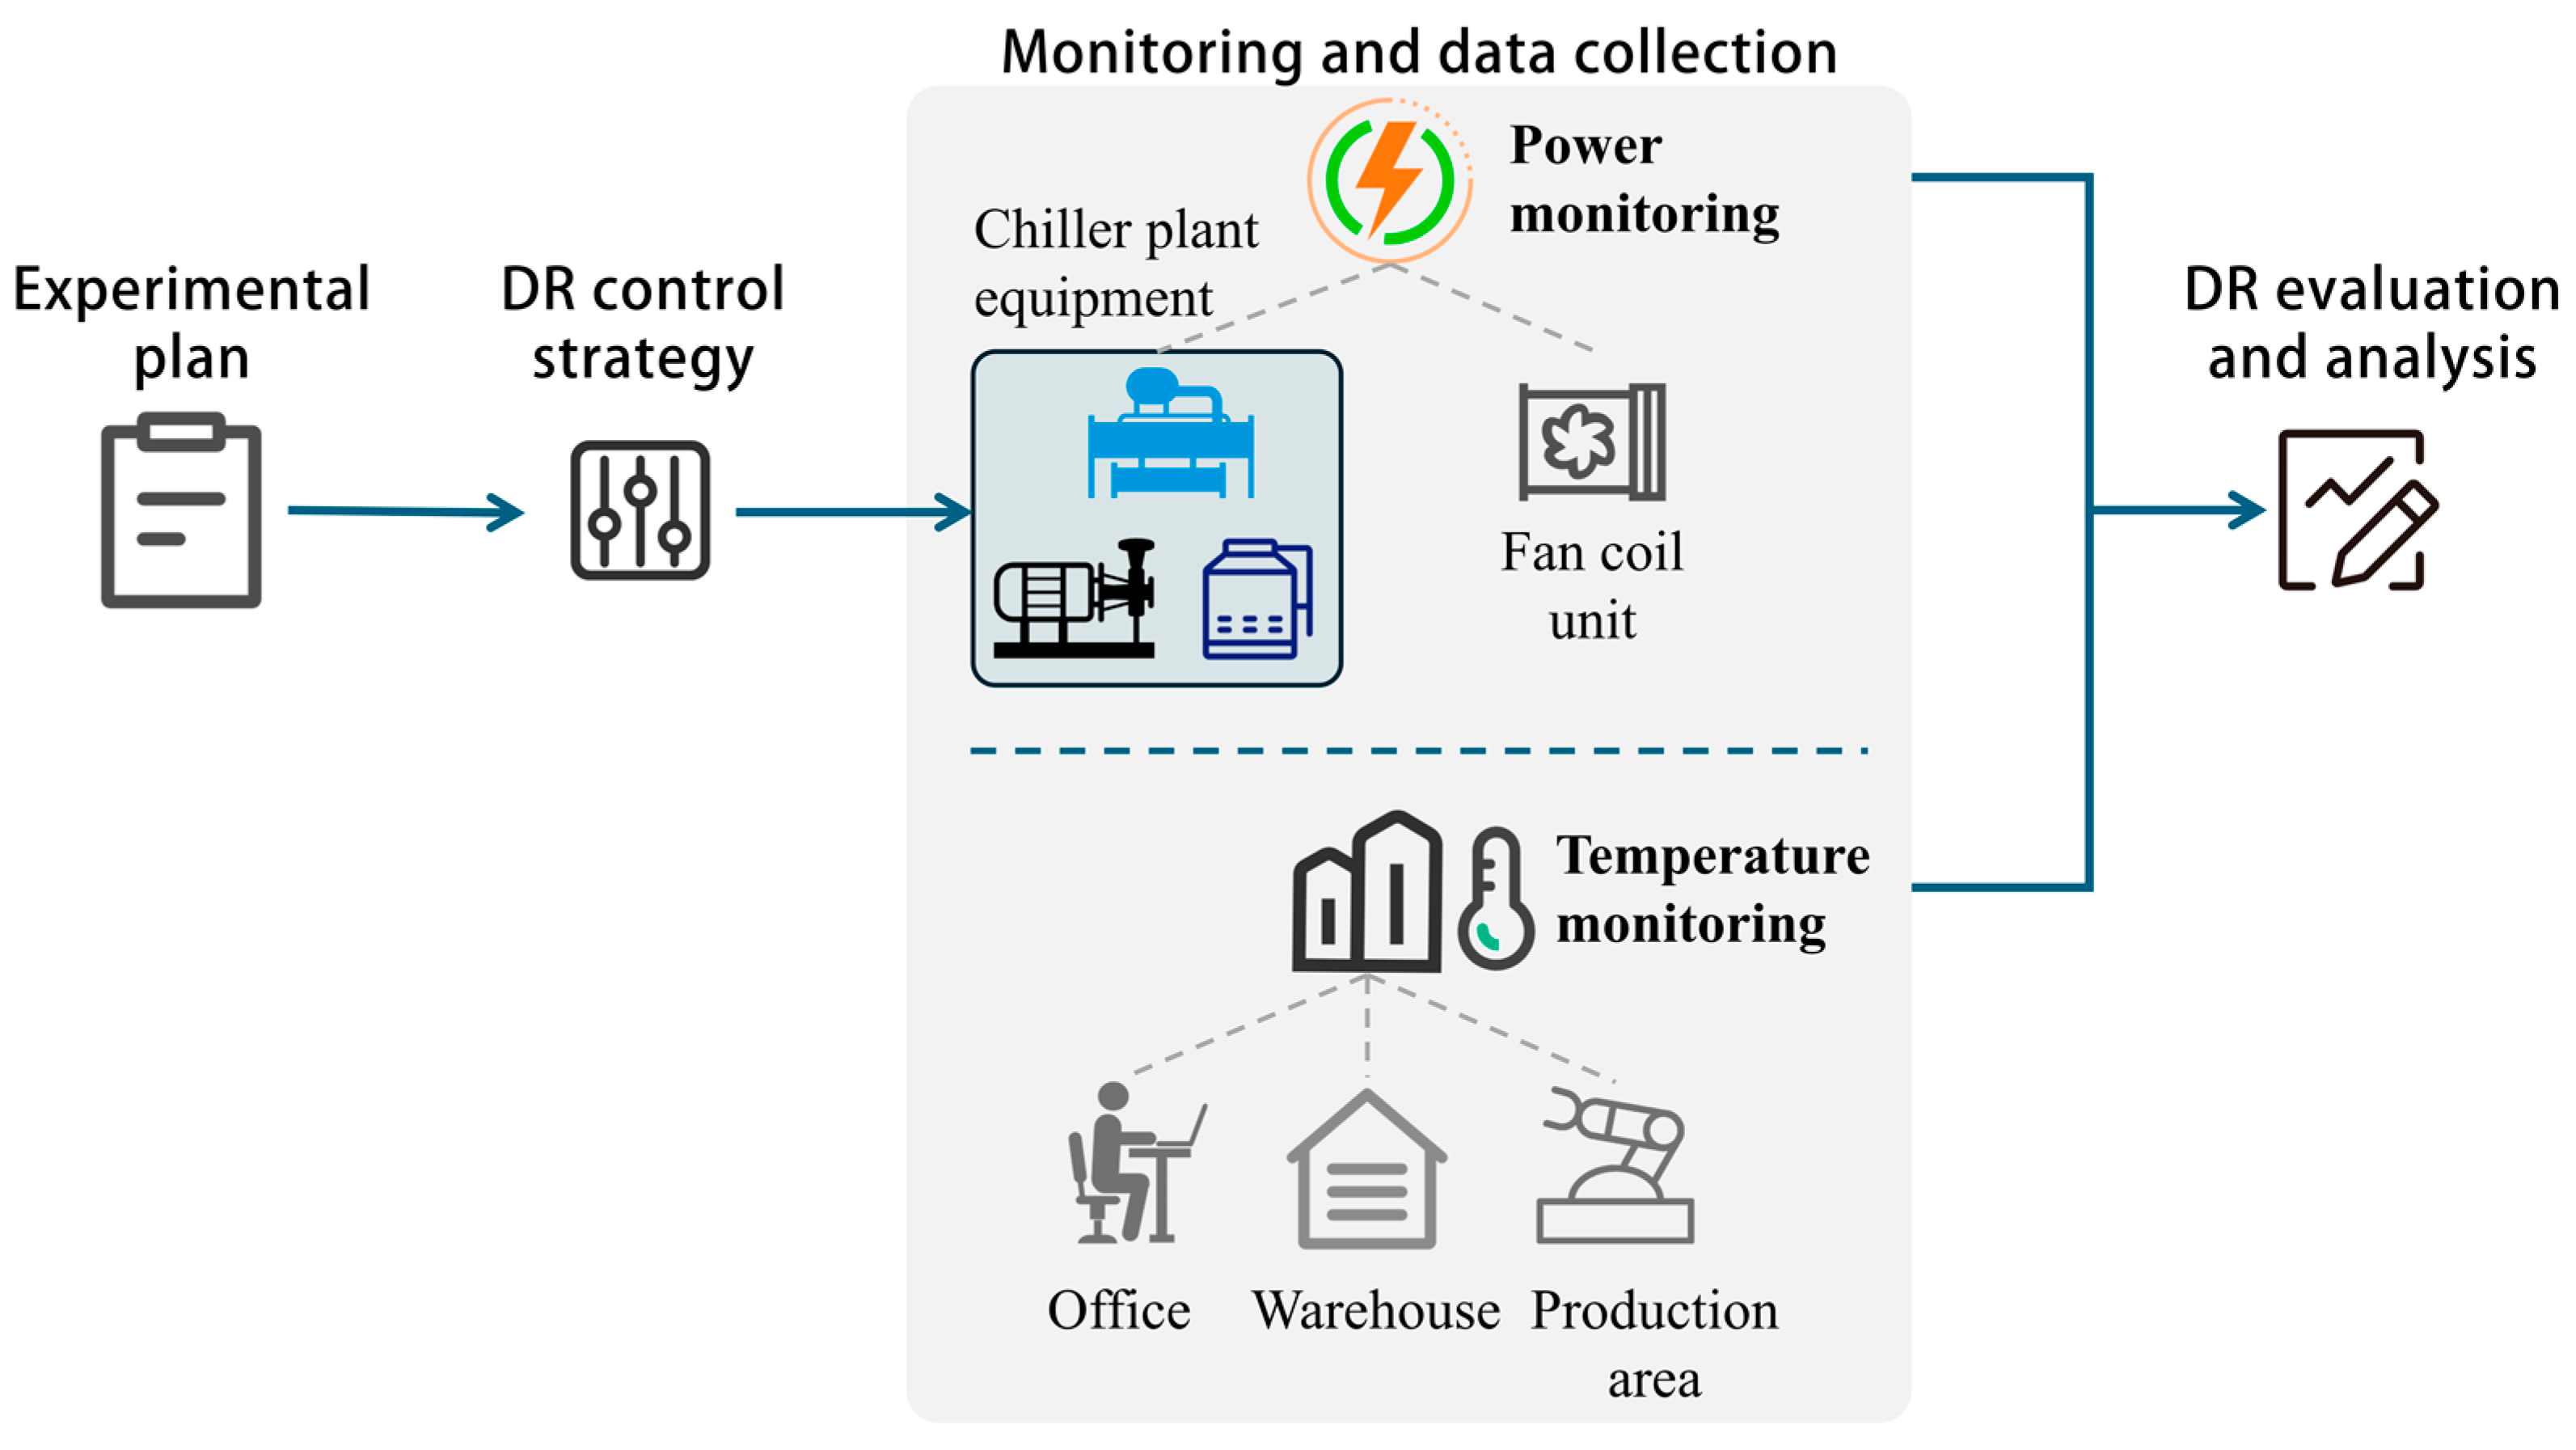
2. Methodology
The outline of this study is illustrated in Figure 1. Initially, an experimental plan was designed to determine the start time of the experiment. Subsequently, a DR control strategy was developed, which involves shutting down chillers and their auxiliary equipment upon receiving a grid emergency DR request. Following this, power consumption and indoor temperature were monitored to analyze system power variations during the DR period and their effects on indoor thermal comfort. Power monitoring included chiller plant equipment and fan coil units. Indoor temperature monitoring points were strategically distributed across offices, warehouses, and production areas to evaluate the temperature impacts of DR on zones with different functions. Finally, the experimental results are evaluated and analyzed.
Figure 1.
An outline of research.
3. Experiment Case and Scheme
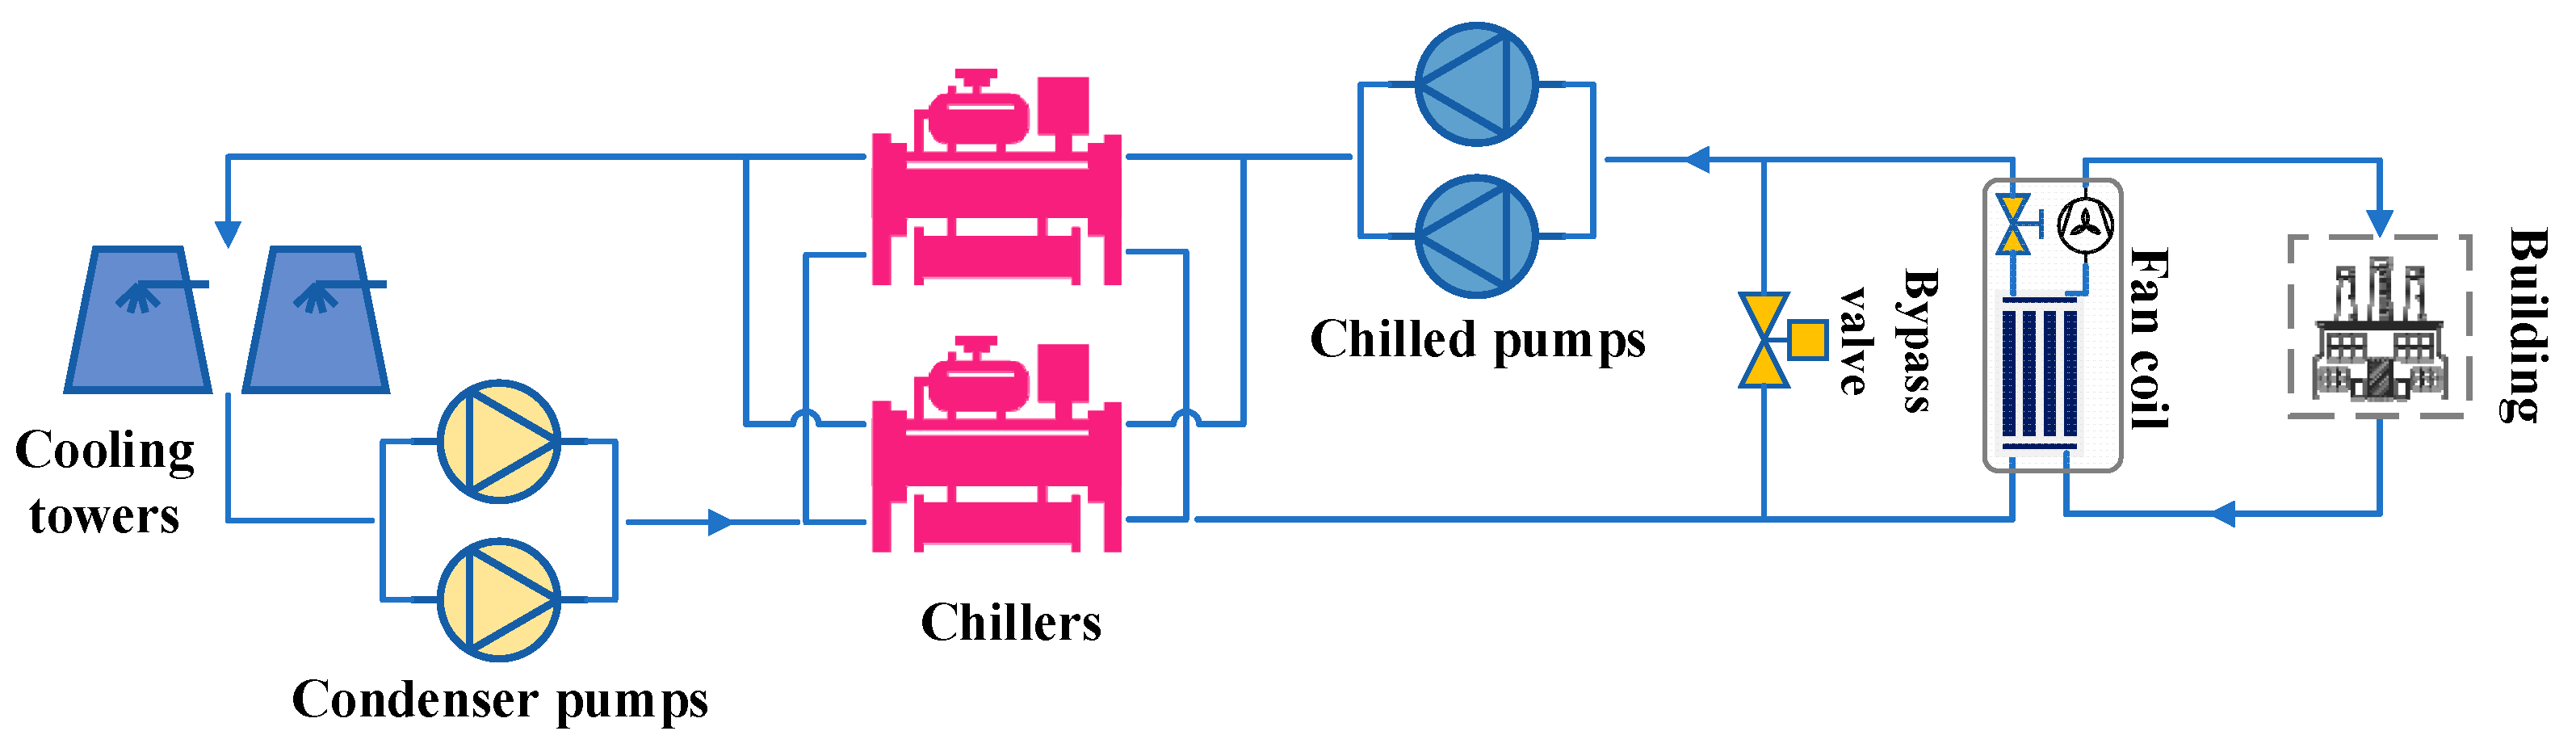
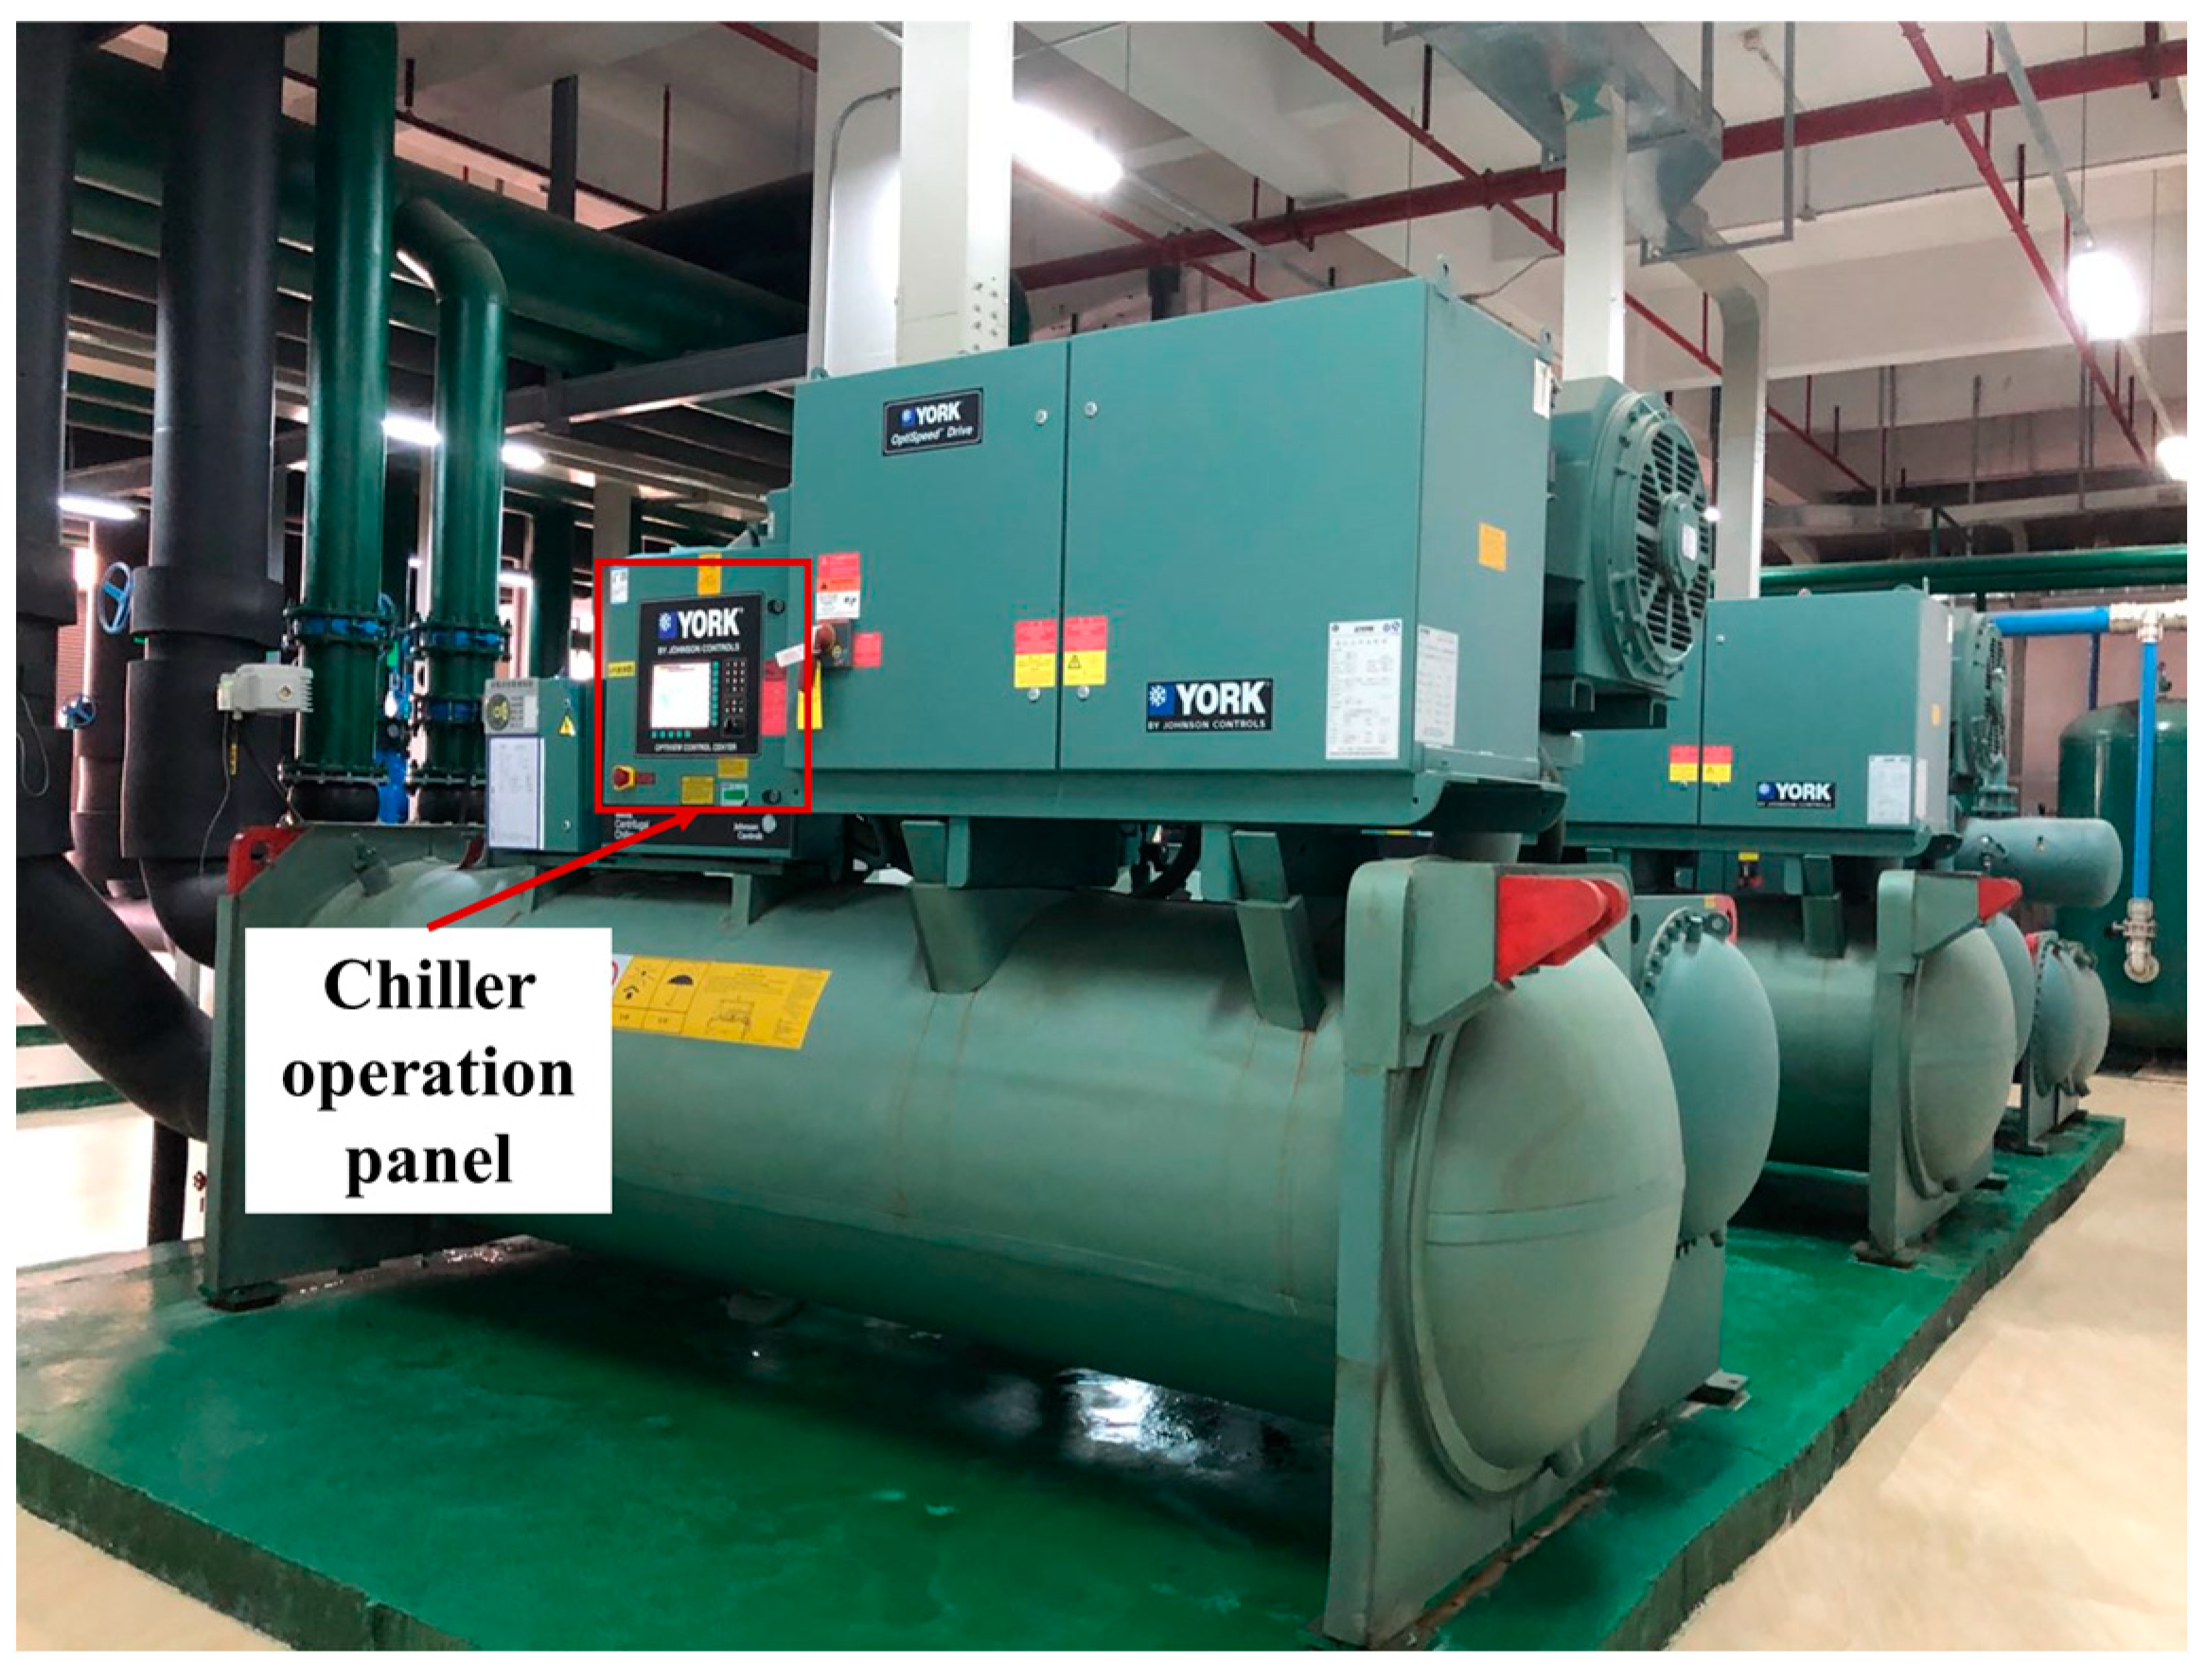
3.1. Experiment Case Description
This study uses Building No.9 in an industrial park in Guangdong, China, as the test facility, as illustrated in Figure 2. The building is a large industrial structure primarily engaged in lithium battery production. It has a total area of 22,000 m2, a height of 21 m, and consists of four floors, classified as a light thermal mass building. The first floor is designated for offices, the second floor serves as a warehouse, and the third and fourth floors are dedicated to lithium battery production lines. The building operates continuously for 24 h.
Figure 2.
(a) Test building; (b) 3D schematic diagram of the test building.
The centralized chiller plants continuously provide cooling capacity to the building, with the system schematic diagram and equipment parameter configuration table shown in Figure 3 and Table 1. The system is configured as a primary pump constant flow system, equipped with one 700 RT centrifugal variable frequency chiller and one 400 RT screw variable frequency chiller. The chilled water pump, condenser water pump, and cooling tower all operate at a fixed frequency. The circulation flow is controlled by a differential pressure bypass valve located on the bypass pipe, which automatically adjusts the valve position based on the pressure difference in the supply and return water mains, ensuring that the current flow matches the cooling load. The air distribution terminal consists of fan coil units to maintain indoor temperature. All auxiliary equipment is interlocked with the chiller for on/off operations. When the chiller is turned off, the corresponding chilled water pump, cooling water pump, and cooling tower will sequentially shut down.
Figure 3.
Schematic of a water-cooled chiller system.
Table 1.
Chiller plant equipment parameters.
3.2. Direct Load Control Strategy
In this experiment, the power load of the chiller is directly controlled to participate in emergency DR. Specifically, control actions are taken to shut down the chiller after the building receives a DR request from the power grid. After issuing the control command, the chiller and auxiliary equipment (including the chilled water pump, condenser water pump, and cooling tower) will gradually shut down according to the built-in logic of the system. The execution of the control strategy is carried out on the operation panel of the chiller control cabinet, as shown in Figure 4. During this period, due to the non-operation of the chiller, a shortage of cooling capacity will occur in the system. Therefore, it is essential to closely monitor the rise in indoor temperature during the implementation of the direct load control (DLC) strategy to avoid excessive impacts on occupant comfort [,]. Although this strategy can quickly reduce the load, it can only be maintained for a limited duration. We arrange for building operation personnel to provide real-time feedback on the current temperature within the building, and the system will be restarted once the allowable temperature threshold is exceeded. It should be noted that due to the limitations of the building energy management system (BEMS), remote control of the indoor fan coil units and temperature set points is not possible. During the testing period, the fan coil units remain in an open state, and the indoor temperature set point is fixed.
Figure 4.
On-site chiller operation panel.
3.3. Data Monitoring and Collection
3.3.1. Data Measurement Equipment
Due to the lack of temperature data storage capabilities in the existing BEMS, this experiment utilized 11 TR001 temperature automatic recording instruments, of which 9 were used to record indoor temperatures and 2 were used to monitor the inlet and outlet temperatures of the chilled water from the chiller. The temperature range is −30~125 °C, with an accuracy of ±0.5 °C and a resolution of 0.1 °C. It features a built-in chip for storing temperature data. The total power of the equipment in the chiller plant and the indoor terminals is automatically collected by the BEMS. Outdoor temperature and radiation intensity are measured by the meteorological station within the industrial park. The sampling interval for all collected data is 30 s.
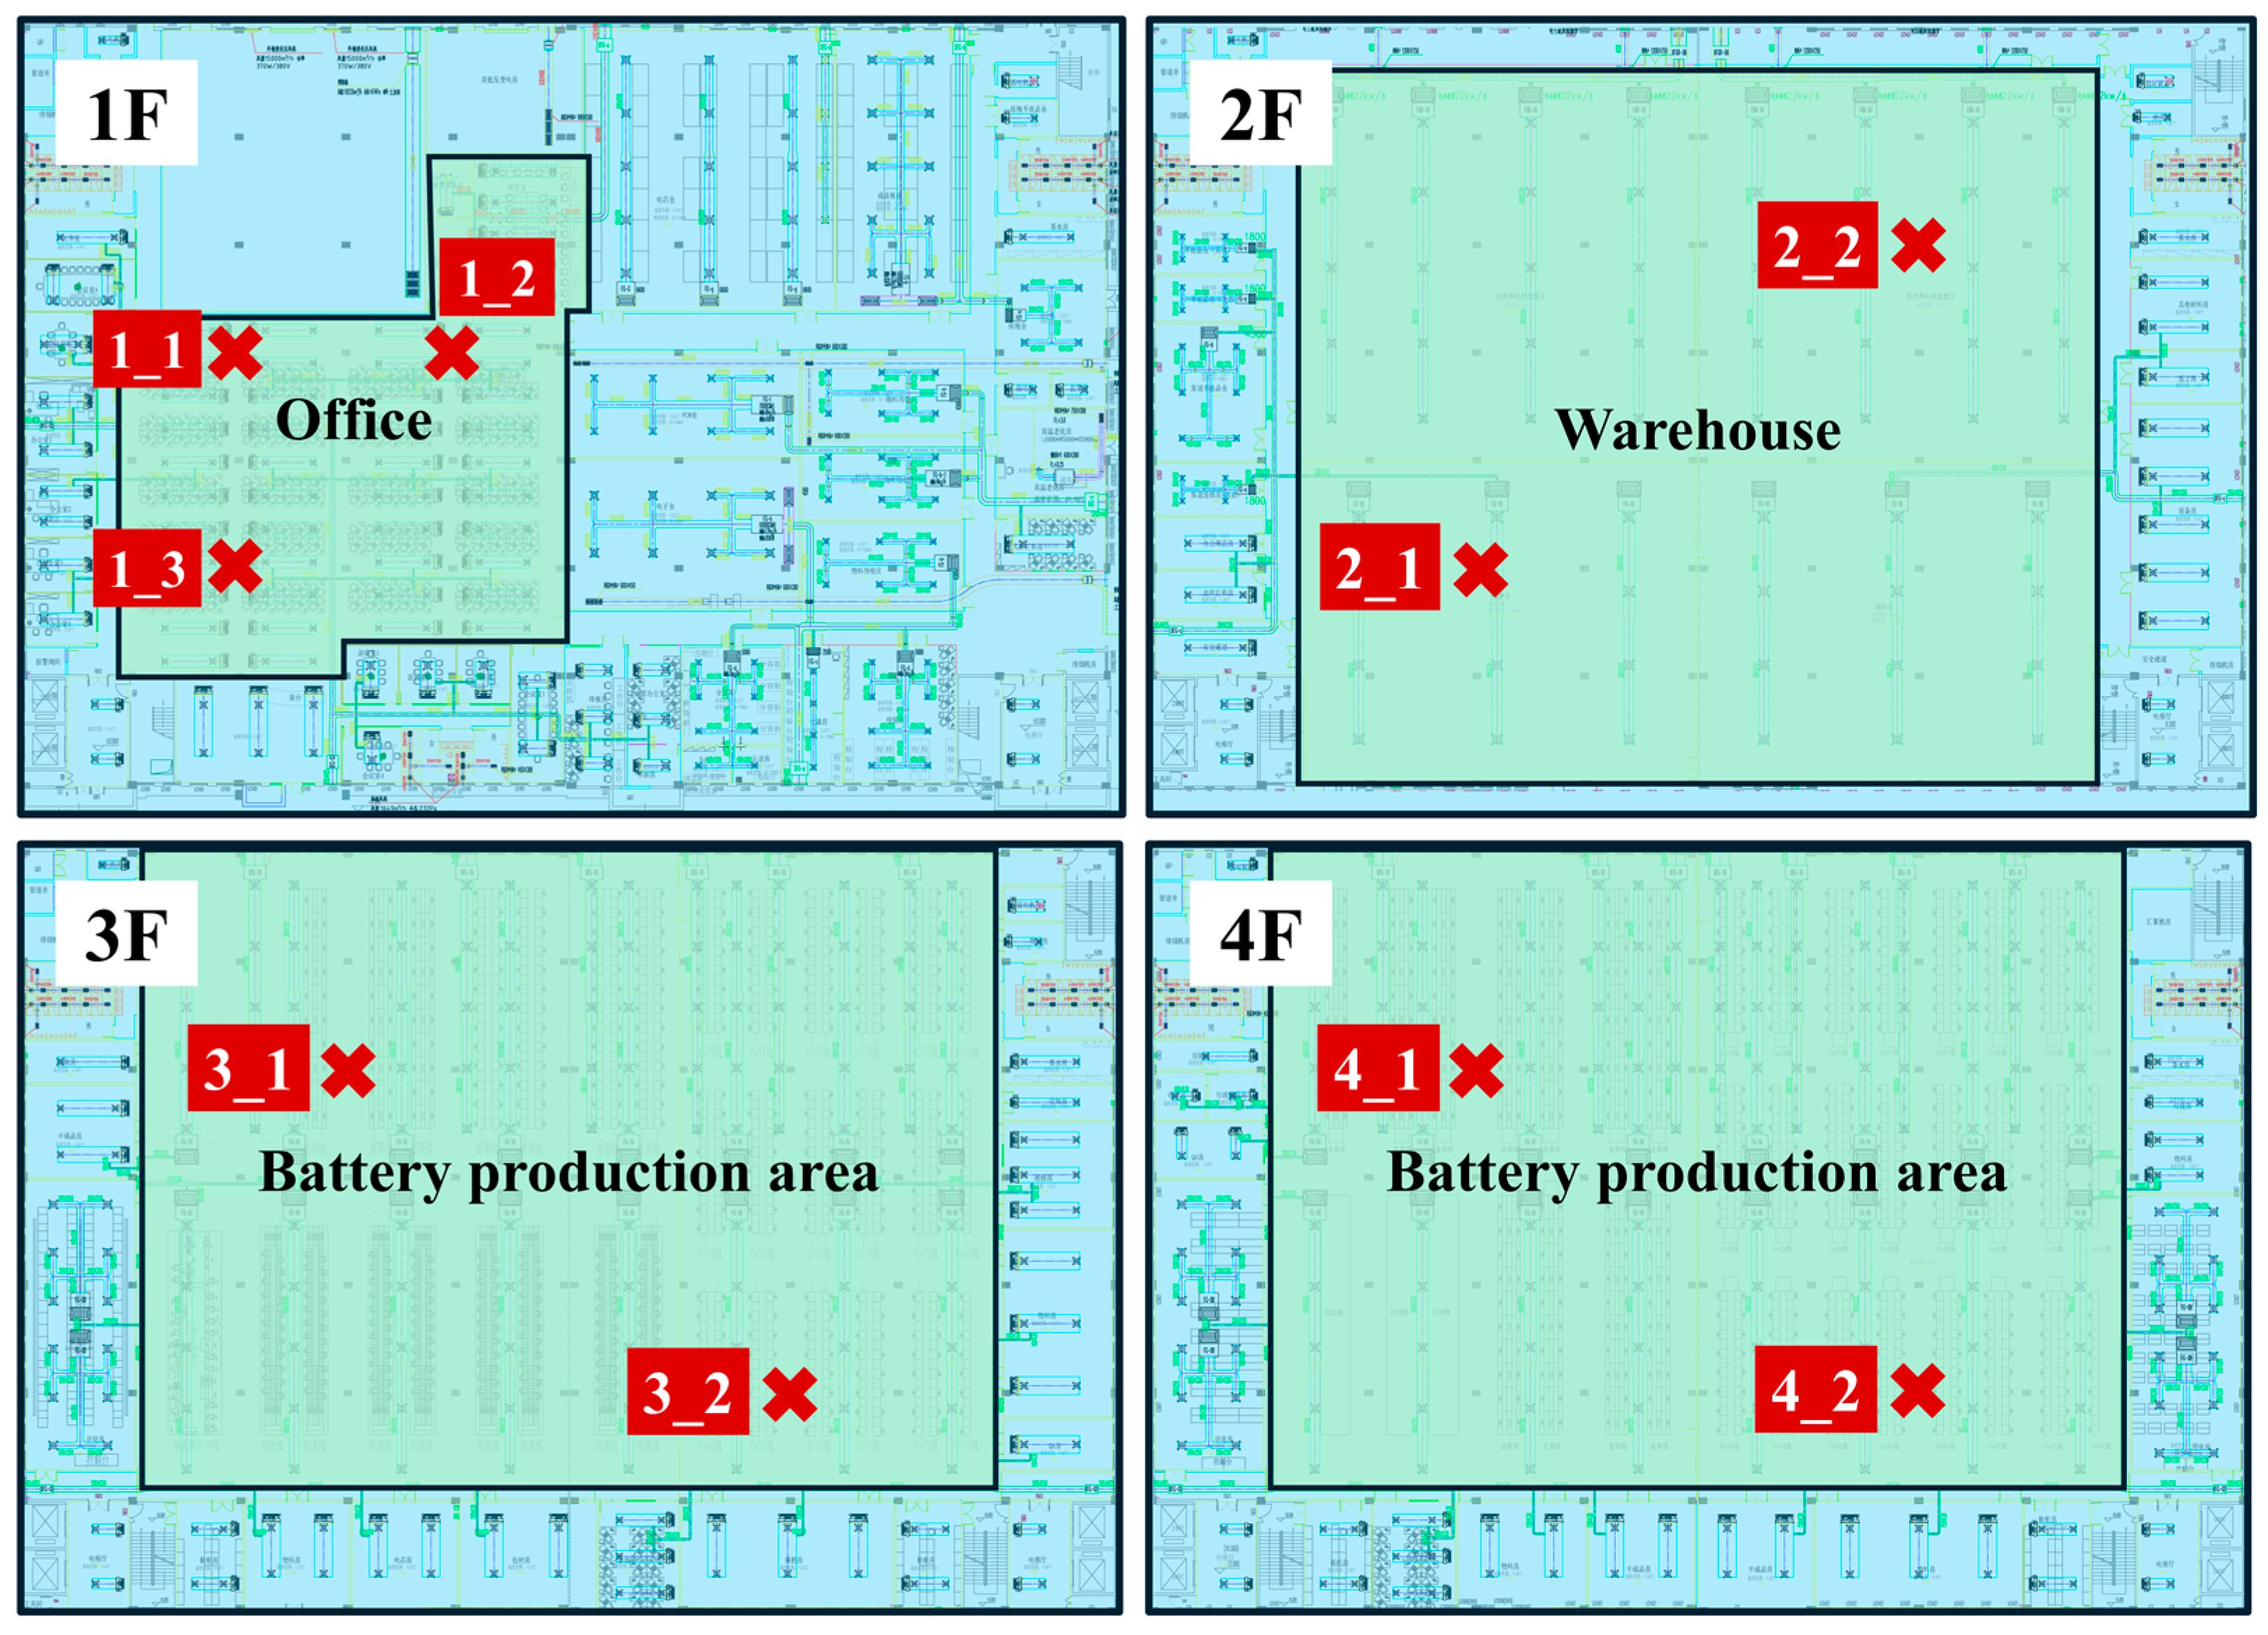
3.3.2. Measuring Point Layout
To monitor the impact on indoor temperature during the shutdown of the chiller, the layout of the temperature sensor measuring points is shown in Figure 5. Sensors were arranged on each floor to monitor the sensitivity of temperature in different usage areas to DR events. Three sensors on the first floor are placed in the office area where personnel are concentrated. Two sensors are arranged diagonally in other areas to measure the overall temperature changes in the region. All sensors are mounted on columns at a height of 2 m above the ground, avoiding positions near air outlets. Figure 6 shows the temperature sensors arranged on the outlet pipeline of the chiller.
Figure 5.
Schematic diagram of the indoor temperature measurement points in the building. The red mark and number represent the sensor placement position and number, respectively.
Figure 6.
Temperature sensors arranged on the chilled water pipeline.
3.4. Experimental Scheme
The experimental tests were conducted on 17 June and 18 June 2020. The outdoor dry bulb temperature and solar radiation are shown in Figure 7. The testing period coincided with the peak phase of summer electricity demand, with the outdoor maximum temperature reaching 33.6 °C. Three shutdown experiments of the chiller were conducted, as shown in Table 2.
Figure 7.
Outdoor dry bulb temperature and solar radiation during the testing period.
Table 2.
Experimental scheme and duration of DR event.
The allowable upper limit for indoor temperature is 28 °C. After each experiment, a sufficient amount of time was allowed to ensure that the system returned to normal operating conditions before starting a new experiment.
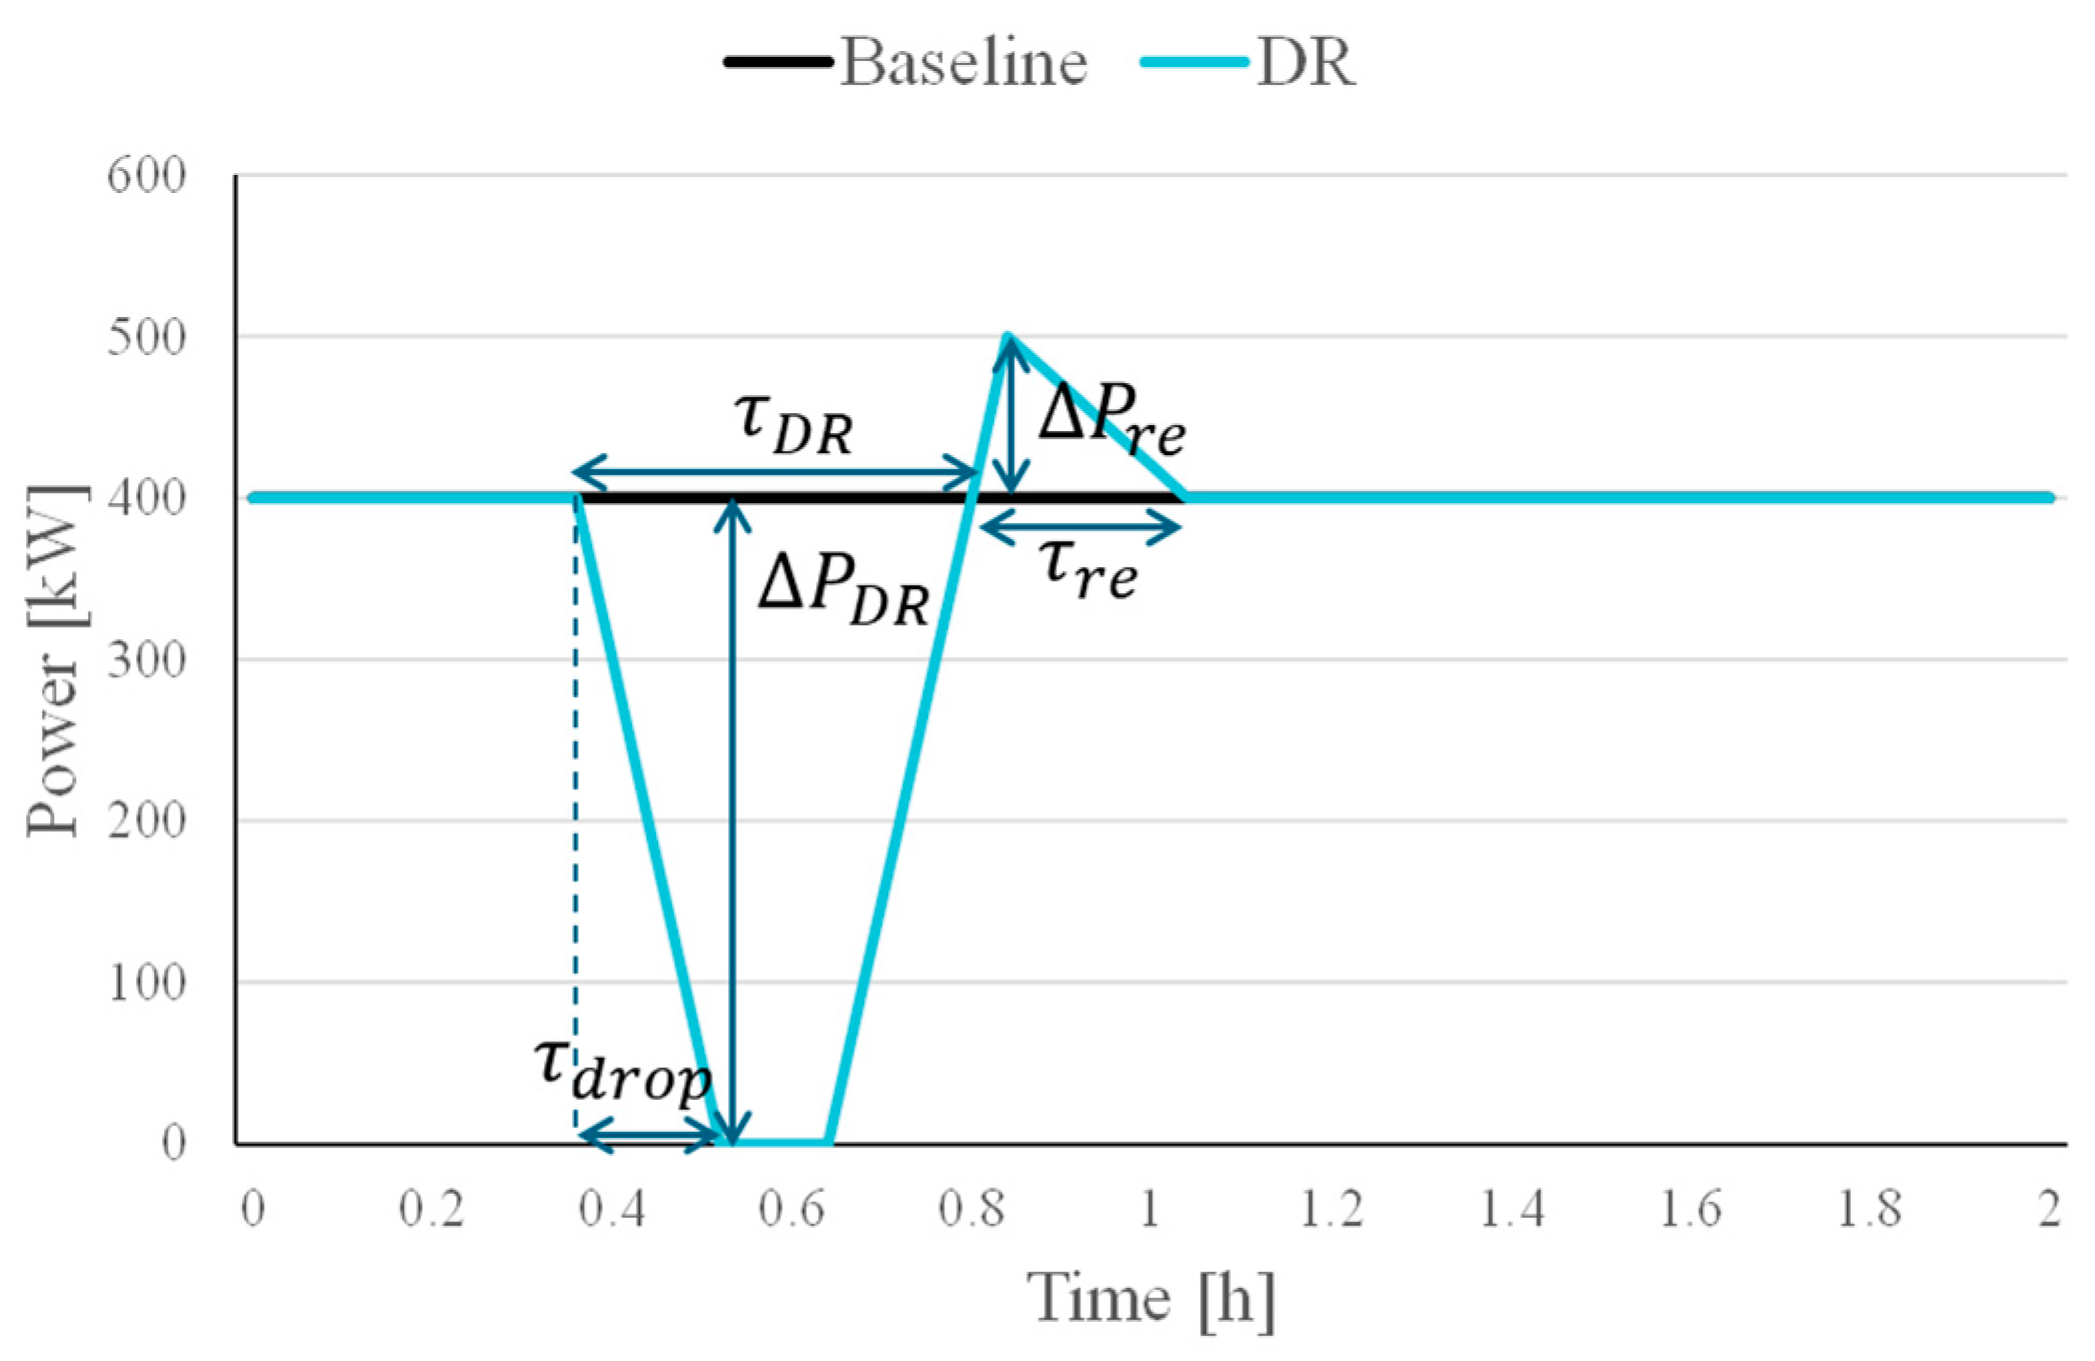
3.5. Flexibility Evaluation Metrics
We adopt the flexibility evaluation metrics shown in Figure 8 to describe the process of chiller participation in emergency demand response []. In the figure, “Baseline” represents the system power during normal operation, while “DR” represents the power curve when participating in DR. indicates the time from the start of DR to the system’s minimum power point, which reflects the system’s time constant, or the speed of response to the grid. represents the maximum power reduction, characterizing the system’s capacity to reduce load. is the duration of the load reduction process. represents the difference between the maximum power and the baseline during the system power rebound process after DR ends []. refers to the time required for the system to recover to normal status after the end of DR.
Figure 8.
Schematic diagram of flexibility evaluation metrics.
4. Experimental Results
Figure 9 shows the change in system power after the chiller is shut down. The chiller was turned off at 17:06 on June 17. It can be observed that there is a rapid decrease in power due to the shutdown of the chiller, with a quick reduction of nearly 200 kW. At this time, the pump remains in the open state, mainly because the built-in control logic of the system requires the chilled water circulation to continue in order to prevent freezing of the chiller evaporator. Five minutes after the chiller is shut down, the chilled and condenser water pumps are turned off, followed by the sequential shutdown of the four cooling towers. At 17:18, the maximum reducible power point was reached, with a reduction of nearly 400 kW. The process of power reduction lasted for 12 min. Three minutes later, the system was restarted, and the chiller and its auxiliary equipment were gradually loaded in the reverse order of the shutdown process, completing this process by 17:24. Afterwards, due to the need to recover the indoor temperature to the original set point, the system experienced a power rebound phenomenon. The duration of the rebound process is determined by the time it takes for the indoor temperature to stabilize. In the first shutdown experiment, it took 38 min to recover, and the maximum rebound power increased by approximately 100 kW compared to the normal operating state.
Figure 9.
The power of the chiller plant and indoor terminals during the implementation of the DLC strategy is shown in (a–c), which represent the experiments that started at 17:06 on 17 June, 11:00 on 18 June, and 16:11 on 18 June, respectively. The hollow circles in the figure sequentially indicate the chiller shutdown time, the time when the minimum power is reached, the time when the chiller is restarted, and the time when the system returns to normal operating conditions. The arrows denote the duration of the chiller shutdown and the recovery time of the system, respectively.
In the second and third experiments, a more aggressive strategy was adopted compared to the first experiment. They lasted 25 min and 52 min, respectively. The maximum power reduction did not show significant differences. This is because the cooling load demand in industrial buildings stems from equipment production, and due to the relatively fixed production schedule, there were no significant fluctuations in the cooling load. The duration of the system recovery was also very similar. However, a noticeable difference was that the third experiment exhibited a significant power rebound, with the maximum rebound power reaching 845 kW. After 52 min of shutdown, the shortage of cooling capacity prompted the automatic control system to activate two chillers for rapid cooling, and the load rates of both units exceeded 70%. In other words, although a longer duration of power reduction can be maintained, there is an additional cost to be paid after the DR ends, as a sharp power rebound may impose a secondary shock on the power grid. Furthermore, it was observed that the terminal power did not show significant changes under any circumstances, which may be attributed to the fact that most of the fan coil units used in the factory operate at a fixed frequency.
Figure 10 shows the dynamic changes in room temperature. The rise in indoor temperature is delayed by approximately 5~10 min after the chiller is shut down, as the chilled water pump remains operational during this period, allowing for the continued utilization of the residual cooling stored in the pipes. The temperature increase in the office area is lower compared to the production area, with no significant change in temperature even during the 20 min shutdown period, while the temperature in the warehouse remains almost unchanged under any operating conditions. The main reason for the differences among the three areas is the variation in internal disturbances. In other words, the greater the heat generated by personnel and production equipment in the area, the more pronounced the temperature change becomes after the chiller is shut down. In contrast, the temperature change in the warehouse is the least noticeable due to the thermal inertia associated with the goods.
Figure 10.
Indoor temperature during the shutdown of the chiller. (a–c) represent the experiments starting at 17:06 on 17 June, 11:00 on June 18, and 16:11 on 18 June, respectively.
In the first two experiments, due to the shorter DR duration, the increase in indoor temperature was within 1 °C, with maximum temperature rises of 0.53 °C and 0.98 °C, respectively. The temperature rise in the first experiment was smaller compared to the second experiment due to the shorter duration. In the afternoon experiment on June 18, the shutdown duration reached 50 min, resulting in a significant increase in indoor temperature. In the production area, there was a general temperature rise of over 1 °C, with the maximum temperature increase on the fourth floor approaching 2 °C; a noticeable upward trend in temperature was also observed in the office area. Our experimental results indicate that due to the different uses and dynamic characteristics of the areas, the temperature increases during the execution of emergency response varies. In regions with high demand, the temperature changes are more pronounced during periods of cooling capacity shortage.
Although no reports of thermal discomfort were received during the experiments, a duration of 50 min is nearly the upper limit for power reduction using the chiller. Furthermore, during the actual implementation of emergency DR strategies, it is advisable to identify the most unfavorable temperature points in the building. In most studies, buildings are treated as a whole or as a single temperature state point, which may lead to an overestimation of the building’s DR potential.
The changes in chilled water temperature are shown in Figure 11. After the chiller is turned off, the inlet and outlet temperatures of the chilled water gradually rise and tend to converge. This is because the chilled water pump remains operational, circulating water within the system, but due to the lack of cooling, this water is heated as it flows through the indoor terminals. After the DR ends and the chiller is restarted, the set point for the outlet temperature of the chilled water is still 10 °C, while the return water temperature is higher. To reach the original temperature set point, the chiller rapidly increases the compressor speed, resulting in a power rebound. In the third experiment, the high return water temperature caused the centrifugal chiller to operate at full load, subsequently leading to the automatic activation of a new chiller. The return water temperature in the second experiment exhibited a different trend compared to the other two experiments, which we cannot explain, possibly due to a sensor malfunction.
Figure 11.
Supply and return water temperatures of chilled water during the shutdown of the chiller. (a–c) represent the experiments starting at 17:06 on 17 June, 11:00 on 18 June, and 16:11 on 18 June, respectively.
The evaluation results of flexibility are shown in Table 3. Since it is not possible to obtain the “true” baseline load in reality, we use the average load during non-response periods of the day as the baseline value. There is no significant difference in , as the rate of load reduction is only related to the system’s built-in control logic. is related to the cooling load at the start of DR. The hotter the weather, the more significant the power reduction. However, this also means that the duration of DR is shorter when the same upper indoor temperature limit is maintained. In the third experiment, was significantly higher than in the first two experiments. A longer generally implies a larger cooling load gap. It should be noted that is essentially related to the cooling load demand after the end of DR, which is also influenced by other factors, such as the control strategies used during DR and the recovery strategies implemented after DR []. The values observed in the three experiments were similar. This indicates that, even when the DR event lasted for an extended period, the system was able to quickly return to its original operating state, provided that sufficient cooling capacity was available. This rapid recovery came at the expense of a higher . In addition, our experimental results are highly consistent with related simulation studies [,], indicating that direct control of chillers during grid response typically involves two major phases: power reduction and power rebound. The difference lies in the fact that simulations may still fail to fully capture the system dynamics and control logic, leading to discrepancies with the actual power curve.
Table 3.
Flexibility evaluation results.
5. Discussion
5.1. Impact of Control Logic
This section further discusses the impact of the internal control logic of the system on the participation of centralized chiller plants in emergency DR. Figure 12 shows the time required for the chiller and its auxiliary equipment on/off, as well as the temperature changes during participation in emergency DR. The first phenomenon we observed is that the time from the system’s initial response to the minimum power point is closely related to the system’s own interlocking control logic. The purpose of these logics is typically to protect the stable operation of the system. The second phenomenon observed was that after the system was restarted in the third experiment, a second chiller was automatically loaded, resulting in a new power peak after the DR. Although this facilitates a quicker recovery of the system to normal conditions, it should be limited to practical applications. Otherwise, it may lead to multiple chillers being continuously loaded and then subsequently unloaded in quick succession. Building operators are generally unwilling to observe frequent cycling of chillers, as this is perceived as an unstable operation, which affects the building’s confidence in participating in DR programs.
Figure 12.
The time for equipment on/off and indoor temperature changes.
The experimental results indicate that the control logic of the HVAC system significantly influences the DR process. In particular, when multiple chillers are operating in the building, they cannot all be shut down immediately due to dead time in the control logic, which may result in a delayed response time. Furthermore, recovery strategies following DR should be carefully evaluated and integrated into the existing control logic. These strategies are designed to help the building return to its original operating state more smoothly, thereby preventing secondary shocks to the grid. Therefore, it is recommended to verify or adjust the control logic before including other similar buildings in emergency demand response programs. For example, increasing the indoor temperature setpoint to reduce cooling load demand, limiting the number of chillers in operation, or utilizing model predictive control to develop more advanced DR control strategies.
5.2. Limitations
This study provides experimental evidence for the participation of chillers in grid emergency response. However, the following limitations should be addressed in future research:
- Our test case did not consider scenarios where multiple chillers operate simultaneously. Due to the coupling of cooling load distribution among them, the control strategy for chillers should be studied more thoroughly. For example, shutting down only some of the operating chillers may increase the load rate of the remaining units, thereby failing to significantly reduce the system’s power consumption.
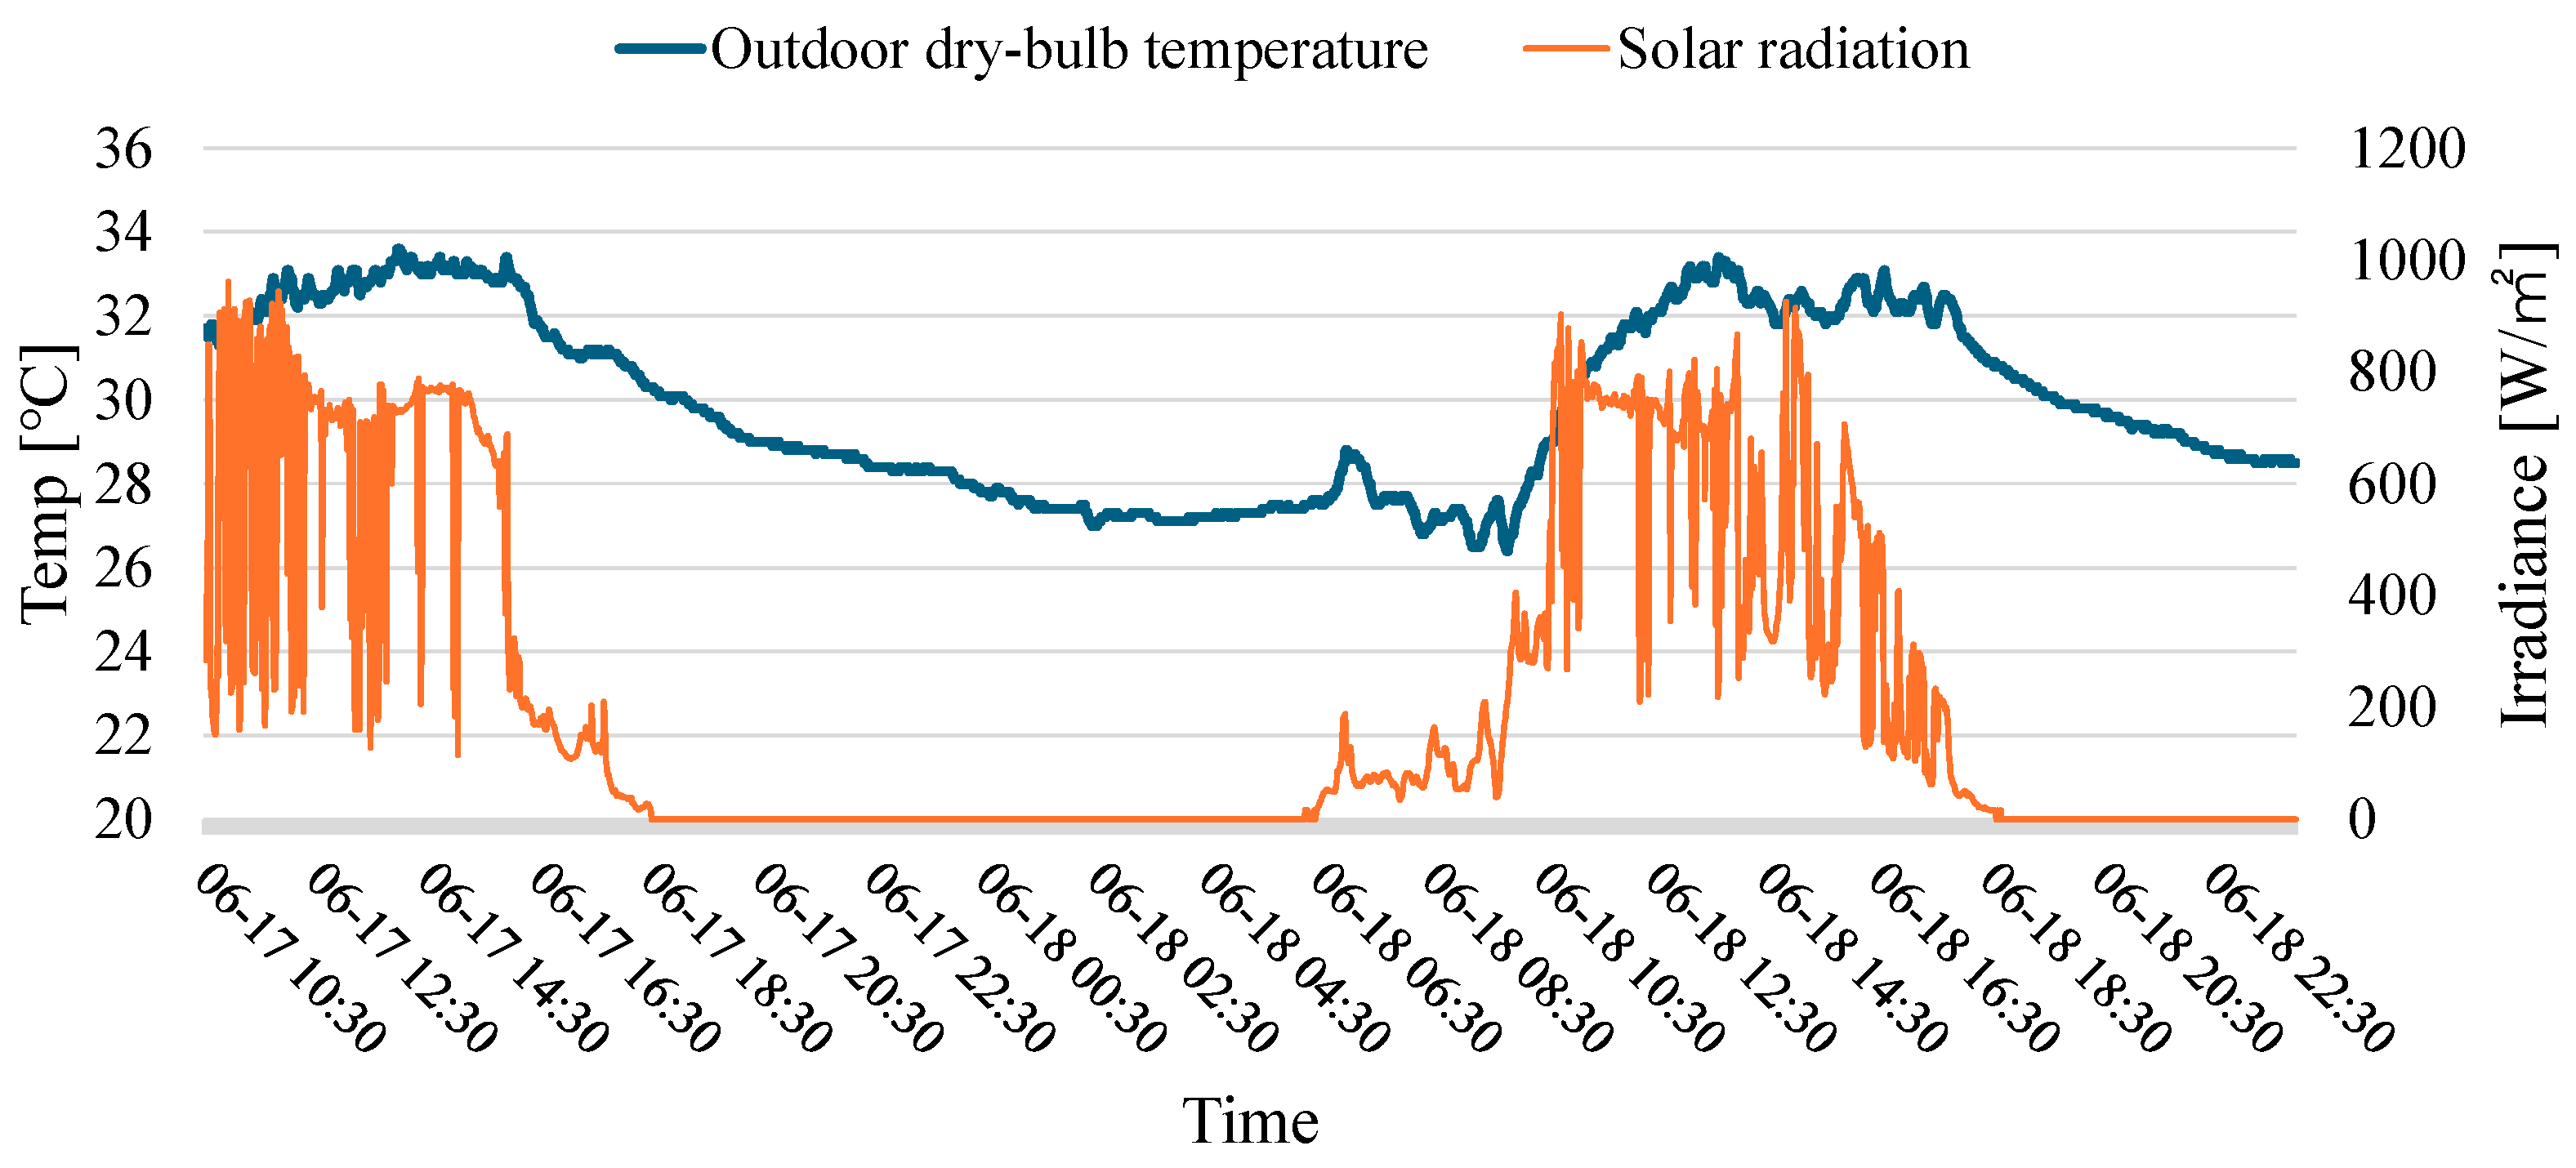
- In our experiment, only the core zones of the building were monitored, while some peripheral zones were not equipped with temperature sensors. These zones may receive more solar radiation compared to the core zones, leading to greater temperature increases during DR events.
- The experiment was conducted in an industrial facility located in a subtropical climate zone. However, the actual potential of buildings in different climate zones and of different types (e.g., large commercial and office buildings) to participate in grid emergency DR requires more extensive experiments for exploration.
6. Conclusions
This study conducted field experiments to test the feasibility of controlling centralized chiller plant loads for participation in emergency demand response (DR). The main conclusions are as follows:
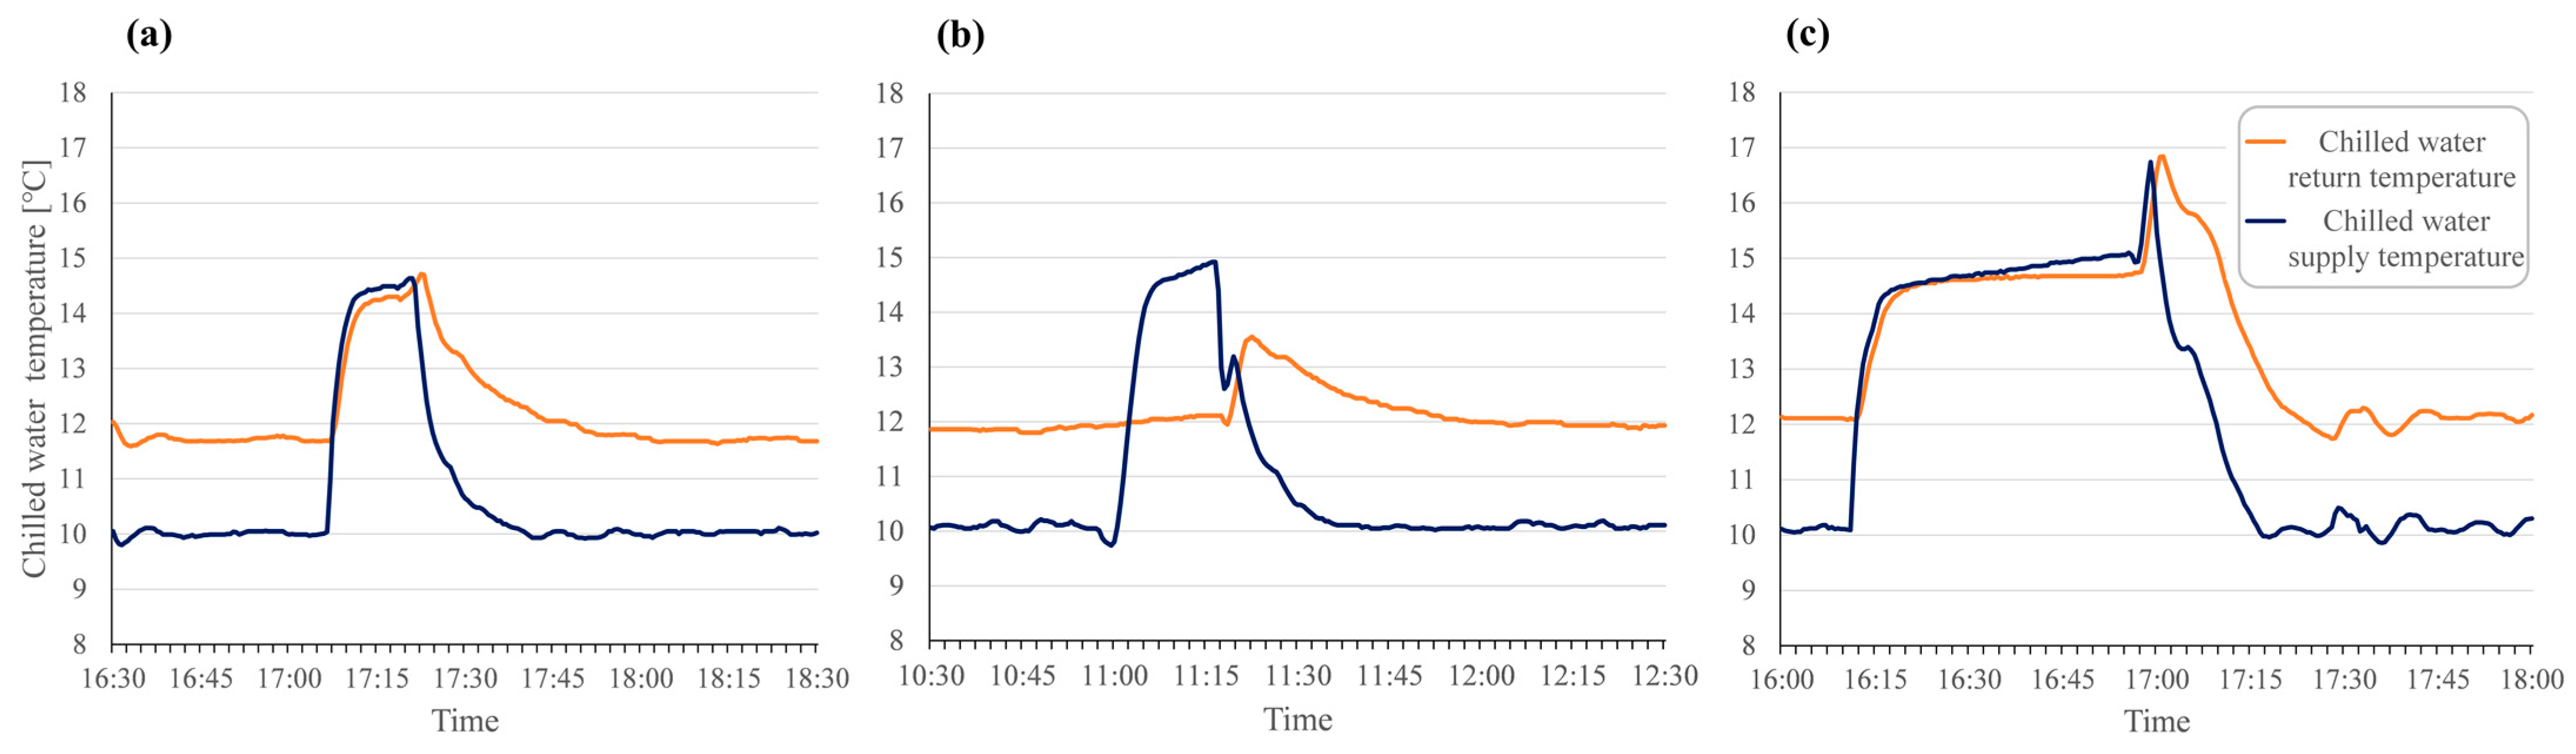
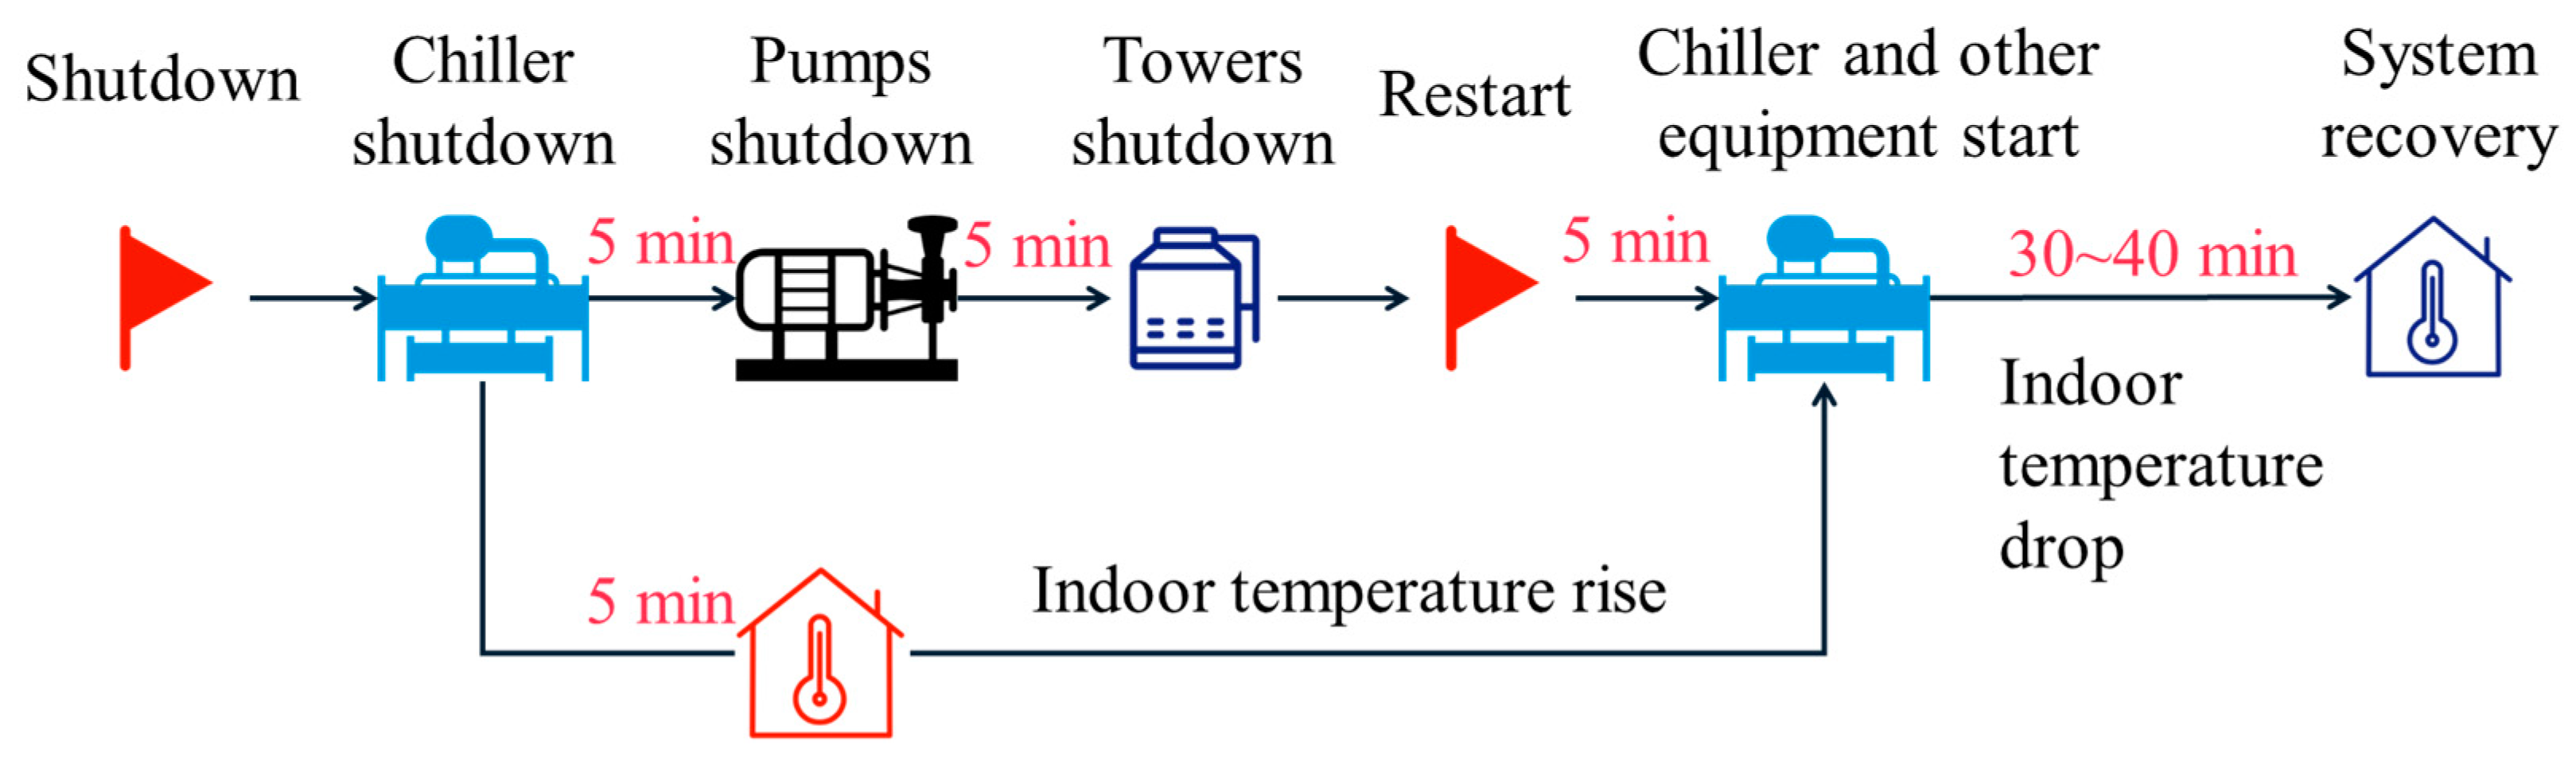
- Shutting down the chiller is an effective and rapid response strategy that does not significantly impact the thermal comfort of building occupants. The system can achieve load reduction in about 10 min. Experimental results during hot summer conditions indicate that the system power can be reduced by 380~459 kW. With a DR duration of 20 min, the temperature increase in various areas of the building is less than 1 °C. Even with a shutdown of 50 min, the temperature remains within an acceptable range, with no reports of thermal discomfort from occupants.
- With the extension of the DR duration, the system can reduce more energy, but this also leads to a more pronounced rebound phenomenon after the DR ends. Experimental results indicate that it takes about 40 min to recover the indoor temperature to its original state.
- The internal control logic of the system is an important factor influencing the emergency DR process. When buildings participate in DR, it is essential to consider modifying the existing control logic to avoid excessive rebound power that could create secondary shocks to the power grid. Additionally, stable operation of the system helps to enhance the confidence of building operators in subsequent participation in DR.
Author Contributions
Conceptualization, J.Z. and J.N.; methodology, J.Z. and Z.T.; validation, Y.L. (Yakai Lu) and H.Z.; formal analysis, J.Z.; writing—original draft preparation, J.Z.; writing—review and editing, Y.L. (Yakai Lu) and Y.L. (Yitong Li); visualization, J.Z., H.Z. and Y.L. (Yitong Li); supervision, Z.T. and J.N.; funding acquisition, Z.T. and J.N. All authors have read and agreed to the published version of the manuscript.
Funding
The China Postdoctoral Science Foundation 2021M702447 “Study on the thermoelectric dynamic response mechanism and response potential quantification method of building air conditioning system”; the Ministry of Science and Technology of the People’s Republic of China 2024YFE0199300 “Research on key technologies for flexibility and interactivity of grid-friendly building integrated energy system”.
Data Availability Statement
The data presented in this study are available on request from the corresponding author. The data are not publicly available due to the reason of technical confidentiality.
Conflicts of Interest
The authors declare no conflict of interest.
References
- Oyekale, J.; Petrollese, M.; Tola, V.; Cau, G. Impacts of renewable energy resources on effectiveness of grid-integrated systems: Succinct review of current challenges and potential solution strategies. Energies 2020, 13, 4856. [Google Scholar] [CrossRef]
- Niu, J.; Tian, Z.; Yue, L. Robust optimal design of building cooling sources considering the uncertainty and cross-correlation of demand and source. Appl. Energy 2020, 265, 114793. [Google Scholar] [CrossRef]
- Ma, Z.; Awan, M.B.; Lu, M.; Li, S.; Aziz, M.S.; Zhou, X.; Du, H.; Sha, X.; Li, Y. An Overview of Emerging and Sustainable Technologies for Increased Energy Efficiency and Carbon Emission Mitigation in Buildings. Buildings 2023, 13, 2658. [Google Scholar] [CrossRef]
- Dong, J.; Xue, G.; Li, R. Demand response in China: Regulations, pilot projects and recommendations–A review. Renew. Sustain. Energy Rev. 2016, 59, 13–27. [Google Scholar] [CrossRef]
- Fu, Y.; O’Neill, Z.; Wen, J.; Pertzborn, A.; Bushby, S.T. Utilizing commercial heating, ventilating, and air conditioning systems to provide grid services: A review. Appl. Energy 2022, 307, 118133. [Google Scholar] [CrossRef]
- Song, Z.; Cao, S.; Yang, H. Assessment of solar radiation resource and photovoltaic power potential across China based on optimized interpretable machine learning model and GIS-based approaches. Appl. Energy 2023, 339, 121005. [Google Scholar] [CrossRef]
- Pérez-Lombard, L.; Ortiz, J.; Pout, C. A review on buildings energy consumption information. Energy Build. 2008, 40, 394–398. [Google Scholar] [CrossRef]
- Tian, Z.; Li, X.; Niu, J.; Zhou, R.; Li, F. Enhancing operation flexibility of distributed energy systems: A flexible multi-objective optimization planning method considering long-term and temporary objectives. Energy 2024, 288, 129612. [Google Scholar] [CrossRef]
- Zhang, X.; Xiao, F.; Li, Y.; Ran, Y.; Gao, W. Energy flexibility and resilience analysis of demand-side energy efficiency measures within existing residential houses during cold wave event. Build. Simul. 2024, 17, 1043–1063. [Google Scholar] [CrossRef]
- Zhu, J.; Niu, J.; Tian, Z.; Zhou, R.; Ye, C. Rapid quantification of demand response potential of building HAVC system via data-driven model. Appl. Energy 2022, 325, 119796. [Google Scholar] [CrossRef]
- Chen, Y.; Chen, Z.; Yuan, X.; Su, L.; Li, K. Optimal control strategies for demand response in buildings under penetration of renewable energy. Buildings 2022, 12, 371. [Google Scholar] [CrossRef]
- Mitić, T.K.; Voss, K. Development of a joint penalty signal for building energy flexibility in operation with power grids: Analysis and case study. Buildings 2023, 13, 1338. [Google Scholar] [CrossRef]
- Morovat, N.; Athienitis, A.K.; Candanedo, J.A.; Delcroix, B. Model-based control strategies to enhance energy flexibility in electrically heated school buildings. Buildings 2022, 12, 581. [Google Scholar] [CrossRef]
- Wang, H.; Wang, S.; Tang, R. Development of grid-responsive buildings: Opportunities, challenges, capabilities and applications of HVAC systems in non-residential buildings in providing ancillary services by fast demand responses to smart grids. Appl. Energy 2019, 250, 697–712. [Google Scholar] [CrossRef]
- Lu, F.; Yu, Z.; Yang, X.; Zou, Y. Energy flexibility analysis of office building using pre-cooling with structural thermal mass. IOP Conf. Series Mater. Sci. Eng. 2019, 609, 052022. [Google Scholar] [CrossRef]
- Wang, J.; Wei, Z.; Zhu, Y.; Zheng, C.; Li, B.; Zhai, X. Demand response via optimal pre-cooling combined with temperature reset strategy for air conditioning system: A case study of office building. Energy 2023, 282, 128751. [Google Scholar] [CrossRef]
- Song, Z.; Cao, S.; Yang, H. An interpretable framework for modeling global solar radiation using tree-based ensemble machine learning and Shapley additive explanations methods. Appl. Energy 2024, 364, 123238. [Google Scholar] [CrossRef]
- Motegi, N. Introduction to Commercial Building Control Strategies and Techniques for Demand Response—Appendices; Lawrence Berkeley National Laboratory: Berkeley, CA, USA, 2007. [Google Scholar]
- Kang, J.; Weng, S.; Li, Y.; Ma, T. Study of building demand response method based on indoor temperature setpoint control of VRV air conditioning. Buildings 2022, 12, 415. [Google Scholar] [CrossRef]
- Lu, X.; Adetola, V.A.; Bhattacharya, S. Large-scale simulation-based parametric analysis of an optimal precooling strategy for demand flexibility in a commercial office building. Energy Build. 2024, 316, 114284. [Google Scholar] [CrossRef]
- Zhang, K.; Saloux, E.; Candanedo, J.A. Enhancing energy flexibility of building clusters via supervisory room temperature control: Quantification and evaluation of benefits. Energy Build. 2024, 302, 113750. [Google Scholar] [CrossRef]
- Xue, X.; Wang, S.; Yan, C.; Cui, B. A fast chiller power demand response control strategy for buildings connected to smart grid. Appl. Energy 2015, 137, 77–87. [Google Scholar] [CrossRef]
- Beckman, W.A.; Broman, L.; Fiksel, A.; Klein, S.A.; Lindberg, E.; Schuler, M.; Thornton, J. TRNSYS The most complete solar energy system modeling and simulation software. Renew. Energy 1994, 5, 486–488. [Google Scholar] [CrossRef]
- Wang, H.; Ding, Z.; Tang, R.; Chen, Y.; Fan, C.; Wang, J. A machine learning-based control strategy for improved performance of HVAC systems in providing large capacity of frequency regulation service. Appl. Energy 2022, 326, 119962. [Google Scholar] [CrossRef]
- Chen, Y.; Xu, P.; Chen, Z.; Wang, H.; Sha, H.; Ji, Y.; Zhang, Y.; Dou, Q.; Wang, S. Experimental investigation of demand response potential of buildings: Combined passive thermal mass and active storage. Appl. Energy 2020, 280, 115956. [Google Scholar] [CrossRef]
- Huang, S.; Katipamula, S.; Lutes, R. Experimental investigation on thermal inertia characterization of commercial buildings for demand response. Energy Build. 2021, 252, 111384. [Google Scholar] [CrossRef]
- Wang, H.; Wang, S.; Shan, K. Experimental study on the dynamics, quality and impacts of using variable-speed pumps in buildings for frequency regulation of smart power grids. Energy 2020, 199, 117406. [Google Scholar] [CrossRef]
- Vrettos, E.; Kara, E.C.; MacDonald, J.; Andersson, G.; Callaway, D.S. Experimental Demonstration of Frequency Regulation by Commercial Buildings—Part II: Results and Performance Evaluation. IEEE Trans. Smart Grid 2018, 9, 3224–3234. [Google Scholar] [CrossRef]
- Vrettos, E.; Kara, E.C.; MacDonald, J.; Andersson, G.; Callaway, D.S. Experimental Demonstration of Frequency Regulation by Commercial Buildings—Part I: Modeling and Hierarchical Control Design. IEEE Trans. Smart Grid 2018, 9, 3213–3223. [Google Scholar] [CrossRef]
- Kim, D.; Braun, J.E. MPC solution for optimal load shifting for buildings with ON/OFF staged packaged units: Experimental demonstration, and lessons learned. Energy Build. 2022, 266, 112118. [Google Scholar] [CrossRef]
- Ham, S.W.; Kim, D.; Barham, T.; Ramseyer, K. The first field application of a low-cost MPC for grid-interactive K-12 schools: Lessons-learned and savings assessment. Energy Build. 2023, 296, 113351. [Google Scholar] [CrossRef]
- Tang, H.; Wang, S.; Li, H. Flexibility categorization, sources, capabilities and technologies for energy-flexible and grid-responsive buildings: State-of-the-art and future perspective. Energy 2020, 219, 119598. [Google Scholar] [CrossRef]
- Niu, J.; Zhou, R.; Tian, Z.; Zhu, J.; Lu, Y.; Ma, J. Energy-saving potential analysis for a 24-hour operating chiller plant using the model-based global optimization method. J. Build. Eng. 2023, 69, 106213. [Google Scholar] [CrossRef]
- Tian, Z.; Lu, Z.; Lu, Y.; Zhang, Q.; Lin, X.; Niu, J. An unsupervised data mining-based framework for evaluation and optimization of operation strategy of HVAC system. Energy 2024, 291, 130043. [Google Scholar] [CrossRef]
- Tang, R.; Fan, C.; Zeng, F.; Feng, W. Data-driven model predictive control for power demand management and fast demand response of commercial buildings using support vector regression. Build. Simul. 2022, 15, 317–331. [Google Scholar] [CrossRef]
- Miri, M.; McPherson, M. Demand response programs: Comparing price signals and direct load control. Energy 2024, 288, 129673. [Google Scholar] [CrossRef]
- Tang, R.; Wang, S.; Yan, C. A direct load control strategy of centralized air-conditioning systems for building fast demand response to urgent requests of smart grids. Autom. Constr. 2018, 87, 74–83. [Google Scholar] [CrossRef]
- Junker, R.G.; Azar, A.G.; Lopes, R.A.; Lindberg, K.B.; Reynders, G.; Relan, R.; Madsen, H. Characterizing the energy flexibility of buildings and districts. Appl. Energy 2018, 225, 175–182. [Google Scholar] [CrossRef]
- Wang, R.; Xin, X.; Liu, J.; Lu, S.; Sun, Y.; Zhao, W. Quantitative method and influencing factors analysis of demand response performance of air conditioning load with rebound effect. In Building Simulation; Springer: Berlin/Heidelberg, Germany, 2024. [Google Scholar]
Disclaimer/Publisher’s Note: The statements, opinions and data contained in all publications are solely those of the individual author(s) and contributor(s) and not of MDPI and/or the editor(s). MDPI and/or the editor(s) disclaim responsibility for any injury to people or property resulting from any ideas, methods, instructions or products referred to in the content. |
© 2025 by the authors. Licensee MDPI, Basel, Switzerland. This article is an open access article distributed under the terms and conditions of the Creative Commons Attribution (CC BY) license (https://creativecommons.org/licenses/by/4.0/).