
A Systematic and Objective Framework for Evaluating Subcontractor Performance Using Monte Carlo Simulation Coupled with the Analytic Hierarchy Process and a Linear Additive Utility Model


Abstract
1. Introduction
2. Literature Review
2.1. Indices and Sub-Indices with Measurements
2.2. Assessment of Subcontractor Performance Process
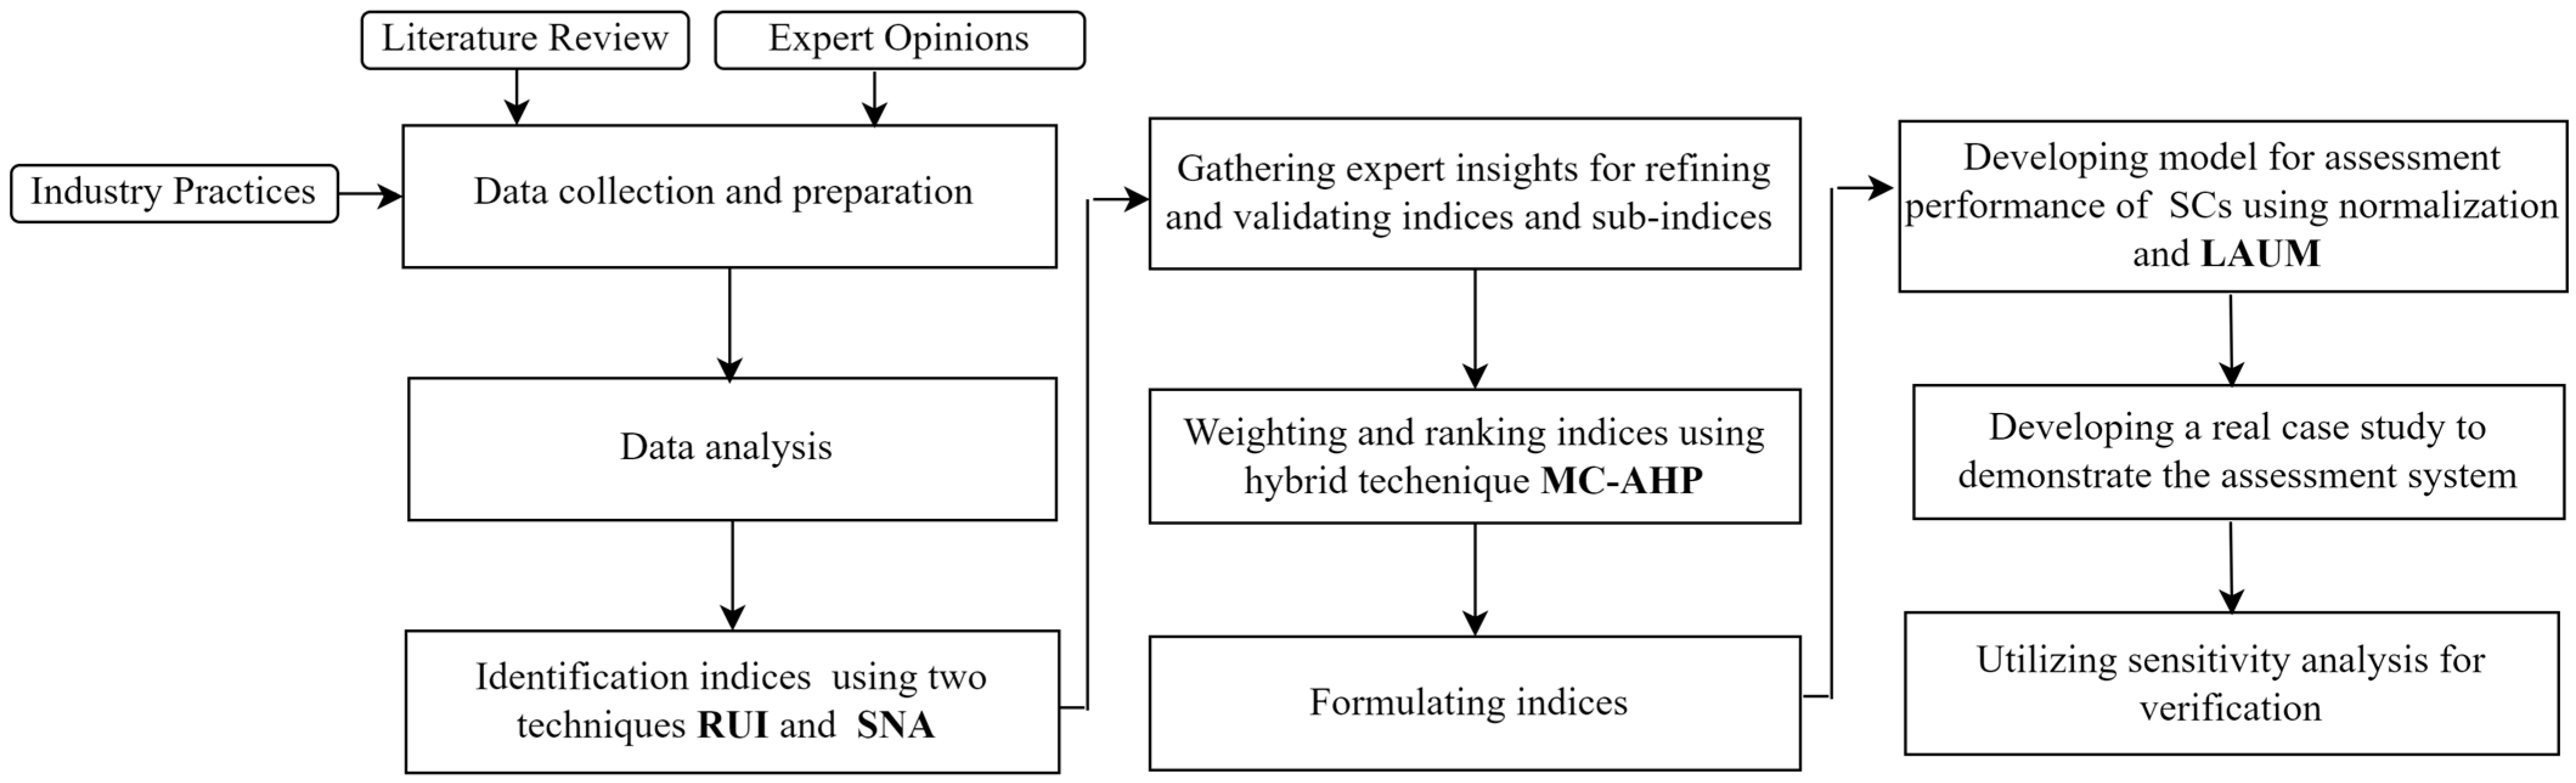
3. Methodology
4. Identification of Significant Indices and Sub-Indices
4.1. Implementation of Analysis Methods
4.1.1. Relative Usage Index (RUI) Method
4.1.2. Social Network Analysis (SNA)
5. Formulation of Significant Sub-Indices
6. Weighting of Significant Sub-Indices Using Monte Carlo Simulation and the AHP (MC-AHP)
7. Developing an Integrated Model for Evaluating the Performance of SCs
7.1. Normalization of the Subcontractor (SC) Performance Indices
7.2. Implementing the Linear Additive Utility Model (LAUM)
- Wi: utility weight, or the relative importance of the index.
- Ni: the normalization of each index.
- n: the number of indices.
7.3. Categorize Performance Levels
8. Case Study
9. Sensitivity Analysis
9.1. Sensitivity of Indices’ Weightage
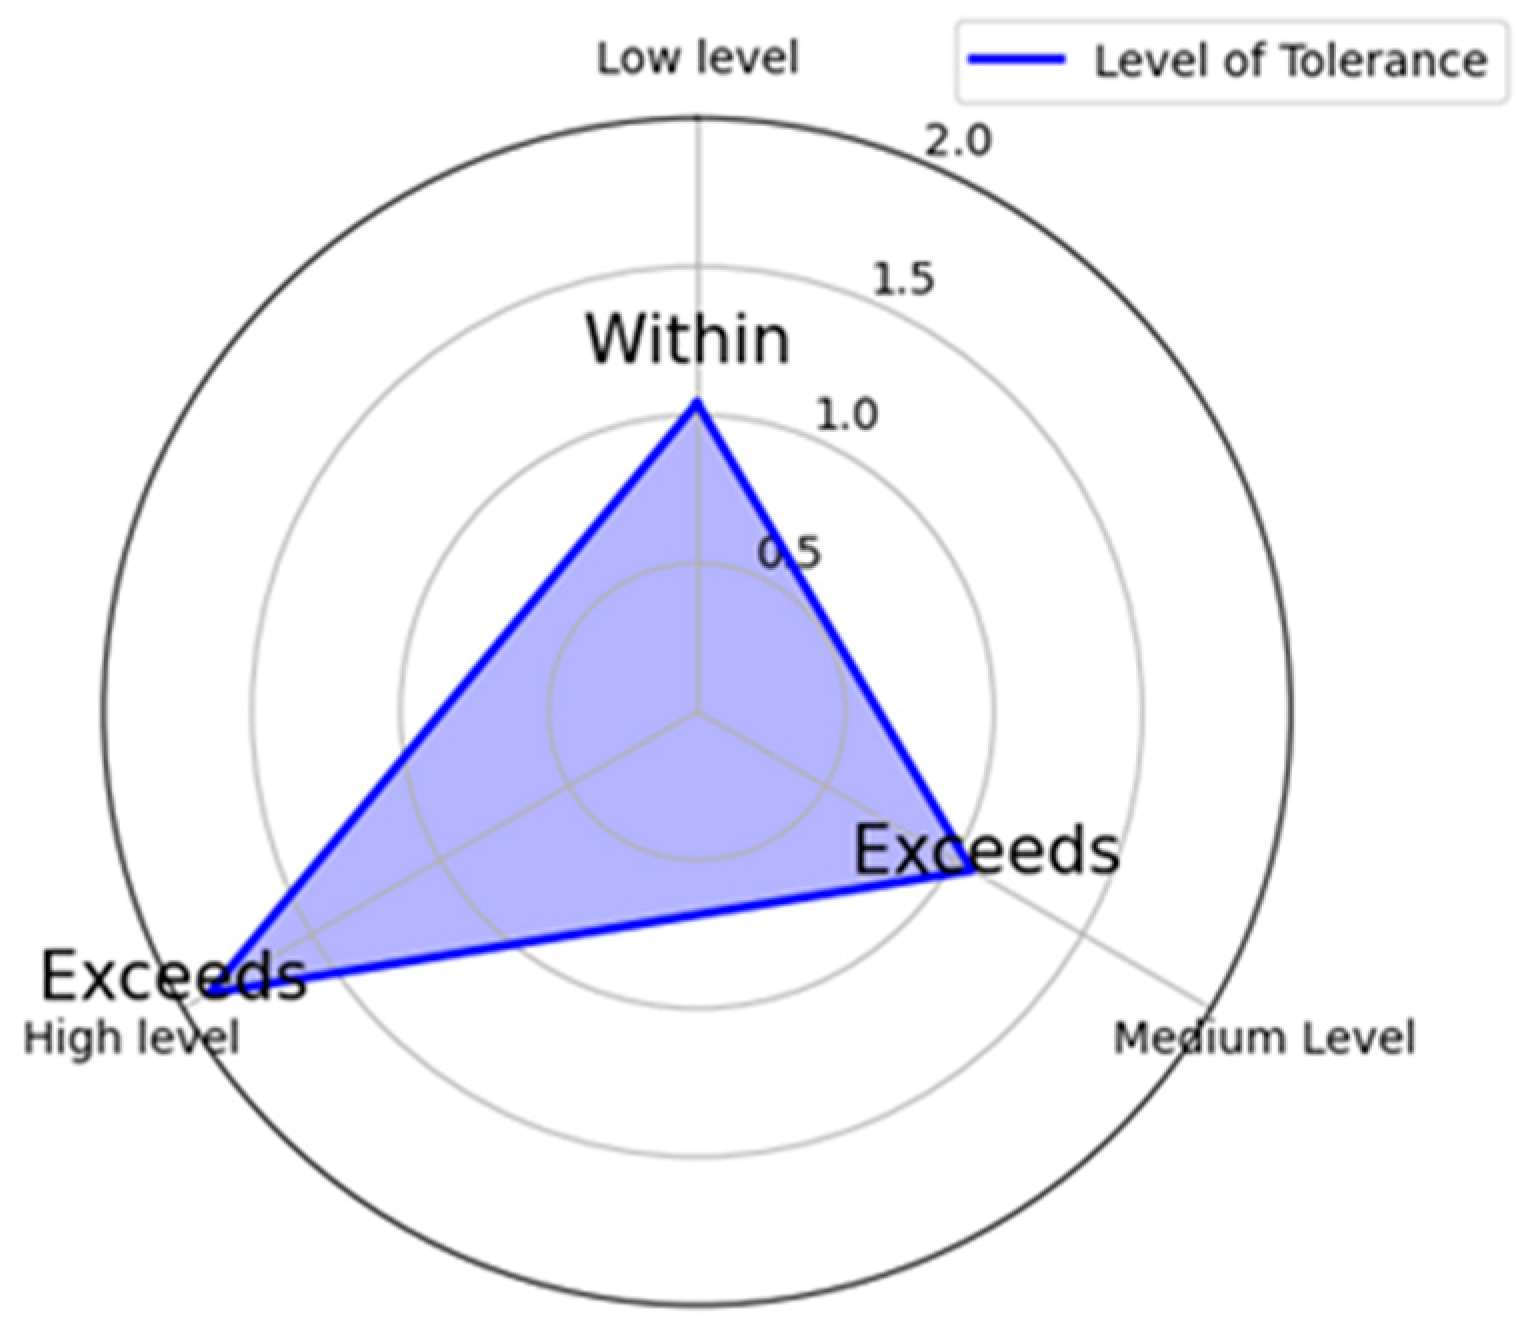
9.2. Levels of Tolerance
9.3. Indices’ Weightage and Levels of Tolerance
9.4. Analysis of Results
10. Conclusions
- This study combines Monte Carlo simulation and the AHP to weigh indices and criteria using expert opinion-based probability distributions. With input from limited experts, three distributions were created, though a larger panel would improve distribution accuracy.
- The model validation process was limited to expert opinions mainly from GCs, restricting perspective diversity—a noted limitation.
- The linear additive utility model (LAUM) was applied with three normalization levels (low, medium, high). Any adjustments to these levels require re-coding, posing a limitation in adaptability.
- This study assesses SC performance at project completion. Future studies could explore periodic assessments during project progress.
- Researchers may investigate the applicability of this approach in other industries, such as manufacturing, oil and gas, or IT services, to gain cross-industry insights where SC evaluation is critical.
- This study utilizes objective measurements rather than subjective ones. Researchers can use these measurements during projects and employ machine learning methods to forecast SC performance or identify defects in the managerial processes of the GC regarding the management of SC relationships to drive improvements.
Author Contributions
Funding
Data Availability Statement
Conflicts of Interest
References
- Artan Ilter, D.; Bakioglu, G. Modeling the relationship between risk and dispute in subcontractor contracts. J. Leg. Aff. Disput. Resolut. Eng. Constr. 2018, 10, 04517022. [Google Scholar] [CrossRef]
- Okunlola, O.S. The Effect of Contractor-Subcontractor Relationship on Construction Duration in Nigeria. Int. J. Civ. Eng. Constr. Sci. 2015, 2, 16–23. [Google Scholar]
- Arditi, D.; Chotibhongs, R. Issues in Subcontracting Practice. J. Constr. Eng. Manag. 2005, 131, 866–876. [Google Scholar] [CrossRef]
- Conner, K.R.; Prahalad, C.K. A Resource-Based Theory of the Firm: Knowledge Versus Opportunism. Organ. Sci. 1996, 7, 477–501. [Google Scholar] [CrossRef]
- Pallikkonda, K.D.; Siriwardana, C.S.A.; Karunarathna, D.M.T.G.N.M. Developing a Subcontractor Pre-Assessment Framework for Sri Lankan Building Construction Industry. In Proceedings of the 13th ICSBE Volume II, Kandy, Sri Lanka, 2019; Volume 1, p. 15. [Google Scholar]
- Francis, V.; Hoban, A. Improving Contractor/Subcontractor Relationships through Innovative Contracting. In Proceedings of the 10th Symposium on Construction Innovation and Global Competitiveness, Boca Raton, FL, USA, 2002; pp. 771–787. [Google Scholar]
- Hinze, J.; Tracey, A. The Contractor-Subcontractor Relationship: The Subcontractor’s View. J. Constr. Eng. Manag. 1994, 120, 274–287. [Google Scholar] [CrossRef]
- Wang, D.; Yung, K.L.; Ip, W.H. A Heuristic Genetic Algorithm for Subcontractor Selection in a Global Manufacturing Environment. IEEE Trans. Syst. Man Cybern. C (Appl. Rev.) 2001, 31, 189–198. [Google Scholar] [CrossRef]
- Cox, R.F.; Issa, R.R.; Frey, A. Proposed Subcontractor-Based Employee Motivational Model. J. Constr. Eng. Manag. 2006, 132, 152–163. [Google Scholar] [CrossRef]
- Shash, A.A. Subcontractors’ Bidding Decisions. J. Constr. Eng. Manag. 1998, 124, 101–106. [Google Scholar] [CrossRef]
- El-Mashaleh, M.S. A Construction Subcontractor Selection Model. Jordan J. Civ. Eng. 2009, 3, 375–383. [Google Scholar]
- Arslan, G.; Kivrak, S.; Birgonul, M.T.; Dikmen, I. Improving Subcontractor Selection Process in Construction Projects: Web-Based Subcontractor Evaluation System (WEBSES). Autom. Constr. 2008, 17, 480–488. [Google Scholar] [CrossRef]
- Afshar, M.R.; Shahhosseini, V.; Sebt, M.H. Optimal Subcontractor Selection and Allocation in a Multiple Construction Project: Project Portfolio Planning in Practice. J. Oper. Res. Soc. 2022, 73, 351–364. [Google Scholar] [CrossRef]
- Hanák, T.; Nekardová, I. Selecting and Evaluating Suppliers in the Czech Construction Sector. Period. Polytech. Soc. Manag. Sci. 2020, 28, 155–161. [Google Scholar] [CrossRef]
- Cheng, M.Y.; Wu, Y.W. Improved Construction Subcontractor Evaluation Performance Using ESIM. Appl. Artif. Intell. 2012, 26, 261–273. [Google Scholar] [CrossRef]
- Ng, T.S.T. Using Balanced Scorecard for Subcontractor Performance Appraisal. In Proceedings of the FIG Working Week and XXX General Assembly, Hong Kong, China, 13–17 May 2007. [Google Scholar]
- Ng, S.T.; Skitmore, M. Developing a Framework for Subcontractor Appraisal Using a Balanced Scorecard. J. Civ. Eng. Manag. 2014, 20, 149–158. [Google Scholar] [CrossRef]
- Eom, C.S.; Yun, S.H.; Paek, J.H. Subcontractor Evaluation and Management Framework for Strategic Partnering. J. Constr. Eng. Manag. 2008, 134, 842–851. [Google Scholar] [CrossRef]
- Başaran, Y.; Aladağ, H.; Işık, Z. Pythagorean Fuzzy AHP-Based Dynamic Subcontractor Management Framework. Buildings 2023, 13, 1351. [Google Scholar] [CrossRef]
- Cheng, M.Y.; Tsai, H.C.; Sudjono, E. Evaluating Subcontractor Performance Using Evolutionary Fuzzy Hybrid Neural Network. Int. J. Proj. Manag. 2011, 29, 349–356. [Google Scholar] [CrossRef]
- Ko, C.H.; Cheng, M.Y.; Wu, T.K. Evaluating Subcontractors’ Performance Using EFNIM. Autom. Constr. 2007, 16, 525–530. [Google Scholar] [CrossRef]
- Mbachu, J. Conceptual Framework for the Assessment of Subcontractors’ Eligibility and Performance in the Construction Industry. Constr. Manag. Econ. 2008, 26, 471–484. [Google Scholar] [CrossRef]
- Ng, S.T.; Tang, Z. Delineating the Predominant Criteria for Subcontractor Appraisal and Their Latent Relationships. Constr. Manag. Econ. 2008, 26, 249–259. [Google Scholar] [CrossRef]
- Hudson, M.; Smart, A.; Bourne, M. Theory and Practice in SME Performance Measurement Systems. Int. J. Oper. Prod. Manag. 2001, 21, 1096–1115. [Google Scholar] [CrossRef]
- Maturana, S.; Alarcón, L.F.; Gazmuri, P.; Vrsalovic, M. On-site subcontractor evaluation method based on lean principles and partnering practices. J. Manag. Eng. 2007, 23, 67–74. [Google Scholar] [CrossRef]
- Chamara, H.W.L.; Waidyasekara, K.G.A.S.; Mallawaarachchi, H. Evaluating Subcontractor Performance in Construction Industry. In Proceedings of the 6th International Conference on Structural Engineering and Construction Management, Kandy, Sri Lanka, 11–13 December 2015; Volume 5, pp. 137–147. [Google Scholar]
- Mahmoudi, A.; Javed, S.A. Performance Evaluation of Construction Subcontractors Using Ordinal Priority Approach. Eval. Program Plan. 2022, 91, 102022. [Google Scholar] [CrossRef] [PubMed]
- Lumanauw, R.N.; Ng, P.K.; Saptari, A.; Halim, I.; Toha, M.; Ng, Y.J. Performance Evaluation of Subcontractors Using Weighted Sum Method through KPI Measurement. J. Eng. Technol. Appl. Phys. 2023, 5, 35–49. [Google Scholar] [CrossRef]
- Abdull Rahman, S.H.; Mat Isa, C.M.; Kamaruding, M.; Nusa, F.N.M. Performance Measurement Criteria. In Green Infrastructure: Materials and Sustainable Management; Springer Nature: Singapore, 2024. [Google Scholar]
- Wasserman, S.; Faust, K. Social Network Analysis: Methods and Applications; Cambridge University Press: Cambridge, UK, 1994. [Google Scholar]
- Scott, J.; Carrington, P.J. The SAGE Handbook of Social Network Analysis; SAGE Publications: London, UK, 2011. [Google Scholar]
- Bastian, M.; Heymann, S.; Jacomy, M. Gephi: An Open-Source Software for Exploring and Manipulating Networks. In Proceedings of the International AAAI Conference on Web and Social Media, San Jose, CA, USA, 17–20 May 2009. [Google Scholar]
- Hanneman, R.A.; Riddle, M. Introduction to Social Network Methods; University of California: Riverside, CA, USA, 2005. [Google Scholar]
- Putri, C.G.; Nusraningrum, D. Subcontractors Selection of Building Construction Project Using Analytical Hierarchy Process (AHP) and Technique for Others Reference by Similarity (TOPSIS) Methods. J. Manaj. Teor. Dan Terap. 2022, 15, 262–273. [Google Scholar] [CrossRef]
- Nassar, N.; AbouRizk, S. Practical application for integrated performance measurement of construction projects. J. Manag. Eng. 2014, 30, 04014027. [Google Scholar] [CrossRef]
- Shahar, D.J. Minimizing the variance of a weighted average. Open J. Stat. 2017, 7, 216–224. [Google Scholar] [CrossRef]
- Momani, A.M.; Ahmed, A.A. Material Handling Equipment Selection Using Hybrid Monte Carlo Simulation and Analytic Hierarchy Process. World Acad. Sci. Eng. Technol. 2011, 59, 953–958. [Google Scholar]
- Saaty, T.L.; Vargas, L.G. Models, Methods, Concepts & Applications of the Analytic Hierarchy Process; Springer Science & Business Media: Berlin/Heidelberg, Germany, 2012. [Google Scholar]
- Banzon, M.J.R.; Bacudio, L.R.; Promentilla, M.A.B. Application of Monte Carlo Analytic Hierarchical Process (MCAHP) in the Prioritization of Theme Park Service Quality Elements. In Proceedings of the 2016 International Conference on Industrial Engineering and Operations Management, Kuala Lumpur, Malaysia, 8–10 March 2016; IEOM Society: Southfield, MI, USA, 2016. [Google Scholar]
- De Felice, F.; Petrillo, A. Analytic Hierarchy Process-Models, Methods, Concepts, and Applications; Intech Open: London, UK, 2023. [Google Scholar]
- Gorripati, R.; Thakur, M.; Kolagani, N. A Framework for Optimal Rank Identification of Resource Management Systems Using Probabilistic Approaches in Analytic Hierarchy Process. Water Policy 2022, 24, 878–898. [Google Scholar] [CrossRef]
- Schaefer, T.; Udenio, M.; Quinn, S.; Fransoo, J.C. Water Risk Assessment in Supply Chains. J. Clean. Prod. 2019, 208, 636–648. [Google Scholar] [CrossRef]
- Lee, D.K.; In, J.; Lee, S. Standard Deviation and Standard Error of the Mean. Korean J. Anesthesiol. 2015, 68, 220–223. [Google Scholar] [CrossRef]
- Kroonenberg, P.M. Applied Multiway Data Analysis; John Wiley & Sons: Hoboken, NJ, USA, 2008. [Google Scholar]
- Figueira, J.; Greco, S.; Ehrogott, M.; Dyer, J.S. MAUT—Multi Attribute Utility Theory. In Multiple Criteria Decision Analysis: State of the Art Surveys; Springer: Boston, MA, USA, 2005; pp. 265–292. [Google Scholar]
- Belton, V.; Stewart, T. Multiple Criteria Decision Analysis: An Integrated Approach; Springer Science & Business Media: New York, NY, USA, 2002. [Google Scholar]
- Helton, J.C.; Davis, F.J. Latin Hypercube Sampling and the Propagation of Uncertainty in Analyses of Complex Systems. Reliab. Eng. Syst. Saf. 2003, 81, 23–69. [Google Scholar] [CrossRef]
- Saltelli, A.; Tarantola, S.; Campolongo, F.; Ratto, M. Sensitivity Analysis in Practice: A Guide to Assessing Scientific Models; Wiley: New York, NY, USA, 2004. [Google Scholar]


| Indices | Sub-Indices | Identification |
|---|---|---|
| Time (STI) | Compliance and flexibility of project schedule (STI) | The SC’s ability to adhere to the project schedule and to demonstrate flexibility when dealing with delays and schedule shortening, as well as the amount of time that the SC saves for the GC across all project stages. |
| Cost and Finance (CFI) | Ensuring SC budget compliance (CFI1) | The ability of the SC to stay within the budget limits agreed upon in the contract, without submitting claims that are not dependent on contractual documents and ensuring that the actual cost of the work performed remains within the allocated budget. |
| Adaptability and invoice timeliness (CFI2) | The capacity of the SC to adapt to circumstances in cases of payment delays attributed to specific conditions, and the punctual submission of invoices to the GC in accordance with contractual obligations. | |
| Cost saving (CFI3) | This sub-criterion concerns the cost-saving measures implemented by the SC for the GC across all project stages. For example, the SC may achieve cost reductions for the GC through the adoption of particular technologies. | |
| Timely payment from SC (CFI4) | The timely payment performance of SC workers at each stage of project execution and timely payment to material suppliers for SC work. | |
| Quality (QI) | Upholding material quality (QI1) | Ensuring the quality of material usage status complies with the standards specified in the contract and general and specific specifications. |
| Level of workmanship (QI2) | The quality of construction workmanship during project execution. | |
| The quality of the end product (QI3) | The compliance status of the accomplished project with the project’s general and particular specifications. | |
| Resource Adequacy (RI) | Technical competence (RI1) | The sub-index (RI1) concerns the technical competence of employees and the availability of adequate resources such as technicians, equipment, and software. |
| Materials available (RI2) | Ensuring that the materials required for production are sufficiently available at the proper time. | |
| Occupational Health and Safety and Environmental Protection Criterion (HSI) | Adhere to the health and safety regulations (HSI1) | Assessing the attitude toward occupational health and safety requirements and ensuring that SCs adopt and comply with the health and safety rules requested by the GC. |
| Environmental awareness (HSI2) | The environmental compliance of SCs during the project, which involves maintaining a clean workspace and adhering to the GC’s waste management plan. | |
| General Contractor Satisfaction (Communication) (SCI) | Effective communication and compliance with GC (SCI1) | Communication and compliance with the GC through the use of coordinated work execution skills and information exchange during project execution with the GC. |
| Adaptability in responding to project changes (SCI2) | The ability to flexibly respond to changes in the project is the second sub-criterion. | |
| Effective communication with others (SCI3) | Ensuring adherence to coordination with other SCs and on-site employees guarantees smooth collaboration without causing delays. | |
| Ability to communicate orders electronically (SCI4) | Refers to the capability of an SC to receive, process, and respond to orders through digital means. | |
| Ability to receive complaints electronically (SCI5) | Refers to the capability of an SC to accept and manage complaints or feedback through digital channels. | |
| Leadership Criterion (LI) | Collaborative leadership (LI1) | Leadership is evaluated based on its focus on fostering collaboration and facilitating the development of subordinates. |
| Dedication (LI2) | Dedication to the project is gauged by assessing the extent of effort dedicated to resolving issues with the GC. | |
| Effective leadership (LI3) | The ability to conduct short- and long-term assessments and anticipate opportunities and threats is considered an indicator of effective leadership. |
| Sub-Indices | [24] | [16] | [25] | [23] | [22] | [20] | [15] | [17] | [26] | [27] | [19] | [28] | [29] | Sum | RUI |
|---|---|---|---|---|---|---|---|---|---|---|---|---|---|---|---|
| STI | 1 | 1 | 1 | 1 | 1 | 1 | 1 | 1 | 1 | 1 | 1 | 11 | 0.85 | ||
| CFI1 | 1 | 1 | 1 | 1 | 1 | 5 | 0.38 | ||||||||
| CFI2 | 1 | 1 | 0.08 | ||||||||||||
| CFI3 | 1 | 1 | 0.08 | ||||||||||||
| CFI4 | 1 | 1 | 2 | 0.15 | |||||||||||
| QI1 | 1 | 1 | 1 | 1 | 1 | 1 | 1 | 7 | 0.54 | ||||||
| QI2 | 1 | 1 | 1 | 1 | 1 | 1 | 1 | 1 | 1 | 9 | 0.69 | ||||
| QI3 | 1 | 1 | 1 | 1 | 1 | 1 | 1 | 1 | 1 | 9 | 0.69 | ||||
| RI1 | 1 | 1 | 1 | 1 | 4 | 0.31 | |||||||||
| RI2 | 1 | 1 | 1 | 1 | 4 | 0.31 | |||||||||
| HSI1 | 1 | 1 | 1 | 1 | 1 | 1 | 1 | 1 | 8 | 0.62 | |||||
| HSI2 | 1 | 1 | 1 | 1 | 1 | 1 | 1 | 1 | 1 | 9 | 0.69 | ||||
| SCI1 | 1 | 1 | 1 | 1 | 1 | 1 | 1 | 7 | 0.54 | ||||||
| SCI2 | 1 | 1 | 1 | 1 | 4 | 0.31 | |||||||||
| SCI3 | 1 | 1 | 1 | 1 | 1 | 1 | 1 | 1 | 8 | 0.62 | |||||
| SCI4 | 1 | 1 | 0.08 | ||||||||||||
| SCI5 | 1 | 1 | 0.08 | ||||||||||||
| LI1 | 1 | 1 | 2 | 0.15 | |||||||||||
| LI2 | 1 | 1 | 1 | 3 | 0.23 | ||||||||||
| LI3 | 1 | 1 | 0.08 |
| Source | Target | Studies | Edge Type |
|---|---|---|---|
| STI | QI3 | [24] | Undirect |
| STI | SCI3 | [24] | Undirect |
| STI | CFI1 | [16] | Undirect |
| STI | QI2 | [16] | Undirect |
| CFI2 | QI1 | [29] | Undirect |
| CFI2 | QI2 | [29] | Undirect |
| SCI3 | LI3 | [19] | Undirect |
| 1 | |||
| Indices | Sub-Indices | Equations | References |
| STI | STI | CT = practical completion date − work commencement date RC = original contract period + Change order time | Authors’ proposal/validation by experts |
| CFI | CFI1 | RV = original contract value + change order value | Authors’ proposal/validation by experts |
| CFI2 | Determining the frequency of SC submissions of invoices to the GC prior to the contractual dates | [34] | |
| CFI3 | Cost Saving (Task) = Contractual Cost (Task) − Modified Cost | [18] | |
| CFI4 | Assessing the frequency of delayed payments (workers and material suppliers) throughout the project | Authors’ proposal/validation by experts | |
| QI | QI1 | Assessing the number of non-conformance reports (NCRs) regarding materials | Authors’ proposal/validation by experts |
| QI2 | Determining the number of non-conformance reports (NCRs) related to work requiring rework | ||
| QI3 | Assessing the number of non-conformance reports (NCRs) related to finished production | ||
| RI | RI1 | Authors’ proposal/validation by experts | |
| RI2 | |||
| HSI | HSI1 | HSI1-1 = Number of incidents of damaging utilities, works, or materials by SC workers during project | Authors’ proposal/validation by experts |
| HSI1-2 = Number of fatal incidents among SC workers during project | [17,18] | ||
| HSI1-3 = Number of reportable safety violation and injuries during project | |||
| HSI1-4 = Number of prosecutions made by Labor Department or Union during project | |||
| HSI2 | Determining the number of warnings issued by the GC site officer | Authors’ proposal/validation by experts | |
| SCI | SCI1 | Authors’ proposal/validation by experts | |
| [23] | |||
| Authors’ proposal/validation by experts | |||
| SCI2 | Authors’ proposal/validation by experts | ||
| SCI3 | Determining the number of incidents, complaints, or conflicts reported by GC engineers | Authors’ proposal/validation by experts | |
| LI | LI1 | Implementing the rating scale (1 to 10) and weighted average with GC team calibration method LI1, LI2, or LI3 = | [35,36] |
| LI2 | |||
| LI3 | |||
| 2 | |||
| Nomenclature | Explanation | ||
| A practical completion date | Marks the date at which a construction project is sufficiently completed in accordance with the contract, as evidenced by a completion certificate or a completion letter. | ||
| A work commencement date | Refers to the specific date on which the GC or SC begins on-site activities for a construction project. | ||
| An original contract period | Refers to the duration initially agreed upon in the construction contract for the completion of the project. | ||
| An original contract value | Refers to the total monetary amount initially agreed upon between the client and the GC for completing the scope of work specified in the construction contract | ||
| A change order time | Refers to the additional time formally granted through an approved change order to account for modifications to the original scope of work | ||
| A change order value | Refers to the monetary amount associated with modifications to the original contract, as outlined in an approved change order | ||
| A cost-saving task | Defines the specific activities, strategies, or measures implemented during a construction project to reduce expenses without compromising quality, safety, or the project’s scope | ||
| A non-conformance report | Is a formal document issued when an SC fails to meet the specified requirements outlined in project contracts, designs, or standards | ||
| A request for information (RFI) | Is a formal document used in construction projects to seek clarification, resolve ambiguities, or request additional information related to the project’s plans, specifications, contracts, or other documentation | ||
| Intensity of Importance | Definition |
|---|---|
| 1 | Equal Importance |
| 2 | Week |
| 3 | Moderate Importance |
| 4 | Moderate Plus |
| 5 | Strong Importance |
| 6 | Strong Plus |
| 7 | Very Strong |
| 8 | Very, Very Strong |
| 9 | Extreme Importance |
| Size of Matrix | 1 | 2 | 3 | 4 | 5 | 6 | 7 | 8 | 9 | 10 |
|---|---|---|---|---|---|---|---|---|---|---|
| RI | 0.0 | 0.0 | 0.58 | 0.90 | 1.12 | 1.24 | 1.32 | 1.41 | 1.45 | 1.49 |
| MC-AHP (BD) | MC-AHP (TD) | MC-AHP (LD) | Lower Std Dev (Method) | ||||
|---|---|---|---|---|---|---|---|
| Index | Weight | Std Dev | Weight | Std Dev | Weight | Std Dev | |
| STI | 0.127 | (±0.015) | 0.148 | (±0.012) | 0.132 | (±0.02) | MC-AHP (TD) |
| CFI | 0.070 | (±0.009) | 0.083 | (±0.008) | 0.079 | (±0.013) | MC-AHP (TD) |
| QI | 0.257 | (±0.014) | 0.261 | (±0.014) | 0.255 | (±0.024) | MC-AHP (TD) |
| RI | 0.064 | (±0.008) | 0.068 | (±0.006) | 0.072 | (±0.010) | MC-AHP (TD) |
| SCI | 0.086 | (±0.015) | 0.081 | (±0.009) | 0.090 | (±0.016) | MC-AHP (TD) |
| HSI | 0.341 | (±0.018) | 0.311 | (±0.016) | 0.316 | (±0.029) | MC-AHP (TD) |
| LI | 0.052 | (±0.002) | 0.050 | (±0.001) | 0.052 | (±0.003) | MC-AHP (TD) |
| ∑ | 1 | 1 | 1 | ||||
| Accepted Matrices | 11,457 | 37,012 | 13,863 | MC-AHP (TD) | |||
| Indices | Weight | Sub-Indices | Weight | Sub-Indices | Weight | Rank | |
|---|---|---|---|---|---|---|---|
| STI | 0.148 | STI | 0.148 |  | STI | 0.148 | 2 |
| CFI | 0.083 | CFI1 | 0.515 | CFI1 | 0.043 | 7 | |
| CFI2 | 0.223 | CFI2 | 0.019 | 13 | |||
| CFI3 | 0.161 | CFI3 | 0.013 | 16 | |||
| CFI4 | 0.098 | CFI4 | 0.008 | 18 | |||
| QI | 0.261 | QI1 | 0.51 | QI1 | 0.134 | 3 | |
| QI2 | 0.166 | QI2 | 0.043 | 6 | |||
| QI3 | 0.323 | QI3 | 0.084 | 4 | |||
| RI | 0.068 | RI1 | 0.5 | RI1 | 0.034 | 10 | |
| RI2 | 0.5 | RI2 | 0.034 | 9 | |||
| HSI | 0.310 | HSI1 | 0.8 | HSI1 | 0.248 | 1 | |
| HSI2 | 0.2 | HSI2 | 0.062 | 5 | |||
| SCI | 0.081 | SCI1 | 0.512 | SCI1 | 0.041 | 8 | |
| SCI2 | 0.304 | SCI2 | 0.025 | 12 | |||
| SCI3 | 0.182 | SCI3 | 0.015 | 15 | |||
| LI | 0.050 | LI1 | 0.508 | LI1 | 0.025 | 11 | |
| LI2 | 0.312 | LI2 | 0.016 | 14 | |||
| LI3 | 0.178 | LI3 | 0.009 | 17 | |||
| ∑ | =1.000 |
| CFI2 | |||||
|---|---|---|---|---|---|
| Condition | Rating | Index Range | CFI2 Range (Low) | CFI2 Range (Medium) | CFI2 Range (High) |
| A | Outstanding Performance | I > 1.15 | CFI2 = 0 | CFI2 = 0 | CFI2 = 0 |
| B | Exceeds Target | 1.05 < I ≤ 1.15 | 0 < CFI2 ≤ 1 | 0 < CFI2 ≤ 1 | 0 < CFI2 ≤ 1 |
| C | Within Target | 0.95 < I ≤ 1.05 | 1 < CFI2 ≤ 2 | 1 < CFI2 ≤ 2 | 1 < CFI2 ≤ 4 |
| D | Below Target | 0.85 < I ≤ 0.95 | 2 < CFI2 ≤ 3 | 2 < CFI2 ≤ 4 | 2 < CFI2 ≤ 6 |
| F | Poor Performance | I ≤ 0.85 | 3 < CFI2 | 4 < CFI2 | 6 < CFI2 |
| Sub-Indices | CI | NI |
|---|---|---|
| STI, RI1-1, RI1-2, SCI1-1, SCI1-2, SCI1-3 | CI > 1.15 | 1.15 |
| 1.15 ≥ CI > 0.85 | NI = CI | |
| CI ≤ 0.85 | 0.85 | |
| CFI1 | CI = 0 | 1.15 |
| 0 < CI ≤ 5% | NI = 127.07 × (CI)2 − 12.431 × (CI) + 1.1533 | |
| 5 < CI | 0.85 | |
| CFI2 | CI = 0 | 1.15 |
| 0 < CI ≤ 4 | NI = 0.0114 × (CI)2 − 0.1214 × (CI) + 1.1527 | |
| 4 < CI | 0.85 | |
| CFI3 | CI > 10% | 1.15 |
| 10% ≥ CI > 0 | NI = −20.503 × (CI)2 + 4.7988 × (CI) + 0.8726 | |
| CI = 0 | 0.85 | |
| CFI4 | CI = 0 | 1.15 |
| 0 < CI ≤ 4 | NI = 0.0114 × (CI)2 − 0.1214 × (CI) + 1.1527 | |
| 4 < CI | 0.85 | |
| QI1 | CI = 0 | 1.15 |
| 0 < CI ≤ 8 | NI = 0.0028 × (CI)2 − 0.0607 × (CI) + 1.151 | |
| 8 < CI | 0.85 | |
| QI2 | CI = 0 | 1.15 |
| 0 < CI ≤ 9 | NI = 0.001 × (CI)2 − 0.0429 × (CI) + 1.1501 | |
| 9 < CI | 0.85 | |
| QI3 | CI = 0 | 1.15 |
| 0 < CI ≤ 6 | NI = 0.0061 × (CI)2 − 0.0848 × (CI) + 1.149 | |
| 6 < CI | 0.85 | |
| RI2 | CI = 0 | 1.15 |
| 0 < CI ≤ 4% | NI = 113.64 × (CI)2 − 12.136 × (CI) + 1.15 | |
| 4% < CI | 0.85 | |
| HSI1-1, HSI1-3, HSI1-4 | CI = 0 | 1.15 |
| 0 < CI ≤ 3 | NI = −0.1 × (CI) + 1.15 | |
| 3 < CI | 0.85 | |
| HSI1-2 | CI = 0 | 1.15 |
| 1 ≤ CI | 0.85 | |
| HSI2 | CI = 0 | 1.15 |
| 0 < CI ≤ 4 | NI = − 0.07 × (CI) + 1.148 | |
| 4 < CI | 0.85 | |
| SCI2 | CI = 100% | 1.15 |
| 100% > CI ≥ 75% | NI= −0.0002 × (CI)2 + 0.045 × (CI) + 1.44 | |
| 75% < CI | 0.85 | |
| SCI3 | CI = 0 | 1.15 |
| 0 < CI ≤ 4 | NI = 0.0114 × (CI)2 − 0.1214 × (CI) + 1.151 | |
| 4 < CI | 0.85 | |
| LI1, LI2, LI3 | CI > 9.5 | 1.15 |
| 9.5 ≥ CI > 6 | NI = 0.011 × (CI)2 − 0.1059 × (CI) + 1.075 | |
| 6 < CI | 0.85 |
| PI | ||
|---|---|---|
| Condition | Rating | Index Range |
| A | Outstanding Performance | PI > 1.15 |
| B | Exceeds Target | 1.05 < PI ≤ 1.15 |
| C | Within Target | 0.95 < PI ≤ 1.05 |
| D | Below Target | 0.85 < PI ≤ 0.95 |
| F | Poor Performance | PI ≤ 0.85 |
| Sub-Indices | Calculation | Normalization (N) (Medium Level) | Weights (W) | W × N |
|---|---|---|---|---|
| STI | 130/139 = 0.94 | 0.94 | 0.148 | 0.138 |
| CFI1 | 0 | 1.15 | 0.045 | 0.052 |
| CFI2 | 1 | 0.0114 × (1)2 − 0.1214 × 1 + 1.153 = 1.04 | 0.019 | 0.020 |
| CFI3 | 0 | 0.85 | 0.014 | 0.012 |
| CFI4 | 1 | 0.0114 × (1)2 − 0.1214 × 1+ 1.152 = 1.04 | 0.009 | 0.009 |
| QI1 | 0 | 1.15 | 0.136 | 0.156 |
| QI2 | 2 | =0.001 × (2)2 − 0.0429 × 2 + 1.15 = 1.07 | 0.044 | 0.047 |
| QI3 | 0 | 1.15 | 0.086 | 0.099 |
| RI1-1 | 3/3 = 1 | 1 | × | × |
| RI1-21 | 2/2 = 1 | 1 | × | × |
| RI1 | 0.5 × 1 + 0.5 × 1 = 1 | 1 | 0.034 | 0.034 |
| RI2 | (3/130) × 100 = 2.3% | 113.64 × (2.3%)2 − 12.13 × 2.3% + 1.15 = 0.93 | 0.034 | 0.032 |
| HSI1-1 | 1 | −0.1 × 1 + 1.15 = 1.05 | × | × |
| HSI1-2 | 0 | 1.15 | × | × |
| HSI1-3 | 0 | 1.15 | × | × |
| HSI1-4 | 0 | 1.15 | × | × |
| HSI1 | 0.25 × 1.05 + 0.25 × 1.15 + 0.25 × 1.15 + 0.25 × 1.15 = 1.13 | 1.13 | 0.249 | 0.280 |
| HSI2 | 2 | −0.07 × 2 + 1.148 = 1.01 | 0.062 | 0.062 |
| SCI1-1 | (5 + 70)/74 = 1.014 | 1.014 | × | × |
| SCI1-2 | 6/6 = 1 | 1 | × | × |
| SCI1-3 | 4/5 = 0.8 | 0.85 | × | × |
| SCI1 | 0.33 × 1.014 + 0.33 × 1 + 0.33 × 0.8 = 0.93 | 0.93 | 0.041 | 0.038 |
| SCI2 | (8/8) × 100 = 100% | 1.15 | 0.025 | 0.029 |
| SCI3 | 1 | 0.0114 × (1)2 − 0.121 × 1 + 1.151 = 1.04 | 0.015 | 0.016 |
| LI1 | (3 × 6 + 5 × 6 + 6 × 9)/(3 + 5 + 6) = 7.29 | 0.011 × (7.29)2 −0.105 × 7.29 + 1.075 = 0.89 | 0.026 | 0.023 |
| LI2 | (3 × 3 + 5× 5 + 6× 4)/(3 + 5 + 6) = 4.14 | 0.85 | 0.016 | 0.014 |
| LI3 | (3 × 9 + 5 × 8 + 6 × 9)/(3 + 5 + 6) = 8.64 | 0.011 × (8.64)2 − 0.105 × 8.64 + 1.075 = 0.99 | 0.009 | 0.009 |
| PI = | 1.07 | |||
Disclaimer/Publisher’s Note: The statements, opinions and data contained in all publications are solely those of the individual author(s) and contributor(s) and not of MDPI and/or the editor(s). MDPI and/or the editor(s) disclaim responsibility for any injury to people or property resulting from any ideas, methods, instructions or products referred to in the content. |
© 2025 by the authors. Licensee MDPI, Basel, Switzerland. This article is an open access article distributed under the terms and conditions of the Creative Commons Attribution (CC BY) license (https://creativecommons.org/licenses/by/4.0/).
Share and Cite
Al Hasan, I.; Hammad, A. A Systematic and Objective Framework for Evaluating Subcontractor Performance Using Monte Carlo Simulation Coupled with the Analytic Hierarchy Process and a Linear Additive Utility Model. Buildings 2025, 15, 390. https://doi.org/10.3390/buildings15030390
Al Hasan I, Hammad A. A Systematic and Objective Framework for Evaluating Subcontractor Performance Using Monte Carlo Simulation Coupled with the Analytic Hierarchy Process and a Linear Additive Utility Model. Buildings. 2025; 15(3):390. https://doi.org/10.3390/buildings15030390
Chicago/Turabian StyleAl Hasan, Iyad, and Ahmed Hammad. 2025. "A Systematic and Objective Framework for Evaluating Subcontractor Performance Using Monte Carlo Simulation Coupled with the Analytic Hierarchy Process and a Linear Additive Utility Model" Buildings 15, no. 3: 390. https://doi.org/10.3390/buildings15030390
APA StyleAl Hasan, I., & Hammad, A. (2025). A Systematic and Objective Framework for Evaluating Subcontractor Performance Using Monte Carlo Simulation Coupled with the Analytic Hierarchy Process and a Linear Additive Utility Model. Buildings, 15(3), 390. https://doi.org/10.3390/buildings15030390