Abstract
The general contractor (GC)–subcontractor (SC) relationship is a crucial aspect of construction supply chain management, heavily influencing project outcomes. This study investigates a method for assessing SC performance and underscores its essential role in construction projects. Traditionally, SC assessments are based on subjective evaluations, which can lead to biased decision-making. To counter this, this study introduces a comprehensive framework that employs objective indices and a systematic evaluation method. The study begins with a comprehensive literature review and expert consultations to identify key indices for SC evaluation: time, cost, quality, safety, resources, satisfaction, and leadership. A hybrid method combining Monte Carlo simulation and the Analytic Hierarchy Process (AHP) is employed to assign weights to these indices through the development of probability distributions, thereby reducing judgment uncertainty. The developed evaluation model incorporates normalization and a linear additive utility model (LAUM) to calculate a performance index (PI) that quantifies SC performance across various levels, from outstanding to poor. The normalization process is applied with three tolerance levels (high, medium, and low). A real case study with a three-scenario sensitivity analysis demonstrates the model’s effectiveness. This approach provides general contractors with a more objective and transparent assessment process, minimizing bias in evaluations.
1. Introduction
Projects in the construction industry are temporary ventures involving multiple stakeholders with diverse educational backgrounds, cultural perspectives, and levels of experience, creating a setting prone to conflicts. The primary sources of these conflicts are delays and the inability to complete work within the allocated budget [1]. About 70% of project work in construction is handled by SCs. This growing reliance is due to contractors leveraging the specialized skills of SCs to boost their overall capabilities while managing their resources more efficiently [2]. Another common reason for subcontracting is that qualified SCs are usually able to perform their work specialty more quickly and at a lesser cost compared to general contractors [3].
In the past, general contractors independently handled entire projects using their in-house capabilities. However, the modern role of GCs has evolved, emphasizing tasks like surveying, contract management, budget estimation, and the planning, direction, and control of projects. Moreover, outsourcing offers companies the opportunity to enhance operational efficiencies by freeing up capacity and focusing on their core strengths, thereby increasing flexibility [4].
In this context, assessing SC performance across all relevant aspects—beyond just time, cost, and quality—is crucial for improving the GC’s managerial processes, capturing lessons learned, and utilizing the assessment outcomes to inform the awarding of contracts for future projects. Furthermore, the absence of performance assessments negatively impacts the general contractor’s reputation. Consistently poor SC performance can lead to client dissatisfaction, eroding trust and reducing future business opportunities. Additionally, the lack of structured feedback results in ineffective resource management and missed opportunities for continuous improvement, which are essential for refining SC selection criteria and enhancing project execution.
According to [5], an SC is defined as any person or company specified in the contract document as an SC, or any individual designated as an SC for a portion of the works. Similarly, ref. [6] describes an SC as a specialist engaged by the main contractor to execute specific tasks within a project, thereby contributing to the fulfillment of the overall contractual obligations. Refs. [6,7] categorize SCs into trade, specialist, and labor-only based on their roles and services in construction projects
This paper presents a novel approach to objectively assess SC performance upon project completion in the construction industry. While SC selection has been extensively discussed in the literature, the objective measurement and evaluation of SC performance within construction projects have received comparatively less attention. This study seeks to address this gap while proposing a flexible solution for more dynamic SC management. To achieve this, this study develops an objective SC management framework for performance measurement and evaluation, emphasizing the minimization of bias during the project closeout phase. This framework incorporates a comprehensive set of quantitative indices, addressing not only traditional factors such as time, cost, quality, and resource adequacy, but also additional dimensions such as GC satisfaction, occupational health and safety, and leadership characteristics. It is important to note that the framework can be applied to all three categories of SCs and to various sectors within the construction industry.
The academic contributions of this study are multifaceted. It integrates literature reviews, expert opinions, and industry practices to identify critical indices influencing SC performance assessment. This study introduces a novel hybrid methodology, combining Monte Carlo simulation with the Analytic Hierarchy Process (AHP), to rigorously evaluate and weigh these indices using various probability distributions. Objective measurements have been developed and validated by both academic and industry experts. Additionally, this study implements three distinct normalization approaches and utilizes a linear additive utility model (LAUM) for performance measurement, offering a scalable and transferable methodology applicable beyond the construction sector. Furthermore, the framework addresses a research gap by ensuring the inclusion of all relevant and effective indices that are often ignored in previous studies. These omissions in past research have led to an over-reliance on subjective measurement techniques, such as point judgments, which can inadvertently introduce bias and corruption into the evaluation process. By contrast, this framework emphasizes accuracy by relying on precise equations to calculate values instead of employing range-based scales, which are inherently less accurate. This methodological shift not only enhances the reliability of the results but also establishes a robust foundation for practical applications in the construction industry.
The expected industrial contribution of this study lies in its implementation of a systematic framework for SC evaluation. This practical approach provides general contractors with a more objective and transparent assessment process, reducing biases commonly associated with subjective evaluations. It enables general contractors to identify conflicts within their SC management processes and improve managerial skills for future projects. Furthermore, this objective approach fosters stronger, long-term partnerships between general contractors and SCs, enhancing collaboration and overall project success.
This study is organized into ten sections: Section 1 introduces the study; Section 2 provides a comprehensive literature review; Section 3 outlines the research methods and methodology; Section 4 presents key indices and sub-indices identified from the literature and expert discussions; Section 5 and Section 6 discuss the formulation and weighting of significant sub-indices; and Section 7, Section 8 and Section 9 detail the development and application of SC performance assessments through a real case study, accompanied by a sensitivity analysis. Finally, Section 10 summarizes the study’s findings, outlines its limitations, and offers directions for future research.
2. Literature Review
An extensive review of previous research and journal articles is pivotal in laying the foundation for new initiatives. This section explores research from relevant domains essential for the evaluation of SCs in the construction industry. The literature review was conducted using databases such as Google Scholar, Web of Science, and Scopus. By examining studies on SC management, the aim is to distill the topic into more comprehensible categories related to SC management. Research studies related to SC management, using keywords such as ‘Subcontractor Management’, ‘Subcontractor Performance assessment’, ‘Subcontractor Performance Evaluation’, and ‘On-Site Subcontractor Performance’, were thoroughly investigated.
2.1. Indices and Sub-Indices with Measurements
Researchers globally have focused extensively on rationalizing SC evaluation and selection processes in the construction industry, where projects are often divided into multiple subcontracts [8]. A GC’s success heavily depends on SC performance [3,9], as GCs typically delegate project tasks to SCs [10]. Numerous papers published over the past several decades have explored indices and sub-indices related to the assessment of SC performance. Time is considered the most important factor, exerting a significant influence on project outcomes. In the literature, this criterion has been identified under various names such as completion of the job within time [11,12,13], delivery date [14], or control time [15]. Researchers evaluate this criterion in diverse ways. Refs. [16,17] expressed it by calculating the percentage of deviation from the SCs’ project milestones, while another study introduced this criterion using a formula to calculate the schedule shortened ratio [18]. Additionally, ref. [1] divided the time criterion into three sub-criteria: firstly, completion of a job within the allocated time; secondly, the scale of cooperation and flexibility when dealing with delays, defined as the SC’s attitude toward delays; and lastly, the percentage of work completed according to the planned schedule.
The cost criterion encompasses numerous dimensions found in the literature, such as price, financial aspects, and payments. Refs. [1,12] proposed three sub-criteria under the cost criterion. One of them is the SC’s bid offer to commence the construction project (tender price), completion of a job within budget, and whether the SC has any financial problems that may cause future issues (financial capacity). Additionally, ref. [12] mentioned that timely payment to laborers is considered under the cost criterion umbrella. On the other hand, evaluation of the cost criterion is considered crucial for the operation of assessments. In this regard, ref. [18] proposed the most important indices, distinguished between cost and finance, and defined indices related to finance, including profitability, growth, activeness, stability, and a cost index. Meanwhile, ref. [16] focused on determining the promptness of payment to discover the financial strength of SCs by calculating the number of days in delaying payment to workers and the number of days in delaying payment to SCs. Achieving successful completion in construction projects entails meeting the quality standards outlined in contracts and specifications, along with adhering to the desired time and cost parameters for the project [19].
Consequently, the performance of the SCs involved in producing project items, in alignment with these quality standards, holds significant importance [1]. To underscore the significance of the quality criterion, ref. [12] identified nine sub-criteria: 1. The quality of production, 2. The standard of workmanship, 3. team efficiency, 4. The quality of materials used, 5. experience in similar works, 6. experience in the construction industry, 7. job safety, 8. personnel training, and 9. The number of qualified personnel. Meanwhile, ref. [1] considered the quality criterion to have the greatest impact on the evaluation of SCs, assigning it the highest value, while the time criterion held the second highest weight value. Additionally, ref. [1] proposed three sub-criteria under the quality criterion, which are quality certificates owned by the SC (quality standard), a guide to assess the GC’s ability based on likely future performance (previous performance), and whether the SC has quality assurance staff (quality assurance programs). Few studies have used formulas to evaluate the quality criterion. Ref. [18] utilized two formulas to calculate the defect occurrence ratio (DOR) and the rework occurrence rate (ROR) and used the concept of a five-point scale to assess executing quality management plans considering that the DOR, the ROR, and quality management represent the quality criterion.
On the other hand, ref. [12] suggested evaluating this quality criterion based on the construction department of the GC without determining a specific methodology. The concept of resources in construction encompasses workforces, materials, equipment, and technology applications. Consequently, researchers have delineated sub-criteria under the resource adequacy criterion. These include assessments related to the adequacy of labor resources, material resources, compliance with the company image, and alignment with other on-site employees [19]. Refs. [15,20] identified self-owned tools (or borrowed from the GC), effective management capabilities, and material wastage as factors influencing the evaluation of SCs. In contrast, ref. [12] went further by delineating nine sub-criteria, which include proposal accuracy, adequacy of the experienced site personnel (supervisor and staff), adequacy of labor resources, adequacy of material resources, adequacy of equipment, care of works and workers, compliance with site safety requirements, compliance with the contract, and compliance with the company image. Furthermore, ref. [18] focused on the technical side, giving importance to the number of technical patents held by the SC, technical support capability (number of technicians), and awards and warnings (over the past three years). In terms of evaluating resource adequacy, ref. [20] specified that the assessment is the responsibility of the relevant field superintendents of the GCs.
Meanwhile, ref. [16] suggested calculating the number of permanent employees of the company (semi-skilled and skilled) and the quantity of physical resources owned by the SC, including equipment and tools. Communication between the GC and SCs is a crucial aspect of a successful construction project. Communication extends not only between the GC and SCs but also encompasses compatibility and communication between various SCs [11,15,20]. This criterion significantly influences the performance in other project categories [19]. Ref. [1] expressed the compatibility and communication criterion across three sub-criteria, which are compliance with the main GC’s vision, cooperation with other SCs during the project period, and knowledge of construction regulations. In contrast, ref. [19] defined four sub-criteria, namely, compliance with other SCs and employees on site, communication and compliance with the GC, harmony within the SC’s own team, and the ability to adopt and respond to changes in the project. Some researchers have sought to identify indicators for assessing this criterion using quantitative or qualitative measurements. Ref. [17] examined the evaluation criterion in two main groups—namely, relationship and communication—by determining the number of unresolved disputes with clients or other parties, the percentage of unsuccessful claims, the percentage of site meetings not attended, the number of times the SC did not respond to the GC’s instructions, and the number of days of delay in responding to instructions.
On the other hand, ref. [18] emphasized the importance of evaluating the level of participation (collaborative work), the level of cooperation and communication (cooperation in work), and the appropriate organizational structure on site, using a five-point scale. In the construction industry, occupational health and safety (OHS) are interconnected and crucial aspects of responsible and sustainable project management. By integrating both OHS and environmental protection measures into construction practices, GCs and SCs can contribute to the well-being of workers, minimizing the environmental footprint of projects. Therefore, the OHS and environmental protection criterion is frequently encountered in addition to time, cost, and quality dimensions [19]. In this regard, some studies have conducted studies to define this criterion.
2.2. Assessment of Subcontractor Performance Process
Researchers have employed various techniques to assign weights to key indices and evaluate SC performance. Among these studies, ref. [15] aimed to develop a support model intended to enhance existing practices for SC performance evaluation. The study examined the suitability of applying the Evolutionary Support Vector Machine Inference Model (ESIM) within evaluation processes, leading to the development of an SC Rating Evaluation Model (SREM). This model was tailored by adapting the ESIM to align with historical SC performance data. However, the study did not specify a particular weighting method, instead assuming that all indices carried equal weight. Ref. [21] conducted a study with the objective of enhancing current practices for evaluating SC performance. The study explored the suitability of adopting the Evolutionary Fuzzy Neural Inference Model (EFNIM) to address and mitigate the limitations present in existing evaluation methods. Ref. [22] proposed a conceptual framework for SC management that focuses on the prioritization of relevant criteria during the construction phase. To achieve this, a Key Performance Indicator (KPI) list comprising 10 comprehensive criteria was developed, with the prioritization based on the Relative Importance Index (RII) values assigned to each criterion.
Ref. [16] developed a decision support system to evaluate SC performance using the balanced scorecard (BSC) model. The weighting for each criterion was determined based on survey findings, with the highest weight assigned to the percentage of work that needed to be redone, which was 0.106. After this study, ref. [23] established performance evaluation criteria to serve as the foundation for developing a new SC performance evaluation system, aiming to enhance the ability to view and compare SC performances. The authors suggested that knowledge-based systems could offer a more accurate and diligent approach to SC performance evaluation. However, the study did not incorporate any weighting of the criteria.
In their respective studies, refs. [17,18] introduced frameworks using the balanced scorecard (BSC) model for SC evaluation and management, aiming to assist GCs in fostering more strategic and productive relationships with their subcontract partners. Ref. [18] employed the Analytic Hierarchy Process (AHP) to determine the weighting of each SC performance index, assigning the highest weight to the cost-saving ratio (0.083). Meanwhile, ref. [17] calculated the mean values of relative importance to compute the weighting for each performance index, with the highest weight assigned to the percentage deviation from the SCs’ project milestones (0.108). Ref. [19] emphasizes measuring and evaluating SC performance during the project execution phase and proposes a dynamic, performance-based management framework for GCs to use in managing SCs proactively. The study applies the Pythagorean Fuzzy Analytic Hierarchy Process (PFAHP) to determine the importance of various indices, with the cost index receiving the highest weight at 0.22.
Based on the findings from the literature review, it has been identified that numerous studies have been conducted on the evaluation of SCs in the construction industry. Some researchers have focused on evaluating SCs during the execution stage of a project, while others have established indices and sub-indices for evaluating SCs at the project’s completion. In some cases, these evaluations rely on subjective information and qualitative scales, without addressing the potential bias in these evaluation methods. Furthermore, the methods used for normalization do not specify a particular value within a specific range, which reduces the accuracy of the index values. Additionally, all studies use methods to weigh significant indices such as the AHP without considering the uncertainty of expert opinions or data collected from the industry.
3. Methodology
The methodology for developing and validating the SC performance assessment system is a multi-step process grounded in both theoretical research and practical insights, as shown in Figure 1. Initially, data collection and preparation are conducted through a thorough literature review, industry practices, and expert opinions to identify relevant performance indices. The collected data are then analyzed to discern patterns and establish significant indices for performance evaluation.

Figure 1.
Research framework.
To refine this process, two techniques, the Relative Utility Index (RUI) and Social Network Analysis (SNA), are employed to identify critical indices and sub-indices. Expert insights are subsequently gathered to further validate and adjust these indices to ensure alignment with industry standards. A hybrid technique, Monte Carlo simulation with the Analytical Hierarchy Process (MC-AHP), is used to assign weightings and rank the indices based on their relative importance in performance assessment.
These indices are then formalized into a structured framework. The next step involves developing a performance assessment model using normalization and the linear additive utility model (LAUM) to ensure precise and standardized evaluations. A real-world case study is presented to demonstrate the implementation of the assessment system, providing a practical example of its application. Finally, a sensitivity analysis is performed to verify the model, ensuring its robustness by testing how variations in input data affect the outcomes. This comprehensive approach integrates both quantitative and qualitative methods to develop a reliable framework for evaluating SC performance.
4. Identification of Significant Indices and Sub-Indices
The review and identification of indices are accomplished through a multi-step process executed as illustrated in Figure 2.
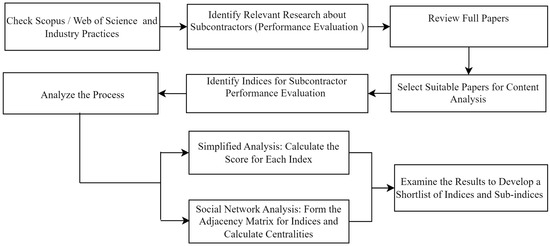
Figure 2.
Steps of identification of significant indices.
We consider the content of 13 selected articles and formats from Canadian GCs used in industry. The body of knowledge is analyzed using both the RUI and SNA to define the significant indices. Seven indices along with twenty sub-indices are identified and illustrated in Table 1.

Table 1.
List of significant indices and sub-indices.
4.1. Implementation of Analysis Methods
The purpose of applying analysis methods is to determine the frequency of the indices illustrated in Table 1 among the selected studies and to help highlight the most commonly used indices. Two methods are implemented as follows:
4.1.1. Relative Usage Index (RUI) Method
This method involves calculating the frequency of each sub-index by summing the values in the corresponding row of the matrix to determine how often each is mentioned, as shown in Table 2. The RUI values are then computed using Equation (1), which represents the frequency of sub-indices divided by the total number of studies. These values are analyzed to highlight the most and least frequently mentioned indices.

Table 2.
Matrix of sub-indices among studies.
4.1.2. Social Network Analysis (SNA)
SNA is a method for studying the structure and dynamics of networks, as outlined by [30]. It involves mapping and measuring relationships and information flows between various entities, such as people, organizations, or knowledge systems [31]. In this study, SNA is applied to analyze relationships between the sub-indices used in the evaluation processes. Each sub-index is represented as a node, and a relationship (edge) is established if two sub-indices are co-mentioned within the same source (study), as exemplified in Table 3. The analysis focuses on undirected networks, where connections are not influenced by directional relationships. Gephi 64 software is employed for network visualization and centrality calculation [32]. Centrality, particularly degree centrality, is used to identify the most frequently mentioned indices in relation to others. Degree centrality measures the number of connections a node has, providing insights into the importance or influence of certain indices within the network. This method highlights key indices through visual representation, where the node size indicates its level of interaction with other indices [33]. A total of 389 edges were identified for the evaluation matrix, and the network visualizations were generated accordingly, as illustrated in Figure 3.

Table 3.
An example of edges.
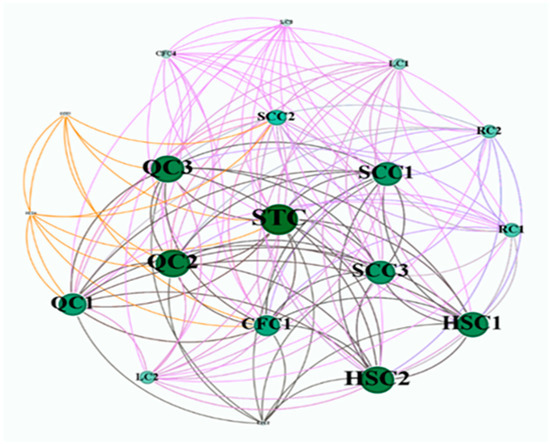
Figure 3.
Social network for evaluation of performance SC.
Based on the results derived from the implementation of the Relative Usage Index (RUI) and Social Network Analysis (SNA) methods, the sub-indices STI, QI1, and QI3 have the highest RUI values and degree of centrality. As a result, a shortlist of indices and sub-indices was identified, including all indices listed in Table 1, except for those with the lowest RUI values and centrality, namely the ability to communicate orders electronically (SCI4) and the ability to receive complaints electronically (SCI5). A panel of experienced construction experts confirmed the significance of all shortlisted indices, emphasizing that resource adequacy, communication, and managerial practices are critical in addition to time, cost, and quality. No suggestions for adding or removing indices were made by the experts.
5. Formulation of Significant Sub-Indices
One of the aims of this study is to measure the sub-indices objectively while minimizing bias. To achieve this, all sub-indices have been formulated based on the literature, the authors’ experience, and feedback from academic and industry experts, as illustrated in Table 4.

Table 4.
Quantitative measurements of sub-indices. 1. Formulation of sub-indices. 2. Explanation of Selected Nomenclature.
6. Weighting of Significant Sub-Indices Using Monte Carlo Simulation and the AHP (MC-AHP)
The Analytic Hierarchy Process (AHP), introduced by T. L. Saaty in 1980, is a widely used decision-making tool for addressing complex, multi-criteria decision problems [37]. The AHP employs pairwise comparisons, enabling decision-makers to assign weights to evaluation criteria [38,39]. In contrast, Monte Carlo simulation is a mathematical technique that accounts for risks in quantitative analysis and decision-making [39].
Although the AHP has been extensively applied to multi-criteria decision challenges, its reliance on singular point estimates can lead to inaccuracies, increasing risk and uncertainty [37]. To overcomes these limitations, several studies have proposed integrating Monte Carlo simulation with the AHP (MC-AHP). This hybrid approach enhances decision accuracy by treating each index as a random variable within a distribution, providing a more comprehensive evaluation across multiple indices [39].
Figure 4 illustrates the steps involved in the MC-AHP method for weighting indices and sub-indices. This technique was developed using Python to enhance decision-making accuracy.
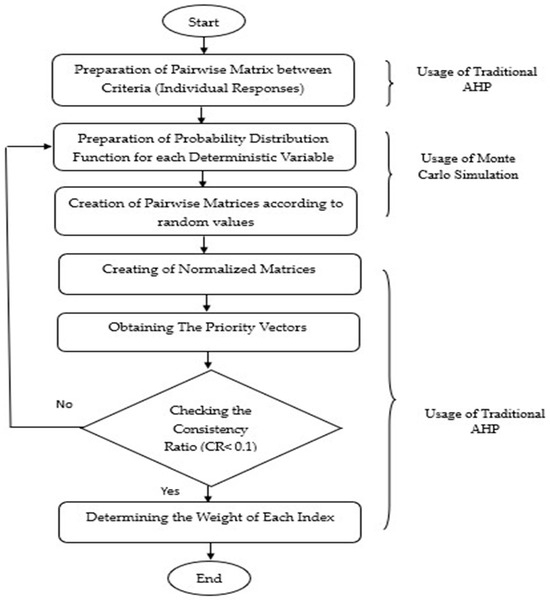
Figure 4.
Steps of MC-AHP hybrid for weighting indices and sub-indices.
The first step involves gathering input from experts and assessing the relative importance of each index and sub-index through pairwise comparisons, using a scale from 1 to 9 as outlined in Table 5. This scale expresses the strength of preference or importance [40]. Using Equation (2), a pairwise comparison matrix (M) is created, incorporating the opinions of each expert, as illustrated in Figure 5, Figure 6 and Figure 7.
where Ci,j refers to the importance degree of element i relative to element j under the evaluation indices and n denotes the number of indices compared.

Table 5.
Standard nine-level comparison scale [38].
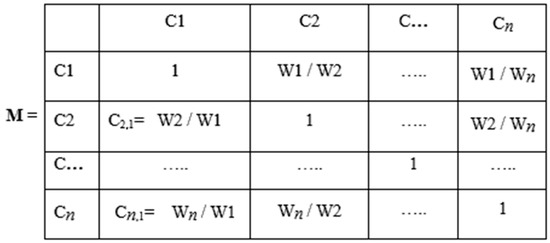
Figure 5.
Pairwise comparison matrix (M).

Figure 6.
Aggregated pairwise comparison matrices (main indices). Note: For example, [4, 4, 6] represents [exprt1 opinion, exprt2 opinion, exprt3 opinion].

Figure 7.
Aggregated pairwise comparison matrices (sub-index CFI).
Next, based on expert opinions, each matrix element has multiple values, with each expert contributing a pairwise comparison matrix. According to [41], Monte Carlo simulation utilizes various probability distribution functions to integrate these expert inputs and generate new values that maintain the same characteristics. These values are then used to form a probability distribution, with the total number of distribution functions determined by Equation (3).
where n represents the number of indices.
Given the limited number of experts, it is challenging to precisely determine the type of distribution for their opinions. Therefore, the Kolmogorov–Smirnov (KS) test, as described by [42], is applied to identify the best-fit distribution for each set of values. The KS test evaluates the difference between the empirical cumulative distribution function and the cumulative distribution function of the reference distribution, with the p-value serving as the criterion for accepting or rejecting the null hypothesis.
In this study, the KS test was implemented using Python language. As a result, three distributions—Beta (BD), Triangular (TD), and Lognormal (LD)—were found to fit all sets of values. Each distribution has a unique shape and its own parameters. Figure 8 illustrates an example for three types of distributions. Subsequently, a set of 100,000 random samples for each distribution (BD, TD, LD) was generated to implement the MC-AHP model while considering expert-informed minimum and maximum values. This means that 100,000 pairwise matrices were generated.

Figure 8.
Example of BD, TD, and LD for expert opinions.
It is important to confirm that the spike observed in Figure 8 arises despite the variation in expert inputs (1/6, 2, 3), due to the significant overlap of the probability distributions generated (Beta, Triangular, and Lognormal) within a specific range. This overlap reflects scenarios where the weighting distributions align, resulting in a pronounced peak around areas of convergence. These results demonstrate a higher level of agreement within the probabilistic framework, even when expert opinions vary.
Afterward, each matrix is normalized by dividing each element (Ci,j) by the sum of its respective column, as shown in Equation (4).
The priority vectors (weights) are then obtained by averaging the normalized values across each row for 100,000 matrices, using Equation (5).
The next step involves checking the consistency of the pairwise comparisons. This process begins by calculating the principal eigenvalue (λmax) by multiplying the pairwise comparison matrix with the priority vector and averaging the eigenvalue estimates (Equation (6)).
The consistency index (CI) is then determined using λmax (Equation (7)), followed by calculating the random consistency index (RI) based on random matrices (Table 6).

Table 6.
RI values (Saaty, 1987).
The consistency ratio (CR) is computed by dividing the CI by the RI, with a CR of 0.1 or less considered acceptable (Equation (8)). Finally, the weight of each index is determined by averaging the weights of the matrices that satisfy the CR condition, ensuring consistency and reliability in the decision-making process.
To show the distribution of weights for each index and to analyze and interpret the behavior of each index, histograms of frequencies for BD, TD, and LD have been plotted, as exemplified in Figure 9.
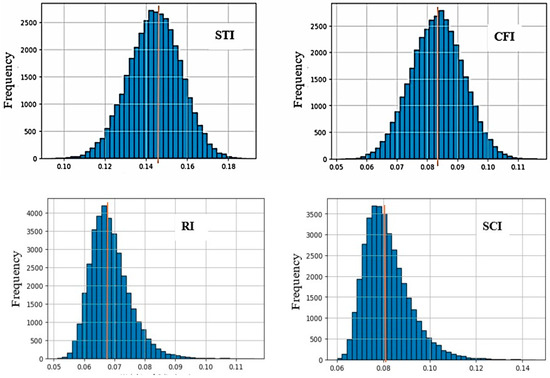
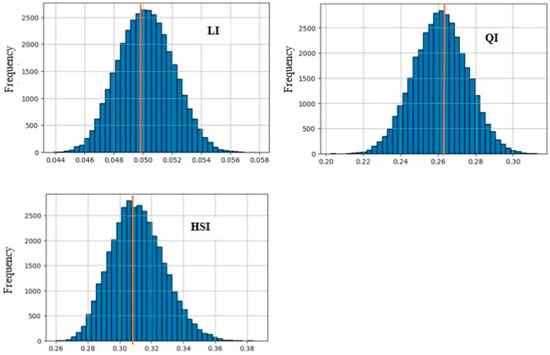
Figure 9.
Histogram of frequencies for indices’ weights (TD).
After implementing the hybrid MC-AHP technique, a set of three values for each index and sub-index is derived from three probability distributions (BD, TD, and LD). To identify the most accurate values (weights) for the indices and sub-indices used in the assessment process, two critical factors are considered. First, the volume of accepted matrices (CRI < 0.1) is vital. A higher number of accepted matrices provides more reliable weight values for the mean calculation, suggesting that the chosen probability distribution is a suitable fit for the empirical data derived from expert opinions. Second, the standard deviation (Std Dev) values are assessed.
The standard deviation measures how well the mean represents the data [43], with lower values indicating that the data points are closely clustered around the mean, reflecting greater consistency, while higher values suggest a wider range of variation, as illustrated in Figure 10. Table 7 shows that the values derived from TD are the most accurate for identifying the weights of indices, and they are also suitable for sub-indices.
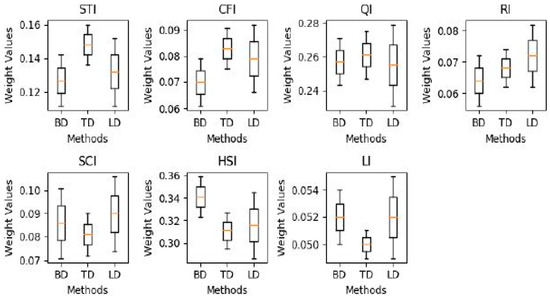
Figure 10.
Box plot for each index for BD, TD, and LD.

Table 7.
Values for each index derived from BD, TD, and LD.
Finally, Table 8 presents the integration of the main indices with the sub-indices for use in assessing SC performance.

Table 8.
Integration of indices and sub-indices.
7. Developing an Integrated Model for Evaluating the Performance of SCs
An integrated model for evaluating SC performance calculates the SC performance index (PI) using a linear additive utility model (LAUM) incorporating multiple indices. Figure 11 illustrates the hierarchical design of the project performance model, while Figure 12 outlines the steps to calculate the PI.
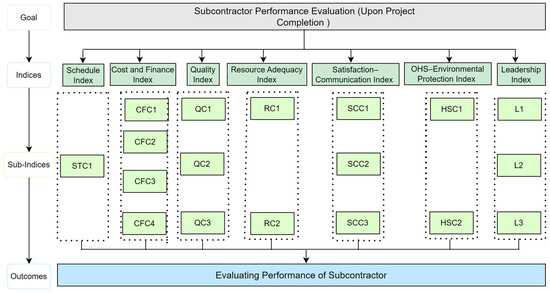
Figure 11.
Hierarchical design of project performance model.
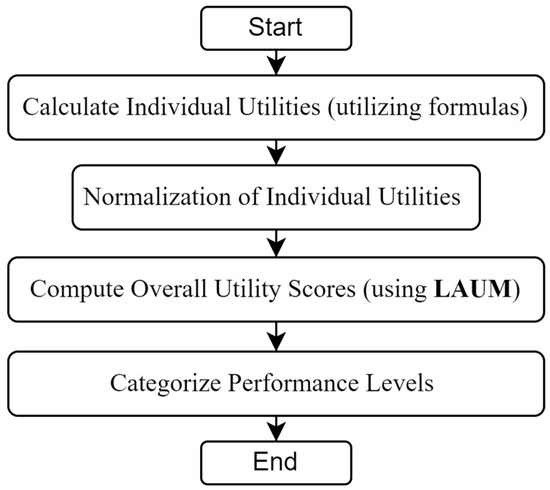
Figure 12.
Steps for calculating PI.
7.1. Normalization of the Subcontractor (SC) Performance Indices
The normalization of SC performance indices is crucial for ensuring a fair, objective, and accurate evaluation process. It addresses issues related to scale and unit differences, enables proper weighting, and strengthens decision-making. By applying appropriate normalization techniques, GCs can achieve consistent and robust performance assessments that accurately reflect SC performance [44]. In this context, the normalization method implemented in this study is both novel and significant, as it generates equations based on proposed ranges that are specifically tailored to the context of the indices, rather than relying solely on predefined ranges. This innovative technique reduces the risk of errors and effectively minimizes bias in the determination of index values.
Ref. [35] highlighted the complexity of performance measurement, which arises from factors such as the dynamic nature of project objectives and the involvement of multiple participants with varying interests. Additionally, some performance objectives are subjective. Given the unique nature of construction projects, normalization must be tailored to specific project conditions and control philosophies. For demonstration purposes, this study proposes three types of normalization based on the tolerance levels of indices—high, medium, and low—to cover a wide range of project conditions and GC policies.
For example, Table 9 illustrates the three types of normalization for the sub-index (CFI2), and Figure 13 demonstrates how the calculated CFI2 (Cl) value can be accurately converted into the normalized CFI2 (NI) value using the trending technique to generate the normalizing equation, where NI = f(Cl). Table 10 provides the normalizing equations for all indices.

Table 9.
The three types of normalization for CFI2.
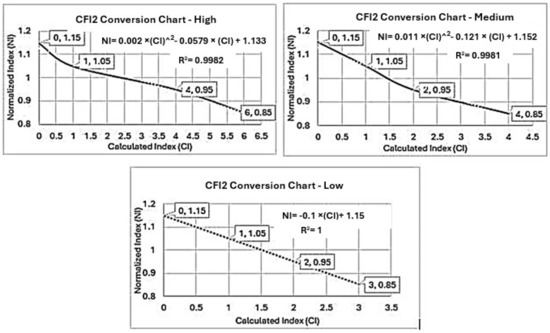
Figure 13.
Linear transformation between normalized and calculated CFI2 index.

Table 10.
Normalizing equations for all indices.
7.2. Implementing the Linear Additive Utility Model (LAUM)
The linear additive utility model (LAUM) is a widely used approach in multi-criteria decision analysis (MCDA) for evaluating and ranking alternatives based on multiple criteria. It offers significant advantages in terms of simplicity and transparency [45]. The LAUM provides a structured and quantifiable method to aggregate different performance metrics into a single composite score, facilitating a more comprehensive evaluation of alternatives [45,46].
The condition for implementing the LAUM to calculate the PI is that the various indices considered in the performance evaluation process are mutually preferentially independent [35].
Ref. [35] asserts that the condition of mutual preferential independence must be satisfied in order to decompose the joint utility function into a sum of individual single-attribute utility functions when the utilities are represented by numerical values. In this study, the condition is met because all criteria are quantitative.
The performance index (PI) can be formulated as a linear additive utility model using Equation (9).
where:
- Wi: utility weight, or the relative importance of the index.
- Ni: the normalization of each index.
- n: the number of indices.
7.3. Categorize Performance Levels
Categorizing performance levels using normalization involves converting raw performance scores into a standardized range and then assigning these normalized scores to specific performance categories. Table 11 illustrates the normalization of the performance levels. This scale is used for the three levels of tolerance and for demonstration purposes only.

Table 11.
Normalization of performance level table.
8. Case Study
For demonstration purposes, a case study using real project data was compiled to illustrate the application of the unified measurement and forecasting framework presented in this study. The data pertains to the remodeling of three floors in a tower to prepare new offices in Edmonton, Alberta, undertaken by a local contracting company and SCs.
The SC whose performance is being assessed is responsible for the data and communication work in the project. This work primarily includes the design and installation of structured cable and network devices, such as routers and switches, as well as the setup of telecommunication systems, Wi-Fi, security systems (e.g., CCTV), and data centers. It should be emphasized that all data are scaled and presented for demonstration purposes only. The project started on 1 May 2023, and the actual completion date was 19 September 2023. Additionally, the revised contract value is CAD 179,088, and the revised project duration is 130 days.
Table 12 illustrates the calculation of performance indices for the proposed SC based on data inputted into the application from the site. A medium tolerance level was selected for the normalization of indices. Figure 14 displays the application’s interface.

Table 12.
The calculation of performance indices for the SC in the remodeling project case study.
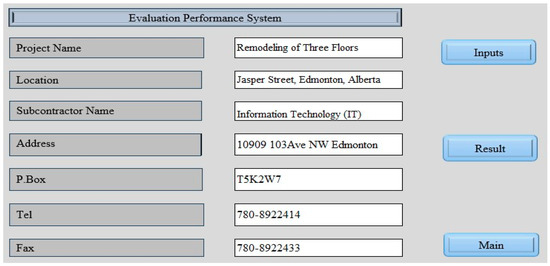
Figure 14.
Application’s interface.
Based on the results illustrated in Figure 15, the performance of the proposed SC exceeds the target, depending on the normalization of the performance level (as referred to in Table 11).
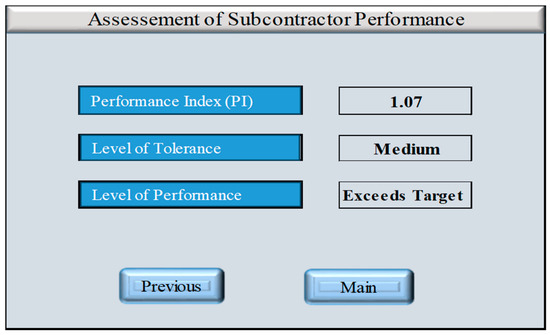
Figure 15.
The result of the performance assessment.
9. Sensitivity Analysis
Sensitivity analysis is an invaluable tool for understanding the behavior of complex models and making informed decisions based on model outputs. By systematically varying input variables and analyzing the resulting changes in output, sensitivity analysis helps identify key drivers, validate models, manage risks, and optimize performance across various fields [47,48]. In this study, sensitivity analysis is conducted according to three scenarios: varying the weights of indices, adjusting the levels of tolerance, and a final scenario that combines the first and second scenarios.
9.1. Sensitivity of Indices’ Weightage
The sensitivity of the indices’ weights was analyzed through the creation of three different scenarios. These scenarios involved testing the sensitivity of the two indices with the highest weights (HSI1 and STI) by increasing and decreasing their values by a specified percentage while adjusting the other weights proportionally to maintain a total weight sum of 1.
The radar chart (Figure 16) illustrates the sensitivity analysis of the HSI1 index, showing how changes in its weight affect the performance index (PI) under different scenarios for the case study. When the weight of HSI1 is increased (10%, 20%, 40%, 50%), the PI consistently rises (1.08, 1.09, 1.1, and 1.11), and the assessment of performance remains as “Exceeds Target”, indicating that increases in HSI1 influence the PI as values only. Conversely, when the weight is decreased by the same percentages, the PI initially remains above the target at a 10% decrease (1.06) but shifts to a “Within Target” assessment as the decrease reaches 20%, 40%, and 50%, with PI values of 1.05, 1.04, and 1.03, respectively. This indicates a significant impact on the PI from weight reductions. The chart shows that the model is more sensitive to decreases in HSI1 weight which produce larger changes in the status of the assessment compared to increases.
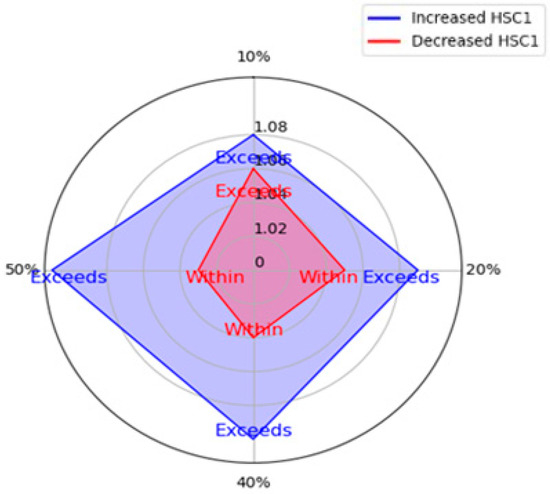
Figure 16.
Sensitivity analysis of the HSI1 index.
The sensitivity of the STI index weight, whether increased or decreased by 10%, 20%, 40%, or 50%, has no significant impact on the performance index (PI), which remains consistent at 1.07 across all scenarios. This result highlights that the model maintains an “Exceeds Target” assessment despite changes in the STI weight.
9.2. Levels of Tolerance
The radar chart (Figure 17) shows that as tolerance levels increase from low to high, the performance index (PI) also rises, with low levels achieving a “Within Target” assessment (PI of 1.04) and medium to high levels maintaining an “Exceeds Target” status (PIs of 1.07 and 1.09). This indicates that a low tolerance level has a significant impact on performance outcomes.
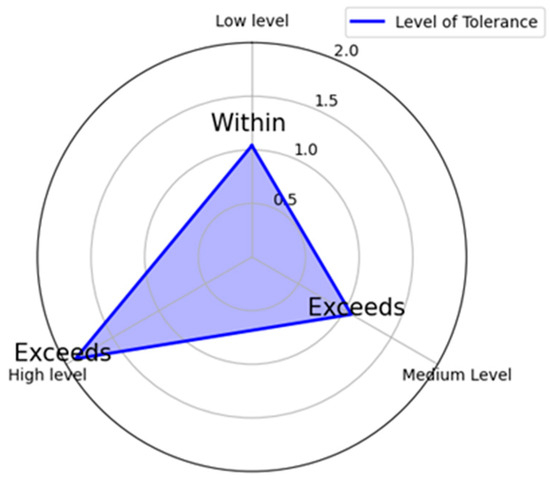
Figure 17.
Sensitivity analysis of level of tolerance.
9.3. Indices’ Weightage and Levels of Tolerance
In this scenario, the sensitivity analysis of the HSI1 index reveals that changes in this index influence the assessment of SC performance across different tolerance levels, as shown in Figure 18. When the HSI1 index increases, the performance index (PI) tends to exceed the target for high and medium tolerance levels. However, even with a 50% increase, the low tolerance level only slightly exceeds the target by 40%, indicating that the assessment process is less sensitive to these increases. Conversely, when the HSI1 index decreases, the PI consistently remains within the target, particularly with larger decreases. At a 10% decrease, the performance of the SC for high (1.08) and medium (1.06) tolerance levels exceeds the target, but at a 50% decrease, the performance for all tolerance levels remains “Within”.
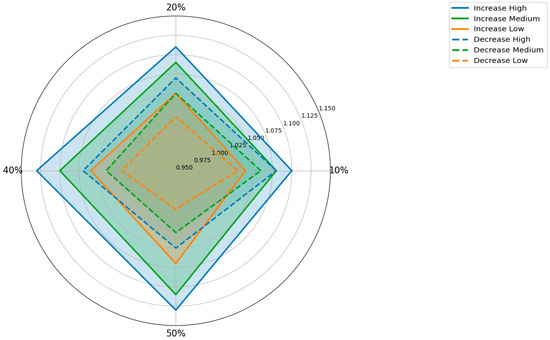
Figure 18.
Sensitivity analysis of the HSI1 index with levels of tolerance.
9.4. Analysis of Results
The sensitivity analysis highlights how changes in indices’ weights and tolerance levels affect SC performance assessments. The model is more sensitive to decreases in the HSI1 index weight, shifting from “Exceeds Target” to “Within Target” with larger reductions, while increases in the HSI1 index weight maintain the same status. Changes in the STI index weight have minimal impact, keeping a consistent assessment. Adjusting tolerance levels shows that a lower tolerance has a more significant impact on performance outcomes. Overall, the analysis underscores the importance of managing indices and tolerance levels to ensure accurate and optimized performance evaluations.
10. Conclusions
This study presents the development of a performance assessment model for SCs upon the completion of projects which is a significant advancement for the construction industry. This model provides a structured approach to quantifying SC performance through objective metrics, which enhances decision-making accuracy and reduces the risk of bias inherent in subjective evaluations. Implementing quantitative scales and objective measurements ensures a higher degree of transparency and consistency in the assessment process. Additionally, incorporating practices regarding waste management and cleaning the workplace into the performance assessment framework aligns with the growing emphasis on environmental responsibility in construction projects. The model can be applied to different companies, and the normalization range can be changed to best reflect the values and policy of a construction company. This study proposes a framework for practitioners and researchers to use in developing a customized SC performance index for projects of any type or size. The proposed framework provides a systematic and structured process to evaluate SC performance from the GC’s perspective.
The overall index is based on eighteen objective measurements of SC performance under seven main indices: time, cost, quality, resource adequacy, quality, occupational health and safety and environmental protection, GC satisfaction, and leadership. These indices were considered to be highly significant and necessitated measurements to assess the performance of SCs.
In this paper, a hybrid technique combining Monte Carlo simulation and the Analytical Hierarchy Process (AHP) was employed to weigh the indices based on expert opinions from leading construction companies in Canada. The results indicate that the occupational health and safety index holds the highest weight, with a value of 0.31, followed by the quality index at 0.261 and the time index at 0.148. These findings highlight the importance of the safety index in Canada, contrasting with previous studies where the quality or cost index was assigned the highest weight. A real case study demonstrated the practical application of these indices by normalizing the values and calculating the performance index using the linear additive utility method (LAUM). The assessment results indicate that the performance exceeds the target at a medium tolerance level. This finding confirms that preventing accidents or incidents on site significantly contributes to improving the performance of SCs. Additionally, the sensitivity analysis indicates the impact of HSI1 on the value of the performance index. A composite performance index was represented with a unique number (PI). Analyzing performance status in relation to company management can improve the management process for GCs and help them to utilize lessons learned. The objective application supports GCs in using measurement indices for new projects in the future.
The study’s limitations and suggestions for future research are outlined as follows:
- This study combines Monte Carlo simulation and the AHP to weigh indices and criteria using expert opinion-based probability distributions. With input from limited experts, three distributions were created, though a larger panel would improve distribution accuracy.
- The model validation process was limited to expert opinions mainly from GCs, restricting perspective diversity—a noted limitation.
- The linear additive utility model (LAUM) was applied with three normalization levels (low, medium, high). Any adjustments to these levels require re-coding, posing a limitation in adaptability.
- This study assesses SC performance at project completion. Future studies could explore periodic assessments during project progress.
- Researchers may investigate the applicability of this approach in other industries, such as manufacturing, oil and gas, or IT services, to gain cross-industry insights where SC evaluation is critical.
- This study utilizes objective measurements rather than subjective ones. Researchers can use these measurements during projects and employ machine learning methods to forecast SC performance or identify defects in the managerial processes of the GC regarding the management of SC relationships to drive improvements.
Author Contributions
Conceptualization, I.A.H. and A.H.; methodology, I.A.H.; validation, I.A.H.; analysis, I.A.H.; data curation, I.A.H.; writing—original draft preparation, I.A.H.; writing—review and editing, I.A.H. and A.H.; visualization, I.A.H.; supervision, A.H. All authors have read and agreed to the published version of the manuscript.
Funding
This research is funded by the Natural Sciences and Engineering Research Council of Canada (NSERC)—Mission Alliance Grant number: 577032-2022.
Data Availability Statement
The data presented in this study are available on request from the corresponding author.
Conflicts of Interest
The authors declare no conflicts of interest.
References
- Artan Ilter, D.; Bakioglu, G. Modeling the relationship between risk and dispute in subcontractor contracts. J. Leg. Aff. Disput. Resolut. Eng. Constr. 2018, 10, 04517022. [Google Scholar] [CrossRef]
- Okunlola, O.S. The Effect of Contractor-Subcontractor Relationship on Construction Duration in Nigeria. Int. J. Civ. Eng. Constr. Sci. 2015, 2, 16–23. [Google Scholar]
- Arditi, D.; Chotibhongs, R. Issues in Subcontracting Practice. J. Constr. Eng. Manag. 2005, 131, 866–876. [Google Scholar] [CrossRef]
- Conner, K.R.; Prahalad, C.K. A Resource-Based Theory of the Firm: Knowledge Versus Opportunism. Organ. Sci. 1996, 7, 477–501. [Google Scholar] [CrossRef]
- Pallikkonda, K.D.; Siriwardana, C.S.A.; Karunarathna, D.M.T.G.N.M. Developing a Subcontractor Pre-Assessment Framework for Sri Lankan Building Construction Industry. In Proceedings of the 13th ICSBE Volume II, Kandy, Sri Lanka, 2019; Volume 1, p. 15. [Google Scholar]
- Francis, V.; Hoban, A. Improving Contractor/Subcontractor Relationships through Innovative Contracting. In Proceedings of the 10th Symposium on Construction Innovation and Global Competitiveness, Boca Raton, FL, USA, 2002; pp. 771–787. [Google Scholar]
- Hinze, J.; Tracey, A. The Contractor-Subcontractor Relationship: The Subcontractor’s View. J. Constr. Eng. Manag. 1994, 120, 274–287. [Google Scholar] [CrossRef]
- Wang, D.; Yung, K.L.; Ip, W.H. A Heuristic Genetic Algorithm for Subcontractor Selection in a Global Manufacturing Environment. IEEE Trans. Syst. Man Cybern. C (Appl. Rev.) 2001, 31, 189–198. [Google Scholar] [CrossRef]
- Cox, R.F.; Issa, R.R.; Frey, A. Proposed Subcontractor-Based Employee Motivational Model. J. Constr. Eng. Manag. 2006, 132, 152–163. [Google Scholar] [CrossRef]
- Shash, A.A. Subcontractors’ Bidding Decisions. J. Constr. Eng. Manag. 1998, 124, 101–106. [Google Scholar] [CrossRef]
- El-Mashaleh, M.S. A Construction Subcontractor Selection Model. Jordan J. Civ. Eng. 2009, 3, 375–383. [Google Scholar]
- Arslan, G.; Kivrak, S.; Birgonul, M.T.; Dikmen, I. Improving Subcontractor Selection Process in Construction Projects: Web-Based Subcontractor Evaluation System (WEBSES). Autom. Constr. 2008, 17, 480–488. [Google Scholar] [CrossRef]
- Afshar, M.R.; Shahhosseini, V.; Sebt, M.H. Optimal Subcontractor Selection and Allocation in a Multiple Construction Project: Project Portfolio Planning in Practice. J. Oper. Res. Soc. 2022, 73, 351–364. [Google Scholar] [CrossRef]
- Hanák, T.; Nekardová, I. Selecting and Evaluating Suppliers in the Czech Construction Sector. Period. Polytech. Soc. Manag. Sci. 2020, 28, 155–161. [Google Scholar] [CrossRef]
- Cheng, M.Y.; Wu, Y.W. Improved Construction Subcontractor Evaluation Performance Using ESIM. Appl. Artif. Intell. 2012, 26, 261–273. [Google Scholar] [CrossRef]
- Ng, T.S.T. Using Balanced Scorecard for Subcontractor Performance Appraisal. In Proceedings of the FIG Working Week and XXX General Assembly, Hong Kong, China, 13–17 May 2007. [Google Scholar]
- Ng, S.T.; Skitmore, M. Developing a Framework for Subcontractor Appraisal Using a Balanced Scorecard. J. Civ. Eng. Manag. 2014, 20, 149–158. [Google Scholar] [CrossRef]
- Eom, C.S.; Yun, S.H.; Paek, J.H. Subcontractor Evaluation and Management Framework for Strategic Partnering. J. Constr. Eng. Manag. 2008, 134, 842–851. [Google Scholar] [CrossRef]
- Başaran, Y.; Aladağ, H.; Işık, Z. Pythagorean Fuzzy AHP-Based Dynamic Subcontractor Management Framework. Buildings 2023, 13, 1351. [Google Scholar] [CrossRef]
- Cheng, M.Y.; Tsai, H.C.; Sudjono, E. Evaluating Subcontractor Performance Using Evolutionary Fuzzy Hybrid Neural Network. Int. J. Proj. Manag. 2011, 29, 349–356. [Google Scholar] [CrossRef]
- Ko, C.H.; Cheng, M.Y.; Wu, T.K. Evaluating Subcontractors’ Performance Using EFNIM. Autom. Constr. 2007, 16, 525–530. [Google Scholar] [CrossRef]
- Mbachu, J. Conceptual Framework for the Assessment of Subcontractors’ Eligibility and Performance in the Construction Industry. Constr. Manag. Econ. 2008, 26, 471–484. [Google Scholar] [CrossRef]
- Ng, S.T.; Tang, Z. Delineating the Predominant Criteria for Subcontractor Appraisal and Their Latent Relationships. Constr. Manag. Econ. 2008, 26, 249–259. [Google Scholar] [CrossRef]
- Hudson, M.; Smart, A.; Bourne, M. Theory and Practice in SME Performance Measurement Systems. Int. J. Oper. Prod. Manag. 2001, 21, 1096–1115. [Google Scholar] [CrossRef]
- Maturana, S.; Alarcón, L.F.; Gazmuri, P.; Vrsalovic, M. On-site subcontractor evaluation method based on lean principles and partnering practices. J. Manag. Eng. 2007, 23, 67–74. [Google Scholar] [CrossRef]
- Chamara, H.W.L.; Waidyasekara, K.G.A.S.; Mallawaarachchi, H. Evaluating Subcontractor Performance in Construction Industry. In Proceedings of the 6th International Conference on Structural Engineering and Construction Management, Kandy, Sri Lanka, 11–13 December 2015; Volume 5, pp. 137–147. [Google Scholar]
- Mahmoudi, A.; Javed, S.A. Performance Evaluation of Construction Subcontractors Using Ordinal Priority Approach. Eval. Program Plan. 2022, 91, 102022. [Google Scholar] [CrossRef] [PubMed]
- Lumanauw, R.N.; Ng, P.K.; Saptari, A.; Halim, I.; Toha, M.; Ng, Y.J. Performance Evaluation of Subcontractors Using Weighted Sum Method through KPI Measurement. J. Eng. Technol. Appl. Phys. 2023, 5, 35–49. [Google Scholar] [CrossRef]
- Abdull Rahman, S.H.; Mat Isa, C.M.; Kamaruding, M.; Nusa, F.N.M. Performance Measurement Criteria. In Green Infrastructure: Materials and Sustainable Management; Springer Nature: Singapore, 2024. [Google Scholar]
- Wasserman, S.; Faust, K. Social Network Analysis: Methods and Applications; Cambridge University Press: Cambridge, UK, 1994. [Google Scholar]
- Scott, J.; Carrington, P.J. The SAGE Handbook of Social Network Analysis; SAGE Publications: London, UK, 2011. [Google Scholar]
- Bastian, M.; Heymann, S.; Jacomy, M. Gephi: An Open-Source Software for Exploring and Manipulating Networks. In Proceedings of the International AAAI Conference on Web and Social Media, San Jose, CA, USA, 17–20 May 2009. [Google Scholar]
- Hanneman, R.A.; Riddle, M. Introduction to Social Network Methods; University of California: Riverside, CA, USA, 2005. [Google Scholar]
- Putri, C.G.; Nusraningrum, D. Subcontractors Selection of Building Construction Project Using Analytical Hierarchy Process (AHP) and Technique for Others Reference by Similarity (TOPSIS) Methods. J. Manaj. Teor. Dan Terap. 2022, 15, 262–273. [Google Scholar] [CrossRef]
- Nassar, N.; AbouRizk, S. Practical application for integrated performance measurement of construction projects. J. Manag. Eng. 2014, 30, 04014027. [Google Scholar] [CrossRef]
- Shahar, D.J. Minimizing the variance of a weighted average. Open J. Stat. 2017, 7, 216–224. [Google Scholar] [CrossRef]
- Momani, A.M.; Ahmed, A.A. Material Handling Equipment Selection Using Hybrid Monte Carlo Simulation and Analytic Hierarchy Process. World Acad. Sci. Eng. Technol. 2011, 59, 953–958. [Google Scholar]
- Saaty, T.L.; Vargas, L.G. Models, Methods, Concepts & Applications of the Analytic Hierarchy Process; Springer Science & Business Media: Berlin/Heidelberg, Germany, 2012. [Google Scholar]
- Banzon, M.J.R.; Bacudio, L.R.; Promentilla, M.A.B. Application of Monte Carlo Analytic Hierarchical Process (MCAHP) in the Prioritization of Theme Park Service Quality Elements. In Proceedings of the 2016 International Conference on Industrial Engineering and Operations Management, Kuala Lumpur, Malaysia, 8–10 March 2016; IEOM Society: Southfield, MI, USA, 2016. [Google Scholar]
- De Felice, F.; Petrillo, A. Analytic Hierarchy Process-Models, Methods, Concepts, and Applications; Intech Open: London, UK, 2023. [Google Scholar]
- Gorripati, R.; Thakur, M.; Kolagani, N. A Framework for Optimal Rank Identification of Resource Management Systems Using Probabilistic Approaches in Analytic Hierarchy Process. Water Policy 2022, 24, 878–898. [Google Scholar] [CrossRef]
- Schaefer, T.; Udenio, M.; Quinn, S.; Fransoo, J.C. Water Risk Assessment in Supply Chains. J. Clean. Prod. 2019, 208, 636–648. [Google Scholar] [CrossRef]
- Lee, D.K.; In, J.; Lee, S. Standard Deviation and Standard Error of the Mean. Korean J. Anesthesiol. 2015, 68, 220–223. [Google Scholar] [CrossRef]
- Kroonenberg, P.M. Applied Multiway Data Analysis; John Wiley & Sons: Hoboken, NJ, USA, 2008. [Google Scholar]
- Figueira, J.; Greco, S.; Ehrogott, M.; Dyer, J.S. MAUT—Multi Attribute Utility Theory. In Multiple Criteria Decision Analysis: State of the Art Surveys; Springer: Boston, MA, USA, 2005; pp. 265–292. [Google Scholar]
- Belton, V.; Stewart, T. Multiple Criteria Decision Analysis: An Integrated Approach; Springer Science & Business Media: New York, NY, USA, 2002. [Google Scholar]
- Helton, J.C.; Davis, F.J. Latin Hypercube Sampling and the Propagation of Uncertainty in Analyses of Complex Systems. Reliab. Eng. Syst. Saf. 2003, 81, 23–69. [Google Scholar] [CrossRef]
- Saltelli, A.; Tarantola, S.; Campolongo, F.; Ratto, M. Sensitivity Analysis in Practice: A Guide to Assessing Scientific Models; Wiley: New York, NY, USA, 2004. [Google Scholar]
Disclaimer/Publisher’s Note: The statements, opinions and data contained in all publications are solely those of the individual author(s) and contributor(s) and not of MDPI and/or the editor(s). MDPI and/or the editor(s) disclaim responsibility for any injury to people or property resulting from any ideas, methods, instructions or products referred to in the content. |
© 2025 by the authors. Licensee MDPI, Basel, Switzerland. This article is an open access article distributed under the terms and conditions of the Creative Commons Attribution (CC BY) license (https://creativecommons.org/licenses/by/4.0/).
