Abstract
Total floor areas of existing masonry structures in China cover 25 billion square meters. A significant proportion of these structures were classified as Grade C or D following a safety assessment. The compaction of masonry mortar occurs concurrently with an increase in vertical loads from upper-story walls and floor slabs. This condition may alter the actual compressive bearing capacity due to the compaction effect on the mortar of ground-floor walls. However, this effect is not addressed in the Chinese Code for Design of Masonry Structures. This study involved designing 12 brick walls using mortar with design strength grades of M2.5, M5, and M7.5, as determined by compressive testing. Each group simulated the ground-floor walls of four-, five-, and six-story masonry structures, considering the combined effects of vertical loads and mortar compaction, respectively. The results showed that, during mortar curing in ground-floor walls, the cracking load and ultimate load capacity of the wall models increased with progressively increasing loads from upper-floor walls and slabs. This is possibly due to the compaction effect on the mortar, which benefits the mortar density and the bonding performance between the mortar and brick. Due to the higher initial porosity and weaker bonding of low-strength mortar, the cracking load capacity of low-strength mortar walls under preloading increased significantly more than was observed in high-strength mortar walls. Conversely, owing to the high correlation between ultimate load and compressive strength, higher mortar strength had a more significant effect on the ultimate loads of the brick wall specimens under preloading. An increase in ultimate load capacity exhibited a linear relationship with the number of structural layers. This study can inform the safety assessment of existing masonry walls.
1. Introduction
Masonry walls are typically constructed by bonding blocks with mortar. Unreinforced masonry walls are most commonly used in low- and mid-rise building structures, offering advantages such as ease of construction, low cost, readily available materials, and excellent durability. As vertical load-bearing components in masonry structures, the compressive strength of masonry walls is their most critical mechanical property. Essentially, masonry walls are composite structures formed by two materials with significantly different properties, such as elastic modulus and Poisson’s ratio [1,2,3]. Construction quality also significantly affects the bonding between these two materials, making the mechanical analysis of masonry walls relatively complex [4,5,6,7,8,9].
In recent decades, numerous experimental and numerical studies have investigated the compressive performance of masonry walls [9,10,11,12,13,14,15,16,17,18,19,20,21,22,23,24]. Results indicate that block strength significantly influences wall compressive strength. Compressive strength of brick walls ranges from 1.1 MPa to 13.9 MPa, with the ratio of masonry wall compressive strength to brick compressive strength varying between 11% and 76% [25] and demonstrating considerable variability. The relative relationship between brick compressive strength and mortar compressive strength also influences the mechanical performance of walls. Generally, it is recognized that when brick walls are of lower strength, the impact of mortar grade on wall compressive bearing capacity is minimal. In other words, mortar strength has a secondary influence on wall compressive strength compared to brick strength. When both brick and mortar strengths double, the wall’s compressive load-bearing capacity increases by 95% and 19%, respectively [18]. Currently, these two factors also serve as key parameters in wall compressive strength calculation formulas specified by national codes [26,27,28,29].
Several studies have examined the influence of factors related to mortar, such as construction techniques and mortar joint thickness, on the compressive failure patterns and load-bearing capacity of masonry walls, beyond mortar strength. Zahra et al. [30] investigated the impact of two laying patterns on masonry member failure mechanisms. They found that mismatched deformation characteristics between blocks and mortar caused vertical cracking on the sides of fully laid members, while face-shell bedded prisms exhibited web splitting. Caldeira et al. [31] examined the relationship between the mortar joint thickness, mortar type, and member failure modes. They found that increased joint thickness reduced the lateral confinement force in the mortar. When the mortar strength was significantly lower than the block strength, the effect of the mortar joint thickness became more pronounced, even leading to mortar fragmentation. Overall, the walls still exhibited a failure process progressing from block tensile cracking of the blocks to local crushing of members. Walls composed of cement mortar, cement–lime mortar, and polymer-modified mortar also exhibit differences in compressive load-bearing capacity [32,33,34]. For instance, Thamboo [35] found that polymer mortar increased the brick wall compressive strength of brick walls by 10–18% compared to cement mortar. Darwish et al. [36] compared the effects of cement mortar and earth-based mortar on the compressive performance of brick walls, noting that cement mortar brick walls achieved approximately 80% of the compressive strength of earth-based mortar components. In recent years, studies have also investigated the effects of nano-modified mortars with early-setting properties [37,38] and carbon nanofiber-modified mortars [39] on masonry strength. Findings indicate that nano-modified mortars can enhance masonry compressive strength by nearly 20% [37,38]. These studies suggest that the comprehensive properties of the mortar influence the compressive load-bearing capacity of masonry.
Prior to conducting a compressive experiment on masonry walls, it should be noted that the strength properties of both the brick and mortar materials need to be tested. However, the conditions under which the mortar strength is tested differ from those of actual construction. During construction, once the masonry has been completed and the internal mortar has not yet fully hardened, the superstructure and floor slabs are added. These loads induce a compaction effect in the mortar. Thus, the compaction of the mortar and the bond between the mortar and brick gradually increase. This factor is not accounted for in mortar strength tests, which leads to an underestimation of the mortar and the masonry wall. Currently, although some studies have compared the compressive strength of masonry walls with different mortar characteristics [40], the influence of construction conditions remains unexplored.
The purpose of this paper is to investigate the effect of the masonry mortar curing processes on the compressive bearing capacity of masonry walls. Twelve brick wall specimens across three mortar grades were subjected to an axial compression test. Four specimens per group simulated the walls with no initial compressive stress and ground-story walls of the four-, five-, and six-story buildings, respectively. The axial compression failure modes and the load–deformation relationship of the brick wall specimens were investigated. The influence of the compaction effect on the cracking load, ultimate load, and brittleness of the brick walls was also examined.
2. Experiment Overview
The masonry prototype had a bay width of 3.3 m and a story height of 3 m. Twelve ground-floor brick wall specimens were designed, comprising three mortar grades (M2.5, M5, and M7.5), with each test group comprising four specimens. Prior to testing, vertical loads generated during the construction were progressively applied as prestress. Each group considered the progressively increasing vertical loads on the ground-floor walls during the construction of four-, five-, and six-story masonry structures. An additional control case that excluded the effects of the construction process was also processed. The size of bricks was 230 mm × 115 mm × 50 mm, classified as MU10. The face dimensions of the brick walls were 750 mm × 750 mm, with a thickness of 230 mm.
2.1. Material Performance Testing
Compressive strength tests were conducted on brick blocks and mortar. Twelve brick specimens were prepared in accordance with the Test Methods for Wall Bricks (GB/T 2524-2012) code [41], as illustrated in Figure 1. The compressive strengths of two of the specimens were low due to imperfections. The results for the remaining ten brick specimens are shown in Table 1. The dimensions of the brick specimens are listed in Table 1, and they were classified as MU10. Nine mortar specimens with dimensions of 70.7 mm × 70.7 mm × 70.7 mm were prepared based on the code called Test Methods for Basic Properties of Building Mortars (JGJ/T 70-2009) [42]. Table 2 displays the compressive strengths of the nine mortar specimens. The results indicate that the average compressive strength of the bricks is 10.4 MPa, with a coefficient of variation of 0.08 and a standard deviation of 9.5 MPa. The measured strengths of the three groups of mortar specimens were 3.3 MPa, 6.9 MPa, and 9.6 MPa, respectively, exceeding 2.5 MPa, 5 MPa, and 7.5 MPa. Their strength grades were therefore assessed as M2.5, M5, and M7.5.
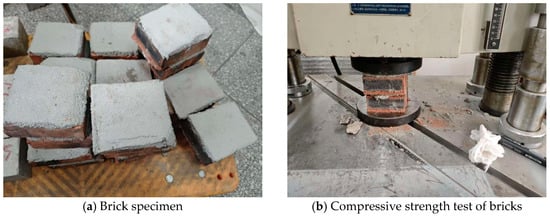
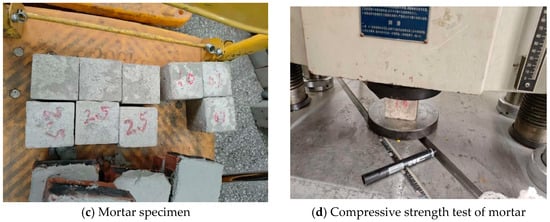
Figure 1.
Compressive strength test of brick blocks and mortar specimens.

Table 1.
Compressive strength test results for masonry blocks.
Table 2.
Compressive strength test value of mortar specimens.
2.2. Test Specimen Preparation
2.2.1. Brick Wall Specimen Construction
Twelve brick walls were constructed using a stretcher–header bond pattern. The walls had face dimensions of 750 mm × 750 mm and a thickness of 240 mm. The foundation beam measured 1350 mm in length, with a cross-section of 300 mm × 300 mm. The loading beam measured 870 mm in length and had a cross-section of 300 mm × 250 mm. To simulate the effects of mortar curing in the constructed wall and progressive loading from the upper-story walls and floor slabs, four reinforced concrete cantilever hooks were incorporated into both the foundation and loading beams. Pre-drilled through-holes in these hooks accommodated prestressed links that simulated upper-story wall and slab loads, as detailed in Table 3 and Figure 2. Figure 3 illustrates the model fabrication process, and Figure 4 shows the finished specimens.
Table 3.
Information of models.
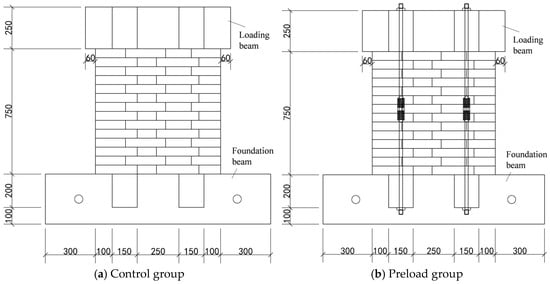
Figure 2.
Schematic diagram of brick walls.
Figure 3.
Fabrication process for brick wall specimens.
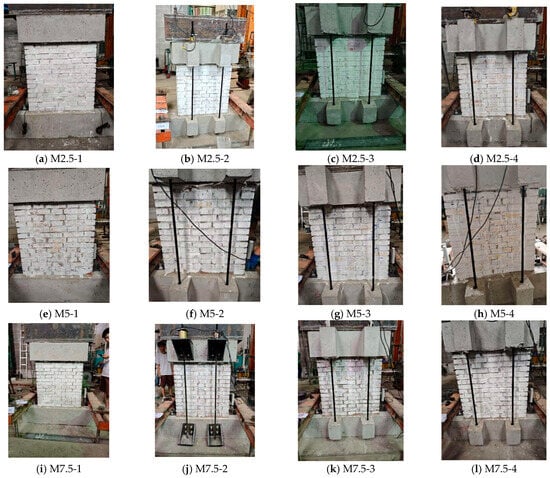
Figure 4.
Brick wall specimens.
2.2.2. Preloading
To investigate the effect of construction loads on the compressive bearing capacity of the ground-story brick walls, the masonry wall model was constructed, and prestressing was applied daily via four bolts following completion. These loads are equivalent to the structural gravity of four-, five-, and six-story buildings. The prestress loads for each specimen are shown in Table 4. As demonstrated in Table 4, in accordance with the Code for Acceptance of Construction Quality of Masonry Structures (GB 50203-2011) [43], the daily height of masonry construction should be regulated within 1.5 m under standard construction conditions. The test was designed based on a daily construction height of 1.5 m and a story height of 3 m. The construction sequence was initiated with the erection of the walls, followed by the pouring of the floor slabs, with progression occurring in a sequential manner, one story at a time. It is evident that the completion of the preloading application necessitates a duration of 12, 15, and 18 days, respectively, for the simulation of the ground-story walls of four-, five-, and six-story buildings.
Table 4.
Equivalent daily applied value for construction loads (Unit: kN).
The preload was calculated as follows. A masonry structure with three bays in the longitudinal direction and two bays in the transverse direction was selected as the test prototype for the application of construction loads. The dimensions of each bay were 8 m in the longitudinal direction and 6 m in the transverse direction, as illustrated in Figure 5. The thickness of the walls was 240 mm, and the thickness of the story slabs was 100 mm. As delineated in Section 2.2.1, a 750 mm × 750 mm wall from the ground-story transverse wall was selected as the test object. Based on the Code for Loading of Building Structures (GB50009-2012) [44], the designated permanent story load was established at 0.413 kN/m2, while the permanent roof load was set at 1.578 kN/m2. The unit weight of brick walls was 20 kN/m3, and the unit weight of the reinforced concrete was 25 kN/m3. Thus, the self-weight of a 1.5 m high wall was estimated to be approximately 5.4 kN. Considering the influence of surrounding masonry walls on the load distribution of this part and the effect of the load diffusion angle, a coefficient of 1.5 was applied. For safety considerations, an amplification factor of 1.6 was also adopted. The preload for a 1.5 m high wall, as outlined in Table 4, was 12.96 kN. The load capacity of a single-floor slab was defined as the self-weight of the slab within the associated area, in addition to the permanent load of the surface layer of the floor slab. In the context of roof slab loads, the permanent load of the surface layer of the roof slab was substituted for that of the floor slab. The single-floor slab load and roof slab load were 17.48 kN and 24.47 kN, respectively, with an associated area of 6 m2. The final preloads for four-, five-, and six-story buildings were 167.12 kN, 210.52 kN, and 260.91 kN. The test was conducted following the conclusion of the 28-day curing period.
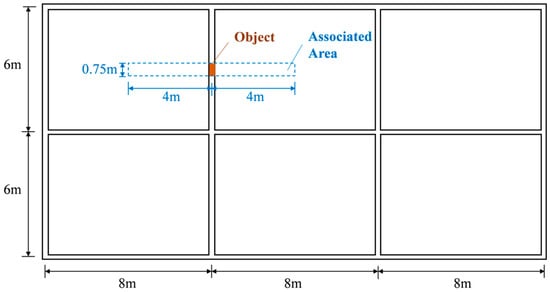
Figure 5.
Test prototype structure.
2.2.3. Loading Project
This test was conducted at the Structural Testing Laboratory of the China Academy of Building Research. As illustrated in Figure 6, the model was secured to the test bench, and the loading apparatus was physically aligned with the model. Vertical displacement transducers (LV1 and LV2) were installed on both sides of the specimen to measure its vertical displacement. Real-time stress changes on the four preloaded bolts in the model were measured using a stress measuring device, while a force sensor mounted at the jack end measured the vertical load. The total load on the wall is the sum of the jack force and the preload. To facilitate the description of crack distribution, the face shown in Figure 4 is designated the “front face”, and the opposite side is designated the “reverse face”. The left and right sides are termed the left and right faces, respectively.
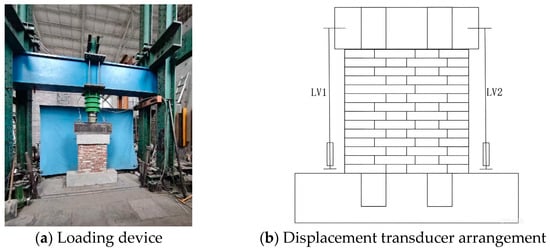
Figure 6.
Brick wall loading device and test point layout.
The force-controlled loading was performed. Within the 0–360 kN load range, each load increment was set at 60 kN. The subsequent load increments were set at 30 kN once 360 kN was reached. The dwell time was set as 1 min. When the first crack appeared in the specimen, the cracking load was recorded. As the loading process progressed, the development of wall cracks was recorded until the masonry wall failed and could no longer bear the load.
3. Experimental Process and Results Analysis
3.1. Experimental Phenomena
Figure 7 illustrates the failure patterns and crack distributions of M2.5 series wall specimens subjected to compressive loading. Due to space constraints, the results for the M5 and M7.5 mortar grade specimen groups are presented in Appendix A. The loads and corresponding test phenomena are summarized in Table 5. The results indicate that when construction loads are considered, fine cracks appear in specimens M2.5-2, M2.5-3, and M2.5-4 at loads of 600 kN, 820 kN, and 899 kN, respectively. Due to higher porosity, the mortar expands laterally more at the joint interface than at the base interface, resulting in stronger tensile stress in the bricks at the top of the wall. Consequently, most vertical initial cracks appear at the top of the wall. Subsequently, cracks continue to develop. When the compressive load reaches 1000 kN, specimens M2.5-2, M2.5-3, and M2.5-4 exhibit continuous vertical cracks. This load value is 28% higher than that corresponding to specimen M2.5-1. When loaded to 1104 kN, 1210 kN, and 1316 kN, respectively, specimens M2.5-2, M2.5-3, and M2.5-4 exhibit uncontrollable widening of cracks, with bricks being crushed or extruded from the wall. The load rapidly decreases, and the maximum crack width exceeds 8 mm. Specimen M2.5-1 exhibits similar phenomena, with a maximum crack width of 12 mm being recorded at the end of the experiment.
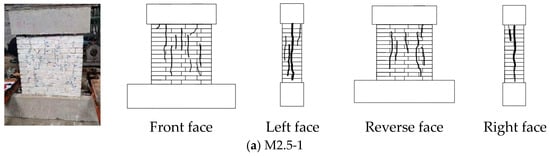
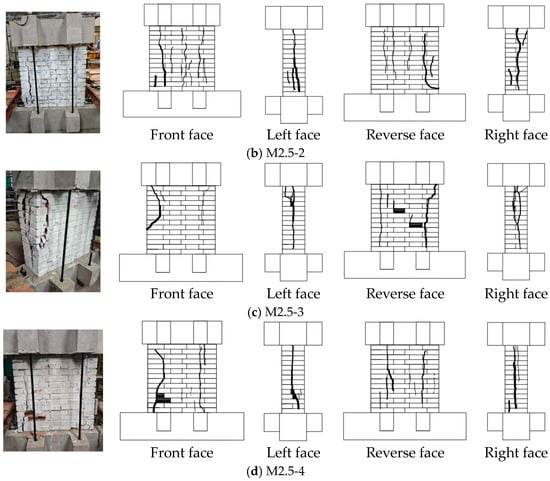
Figure 7.
Phenomena of M2.5 Series: wall configuration and crack distribution.
Table 5.
Summary of experimental phenomena for 12 specimens.
The experimental phenomena observed from loading to failure in specimens M5-1 to M5-4 are essentially consistent with those in specimens M2.5-1 to M2.5-4. This includes the progression of single-brick cracking, crack propagation, crack penetration, brick extrusion, and crushing. Due to the higher mortar strength compared to the first group, the corresponding load values are greater. When the mortar grade is M7.5, specimen M7.5-4 experiences sudden collapse of the middle–upper wall section and drops at a load of 2103 kN. Compared to specimens M7.5-1, M2.5-4, and M5-4, the difference in load between crack propagation and wall collapse is smaller, and the time interval is shorter. This indicates that brick walls with high-strength mortar and high pre-compressive loads are more brittle.
In summary, due to the significant uncertainties in brick wall materials and construction processes, the locations of single cracks, continuous cracks, and through cracks exhibit variability and are potentially distributed across the central or peripheral areas of the reverse face of the walls. Mortar strength and preload do not fundamentally alter the damage and failure patterns of brick walls, which manifest as compressive failure of the wall structure.
3.2. Load–Deformation Curve
Figure 7 presents the load–deformation relationships for twelve brick wall specimens under compressive loads. The specimens are grouped into three categories based on mortar grade. As shown in Figure 6, a strain gauge was positioned on each side of the specimen to measure its vertical displacement; the average value is shown in Figure 8. When the loads are low, the vertical deformation of the walls exhibits an approximately linear relationship with the load. Subsequently, the walls gradually enter an elastic–plastic deformation state, accompanied by the appearance, cracking, expansion, and failure. In terms of deformation, the maximum elastic deformations for specimens M2.5-4, M5-4, and M7.5-4 are 1.20 mm, 1.50 mm, and 2.43 mm, respectively. This indicates that higher mortar grades result in greater upper limits for elastic deformation. Once the brick wall enters the elastic–plastic stage, construction loads reduce the elastic–plastic deformation under identical load conditions. For instance, specimen M5-1 exhibits the greatest elastic–plastic deformation, while specimens M5-2, M5-3, and M5-4 demonstrate lower elastic–plastic deformations than the result of M5-1 under the same loading conditions. This is because construction loads increase mortar density and induce a compaction effect, thereby reducing mortar deformation during subsequent loading.
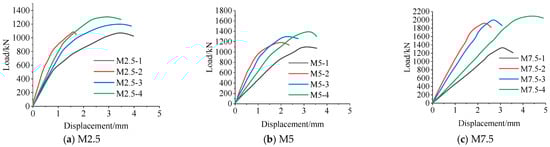
Figure 8.
Load–deformation relationships of 12 specimens.
Table 6 summarizes the cracking loads and ultimate loads for each brick wall specimen. The amplification factor of the cracking load is defined as the ratio of the cracking load of specimens subjected to preload to the cracking load of specimens without preload, under identical mortar grade conditions. Similarly, the amplification factor of the ultimate load is defined as the ratio of the ultimate load of specimens subjected to preload to that of specimens without preload, under identical mortar grade conditions. Figure 9 illustrates the amplification factors for the cracking and ultimate loads of the specimens.
Table 6.
Cracking load and ultimate load of each specimen.
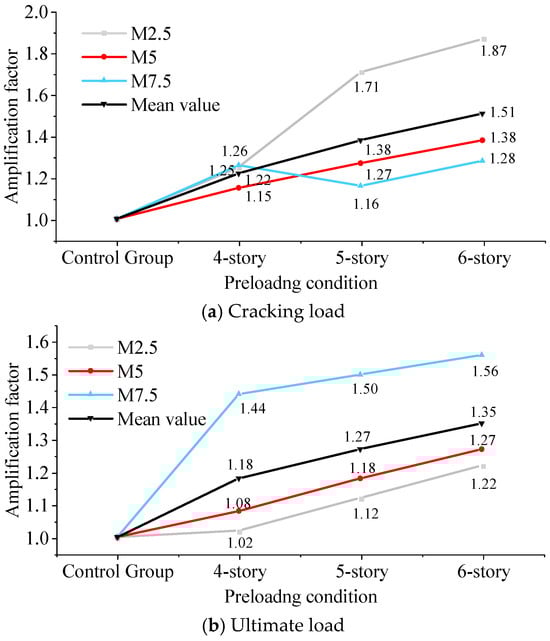
Figure 9.
Amplification factors for cracking loads and ultimate loads.
The results indicate that the preload has a greater effect on the cracking load of walls with lower mortar strength grades (M2.5) than on those with higher grades (M5 and M7.5). For instance, the amplification factors for the cracking loads for M2.5-3 and M2.5-4 specimens are 1.71 and 1.87, respectively, which are both approximately 26% higher than the corresponding results for walls made with M5 and M7.5 mortar. However, the pattern for the ultimate load amplification factors is the opposite of that for the cracking load amplification factors. This indicates that preloading has a more pronounced effect on increasing the ultimate load capacity of high-strength mortar brick wall specimens. For instance, the ultimate load amplification factors for the M2.5-2 and M5-2 specimens are 1.02 and 1.08, respectively, whereas the ultimate load amplification factor for the M7.5-2 specimen is 1.44. The amplification factors of ultimate loads for M2.5-4 and M5-4 specimens are 1.22 and 1.27, respectively, while the result of the M7.5-4 specimen achieves a coefficient of 1.56.
On the other hand, when the mortar strength grade is lower (M2.5), although the preload increased the bearing capacity of the walls, it also heightened the brittleness. The ratio of the cracking load to the ultimate load increases from 0.44 to 0.68. When the mortar strength grade is M5, this phenomenon is mitigated, with the cracking load-to-ultimate load ratio remaining largely unchanged. For the walls with the M7.5 mortar strength, the cracking load–ultimate load ratio decreases as the preload increases. Furthermore, as shown in Figure 9, for masonry structures with four, five, and six stories, although the amplification factors of cracking loads with different mortar grades exhibit a non-monotonic relationship with the number of stories, the amplification factors of ultimate loads show a linear relationship.
3.3. Analysis and Discussion
In the absence of tests on the microstructure of the mortar, the analysis draws upon existing research into the compaction process of cement-emulsified asphalt mixtures [45,46]. The full hardening cycle of mortar may extend to 28 days. Unhardened mortar constitutes a plastic mixture of cement particles, sand grains, water, and air bubbles. The prestress induced by continuous construction forces internal air bubbles to escape and promotes the rearrangement of solid particles, thereby enhancing density. Consequently, the hardened cement paste exhibits a more compact structure with fewer defects, potentially increased strength, and reduced deformation capacity.
Due to the brick firing process, a perfectly flat surface cannot be guaranteed. When a brick wall is subjected to additional axial compressive loads at an early stage, the lateral expansion of the mortar joints increases, resulting in closer and more compact contact with the bricks. The elastic modulus of the mortar is generally lower than that of the brick, while its Poisson’s ratio is slightly higher. Consequently, during mortar curing and prolonged compression, the mortar remains in a state of triaxial confinement. However, the bricks experience horizontal biaxial tension and vertical compression, which are induced by the lateral deformation of the mortar. Finally, the ultimate failure of bricks under vertical loads is effectively caused by snapping due to the horizontal mortar deformation (Figure 10).
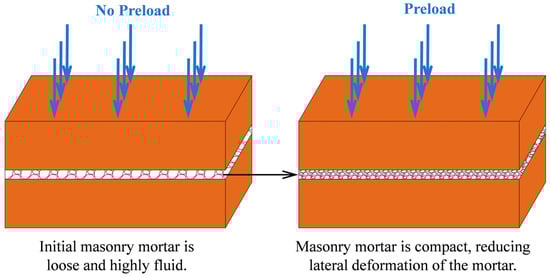
Figure 10.
Long-term compaction process of masonry mortar.
The failure mode of brick masonry walls is governed by the principal tensile stress failure criterion. The cracking and failure occur when the maximum principal tensile stress in the masonry material exceeds its tensile strength. During the initial stages of the construction, the mortar is weak and fluid. The tensile stresses induced by lateral deformation of the mortar are negligible and will not cause tensile failure of the bricks. As the increase in the construction loads and time conditions, the lateral deformation, density, and compaction of the mortar gradually increase. When a preloaded brick wall is subjected to additional loading, the Poisson effect in the mortar weakens, reducing the vertical deformation of the walls. The reasons for the increased cracking load and ultimate load include: (i) the preload enhances the bond between the mortar–block interface, mitigating the effects of block surface irregularities; (ii) higher-density mortar exhibits superior material properties; (iii) preloading reduces the inherent non-uniformity of the mortar, diminishing the stress concentration of the bricks at vertical joints; and (iv) the preload causes a portion of the lateral deformation to be released prematurely during the mortar compaction process. Under identical external loads, the lateral deformation of the mortar is reduced, thereby decreasing the tensile stresses within the bricks.
Concurrently, the influence of prestress on cracking load is more pronounced in low-strength mortar, whereas the effect of prestress on ultimate load is more significant in high-strength mortar. The reasons for this may be as follows: Cracking load primarily depends on the tensile strength of the masonry, i.e., the bond strength between the mortar and the blocks. Applying prestress before the mortar fully hardens compacts the mortar and improves interfacial bonding. Low-strength mortar exhibits higher initial porosity and weaker bonding. Applying prestress significantly enhances its density and bond strength, substantially increasing the cracking load. Conversely, high-strength mortar already has a high initial density and bond strength, so prestressing offers limited improvement and results in a smaller increase in cracking load. The ultimate load is primarily governed by the compressive strength of the masonry, which relates to the strength of the mortar and blocks, and the uniformity of stress distribution. While prestressing enhances density, its contribution to improving mortar strength is limited. However, it optimizes stress transfer between high-strength mortar and blocks more effectively, resulting in a more uniform stress distribution under compression. This enables the block strength to be utilized more fully, significantly increasing compressive strength.
4. Conclusions
This study investigated the damage and failure processes, cracking loads, and ultimate loads of brick walls with different mortar grades under varying construction load conditions through compressive experiments. The main conclusions are as follows.
(1) Due to significant uncertainties in materials and construction processes, cracks appear in different locations on the wall specimens. However, the strength of the mortar and the preload have a minimal impact on the failure patterns of brick walls. For the same mortar grade, the maximum crack width occurs in walls without construction loads. As the number of masonry structural stories increases (i.e., as the preload increases), the maximum crack width decreases. This phenomenon is most pronounced in the M2.5 test group. This indicates that construction loads significantly enhance the compaction of the mortar, thereby increasing the mortar density and strength, reducing crack propagation, and diminishing crack width at failure.
(2) Under construction loads, the elastic deformations of the walls increase with higher mortar grades. However, once the wall enters the plastic range, under identical loading conditions, increased construction loads reduce the elastic–plastic deformations. Consequently, the ratio of cracking load to ultimate load increases, particularly in low-mortar-grade walls, where this ratio rises from 0.44 to 0.68. This indicates that construction loads further increase the brittleness of brick walls.
(3) The preload generated by five- and six-story masonry structures increases the cracking load by 70% and 87%, respectively, for walls with low-strength mortar (M2.5). In contrast, the increase is 27% and 38% for walls with medium- and high-strength mortar (M5 and M7.5). Conversely, the effect of preload on increasing the ultimate load capacity of high-strength mortar brick wall specimens is more significant. The preload generated by a six-story masonry structure causes a 56% increase in ultimate load capacity. Furthermore, the increase in cracking load for walls of different mortar grades is proportional to the number of stories in the structure.
It is worth noting that a test was conducted for each loading condition and material parameter. The results do not account for material variability or objective uncertainty. The research focused on testing the load-bearing capacity of walls without examining the microscopic phenomena of the mortar during the preloading process. Subsequent numerical simulations could investigate how factors such as the number of stories and material parameters influence the cracking and ultimate loads of walls, thereby providing simplified fitting equations.
Author Contributions
F.W.: writing—original draft; J.Z.: investigation; S.H.: funding acquisition and methodology; B.Y.: conceptualization; L.W.: data curation. All authors have read and agreed to the published version of the manuscript.
Funding
This study was supported by the National Key Research and Development Program of China (No. 2022YFC3803500) and the Tianjin Natural Science Foundation Project (No. 25JCQNJC00310).
Data Availability Statement
The original contributions presented in the study are included in the article, further inquiries can be directed to the corresponding authors.
Conflicts of Interest
Authors Jing Zhang, Shimin Huang and Baojiang Yin were affiliated with the company China Academy of Building Research. Author Jing Zhang was affiliated with the company C+E Center for Engineering Research Test and Appraisal Co., Ltd. The remaining authors declare that the research was conducted in the absence of any commercial or financial relationships that could be construed as a potential conflict of interest.
Appendix A
The failure patterns and crack distributions of wall specimens with the M5 and M7.5 mortar grades under compressive loading are presented in Figure A1 and Figure A2.

Figure A1.
Phenomena of M5 Series: wall configuration and crack distribution.


Figure A2.
Phenomena of M7.5 Series: wall configuration and crack distribution.
References
- Henrique Nalon, G.; Santos, C.F.R.; Pedroti, L.G.; Ribeiro, J.C.L.; de Souza Veríssimo, G.; Ferreira, F.A. Strength and failure mechanisms of masonry prisms under compression, flexure and shear: Components’ mechanical properties as design constraints. J. Build. Eng. 2020, 28, 101038. [Google Scholar] [CrossRef]
- Doran, B.; Karslioglu, M.; Unsal Aslan, Z.; Vatansever, C. Experimental and Numerical Investigation of Unreinforced Masonry Walls with and without Opening. Int. J. Archit. Herit. 2023, 17, 1833–1854. [Google Scholar] [CrossRef]
- Huang, D.; Albareda, A.; Pons, O. Experimental and numerical study on unreinforced brick masonry walls retrofitted with sprayed mortar under uniaxial compression. Buildings 2023, 13, 122. [Google Scholar] [CrossRef]
- Mohamad, G.; Lourenço, P.B.; Roman, H.R. Mechanics of hollow concrete block masonry prisms under compression: Review and prospects. Cem. Concr. Compos. 2007, 29, 181–192. [Google Scholar] [CrossRef]
- Ramamurthy, K.; Sathish, V.; Ambalavanan, R. Compressive strength prediction of hollow concrete block masonry prisms. ACI Struct. J. 2000, 97, 61–67. [Google Scholar] [CrossRef]
- Sarhat, S.R.; Sherwood, E.G. The prediction of compressive strength of ungrouted hollow concrete block masonry. Constr. Build. Mater. 2014, 58, 111–121. [Google Scholar] [CrossRef]
- Fonseca, G.M.F.S.; Vermeltfoort, A.T. A Lubeck. Stiffness plasticity degradation of masonry mortar under compression: Preliminar results. Rev. IBRACON Estrut. Mater. 2018, 11, 279–295. [Google Scholar] [CrossRef]
- Mohamad, G.; Fonseca, F.S.; Vermeltfoort, A.T.; Martens, D.R.; Lourenço, P.B. Strength, behavior, and failure mode of hollow concrete masonry constructed with mortars of different strengths. Constr. Build. Mater. 2017, 134, 489–496. [Google Scholar] [CrossRef]
- Silvia Calo Cascardi, A.; Aiello, M.A. Unified design-oriented model for the shear strengthening of masonry walls with Inorganic Mortar Composite systems. Eng. Struct. 2025, 336, 120394. [Google Scholar] [CrossRef]
- Gumaste, K.S.; Rao, K.S.N.; Reddy, B.V.V.; Jagadish, K.S. Strength and elasticity of brick masonry prisms and wallettes under compression. Mater. Struct. Constr. 2007, 40, 241–253. [Google Scholar] [CrossRef]
- Keshava, M.; Raghunath, S.R. Experimental Investigations on Axially and Eccentrically Loaded Masonry Walls. J. Inst. Eng. Ser. A 2017, 98, 449–459. [Google Scholar] [CrossRef]
- Amalkar, M.S.; Renukadevi, M.V.; Jagadish, K.S. Basutkar SM Effect of slenderness and eccentricity on the strength of concrete block masonry: An experimental investigation. SN Appl. Sci. 2020, 2, 1046. [Google Scholar] [CrossRef]
- Dharek, M.S.; Raghunath, S.; Ashwin, C.P. Experimental behaviour of unreinforced and reinforced concrete block masonry walls under uniaxial compression. Mater. Today Proc. 2021, 46, 2462–2467. [Google Scholar] [CrossRef]
- Hasan, M.; Saidi, T.; Sarana, D. Bunyamin The strength of hollow concrete block walls, reinforced hollow concrete block beams, and columns. J. King Saud. Univ.-Eng. Sci. 2021, 34, 523–535. [Google Scholar] [CrossRef]
- Khan, N.A.; Aloisio, A.; Monti, G.; Nuti, C.; Briseghella, B. Experimental characterization and empirical strength prediction of Pakistani brick masonry walls. J. Build. Eng. 2023, 71, 106451. [Google Scholar] [CrossRef]
- Milani, A.S.; Lübeck, A.; Mohamad, G.; da Silva Santos Neto, A.B.; Budny, J.; Kosteski, L.E. Case study of prototype and small-scale model behavior of clay blocks masonry under compression. Case Stud. Constr. Mater. 2021, 15, e00684. [Google Scholar] [CrossRef]
- Calderón, S.; Sandoval, C.; Araya-Letelier, G.; Aguilar, V. A detailed experimental mechanical characterization of multi-perforated clay brick masonry. J. Build. Eng. 2023, 63, 105505. [Google Scholar] [CrossRef]
- Necdet, T.; Ertan, O.; Hilal, G. Structural evaluation of masonry walls with double-sided CFRP reinforcement through diagonal compression tests. J. Build. Eng. 2025, 111, 113142. [Google Scholar] [CrossRef]
- Jafari, S.; Rots, J.G.; Esposito, R. A correlation study to support material characterisation of typical Dutch masonry structures. J. Build. Eng. 2022, 45, 103450. [Google Scholar] [CrossRef]
- Costigan, A.; Pavía, S.; Kinnane, O. An experimental evaluation of prediction models for the mechanical behavior of unreinforced, lime-mortar masonry under compression. J. Build. Eng. 2015, 4, 283–294. [Google Scholar] [CrossRef]
- Zhu, F.; Zhou, Q.; Wang, F.; Yang, X. Spatial variability and sensitivity analysis on the compressive strength of hollow concrete block masonry wallettes. Constr. Build. Mater. 2017, 140, 129–138. [Google Scholar] [CrossRef]
- Sandoval, C.; Roca, P.; Bernat, E.; Gil, L. Testing and numerical modelling of buckling failure of masonry walls. Constr. Build. Mater. 2011, 25, 4394–4402. [Google Scholar] [CrossRef]
- Zhou, Q.; Wang, F.; Zhu, F.; Yang, X. Stress–strain model for hollow concrete block masonry under uniaxial compression. Mater. Struct. Constr. 2017, 50, 106. [Google Scholar] [CrossRef]
- Thamboo, J.A.; Dhanasekar, M. Correlation between the performance of solid masonry prisms and wallettes under compression. J. Build. Eng. 2019, 22, 429–438. [Google Scholar] [CrossRef]
- Blash, A.A.A.; Bakar, B.H.A.; Udi, U.J.; Dabbour, B.S.A.; Jaafar, A.A.; Yanhao, L.; Abu Bakar, I.A.; Rashed, M. Performance of Unreinforced Masonry Walls in Compression: A Review of Design Provisions, Experimental Research, and Future Needs. Appl. Sci. 2023, 13, 12306. [Google Scholar] [CrossRef]
- BS EN 1996-1-1; 2005, Eurocode 6: Design of Masonry Structures—Part 3: General Rules for Reinforced and Unreinforced Masonry Structures. British Standards Institution: London, UK, 2005.
- CSA S304; Design of Masonry Structures. Canadian Standards Association (CSA): Mississauga, ON, Canada, 2014.
- AS 3700; Design of Masonry Structures. Australian Standards: Sydney, Australia, 2018.
- GB50003-2011; Code for Design of Masonry Structures. Chinese Standards: Beijing, China, 2011.
- Zahra, T.; Thamboo, J.; Asad, M. Asad Compressive strength and deformation characteristics of concrete block masonry made with different mortars, blocks and mortar beddings types. J. Build. Eng. 2021, 38, 102213. [Google Scholar] [CrossRef]
- Caldeira, F.E.; Nalon, G.H.; de Oliveira, D.S.; Pedroti, L.G.; Ribeiro, J.C.L.; Ferreira, F.A.; de Carvalho, J.M.F. Influence of joint thickness and strength of mortars on the compressive behavior of prisms made of normal and high-strength concrete blocks. Constr. Build. Mater. 2020, 234, 117419. [Google Scholar] [CrossRef]
- Hernoune, H.; Benabed, B.; Alshugaa, M.; Abousnina, R.; Guettala, A. Strengthening of masonry walls with CFRP composite: Experiments and numerical modeling. Epa. J. Silic. Based Compos. Mater. 2020, 72, 2–11. [Google Scholar] [CrossRef]
- Kaczmarek, A. Technical evaluation of construction mortars with various lime quantity additions. IOP Conf. Ser. Mater. Sci. Eng. 2019, 471, 032037. [Google Scholar] [CrossRef]
- Pavia, S.; Brennan, O. Portland Cement-Lime Mortars for Conservation. In Historic Mortars; Springer International Publishing: Cham, Switzerland, 2019; pp. 129–142. [Google Scholar]
- Thamboo, J.A. Material characterisation of thin layer mortared clay masonry. Constr. Build. Mater. 2020, 230, 116932. [Google Scholar] [CrossRef]
- Darwish, M.; Khedr, S.; Halim, F.; Khalil, R. Novel simplified construction of walls and prisms made of CEBS and earth-based mortar. Pract. Period. Struct. Des. Constr. 2020, 25, 04020041. [Google Scholar] [CrossRef]
- Kazempour, H.; Bassuoni, M.T.; Hashemian, F. Masonry mortar with nanoparticles at a low temperature. Proc. Inst. Civ. Eng.-Constr. Mater. 2017, 170, 297–308. [Google Scholar] [CrossRef]
- Kazempour, H. Effect of nanoparticles on the properties of masonry mortars and assemblages at a cold temperature. In Proceedings of the CSCE 2014 General Conference, Halifax, NS, Canada, 28–31 May 2014. [Google Scholar]
- Erdogmus, E. Use of fiber-reinforced cements in masonry construction and structural rehabilitation. Fibers 2015, 3, 41–63. [Google Scholar] [CrossRef]
- Nalon, G.H.; José Carlos Lopes Ribeiro Pedroti, L.G.; da Silva, R.M.; de Araujo, E.N.D.; Santos, R.F.; de Lima, G.E.S. Review of recent progress on the compressive behavior of masonry prisms. Constr. Build. Mater. 2022, 320, 126181. [Google Scholar] [CrossRef]
- GB/T 2524-2012; Test Methods for Wall Bricks. Chinese Standards: Beijing, China, 2012.
- GJ/T 70-2009; Test Methods for Basic Properties of Building Mortars. Chinese Standards: Beijing, China, 2009.
- GB 50203-2011; Code for Acceptance of Construction Quality of Masonry Structures. Chinese Standards: Beijing, China, 2011.
- GB50009-2012; Code for Loading of Building Structures. Chinese Standards: Beijing, China, 2012.
- Yang, W.T.; Ouyang, J.; Meng, Y.; Han, B.G.; Sha, Y.Q. Effect of curing and compaction on volumetric and mechanical properties of cold-recycled mixture with asphalt emulsion under different cement contents. Constr. Build. Mater. 2021, 297, 123699. [Google Scholar] [CrossRef]
- Cui, Z.H.; Xue, C.P.; Wen, X.K.; Wen, W.L. Prediction model of compaction process parameters for pavement of cement emulsified asphalt mixture based on effective compaction work. Constr. Build. Mater. 2021, 280, 122403. [Google Scholar] [CrossRef]
Disclaimer/Publisher’s Note: The statements, opinions and data contained in all publications are solely those of the individual author(s) and contributor(s) and not of MDPI and/or the editor(s). MDPI and/or the editor(s) disclaim responsibility for any injury to people or property resulting from any ideas, methods, instructions or products referred to in the content. |
© 2025 by the authors. Licensee MDPI, Basel, Switzerland. This article is an open access article distributed under the terms and conditions of the Creative Commons Attribution (CC BY) license (https://creativecommons.org/licenses/by/4.0/).