Abstract
Against the backdrop of global natural sand scarcity and stringent ecological protection policies, tuff mechanism sand has emerged as a promising alternative fine aggregate for concrete, especially in coastal infrastructure hubs like Ningbo, where abundant tuff resources coexist with acute natural sand shortages. However, existing research on TMS concrete lacks systematic multi-factor optimization, while the performance regulation mechanism of TMS remains unclear, hindering its application in large-scale engineering. To address this gap, this study employed a L16(45) orthogonal experimental design to systematically investigate the effects of five key factors, including fineness modulus, sand ratio, fly ash-to-ground granulated blast-furnace slag ratio, stone powder content, and water–binder ratio, on the 3 d, 7 d, and 28 d compressive, splitting tensile, and flexural strengths of TMS concrete from Ningbo. The results indicate that all three strengths exhibit rapid growth from 3 d to 7 d and stable growth from 7 d to 28 d, with the 3 d compressive strength accounting for 72.5% of the 28 d value, while flexural strength shows the lowest 3 d proportion (63.1%) and highest late-stage growth rate. Range analysis reveals that water–binder ratio is the dominant factor controlling compressive strength and splitting tensile strength, whereas fineness modulus dominates flexural strength. The optimal fineness modulus values for compressive, splitting tensile, and flexural strengths are 2.60, 2.90, and 2.30, respectively; a stone powder content of 0% optimizes compressive and flexural strengths, while 6% is optimal for splitting tensile strength. Notably, the interaction between fineness modulus and water–binder ratio exerts a statistically significant effect on compressive strength (p = 0.008), while the other interactions are negligible. This study fills the gap in research on multi-factor synergistic optimization of TMS concrete and provides targeted mix proportion designs for different engineering requirements. The findings not only enrich the theoretical system of manufactured-sand concrete but also offer practical technical support for the resource utilization of TMS in medium-to-high-strength concrete engineering, aligning with the sustainable development goals of the construction industry.
1. Introduction
Sand, as one of the main raw materials of concrete, accounts for 20–40% of concrete volume. Against the backdrop of global natural sand resource depletion and the booming development of infrastructure, manufactured sand (MS) has emerged as a core alternative to natural sand in concrete production, becoming a key driver for the construction industry’s transition toward sustainability [1,2,3]. Unlike natural sand, MS exhibits distinct advantages such as controllable particle size distribution, stable quality, and wide availability of materials [4,5,6]. These characteristics enable it to meet the performance requirements of concrete. In recent years, the annual consumption of MS in China alone has exceeded 2 billion cubic meters, and its application scope has expanded from general-purpose concrete to key engineering projects [7,8]. Yash et al. [9] investigated the potential of MS in concrete, analyzed its fresh and hardened properties, and highlighted its compatibility. In some cases, it offers environmental benefits, including the conservation of natural sand and improved energy efficiency, making it more advantageous than natural sand. Vijaya et al. [10] concluded that the use of MS addresses the global scarcity of river sand and prevents related environmental issues. It can serve as an efficient fine aggregate in concrete to meet future demands amid the global shortage of river sand. Yash et al. [11] investigated Deccan basalt MS, a sustainable alternative in concrete production, replacing river sand at substitution rates ranging from 0% to 100%. Deep et al. [12] found that the application of MS in concrete makes it more environmentally friendly and durable while also demonstrating superior performance in sulfate environments. The research of Thangapandi et al. [13], focusing primarily on durability performance, investigated the strength and properties of concrete containing calcium aluminate and zinc oxide with manufactured sand under harsh environmental conditions.
However, existing research on MS concrete is highly concentrated on limestone-based MS. Most studies have explored the effects of the limestone MS fineness modulus, stone powder content, and water–binder ratio on mechanical properties and durability, establishing a relatively mature mix proportion design system [14,15,16,17,18,19]. Shi et al. [20] investigated the effect of stone powder in manufactured sand on concrete performance, and systematically analyzed the properties of stone powder-modified concrete through numerous experiments. The study aimed to obtain scientific and reasonable test data and conclusions, thereby promoting the optimization of manufactured-sand performance and ultimately providing effective references for the application of manufactured-sand concrete in engineering. Akrout et al. [21] intended to determine the influence of limestone manufactured sand on chloride ion ingress into mortar. Two types of sands were used for sample preparation: siliceous sand (which served as the reference) and limestone crushed sand (the aggregate type adopted in this study). To compare and evaluate the mortar’s resistance to chloride ion penetration, two different diffusion tests were conducted: the slow migration test and the rapid migration test. A model based on the Nernst–Planck equation was proposed in this study to calculate the effective diffusion coefficient, and the diffusion coefficients of each sample were compared. All test results indicated that the diffusion coefficient of siliceous sand mortar was higher than that of limestone sand mortar, and the diffusion coefficient appeared to vary with the water–cement ratio. Chen et al. [22] evaluated the pore structure of mortar mixtures when fine aggregate was replaced by crushed limestone sand. The results showed that the porosity increased with an increase in the water–cement ratio.
In contrast, research on tuff mechanism sand (TMS) concrete is still in its infancy. Tuff, as a volcanic sedimentary rock, has unique properties such as low apparent density, high porosity, and moderate activity, which differ significantly from the high density and inert nature of limestone. These differences mean that the performance regulation mechanism of the TMS concrete cannot be directly inferred from limestone manufactured-sand concrete, leading to a lack of targeted technical support for application of TMS concrete in engineering [23,24]. In the other hand, the use of MS typically relies on locally sourced materials, making it essential to investigate the properties of TMS from different regions. The Ningbo region has experienced volcanic eruptions in the past, leading to the formation of volcanic sedimentary rocks such as tuff. Therefore, tuff resources are present in this area, distributed within rock strata of volcanic origin, which provides potential for the extraction and utilization of TMS in the region [25,26].
As a major coastal infrastructure hub, Ningbo is currently facing an acute shortage of natural river sand, exacerbated by stringent ecological protection policies that prohibit excessive exploitation, creating an urgent need for high-quality alternative aggregates. Meanwhile, the locally abundant tuff resources offer great potential for TMS, yet the mechanical performance regularity of TMS concrete remains unclear, severely hindering its large-scale application in engineering. Against this backdrop, this study focuses on TMS from the Ningbo area, employing the orthogonal test method (L16(45)) to systematically investigate and analyze the mechanical properties of the resulting concrete, as shown in Figure 1, thereby exploring its potential engineering applications and addressing the pressing material supply challenge.
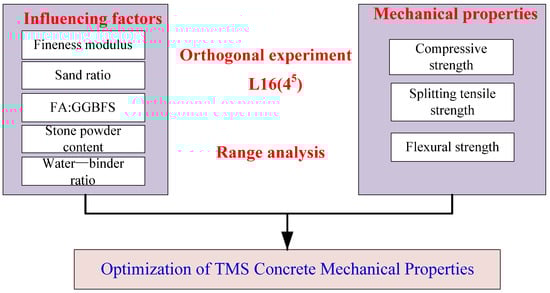
Figure 1.
Schematic diagram of the research framework and experimental flow.
2. Experimental Materials and Methods
2.1. Material Performance
2.1.1. TMS
Tuff is a type of volcaniclastic rock with moderate hardness. Its main component is volcanic ash, featuring a loose, porous appearance and a rough texture. The TMS used in the tests was provided by Zhejiang Changying Environmental Protection Co., Ltd. (Zhejiang, China). Table 1 presents the results of the X-ray Fluorescence (XRF) test on the TMS. The content of SiO2 is 55.48%, and it mainly functions to provide a framework for concrete, enhance its strength and durability, and reduce its expansibility. The content of Al2O3 is 16.29%, and it can react with CaO to form calcium aluminate hydrate, thereby improving the early strength of concrete. The content of CaO is 8.87%, and it can react with SiO2 to generate calcium silicate, contributing to the hydration process. In addition, the content of Fe2O3 is 6.47%, and its primary role is to enhance the durability of concrete. It should be noted that the contents of K2O and Na2O in the sample are 6.03% and 3.00%, respectively; excessively high alkali content may trigger an alkali–aggregate reaction (AAR). Therefore, to mitigate an AAR, priority should be given to the use of low-alkali cement, with the incorporation of mineral admixtures such as fly ash and slag. These admixtures not only dilute the total alkali content of the system but also utilize the pozzolanic activity of industrial waste residues to consume part of the free alkali, forming a dual prevention and control mechanism.

Table 1.
Chemical composition of the TMS.
Figure 2 shows the X-ray Diffraction (XRD) test results for the TMS sample. Combined with the Rietveld analysis method, the relative content of each mineral can be estimated, and the main components of the sample are quartz, albite, and plagioclase. Figure 3 presents the microscopic observation results of the TMS sample, which further validate the conclusions of the XRD and XRF tests.
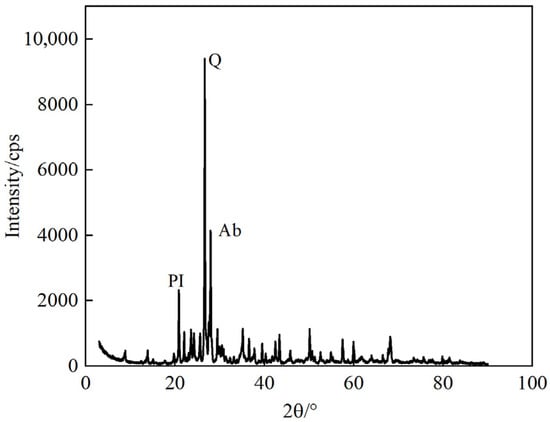
Figure 2.
X-ray diffraction spectrum.
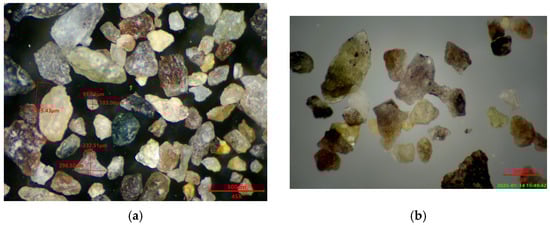
Figure 3.
Microstructure of the TMS sample: Zoomed (a) 45 times and (b) 63 times.
2.1.2. Cement
Cement is the main component of cementitious materials, and its properties have a significant impact on concrete. The cement used in these experiments was P.O 42.5 provided by Ningbo Xiangshan Port Cement Co., Ltd. (Ningbo, China) According to the testing method based on GB175 [27], its density is 3.04 g/cm3, fineness is 9.7%, standard-consistency water consumption is 28.0%, initial setting time is 160 min, final setting time is 200 min, compressive strengths at 3 and 28 d are 26.3 and 44.5 MPa, respectively, and flexural strengths at 3 and 28 d are 5.2 and 8.7 MPa, respectively.
2.1.3. Superplasticizer
The superplasticizer used in these experiments is the WH-H(I)-type polycarboxylate superplasticizer produced by Weihong New Materials Technology Co., Ltd. (Ningbo, China) This type of superplasticizer is a commonly used in high-performance admixture in concrete preparation, which can effectively adjust the workability of concrete and improve the mechanical properties and durability after hardening. In terms of appearance, the WH-H(I)-type polycarboxylate superplasticizer is a transparent-to-slightly turbid light yellow liquid, with no obvious sediment or impurities, and its state is uniform and stable. Its key performance parameters were tested and are summarized in Table 2. All indicators clearly meet the technical requirements for GB8076 [28], which can ensure its stable role in the concrete system and provide a basis for the reliability of subsequent test results.
Table 2.
Performance of water-reducing agent.
2.1.4. Coarse Aggregate
To ensure the continuity and rationality of the concrete aggregate gradation—a key prerequisite for improving the workability of concrete mixtures, reducing the internal void ratio, and further ensuring structural compactness and mechanical strength after hardening—two types crushed stones with different particle size ranges were selected in these tests. One type of crushed stone had a particle size range of 16–26.5 mm, and the other of 4.75–16 mm. The combination of the two particles sizes can achieve effective filling of aggregate particles and avoid fluctuations in concrete performance caused by gradation gaps.
The physical and mechanical indicators of the crushed stone were all tested and are summarized in Table 3. After verification, we found that all indicators strictly comply with the technical requirements for JTG/T 3650 [29]. This ensures that it can play a stable aggregate support role in highway bridge and culvert engineering scenarios where high material performance is required.
Table 3.
Physical and mechanical properties of coarse aggregate.
2.1.5. Mineral Admixtures
In the modern concrete preparation system, mineral admixtures are key components for achieving high performance and greenization of concrete. Among them, fly ash (FA) and ground granulated blast furnace slag (GGBFS) are widely used due to their dual functions of filling and activity excitation. As functional filling materials for concrete, both can not only reduce internal voids in concrete through particle gradation optimization, improving the workability of the mixture, but also participate in the concrete hardening process through secondary hydration reactions to form stable hydration products.
The FA used in this study was from Ninghai Guohua Power Plant (Ningbo, China), classified as Class F Grade II. Tests showed that the key performance indicators of this FA are follows: the 80 μm square sieve residue (fineness) is 23.4%, the loss on ignition is 1.72%, the water demand ratio is 96%, and the 28 d strength activity index is 80%. All indicators meet the technical requirements for GB/T1596 [30].
The GGBFS used in this study was an S95-grade product provided by Ningbo Ziheng (Ningbo, China). Its main technical indicators were tested and are summarized in Table 4. After verification, we found that all indictors comply with GB/T18046 [31], ensuring that the GGBFS can play a stable role in the concrete system.
Table 4.
Physical and mechanical properties of the GGBFS.
2.2. Experimental Plan
2.2.1. Orthogonal Experiment for Mechanical Properties
In the study on the mechanical properties of TMS concrete, the experimental process involved multiple influencing factors such as fineness modulus, sand ratio, water–binder ratio, and stone powder content. If a full-factor test method is adopted to cover all variable combinations, dozens or even hundreds of test groups are required—which not only consumes a large amount of raw materials, reagents, and test time, but also easily leads to confusion in test result analysis due to cross-interference between variables. However, through a scientific experimental design using orthogonal tables, the number of test groups can be efficiently compressed to 16 on the premise of ensuring coverage of key variable combinations and retention of core test information, thereby providing a reliable basis for accurately exploring the laws of the influence of various factors and their interactions on the mechanical properties of TMS concrete [32].
With the goal of optimizing the mechanical properties of concrete, this study first determined the basic mix proportion; the mass ratio of cement, mineral admixture (compounded by FA and GGBFS), coarse aggregate, and superplasticizer was 1:0.82:7.35:0.02. The determination of this mix proportion comprehensively considers the activity development of the cementitious system, the compatibility of aggregate gradation, and the adaptability of the superplasticizer, and it has been practically applied in the reconstruction and expansion project of G15 Shenhai Expressway in China.
In terms of coarse aggregate gradation design, medium-sized crushed stone with a particle size range of 4.75–16 mm, and coarse-sized crushed stone with a particle size range of 16–26.5 mm, were selected, and they were mixed at a mass ratio of 1:2.34. This combination enables the realization of continuous gradation of coarse aggregate, effectively reducing the void ratio between particles and laying a structural foundation of aggregate for improving the compactness and strength of concrete after hardening.
To systematically explore the influence of key parameters on the performance of manufactured tuff sand concrete, this study set 5 variables, including fineness modulus of the TMS, sand ratio, mass ratio of FA:GGBFS, stone powder content, and water–binder ratio. Based on the above variables, a five-factor four-level orthogonal experimental design was adopted. This design can cover the key level combinations of each variable through 16 groups of experiments, which not only reduces the experimental workload but also efficiently analyzes the influence of single variables and interactions between variables on concrete performance, avoiding the redundancy of full-factor experiments. This specific experimental scheme is shown in Table 5.
Table 5.
Orthogonal experimental table.
- (1)
- Fineness modulus
The fineness modulus is a core index characterizing the particle gradation distribution of sand, which is directly related to the aggregate packing density and the microstructure of the paste–aggregate interfacial transition zone (ITZ), and ultimately exerts a decisive influence on the concrete strength. In essence, it quantifies the fineness of sand by reflecting the average particle size and particle size distribution characteristics of sand grains: when the sand grains are coarser (i.e., a higher fineness modulus), the void volume formed between aggregate particles is larger. The concrete paste needs to occupy a greater volume to fill these voids, which easily leads to insufficient paste wrapping. This not only reduces the overall compactness of concrete but also weakens the bonding effect between aggregates and paste, thereby decreasing the compressive strength and flexural strength of concrete. On the contrary, when the sand grains are finer (i.e., a lower fineness modulus), the fine particles can more fully fill the voids between coarse particles, which helps to improve the aggregate packing density. However, the specific surface area of fine particles is larger, which will significantly increase the water demand for concrete mixing. If the water consumption cannot be accurately controlled by admixtures, the excess water is prone to forming pores inside after evaporation, which also adversely affects the concrete strength. Based on this, to systematically explore the law of the influence of fineness modulus on the performance of the TMS concrete, this study selected four fineness modulus gradients, including 2.15, 2.60, 2.90, and 3.35, as test variables.
To accurately prepare the TMS with the above four fineness moduli, the test adopted the following process. First, the original sand was dried to a constant weight in an oven at 105 ± 5 °C, as shown in Figure 4. Then, a sieve set conforming to GB/T14684 [33] was selected and combined with a standard sieve shaker for sieving. The sieving time was set to 10 min to ensure full separation of sand grains between each sieve layer. Finally, 8 sand fractions with particle size ranges of >4.75 mm, 2.36–4.75 mm, 1.18–2.36 mm, 0.6–1.18 mm, 0.3–0.6 mm, 0.15–0.3 mm, 0.075–0.15 mm, and <0.075 mm (stone powder) were obtained, as shown in Figure 5.

Figure 4.
Drying oven.
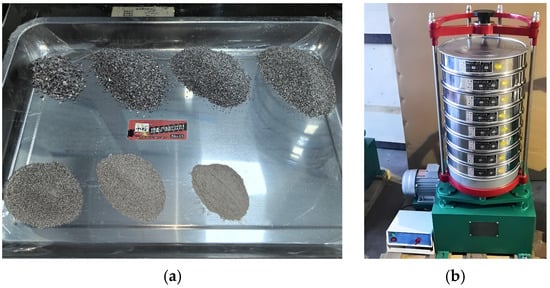
Figure 5.
Screening of the TMS: (a) screening results; (b) screening device.
When preparing sand with different fineness moduli later in the experiment, Table 6 was used as the basis. It clearly states the mixing proportions of each particle size fraction corresponding to the four target fineness moduli. During the test, each particle size fraction was accurately weighed according to the proportions in the table. The weighed fractions were poured into a planetary mixer, with the mixing speed set to 300 r/min and mixing time to 3 min to ensure uniform mixing of each particle size fraction. After mixing, 3 samples of 100 g were randomly selected for fineness modulus re-inspection to ensure that the deviation between the actual fineness modulus and the target value was ≤0.05.
Table 6.
Gradation distribution of different fineness moduli.
- (2)
- Sand ratio
The sand ratio is a key parameter for regulating the performance of the aggregate system in a concrete mix design. It is defined as the percentage of the mass of fine aggregate to the total mass of fine and coarse aggregates, as shown in Equation (1). By changing the relative proportion of fine aggregate to coarse aggregate, this parameter directly affects the packing density of concrete aggregates and the micro-quality of the paste–aggregate ITZ, thereby relating to the workability and mechanical properties of concrete.
where Sp is the sand ratio; ms is the mass of fine aggregate; and mg is the mass of the coarse aggregate.
In view of the characteristics of the TMS, it is necessary to optimize the sand ratio to balance two core needs: one is to ensure that the fine aggregate can fully fill the voids of the coarse aggregate to improve the packing density; the other is to ensure that the paste can uniformly wrap the aggregate surface to optimize the microstructure of the ITZ, avoiding the deterioration of mixture workability caused by excessive frictional resistance. Based on this, combined with the results of preliminary pre-tests, four sand ratio gradients were set in this study to systematically explore the law of their influence on the performance of the TMS concrete.
- (3)
- Mass ratio of FA:GGBFS
The blending ratio of mineral admixtures (specifically referring to the mass ratio of FA:GGBFS) regulates the synergistic effect of pozzolanic and micro-aggregate effect, thereby changing the type, quantity, and microstructure of concrete hydration products, and ultimately exerting a decisive impact on the long-term strength development law and durability of concrete.
However, there are significant differences in performance characteristics between FA and GGBFS. The active components of FA are released slowly, and its secondary hydration reaction is not obvious in the early stage of concrete hydration, mainly entering the active period after 28 d. Therefore, it focuses more on improving the long-term strength and durability of concrete; in contrast, GGBFS has a more easily disintegrated vitreous structure, and its active components can quickly participate in the reaction in the early stage of hydration, which can significantly improve the early strength of concrete while also making a continuous contribution to its later strength.
It is this performance difference that makes the blending ratio of FA and GGBFS directly affect the hardening rate and microstructure evolution of concrete: when GGBFS accounts for a higher proportion in the blending ratio, the early hydration reaction is more intense, C-S-H gel is generated faster, and the early compressive and flexural strengths of concrete increase more significantly, but it is necessary to control the early hydration heat; when FA accounts for a higher proportion, the early strength development is relatively gentle, but the secondary hydration reaction continues to advance after 28 d, resulting in more stable later strength growth and a denser microstructure. If the ratio is unbalanced, it may lead to insufficient early strength or stagnant later strength growth.
To systematically explore the law of the influence of blending ratio on the mechanical properties of TMS concrete, this study sets four gradients of the mass ratio of FA:GGBFS, 2:8, 4:6, 6:4, and 8:2, so as to comprehensively analyze the variation characteristics of concrete compressive and flexural strengths under different blending systems.
- (4)
- Stone powder content
Stone powder (specifically referring to fine particles with a particle size ≤ 0.075 mm) exhibits a dual effect in the concrete system, namely a physical filling effect and a chemical effect. However, its strong surface adsorption may interfere with the hydration process, thereby affecting the strength development of concrete.
Considering the characteristics of stone powder in the TMS, this study sets the stone powder content gradients to 0%, 2%, 4%, and 6%, as shown in Equation (2), so as to systematically explore the critical impact threshold of stone powder on the mechanical properties of the TMS concrete.
where P is the stone powder content and mp is the mass of stone powder.
- (5)
- Water–binder ratio
The water–binder ratio is a key parameter in concrete mix design, defined as the ratio of the mass of mixing water to the total mass of cement and other cementitious materials. Its value directly determines the strength development law and microstructural compactness of concrete.
The water–binder ratio must be controlled to ensure that the concrete has sufficient compactness and strength after hardening, while reasonable fluidity must be reserved to meet the requirements of mixing, pouring, and vibration construction. Based on this, combined with the characteristics of the TMS in this study and the adaptability of the polycarboxylate superplasticizer, four water–binder ratio gradients, including 0.35, 0.39, 0.42, and 0.44, were set to explore their critical impact on the mechanical properties of concrete.
2.2.2. Preparation and Maintenance of Test Specimens
The process of the preparation and maintenance of concrete specimens in this study complied with the specifications of Chinese code GB/T 50081 [34], so as to ensure the accuracy and representativeness of the specimen performance test results. The specific process was as follow.
First, the specimen size was determined according to the test requirements, standard cube molds of 150 mm × 150 mm × 150 mm were used for compressive strength and splitting strength testing, and prismatic molds of 100 mm × 100 mm × 400 mm were used for flexural strength testing. Before preparation, the molds were pretreated, compressed air was used to blow off residual concrete debris on the inner wall of the molds, and a thin layer of release agent was evenly applied to ensure the inner wall of the molds was smooth without oil accumulation, preventing adhesion between the formed specimen and the mold.
Subsequently, the concrete mixture was poured, and the TMS concrete mixture prepared according to the mix proportion was filled into the mold in two layers, with the filling height of each layer being approximately 1/2 of the mold volume. After filling each layer, a standard vibration table with a frequency of 50 Hz and an amplitude of 0.5 mm was used for vibration, and the vibration time was controlled at 20–30 s until a uniform cement paste appeared on the specimen surface without obvious air bubbles, as shown in Figure 6.
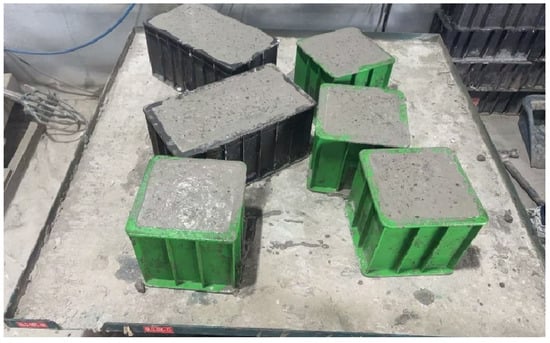
Figure 6.
Vibration table.
After the specimen preparation was finished, the surface of the specimen and the top of the mold were immediately fully covered with a polyethylene plastic film, and the edge of the film was sealed to fit the outer wall of the mold to prevent moisture loss from the specimen due to evaporation during standing, which would affect the cement hydration process and the early strength development of the specimen.
The specimens covered with film were placed in a dedicated standing room for maintenance. The standing environment temperature was controlled at 20 ± 5 °C, and the relative humidity was maintained above 50%; the standing time was set to 1–2 d, and the specific duration was adjusted according to the early strength development of concrete.
After standing, demolding was carried out. During operation, the side walls of the mold were tapped lightly first to slightly separate the specimen from the inner wall of the mold, and then the mold plates were pried slowly along the mold corners. Forcible prying or tapping of the specimen itself was prohibited. After demolding, the appearance of the specimens was checked immediately: unsuitable specimens with edge defects, surface cracks, or dimensional deviations were rejected, and only specimens with an intact appearance and standard dimensions were retained for subsequent maintenance.
Suitable specimens were transferred to a standard curing chamber within 15 min after demolding to avoid long-term exposure to air, leading to surface moisture evaporation. During curing, the temperature and humidity parameters of the curing chamber were checked regularly and recorded 3 times a day to ensure stable operation of the equipment.
2.2.3. Test Program
The compressive, splitting tensile, and flexural strength tests of the TMS concrete in this study all followed GB/T 50081 [34]; the specific test procedures were are as follows.
- (1)
- Compressive strength
Cube specimens measuring 150 mm × 150 mm × 150 mm were used (3 per group) to test strengths at 3 d, 7 d, and 28 d. Before the test, specimens were taken out of the curing chamber, surface moisture was wiped off, and their appearance was checked. An electro-hydraulic servo compression tester with a range of 0–3000 kN was used; specimens were placed centrally on the platen, loaded at a uniform rate of 0.5–0.8 MPa/s until failure, as shown in Figure 7; and the maximum failure load was recorded. Strength was calculated using Equation (3), and the average strength of 3 specimens taken as the representative value. It is noted that values with deviations exceeding ±15% were rejected.
where is the compressive strength, F is the maximum load, and A is the compressive area.
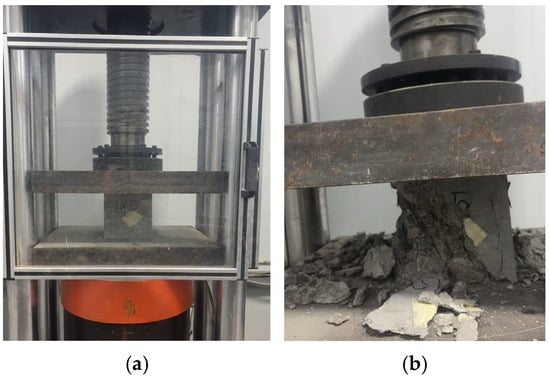
Figure 7.
Compressive strength test. (a) Test device; (b) failure mode.
- (2)
- Splitting tensile strength
Cube specimens measuring 150 mm × 150 mm × 150 mm were used (3 per group) to test strengths at 3 d, 7 d, and 28 d. Specimen pretreatment was consistent with the compressive strength test, with additional steel splitting strips covered with an elastic cushion on the surface. The same type of compression tester was used; specimens were placed flat on the lower platen, and one splitting strip was placed at the center of the top and bottom surfaces. Loading was conducted at a rate of 0.08–0.10 MPa/s until the specimens split, and the maximum load was recorded, as shown in Figure 8. Splitting tensile strength (fts) was calculated using Equation (4), with data processing consistent with the compressive strength test.
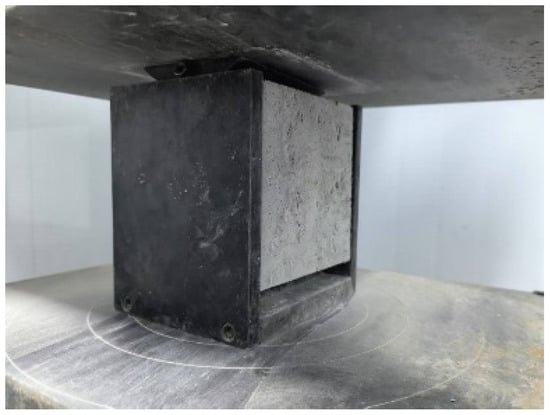
Figure 8.
Splitting tensile strength.
- (3)
- Flexural strength
Prism specimens measuring 100 mm × 100 mm × 400 mm were used (3 per group) to test strengths at 3 d, 7 d, and 28 d. To achieve this goal, a bending fixture was equipped with a support roller spacing of 300 mm. The specimens were placed on the support roller, loaded at a speed of 0.05–0.08 MPa/s until the specimen fractured, and the maximum load was recorded, as shown in Figure 9. The flexural strength was calculated using Equation (5), and the average strength of 3 specimens was taken as the representative value; values with deviations exceeding ±10% were rejected.
where ff is the flexural strength, L is the support roller spacing, and b and h are the width and height of the specimen, respectively.
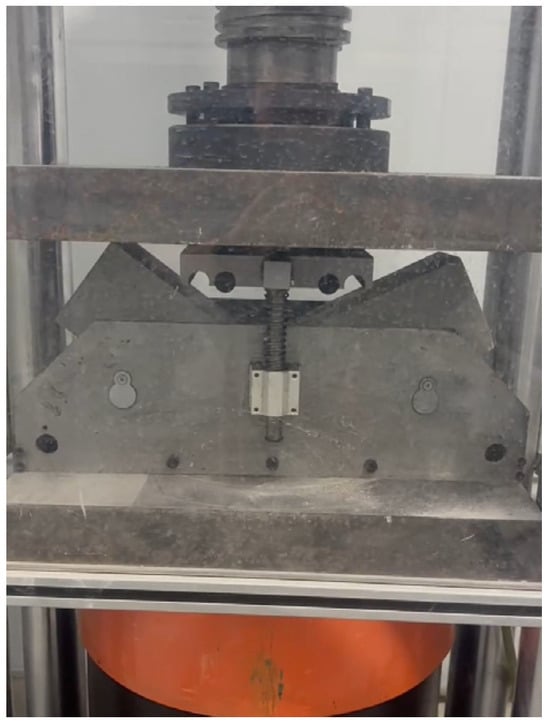
Figure 9.
Flexural strength test.
2.2.4. Range Analysis Method
The core principle of the range analysis method is to determine the primary and secondary order of factors and identify the optimal levels by quantifying the degree of influence of different levels of each factor on the test index. The greater the dispersion of the test results under different levels of the same factor, the larger the range, indicating that the factor has a more significant regulatory effect on the index. The specific steps are as follows.
- (1)
- Total value of results at a level
For a certain factor i, this refers to the sum of all test results corresponding to its j-th level, as shown in Equation (6).
where i is the factor number; j is the level number; n is the number of times the level appears in the orthogonal test table; and yijk is the test index value of the k-th test when factor i takes the j-th level.
- (2)
- Average value of result at a level
This is the average of the test results for the j-th level of factor i, which reflects the average performance of the index at that level, as shown in Equation (7).
The physical meaning of kij is as follows: for an index adhering to the “larger is better” criterion, a larger kij signifies a more optimal level; for one following the “smaller is better” criterion, a smaller kij denotes a more optimal level.
- (3)
- Factor range
This refers to the difference between the maximum and minimum values among the average values of all levels of the factor i, as shown in Equation (8).
The core significance of the range Ri is to quantify the degree of influence of the factor on the index. A larger Ri means that different levels of the factor cause more dramatic fluctuations in the index, i.e., the factor has a more significant influence on the index.
3. Results and Discussion
3.1. Compressive Strength
Figure 10 presents the test results of compressive strength of the TMS concrete at 3 d, 7 d, and 28 d in the orthogonal experiment. To further explore the growth law of compressive strength, the strength growth rate (ηij) is defined as the compressive strength growth rate of concrete from day i to day j, and its calculation formula is shown in Equation (9).
where fid and fjd represent the compressive strength on day i and day j, respectively.
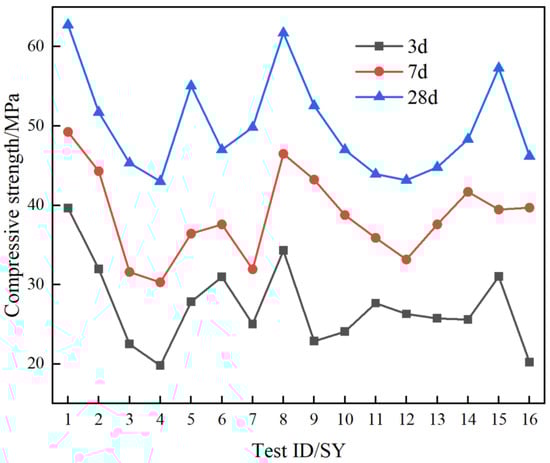
Figure 10.
Compressive strength results for different ages in the orthogonal experiment.
From the overall law of strength development, our results first show the characteristic of rapid growth in the early stage and stabilization in the middle and late stages. The average strength growth rate in the 3 d to 7 d stage is close to 50%, which is much higher than 28.3% in the 7 d to 28 d stage. This phenomenon is directly related to the hydration characteristics of cementitious materials; 3 d to 7 d is the period during which the hydration reaction is most vigorous in a cement clinker, and hydration products can quickly fill the aggregate gaps, thereby promoting a rapid increase in strength. The 3 d-to-7 d period corresponds to the stage of accelerated cement clinker hydration, where tricalcium silicate (C3S) and dicalcium silicate (C2S) undergo vigorous reactions to generate massive amounts of calcium silicate hydrate (C-S-H) gel. This gel rapidly fills the voids between aggregates, acting as a strength skeleton that drives a sharp increase in concrete strength [35,36].
However, after 7 d, the hydration rate of cement slows down significantly, and the strength growth mainly depends on the pozzolanic effect of the FA and GGBFS. The strength is supplemented by the slow reaction of the FA and slag to form calcium silicate hydrate gel, so the strength growth rate decreases significantly. In addition, there is a negative correlation between the initial strength base and the growth rate. For the test groups with low 3 d compressive strength (such as SY4 and SY16), their η37 generally exceeds 50%; while for the test groups with high 3 d compressive strength (such as SY1 and SY8), their η37 is mostly lower than 35%. However, in terms of the final 28 d compressive strength, the test groups with high initial strength still maintain an obvious advantage, which indicates that the early strength compensation capacity cannot completely make up for the gap in initial strength, and the final strength of concrete still depends on the overall rationality of the mix proportion.
To explore the influence of different factors on the 28 d compressive strength, the 28 d compressive strength was selected as the target index for range analysis, and the results are shown in Table 7.
Table 7.
Range analysis of compressive strength.
These results show that the order of degree to which each factor influences the 28 d compressive strength, from strong to weak, is water–binder ratio, fineness modulus, FA:GGBFS, sand ratio, and stone powder content. Among them, the water–binder ratio is the most dominant factor affecting the 28 d compressive strength, and its range is 1.8 times that of the secondary dominant factor, indicating that slight adjustment of the water–binder ratio can have a significant impact on the 28 d compressive strength, while the stone powder content has the smallest range and is a secondary control factor.
For water–binder ratio, the average 28 d compressive strength (k) is 0.35, reaching 57.2 MPa. As the water–binder ratio increases from 0.35 to 0.42, the 28 d compressive strength decreases continuously. These results confirms the core mechanism that a low water–binder ratio can improve the compactness and compressive strength of concrete. For fineness modulus, the 2.60 level is the optimal level, and its average 28 d compressive strength is 53.4 MPa, while the average 28 d compressive strength of the 2.90 level is the lowest at only 46.7 MPa. This indicates that excessively coarse or excessively fine sand is not conducive to improving compressive strength, and the TMS with a medium fineness modulus has the best adaptability to the concrete mix proportion. There is a relationship between the fineness of an additive and its mechanical properties, so finding the optimum fineness value is important [37,38]. The average 28 d compressive strength of the sand ratio of 25% is the highest, the gap filling of coarse aggregate is more reasonable, and the ability of mortar to wrap the aggregate is significantly improved, thereby optimizing overall performance. In addition, the results show that when FA and GGBFS are mixed in a ratio of 6:4, the synergistic effect between them can be fully exerted, making the pozzolanic effect and early strength the best combination, thereby improving the final compressive strength. As for stone powder content, the average 28 d compressive strength at the 0% level is the highest, indicating that low stone powder content can reduce its adsorption of water reducer, and prevent the mortar dilution problem caused by failure of the water reducer; this is similar to previous research findings [39,40]. Based on the range analysis results, the theoretical optimal mix proportion for the 28 d compressive strength of concrete is as follows: fineness modulus = 2.60, sand ratio = 25%, FA:GGBFS = 6:4, stone powder content = 0%, and water–binder ratio = 0.35. Therefore, for bridge components dominated by compressive stress, including piers, abutments, pile foundations, and arch rings of arch bridges, the concrete mix proportion with optimal compressive performance is recommended.
3.2. Splitting Tensile Strength
Figure 11 presents the test results regarding the splitting tensile strength of concrete at 3 d, 7 d, and 28 d in the orthogonal experiment. The growth law of splitting tensile strength shares similarities with that of compressive strength while also exhibiting significant differences. The similarity lies in rapid growth in the early stage and stabilization in the middle and late stages, and the core differences are concentrated in two aspects. First, the fluctuation range of the growth rate in the middle and late stages is larger. This is because splitting tensile performance is more sensitive to the interfacial bonding of concrete. After 7 d, although the pozzolanic effect of FA and GGBFS can generally improve the aggregate–paste ITZ structure, the degree of interface improvement varies greatly under different mix proportions, directly leading to intensified fluctuations in the growth rate in the middle and late stages. Second, the influence of water–binder ratio on splitting tensile strength is more non-linear and does not adhere to the “lower is better” criterion. An excessively low water–binder ratio can improve compactness but tends to increase the internal shrinkage stress of concrete and cause microcracks, thereby reducing splitting tensile strength.
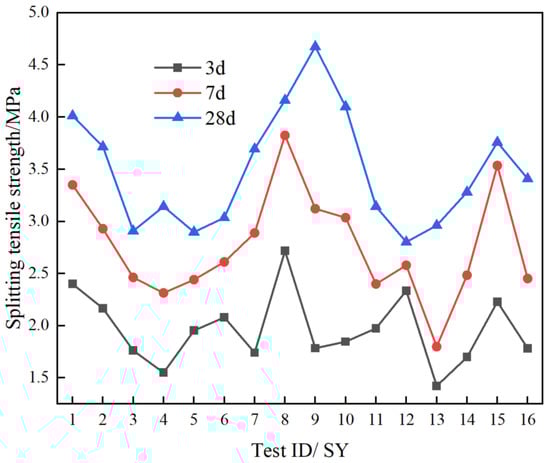
Figure 11.
Splitting tensile strength results for different ages in the orthogonal experiment.
Taking 28 d splitting tensile strength as the index, range analysis was conducted, and the results are shown in Table 8.
Table 8.
Range analysis of splitting tensile strength.
The order of the degree to which each factor influences the 28 d splitting tensile strength, from strong to weak, is water–binder ratio, FA:GGBFS, stone powder content, fineness modulus, and sand ratio.
In terms of range amplitude, the range of the water–binder ratio is 3.1 times that of the secondary dominant factor (FA:GGBFS), making it the most dominant factor. The ranges of FA:GGBFS, stone powder content, and fineness modulus fall within a narrow interval of 0.30–0.35 MPa with small differences, classifying them as medium-influencing factors. The sand ratio has the smallest range and exerts the weakest influence on the splitting strength.
From the perspective of the mechanical mechanism, during the splitting tensile loading process, stress is mainly concentrated in the aggregate–paste in the ITZ, and the interfacial bonding strength directly determines the failure mode and upper strength limit of concrete. Among these factors, FA:GGBFS becomes the secondary dominant factor, primarily due to the synergistic effect between them. The spherical particles of the FA can optimize the fluidity of the paste around aggregates, reducing the primary pores in the ITZ; meanwhile, the pozzolanic reaction of GGBFS generates C-S-H gel with a low Ca/Si ratio, which fills interfacial microcracks and reduces the oriented arrangement of Ca(OH)2 crystals at the interface.
Regarding the selection of optimal factor levels, the splitting tensile strength prefers coarse aggregates with a fineness modulus of 2.90. This is because coarse aggregates have higher surface roughness, leading to stronger mechanical interlocking with the cement paste, which effectively improves interfacial bonding strength. Moreover, this gain can offset the adverse effect of slightly increased matrix porosity caused by coarse aggregates. For the stone powder content, 6% becomes the optimal level, mainly because the micro-aggregate filling effect is highly compatible with the interfacial requirements of splitting tensile strength. It can accurately fill the tiny voids at the aggregate–paste interface, improving interface compactness. At the same time, the specific surface area of the stone powder in this batch is moderate, and its adsorption effect on water reducers is weak, which does not cause a significant decrease in the fluidity of the cement paste.
Combining the optimal levels of each factor, the theoretical optimal mix proportion for the 28 d splitting tensile strength is fineness modulus = 2.90, sand ratio = 25%, FA:GGBFS = 6:4, stone powder content = 6%, and water binder ratio = 0.35. Therefore, for key bridge components subject to tensile stress, including cable anchors and hangers of suspension/cable-stayed bridges, as well as the tensile zones of prestressed concrete beams, thus concrete mix proportion is recommended.
3.3. Flexural Strength
Figure 12 presents the test results regarding the flexural strength of the TMS concrete at 3 d, 7 d, and 28 d in the orthogonal experiment. Unlike compressive strength, the mechanical mechanism of flexural strength is a flexural–tensile mechanism, which requires meeting the dual requirements of matrix tensile performance and interface crack resistance. As the key weak link in flexural failure, the ITZ relies on the continuous filling and densification of late cement hydration products for structural enhancement. Consequently, the early stage development of flexural strength is relatively delayed, with the 3 d strength accounting for only 63.1% of the 28 d strength, significantly lower than the 72.5% of compressive strength.
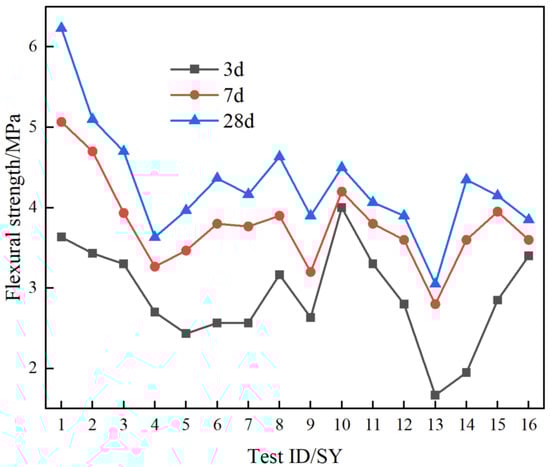
Figure 12.
Flexural strength results for different ages in the orthogonal experiment.
In terms of the age distribution of factor sensitivity, flexural strength exhibits the characteristic of relying on the matrix in the early stage and the interface in the late stage. In the early stage, the water–binder ratio is mainly used to control matrix compactness and quickly establish the basic tensile strength; in the late stage, the fineness modulus is used to optimize aggregate gradation, improve matrix uniformity, and reduce interface microcracks. Therefore, its late-stage sensitivity to interface-related factors (fineness modulus) lies between that of compressive strength and splitting tensile strength.
Range analysis was conducted with the 28 d flexural strength as the core target, and the results are shown in Table 9.
Table 9.
Range analysis of flexural strength.
It can be seen from Table 9 that the order in which each factor influences the 28 d flexural strength, from strong to weak, is fineness modulus, water–binder ratio, FA:GGBFS, stone powder content, and sand ratio. Among them, the fineness modulus is the most dominant factor, with the optimal level being 2.30, consistent with the research results of De et al. [41]. Fine aggregate has a small particle size and continuous gradation. It can fully fill the gaps between coarse aggregates to form a dense skeleton structure, reducing the number of stress concentration points inside the matrix. On the other hand, the larger contact area between fine aggregate and cement paste can effectively reduce the thickness of the ITZ and inhibit crack initiation. Therefore, its 28 d strength average reaches 4.90 MPa, an increase of 25.6% compared with the worst level. The water–binder ratio is the secondary dominant factor, with the optimal level being 0.35. A low water–binder ratio can promote the full hydration of cement, reduce the matrix porosity to below 16%, and at the same time improve the cross-linking density of the C-S-H gel, significantly enhancing the matrix tensile performance.
Combining the optimal levels of each factor, the theoretical optimal mix proportion for the 28 d flexural strength is fineness modulus = 2.30, sand ratio = 30%, FA:GGBFS = 2:8, stone powder content = 0%, and water–binder ratio = 0.35. For bridge components under bending stress, such as main girders (simply supported beams, continuous beams), bridge decks, and expansion joint bearing plates, flexural performance directly determines their service life. Thus, the concrete mix proportion with optimal flexural performance is recommended.
3.4. Interaction Effect
The interaction effect refers to the phenomenon of coupling between various factors, and its significance is usually judged according to the p value. The core meaning of the p value here is the probability of observing the current experimental results (or more extreme results) under the null hypothesis that there is no interaction between two factors. In this study, the significance level α is set to 0.05, with the judgment rule as follows: if p > 0.05, it indicates that the interaction has no significant impact on the target index; if p ≤ 0.05, the null hypothesis is rejected, and it is considered that there is a significant interaction between the two factors.
Taking the 28 d compressive strength as the evaluation index, analysis of variance was used to quantitatively analyze the interaction effects of various factors. The p values of the interaction effects between different factors are presented in Table 10. The results show that only the interaction between fineness modulus and water–binder ratio has a p = 0.008 ≤ 0.05, exerting an extremely significant impact on the 28 d compressive strength; the p values of all other interaction effects are >0.05, with no significant impact. An interaction effect diagram of these two factors is illustrated in Figure 13.
Table 10.
Analysis of variance results.
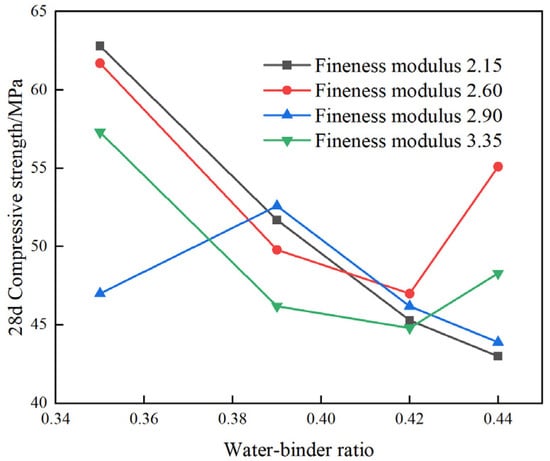
Figure 13.
Effect of interaction between fineness modulus and water–binder ratio.
When the water–binder ratio is 0.35, the 28 d compressive strengths of the TMS concrete with fineness moduli of 2.15 and 2.60 both exceed 60 MPa, while the strength decreases significantly when the fineness modulus increases to 2.90 and 3.35. This is because under low water–binder ratio conditions, the cementitious paste exhibits high viscosity. The particle gradation of the TMS with a medium–low fineness modulus can easily form a dense skeleton structure with coarse aggregates, and no excess free water remains in the ITZ, thereby significantly improving the compressive strength. In contrast, TMS with high fineness modulus has a large specific surface area, leading to increased water demand, which results in a higher internal porosity of concrete and a subsequent decrease in strength.
When the water–binder ratio is 0.44, the strength of the TMS concrete with a fineness modulus of 2.60 reaches 55.1 MPa, which is significantly higher than that of TMS concrete with other fineness modulus levels. This is attributed to the sufficient fluidity of the cementitious paste under a high water–binder ratio. The reactive SiO2 in TMS with a high fineness modulus is more easily activated by Ca(OH)2 produced during cement hydration. The secondary hydration products can effectively fill internal pores, offsetting the strength loss caused by the excessively high water–binder ratio. In contrast, TMS with a low fineness modulus has a low content of reactive components, which cannot fully participate in the secondary hydration reaction, resulting in persistently low strength.
When the water–binder ratio is in the range of 0.39~0.42, the interaction between fineness modulus and water–binder ratio tends to be gentle. The compressive strengths of concrete with different fineness moduli are concentrated in the range of 45~53 MPa, with small fluctuations. This indicates that the strength in this range is mainly dominated by the hydration degree of the cementitious system, and the regulatory effect of fineness modulus is weakened.
4. Conclusions
Based on an orthogonal experimental design, this study systematically investigated the effects of fineness modulus, sand ratio, mass ratio of the FA:GGBFS, stone powder content, and water-to-binder ratio on the mechanical properties of TMS concrete. The following conclusions were drawn.
- (1)
- The compressive, splitting tensile, and flexural strengths of the TMS concrete all showed a trend of rapid growth from 3 d to 7 d, and stable growth from 7 d to 28 d, but with significant index differences. The 3 d compressive strength accounted for 72.5% of the 28 d strength, and the growth rate ~50%; the flexural strength had the lowest 3 d ratio and the highest growth rate (18.6%) from 7 d to 28 d; the splitting tensile strength was between the two.
- (2)
- The dominant factor for compressive and splitting tensile strengths was water–binder ratio (ranges 12.37 MPa, 1.10 MPa); the dominant factor for flexural strength was fineness modulus (range 1.00 MPa), with water–binder ratio being the secondary factor (range 0.85 MPa); and sand ratio had the weakest influence on the three strengths (range ≤ 0.60 MPa).
- (3)
- In terms of fineness modulus, the compressive strength, splitting tensile strength, and flexural strength reach their optimal levels at 2.60, 2.90, and 2.30, respectively; in terms of stone powder content, the compressive and flexural strengths are optimal at 0%, while the splitting tensile strength is optimal at 6%.
- (4)
- The interaction between fineness modulus and water–binder ratio is statistically significant, while the interaction effects of other factors can be neglected.
- (5)
- There are significant differences in the theoretical optimal mix proportions of the three strengths, necessitating targeted design based on performance requirements. In addition, the durability of TMS concrete requires further research.
Author Contributions
Conceptualization, P.H.; methodology, P.H.; software, H.Z. and Z.L.; validation, H.Z. and Z.W.; formal analysis, C.Y.; investigation, H.Z. and D.L.; resources, H.Z. and C.Y.; data curation, J.L. and Y.Z.; writing—original draft preparation, H.Z.; writing—review and editing, P.H. and C.Y.; visualization, H.Z. and Z.L.; supervision, P.H.; project administration, H.Z.; funding acquisition, Z.L. and Z.Z. All authors have read and agreed to the published version of the manuscript.
Funding
The APC was funded by Jiangsu ZYZ Intelligent Operation & Maintenance Institute Co., Ltd. and Ningbo Yongtaiwen Transportation Development Co., Ltd.
Data Availability Statement
The original contributions presented in this study are included in the article. Further inquiries can be directed to the corresponding author.
Conflicts of Interest
Author Haitao Zhang was employed by the company Ningbo Datong Development Co., Ltd. Authors Zhiguo Liu, Zhentian Zhang, and Diwei Lang were employed by the company Ningbo Yongtaiwen Transportation Development Co., Ltd. Author Caiqian Yang was employed by the company Jiangsu ZYZ Intelligent Operation & Maintenance Institute Co., Ltd. The remaining authors declare that the research was conducted in the absence of any commercial or financial relationships that could be construed as a potential conflict of interest. The authors declare that this study received funding from Jiangsu ZYZ Intelligent Operation & Maintenance Institute Co., Ltd. and Ningbo Yongtaiwen Transportation Development Co., Ltd. The funder was not involved in the study design, collection, analysis, interpretation of data, the writing of this article or the decision to submit it for publication.
References
- Du, B.; Xiang, T.Y.; Huang, Z.H. Research on Creep Application of High-strength Concrete with Manufactured Sand for Bridge Use. Agro Food Ind. Hi-Tech 2017, 28, 3064–3067. [Google Scholar]
- Zhang, Y.Z.; Gu, L.Y.; Zhang, Q.L. Durability of manufactured sand concrete in atmospheric acidification environment. Case Stud. Constr. Mater. 2023, 17, e01613. [Google Scholar] [CrossRef]
- He, X.J.; Zhu, E.J.; Zhang, M.X.; Wu, L.; Li, P.G. Experimental Study on Performance of High-Performance Concrete Based on Different Fine Aggregate Systems. Buildings 2025, 15, 3386. [Google Scholar] [CrossRef]
- Arulmoly, B.; Konthesingha, C.; Nanayakkara, A. Performance evaluation of cement mortar produced with manufactured sand and offshore sand as alternatives for river sand. Constr. Build. Mater. 2021, 297, 123784. [Google Scholar] [CrossRef]
- Wen, J.; Li, H.; Wang, Z.; Yang, Z.; Huang, F.; Dong, H.; Li, Z. Fatigue performance of ballastless track manufactured sand concrete: The influence of manufactured sand lithology and stone powder content. J. Sustain. Cem.-Based Mater. 2025, 14, 1473–1486. [Google Scholar] [CrossRef]
- Petit, H.A.; Irassar, E.F. The throat classifier: A novel air classifier for the control of dust in manufactured sands. Powder Technol. 2021, 390, 417–427. [Google Scholar] [CrossRef]
- Li, H.; Wang, Z.; Huang, F.; Yi, Z.; Xie, Y.; Sun, D.; Sun, R. Impact of different lithological manufactured sands on high-speed railway box girder concrete. Constr. Build. Mater. 2020, 230, 116943. [Google Scholar] [CrossRef]
- Liu, Z.F.; He, J.Q. Elastic Modulus Prediction for Manufactured Sand Concrete Using Fuzzy Set and Neural Network. Teh. Vjesn.-Tech. Gaz. 2024, 31, 2125–2131. [Google Scholar]
- Rathore, Y.; Raheem, J. The Evolution, Characteristics, and Potential of Manufactured Sand in Concrete: A Short Review. Natl. Acad. Sci. Lett. 2025. [Google Scholar] [CrossRef]
- Bhoopathy, V.; Subramanian, S.S. The way forward to sustain environmental quality through sustainable sand mining and the use of manufactured sand as an alternative to natural sand. Environ. Sci. Pollut. Res. 2022, 29, 30793–30801. [Google Scholar] [CrossRef]
- Rathore, Y.; Raheem, J. Sustainable Concrete Advancements: Exploring Deccan Basalt Manufactured Sand as A River Sand Alternative. Natl. Acad. Sci. Lett. 2025. [Google Scholar] [CrossRef]
- Tripathi, D.; Kumar, R.; Mehta, P.K. Development of an environmental-friendly durable self-compacting concrete. Environ. Sci. Pollut. Res. 2022, 29, 54167–54180. [Google Scholar] [CrossRef] [PubMed]
- Thangapandi, K.; Anuradha, R.; Awoyera, P.O.; Gobinath, R.; Archana, N.; Berlin, M.; Oladimeji, O.B. Durability phenomenon in manufactured sand concrete: Effects of zinc oxide and alcofine on behaviour. Silicon 2020, 13, 1079–1085. [Google Scholar] [CrossRef]
- Fan, W.; Wei, Y.; Yi, J.Y.; Zhao, K.; Zhu, B.R.; Li, G.F. Analysis and Correction of the Shrinkage Prediction Model for Manufactured Sand Concrete. Materials 2025, 18, 3802. [Google Scholar] [CrossRef]
- Xie, K.Z.; Bai, M.Y.; Qing, Z.G.; Li, J.; Ge, B.Z. Study on Durability of Manufactured Sand Based on Stone Powder Content. Sci. Adv. Mater. 2018, 10, 1608–1614. [Google Scholar] [CrossRef]
- Pilegis, M.; Gardner, D.; Lark, R. An Investigation into the Use of Manufactured Sand as a 100% Replacement for Fine Aggregate in Concrete. Materials 2016, 9, 440. [Google Scholar] [CrossRef]
- Zhen, H.; Xiong, Z.; Song, Y.Y.; Li, L.J.; Qiu, Y.; Zou, X.Z.; Chen, B.; Chen, D.E.; Liu, F.; Ji, Y.D. Early mechanical performance of glass fibre-reinforced manufactured sand concrete. J. Build. Eng. 2024, 83, 108440. [Google Scholar] [CrossRef]
- Zheng, S.B.; Chen, J.J.; Wang, W.X. Effects of Fines Content on Durability of High-Strength Manufactured Sand Concrete. Materials 2023, 16, 522. [Google Scholar] [CrossRef] [PubMed]
- Xu, X.B.; Xie, J.C.; Tang, Y.S.; Luo, L.F.; Chen, Z.; Li, J.W. Experimental Study and Machine Learning-Based Prediction of the Abrasion Resistance of Manufactured Sand Concrete. Buildings 2024, 14, 3433. [Google Scholar] [CrossRef]
- Shi, L.H.; Ma, H.X. Experimental Study on Effect of Limestone Powder on Concrete Properties in Mechanism Sand. Integr. Ferroelectr. 2021, 215, 38–46. [Google Scholar] [CrossRef]
- Akrout, K.; Ltifi, M.; Ouezdou, M.B. Chloride diffusion in mortars—Effect of the use of limestone sand Part I: Migration test. Int. J. Concr. Struct. Mater. 2010, 4, 105–108. [Google Scholar]
- Chen, X.D.; Wu, S.X.; Zhou, J.K. Pore Size Distribution of Cement Mortar Prepared with Crushed Limestone Sand. KSCE J. Civ. Eng. 2016, 20, 762–767. [Google Scholar] [CrossRef]
- Wang, X.; Zhang, W.H.; Zhang, Y.S.; Qiao, H.X.; Xue, C.Z.; Mundia, M.M.; An, B.F. Research on the green preparation of manufactured sand by tuff produced in Gansu China and its influence on the properties of concrete. Constr. Build. Mater. 2023, 409, 133794. [Google Scholar] [CrossRef]
- Charrak, M.; Bali, A.; Silhadi, K. Concrete mix design containing calcareous tuffs as a partial sand substitution. Constr. Build. Mater. 2013, 47, 318–323. [Google Scholar] [CrossRef]
- Ma, J.; Huang, Z.L.; Zhong, D.K.; Liang, S.J.; Liang, H.; Xue, D.Q.; Chen, X.; Fan, T.G. Formation and distribution of tuffaceous tight reservoirs in the Permian Tiaohu Formation in the Malang sag, Santanghu Basin, NW China. Pet. Explor. Dev. 2016, 43, 778–786. [Google Scholar] [CrossRef]
- Lu, X.; Pei, L.; Peng, S.T.; Li, X.; Chen, J.K.; Chen, C. Hydration, Hardening Mechanism, and Performance of Tuff Normal Concrete. J. Mater. Civ. Eng. 2021, 33. [Google Scholar] [CrossRef]
- GB 175; Common Portland Cement. AQSIQ: Beijing, China, 2023.
- GB8076; Concrete Admixture. AQSIQ: Beijing, China, 2008.
- JTG/T 3650; Technical Specifications for Construction of Highway Bridges and Culverts. Ministry of Transport: Beijing, China, 2020.
- GB/T 1596; Fly Ash Used for Cement and Concrete. AQSIQ: Beijing, China, 2017.
- GB/T 18046; Ground Granulated Blast Furnace Slag Used for Cement, Mortar, and Concrete. AQSIQ: Beijing, China, 2017.
- Kutuk, S. Morphology, Crystal Structure and Thermal Properties of Nano-Sized Amorphous Colemanite Synthesis. Arab. J. Sci. Eng. 2024, 49, 11699–11716. [Google Scholar] [CrossRef]
- GB/T 14684; Sand for Construction. AQSIQ: Beijing, China, 2022.
- GB/T 50081; Standard for Test Method of Concrete Physical and Mechanical Properties. Ministry of Housing and Urban-Rural Development: Beijing, China, 2018.
- Huo, B.B.; Zhang, Y.M. Effects of dicalcium ferrite on hydration and microstructure of cementitious material. Constr. Build. Mater. 2024, 411, 134604. [Google Scholar] [CrossRef]
- Xu, Y.D.; He, T.S.; Ma, X.D.; Luo, R.Y. The influence of calcium sulphoaluminate cement on the hydration process of cement paste mixed with alkali free liquid accelerator. Mater. Today Commun. 2022, 33, 104622. [Google Scholar] [CrossRef]
- Kara, C.; Kutuk, S.; Lituk-sert, T. Improvement of the durability of concrete by substitution of raw ground colemanite. Case Stud. Constr. Mater. 2023, 19, e02393. [Google Scholar] [CrossRef]
- Kutuk, S.; Lituk-sert, T. An examination of nanoparticle colemanite mineral added warm mix asphalt. Constr. Buliding Mater. 2020, 243, 118252. [Google Scholar] [CrossRef]
- Zhang, M.M.; Xu, J.; Li, M.; Yuan, X.S. Influence of Stone Powder Content from Manufactured Sand Concrete on Shrinkage, Cracking, Compressive Strength, and Penetration. Buildings 2023, 13, 1833. [Google Scholar] [CrossRef]
- Wu, H.M.; Liu, K.; Yang, F.; Shen, B.; Ma, K.J.; Zhang, J.Y.; Liu, B. Experimental Mechanical Properties and Numerical Simulation of C80 Concrete with Different Contents of Stone Powder. Materials 2022, 15, 3282. [Google Scholar] [CrossRef] [PubMed]
- De Vlieger, J.; Blaakmeer, J.; Gruyaert, E.; Cizer, Ö. Assessing static and dynamic yield stress of 3D printing mortar with recycled sand: Influence of sand geometry, fineness modulus, and water-to-binder ratio. J. Build. Eng. 2025, 101, 111827. [Google Scholar] [CrossRef]
Disclaimer/Publisher’s Note: The statements, opinions and data contained in all publications are solely those of the individual author(s) and contributor(s) and not of MDPI and/or the editor(s). MDPI and/or the editor(s) disclaim responsibility for any injury to people or property resulting from any ideas, methods, instructions or products referred to in the content. |
© 2025 by the authors. Licensee MDPI, Basel, Switzerland. This article is an open access article distributed under the terms and conditions of the Creative Commons Attribution (CC BY) license (https://creativecommons.org/licenses/by/4.0/).