Abstract
Perceived landscape quality in historical and cultural districts is crucial for reconciling cultural heritage preservation with urban renewal. However, limited attention has been paid to whether street-level visual elements influence public esthetic perception in a nonlinear manner, especially in heritage-sensitive urban environments. Against this backdrop, this study explores the nonlinear effects of natural, artificial, and interfering visual elements on perceived landscape quality in historical and cultural districts. Five districts in Wuhan, China, were selected. Street view images were processed with a U-Net–based semantic segmentation model to extract pixel-level visual elements, and public scenic beauty ratings were collected through an image-based questionnaire survey. The analyses reveal nonlinear perception patterns. The results show that the relationships between visual elements and perceived beauty are nonlinear and heterogeneous. Natural elements have the strongest positive influence on perceived landscape quality, artificial elements require careful density control, and interfering elements are consistently negative contributors. By quantifying these nonlinear mechanisms, this study suggests that esthetic responses in historical districts may depend on threshold-like combinations of visual elements and may offer a useful reference for heritage-sensitive urban renewal and streetscape design.
1. Introduction
The European Landscape Convention defines landscape as an area perceived by people, shaped by the interaction of natural and cultural forces [1]. As a perceptual construct, landscape is no longer seen merely as a territorially or administratively bounded space, but rather as a dynamic interface between human cognition and environmental form [2,3]. This shift toward understanding landscape as a subjective experience has emphasized perception, esthetics, and symbolic meaning as key dimensions of landscape quality [4], and underscores the complex interplay of visual attributes in esthetic evaluation. Additionally, Daniel and Boster 1976 emphasized that the core of landscape quality perception lies in the interaction between people and landscape [5], a concept foundational to contemporary studies linking landscape attributes to public preference. Visual perception serves as a key means of evaluating its external features and functions, thereby revealing the intrinsic value of the landscape. Recent empirical work on biophilic design further shows that moderate levels of nature-like fractal complexity can lower physiological stress and increase visual fluency in environmental perception [6,7,8]. At the same time, biophilic and traditional urban design research suggests that historic urban fabrics with human-scale detail and coherent geometries, as often found in historical and cultural districts, can enhance perceived landscape quality and experiential richness [9,10,11].
In the context of rapid urbanization, the perceptual quality of historical and cultural districts—key components of urban cultural infrastructure—has received increasing attention. These areas embody historical memory and urban identity, providing visual and spatial continuity amid modern development. In this paper, we understand “historical memory” not as an abstract metaphor but as a set of shared narratives and everyday practices that are materially anchored in the built environment. Facade compositions, street alignments, traditional materials, and the rhythm of openings and signage together encode how past ways of life are remembered, normalized, or selectively forgotten in the present streetscape. “Urban identity” is thus produced not only through official heritage designations, but also through the recurring visual cues that allow residents and visitors to recognize a district as historically distinct from the surrounding urban fabric. From this perspective, the visual quality of historical and cultural districts is inseparable from the ways in which specific spatial and architectural patterns sustain, dilute, or reframe these lived memories over time. The esthetic character of such landscapes plays a critical role in enhancing psychological well-being, place attachment, and the sustainability of urban life [12]. Biophilic design theory further argues that humans possess an innate affinity for natural forms and processes, so that environments which evoke these qualities can strengthen psychological well-being and place attachment [9]. Experimental and field studies indicate that exposure to fractal or near-natural architectural patterns is associated with stress reduction and improved cognitive functioning [6,8]. Large-scale data-driven analyses of scenic ratings and happiness also demonstrate that people tend to report higher life satisfaction in more visually beautiful and scenic environments, including urban settings [13,14]. Being both symbolic and lived spaces, historically significant districts influence not only physical environments [15] but also social and emotional experiences [16,17]. Understanding how visual features shape public perceptions of these districts can thus offer valuable insights for landscape design, heritage protection, and planning policy [18,19].
Research on landscape quality perception can be broadly categorized into two main approaches. According to Lothian, these consist of (1) the objective approach, grounded in physical paradigms, and (2) the subjective approach, rooted in psychological paradigms [20]. The objective approach typically evaluates urban landscape quality using tools such as City Information Modeling (CIM), remote sensing imagery, satellite photos, and land cover data, with subsequent inference of their impacts on public perception [21]. However, as noted by Daniel [22], such objective assessments often fail to capture the nuanced preferences exhibited in real-world experiences, or the complex interactions between people and landscapes. In contrast, the subjective approach—advocated by [23,24,25,26,27]—relies on visual stimuli, such as landscape photographs, to simulate real-world environmental experiences and elicit immediate human perceptual responses. Complementing these approaches, eye-tracking studies by Hollander, Sussman, Lavdas and colleagues reveal how observers unconsciously fixate on specific façade elements, symmetry patterns and focal features in streetscapes, providing direct evidence of how visual elements guide attention in urban scenes [28,29,30,31].
Common objective indices include the Green Visibility Index (GVI), Water Visibility Index (WVI), and Urban Construction Level (UCL), as proposed by scholars like [32,33,34]. However, with ongoing urban transformations, landscape perception is shaped by the joint effects of multiple factors rather than the linear impact of any single element. Earlier studies often overlooked the urban landscape as a complex system composed of diverse elements and typologies [35]. While Tenerelli and others highlighted the importance of landscape indicators in evaluating visual quality, the interactive effects among these indicators remain insufficiently explored. Moreover, because public evaluations reflect a holistic perception of the landscape—rather than assessments of isolated elements—existing methods remain limited in their ability to explain comprehensive visual perception [36,37]. In particular, conventional indices rarely capture formal properties such as fractal scaling, biophilic structure, or symmetry, which have been shown to exert strong and sometimes nonlinear influences on preference, stress recovery, and perceived beauty in both natural and built environments [6,7,8,9,10,11,38].
Since the 1960s, numerous theories and methodologies have been developed to investigate the subjective perception of landscape quality. Examples include the four paradigms proposed by Zube [39]; the perceptual index system—comprising coherence, mystery, complexity, and legibility—developed by Kaplan and Kaplan [40]; and the scenic beauty estimation method introduced by Daniel [22]. These studies collectively underscore the central role of human perception in evaluating landscape quality—an aspect that is essential for enhancing well-being, guiding urban design, supporting environmental governance, and ultimately achieving livable and sustainable urban environments [41]. However, traditional evaluation methods—such as surveys, in-depth interviews, and photo-based assessments—are often time-consuming, costly, and constrained by limited data sources, thereby restricting their applicability in large-scale built environments [42,43]. Recent eye-tracking research demonstrates that environments with symmetric, organized patterns generate more stable attention patterns and positive affective responses, supporting a link between visual order and preference [28,30,44]. Together with work in neuroarchitecture and classic planning, these studies contribute to an emerging neurological basis for beauty in the built environment [11,31,45,46,47].
The limitations of existing research are evident in two primary aspects. First, there is a lack of clear and reliable reference frameworks for assessing how the landscape quality of historical and cultural districts influences public perception. This gap presents significant challenges for urban planners and designers in making informed decisions. Quantifying the visual landscape elements in historical and cultural districts remains difficult, and conventional indicators for assessing urban landscape quality are not fully applicable to these contexts. For instance, although indicators like green view index (GVI) are widely applied, others—such as tunnels and public transit facilities—may not be relevant or applicable in the context of the districts. Second, most existing studies focus on isolated visual indicators, often assuming linear relationships between landscape features and esthetic response. This overlooks the perceptual complexity of historical and cultural districts, where multiple visual components interact. Prior research rarely examines nonlinear effects—such as threshold saturation or inverted U-shaped patterns—that align more realistically with human cognitive responses.
To address these gaps, this study employs a perception-driven analytical framework underpinned by deep learning to capture the nonlinear effects of visual elements in historical and cultural districts. In this framework, street-view imagery from five districts in Wuhan is analyzed by integrating semantic segmentation, public esthetic evaluation, and SHAP-based model interpretation. Accordingly, the primary aim of this study is to reveal how natural, artificial, and interfering visual elements jointly and nonlinearly affect perceived landscape quality. In addition, the study introduces an interpretable deep learning–based evaluation framework to uncover complex nonlinear relationships and interactions among visual variables, providing a novel tool for landscape assessment in heritage areas [6,8,9,10,11,31,45,47].
2. Materials and Methods
2.1. Study Area
The study focuses on five historical and cultural districts in Wuhan, Hubei Province, China (Figure 1). Figure 1a highlights the administrative districts where the five selected historical districts are located, while Figure 1b–d illustrate the specific spatial extents of the historic blocks within those districts. As a megacity with rich historical heritage and rapid urban transformation, Wuhan provides a representative context for examining how visual elements in historical and cultural districts influence public perceptions of landscape quality. These districts exemplify the tension between heritage preservation and contemporary urban development. Analyzing them provides insight into how visual esthetics can be enhanced through design interventions without compromising cultural identity, ultimately improving residents’ perceived environmental quality and experience. This is consistent with evidence that exposure to scenic and nature-rich environments correlates with increased happiness and well-being [15,16,17,18].
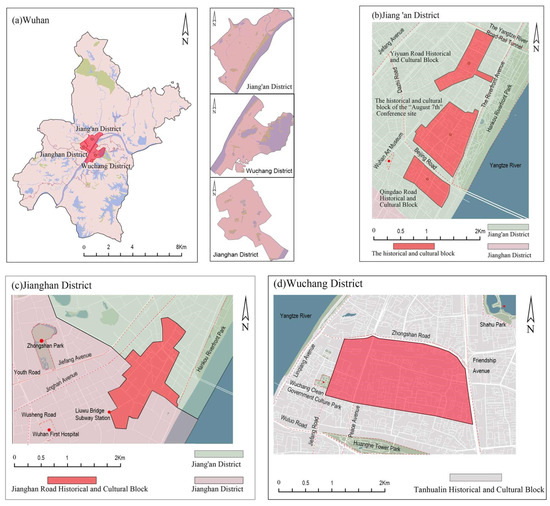
Figure 1.
(a) In Wuhan, China, the administrative regions where the five research areas are located; (b) The research area located in the Jiang’an District; (c) The research area located in the Jianghan District; (d) The research area located in the Wuchang District.
2.2. Research Framework
The research framework of this study consists of three main components (Figure 2). First, objective visual elements are extracted from street-view images. A U-Net–based semantic segmentation model is trained and adjusted (using Cityscape pre-training, multi-scale feature fusion, attention mechanisms and suppressive filtering of non-target categories), followed by spatial de-duplication, temporal clustering, semantic category labeling and spatial coordinate matching. This module outputs visual indices for natural elements, artificial elements and interference elements. Second, subjective evaluation data are collected through an image-based questionnaire survey. A Likert scale with a score range from −3 to +3 is used to develop coarse- and fine-grained evaluation indicators, which are implemented via an online mini-program. The resulting scenic beauty scores are processed through reliability analysis and score normalization to obtain stable measures of perceived landscape quality. Third, the objective and subjective datasets are integrated to construct the perception model. Segmentation performance is verified by comparing manual annotation and machine identification, after which visual indices are paired with scenic beauty scores for partial correlation analysis, Gray Statistical Analysis–based screening of final elements, regression modeling and SHAP visualization of sample scores. Together, these three modules link street-view imagery, visual element indices and public esthetic responses into a coherent workflow for analyzing how visual elements in historic districts influence perceived landscape quality.
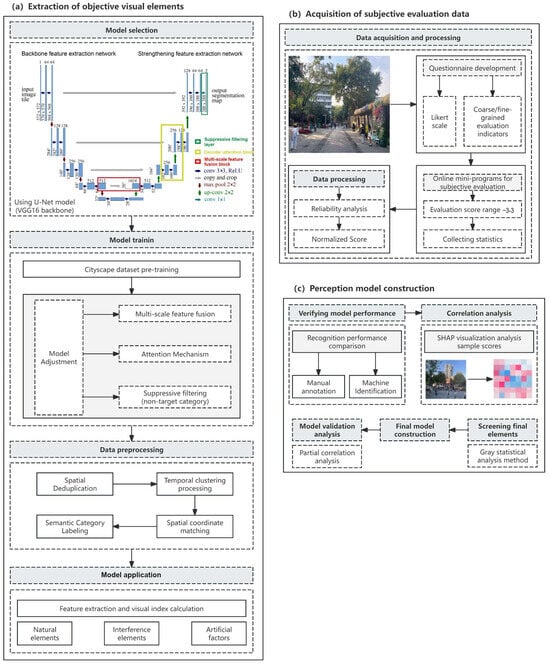
Figure 2.
Technical framework diagram.
2.3. Key Methods
This study adopts a multi-method approach to extract visual features, quantify public perception, and interpret the relationships between visual elements and perceived landscape quality in historical and cultural districts. The key techniques are outlined below:
(1) Semantic segmentation enables precise identification and extraction of visual elements in street-view images of historical and cultural districts (e.g., buildings, roads, vegetation, sky, water). These elements form the basis of the visual evaluation index system. Accurate extraction of such features provides insight into the structural and visual characteristics of the environment. Advances in deep learning have significantly improved semantic segmentation performance, making it widely applicable [48]. By classifying each pixel into a predefined category [49], semantic segmentation achieves higher accuracy in identifying street-level elements compared to traditional methods [50]. Models pretrained on datasets like Cityscapes can automatically recognize elements relevant to street-level imagery (such as vegetation, buildings, and sky). From these pixel-level classifications, we can calculate metrics like the Green View Index (GVI), yielding an accurate and efficient quantitative description of the environment’s composition.
(2) Scenic Beauty Estimation (SBE): In contrast to objective visual analysis, the Scenic Beauty Estimation method focuses on the public’s subjective perception of landscape quality. SBE remains one of the most widely used psychophysical approaches in landscape evaluation [51]. Originally proposed by Daniel and Boster [5], SBE uses standardized scoring and analytical procedures to translate individual esthetic judgments into quantifiable values. This approach effectively captures how different visual environments influence public esthetic preferences. SBE thus provides an overall esthetic rating for a scene and, when combined with other analyses, can indicate how individual landscape elements contribute to human esthetic responses [52,53]. In the context of historical and cultural districts, esthetic perceptions are shaped by diverse factors such as spatial ambiance, cultural symbolism, and personal memories, which are difficult to predict from any single physical variable. By integrating SBE with computational visual indicators, we bridge the gap between physical attributes and psychological responses, introducing a “public perspective” into data-driven urban landscape assessments. Recent studies have even leveraged deep learning to predict esthetic scores from images, but in our study we use actual survey-based SBE scores and further interpret them with SHAP to examine how each visual element contributes to perceived beauty.
(3) SHAP Visualization Analysis: SHAP (SHapley Additive Explanations) is an interpretability technique based on the Shapley value from cooperative game theory. It quantifies the average marginal contribution of each input feature (in our case, specific image-derived variables or even specific image regions) to the model’s output prediction. A positive SHAP value (typically shown in red) for a feature means that feature increases the model’s predicted scenic beauty score, whereas a negative SHAP value (blue) means the feature lowers the predicted score [54,55,56]. These fine-grained SHAP visualizations help interpret the model’s predictions by highlighting which elements of an image drive the scenic beauty assessment. They also provide targeted insights for design decision-making (e.g., indicating which visual elements could be altered to improve perceived beauty) and inform further model optimization.
(4) Gray Statistical Analysis (GSA): GSA was used to filter and prioritize the initial set of visual element variables. By calculating decision coefficients under high, medium, and low gray relational grades, GSA evaluates both the magnitude and the stability of each element’s contribution to perceived landscape quality [57]. This method helps eliminate features that might appear statistically significant in isolation but have inconsistent or negligible effects on perception, while retaining core indicators with a stable, strong impact. GSA is advantageous for small-sample or multi-source datasets and can accommodate incomplete information systems. It integrates qualitative and quantitative characteristics, making it suitable for the multi-source, multi-scale, and subjective data involved in evaluating historic landscape quality. In this study, GSA enabled us to filter out confounding factors that lacked robust practical relevance and to retain key indicators with high decision coefficients. This provided a solid foundation for constructing a reliable landscape quality model.
(5) Partial correlation analysis: Partial correlation measures the linear relationship between two variables while controlling for the influence of other variables. In our context, this technique helps identify valid linear associations among landscape features within a complex visual environment. Although our primary analysis focuses on capturing nonlinear effects, we employed partial correlation as a complementary step to check the robustness of relationships and to aid in interpreting interactions between variables [58].
2.4. Visual Elements Extraction
2.4.1. Multi-Dimensional Index System for Visual Elements
We established a multi-dimensional evaluation index system to quantitatively represent the street-level visual environment of the historic and cultural districts. The final index system (Table 1) includes a set of indicators derived from pixel proportions of various element categories in the images, reflecting natural elements, artificial elements, and interference elements present in each street view:
Natural elements: Represented by the pixel proportions of sky and vegetation in the image. (Note: Water bodies were initially considered, but water features were found to be very scarce in Wuhan’s historical and cultural districts. They were deemed negligible and excluded from the analysis. Thus, natural elements are ultimately captured by the Sky Visibility Index and Green View Index).
Artificial elements: Represented by the pixel proportions of buildings, sidewalks, pedestrians, and fences. Buildings and sidewalks characterize the built environment context [59]. Human presence (People Visibility Index) is included due to our innate tendency to respond to other humans in an environment; higher pedestrian presence can signal vitality and stimulate exploration [60]. In line with the biophilia hypothesis, the presence of people indirectly conveys a sense of vitality and fosters place attachment. Fences (particularly their style and prevalence) are included as they delineate space and can influence the visual continuity of the historic streetscape [61].
Interference elements: Represented by the pixel proportions of traffic-related features such as traffic signs, traffic lights, road pavement, and vehicles (including cars, buses, and motorcycles) present in the image. These elements are generally considered detractors in a historical context—excessive traffic infrastructure and vehicles can disrupt the historic ambiance.
is the total number of pixels in image I, is the total number of vegetation pixels in image i, is the total number of sky pixels in image i, is the total number of building pixels in image i, is the total number of sidewalk pixels in image i, is the total number of person pixels in image i, is the total number of fence pixels in image i, is the total number of traffic sign pixels in image i, is the total number of traffic light pixels in image i, is the total number of roadway pixels in the image, is the total number of car pixels in image i, is the total number of bus pixels in image i, and is the total number of motorcycle pixels in the image.

Table 1.
Evaluation index system of visual elements of historic and cultural block landscape.
Table 1.
Evaluation index system of visual elements of historic and cultural block landscape.
| Dimension | Parameter | Parameter Description | Parameter Equation |
|---|---|---|---|
| Natural elements | Green Visibility Index (GVI) | The proportion of vegetation pixels in the image | |
| Sky Visibility Index (SVI) | The proportion of sky pixels in the image | ||
| Artificial elements | Building Visibility Index (BVI) | The proportion of building pixels in the image | |
| Road Visibility Index (RVI) | The proportion of footpath pixels in the image | ||
| People Visibility Index (PVI) | The proportion of people pixels in the image | ||
| Fence Visibility Index (FVI) | The proportion of fence pixels in the image | ||
| Interference elements | Traffic Equipment Visibility Index (TEVI) | The proportion of traffic equipment (traffic signs and traffic lights) pixels in the image | |
| Lane Visibility Index (LVI) | The proportion of lane pixels in the image | ||
| Vehicle Visibility Index (VVI) | The proportion of vehicle (cars, buses and motorcycles) pixels in the image |
Each index is defined as the proportion of the image’s pixels belonging to that category. For example, the Green View Index (GVI) is the proportion of vegetation pixels in the image, and the Sky Visibility Index (SVI) is the proportion of sky pixels. Similarly, we define Building Visibility Index (BVI), Road (sidewalk) Visibility Index (RVI), People Visibility Index (PVI), Fence Visibility Index (FVI), Traffic Equipment Visibility Index (TEVI), Lane Visibility Index (LVI), and Vehicle Visibility Index (VVI) as the proportions of pixels corresponding to buildings, sidewalks, people, fences, traffic signs/lights, road surface, and vehicles, respectively. Table 1 summarizes these visual element indicators and their formulation.
In addition to these visibility-based indices, some landscape perception studies have employed aggregate measures of “visual complexity” to represent overall scene intricacy or heterogeneity. In this study, we do not introduce a separate complexity indicator as an explicit modeling variable. First, many aspects of visual complexity—such as variation in form, texture, and object diversity—are already implicitly reflected in the combined configuration of our pixel-based indices (e.g., the joint proportions of sky, vegetation, buildings, pedestrians, and traffic elements). Second, adding an additional composite complexity metric that overlaps conceptually with these indicators could introduce redundancy and multicollinearity, thereby obscuring the specific contributions of individual elements. For the sake of model parsimony and interpretability, we therefore focus on this concise set of well-defined visibility indicators rather than an additional aggregate complexity index.
To ensure these seemingly generic streetscape indices are interpreted in a heritage-sensitive way, we emphasize two points. First, this index set is applied specifically to five officially designated historic neighborhoods in Wuhan, each of which retains a distinct historical fabric and cultural significance. By situating the analysis in these heritage contexts, the pixel-based indicators take on culturally specific meanings. Second, each index is interpreted in light of the historic character of the environment rather than as a purely generic urban metric, as outlined below:
GVI: Visibility of vegetation, particularly historically significant greenery such as old street trees and traditional courtyard plants that contribute to local memory; SVI: Degree of openness of the streetscape (the extent of sky visible), which can distinguish narrow traditional alleys (low SVI) from broader open squares or boulevards (high SVI); BVI: Visual prominence of building facades, highlighting well-preserved historic architecture in the streetscape; RVI: Proportion of the view occupied by pedestrian pathways, reflecting the pedestrian-oriented nature and traditional street layout (e.g., narrow lanes for slow traffic) of the historic area; PVI: Presence of people in the scene, indicating street vitality and social activity. A higher PVI suggests a lively atmosphere, which can enhance the cultural ambiance and sense of place; FVI: Prevalence of fences or boundary walls. This helps distinguish historically appropriate boundary elements (like stone walls or decorative railings in traditional styles) from intrusive modern fencing, affecting the visual continuity of the historic scene; TEVI: Presence of traffic signs and lights. These are considered intrusion elements in a historic setting; a high TEVI might signal visual clutter that detracts from the heritage atmosphere; LVI: Extent of roadway surface visible. In pedestrian-centric historical and cultural blocks, a lower LVI is expected, whereas a high LVI could indicate wide roads or parking areas that are less in harmony with a historic pedestrian environment; VVI: Presence of vehicles (cars, buses, motorcycles). Vehicles are treated as a negative factor for historic ambiance—the more vehicles dominate the view, the more the historical sense of place may be weakened.
2.4.2. Data Acquisition and Processing
When applying deep learning methods to study landscape quality perception, the acquisition and preprocessing of image data are crucial to ensure effective model training and reliable results. While it is theoretically possible to use street-view imagery from mainstream map service providers, in practice we found limitations in their coverage and resolution for the historical and cultural districts. The narrow streets, complex spatial structures, unique architectural styles, and rich cultural atmosphere of these districts often lead to image distortions or gaps in standard street-view coverage.
To address these issues, we supplemented available online street-view images with manually captured photographs. All photos were taken under consistent conditions: using the same camera equipment and settings at approximately pedestrian eye level (~1.6 m height), during similar daytime hours (between 9:00 a.m. and 11:00 a.m.), and under clear or lightly cloudy weather conditions. By standardizing the shooting conditions, we ensured the images are comparable in lighting and perspective. One potential concern is that a single photograph provides only a fragment of the streetscape. To capture a more complete picture of each district, images were collected systematically at fixed spatial intervals along every street. This approach yielded a large, continuous sequence of street-view images, helping to capture the overall visual characteristics of the historical and cultural districts rather than isolated or biased scenes. It also mirrors the way pedestrians experience the environment through a sequence of visual frames, thereby better reflecting the true pedestrian perspective of the cultural ambiance.
For the subsequent landscape quality evaluation, we collected public perceptual data and applied score normalization techniques. In raw form, individuals’ ratings of landscape beauty can vary widely due to differences in personal esthetic preferences, cultural background, and scoring habits [62]. To make the subjective scores comparable, we standardized all ratings using Z-score normalization [63]. This transformation places all respondents’ ratings on a common scale (mean 0, standard deviation 1), reducing biases introduced by individuals using the rating scale differently (for example, some people tending to use only the upper end of the scale while others use the full range). The formula for this Z-score standardization is:
is the standardized landscape beauty score of the jth judge for the i-th photo; is the landscape beauty score of the jth judge for the ith photo; is the average landscape beauty score of all photos by the jth judge; is the standard deviation of the landscape beauty score of all photos by the jth judge.
While Z-score normalization aligns the rating scales, it does not entirely remove individual subjective bias. Therefore, after this normalization, we aggregated the multiple ratings for each image to obtain a single consensus score per image. We used the median of all standardized scores for a given image as its final Scenic Beauty score. Using the median (as opposed to the mean) is a robust aggregation choice that reduces the influence of any extreme judgments and better represents a consensus view [64]. Additionally, any respondents who exhibited erratic scoring behavior (identified as outliers through statistical checks, described later) were removed from the dataset before final aggregation. This two-step procedure—score normalization followed by consensus-based aggregation (with outlier exclusion)—ensured that the final scenic beauty scores for the images reliably reflect collective perceptual tendencies. These standardized consensus beauty scores were then ready to be paired with the pixel-level visual element indices for analysis in our modeling framework [65].
2.4.3. Semantic Segmentation Model Training
Following data preparation, we carried out semantic segmentation experiments on the street-view image dataset (incorporating both the crawled images and the supplementary photographs) to extract the pixel-level distributions of the various landscape elements. This step provided the quantitative measures of visual composition needed for the landscape quality evaluation. We chose a U-Net convolutional neural network with a VGG16 backbone as our segmentation model, given its proven high pixel-wise accuracy and fast inference speed in urban street-view segmentation tasks. The U-Net’s encoder–decoder architecture is well-suited for capturing both low-level and high-level features in images, and it is amenable to transfer learning and fine-tuning, which was advantageous for our purposes [66].
The model’s performance on our test set is summarized in Table 2. The baseline U-Net model (with VGG16 encoder) achieved a pixel accuracy (PA) of 82.38%, meaning over 82% of all pixels were correctly classified. The Recall (sensitivity) was 73.24%, and Precision was 71.02%. The harmonic mean of these (F1-score) was 72.04%. Intersection over Union (IoU), a stricter metric that measures overlap between the predicted segmentation and ground truth, reached 74.33%. These results indicate a well-balanced overall performance, suggesting the model is reliably extracting semantic features from the complex scenes in the districts.
Table 2.
Performance indicators of the U-Net model based on the VGG16 backbone on the test set.
We noted that pretraining the model on a large benchmark like Cityscapes can typically yield higher pixel accuracy (often above 85%). However, our historical district scenes contain complex spatial features—for example, densely interwoven vegetation and architectural details—that can challenge segmentation accuracy. To improve the model’s performance on our specific dataset, we fine-tuned the U-Net by incorporating a multi-scale feature fusion block, decoder attention blocks, and a suppressive filtering layer into the architecture. As shown in Figure 2, the multi-scale feature fusion block is implemented at the bottleneck stage between the deepest encoder block and the first decoder block, decoder attention blocks are attached to selected decoder stages to re-weight salient façades, vegetation and pedestrians, and the suppressive filtering layer is applied at the final prediction head before outputting the segmentation map. Table 3 reports the performance after these optimizations. After fine-tuning, the U-Net’s pixel accuracy improved to 84.61%. Recall increased to 76.17% and Precision to 73.59%, yielding an F1-score of 74.85%. The IoU also rose to 76.68%. In addition to these quantitative improvements, the optimized model produced qualitatively cleaner segmentation maps: it was better at correctly recognizing small or obstructed elements and at ignoring irrelevant background pixels. In practical terms, the fine-tuned model more accurately identified all 12 target element categories in the street images and reduced misclassifications by filtering out noise and low-confidence regions. As shown in Figure 3, the modified U-Net converges to a lower validation loss than the baseline model and maintains a small gap between training and validation losses, indicating improved convergence without obvious overfitting.
Table 3.
Performance of the optimized model.
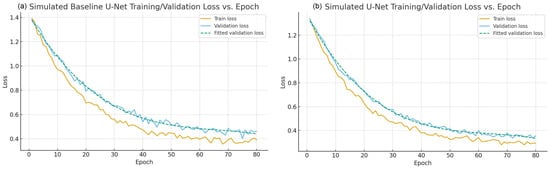
Figure 3.
(a) Training and validation loss of the baseline U-Net; (b) Training and validation loss of the modified U-Net.
2.5. Subjective Scenic Beauty Evaluation
This study also conducted an image-based questionnaire survey to gather public evaluations of the street scenes, which served as the subjective component of our landscape quality analysis. In this survey, participants provided their preferences and perceptions for a subset of the street-view images, and we processed the responses to derive a robust Scenic Beauty Degree score for each image [67]. The procedure for the subjective evaluation involved several steps, as detailed below:
Data assignment and preprocessing: Given the large number of images (3013 in total), we employed a random assignment strategy to ensure no single participant was overwhelmed. Each respondent rated 10 images, which were randomly drawn from the full image set. The random selection was stratified by districts so that each of the five historical and cultural districts was proportionally represented in every respondent’s image bundle. We recruited participants through various online channels (such as student group chats, community WeChat groups, and local social networks) and aimed for a diverse sample in terms of age, occupation, and background. Before beginning the survey, respondents provided basic demographic information (age, gender, occupation, and place of residence) to allow us to characterize the sample and ensure it was reasonably balanced. For each image shown, participants were asked to rate three aspects: its esthetic appeal, comfort, and historical ambiance. Ratings were given on a seven-point Likert scale ranging from –3 (“extremely dislike”) to +3 (“extremely like”). We limited each participant to 10 images to minimize fatigue, and any participant who did not finish all their assigned ratings was excluded from the dataset. Once the responses were collected, we performed data cleaning: any incomplete responses or instances where a participant skipped an image were removed. Then, as described earlier, we standardized each participant’s scores Via Z-score normalization to control for individual differences in scoring range and use of the scale.
Quality control: We incorporated multiple quality control measures to ensure the reliability of the survey data. First, an attention-check question was embedded in the questionnaire (for example, asking the respondent to select a specific option for that question to confirm they were reading instructions); responses failing this check were discarded. Second, we monitored the time each participant took to complete the survey [68]. If a response was completed in an unreasonably short time (less than one-third of the median completion time), we considered it invalid due to the high likelihood of random or superficial answering, and such cases were removed. We also checked for straight-lining behavior—if a respondent gave the exact same rating for all images (e.g., all zeros or all threes), their data was flagged as inattentive and excluded. Third, we evaluated the consistency of each respondent’s ratings relative to the overall trends. We calculated the correlation between each individual’s rating vector (across the 10 images they evaluated) and the median rating vector of all respondents for those same images. Participants with a very low correlation (Pearson’s r < 0.20) to the group consensus were deemed outliers in terms of preference pattern and were removed from the final dataset. These quality control steps helped filter out inattentive or non-representative respondents, thereby improving the reliability of the collected preference data.
Reliability testing and score aggregation: After cleaning the data, we assessed the internal consistency of the survey responses using Cronbach’s α. This analysis confirmed that the ratings across the three evaluated dimensions (esthetics, comfort, historic ambiance) were highly consistent, suggesting that respondents who rated an image favorably in one dimension tended to do so in the others as well. Given this consistency, and because our primary interest is in overall scenic quality, we proceeded to aggregate the results into a single score per image. For each image, we already had multiple standardized ratings (from different people). We computed the final Scenic Beauty score for that image as the median of all its standardized ratings. The median was chosen because it is robust to outliers and it captures the central tendency of public opinion even if a few ratings are unusually high or low. Thus, each of the 3013 images obtained a final SBD score representing a consensus public esthetic evaluation, on a standardized scale. (For interpretation, a higher SBD score indicates a more positively perceived streetscape).
Expert validation: To ensure that the public’s consensus ratings were reasonable and to add an extra layer of validation, we conducted a follow-up evaluation with a panel of experts. We invited eight experts in relevant fields (including landscape architecture, heritage conservation, and urban design) to independently rate a stratified random sample of the street-view images. This expert sample covered images from each district and spanned the range of SBD scores. We then compared the experts’ ratings with the general public’s median ratings for the same images. Using nonparametric statistical tests and effect size measures, we checked for significant discrepancies between expert and public evaluations. We found that, for the vast majority of images, the expert ratings were in line with the public’s perception (no significant differences, p > 0.05). A few images showed some divergence—experts sometimes gave slightly higher importance to historical ambiance details that the general public might have overlooked, for instance. Those cases were flagged for sensitivity analysis. In our results, we note any instances where expert opinion differed markedly from public perception and discuss potential reasons. Overall, the inclusion of expert validation helped confirm that the crowd-sourced scenic beauty assessments were credible and provided confidence that the consensus SBD scores could be used as a reliable dependent variable in our subsequent analysis.
3. Results
3.1. Quantitative Results of Landscape Elements
We used a semantic segmentation model to automatically identify and quantify visual elements in each street-view image, following the index system in Table 1, Figure 4 provides a side-by-side comparison of an original street scene and the U-Net segmentation output, illustrating how elements such as buildings, vegetation, sky, and roads are recognized and labeled. When evaluating the extraction’s reliability, we found that most recognition errors involved natural elements, especially in differentiating vegetation from sky in challenging scenes. For instance, the model occasionally misclassified patches of sky visible through overhanging tree branches as vegetation, leading to slightly blurred boundaries between these classes. Such errors are understandable given the fine-grained intermixing of foliage and sky in tree canopies, but quantifying them was necessary to assess the model’s accuracy.
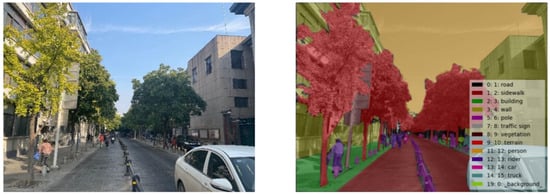
Figure 4.
Comparison of Street Scene Images and Semantic Segmentation Results.
To rigorously assess the U-Net’s segmentation accuracy for key elements, we performed an Intersection over Union (IoU) analysis on seven representative street-view images. These images were selected to cover the full range of landscape quality observed in our dataset, corresponding to scenic beauty ratings from −3 (very poor visual quality) to +3 (very good visual quality) on a Likert scale. For each image, we generated manual ground-truth segmentations for the critical natural elements (vegetation and sky) and compared them with the model’s output. Table 4 summarizes the vegetation results and Table 5 the sky results, including the proportion of pixels identified and the corresponding IoU for each case.
Table 4.
Comparison of the Recognition Effects of Vegetation Elements in Historical and Cultural Districts by U-Net and Manual Methods.
Table 5.
Comparison of the Recognition Effects of Sky Elements in Historical and Cultural Districts by U-Net and Manual Methods.
As shown in Table 4, vegetation IoU in the sampled images ranged from 80.31% in the most challenging scene (dense foliage with a complex background) to 98.79% in the clearest case. Most images yielded vegetation IoU values in the mid- to high-90% range, reflecting excellent agreement between the U-Net output and the manual annotations. For sky, Table 5 shows IoU values between 96.67% and 99.85% across the test images, demonstrating extremely high accuracy in identifying sky regions. Overall, these results confirm that the semantic segmentation model performs with high accuracy for the key visual elements in historical and cultural district scenes. This strong performance (typically IoU > 95% for sky and mid-90s for vegetation) increases confidence that the extracted visual element proportions (e.g., GVI and SVI) are reliable for subsequent analyses related to scenic beauty perceptions.
3.2. Visual Characteristics at Different Scenic Beauty Levels
To capture variations in perceived landscape beauty across the study sites while preserving the full resolution of respondents’ judgments, we retained the original seven-point standardized SBE scale (−3 to +3) and implemented an objective, reproducible procedure to select representative images for each score bin. For each bin we (1) identified all images whose standardized SBE scores fell within the bin, (2) computed two image-level metrics—absolute deviation from the bin median (proximity) and inter-rater variability (standard deviation of raw ratings)—and (3) ranked candidates by a combined metric that jointly rewards closeness to the bin central tendency and high inter-rater agreement; the top-ranked image was chosen as the primary exemplar. To ensure that the fine-grained seven-level grouping did not produce spurious distinctions, we conducted robustness checks by reporting sample sizes per bin, testing differences across bins with nonparametric methods, and collapsing the seven levels into three broad categories (negative/neutral/positive) to re-run the principal analyses. The substantive findings reported are robust to this aggregation. Collectively, these procedures render the representative-image selection transparent, statistically grounded, and reproducible, while retaining the interpretive detail necessary to detect nonlinear and threshold effects in esthetic perception.
In low-rated samples (−3 to −2; Figure 5 and Figure 6), traffic signs and vehicles exert a strong negative influence on perceived landscape quality. High densities of traffic signs and vehicles tend to attract excessive visual attention (as indicated by red regions in SHAP), increase clutter, and diminish overall esthetic appeal. In these samples, red-highlighted regions—primarily traffic signs and vehicles—are key contributors to lower beauty ratings.
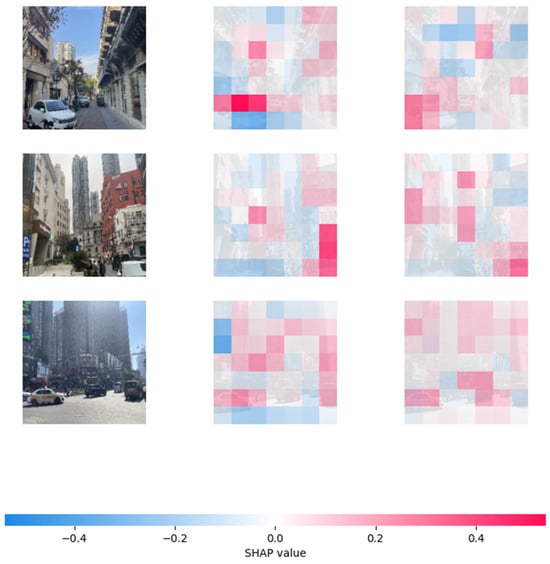
Figure 5.
Typical example of a beauty rating score of −3.
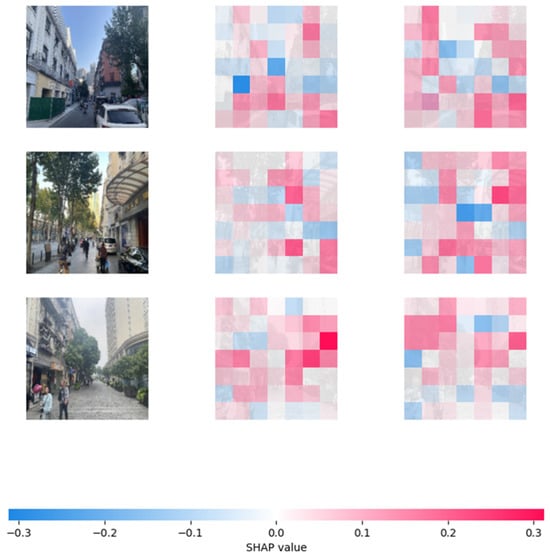
Figure 6.
Typical example of a beauty rating score of −2.
In medium-rated images (−1 to 1; Figure 7, Figure 8 and Figure 9), the inhibitory effect of interference elements such as traffic signs is less pronounced. Meanwhile, natural elements such as vegetation exhibit a more prominent positive influence on esthetic perception. This suggests that in less cluttered environments, enhancing the visibility of natural features improves overall landscape esthetics.
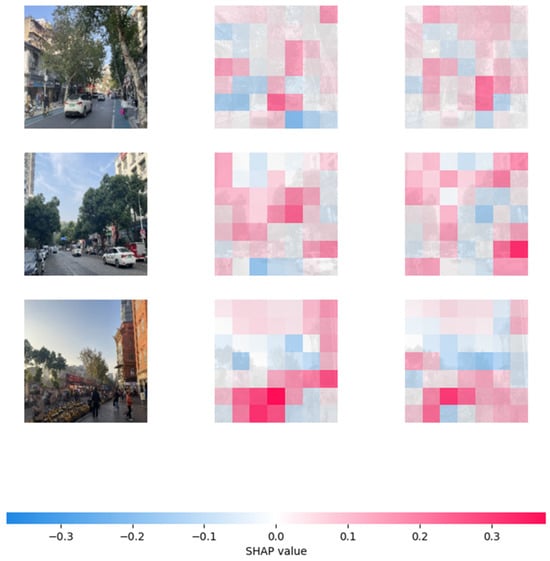
Figure 7.
Typical example of a beauty rating score of −1.
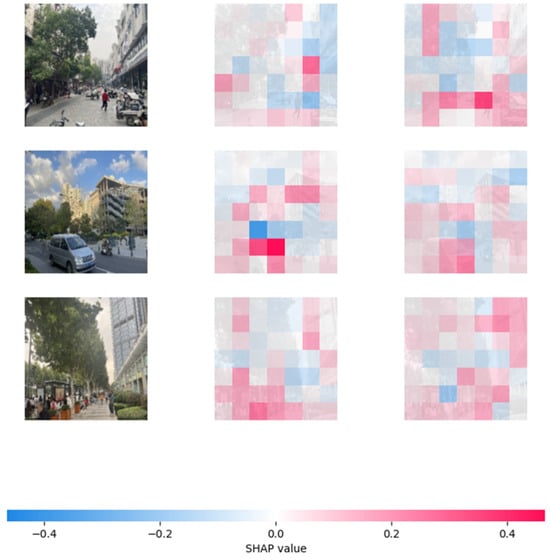
Figure 8.
Typical example of a beauty rating score of 0.
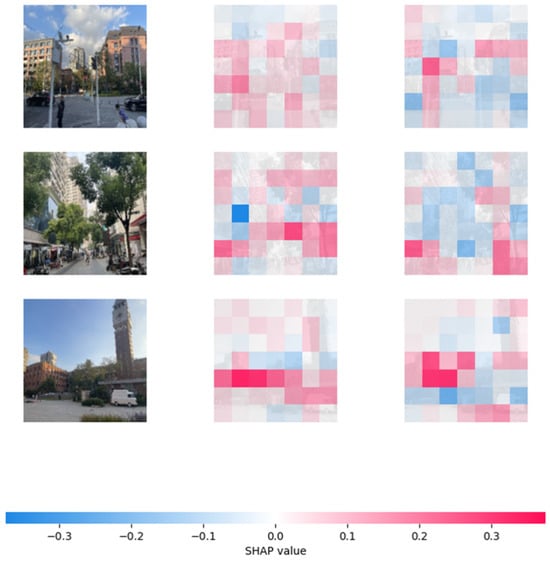
Figure 9.
Typical example of a beauty rating score of 1.
High-scoring samples (2 to 3; Figure 10 and Figure 11) typically lacked interference elements, while vegetation dominated the visual composition and showed a strong positive correlation with beauty ratings. This indicates that abundant natural elements, especially vegetation, play a vital role in enhancing the landscape quality of historical and cultural districts.
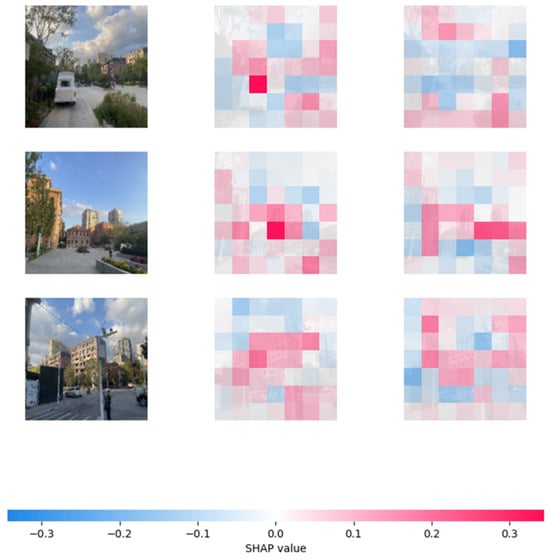
Figure 10.
Typical example of a beauty rating score of 2.
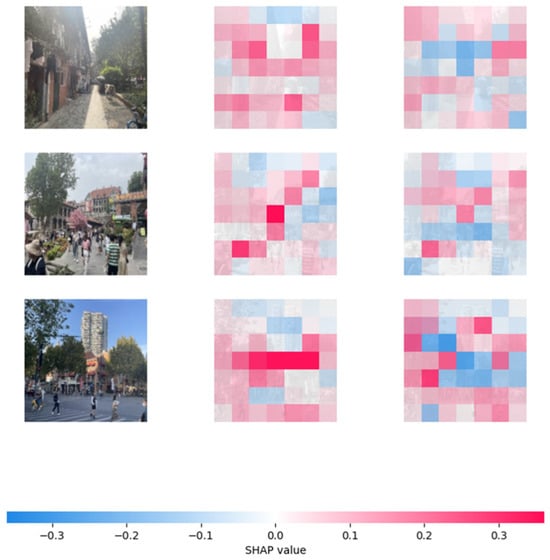
Figure 11.
Typical example of a beauty rating score of 3.
3.3. Effects of Visual Elements on Perceived Scenic Beauty
The following subsection investigates the relationships between natural, artificial, and interference elements and their impact on Scenic Beauty Degree (SBD) scores. As shown in Figure 12, green view index (GVI) exhibits a significant positive linear relationship with SBD scores (β ≈ 0.08, R2 = 0.64, p < 0.001), suggesting that an increase in green view coverage significantly enhances perceived landscape beauty. In contrast, the relationship between sky visibility index (SVI) and SBD scores follows an inverted U-shaped curve, with peak esthetic perception occurring around 25% SVI. Both excessive and insufficient sky exposure negatively affect the beauty rating. This model yielded an R2 of 0.70 (p < 0.001), underscoring the critical moderating role of sky openness in landscape perception.
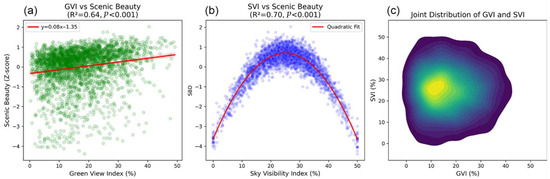
Figure 12.
(a) Correlation analysis between GVI and SBD; (b) Correlation analysis between SVI and SBD; (c) Joint distribution of GVI and SVI based on kernel density estimation.
Furthermore, Figure 12c presents the joint distribution of GVI and SVI based on kernel density estimation (KDE), revealing their distributional patterns across all samples. The data exhibit a clear clustering pattern in both dimensions, suggesting a non-random, structured distribution of natural elements within the blocks. This visualization not only supports the univariate regression findings, but also implies a potential interaction between GVI and SVI, reinforcing the notion that natural elements jointly influence esthetic perception in a compounded manner. Collectively, these results demonstrate that natural elements are pivotal to enhancing subjective esthetic evaluations in historical and cultural districts’ landscapes.
Interference elements, including vehicle visibility index (VVI), traffic equipment visibility index (TEVI), and lane visibility index (LVI), are presented in Figure 13. VVI shows a significant negative linear correlation with SBD scores (R2 = 0.58, p < 0.001), indicating that higher vehicle presence substantially degrades perceived landscape beauty (Figure 13a). Similarly, TEVI also exhibits a negative linear association with SBD (Figure 13b), with increasing traffic equipment visibility linked to reduced esthetic ratings. The model’s explanatory power is relatively low (R2 = 0.13, p < 0.001), indicating a weaker—yet still significant—negative contribution of traffic infrastructure to landscape perception. However, its impact is weaker than that of VVI. As illustrated in Figure 13c, the contribution of LVI to reduced SBD is minimal.
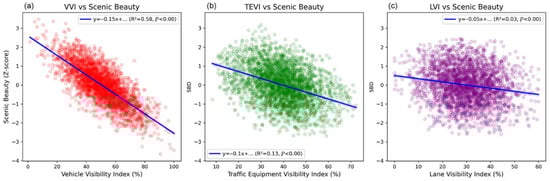
Figure 13.
(a) Correlation analysis between VVI and SBD; (b) Correlation analysis between TEVI and SBD; (c) Correlation analysis between LVI and SBD.
Nevertheless, compared with key natural and building-related indices, the explanatory power of VVI is still moderate and highly contingent on short-term traffic management conditions. As discussed in Section 3.4, the subsequent global sensitivity analysis does not identify VVI as a core determinant of perceived scenic beauty at the block scale, and it is therefore not retained in the final parsimonious model.
Figure 14 illustrates the relationship between artificial landscape elements and Scenic Beauty Degree (SBD). Overall, building visibility index (BVI) and pedestrian visibility index (PVI) exhibit a strong quadratic (inverted U-shaped) relationship with SBD, whereas road visibility index (RVI) and fence visibility index (FVI) demonstrate primarily linear trends. In the BVI–SBD subplot, the beauty score peaks when BVI approaches 40%, suggesting that a moderate level of building density—when stylistically aligned with the historical context—significantly enhances esthetic perception. Outside this optimal range, SBD declines sharply. This relationship is well supported by the regression fit (R2 = 0.84), highlighting BVI’s strong explanatory power for esthetic evaluations in historical and cultural districts’ landscapes. The rationale behind the inverted U-shaped relationship is twofold. First, historical or architecturally distinctive buildings often feature symbolic elements—such as traditional carvings or sloped roofs—that convey cultural identity and a strong sense of place. Additionally, the blocks with consistent architectural styles and harmonious color schemes reinforce visual order and elevate esthetic appeal. Consequently, built structures in historical and cultural districts tend to have a positive correlation with perceived beauty. However, excessive commercialization can introduce architectural elements that conflict with historical styles. When building coverage exceeds 40%, a heightened sense of spatial oppression may occur, leading to negative psychological effects—a phenomenon known as the “threshold effect.” In addition, large structures can disrupt skyline continuity and degrade visual harmony. In the PVI–SBD subplot, the model fit is also high (R2 = 0.79), indicating that pedestrian activity significantly influences landscape perception in historical and cultural districts. However, the data suggest a similar “optimal threshold” pattern. Optimal visual experience is achieved when PVI is approximately 20%. Values that are too low or too high may cause the space to feel either “empty” or “overcrowded,” both of which reduce the perceived esthetic value.
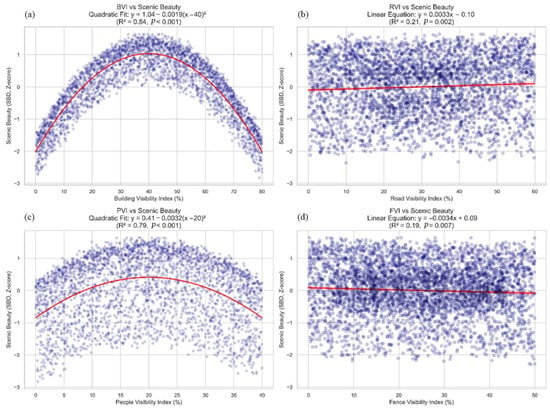
Figure 14.
(a) Correlation analysis between BVI and SBD; (b) Correlation analysis between RVI and SBD; (c) Correlation analysis between PVI and SBD; (d) Correlation analysis between FVI and SBD.
Both the road visibility index (RVI) and fence visibility index (FVI) exhibit weak linear correlations with the Scenic Beauty Degree (SBD), as indicated by their low model fit. This suggests that their explanatory power for landscape esthetics is limited, serving more as auxiliary variables. The weak positive correlation between RVI and SBD may be attributed to the harmonious integration of pedestrian walkways within the design of most historical and cultural districts in Wuhan. Walkways constructed with traditional materials may enhance both accessibility and visual appeal, particularly when complemented by adjacent vegetation. However, due to the low explanatory power of this variable, it suggests that while walkway design is important, it has limited influence on overall esthetic perception when considered in isolation. Synergistic interactions with other elements are necessary to significantly enhance the landscape experience. The FVI displays a weak negative linear correlation with SBD (R2 = 0.19), indicating that fences—acting as visual interference—have a modest adverse impact on perceived landscape beauty, though their overall explanatory power remains limited. This implies that although fences may disrupt visual coherence and diminish spatial permeability, their isolated influence is insufficient to substantially alter the perception of scenic beauty.
Each of the five historic districts also exhibits a distinctive visual and spatial profile that is closely tied to its historic fabric and functional role. In most cases, the internal streets are narrow, enclosed corridors framed by continuous building façades, which naturally leads to relatively low sky visibility (SVI) and high building visibility (BVI). Greenery in the sampled scenes is dominated by street trees and small-scale planting along building fronts or sidewalks, rather than large continuous green belts, which is consistent with the moderate yet spatially varied GVI levels observed in the data. Differences in PVI, TEVI, LVI and VVI further mirror each district’s current use and management status: for example, streets with stronger commercial and tourism functions tend to show higher pedestrian presence and more traffic-related elements, whereas relatively residential or community-oriented segments remain less visually disturbed by vehicles and signage. These patterns indicate that the observed heterogeneity in visual indices and perception scores is not merely numerical, but reflects the unique spatial texture, heritage morphology and use intensity characteristic of historic cultural districts.
3.4. Selection of Visual Elements for Model Construction
This study employed the GSA method to evaluate and screen nine preliminary landscape elements in the historical and cultural districts of Wuhan. Five elements with “medium” importance—RVI, FVI, TEVI, LVI, VVI—were excluded. The four remaining elements with “high” importance—SVI, GVI, BVI, PVI—were retained for constructing the landscape quality perception model (Table 6).
Table 6.
Screening Results of the Importance of Visual Elements in the Districts Based on GSA.
Unlike traditional regression analysis, which focuses primarily on goodness-of-fit with the dependent variable, the GSA procedure considers not only statistical significance, but also each indicator’s contribution across different gray levels, its stability, redundancy with other variables and its practical controllability in real-world block management. As shown in Table 6, for example, VVI yields a relatively high R2 value in the univariate regression (0.58), but its decision coefficient in the high gray level (4.33) is much lower than that of SVI (13.00) and GVI (12.67). At the same time, VVI shows higher redundancy with other interference-related indices and greater temporal volatility, which weakens its comprehensive weight in the GSA framework. From a planning perspective, vehicle visibility is also less directly controllable than building form or greenery configuration. Given the aim of developing a parsimonious and robust perception model based on a small set of key, stable and actionable visual elements, VVI was therefore not included in the final set of core predictors, despite its statistically significant negative association with SBD.
Certain elements, such as vehicle visibility (VVI), exhibit a statistically significant negative correlation with the SBD score (e.g., p < 0.001). However, the gray statistical analysis (GSA) method considers not only statistical significance, but also each element’s contribution to overall landscape quality, its stability, and practical applicability in real block scenarios. Although VVI demonstrates a significant negative effect in the SBD score and gray correlation calculations, its overall correlation weight in the comprehensive evaluation system is low. This suggests that, under the influence of multiple interacting factors, the relative importance of vehicles in enhancing or maintaining the landscape quality of the blocks is limited compared to buildings and natural elements. In summary, while VVI is statistically significant, its limited contribution and low consistency in the overall assessment led to its exclusion from the final set of key evaluation indicators.
It is therefore important to clarify how the final perception model should be interpreted. In this study, the model is intentionally specified as a parsimonious representation of the dominant, structurally and managerially actionable visual elements (SVI, GVI, BVI and PVI), rather than as an exhaustive account of all potentially detrimental factors. Interfering elements such as vehicles, traffic equipment and lane markings are still recognized as having negative associations with SBD in the preceding analyses (Section 3.3), but given their lower GSA weights and more limited direct controllability in heritage-sensitive renewal projects, they are treated as contextual disturbance rather than core predictors in the present modeling framework.
3.5. Establish a Perception Model
Building upon the gray statistical analysis results, this study constructed a perception-based model to examine the nonlinear influence of visual elements on landscape beauty evaluations in historical and cultural districts. Four key visual elements—sky visibility (X1), green vegetation visibility (X2), building visibility (X3), and pedestrian visibility (X4)—were retained and quantitatively encoded (Table 7).
Table 7.
Quantitative Assignment of Landscape Elements Based on Gray-scale Analysis.
The perception model was developed to reflect the hypothesized nonlinear interactions between visual landscape components and human esthetic perception. Partial correlation analyses confirmed that each of the four visual elements significantly contributed to perceptual outcomes. The resulting model equation is as follows:
Specifically, X1 exhibited an inverted U-shaped association with beauty scores, suggesting that both excessively low and excessively high sky exposure may reduce perceived quality—highlighting a nonlinear optimal threshold. X2 maintained a consistently positive and significant correlation with beauty scores across all operations, underscoring its stable esthetic value. In contrast, both X3 and X4 demonstrated weak to moderate inverted U-shaped trends. While their overall contributions were statistically significant (Table 8 and Table 9), their influence fluctuated under different controls, indicating possible synergistic or interaction effects when natural and artificial elements co-occur.
Table 8.
Results of the Fourth Partial Correlation Analysis of Visual Elements.
Table 9.
Regression coefficients and statistics of the model.
The results reinforce the value of employing a deep learning-driven perception model in historical and cultural districts’ research. The model effectively captures complex nonlinear patterns in how specific visual features affect esthetic perceptions, which may be obscured under traditional linear approaches.
3.6. Comparison and Analysis of Perception Models
This study quantitatively analyzed the key visual elements influencing the landscape quality of historical and cultural districts and developed an evaluation model integrating landscape quality and perception using partial correlation. Based on the four primary visual elements identified through gray statistical analysis, a landscape beauty evaluation model was further established using multiple linear regression. Table 7 presents four partial correlation analyses: (1) simple regression without control variables, (2) cross-category control, (3) same-category control, and (4) full model control.
To assess the methodological advancement and reliability of the proposed deep learning–driven nonlinear regression perception model, this study conducted a comparative analysis with five representative models from existing literature: the Structural Equation Model (SEM), Partial Least Squares Structural Equation Model (PLS-SEM), POI-GIS spatial analysis model, traditional linear regression, and the emerging landscape-sensing coupling model. The comparison focused on three dimensions—explanatory power (R2), capacity to capture complex relationships, and technical innovation—as detailed below:
(1) Explanatory Power (R2): The model proposed in this study achieved an R2 value of 0.609 (p < 0.001), which is significantly higher than that of mainstream linear models and several structural equation models. For instance, the traditional linear regression model [69] generally yields R2 values below 0.45, largely due to its inability to account for threshold effects between variables. SEMs, though capable of modeling latent variable relationships, typically show R2 values ranging from 0.50 to 0.55 and exhibit limited predictive power for manifest variables [70]. While the PLS-SEM reached an R2 of 0.67 in the study of ancient Huizhou village revitalization [71], it relies heavily on subjective questionnaire data and does not incorporate objective street view indicators. The key advantage of the present model lies in its ability to precisely identify optimal thresholds for both natural and artificial elements (e.g., SVI ≈ 25%, BVI ≈ 41%), thereby substantially enhancing the model’s explanatory power for scenic beauty degree (SBD).
(2) Ability to Capture Complex Relationships: Most existing models assume linear or simple path-based relationships between landscape visual elements and esthetic perception, limiting their ability to detect interaction or moderation effects. For instance, although the POI-GIS spatial model can locate commercial activity hotspots, it fails to establish a quantitative link between POI density and landscape quality [69]. SEM multi-group analysis [72] distinguishes perceptual differences between residents and tourists but does not reveal inflection points in satisfaction caused by variations in building density. The “landscape-sense” coupling model integrates eye tracking and machine learning but lacks the capability to identify optimal thresholds of key visual elements [73].
The key innovation of this model lies in its integration of SHAP-based interpretability analysis (Figure 5, Figure 6, Figure 7, Figure 8, Figure 9, Figure 10 and Figure 11), which verifies the consistent negative influence of interference elements (e.g., VVI, TEVI) and quantitatively identifies nonlinear effects among natural (GVI: positive linear) and artificial factors (BVI/PVI: inverted U-shaped). This effectively addresses issues such as “over-commercialization” or “spatial emptiness” that hinder traditional approaches to the block renewal.
(3) Technical Innovation: Compared to traditional methods that rely on manual interpretation or subjective questionnaires, the proposed model offers three key advantages: enhanced data objectivity, higher analytical efficiency, and improved interpretability of results (Table 10).
Table 10.
Comparison of research model details.
Compared with traditional approaches, the proposed model adopts U-Net-based semantic segmentation in place of manual annotation, thereby reducing subjective bias [72,74]. In terms of operational efficiency, it completes analysis in approximately one-tenth the time required by conventional questionnaire-based methods [73]. For interpretability, the model employs SHAP to generate pixel-level contribution maps (Figure 5, Figure 6, Figure 7, Figure 8, Figure 9, Figure 10 and Figure 11), enabling precise localization of negative landscape factors (e.g., traffic signs), whereas SEM is limited to displaying relationships among latent variables [75]. As a result, the proposed model not only demonstrates robust statistical performance, but also exhibits clear advantages over existing methods in terms of interpretive depth, evaluation objectivity, and analytical efficiency in the context of historical and cultural districts’ landscape quality.
4. Discussion
This study first evaluated the U-Net model’s overall performance by focusing on intersection-over-union (IoU) scores for key visual elements such as sky and vegetation. Results showed that U-Net achieved high recognition accuracy in most scenarios, with an average IoU exceeding 0.75, indicating reliable segmentation of sky and major vegetation regions (see Table 3 and Table 4). However, across the landscape quality gradient—from “very poor” to “very good” (Likert scores from −3 to 3)—the IoU differences between high-scoring and low-scoring samples were minimal. Thus, U-Net’s segmentation accuracy remains relatively stable across perceptual levels and does not appear sensitive to subtle visual or experiential distinctions. This stability provides a robust basis for linking objectively segmented visual elements (particularly sky and vegetation) to experimental findings that exposure to nature-like fractal patterns and biophilic environments can reduce physiological stress and enhance perceptual fluency [6,8,9].
Analysis of segmentation samples revealed that U-Net exhibits some deviations and misclassifications when processing fine-grained features in the districts’ images. For instance, it often misclassifies hollow railings as solid barriers and incorrectly labels gaps between tree branches as vegetation, leading to blurred boundaries and category confusion (Figure 4). These errors primarily stem from the complex spatial geometry of historical building facades and vegetation, along with varying lighting and occlusion conditions. Eye-tracking research on traditional streetscapes shows that such fine-grained façade details and small openings often attract a disproportionate share of visual attention and contribute to perceived interest and engagement [28,30,44]. Therefore, improving the segmentation of these visually salient but small-scale elements is important for fully capturing how observers experience historical and cultural districts, even though the overall IoU for major classes remains high.
Compared with state-of-the-art models such as DeepLabv3+ [76] and Mask R-CNN [77], which excel at single-feature segmentation in urban street scenes, U-Net shows slightly lower accuracy in high-detail environments. This highlights the need to optimize its feature extraction capabilities for small-scale targets. To address this, we implemented two architectural enhancements. First, we adopted a multi-scale feature fusion strategy to capture both macro-structural and fine-grained elements—such as railings, signage, and traditional façade textures—that are often small but perceptually significant. By aggregating features from multiple spatial resolutions, the model can retain both the global layout and local detail, which is particularly beneficial in the visually layered context of historical environments. Second, we integrated an attention mechanism inspired by human visual cognition to strengthen the model’s focus on perceptually dominant regions. This mechanism dynamically reweights features based on relevance, emphasizing key landscape components (for example, vegetation patches, sky windows framed by traditional architecture, and prominent facades) while suppressing background clutter such as electric wires or moving vehicles. Together, these refinements substantially improve the model’s ability to parse the nuanced, multi-layered visual structure of historical and cultural districts. This design choice resonates with empirical findings that human observers do not distribute attention uniformly, but preferentially fixate on coherent focal elements, symmetric arrangements, and human-scaled façade details in urban scenes [28,29,31,44], which are precisely the features that the enhanced model is better able to represent.
Quantitative comparisons on the test set demonstrate that the enhanced model achieves a higher mean IoU of 0.7668, compared to 0.7433 for the baseline U-Net model, confirming the effectiveness of the refinements. These improvements are most pronounced in areas with dense architectural ornamentation or partially occluded natural elements. Overall, the multi-scale fusion and attention-based enhancements substantially improve the model’s ability to capture the nuanced visual structure of historical and cultural districts.
Beyond model performance, we identified optimal thresholds for four key visual elements influencing landscape perception: sky visibility index (SVI) ≈ 25%, green view index (GVI) near its maximum, building visibility index (BVI) ≈ 40%, and pedestrian visibility index (PVI) ≈ 22%. These thresholds serve as quantitative benchmarks for street space design, green infrastructure layout, and building renewal density control. SHAP visualizations reveal that low-scenic street segments are typically characterized by excessive vehicle and traffic equipment visibility coupled with a pronounced sense of spatial enclosure. To improve scenic quality, we recommend introducing green barriers at street entrances, nodes, and corners, removing redundant infrastructure, and enhancing natural visibility through interventions such as vertical greening and canopy coverage. Furthermore, our model can be generalized to other urban historical and cultural districts Via transfer learning, enabling streamlined end-to-end support for problem identification, threshold calibration, and strategy formulation. These optimal ranges are consistent with evidence that people tend to prefer streetscapes which balance openness, greenery, and built form, rather than maximizing a single component, and that more scenic environments are associated with higher reported happiness and well-being in urban contexts [9,13,14,38].
The findings also reveal pronounced nonlinear perceptual effects. Contrary to much of the existing literature on urban and historical landscape perception—which often assumes that visual elements contribute to esthetic evaluations in a linear or additive manner—the SHAP-based interpretability indicates that the influence of visual elements on esthetic perception is often nonlinear and context-dependent [78]. Specifically, interference elements such as vehicles and traffic facilities dominate negative contributions in low-scoring (low-beauty) scenes, whereas as scores increase, natural elements—particularly vegetation and sky—become the primary positive predictors. These results are not merely additive; instead, they exhibit threshold behaviors and interaction effects [79,80]. Joint kernel density analysis further reveals a synergistic clustering of green plant and sky visibility: their co-occurrence has a compounded positive effect on perceived beauty [81]. In contrast, built structures and pedestrian presence follow inverted U-shaped patterns, where moderate densities are perceived most positively while both scarcity and oversaturation reduce esthetic appeal. These findings underscore the existence of perceptual thresholds and saturation points—dynamics that linear models are ill-equipped to capture [82]. Importantly, the model’s predictive performance (R2 = 0.609, p < 0.001) supports the robustness of these nonlinear relationships. Green plant visibility (β = 0.400) and sky visibility (β = 0.300) emerged as the strongest positive contributors, whereas built environment features showed complex, non-monotonic effects. This suggests that esthetic valuation is sensitive not only to the quantity of visual elements but also to their relative composition and contextual interaction. Overreliance on additive models may overlook such critical interactive effects; accordingly, urban design strategies should integrate nonlinear perceptual dynamics and spatial thresholds into planning practices, particularly when managing historically sensitive or visually complex environments. Similar inverted-U and threshold patterns have been reported in experimental studies on fractal and nature-like visual stimuli, where moderate levels of geometric complexity maximize both preference and stress reduction, rather than extreme simplicity or overload [6,7,8]. Large-scale image-based analyses of scenic beauty and happiness likewise indicate that locations combining greenery, open sky, and appropriately scaled built form tend to be experienced as more beautiful and pleasant [13,14]. These converging results support the view that the nonlinear relationships identified in our model are consistent with a broader neuro-esthetic and biophilic basis for architectural beauty in historical urban environments [9,11].
Despite these insights, several limitations of the study remain. First, the U-Net-based segmentation method relies on a combination of online street-view images and manually collected photographs, resulting in a limited sample size and diversity that may not capture the full landscape complexity of all areas in Wuhan or other regions. In particular, many of the supplementary photographs in narrow alleyways were deliberately taken on clear mornings to ensure adequate visibility, which may under-represent landscape perception under other times of day, weather conditions, or crowding patterns. Second certain architectural details—such as shaded facades of ancient buildings and structural elements in narrow alleys—can be misidentified, reducing the accuracy of visual element quantification. Although the model demonstrates strong explanatory power, it struggles to capture more intricate nonlinear interaction effects. Third, our analysis did not include explicit measures of visual complexity (e.g., fractal or textural complexity) in order to preserve the interpretability of the model; future work could incorporate appropriate complexity metrics to explore their influence on perceived landscape quality. Finally, our current evaluation framework does not integrate multi-source data (e.g., acoustic environment, air quality, or access to public services), which limits its ability to reflect spatial heterogeneity and a truly multidimensional user experience. Future work that combines visual indicators with physiological or self-reported measures of comfort, stress, and satisfaction would be especially valuable for testing how the identified visual thresholds translate into actual health and well-being outcomes in historical and cultural districts [14].
To address these limitations, future research should pursue several directions: First, develop a more holistic evaluation framework: Integrate visual data with multi-source information such as acoustic metrics, air quality, and resident satisfaction surveys. Employ advanced nonlinear modeling approaches (e.g., generalized additive models or random forest regression) to investigate multidimensional perceptual drivers; Second, conduct cross-regional comparative studies: Apply the model to historical and cultural districts with diverse cultural and spatial characteristics to validate the universality of the optimal SVI/GVI/BVI/PVI thresholds and to develop context-specific design interventions.
Implementing these enhancements would strengthen the scientific foundation and practical applicability of the proposed evaluation system, providing more comprehensive support for urban renewal initiatives and cultural heritage conservation in historical and cultural districts.
5. Conclusions
This study presents an integrated framework that combines street view images, deep semantic segmentation, and explainable machine learning to quantify the nonlinear efects of key visual elements on perceived landscape quality in Wuhan’s historic and cultural districts. A U-Net–based semantic segmentation model enabled accurate extraction of essential visual elements from street view images, facilitating detailed analysis of their complex relationships with esthetic perception. By explicitly modeling the joint contribution of sky, vegetation, buildings, and pedestrians, the framework helps operationalize how everyday visual environments in historic districts can influence perceived quality in ways that are consistent with experimental evidence on stress reduction and preference for nature-like fractal and biophilic patterns.
In the modeling stage, a perception-based predictive model was established, identifying four key visual elements. The model demonstrated strong explanatory power (R2 = 0.609, p < 0.001). Green plant visibility had the most significant positive effect on perceived beauty (β = 0.400), whereas sky visibility exhibited an inverted U-shaped effect (β = 0.300). Building and pedestrian visibility also followed nonlinear trends, suggesting the importance of exploring threshold effects in landscape perception.
Through SHAP interpretability analysis, we illuminated how the impact of each visual element shifts under different scenic conditions. In less scenic areas, interference elements exerted the strongest negative impact, whereas in highly scenic areas the positive contributions of sky and green vegetation dominate. Kernel density and joint distribution analyses confirmed the synergistic effect of green vegetation and sky visibility, as well as the inverted-U patterns for building and pedestrian visibility. These results suggest that reducing visual clutter and maintaining balanced visual compositions can improve perceived landscape quality. This pattern is consistent with eye-tracking and biometric studies showing that observers preferentially fixate on coherent, articulated façades and green elements in traditional streetscapes, and that such configurations are systematically rated as more beautiful than visually fragmented or traffic-dominated scenes.
Overall, this study advances the evaluation of urban landscape quality by explicitly modeling and quantifying the nonlinear interplay of visual components in historical and cultural districts. The proposed evaluation framework demonstrates strong transferability and practical applicability: it can be rapidly adapted to other districts Via model retraining, and it offers data-driven support for identifying and improving low-quality street segments in urban renewal projects. For practical implementation, we recommend maintaining SVI around 25%, maximizing GVI, keeping BVI near 40%, and regulating PVI to approximately 22% in order to balance heritage preservation with functional needs. These quantitative targets can be interpreted as design ranges for achieving biophilic, human-scale streetscapes in historic areas, in line with biophilic design frameworks and traditional urban design principles that emphasize greenery, framed sky views, and legible built form.
Methodologically, this study combines deep learning–based image processing, advanced statistical modeling, and explainable machine learning to establish a novel approach for integrating multi-source data and explicitly identifying nonlinear mechanisms in urban landscape perception. This interdisciplinary approach not only enhances the precision of visual element extraction, but also provides critical insights into the complex, threshold-dependent interactions that shape esthetic experiences in the districts. Because the pipeline links pixel-level visual structure to reported scenic beauty, it also offers a computational bridge to emerging neuro esthetic studies that relate specific visual patterns in streetscapes to measurable affective and cognitive responses.
The findings significantly enrich existing theoretical frameworks of urban landscape perception by elucidating the nonlinear dynamics of natural, artificial, and interference elements. They also offer actionable technical support for heritage restoration, urban policy formulation, and urban space redesign, emphasizing that balancing visual elements is critical to optimizing perceived landscape quality. In this sense, the work speaks directly to current debates on “scenic beauty” versus conventional architectural beauty by showing that public evaluations in historic districts are strongly shaped by visual configurations that align with biophilic and traditional patterns, for which a neurological basis for beauty has begun to be documented.
In summary this research advances both theoretical understanding and practical evaluation of urban visual quality by foregrounding nonlinear interactions among key visual factors. Future work should leverage big-data analytics and multi-scale spatiotemporal methods to deepen exploration of these dynamics and incorporate additional environmental and social variables, thereby enabling more informed and holistic urban planning and design decisions. The direction is to combine the present visual indicators with physiological or affective measures, in order to test more directly how the identified visual thresholds relate to the strong, partly unconscious health and well-being effects reported for fractal, biophilic, and symmetry-rich environments.
Author Contributions
Conceptualization, H.X.; methodology, T.Y.; software, T.Y. and Z.G. validation, T.Y. and Z.G.; formal analysis, T.Y.; investigation, T.Y.; resources, H.X.; data curation, T.Y.; writing—original draft preparation, H.X. and T.Y.; writing—review and editing, H.X. and T.Y.; visualization, T.Y.; supervision, H.X.; project administration, H.X.; funding acquisition, H.X. All authors have read and agreed to the published version of the manuscript.
Funding
This work was supported by the General Project of Social Science Foundation of Hubei Province [HBSKJJ20233416], the Key Project of Philosophy and Social Science Research of Hubei Provincial Department of Education [No.23D111] and the Key Project for Graduate Students’ Innovation and Entrepreneurship of Wuhan University of Science and Technology [JCX2023022].
Institutional Review Board Statement
The study was conducted in accordance with the Declaration of Helsinki, and the study was reviewed and approved by the School of Urban Construction at Wuhan University of Science and Technology on 1 September 2024.
Informed Consent Statement
Informed consent was obtained from all subjects involved in the study.
Data Availability Statement
The datasets generated during the current study were collected by the authors and are not publicly available, but they can be obtained from the corresponding author upon reasonable request.
Conflicts of Interest
The authors declare no conflicts of interest.
References
- Olwig, K.R. The Practice of Landscape ‘Conventions’ and the Just Landscape: The Case of the European Landscape Convention. In Justice, Power and the Political Landscape; Routledge: Abingdon, UK, 2009; ISBN 978-1-315-87827-0. [Google Scholar]
- Antrop, M. From holistic landscape synthesis to transdisciplinary landscape management. FengJing YuanLin Landsc. Archit. 2010, 8, 74–80. [Google Scholar]
- Dupont, L.; Antrop, M.; Eetvelde, V.V. Eye-Tracking Analysis in Landscape Perception Research: Influence of Photograph Properties and Landscape Characteristics. Landsc. Res. 2014, 39, 417–432. [Google Scholar] [CrossRef]
- Butler, A.; Berglund, U. Landscape Character Assessment as an Approach to Understanding Public Interests within the European Landscape Convention. Landsc. Res. 2014, 39, 219–236. [Google Scholar] [CrossRef]
- Daniel, T.C.; Boster, R.S. Measuring Landscape Esthetics; The Scenic Beauty Estimation Method; Rocky Mountain Forest and Range Experiment Station; U.S. Department of Agriculture, Forest Service: Fort Collins, CO, USA, 1976.
- Taylor, R.P. Reduction of Physiological Stress Using Fractal Art and Architecture. Leonardo 2006, 39, 245–251. [Google Scholar] [CrossRef]
- Taylor, R.P.; Spehar, B. Fractal Fluency: An Intimate Relationship Between the Brain and Processing of Fractal Stimuli. In The Fractal Geometry of the Brain; Di Ieva, A., Ed.; Springer: New York, NY, USA, 2016; pp. 485–496. ISBN 978-1-4939-3995-4. [Google Scholar]
- Taylor, R. The Potential of Biophilic Fractal Designs to Promote Health and Performance: A Review of Experiments and Applications. Sustainability 2021, 13, 823. [Google Scholar] [CrossRef]
- Kellert, S.R.; Heerwagen, J.; Mador, M. Biophilic Design: The Theory, Science and Practice of Bringing Buildings to Life; John Wiley & Sons: Hoboken, NJ, USA, 2011; ISBN 978-1-118-17424-1. [Google Scholar]
- Mehaffy, M.W. The Impacts of Symmetry in Architecture and Urbanism: Toward a New Research Agenda. Buildings 2020, 10, 249. [Google Scholar] [CrossRef]
- Buras, N.H. The Art of Classic Planning: Building Beautiful and Enduring Communities; Harvard University Press: Massachusetts, UK, 2020; ISBN 978-0-674-91924-2. [Google Scholar]
- Dou, Y.; Zhen, L.; De Groot, R.; Du, B.; Yu, X. Assessing the Importance of Cultural Ecosystem Services in Urban Areas of Beijing Municipality. Ecosyst. Serv. 2017, 24, 79–90. [Google Scholar] [CrossRef]
- Seresinhe, C.I.; Preis, T.; MacKerron, G.; Moat, H.S. Happiness Is Greater in More Scenic Locations. Sci. Rep. 2019, 9, 4498. [Google Scholar] [CrossRef]
- Seresinhe, C.I.; Preis, T.; Moat, H.S. Using Deep Learning to Quantify the Beauty of Outdoor Places. R. Soc. Open Sci. 2017, 4, 170170. [Google Scholar] [CrossRef]
- Xu, J.; Wang, J.; Zuo, X.; Han, X. Spatial Quality Optimization Analysis of Streets in Historical Urban Areas Based on Street View Perception and Multisource Data. J. Urban Plan. Dev. 2024, 150, 05024036. [Google Scholar] [CrossRef]
- Serag El Din, H.; Shalaby, A.; Farouh, H.E.; Elariane, S.A. Principles of Urban Quality of Life for a Neighborhood. HBRC J. 2013, 9, 86–92. [Google Scholar] [CrossRef]
- Vogt, C.A.; Andereck, K.L.; Pham, K. Designing for Quality of Life and Sustainability. Ann. Tour. Res. 2020, 83, 102963. [Google Scholar] [CrossRef]
- Tian, Y.; Jim, C.Y.; Wang, H. Assessing the Landscape and Ecological Quality of Urban Green Spaces in a Compact City. Landsc. Urban Plan. 2014, 121, 97–108. [Google Scholar] [CrossRef]
- Karade, R.M.; Kuchi, V.S.; Kabir, J. The Role of Green Space for Sustainable Landscape Development in Urban Areas. Acta Hortic. 2017, 1181, 73–76. [Google Scholar] [CrossRef]
- Lothian, A. Landscape and the Philosophy of Aesthetics: Is Landscape Quality Inherent in the Landscape or in the Eye of the Beholder? Landsc. Urban Plan. 1999, 44, 177–198. [Google Scholar] [CrossRef]
- Zhang, X.; Ren, Y.; Lv, J.; Geng, Y.; Su, C.; Ma, R. Morphological Evolution and Socio-Cultural Transformation in Historic Urban Areas: A Historic Urban Landscape Approach from Luoyang, China. Buildings 2025, 15, 1373. [Google Scholar] [CrossRef]
- Daniel, T.C. Whither Scenic Beauty? Visual Landscape Quality Assessment in the 21st Century. Landsc. Urban Plan. 2001, 54, 267–281. [Google Scholar] [CrossRef]
- Tveit, M.; Ode, Å.; Fry, G. Key Concepts in a Framework for Analysing Visual Landscape Character. Landsc. Res. 2006, 31, 229–255. [Google Scholar] [CrossRef]
- Ode, Å.; Tveit, M.S.; Fry, G. Capturing Landscape Visual Character Using Indicators: Touching Base with Landscape Aesthetic Theory. Landsc. Res. 2008, 33, 89–117. [Google Scholar] [CrossRef]
- Ode, Å.; Fry, G.; Tveit, M.S.; Messager, P.; Miller, D. Indicators of Perceived Naturalness as Drivers of Landscape Preference. J. Environ. Manag. 2009, 90, 375–383. [Google Scholar] [CrossRef]
- Ode, Å.; Hagerhall, C.M.; Sang, N. Analysing Visual Landscape Complexity: Theory and Application. Landsc. Res. 2010, 35, 111–131. [Google Scholar] [CrossRef]
- Ode Sang, Å.; Miller, D. Analysing the Relationship between Indicators of Landscape Complexity and Preference. Environ. Plan. B Plan. Des. 2011, 38, 24–40. [Google Scholar] [CrossRef]
- Hollander, J.B.; Sussman, A.; Purdy Levering, A.; Foster-Karim, C. Using Eye-Tracking to Understand Human Responses to Traditional Neighborhood Designs. Plan. Pract. Res. 2020, 35, 485–509. [Google Scholar] [CrossRef]
- Sussman, A.; Hollander, J. Cognitive Architecture: Designing for How We Respond to the Built Environment, 2nd ed.; Routledge: New York, NY, USA, 2021; ISBN 978-1-003-03154-3. [Google Scholar]
- Salingaros, N.A.; Sussman, A. Biometric Pilot-Studies Reveal the Arrangement and Shape of Windows on a Traditional Façade to Be Implicitly “Engaging”, Whereas Contemporary Façades Are Not. Urban Sci. 2020, 4, 26. [Google Scholar] [CrossRef]
- Lavdas, A.A.; Salingaros, N.A.; Sussman, A. Visual Attention Software: A New Tool for Understanding the “Subliminal” Experience of the Built Environment. Appl. Sci. 2021, 11, 6197. [Google Scholar] [CrossRef]
- Luttik, J. The Value of Trees, Water and Open Space as Reflected by House Prices in the Netherlands. Landsc. Urban Plan. 2000, 48, 161–167. [Google Scholar] [CrossRef]
- Tenerelli, P.; Püffel, C.; Luque, S. Spatial Assessment of Aesthetic Services in a Complex Mountain Region: Combining Visual Landscape Properties with Crowdsourced Geographic Information. Landsc. Ecol. 2017, 32, 1097–1115. [Google Scholar] [CrossRef]
- Li, X.; Li, L.; Wang, X.; Lin, Q.; Wu, D.; Dong, Y.; Han, S. Visual Quality Evaluation Model of an Urban River Landscape Based on Random Forest. Ecol. Indic. 2021, 133, 108381. [Google Scholar] [CrossRef]
- Zhao, Y.; Liu, J.; Zheng, Y. Preservation and Renewal: A Study on Visual Evaluation of Urban Historical and Cultural Street Landscape in Quanzhou. Sustainability 2022, 14, 8775. [Google Scholar] [CrossRef]
- Vukomanovic, J.; Orr, B.J. Landscape Aesthetics and the Scenic Drivers of Amenity Migration in the New West: Naturalness, Visual Scale, and Complexity. Land 2014, 3, 390–413. [Google Scholar] [CrossRef]
- Inglis, N.C.; Vukomanovic, J.; Costanza, J.; Singh, K.K. From Viewsheds to Viewscapes: Trends in Landscape Visibility and Visual Quality Research. Landsc. Urban Plan. 2022, 224, 104424. [Google Scholar] [CrossRef]
- Kellert Stephen, R. What Is and Is Not Biophilic Design? Metropolis Magazine, 9 November 2025. Available online: https://metropolismag.com/viewpoints/what-is-and-is-not-biophilic-design/ (accessed on 10 November 2025).
- Zube, E.H.; Sell, J.L.; Taylor, J.G. Landscape Perception: Research, Application and Theory. Landsc. Plan. 1982, 9, 1–33. [Google Scholar] [CrossRef]
- Kaplan, R.; Kaplan, S. The Experience of Nature: A Psychological Perspective; Cambridge University Press: Cambridge, UK, 1989. [Google Scholar]
- Gobster, P.H.; Ribe, R.G.; Palmer, J.F. Themes and Trends in Visual Assessment Research: Introduction to the Landscape and Urban Planning Special Collection on the Visual Assessment of Landscapes. Landsc. Urban Plan. 2019, 191, 103635. [Google Scholar] [CrossRef]
- Scott, K.E.; Benson, J.F. Public and Professional Attitudes to Landscape: Scoping Study. 2002. Available online: https://eprints.ncl.ac.uk (accessed on 14 August 2024).
- van der Jagt, A.P.N.; Craig, T.; Anable, J.; Brewer, M.J.; Pearson, D.G. Unearthing the Picturesque: The Validity of the Preference Matrix as a Measure of Landscape Aesthetics. Landsc. Urban Plan. 2014, 124, 1–13. [Google Scholar] [CrossRef]
- Rosas, H.J.; Sussman, A.; Sekely, A.C.; Lavdas, A.A. Using Eye Tracking to Reveal Responses to the Built Environment and Its Constituents. Appl. Sci. 2023, 13, 12071. [Google Scholar] [CrossRef]
- Brielmann, A.A.; Buras, N.H.; Salingaros, N.A.; Taylor, R.P. What Happens in Your Brain When You Walk Down the Street? Implications of Architectural Proportions, Biophilia, and Fractal Geometry for Urban Science. Urban Sci. 2022, 6, 3. [Google Scholar] [CrossRef]
- Lavdas, A.A.; Salingaros, N.A. Architectural Beauty: Developing a Measurable and Objective Scale. Challenges 2022, 13, 56. [Google Scholar] [CrossRef]
- Salingaros, N.A. Brains, Hands, and Hearts: How Traditional Design Supports Health. International Society of Biourbanism. 2022. Available online: https://www.biourbanism.org/brains-hands-and-hearts-how-traditional-design-supports-health/ (accessed on 14 August 2024).
- Naik, N.; Raskar, R.; Hidalgo, C.A. Cities Are Physical Too: Using Computer Vision to Measure the Quality and Impact of Urban Appearance. Am. Econ. Rev. 2016, 106, 128–132. [Google Scholar] [CrossRef]
- Guo, D.; Pei, Y.; Zheng, K.; Yu, H.; Lu, Y.; Wang, S. Degraded Image Semantic Segmentation With Dense-Gram Networks. IEEE Trans. Image Process. 2020, 29, 782–795. [Google Scholar] [CrossRef]
- Kang, Y.; Zhang, F.; Gao, S.; Lin, H.; Liu, Y. A Review of Urban Physical Environment Sensing Using Street View Imagery in Public Health Studies. Ann. GIS 2020, 26, 261–275. [Google Scholar] [CrossRef]
- Daniel, T.C.; Schroeder, H. Scenic Beauty Estimation Model: Predicting Perceived Beauty of Forest Landscapes. In Proceedings of the Our National Landscape: A Conference on Applied Techniques for Analysis and Management of the Visual Resource, Incline Village, NV, USA, 23–25 April 1979; Elsner, G.H., Smardon, R.C., Eds.; Pacific Southwest Forest and Range Experiment Station, General Technical Report; Forest Service, U.S. Department of Agriculture: Berkeley, CA, USA, 1979; pp. 514–523. [Google Scholar]
- Frank, S.; Fürst, C.; Koschke, L.; Witt, A.; Makeschin, F. Assessment of Landscape Aesthetics—Validation of a Landscape Metrics-Based Assessment by Visual Estimation of the Scenic Beauty. Ecol. Indic. 2013, 32, 222–231. [Google Scholar] [CrossRef]
- Hull, R.B.; Buhyoff, G.J.; Daniel, T.C. Measurement of Scenic Beauty: The Law of Comparative Judgment and Scenic Beauty Estimation Procedures. For. Sci. 1984, 30, 1084–1096. [Google Scholar] [CrossRef]
- Marcílio, W.E.; Eler, D.M. From Explanations to Feature Selection: Assessing SHAP Values as Feature Selection Mechanism. In Proceedings of the 2020 33rd SIBGRAPI Conference on Graphics, Patterns and Images (SIBGRAPI), Porto de Galinhas, Brazil, 7–10 November 2020; pp. 340–347. [Google Scholar]
- Meng, Y.; Yang, N.; Qian, Z.; Zhang, G. What Makes an Online Review More Helpful: An Interpretation Framework Using XGBoost and SHAP Values. J. Theor. Appl. Electron. Commer. Res. 2021, 16, 466–490. [Google Scholar] [CrossRef]
- Wang, H.; Liang, Q.; Hancock, J.T.; Khoshgoftaar, T.M. Feature Selection Strategies: A Comparative Analysis of SHAP-Value and Importance-Based Methods. J. Big Data 2024, 11, 44. [Google Scholar] [CrossRef]
- Liu, S. Grey Systems Analysis: Methods, Models and Applications; Springer Nature: Berlin/Heidelberg, Germany, 2025; ISBN 978-981-97-8727-2. [Google Scholar]
- Di Stefano, L.; Mattoccia, S. Fast Template Matching Using Bounded Partial Correlation. Mach. Vis. Appl. 2003, 13, 213–221. [Google Scholar] [CrossRef]
- Kellert, S. Building for Life: Designing and Understanding the Human-Nature Connection; Island Press: Washington, DC, USA, 2005. [Google Scholar]
- Park, R.E. The City: Suggestions for the Investigation of Human Behavior in the City Environment. Am. J. Sociol. 1915, 20, 577–612. [Google Scholar] [CrossRef]
- Knopf, R.C. Recreational Needs and Behavior in Natural Settings. In Behavior and the Natural Environment; Altman, I., Wohlwill, J.F., Eds.; Springer: Boston, MA, USA, 1983; pp. 205–240. ISBN 978-1-4613-3539-9. [Google Scholar]
- Gal, M.S.; Rubinfeld, D.L. Data Standardization. NYU Law Rev. 2019, 94, 737. [Google Scholar] [CrossRef]
- Heip, C.; Herman, P.M.J.; Soetaert, K. 4. Data Processing, Evaluation, and Analysis; John Wiley & Sons: Hoboken, NJ, USA, 1988. [Google Scholar] [CrossRef]
- Cheadle, C.; Vawter, M.P.; Freed, W.J.; Becker, K.G. Analysis of Microarray Data Using Z Score Transformation. J. Mol. Diagn. 2003, 5, 73–81. [Google Scholar] [CrossRef]
- Colan, S.D. The Why and How of Z Scores. J. Am. Soc. Echocardiogr. 2013, 26, 38–40. [Google Scholar] [CrossRef]
- Mascarenhas, S.; Agarwal, M. A Comparison between VGG16, VGG19 and ResNet50 Architecture Frameworks for Image Classification. In Proceedings of the 2021 International Conference on Disruptive Technologies for Multi-Disciplinary Research and Applications (CENTCON), Bengaluru, India, 19–21 November 2021; Volume 1, pp. 96–99. [Google Scholar]
- Stone, D.H. Design a Questionnaire. BMJ 1993, 307, 1264–1266. [Google Scholar] [CrossRef]
- Taherdoost, H. Validity and Reliability of the Research Instrument; How to Test the Validation of a Questionnaire/Survey in a Research. Int. J. Acad. Res. Manag. 2016, 5, 28–36. [Google Scholar] [CrossRef]
- Liu, J.; Yang, L.; Zhang, X. The relationship between soundscape perception and landscape evaluation in historical blocks: A case study of Sanfang Qixiang, Fuzhou. Chin. Landsc. Archit. 2020, 36, 35–39. [Google Scholar]
- Liu, Y.; Li, Z.; Tian, Y.; Gao, B.; Wang, S.; Qi, Y.; Zou, Z.; Li, X.; Wang, R. A Study on Identifying the Spatial Characteristic Factors of Traditional Streets Based on Visitor Perception: Yuanjia Village, Shaanxi Province. Buildings 2024, 14, 1815. [Google Scholar] [CrossRef]
- Li, J.; Chu, J.; Li, Y. Study on the revitalization path of traditional villages based on partial least squares structural equation modeling: A case study of the ancient Huizhou area. Small Town Constr. 2021, 41, 16–24. [Google Scholar]
- Liu, R. GIS-based visual field analysis of urban historical blocks: A case study of Hengshan Road–Fuxing Road Historic and Cultural District. Urban Constr. Theory Res. Electron. Ed. 2018, 7, 25. [Google Scholar] [CrossRef]
- Liu, B.; Xie, X.; Wang, L. Evaluation of the quality of landscape protection in historic towns based on the PSR model: A case study of Qingcheng, Lanzhou. Urban Archit. 2024, 19, 1–7. [Google Scholar] [CrossRef]
- Liu, J.; Han, H.; Chen, Z. Study on Practice Framework and Evaluation Indicator System of Landsense Design for the Enhancement of Cultural Ecosystem Services in Historical Blocks. | EBSCOhost. Available online: https://openurl.ebsco.com/contentitem/doi:10.15302%2FJ-LAF-0-020019?sid=ebsco:plink:crawler&id=ebsco:doi:10.15302%2FJ-LAF-0-020019 (accessed on 28 July 2025).
- Xue, T.; Zhang, J.; Zhao, N.; Liu, P. The influence of visitors’ personal involvement on place attachment in historical blocks: A case study of Laomendong, Nanjing. Hebei J. For. Res. 2016, 31, 68–74. [Google Scholar] [CrossRef]
- Gou, A.; Zhang, C.; Wang, J. Study on the Identification and Dynamics of Green Vision Rate in Jing’an District, Shanghai Based on Deeplab V3 + Model. Earth Sci. Inform. 2022, 15, 163–181. [Google Scholar] [CrossRef]
- Hou, T.; Li, J. Application of Mask R-CNN for Building Detection in UAV Remote Sensing Images. Heliyon 2024, 10, e38141. [Google Scholar] [CrossRef]
- Arriaza, M.; Cañas, J.F.; Cañas, J.A.; Ruiz, P.; González, J.; Barea, F. Landscape Assessment via Regression Analysis. Agrekon 2013, 52, 133–151. [Google Scholar]
- Wang, P.-C.; Yu, C.-Y. Aesthetic Experience as an Essential Factor to Trigger Positive Environmental Consciousness. Sustainability 2018, 10, 1098. [Google Scholar] [CrossRef]
- Zhang, Q.; Xu, H. Understanding Aesthetic Experiences in Nature-Based Tourism: The Important Role of Tourists’ Literary Associations. J. Destin. Mark. Manag. 2020, 16, 100429. [Google Scholar] [CrossRef]
- Wai, K.-M.; Yuan, C.; Lai, A.; Yu, P.K.N. Relationship between Pedestrian-Level Outdoor Thermal Comfort and Building Morphology in a High-Density City. Sci. Total Environ. 2020, 708, 134516. [Google Scholar] [CrossRef]
- Zacharias, J. Pedestrian Behavior Pedestrian Behavior and Perception in Urban Walking Environments. J. Plan. Lit. 2001, 16, 3–18. [Google Scholar] [CrossRef]


Disclaimer/Publisher’s Note: The statements, opinions and data contained in all publications are solely those of the individual author(s) and contributor(s) and not of MDPI and/or the editor(s). MDPI and/or the editor(s) disclaim responsibility for any injury to people or property resulting from any ideas, methods, instructions or products referred to in the content. |
© 2025 by the authors. Licensee MDPI, Basel, Switzerland. This article is an open access article distributed under the terms and conditions of the Creative Commons Attribution (CC BY) license (https://creativecommons.org/licenses/by/4.0/).