Abstract
This study proposes an equipment-level framework for quantifying and grading tower-crane construction safety resilience that addresses three persistent gaps in construction safety research: subjective weighting, static scoring, and weak uncertainty treatment. The Entropy Weight Method (EWM) with Monte Carlo Simulation (MCS) is integrated to convert five objective indicators (fatalities, serious injuries, economic losses, accident-severity factor, and accident frequency) into (i) data-driven weights and (ii) interval-valued resilience estimates (mean and 95% CI). A quintile scheme yields an interpretable five-tier scale from Very Weak to Very Strong. On a multi-source dataset of 696 accidents, casualties and severity dominate the entropy weights and effectively separate resilience tiers. The MCS intervals are stable and decision-oriented. Using the obtained tiers as labels, a Random-Forest classifier achieves superior Accuracy and Macro-F1, demonstrating that the grading is predictable and thus operational for early warning. Two lightweight proxies were further introduced, the Management Behavior Index (MBI) and the Recovery Difficulty Index (RDI), to incorporate management/behavioral signals and recovery burden; both couple with the EWM-MCS score at small weights, smooth zero-event cases, and highlight priority risks. Sensitivity checks on binning rules, simulation budgets, perturbation magnitudes, and coupling coefficients confirm robustness. The proposed framework generates interconnected output metrics, including the mean value, confidence interval, risk tier, and result interpretability. Furthermore, it exhibits high portability and can be readily adapted to other types of critical construction equipment as well as online assessment workflows.
1. Introduction
With the rapid acceleration of urbanization and the growing complexity of high-rise and super high-rise projects, construction sites face unprecedented safety challenges. Tower cranes, as the core vertical transportation equipment, play a decisive role in ensuring construction efficiency and safeguarding both workers and property. In recent years, however, frequent accidents such as collapses and collisions (driven by irregular management, equipment aging, and extreme weather) have caused severe casualties and economic losses, restricting improvements in intrinsic site safety []. Traditional research on construction safety has emphasized static risk control, accident causation, and preventive mechanisms. While such approaches are valuable in pre-event prevention, they often neglect the adaptive, recovery, and reorganization capacities of construction systems under sudden disturbances, thereby failing to reflect their dynamic resilience.
Resilience theory has emerged as a critical framework for evaluating complex systems under disruptions. Bruneau et al. [] pioneered the four-dimensional framework of Robustness, Redundancy, Resourcefulness, and Rapidity, operationalized through functionality-time relationships (resilience triangle), which has become a cornerstone of resilience assessment for communities and lifeline systems. Subsequent works extended this framework to functionality-based indices integrating degradation and recovery curves [,], while Hosseini et al. [] classified resilience into engineering, ecological, and organizational domains, advocating comprehensive coverage of pre-, during-, and post-disruption phases. In critical infrastructure fields, simulation and probabilistic approaches have become prevalent. Panteli and Mancarella [] modeled weather-driven power-system resilience. Zobel and Khansa [] addressed multi-event resilience in IT systems. Sheffi [] and Christopher and Peck [] analyzed redundancy and flexibility in resilient supply chains.
Domestic and international studies have also begun applying resilience concepts to construction systems. Qin [] proposed a four-dimensional “plan-organize-control-recover” framework for construction system resilience. Zhang [] developed a fuzzy AHP-based resilience grading model for metro construction. Li [] integrated extension theory and cloud models for safety evaluation of industrial renovation projects. Sesana et al. [] examined sustainability and resilience aspects of building construction systems. Recent reviews emphasize a shift from project/organizational resilience toward equipment- and task-level modeling, with tower cranes identified as particularly sensitive due to their dynamic operational and environmental exposure. Within the tower-crane safety domain, research has converged on three strands: (i) technology-enabled risk sensing (IoT sensors, vision-based detection) [,], (ii) dynamic risk modeling (Bayesian networks, functional resonance analysis) [], and (iii) management frameworks targeting erection and dismantling hazards []. These contributions highlight a growing trend toward continuous monitoring and probabilistic inference but also reveal the lack of integrated resilience metrics at the equipment level.
Methodologically, objective weighting and uncertainty quantification have become key levers for robust resilience evaluation. The entropy weight method (EWM) has been widely used in disaster and engineering risk assessment for deriving indicator weights from data variability, though some studies raise concerns about robustness in certain indicator distributions [,]. Monte Carlo simulation has been adopted to propagate uncertainty and generate interval-based results in chemical domino-effect modeling, bridge construction safety, and general project risk assessments [,]. Parallel to this, machine learning models such as logistic regression, random forest, and gradient boosting have demonstrated strong predictive capabilities in construction safety, from accident type classification to fall-risk prediction and injury-type analysis [,,].
Despite substantial progress, three practical gaps limit current practice: (1) resilience is seldom modeled at the equipment level—where operational decisions on tower cranes are actually made; (2) indicator weighting is often subjective or static, which obscures heterogeneous risk patterns (e.g., low-frequency/high-consequence vs. high-frequency/low-consequence events); and (3) uncertainty is weakly treated, so point scores may mask volatility and hinder decision-oriented grading and early warning.
This study develops an integrated equipment-specific framework for quantifying and grading the construction safety resilience of tower cranes. The framework combines the Entropy Weight Method (EWM) and Monte Carlo Simulation (MCS). EWM is employed to calculate objective, data-driven weights for five core indicators—namely fatalities, serious injuries, economic losses, accident severity factor, and accident frequency—while MCS is utilized to generate interval-based scoring results that account for assessment uncertainty. The study’s novelty and contributions are reflected in three key aspects. First, it shifts the focus of resilience assessment from the system or project level to the individual equipment level (i.e., the tower crane unit), with a tailored indicator set established to specifically target accident consequences, severity, and exposure, filling the gap of a lack of equipment-oriented resilience assessment tools in existing research. Second, it integrates assessment and simulation into a unified operational workflow that not only yields a mean resilience score with a 95% confidence interval but also outputs an interpretable five-tier resilience rating scale (ranging from Very Weak to Very Strong), addressing the issue of poor interpretability in traditional single-value assessment methods. Third, it forms a closed-loop from assessment to predictive early warning by training compact classifiers, including Logistic Regression (LR), Random Forest (RF), and Gradient Boosting (GB). Results demonstrate that the proposed resilience tiers can be reliably predicted, thereby enabling the framework to support early safety warnings and targeted management practices. Additionally, two lightweight auxiliary indices, the Management Behavior Index (MBI) and Recovery Difficulty Index (RDI), are further introduced: the MBI captures signals related to management irregularities and operator behavioral misconduct, while the RDI quantifies the recovery burden associated with accident severity and frequency. These two indices are incorporated into the framework as supplementary components without overshadowing the influence of the five core indicators, which further enhances the comprehensiveness of resilience assessment without compromising the priority of core evaluation dimensions.
2. Theoretical Foundation and Methods
2.1. Definition of Resilience and Core Dimensions
Following Bruneau et al.’s four-dimension framework (R4): Robustness, Redundancy, Resourcefulness, Rapidity [], the following definitions are adopted for this study: Robustness: the ability of a system to maintain performance without failure under disturbances. Redundancy: the availability of functional substitutes and backup resources. Resourcefulness: the capability to identify problems and mobilize resources under constraints. Rapidity: the speed at which functionality is restored to an acceptable level.
To make R4 actionable at the equipment level (tower crane unit), we map the conceptual dimensions to measurable constructs that match field records and sensing/ledger data, as shown in Table 1.
- Disturbance tolerance (Robustness): the extent to which the crane avoids severe failure under shocks. We quantify this primarily via consequence variables: fatalities, serious injuries, and economic loss (all negative-direction indicators).
- Rapid recovery (Rapidity + Resourcefulness): the ability to restore lifting capacity promptly or achieve acceptable throughput via substitutions (e.g., redeployment, accelerated repair). We use severity factor and economic loss as practical proxies and inject recovery uncertainty via Monte Carlo simulation.
- Indicator responsiveness (Redundancy at the observation layer + Observability): coverage and sensitivity of a multi-indicator scheme so that the computed resilience reflects the actual state rather than a single-indicator bias. We quantify each indicator’s information contribution using the EWM.

Table 1.
Mapping of resilience dimensions to indicators and modeling choices (tower-crane context).
Table 1.
Mapping of resilience dimensions to indicators and modeling choices (tower-crane context).
| Resilience Dimension | Operational Meaning | Observable Indicators | Model Mapping | Decision Logic & Engineering Implications |
|---|---|---|---|---|
| Robustness | Avoid severe failure under shocks | Fatalities (−), Serious injuries (−), Economic loss (−) | Normalization + EWM + Monte Carlo | Lower mean/variability ⇒ higher robustness; guide hardening |
| Rapidity + Resourcefulness | Restore lifting or achieve acceptable throughput via substitution/repair | Severity factor (−), Economic loss (−); Frequency (−) as exposure proxy | Severity & loss in EWM + Monte Carlo | Lower severity/loss ⇒ shorter recovery; guide contingency & pre-positioning |
| Indicator responsiveness | Multi-indicator coverage and sensitivity to true resilience state | All five indicators | EWM for information contribution | Weights show key drivers; guide data collection & high-frequency risk reduction |
Notes: (i) “(−)” denotes negative-direction indicators before alignment. (ii) Grading uses quantile or natural-break rules to obtain Very Weak → Very Strong. (iii) Model outputs include the mean resilience score and 95% confidence interval, enabling interval-aware decisions.
The core inputs are fatalities, serious injuries, economic loss, severity factor (1/3/7/9), and incident frequency.
2.2. Entropy Weight Method, EWM
The EWM originates from the concept of “entropy” in information theory, which measures a system’s uncertainty and information content (Shannon, 1948 [,]). In multi-indicator comprehensive evaluation scenarios, this method uses the degree of dispersion of indicators across samples as a measure of “information contribution”: greater dispersion indicates stronger discriminative power, warranting higher weighting. Conversely, if an indicator exhibits similar values across different subjects, its information increment is limited, and its impact on the overall evaluation should be smaller. Compared to subjective weighting relying on expert scoring, EWM offers objective and reproducible advantages in engineering assessments with moderate to large sample sizes and quantifiable observational data. It is particularly suitable for the resilience evaluation scenario at the equipment level for tower cranes addressed in this paper.
The entropy weight method uses “information entropy” to characterize the dispersion of indicators across samples: the more dispersed an indicator is across samples, the greater the information it provides, and the higher its objective weight. Let there be m evaluation objects (samples, i = 1, …, m) and n indicators (j = 1, …, n). The original data matrix is .
- (1)
- Indicator Standardization and Normalization
All indicators are standardized onto a positive scale, where higher values correspond to better performance, thereby eliminating dimensional effects. The minimum and maximum value of the jth is , respectively.
- Positive indicators (higher values are better):
- Negative indicators (lower values are better):
Here ε > 0 is an extremely small constant (e.g., 10−12), preventing division-by-zero errors caused by “zero range.” After normalization, Y = [yij] ∈ [0,1].
- (2)
- Proportional Matrix (Probabilistic Transformation)
Each column is standardized by its respective column sum to derive a proportional matrix :
If , can be set to (information is completely uniform), where m is the sample size.
- (3)
- Information Entropy
The information entropy of the jth indicator is defined as:
, the closer the value is to 1, the more “uniform” the indicator is across samples, indicating lower discriminative power and reduced information content.
- (4)
- Redundancy (Coefficient of Variation)
The higher the dj value, the better the indicator distinguishes between samples (i.e., the more “concentrated” the information).
- (5)
- Objective Weighting
The weight vector obtained through redundancy normalization is:
Weighted summation can be applied by .
Given that the Entropy Weight Method (EWM) derives objective weights based on data dispersion, correlated indicators may result in the inflation or dilution of indicator importance if such correlation remains unaddressed. In practical operation, interrelationships among indicators are screened through the construction of rank-based association matrices using Spearman’s and Kendall’s correlation coefficients. For indicator pairs demonstrating strong monotonic association, the qualitative overlap between them is documented. When potential indicator redundancy is identified, one of two targeted strategies is adopted: (a) indicators with conceptual overlap are grouped under a unified analytical construct, and EWM is applied in a hierarchical manner; (b) a simplified sensitivity analysis is conducted using perturbed indicator sets—specifically, by removing or merging one of the correlated indicators—to verify the stability of resilience tier assignments. This systematic procedure effectively avoids the double counting of indicator information while maintaining the interpretability of the evaluation system, without altering the overall structure of the evaluation workflow.
2.3. Monte Carlo Simulation (MCS)
MCS is a probability-driven numerical scheme widely used for uncertainty analysis and risk quantification [,]. It propagates input randomness through a model to obtain the sampling distribution of outputs, which is particularly suitable for nonlinear and heteroscedastic systems typical of construction safety and equipment-level resilience.
Combining the EWM with MCS to construct a tower crane resilience model, the simulation steps are as follows:
- (a)
- Indicator normalization: Standardize all tower crane accident indicators using Min-Max normalization, mapping them to the [0,1] interval.
- (b)
- Weight assignment: Employ the EWM to obtain objective weights () for each indicator, used to construct a weighted scoring function.
- (c)
- Random perturbation introduction: For each normalized indicator value , introduce a perturbation term:
Here, denotes the perturbed value, and is a zero-mean normal random variable with a standard deviation proportional to the indicator magnitude. In this study, σ is set within 5–10% to reflect the intrinsic randomness of tower crane accident data. This perturbation scheme enables the resilience model to capture not only deterministic outcomes but also the variability band, thereby producing statistically meaningful evaluation results.
- (d)
- Simulation scoring calculation: Calculate the resilience score (Ex value) after each simulation using the weighted sum formula:
- (e)
- Output statistical results: By repeating the simulation N times (set to 500 times in this paper), the distribution of Ex values is formed. The mean, standard deviation, and confidence interval of Ex are extracted, which serve as the basis for determining the resilience grade and ranking of tower cranes. The choice of 500 iterations reflects a convergence-versus-cost trade-off typically adopted in practical Monte Carlo applications: preliminary tests showed diminishing changes in the mean resilience score and the 95% interval width when increasing runs beyond a few hundred. To make this explicit, a simple stability check was performed by repeating the simulation under different random seeds and grade assignments remained unchanged under these repeats. The ±5–10% perturbation range is intended to emulate reporting imprecision and site-to-site heterogeneity without overwriting the observed distribution. It is calibrated to be small relative to the empirical interquartile ranges of the indicators so that it acts as noise rather than a structural re-weighting.
To obtain interval-valued resilience scores, random draws are generated for each indicator under empirically reasonable ranges (guided by historical dispersion). The aggregated resilience index is then computed for each draw to produce a distribution for grading. A simple stability check, repeating simulations with different random seeds and modestly perturbed indicator ranges, confirms that grade tiers are insensitive to minor input variations. This step complements EWM by quantifying uncertainty that point estimates alone cannot capture.
2.4. Scoring and Grading Mechanism
2.4.1. Subsubsection
To facilitate cross-indicator and cross-sample comparability, all indicators are first normalized (inverse indicators are converted to positive indicators before Min-Max normalization). Objective weights are derived using the entropy weighting method. Comprehensive Risk Score:
A higher R indicates greater overall risk. Resilience Score:
A higher value indicates stronger disturbance resistance and recovery capacity. To characterize uncertainty, each sample undergoes K Monte Carlo perturbations and scoring, yielding a set of . The mean and 95% confidence interval (CI) are then calculated.
2.4.2. Tier Classification (Binning) Strategy
Considering stability, interpretability, and feasibility across different application scenarios, the quantile method is used. Quantiles (Default) uses the 20%, 40%, 60%, and 80% quantiles as thresholds to classify samples into five tiers (Very Weak, Weak, Moderate, Strong, Very Strong). This method ensures relatively balanced sample sizes across each tier, thereby enabling robust comparative analyses between different projects or regions. It is particularly suitable for scenarios characterized by skewed or long-tailed sample distributions, as well as those with high requirements for inter-batch comparability. On this dataset, the empirical quintile thresholds of the resilience score (R) are Q20 = [τ1], Q40= [τ2], Q6 = [τ3], and Q80 = [τ4]. Accordingly, cases are labeled as Very Weak (R < Q20), Weak (Q20 ≤ R < Q40), Moderate (Q40 ≤ R < Q60), Strong (Q60 ≤ R < Q80), and Very Strong (R ≥ Q80). Because the empirical distribution of R is strongly right-skewed and concentrated near 1.0, relatively high absolute scores (e.g., R ≈ 0.95) can still fall into the Moderate or Strong categories. The grading scheme is based on relative position in the sample rather than fixed absolute cut-offs. These mechanisms integrate scoring (R and Resilience) with grading (threshold strategy) into a closed-loop system with the features of “quantifiable-gradable-explainable.” This system explicitly converts uncertainty into actionable management decisions.
2.5. Model Flowchart
The mechanism diagram illustrating the model construction process is presented in Figure 1, which comprises the following seven core modules:
- (1)
- Data Preprocessing: This module encompasses three key operations: missing value imputation, accident severity quantification, and data standardization. These steps ensure the quality, consistency, and comparability of raw data for subsequent analyses.
- (2)
- Indicator System Establishment and Weight Calculation: The process involves two sequential tasks: systematic selection of core indicators (e.g., casualty metrics, economic losses) and weight computation using the Entropy Weighting Method (EWM), which reflects the relative importance of each indicator.
- (3)
- Resilience Score Calculation: Resilience scores are derived via weighted summation of the normalized indicator values (weighted by EWM-derived weights). A supporting score interpretation mechanism is also integrated to clarify the practical implications of different score ranges.
- (4)
- Resilience Level Classification and Ranking: The quantile method is employed to categorize resilience scores into five distinct levels: Very Weak, Weak, Moderate, Strong, Very Strong. Entities are prioritized based on their mean resilience scores, enabling precise identification of high-risk entities and supporting tiered safety management.
- (5)
- Model Output and Interpretation: The model generates multiple decision-support metrics, including the mean resilience score, 95% confidence interval of scores, distribution of resilience levels, and priority ranking of entities. By integrating accident characteristics (e.g., type, severity) with indicator weight distribution, this mechanism identifies key influencing factors for high-risk entities, providing a quantitative foundation for targeted safety intervention measures.
- (6)
- Extended Modules: Two supplementary modules are incorporated to enhance assessment comprehensiveness. The Management Behavior Index (MBI) captures signals of management irregularities and operator misconduct and the Recovery Difficulty Index (RDI) quantifies the recovery load associated with accident severity and frequency. Both indices are incorporated into the EWM-Monte Carlo Simulation (MCS) framework as low-weight terms to refine the resilience assessment without overriding core indicator contributions.
- (7)
- Application Layer: This layer translates model outputs into practical value by providing data-driven decision-making support for safety management departments and optimizing tower crane safety management protocols.
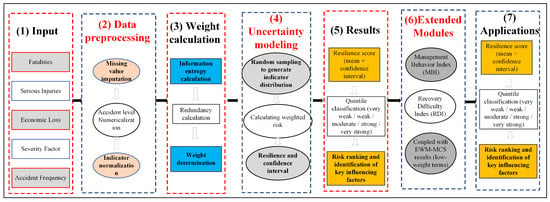
Figure 1.
Mechanism Diagram for Constructing a Construction Resilience Model for Tower Cranes.
Concurrent validity is examined in a descriptive way by checking whether lower resilience grades are associated with more severe accident profiles (higher fatalities, injuries, losses, and severity factors) in the same dataset. For predictive validity, Section 5 trains three representative classifiers (multinomial LR, RF, and GB) to anticipate resilience levels from the five core indicators and evaluates them on a stratified train–test split using Accuracy and Macro-F1. Together, these analyses provide an internal consistency and predictive validity check for the proposed EWM–MCS index without adding extra modeling complexity.
3. Data & Indicators
3.1. Data Overview and Cleaning
This study compiled 696 tower crane accident records from multiple public channels, including provincial/municipal housing and urban-rural development and emergency management platforms, government portals and bulletins, industry regulatory and safety-focused websites, as well as mainstream media and professional documentation platforms. The original dataset encompassed seven attributes describing project characteristics, environmental conditions, accident consequences, root causes, and primary–secondary–tertiary risk factors. These fields included both quantitative values (e.g., casualties, economic losses) and structured categorical variables with textual descriptions, reflecting the variability and representativeness of tower crane accidents across different regions and scenarios. To ensure compatibility with the subsequent entropy-weighting and Monte Carlo modeling, a standardized preprocessing workflow was implemented, comprising the following steps:
- (1)
- Data structuring and type normalization: Explicitly defining columns for casualties, economic loss, severity, and risk factors, and removing duplicate entries.
- (2)
- Numerical conversion and missing-value imputation: Converting textual casualty and loss information into numeric form. Missing casualty data were set to 0 (interpreted as “no reported casualties”). Economic loss values were extracted from text-based records, and missing values were imputed using group-specific means or medians.
- (3)
- Severity level quantification: Severity levels were mapped to numerical severity factors via the conversion rule {general, relatively large, major, particularly serious} → {1, 3, 7, 9}. According to Chinese production-safety legislation, tower-crane accidents are legally divided into four severity levels based on strongly non-linear thresholds in fatalities, serious injuries, and direct economic loss (e.g., 1–2, 3–9, 10–29, and ≥30 deaths, respectively). To obtain a semi-quantitative variable for modeling, we map these four levels to the scores 1, 3, 7, and 9. This superlinear coding compresses the statutory escalation into a [1,9] scale while preserving the ordinal structure and emphasizing the much larger gap between major and particularly serious accidents than between general and relatively large accidents. As a small robustness check, we re-ran the EWM–MCS framework using near-equidistant codings (e.g., 1–2–3–4 and 1–3–5–7). The ordering of indicator weights and the quintile-based resilience grades changed only slightly, and all substantive conclusions (such as the dominance of frequency- and fatality-related indicators) remained unchanged. Therefore, the main findings are not sensitive to the specific numeric encoding of severity levels.
- (4)
- Accident frequency calculation: Frequency metrics were derived by aggregating accident counts based on the three-level risk-factor taxonomy.
- (5)
- Robustness enhancement: Long-tailed variables (e.g., economic losses) were transformed using the “log1p” function (log1p(x) = ln(1 + x)) and then subjected to extreme-value censoring via quantile trimming (e.g., retaining values between the 1st and 99th percentiles).
- (6)
- Indicator alignment and dimensionless normalization: The five core risk indicators—fatalities, serious injuries, economic losses, severity factor, and accident frequency—were uniformly normalized to the range [0,1] using the Min–Max method, as specified in Equation (1).
The compiled, structured database contains 696 risk-factor–level records corresponding to approximately 375 distinct tower crane accidents, collected from officially published accident bulletins over multiple years. Projects are located in more than 30 provinces and municipalities across mainland China (e.g., Guangdong, Jiangsu, Shandong, Shanghai, Beijing, Sichuan), with a small number of overseas sites (e.g., Japan and Saudi Arabia). In this study, “frequency” is defined as the total number of historical accident records associated with a given tertiary risk factor over the full observation window, aggregated across all sites and cranes. Because consistent exposure denominators (such as crane–years or site–years) are not available, this frequency is interpreted as a relative salience indicator rather than a fully normalized accident rate.
Economic losses are recorded in Chinese yuan (CNY), mostly in units of ten thousand yuan, as reported in the original accident bulletins. All entries are expressed in CNY, so no additional cross-currency conversion is required, and no further deflation is applied. Loss is used as a relative magnitude indicator within the EWM–MCS framework rather than as an exact monetary estimate. Missing casualty counts are treated as zero, missing severity grades are mapped to the lowest severity factor as a conservative assumption, and missing loss values are imputed using averages as described above. A simple internal sensitivity check based on alternative imputation schemes (e.g., complete-case analysis for loss and using medians instead of means) produces very similar entropy-weight rankings and quintile-based resilience grades, suggesting that the main conclusions are robust to reasonable variations in the missing-data treatment. These variables serve as forward-looking risk indicators for subsequent weighting and scoring processes. The overall preprocessing workflow ensures the consistency, comparability, and reproducibility of the dataset while maintaining data traceability, thereby providing stable input parameters for subsequent sample classification and ranking analyses.
Given the multi-source nature of the accident dataset, several additional steps were taken to ensure data quality. First, de-duplication was applied using title–date–location fuzzy matching and the most complete record was retained when near-duplicates were found. Second, consistency checks were performed for key fields (fatalities, injuries, economic losses). When counts conflicted across sources, the conservative (higher-severity) record was retained and flagged. Third, residual missingness in non-critical fields was handled using median imputation within similar site or project types, consistent with the strategy described above. Finally, remaining uncertainty in the indicators is propagated through the MCS step, which yields interval-valued resilience scores rather than single-point estimates and makes the impact of data limitations explicit in the subsequent evaluation.
3.2. Data Visualization and Analysis
The statistical analysis of construction accident records reveals several notable patterns. Frequency analysis (Figure 2) highlights that tertiary risk factors such as errors in tower crane installation and dismantling procedures and weak safety awareness among workers are the most recurrent, emphasizing persistent issues in both operational practices and human factors. Examination of casualties and economic losses (Figure 3) indicates that although most accidents cause limited harm, a small number of severe cases result in disproportionately high fatalities and financial losses. The boxplot analysis confirms that higher severity levels are strongly associated with greater economic damage, and scatter plots further demonstrate that high-frequency risk factors often coincide with elevated severity. Correlation and heatmap analyses (Figure 4) show that severity, fatalities, and economic loss are closely interrelated, with many high-frequency tertiary risks concentrated in low- to medium-severity accidents but some extending into major incidents. Finally, Pareto analysis (Figure 5) reveals that roughly 20% of tertiary risks account for over 80% of all accidents, suggesting that targeted interventions focusing on a limited set of dominant risks, particularly those related to crane operations and worker safety awareness, could yield substantial improvements in overall safety performance.
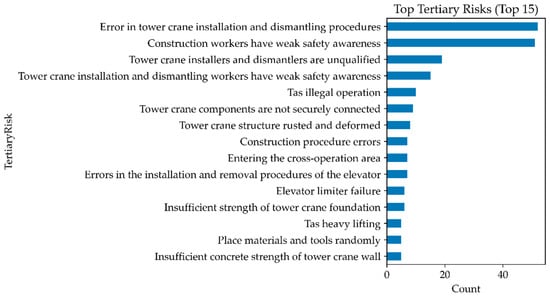
Figure 2.
Top tertiary risks.
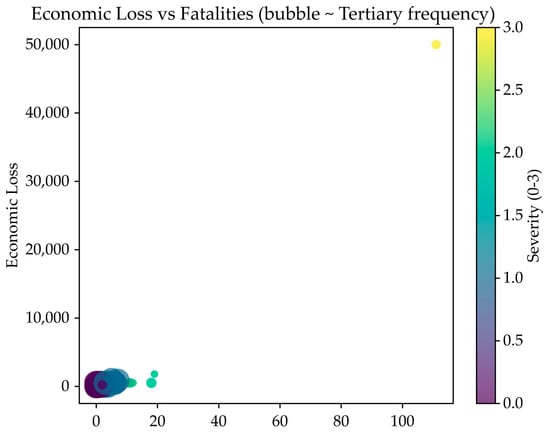
Figure 3.
Loss vs. fatalities frequency.
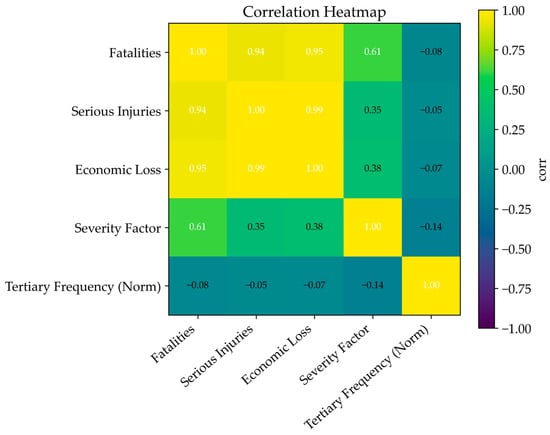
Figure 4.
Correlation heatmap.
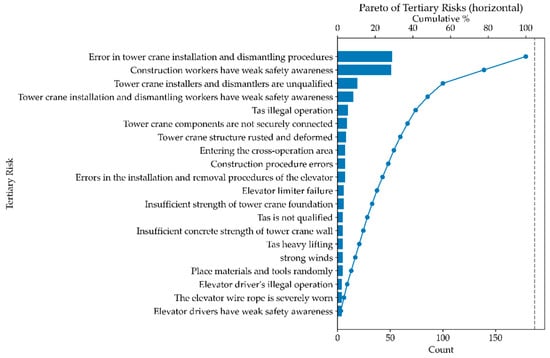
Figure 5.
Pareto of tertiary risks.
4. Modeling & Case Study
4.1. Entropy-Weight Results
Following the EWM pipeline, five first-level indicators, fatalities, serious injuries, economic loss, severity factor, and accident frequency, were objectively weighted. The EWM results are presented in Table 2 and Figure 6. The estimated entropy values for each indicator were as follows: 0.690 for serious injuries, 0.719 for the severity factor, 0.792 for fatalities, 0.960 for accident frequency, and 0.974 for economic losses. The corresponding diversification coefficients were 0.310, 0.281, 0.208, 0.040, and 0.026, respectively, with the final weights calculated as 0.3587, 0.3246, 0.2408, 0.0461, and 0.0298. From these results, it can be concluded that serious injuries and the severity factor contribute the most to distinguishing resilience levels in the sample, followed by fatalities. In contrast, accident frequency and economic losses were assigned substantially smaller weights. This is attributed to their higher entropy values, which indicate lower cross-sample dispersion and thus weaker discriminatory power for resilience level classification.

Table 2.
EWM results.
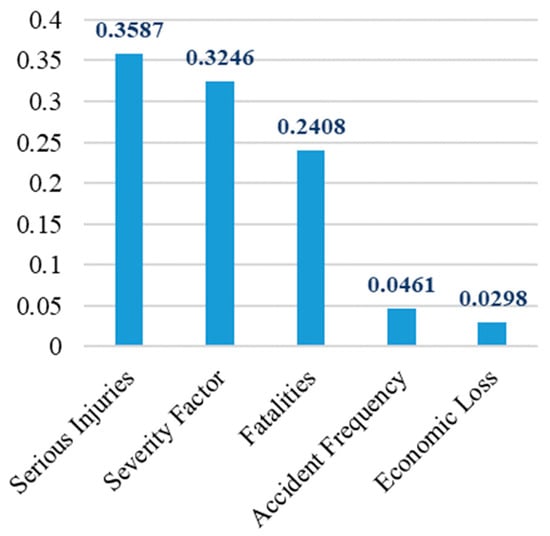
Figure 6.
Indicator Weight Bar Chart.
The ranking is consistent with mechanism-based expectations. Firstly, sparse and heavy-tailed distributions of casualty data reduce entropy and elevate corresponding weights, thereby enhancing the discriminatory power among different units. Secondly, the discretized severity factor {1,3,7,9} create larger intervals between adjacent values, which improves the sensitivity of resilience differentiation. Thirdly, economic loss data exhibit greater noise due to variations in reporting protocols and tend to be concentrated, while accident frequency data are characterized by low values and right-skewed distributions. Both factors limit their discriminatory capacity after Min-Max normalization. It is important to note that weights derived from the entropy weighting method (EWM) reflect the statistical separability of indicators rather than their absolute managerial significance. Although casualty metrics and severity factors dominate the resilience score, economic losses (as a measure of cost and schedule exposure) and accident frequency (as an indicator of chronic management performance) remain operationally critical for resource allocation and long-term process control.
It is important to emphasize that the weighting reflects the “ability to distinguish resilience levels among different samples,” not a definitive ranking of “importance” for management purposes. While economic losses and accident frequency carry lower weights, they remain crucial references for strategy formulation and resource allocation: the former corresponds to financial and schedule risks, while the latter often signals long-term management failures and the accumulation of hidden dangers.
4.2. MCS Resilience Results
After completing entropy weight calculations, this study conducted MCS for each sample based on five core indicators: fatalities, serious injuries, economic losses, severity factor, and accident frequency.
Each tower crane underwent independent simulation N = 500 times to derive resilience distributions. The mean resilience value (ResilienceMean) and 95% confidence intervals (CI_L, CI_U) were extracted as quantitative outcomes. All ResilienceMean values across samples were categorized into five tiers using the quintile method (equal frequency): Very Weak, Weak, Moderate, Strong, and Very Strong. The output results are shown in Table 3 (including “TertiaryRisk, Resilience Mean, 95% CI, Resilience Level”). The advantage of the “quintile method” is that each level has approximately the same sample size, facilitating cross-comparison and resource allocation. If management prefers “equidistant binning/natural breakpoints/expert thresholds,” this model can also be switched without loss of information.

Table 3.
Sample resilience results (ID/factor/mean/CI/level).
To facilitate rapid identification of highly resilient entities and intervals with uncertainty, this paper presents an error bar chart for the top 20 resilience-average devices (see Figure 7).
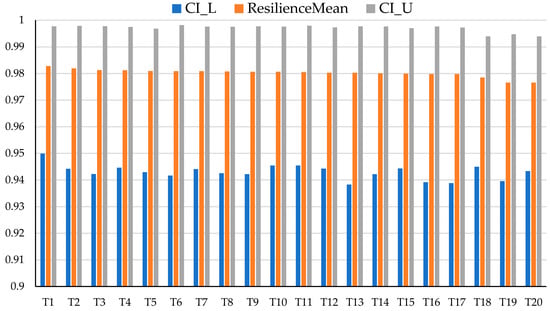
Figure 7.
The top 20 ResilienceMean (T1 = Lifting path obstructed; T2 = Low-temperature brittle fracture of tower crane structure; T3 = Hook broken; T4 = Tower crane overload; T5 = Piling machine brake damaged; T6 = Materials and tools near the opening are scattered.; T7 = Tower crane hoisting rope breaks; T8 = Pump truck boom connection loose; T9 = The tower crane structure is tilted too much.; T10 = The overall steel platform has poor sealing performance; T11 = Thunderstorm; T12 = high temperature;T13 = Group tower operation;T14 = poor sealing of climbing scaffold; T15 = Tutor fatigue; T16 = Tower crane anti-disengagement device malfunction; T17 = Multiple three-dimensional cross-operation surfaces; T18 = Signalman’s erroneous command; T19 = There is a risk of objects falling from heights; T20 = Inadequate protection of the working environment).
Most units achieve mean resilience values between 0.95 and 0.98, with upper bounds close to 1.0, indicating generally high resilience and strong recovery capacity. However, the lower bounds vary across units, in some cases dropping below 0.92, suggesting vulnerability under specific risks. In particular, factors such as lifting obstructions, structural component damage, and absence of protective facilities are associated with wider intervals and lower stability. By contrast, risks related to environmental conditions (e.g., temperature, rainfall) and behavioral factors (e.g., weak safety awareness) show narrower intervals, reflecting more consistent resilience. Overall, the Top-30 results highlight that high mean resilience does not guarantee stability. Risk management should focus on reinforcing structural vulnerabilities while maintaining long-term control of frequent but stable risks. This distribution-aware perspective provides stronger support for prioritization and targeted resilience enhancement.
4.3. Resilience Grading and Spatial Distribution
Using the integrated EWM-Monte Carlo Simulation (MCS) framework with quantile-based classification thresholds (20th/40th/60th/80th percentiles), all construction sites were categorized into five resilience grades with relatively balanced sample distributions: Very Weak (13 sites; 21.3%), Weak (12 sites; 19.7%), Medium (12 sites; 19.7%), Strong (12 sites; 19.7%), and Very Strong (12 sites; 19.7%). As summarized in Table 4, the Very Weak and Weak groups exhibit a higher median accident frequency (4–5 incidents) and non-negligible casualty counts, whereas the Strong and Very Strong groups are distinguished by low accident frequencies (0–1 incidents) and typically near-zero casualties. Additionally, the MCS-derived confidence intervals for resilience scores are narrower in the Strong and Very Strong grade groups. Consistent tier assignments under small perturbations of indicator sets and sampling seeds suggest that the proposed evaluation is robust to moderate collinearity and distributional uncertainty at the current data scale.

Table 4.
Level ratio and typical characteristics.
Spatial mapping of site-level resilience grades reveals three distinct patterns:
- Low-resilience clusters tend to form in regions with harsh operating conditions (e.g., high wind exposure, foundation constraints), and these clusters are accompanied by wider MCS confidence intervals, indicating greater uncertainty in resilience assessments.
- High-resilience sites are more geographically dispersed, and they are typically characterized by strict adherence to standard operating procedures (SOPs) and robust quality control (QC) systems, with narrower MCS confidence intervals reflecting more reliable assessments.
- Medium-resilience grade belts frequently serve as transition zones between low- and high-resilience areas, exhibiting intermediate characteristics in both operating conditions and assessment uncertainty.
Management implications are tailored to align with these spatial patterns, as outlined below:
Low-resilience clusters: Implement a “halt–rectify–re-qualify” protocol, including temporary deactivation of high-risk operations, expert-led safety reviews, targeted remediation of foundation and structural connection issues, torque verification of critical components, and third-party acceptance testing prior to reactivation.
High-resilience areas: Adopt a “sustain–standardize–pre-alert” strategy, which involves maintaining existing SOP compliance and two-person safety check systems, documenting micro-incidents for root-cause analysis, and sustaining regular QC cadences to prevent performance degradation.
Transition zones: Focus on closed-loop improvement initiatives and experience codification (e.g., formalizing best practices from adjacent high-resilience sites), with the goal of elevating site resilience from the Medium to Strong grade.
To ensure temporal and cross-regional comparability of resilience assessments, the aforementioned quantile thresholds are consistently retained. For each geographic area, two map-level indicators are reported: (1) the grade mix (distribution of resilience grades) and (2) stability (the proportion of sites with narrow MCS confidence intervals). This dual-indicator approach ensures that management decisions account for both point estimates of resilience and the uncertainty associated with these estimates.
4.4. Analysis of Typical Cases
Table 5 reveals two contrasting resilience profiles among the typical cases: Very weak (A, B) versus Very strong (C, D). Cases A and B couple severe consequences (Severity 9/7) with high exposure (Freq. ≥ P75) and their MCS outputs show low means with wide 95% CIs, indicating unstable states and control gaps. Case A, a limit/wind failure escalating to capsize, resulted in 111 fatalities, >300 injuries, and 499.68 M in losses whose root causes include a non-retracted boom and weak foundation. Recommended actions are immediate stand-down, dual redundancy on critical subsystems, NDT of load paths, and a graded restart protocol. Case B, a connection/fastening defect leading to a fall, caused 19 deaths and ¥18 M in losses. Actions should emphasize closed-loop assembly QC, torque verification, and third-party acceptance testing. By contrast, Cases C and D exhibit low severity (both 1) and low frequency (≤P25), with high MCS means and narrow intervals, reflecting controlled processes and rapid correction. Case C (human-error impact) produced one injury with no financial loss. In this case, maintaining SOPs, implementing two-person checks, and logging micro-incidents are appropriate. Case D (manufacturing/assembly pin defect) incurred ¥0.1 M loss and was reversible and incoming/first-article quality control (QC), anti-drop pins, and checklist discipline are advised. Overall, “weak” profiles require halt-reinforce-re-qualify, whereas “strong” profiles call for sustain-standardize-pre-alert, underscoring that a high point estimate alone does not ensure stability without considering CI width and causal patterns.

Table 5.
Typical sample profiles and countermeasures.
5. Predictive Modeling & Feature Importance
This study employs resilience levels (Very Weak → Very Strong, five categories) as supervised labels, selecting five core indicators (fatalities, serious injuries, economic losses, severity factors, and accident frequency) as input features to construct a multi-class prediction model. The training and testing sets were divided using stratified sampling. The logistic regression model employed standardized preprocessing, while the random forest and gradient boosting models were directly trained on raw-scale data. Model configurations included multinomial logistic regression (multinomial LR), random forest (RF), and gradient boosting (GB), with Accuracy and Macro-F1 serving as unified evaluation metrics, and the prediction performance is shown as Table 6 and Figure 8.

Table 6.
Performance comparison of three models (test set).

Figure 8.
Confusion matrix: (a) LR, (b) RF, (c) GB.
Results show that both RF and GB outperform LR, achieving Accuracy and Macro-F1 scores of 0.812 and 0.785, respectively, compared to LR’s 0.688 and 0.660 (Table 6). Tree-based models demonstrated high stability in distinguishing Very Weak and Very Strong categories but exhibited confusion at the Moderate-Strong boundary (Figure 8). In contrast, LR’s linear assumption limited its discriminative power for intermediate categories. Overall, the resilience rating exhibited a pronounced nonlinear relationship with features, making RF and GB more suitable as primary models.
As is shown in Table 7 and Figure 9, feature-importance analysis indicates that accident frequency contributes most significantly to prediction outcomes, followed by fatalities and severity factors. The marginal contribution of serious injuries is relatively low, while economic losses exhibit the weakest direct discriminative power due to external influences such as regional construction costs, compensation standards, and insurance claims. These findings complement the earlier entropy-weighted results rather than replicate them one-to-one. EWM weights are driven by the dispersion of an indicator across cranes (information content in the sample), whereas RF/GB feature importance reflects the marginal contribution of each indicator to reducing prediction error in the classifiers. For example, an indicator that varies widely across sites but is only weakly associated with low-resilience cases can obtain a relatively high EWM weight but low RF/GB importance, whereas a rare but highly predictive early-warning signal may show the opposite pattern. At the management level, frequency control should therefore be the primary focus, supplemented by strict control of fatalities and injuries and stable control of severity. Economic losses should serve as an auxiliary reference for resource allocation and governance intensity.

Table 7.
Feature importance ratio and explanation (consensus importance, 0–1 normalization).
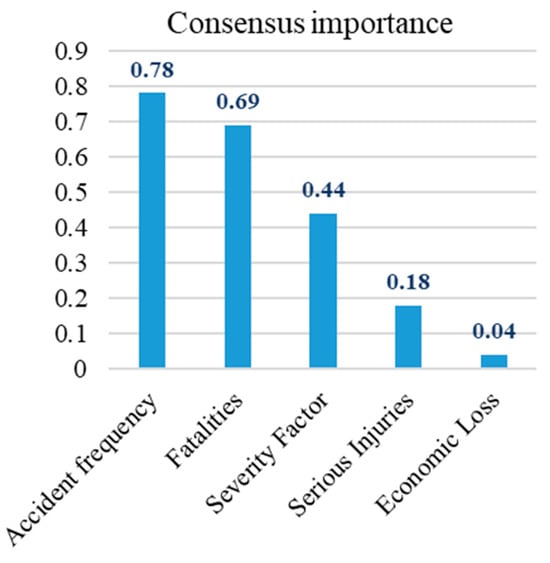
Figure 9.
Feature Importance Bar Chart (Consensus Importance, Normalized).
6. MBI–RDI Enhanced Framework for Tower Crane Resilience Evaluation
6.1. Index Construction and Mathematical Expression
To enable preemptive assessments when equipment remains undamaged and explicitly characterize the difficulty of “recovery from impact,” this paper constructs the Management Behavior Index (MBI) and Recovery Difficulty Index (RDI) within the baseline indicator system. First, the MBI measures weaknesses at the management/operational behavior level. For each tertiary risk item r, its occurrence frequency in the dataset is counted and Min-Max normalized. If the item matches a predefined management behavior lexicon Smgmt (e.g., “uninspected/unmaintained/non-compliant/misdirected/blind lifting/overloading”), a relative penalty weight γ ∈ [0,1] (default γ = 0.2) is applied to yield. The MBI tertiary risk item r (MBIr) can be calculated by
Smgmt is a defined management behavior lexicon, referring to a keyword collection (dictionary) specifically compiling terms/phrases that reflect management and operational behavioral issues. Its purpose is to search for these terms within text fields (e.g., “Tertiary Risk Factors,” “Accident Cause” descriptions). A match indicates the record carries a “management/behavioral misconduct” signal, used to calculate the MBI. When constructing the MBI, each record’s textual description is statistically analyzed for inclusion of terms from the management governance and personnel behavior categories—A match for management-related terms scores 1 point (e.g., “uninspected”, “unmaintained”, “non-compliant”, “regulations”, “training”, “review/approval”, “briefing”, “acceptance”, “maintenance/repair/supervision/oversight”). An additional point is awarded for hits in the personnel conduct category (e.g., “violation”, “non-compliance”, “erroneous command”, “risky operation”, “unfastened/unworn”, “fatigue”, “under the influence”, “poor communication/unclear signals”).
RDI is used to quantify the difficulty of “recovery from impact”: consequence-type indicators (severity factor, fatalities, serious injuries, economic losses) are each standardized to , and then weighted and summed to obtain:
The default weights are α = 0.5, β = 0.2, δ = 0.2, and η = 0.1, emphasizing the dominant role of severity in recovery processes (approval procedures, scope of work stoppage, public opinion pressure, etc.). Fatalities and serious injuries follow in importance, while economic losses carry a smaller weight due to significant variation in regional construction costs and claims settlement criteria. Both indices are normalized to [0,1], enabling direct integration with baseline risk scores to enhance preemptive identification of non-incident equipment and improve representation of recovery difficulty.
6.2. Integration with the Baseline Model
Let Rbase denote the baseline standardized risk score (see (Equation (9))). We define the extended risk score by incorporating MBI and RDI as soft penalties:
with fusion weights λ, ρ ∈ [0,1] (default λ = ρ = 0.10). This structure preserves comparability while improving ex-ante discrimination: even if incident frequency is zero, MBI > 0 (management weakness) and a context-driven RDI > 0 (e.g., configuration, operating regime, wind-load zoning) can downshift resilience appropriately, avoiding the naïve inference “zero events ⇒ very strong resilience.”
6.3. Experimental Settings
In the experimental design, resilience grading was implemented using equal-frequency quintiles to ensure that each of the five classes (Very Weak to Very Strong) contained approximately 20% of the samples, thus maintaining class balance for downstream prediction. Monte Carlo Simulation (MCS) was performed with a baseline sample size of N = 500, and robustness checks were conducted with N = 1000 and N = 3000, while the disturbance amplitude was increased from the 5% baseline to +10% and +15% to test stability.
A minimal appendix summarizes the cue lexicon, extraction workflow, and representative “raw text → MBI/RDI component” examples (see Appendix A).
6.4. Key Results and Analysis
Equal-frequency binning yields near 20% share per grade, ensuring balanced categories for evaluation and learning. Figure 10 illustrates the Top-10 tertiary risks categorized by MBI clusters, with a primary focus on the “signaling/command” and “operator actions” domains. Representative risks in these domains include insufficient pre-fixation of loads, improper elevator/crane operation, and erroneous signaling, all of which exhibit an MBI ranging from approximately 0.5 to 1.0. These are followed by other critical risks (not listed here for brevity) such as low safety awareness/unqualified personnel, blind lifts, operator fatigue, and procedural errors, with their MBI values falling between roughly 0.28 and 0.45.
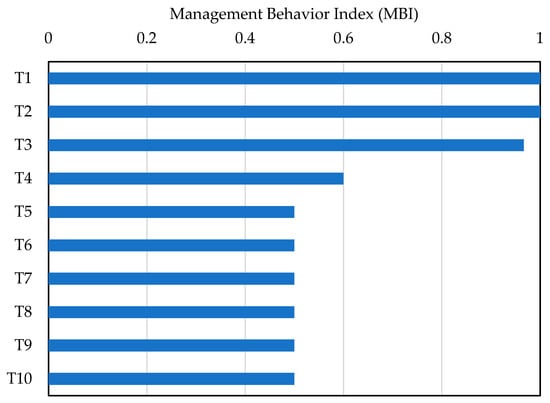
Figure 10.
Top 10 Management Behavior Sub-Index (MBI) for Level 3 Risk (T1 = The signalman failed to properly secure the suspended object; T2 = Elevator operator’s violation of regulations; T3 = Tasman’s illegal operation; T4 = Signalman’s erroneous command; T5 = elevator overload; T6 = Signal workers have a weak sense of safety; T7 = Unqualified signal worker; T8 = Tower blind hanging; T9 = Tutor fatigue; T10 = Construction procedure error).
These findings highlight three high-priority, high-impact intervention areas: (1) pre-lift load fixation and trial checks, (2) compliant slinging operations and standardized equipment operation, and (3) unified command terminology. To translate these insights into practice, it is recommended that key indicators—including operator license holding rate, pre-shift safety briefing coverage, zero-tolerance implementation for blind lifts, overload alarm trigger functionality, safety interlock integrity, and video sampling inspection compliance rate—be integrated into digital audit systems. This integration will form a closed-loop management process: MBI-based ranking → targeted rectification of high-impact risks → post-rectification reinspection. For example, tertiary risks with an MBI of ≥0.6 should be subject to 100% rectification to eliminate potential safety hazards.
Scatter plots illustrate a distinct negative correlation between the RDI and Resilienceext (Figure 11): higher recovery difficulty is associated with lower mean Resilienceext values. Notably, samples categorized as “Very Weak” or “Weak” in terms of Resilienceext tend to cluster in regions with high RDI values. This observation complements established engineering priors and confirms that the recovery dimension (a core component of Resilience assessment) is being effectively captured by the proposed framework.
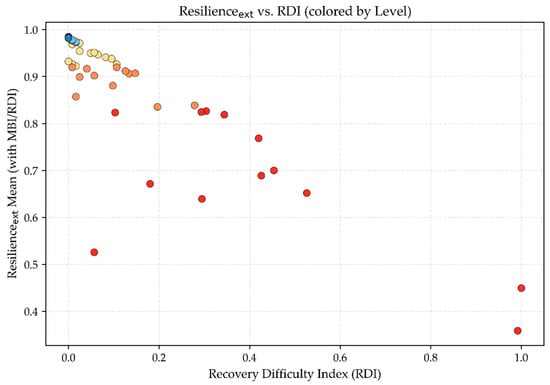
Figure 11.
RDI—Resilienceext Scatter.
Even for “no-incident” equipment with frequency = 0, units exposed to high-MBI contexts or high-RDI operating regimes are rationally down-weighted in resilience, preventing the erroneous conclusion that “no accidents imply very strong resilience.”
6.5. Sensitivity and Ablation Analysis
As is shown in Figure 12, varying N (to 1000/3000) or modestly inflating noise (+10%/+15%) has negligible effect on the global mean resilience (bars are short; ∣Δ∣< 10−3 for N, ≈ −0.001 for noise). In contrast, increasing λ or ρ from 0.05 to 0.20 produces appreciable changes (∣Δ∣ ≈ 0.005–0.007), indicating that management weakness and recovery difficulty are substantive drivers rather than tunable artefacts, i.e., parameter tuning cannot “mask” genuine management/recovery deficits and the model reflects them faithfully.
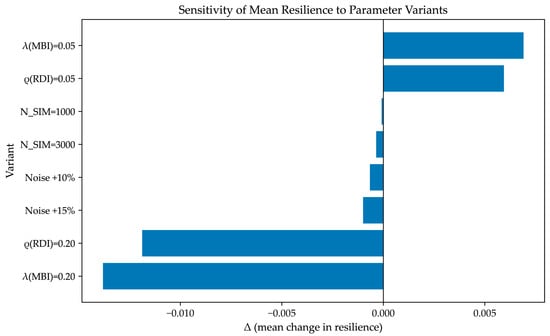
Figure 12.
Sensitivity analysis tornado diagram (the impact of weights and hyperparameters on average resilience).
A grid sensitivity study was conducted by varying the MBI weight λ ∈ {0, 0.05, 0.10, 0.20, 0.30} and the RDI weight ρ ∈ {0, 0.05, 0.10, 0.20, 0.30}, shown as Figure 13 and Figure 14. Two metrics were tracked: level stability (share of items retaining their baseline quantile grade) and the change in mean resilience (Δ). As shown in the two heatmaps, overall stability remained high. When λ/ρ ≈ 0.10, stability reached 1.00, i.e., perfect agreement with the baseline partition. Increasing either weight gradually reduced stability but it mostly stayed within 0.85–0.95 and only the strongest penalization (λ = 0.30, ρ = 0.30) lowered it to about 0.72–0.75, which is consistent with deliberately emphasizing management and recovery penalties. The mean resilience exhibited a monotonic decrease as λ, ρ increased, with a maximal drop of ≈−0.05 at λ = ρ = 0.30. Within the recommended operating range [0.05, 0.20], however, ∣Δ∣remained ≤ 0.02, indicating controllable adjustments rather than structural shifts. These patterns support λ ≈ 0.10 and ρ ≈ 0.10 as a default configuration, balancing interpretability, stability, and the explicit inclusion of management and recovery dimensions.
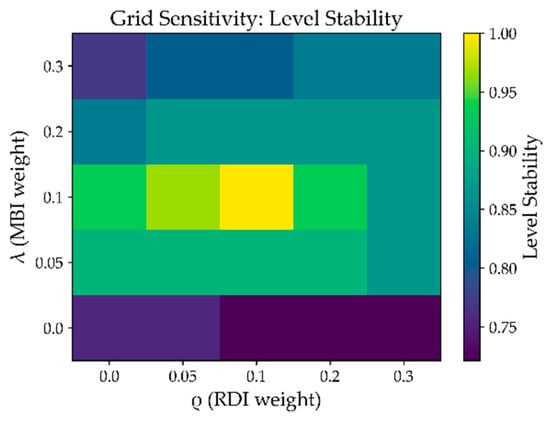
Figure 13.
Grid sensitivity level stability.
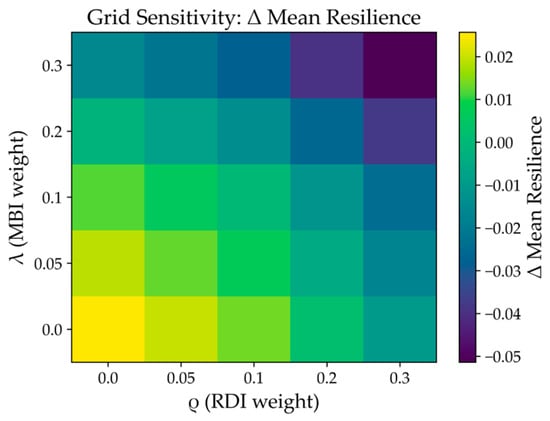
Figure 14.
Grid sensitivity mean delta.
An ablation on the zero-event subset (Accident Frequency = 0) further probed boundary behavior, shown as Figure S1 in the Supplementary Material. The baseline EWM + MCS model produced a mean resilience of 0.983, while the fused model yielded 0.980, a small downward correction. This confirms the intended effect: even without recorded accidents, textual evidence of management/behavioral weaknesses (MBI) or high recovery difficulty (RDI) introduces a measured penalty, thus avoiding passive overrating as “Very Strong.” Operationally, this enables low-cost prior corrections to trigger targeted audits and corrective actions.
Moderate weights (λ, ρ ≈ 0.10) are recommended for practice: they preserve grade stability, limit mean shifts, and surface actionable vulnerabilities, yielding a tunable, governance-aligned resilience assessment.
7. Conclusions & Future Work
7.1. Conclusions
This paper addresses the challenge of objectively quantifying and proactively predicting construction behavior resilience at the equipment level using tower crane accident data. It constructs an integrated framework comprising data governance-entropy weighting (EWM)—uncertainty propagation (MCS)—tier classification—supervised prediction—and explainable governance. The paper proposes the Management Behavior Index (MBI) and Recovery Difficulty Index (RDI), integrating them with a baseline model. Through multi-model comparison and feature importance analysis, it validates the predictability of classification results and the operability of governance levers, establishing an implementation pathway for enterprise digital platforms. The following conclusions can be drawn.
(1) The EWM + MCS assessment framework centers on five objective metrics (fatalities, serious injuries, economic losses, severity factors, and accident frequency) to generate distributed resilience outcomes expressed as mean +95% confidence interval. This approach better reflects uncertainty and robustness compared to static single-value scoring, demonstrating verifiable and reproducible computational properties across national samples.
(2) Entropy-weighted results indicate higher discriminative power for high-consequence indicators (serious injury, severity, fatality). MCS reveals broader intervals and stronger volatility in low-resilience groups, validating the governance principle of “prioritizing frequency control while strictly managing fatalities and injuries.”
(3) Using resilience grades (five-category classification) as supervision signals, comparisons of LR/RF/GB reveal that ensemble tree models (RF/GB) achieve superior Accuracy/Macro-F1 (e.g., 0.812/0.785) under nonlinearity, small sample sizes, and class imbalance conditions, validating the feasibility and practicality of the “assessment-prediction” closed-loop system.
(4) Feature importance (RF/GB consensus) indicates: accident frequency contributes most significantly, followed by fatalities and severity. Serious injuries show reduced marginal contribution due to correlation effects, while economic losses exhibit weak direct discriminative power due to measurement discrepancies. This complements entropy-weighted results, providing quantitative support for the “frequency control—casualty control—severity stabilization” approach.
(5) Incorporating MBI/RDI enables preemptive assessment of non-failing or low-frequency equipment: MBI identifies actionable weaknesses in management and operational practices, while RDI shows significant negative correlation with resilience mean, revealing the concurrent suppression of resilience by “high severity × high recovery load.” The integrated scoring system exhibits low sensitivity to binning and hyperparameters, demonstrating strong engineering applicability and transferability.
(6) This approach establishes an end-to-end implementation pathway from data cleansing—weighting—random simulation—grading—prediction—to governance. It can be directly embedded into enterprise digital safety platforms to support differentiated remediation, optimal resource allocation, and continuous improvement.
The proposed equipment-level framework is directly actionable in construction safety management. In routine operation, objective weights (EWM) can be recomputed on a monthly/quarterly cycle from site logs, while a rolling Monte Carlo step provides a resilience grade with a 95% confidence interval for each crane. Threshold-based actions are straightforward: Very Weak/Weak grades trigger targeted inspections (structural and electrical), load-history review, and refresher training for operators; Moderate prompts enhanced monitoring; Strong/Very Strong support normal operation with periodic auditing. When telemetry is available, IoT/BIM integration enables near-real-time updates (e.g., wind alarms, overload events, downtime episodes) and a dashboard where MBI (management behavior) and RDI (recovery difficulty) act as leading indicators to prioritize cranes and allocate supervision resources.
7.2. Limitations and Outlook
This study evaluates tower crane resilience at the equipment level using the objective Entropy Weight Method (EWM) and uncertainty-aware Monte Carlo Simulation (MCS) for scoring, and several limitations and potential biases of this research should be noted, with corresponding mitigation measures proposed, along with directions for future work. On the one hand, potential biases primarily manifest in multi-source accident data, including the under-reporting of minor, non-injury events, geographical skew toward regions with more transparent reporting, and time-varying standards and definitions across data sources. These risks are mitigated by standardizing definitions across sources, de-duplicating records, propagating residual uncertainty through interval-valued MCS outputs to reflect reporting uncertainty, and adopting repeated cross-validation when training auxiliary grade-prediction models. On the other hand, the research also has inherent limitations. First, process-level variables (e.g., downtime and repair cycles) were not consistently available and are reserved for future integration with the Internet of Things (IoT) and Building Information Modeling (BIM), which results in current resilience grades emphasizing outcomes and exposure more than recovery dynamics. Second, despite redundancy screening and stability checks, correlated indicators may still persist. Third, the settings of Monte Carlo Simulation were determined based on a trade-off between convergence and cost, and broader perturbation ranges or a significantly greater number of runs could widen result intervals even if qualitative grading remained stable in the tests. It is worth noting that the framework remains applicable even with incomplete or regionally inconsistent datasets, as the objective weighting of EWM and interval scoring of MCS make uncertainties explicit, though grade intervals may be widened accordingly. For future work, validation will be extended to external datasets and other types of lifting equipment to examine domain shift. Region-specific calibration and post-stratification weights will be applied to correct for observable imbalances such as site type, project scale, and region. Additionally, a minimal data-completeness checklist (including fatalities, serious injuries, event date, and location) will be adopted prior to large-scale deployment of the framework.
Four extensions will further enhance generalizability and operational value:
(1) External validation across datasets and equipment. Future work will test the framework on multi-region datasets and related lifting equipment (e.g., mobile cranes) to examine domain shift. Stratified evaluation by site type, project scale, and regulatory context will clarify when re-calibration of indicator ranges is necessary.
(2) Organizational and human factors. To capture management and behavioral influences, the indicator set will be augmented with measurable proxies such as safety-training intensity, near-miss reporting rate, toolbox-meeting regularity, supervisor-to-crew ratio, and safety-culture survey scores. These variables will be incorporated using the same objective-weighting logic to avoid subjective bias.
(3) Dynamic, real-time assessment via IoT/BIM data streams. An IoT/BIM-integrated pipeline will enable rolling updates of resilience scores by fusing telemetry (operation time, overload alarms, wind conditions), maintenance logs (downtime, repair cycles), and schedule context from BIM. Rolling-window weighting (EWM) combined with streaming uncertainty propagation (MCS) can support early warning dashboards and targeted interventions while preserving the current interpretability and grading scheme.
(4) Prospective pilot studies will be conducted on ongoing projects spanning multiple regions and various crane types, in accordance with pre-specified protocols: external hold-outs for grade prediction, cross-equipment benchmarking against equal-weight and expert-weight baselines, and back-testing of early-warning performance using IoT logs and incident reports. This program will document domain shift, concept drift, and the operational cost/benefit of intervention triggers.
Supplementary Materials
The following supporting information can be downloaded at: https://www.mdpi.com/article/10.3390/buildings15234280/s1, Figure S1: Ablation zero event bar.
Author Contributions
Conceptualization, M.X. and H.Z.; methodology, M.X. and H.Z.; software, M.X.; validation, M.X.; formal analysis, M.X.; investigation, M.X.; writing—original draft preparation, M.X.; writing—review and editing, M.X. and H.Z.; supervision, H.Z.; project administration, M.X. and H.Z.; funding acquisition, M.X. All authors have read and agreed to the published version of the manuscript.
Funding
This research was funded by China Postdoctoral Science Foundation under grant number 2025M773283, Shanghai Science and Technology Innovation Plan under Grant Number 24YF2720700 and the Research and Innovation Program of Shanghai Research Institute of Building Sciences Group Ltd. under Grant Number KY10000249.20230031.
Data Availability Statement
The data presented in this study are available on request from the corresponding author.
Conflicts of Interest
Author Mingze Xu was employed by the company Shanghai Jianke Engineering Consulting Co., Ltd. Author Hongbo Zhou was employed by the company Shanghai Research Institute of Building Sciences Group Co., Ltd.
The authors declare that this study received funding from Shanghai Research Institute of Building Sciences Group Ltd. The funder was not involved in the study design, collection, analysis, interpretation of data, the writing of this article or the decision to submit it for publication.
Abbreviations
| Abbreviation | Full Name | Abbreviation | Full Name |
| AHP | Analytic Hierarchy Process | IoT | Internet of Things |
| BIM | Building Information Modeling | LR | Logistic Regression |
| CI | Confidence Interval | MBI | Management Behavior Index |
| CNY | Chinese Yuan | MCS | Monte Carlo Simulation |
| EWM | Entropy Weight Method | PPE | Personal Protective Equipment |
| GB | Gradient Boosting | QC | Quality Control |
| R4 | Robustness, Redundancy, Resourcefulness, Rapidity | RDI | Recovery Difficulty Index |
| RF | Random Forest | SOP | Standard Operating Procedure |
Appendix A. Extraction of MBI and RDI Indicators
Appendix A.1. Cue Lexicon and Rules
The Management Behavior Index (MBI) is based on simple keyword cues extracted from the English descriptions of SecondaryRisk and TertiaryRisk. In this study, typical management-related cues include, for example, “maintenance”, “repair”, “routine inspection”, “equipment inspection”, “safety supervision”, “technical briefing”, “method statement”, and “safety training”. Typical behavior-related cues include “rule violation”, “unsafe operation”, “improper signaling”, “overloading”, “failure to fasten”, and “failure to wear PPE”. For each accident record, if at least one management-related cue is present, the management_flag is set to 1; otherwise, 0. If at least one behavior-related cue is present, the behavior_flag is set to 1; otherwise, 0. The record-level score is mgmt_score = management_flag + behavior_flag ∈ {0, 1, 2}. For each tertiary risk category, the MBI is obtained by averaging mgmt_score over all associated records and rescaling the result to [0,1] using Min–Max normalization.
The Recovery Difficulty Index (RDI) combines the normalized severity factor and smoothed accident frequency for each tertiary risk, as defined in the main text. Higher RDI values correspond to risk factors that are both more severe and more frequent in historical data.
Appendix A.2. Extraction Workflow and Example
The extraction workflow is keyword-based and automatic: the cue lexicon is first defined from a qualitative review of tower-crane accident reports, then all records are automatically scanned for these cues in the SecondaryRisk and TertiaryRisk fields. One researcher checks the tagged results and refines the lexicon where obvious false positives or negatives occur. The final tagging is then applied to the full dataset.
As an illustration, the tertiary risk description “Failure to carry out required equipment maintenance; routine inspections inadequate” contains the management-related cues “maintenance” and “routine inspections”. In this case, management_flag = 1 and behavior_flag = 0, so mgmt_score = 1 for that record. After averaging mgmt_score across all similar records and normalizing to [0,1], the corresponding tertiary risk category obtains an above-average MBI. If this category is also associated with relatively high severity and frequency, it will simultaneously exhibit a high RDI in the integrated framework.
References
- JGJ 196-2010; Technical Specification for Safety Installation Operation and Dismantlement of Tower Crane in Construction. Ministry of Housing and Urban-Rural Development of China, China Architecture & Building Press: Beijing, China, 2010. (In Chinese)
- Bruneau, M.; Chang, S.E.; Eguchi, R.T.; Lee, G.C.; O’Rourke, T.D.; Reinhorn, A.M.; Shinozuka, M.; Tierney, K.; Wallace, W.A.; Von Winterfeldt, D. A Framework to Quantitatively Assess and Enhance the Seismic Resilience of Communities. Earthq. Spectra 2003, 19, 733–752. [Google Scholar] [CrossRef]
- Cimellaro, G.P.; Reinhorn, A.M.; Bruneau, M. Framework for analytical quantification of disaster resilience. Eng. Struct. 2010, 32, 3639–3649. [Google Scholar] [CrossRef]
- Cimellaro, G.P.; Reinhorn, A.M.; Bruneau, M. Seismic resilience of a hospital system. Struct. Infrastruct. Eng. 2010, 6, 127–144. [Google Scholar] [CrossRef]
- Hosseini, S.; Barker, K.; Ramirez-Marquez, J.E. A review of definitions and measures of system resilience. Reliab. Eng. Syst. Saf. 2016, 145, 47–61. [Google Scholar] [CrossRef]
- Panteli, M.; Mancarella, P. Influence of extreme weather and climate change on the resilience of power systems: Impacts and possible mitigation strategies. Electr. Power Syst. Res. 2015, 127, 259–270. [Google Scholar] [CrossRef]
- Zobel, C.W.; Khansa, L. Characterizing multi-event disaster resilience. Comput. Oper. Res. 2014, 42, 83–94. [Google Scholar] [CrossRef]
- Sheffi, Y. The Resilient Enterprise: Overcoming Vulnerability for Competitive Advantage; MIT Press: Cambridge, MA, USA, 2005. [Google Scholar]
- Christopher, M.; Peck, H. Building the Resilient Supply Chain. Int. J. Logist. Manag. 2004, 15, 1–14. [Google Scholar] [CrossRef]
- Qin, K. Study on the Toughness Improvement of the Construction Safety Management System of Super High-Rise Buildings. Master’s Thesis, Beijing University of Civil Engineering and Architecture, Beijing, China, 2024. (In Chinese). [Google Scholar] [CrossRef]
- Zhang, Y. Evaluation and Improvement Strategy of Subway Construction Safety System Resilience: A Case Study of Section A of Beijing Rail Transit Line 22. Master’s Thesis, Liaoning Technical University, Liaoning, China, 2024. (In Chinese). [Google Scholar] [CrossRef]
- Li, Y. Research on Resilience of Construction Safety Management System for Old Industrial Building Renovation. Master’s Thesis, Xi’an University of Architecture and Technology, Xi’an, China, 2022. (In Chinese). [Google Scholar] [CrossRef]
- Sesana, M.M.; Dell’Oro, P. Sustainability and Resilience Assessment Methods: A Literature Review to Support the Decarbonization Target for the Construction Sector. Energies 2024, 17, 1440. [Google Scholar] [CrossRef]
- Shapira, A.; Lyachin, B. Identification and Analysis of Factors Affecting Safety on Construction Sites with Tower Cranes. J. Constr. Eng. Manag. 2009, 135, 24–33. [Google Scholar] [CrossRef]
- Wang, J.; Zhang, Q.; Yang, B.; Zhang, B. Vision-Based Automated Recognition and 3D Localization Framework for Tower Cranes Using Far-Field Cameras. Sensors 2023, 23, 4851. [Google Scholar] [CrossRef]
- Zhong, H.; Chen, L.; Antwi-Afari, M.F.; Bao, Z.; Chen, K. Dynamic risk assessment of tower crane operations by integrating functional resonance analysis method and Bayesian Network. Dev. Built Environ. 2025, 23, 100699. [Google Scholar] [CrossRef]
- Chian, E.Y.T.; Goh, Y.M.; Tian, J.; Guo, B.H. Dynamic identification of crane load fall zone: A computer vision approach. Saf. Sci. 2022, 156, 105904. [Google Scholar] [CrossRef]
- Zhu, Y.; Tian, D.; Yan, F. Effectiveness of entropy weight method in decision-making. Math. Probl. Eng. 2020, 2020, 1–5. [Google Scholar] [CrossRef]
- Wu, R.M.X.; Zhang, Z.; Yan, W.; Fan, J.; Gou, J.; Liu, B.; Gide, E.; Soar, J.; Shen, B.; Fazal-E-Hasan, S.; et al. A comparative analysis of the principal component analysis and entropy weight methods to establish the indexing measurement. PLoS ONE 2022, 17, e0262261. [Google Scholar] [CrossRef]
- Tixier, A.J.; Hallowell, M.R.; Rajagopalan, B. Construction safety risk modeling and simulation. Risk Anal. 2017, 37, 1917–1935. [Google Scholar] [CrossRef] [PubMed]
- Namazian, A.; Yakhchali, S.H.; Yousefi, V.; Tamošaitienė, J. Combining Monte Carlo simulation and Bayesian networks methods for assessing completion time of projects under risk. Int. J. Environ. Res. Public Health 2019, 16, 5024. [Google Scholar] [CrossRef] [PubMed]
- Alkaissy, M.; Arashpour, M.; Golafshani, E.M.; Hosseini, M.R.; Khanmohammadi, S.; Bai, Y.; Feng, H. Enhancing construction safety: Machine learning-based classification of injury types. Saf. Sci. 2023, 162, 106102. [Google Scholar] [CrossRef]
- Zermane, A.; Tohir, M.Z.M.; Zermane, H.; Baharudin, M.R.; Yusoff, H.M. Predicting fatal falls from heights accidents using random forest classification machine learning model. Saf. Sci. 2023, 159, 106023. [Google Scholar] [CrossRef]
- Shin, Y.; Lee, Y. Application of stochastic gradient boosting approach to early prediction of safety accidents at construction site. Adv. Civ. Eng. 2019, 2019, 1574297. [Google Scholar] [CrossRef]
- Shannon, C.E. A mathematical theory of communication. Bell Syst. Tech. J. 1948, 27, 379–423. [Google Scholar] [CrossRef]
- Shannon, C.E. A mathematical theory of communication. Bell Syst. Tech. J. 1948, 27, 623–656. [Google Scholar] [CrossRef]
- Melchers, R.E. Structural Reliability Analysis and Prediction, 2nd ed.; John Wiley & Sons: Chichester, UK, 1999. [Google Scholar]
- Au, S.-K.; Beck, J.L. Estimation of small failure probabilities in high dimensions by subset simulation. Probabilistic Eng. Mech. 2001, 16, 263–277. [Google Scholar] [CrossRef]
Disclaimer/Publisher’s Note: The statements, opinions and data contained in all publications are solely those of the individual author(s) and contributor(s) and not of MDPI and/or the editor(s). MDPI and/or the editor(s) disclaim responsibility for any injury to people or property resulting from any ideas, methods, instructions or products referred to in the content. |
© 2025 by the authors. Licensee MDPI, Basel, Switzerland. This article is an open access article distributed under the terms and conditions of the Creative Commons Attribution (CC BY) license (https://creativecommons.org/licenses/by/4.0/).