Article

Synergistic Role of Recycled Concrete Aggregates and Hybrid Steel Fibers in Roller-Compacted Concrete Pavements: A Multi-Criteria Assessment for Eco-Efficiency Optimization

1
ARISE, ISISE, Department of Civil Engineering, University of Minho, 4800-058 Guimarães, Portugal
2
ISISE, Department of Civil Engineering, University of Coimbra, 3030-788 Coimbra, Portugal
*
Authors to whom correspondence should be addressed.
Buildings 2025, 15(23), 4279; https://doi.org/10.3390/buildings15234279
Submission received: 2 November 2025 / Revised: 22 November 2025 / Accepted: 25 November 2025 / Published: 26 November 2025

Abstract

This study examines the synergistic influence of recycled concrete aggregates (RCAs), industrial steel fibers (ISFs), recycled steel fibers (RSFs), and hybrid ISF/RSF (HSF) on the structural, durability, and environmental performance of roller-compacted concrete pavement (RCCP). Twenty mixtures were prepared with 0 and 50% RCA and fiber dosages of 0–0.9%, including plain, single-fiber, and HSF systems. Compressive, splitting tensile, and flexural strengths, as well as freeze–thaw resistance up to 300 cycles, were experimentally evaluated. Environmental performance was quantified through a cradle-to-gate life cycle assessment (LCA) covering nine impact categories and integrated with a multi-criteria decision analysis (MCDA) using the weighted sum method (WSM) and technique for order of preference by similarity to ideal solution (TOPSIS). Results indicate that 50% RCA replacement reduced compressive strength by ~21% but decreased global warming potential (GWP) by 15%. Hybrid fiber reinforcement significantly improved mechanical and durability properties, achieving up to 51% higher tensile strength and >85% strength retention after 300 freeze–thaw cycles compared with the control mix. The LCA showed notable reductions in GWP, acidification potential, and non-renewable energy demand when ISF and natural aggregates were partially substituted with RSF and RCA. The MCDA identified N50_R50_ISF0.3_RSF0.3 (50% RCA with 0.6% HSF) as the optimal mixture, achieving the highest eco-efficiency index (WSM = 0.80; TOPSIS = 0.73). These findings confirm that integrating RCA with hybrid steel fibers enhances the mechanical and durability performance of RCCP while substantially reducing environmental burdens, providing a viable strategy for low-carbon and circular pavement construction.

1. Introduction

The construction industry plays a significant role in global environmental degradation, accounting for over one-third of natural resource consumption, energy use, and greenhouse gas (GHG) emissions [1,2,3,4]. Concrete infrastructure, in particular, is a major contributor to embodied carbon and resource depletion due to its high demand for virgin aggregates, cement, and industrial additives [5,6,7,8]. As sustainability becomes a central objective in civil infrastructure development, the need to reduce the environmental footprint of concrete pavement systems while maintaining high mechanical and durability performance has become increasingly urgent [9,10].
Roller-compacted concrete pavement (RCCP) has emerged as a sustainable alternative to conventional pavement systems due to its low cement content, reduced water usage, and rapid construction method involving heavy compaction. RCCP is commonly used in industrial, highway, and airfield applications because of its structural efficiency and cost-effectiveness [11,12]. However, conventional RCCP relies heavily on virgin natural aggregates (NAs) and industrial steel fibers (ISFs), which are associated with high energy consumption and GHG emissions during production and transportation [13,14,15,16]. Improving the eco-efficiency of RCCP requires integrating recycled materials that reduce environmental impact without compromising structural integrity [17]. One promising strategy is the incorporation of recycled concrete aggregates (RCAs), which are sourced from construction and demolition waste. Their use contributes to waste reduction, landfill diversion, and raw material conservation, supporting circular economy goals [18,19,20]. However, the application of RCA is often limited by its adverse effects on mechanical properties, including reduced compressive and tensile strength and lower freeze–thaw resistance due to higher porosity and weaker interfacial transition zones [21,22,23]. To mitigate these deficiencies, fiber reinforcement is commonly employed. Industrial steel fibers are effective in enhancing the tensile, flexural, and post-cracking behavior of concrete [24,25,26,27,28,29,30]. Nevertheless, the environmental burden associated with their manufacture has raised concerns. In contrast, recycled steel fibers (RSFs), often recovered from end-of-life tires or industrial scrap, offer a low-cost, low-carbon alternative with considerable mechanical potential [23,24,25]. RSFs have demonstrated improvements in crack control, toughness, and energy absorption, though their performance varies depending on content and dispersion [26,27].
Recent studies suggest that hybrid steel fiber (HSF) systems, combining ISF and RSF, may generate synergistic effects that outperform single-fiber systems [28,29]. ISFs provide structural stiffness, while RSFs contribute ductility and multi-directional crack control due to their irregular geometry [30,31]. When combined, these fibers can effectively compensate for the mechanical deficiencies caused by RCA and enhance durability against freeze–thaw-induced deterioration. This synergistic effect arises from multi-scale crack stabilization, where RSFs contribute to micro-level crack bridging and ISFs improve macro-level crack resistance and fiber pull-out performance, resulting in superior overall behavior compared to mixtures reinforced with either fiber type alone [32,33]. However, few studies have comprehensively investigated the integration of RCA and HSF in RCCPs, particularly with respect to freeze–thaw durability and environmental sustainability assessed via life cycle methodologies [34,35,36]. Moreover, existing studies rarely utilize multi-criteria decision analysis (MCDA) to balance performance and sustainability in identifying optimal mixture designs [37,38,39].
It is hypothesized that combining RCA and hybrid fibers (ISF + RSF) in RCCP will result in a synergistic improvement in mechanical performance and freeze–thaw durability while reducing environmental impacts through the valorization of recycled materials. The theoretical justification lies in the complementary action of fiber types, where ISF imparts high load resistance and RSF enhances ductility and crack arresting ability, counteracting the structural deficiencies caused by RCA’s porous and weak aggregate surfaces. Additionally, substituting NAs and ISFs with recycled alternatives (RCAs and RSFs) is expected to reduce global warming potential (GWP), acidification potential (AP), and non-renewable energy demand (PE-NRe), enhancing the overall eco-efficiency of RCCP. To test this hypothesis, the present study investigates the combined effects of RCA content (50%, by volume) and steel fiber type/dosage (ISF, RSF, HSF at 0–0.9% by volume fraction) on the mechanical properties, freeze–thaw resistance, and life cycle environmental impacts of RCCP. Twenty RCCP mixtures were designed and subjected to compressive, tensile, and flexural strength tests, as well as freeze–thaw durability assessments over 100, 200, and 300 cycles. Environmental impacts were evaluated using a cradle-to-gate life cycle assessment (LCA) across nine categories. Finally, the MCDA employing the weighted sum method (WSM) and TOPSIS was used to identify the most eco-efficient mixture. This study contributes a comprehensive experimental and environmental framework for the development of sustainable RCCP using waste-derived aggregates and fibers, advancing the principles of cleaner production, resource circularity, and low-carbon infrastructure design.

2. Materials and Methods

A total of twenty RCCP mixtures were prepared and grouped into two categories based on the replacement level of NA with RCA: 0 and 50% by mass. Each group consisted of ten mixes: a plain control (no fibers), ISF-only and RSF-only mixes at 0.3%, 0.6%, and 0.9% by volume fraction, and HSF combining ISF and RSF equally. Mix codes follow the format N100_R0_ISF0.3_RSF0, where “N100” and “R0” indicate 100% NA and 0% RCA, respectively, with fiber dosages specified accordingly. This grouping structure was applied consistently in both the mixture design table and the organization of results. Next, mechanical properties (compressive, splitting tensile, and flexural strength at 28 days) and durability (strength retention after 100, 200, and 300 freeze–thaw cycles) were evaluated. Each test was performed on four replicate specimens. Results are reported as mean values, with the coefficient of variation (CoV) used to express data variability. To ensure statistical validity, outliers were identified and removed using Grubbs’ Test, Dixon’s Q Test, and boxplot analysis. In all figures, both the error bars and the values in parentheses represent the CoV (%) for each set of results.

2.1. Materials

2.1.1. Aggregates

The coarse and fine aggregates used in this study were selected and evaluated in accordance with the guidelines specified in ACI 211.3R and ACI 325.10R. All relevant physical and mechanical properties were determined, following ASTM standards to ensure suitability for RCCP applications. RCA, ranging from 4.76 to 23.00 mm, was produced by crushing OPC concrete cylinders with an average compressive strength of 40 MPa. To ensure consistent quality, the RCA was further processed by manual crinkling, washing, filtering, and sieving to remove fines and contaminants. Natural coarse aggregate (crushed granite, CG) in the size range of 4.76–22.50 mm (supplied by Secil) and natural fine aggregate (river sand, RS) with a particle size range of 0–4.76 mm were also used in the mixtures (also supplied by Secil). In addition, the silt (fines) content of RS was measured according to ASTM C117 and found to be 1.8%, which complies with the ASTM C33 limit of ≤3% for fine aggregates used in structural concrete. This parameter is essential for frost resistance, as excessive fines can increase water absorption and susceptibility to freeze–thaw deterioration. RS was further classified as a naturally occurring siliceous sand, while both CG and RCA were identified as angular crushed aggregates with high mechanical interlock potential, contributing to improved compaction and freeze–thaw durability. Figure 1 presents the particle size distribution curves for the combined aggregates used in the two RCA replacement groups: (a) N100_R0, and (b) N50_R50. All gradation curves fall within the upper and lower limits specified by ACI 211.3R, confirming the use of well-graded aggregates suitable for high-density RCCP.
The physical properties of the aggregates were characterized using standardized test methods: ASTM C127 for coarse aggregate specific gravity, ASTM C128 for fine aggregates, ASTM C29 for bulk density and void content, ASTM C136 for particle size distribution, and ASTM C117 for fines content. These additional parameters ensure comprehensive characterization of aggregates influencing frost resistance and durability. The key physical characteristics of the aggregates are summarized in Table 1.

2.1.2. Cement, Water and Admixture

The binder used in this study was OPC classified as CEM I 42.5R (Robustek, Lisbon, Portugal), a high-early strength Portland limestone cement conforming to the requirements of EN 197-1. Its chemical composition, expressed as weight percentages relative to total cement mass, is presented in Table 2. Compressive strength tests confirmed early-age performance of 20 MPa at 2 days and a 28-day strength of 42.5 MPa. The cement (Cem) was supplied by a local manufacturer and stored in a temperature-controlled, low-humidity environment to prevent premature hydration due to moisture exposure. Its measured specific gravity was 3.18 g/cm3.
Potable tap water (Wat) was used for all mixing and curing processes. The water was free from organic matter and substances known to hinder cement hydration and complied with the quality requirements specified in ASTM C1602. Finally, a polycarboxylate-based superplasticizer (SP), commercially known as Master Glenium SKY 617 (BASF), was added at dosages ranging from 3.4 to 10.2 kg/m3 to maintain adequate workability, particularly in mixtures with reduced water content and higher fiber content.

2.1.3. Fibers

To enhance the mechanical performance, durability, and sustainability of the RCCP mixtures, two types of steel fibers were incorporated: ISF and RSF. Their physical forms are shown in Figure 2. The ISFs were commercially produced hooked-end fibers, 33 mm in length, (model HE 55/33, supplied by ArcelorMittal) and widely used in structural concrete for their consistent geometry and proven mechanical performance. In contrast, RSFs were sourced from post-consumer tires through a mechanical shredding process (provided by a Portuguese private company), supporting waste valorization and circular economy principles. These fibers exhibited irregular geometries and non-uniform dimensions, with variability in both length and diameter. The relatively high variation observed in RSF length (approximately 38%) is inherent to the shredding process, which produces fibers of irregular shape and size rather than uniform industrial-grade geometry. This variability is typical of recycled tire-derived fibers and may influence tensile and flexural responses, as the effectiveness of crack-bridging depends on fiber length and anchorage. To ensure representative characterization, the geometry of RSFs was statistically evaluated from a sample of 3000 fibers, and average values were reported. A summary of the key physical and mechanical properties of both fiber types is presented in Table 3.

2.2. Methods

2.2.1. Specimen Mixture and Preparation

A total of twenty RCCP mixtures were designed in accordance with ACI 211.1-91. Each group consisted of ten mixtures, including one control mix as plain RCCP (0% ISF and 0% RSF). Compaction was optimized using the Modified Proctor Test (ASTM D1557) to determine the optimum moisture content (OMC) and the corresponding maximum dry density (MDD). Water content was incrementally adjusted, and the OMC was identified as the water content at MDD. Based on the OMC, water-to-cement (Wat/Cem) ratios and material quantities were calculated per cubic meter, as shown in Table 4.
Dry materials (cement and aggregates) were initially mixed for one minute. Fibers were then gradually added, followed by water and superplasticizer (SP), to ensure uniform distribution and prevent clumping. The mixture was blended for an additional five minutes to achieve a homogeneous consistency. Fresh RCCP was cast into cylindrical molds (150 × 300 mm) and prismatic molds (150 × 150 × 600 mm) for mechanical and durability testing.
Compaction was performed using an electric vibrating hammer, in accordance with ASTM C1435, applying three layers per specimen. Each layer was compacted for a maximum of 20 s or until a visible ring of mortar appeared, indicating sufficient consolidation. After 24 h, the specimens were demolded and cured in water at 23 ± 2 °C for 28 days, as per ASTM C192/C192M.

2.2.2. Mechanical Test Procedures

The mechanical performance of RCCP specimens was evaluated through uniaxial compressive strength, splitting tensile strength, and three-point notched beam bending tests (3PNBBT). All tests were conducted in accordance with relevant standards to ensure accuracy and repeatability.
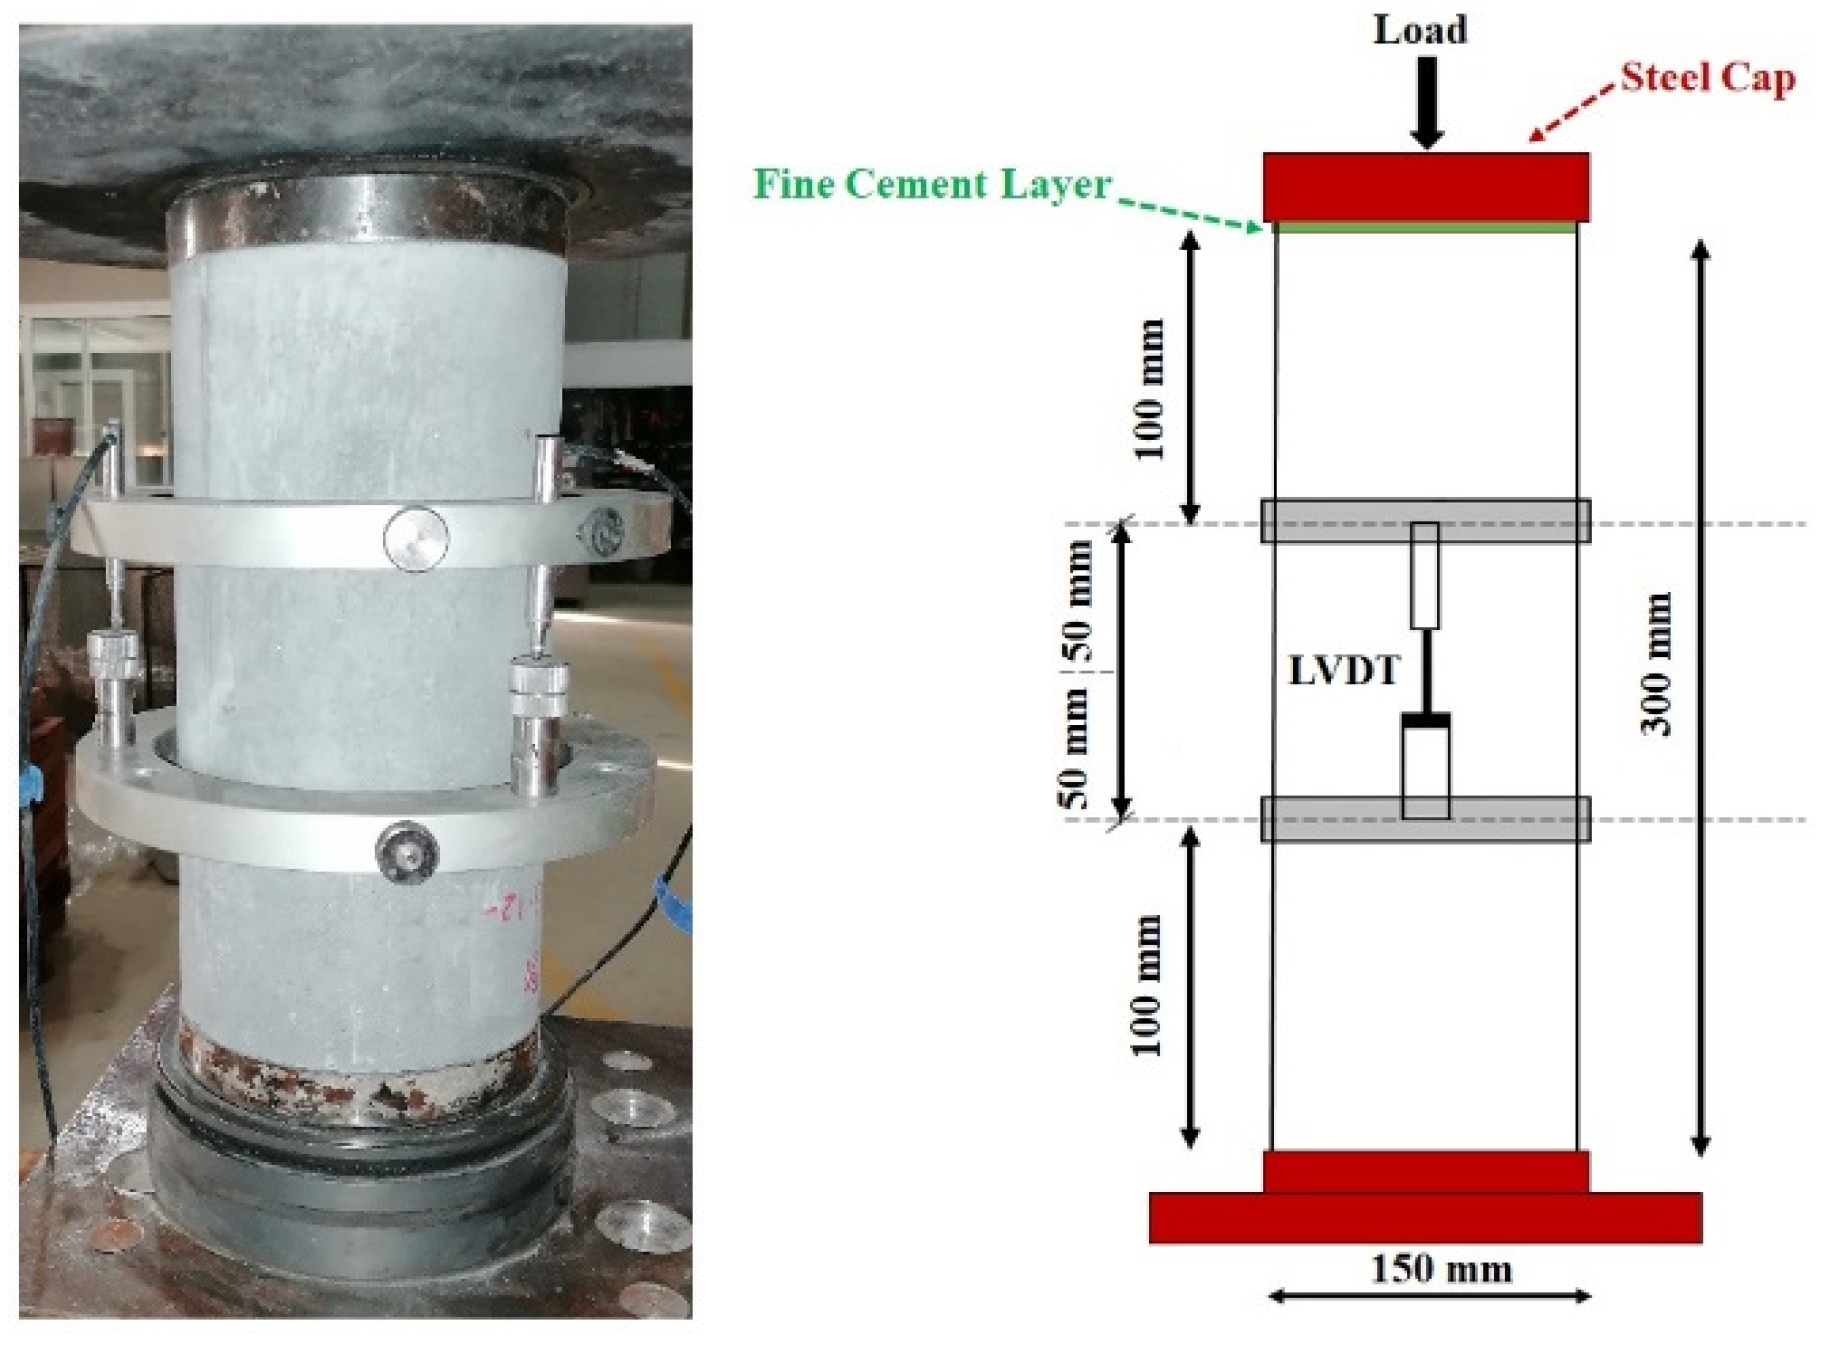
The uniaxial compressive strength ( f c m ), secant modulus of elasticity ( E c m ) were determined after 28 days of curing, following NP EN 12390-3:2011 and NP EN 12390-13:2014, respectively. Tests were carried out on cylindrical specimens (150 mm × 300 mm) using a servo-controlled universal testing machine with a maximum capacity of 2000 kN. Axial displacement was monitored using an internal displacement transducer integrated into the test system, which was used as the control variable during loading. The compressive strength was calculated based on the peak load applied to the specimen. The modulus of elasticity was derived from the slope of the stress–strain curve in the linear region of the response. Compressive toughness ( T o u g _ C o m p )   defined as the area under the stress–displacement curve up to 0.33 of peak compressive strength, quantifies the energy absorption of RCCP mixtures [40]. The experimental setup and instrumentation used for these tests are presented in Figure 3, including equipment layout and monitoring system.
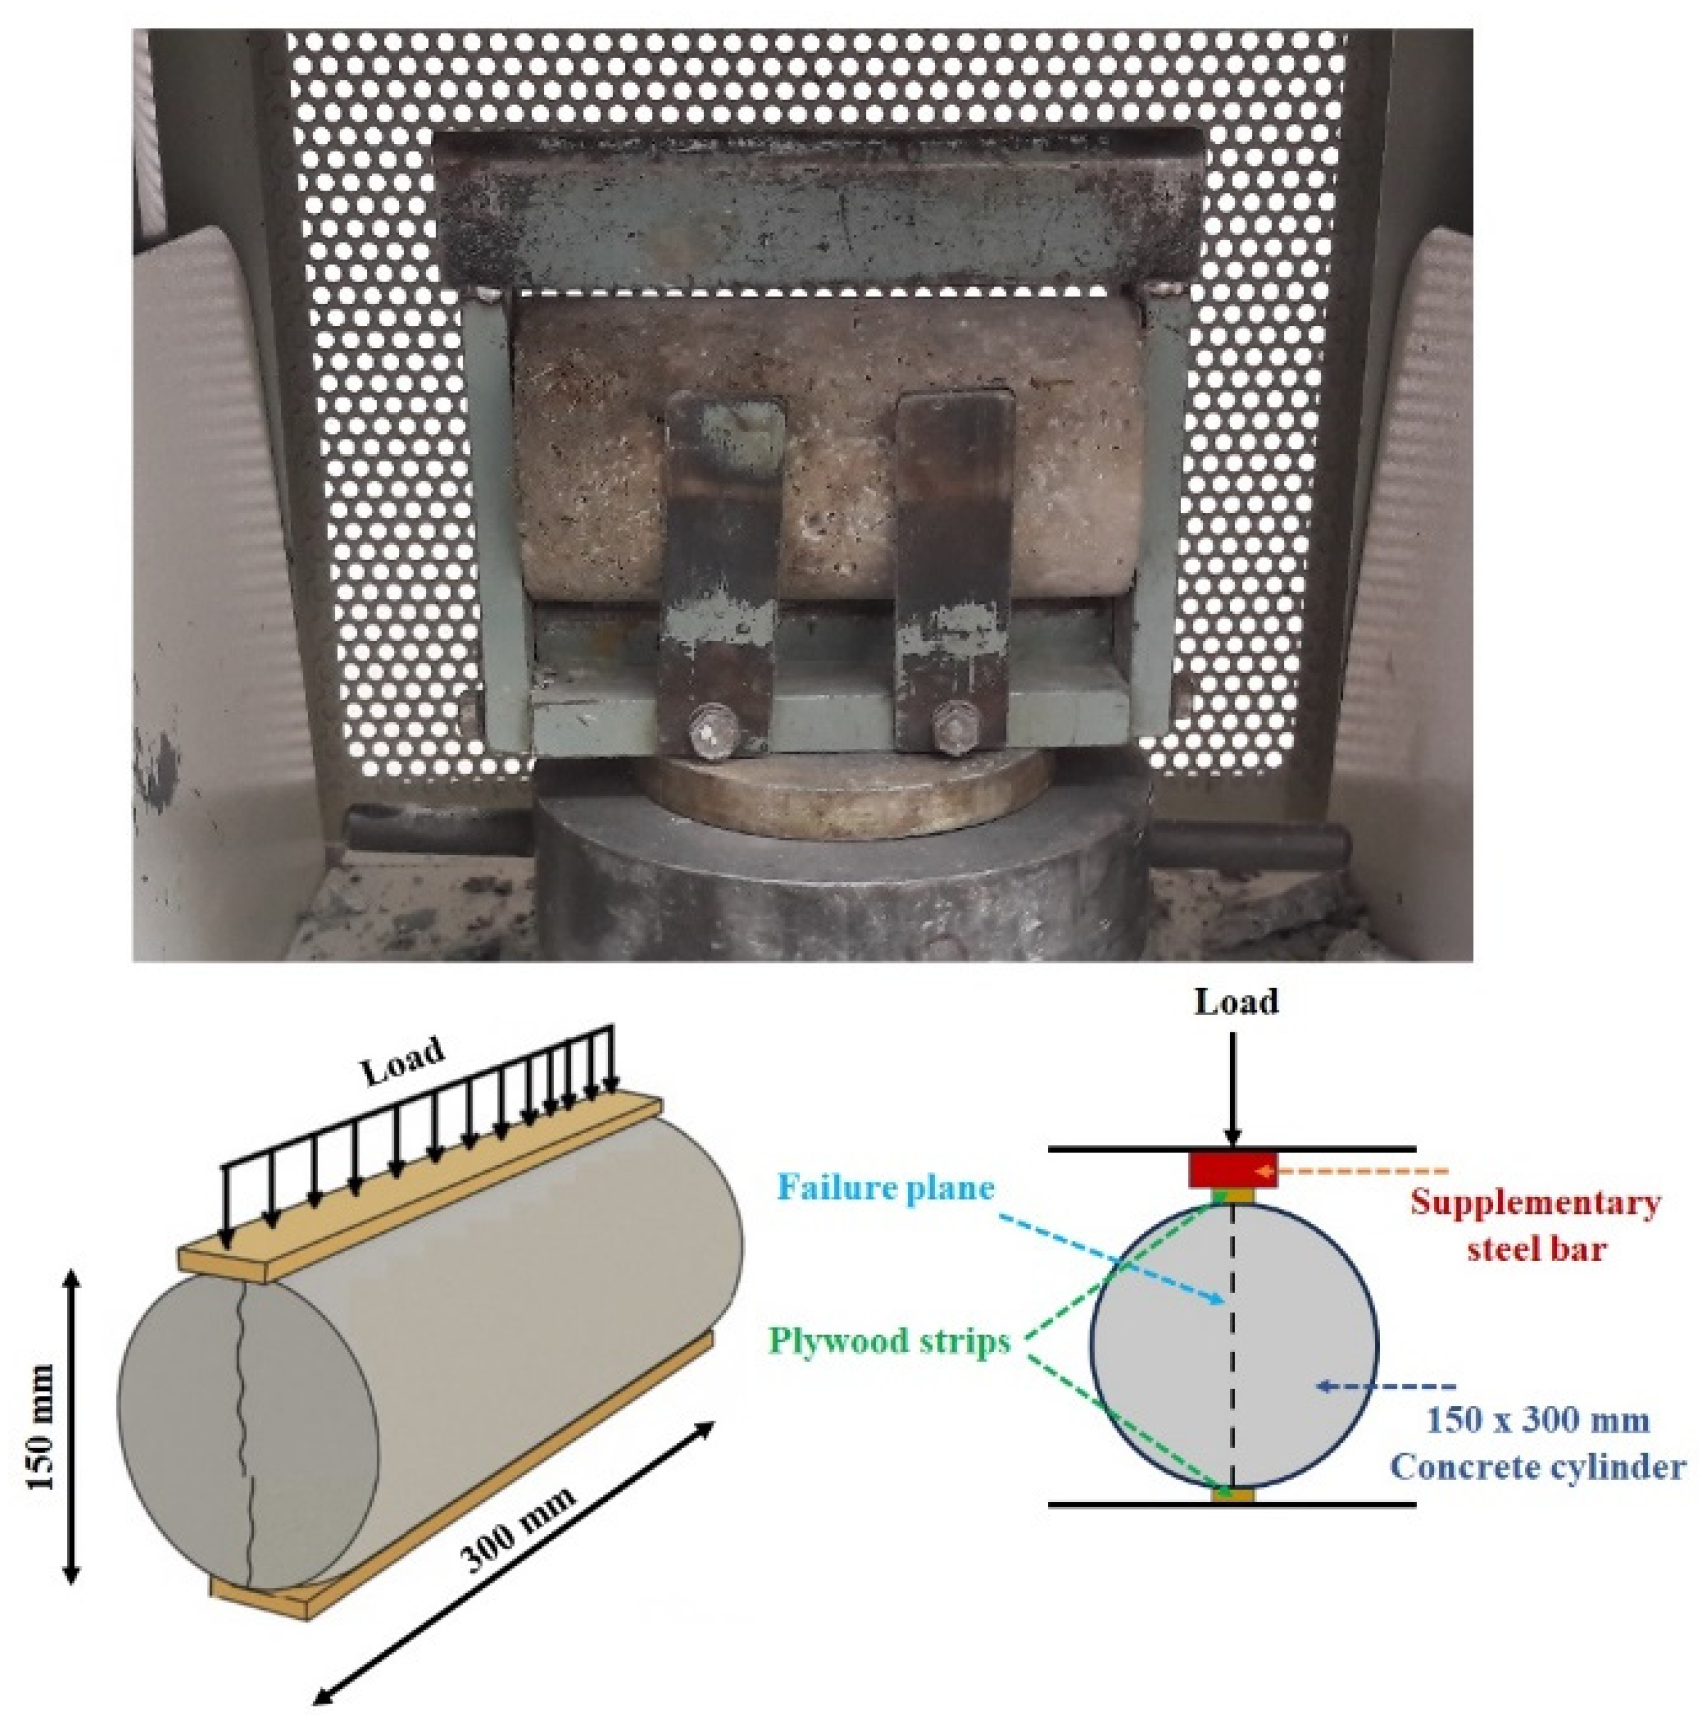
The splitting tensile strength ( f t ) of RCCP specimens was evaluated in accordance with ASTM C496/C496M, using 150 mm × 300 mm cylindrical specimens (Figure 4). Each specimen was placed horizontally between two hardened steel bearing strips, and a compressive load was applied diametrically. Transverse deformation, measured perpendicular to the loading axis, was recorded to capture the material’s response under indirect tensile loading. The splitting tensile strength was calculated using the peak load ( P m a x ) obtained from the load–deformation curve, corresponding to the material’s elastic limit. The strength was computed using Equation (1), where D and L are the diameter and length of the specimen, respectively:
f t = 2     P m a x π     D     L
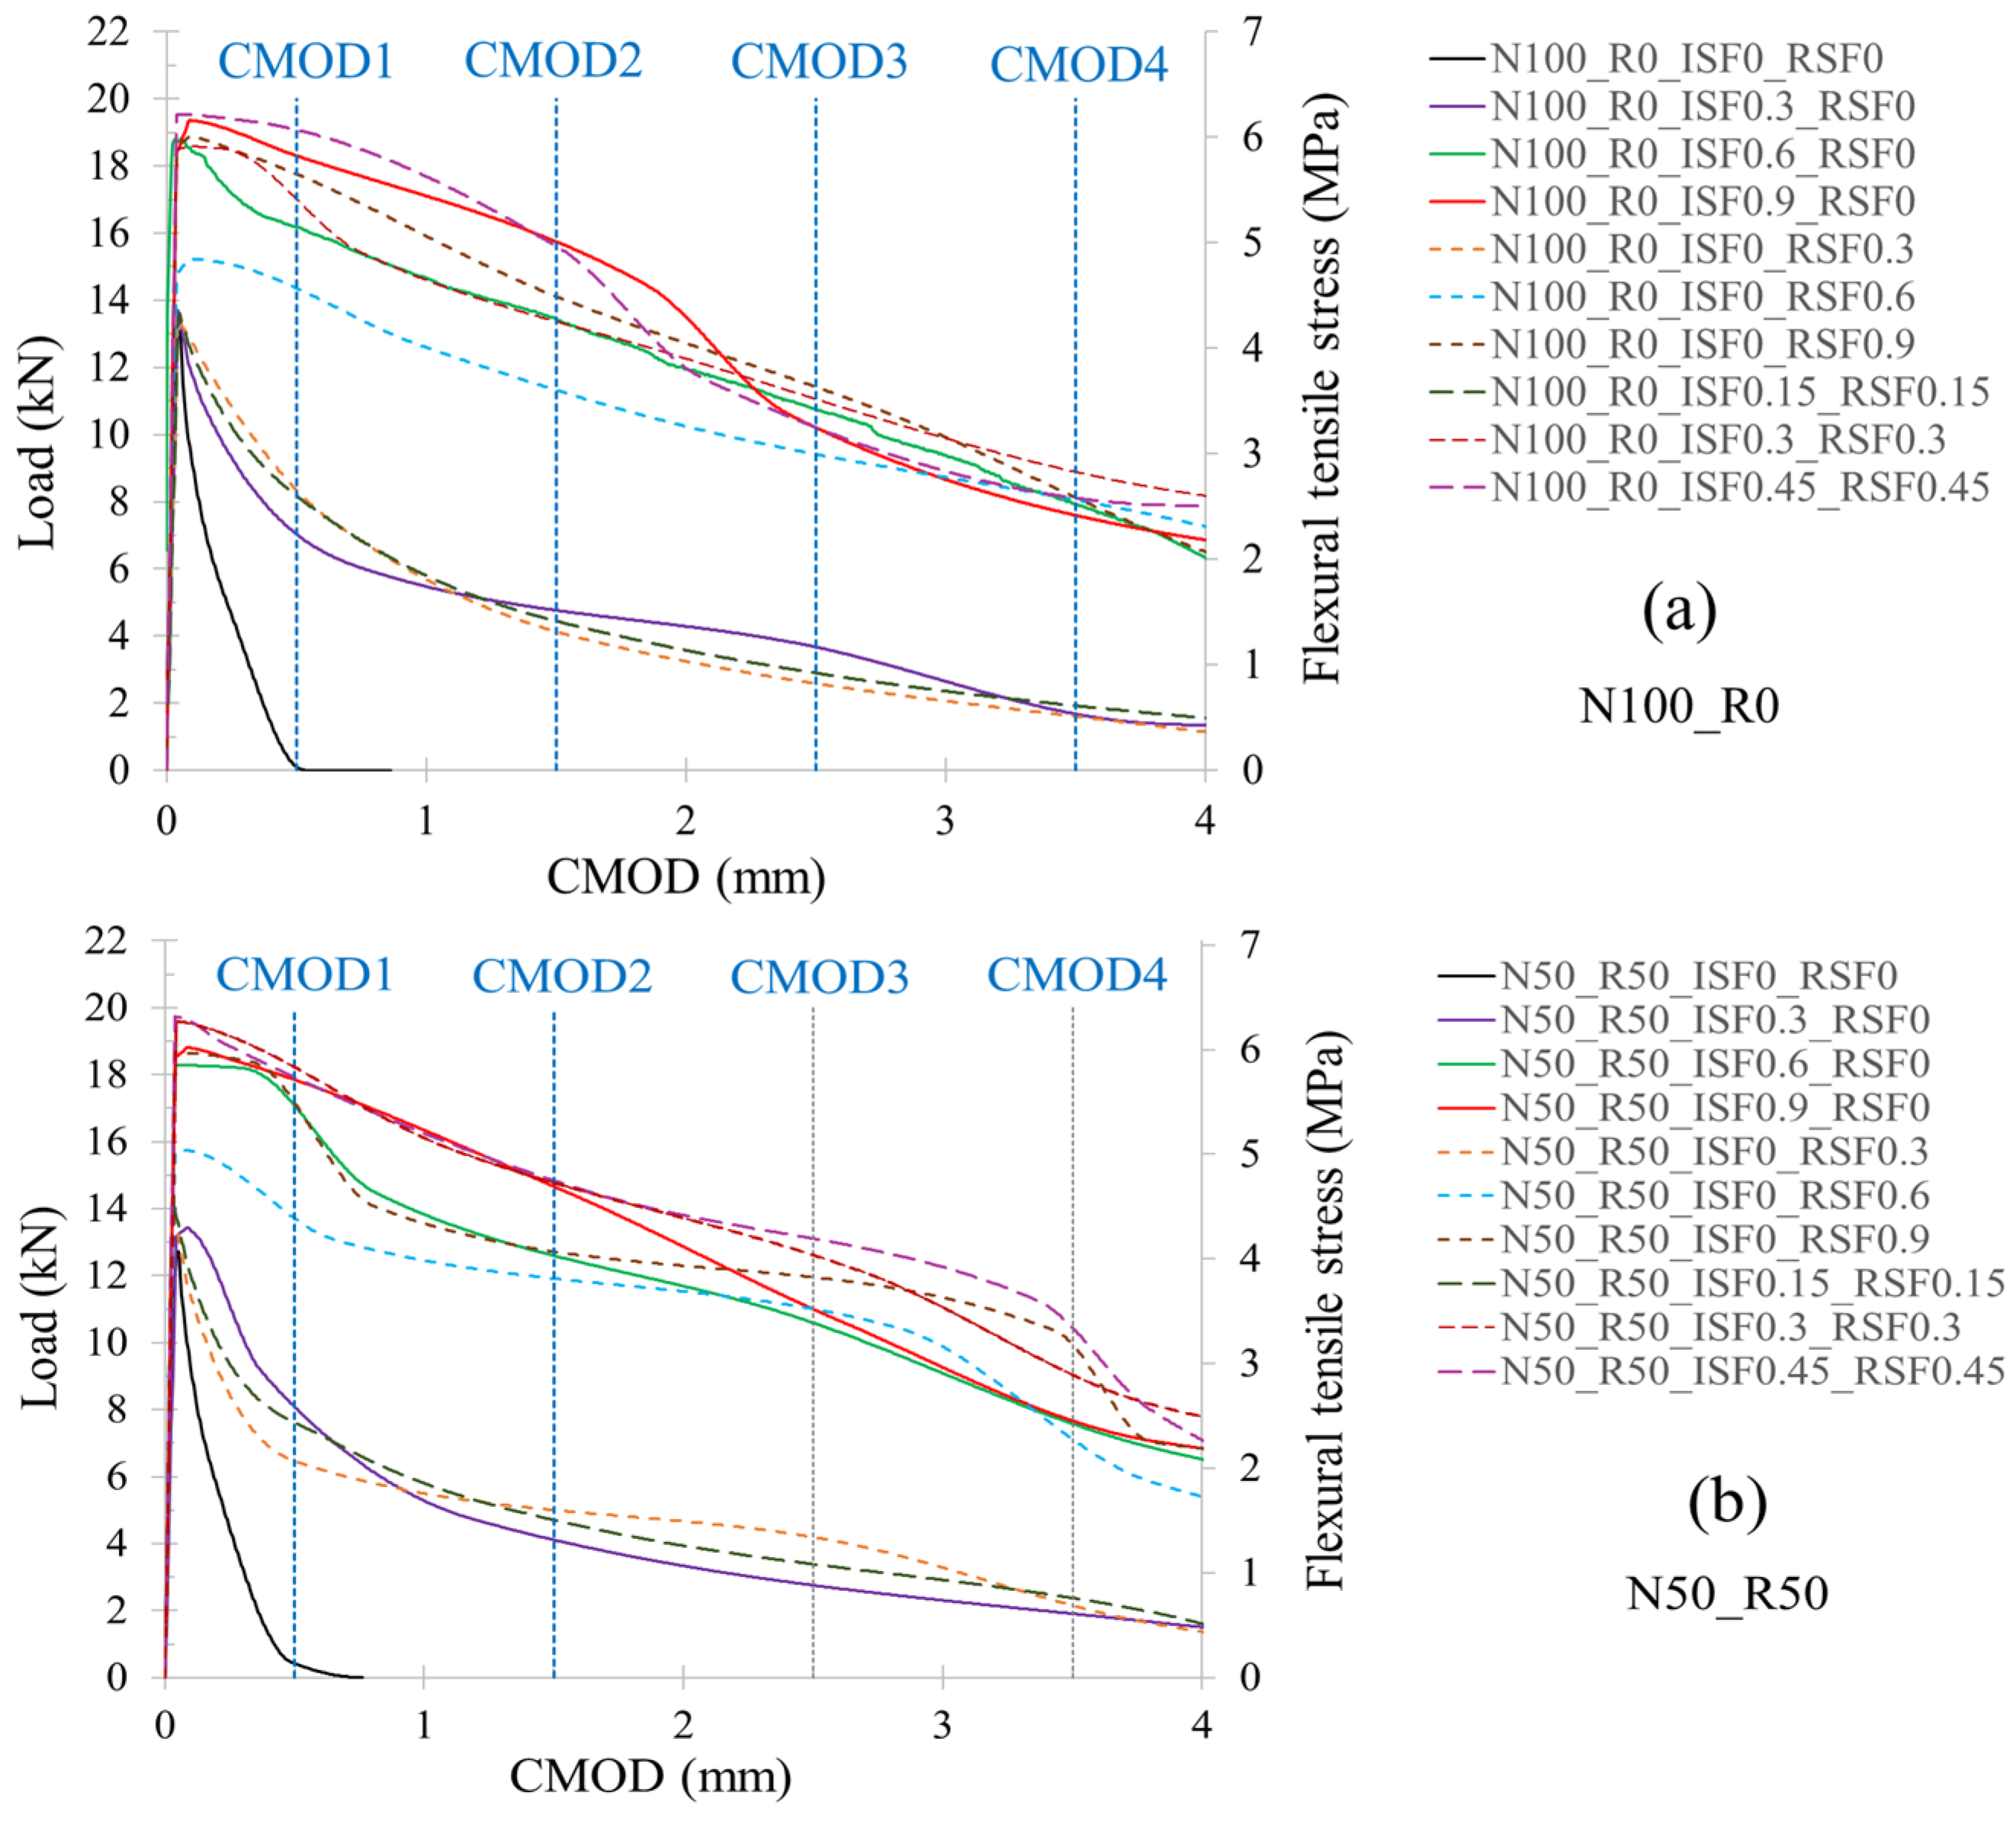
The flexural behavior of RCCP was assessed using 3PNBBT in accordance with the fib Model Code 2010. Prismatic specimens measuring 150 × 150 × 600 mm were cast with a span of 500 mm and a 25 mm notch (<5 mm wide) at mid-span to promote controlled crack initiation. Tests were conducted under monotonic loading using a 250 kN servo-hydraulic actuator. The initial flexural tensile strength ( f c t , L ) was evaluated at a crack mouth opening displacement (CMOD) of 0.05 mm, reflecting the material’s ability to resist cracking under tension. Residual flexural strengths ( f R , 1 , f R , 2 , f R , 3 , f R , 4 ) were determined at CMODs of 0.5, 1.5, 2.5, and 3.5 mm, respectively. Load–CMOD responses were continuously recorded to evaluate post-cracking performance. The flexural toughness ( T o u g _ F l e x ) was calculated as the area under the load–CMOD curve up to 3.5 mm CMOD, representing the material’s energy absorption capacity. Similarly, fracture energy ( G f ) was computed as the area under the load–CMOD curve up to 3.5 mm, normalized by the specimen’s fracture surface area. The experimental setup and monitoring system used in the 3PNBBT are shown in Figure 5.

2.2.3. Durability Testing

The freeze–thaw durability of RCCP specimens was evaluated following ASTM C666, Procedure A, which simulates severe environmental exposure through rapid freezing and thawing in water. Prior to testing, specimens were fully saturated by 24 h water immersion to ensure maximum moisture uptake. Freeze–thaw cycles (FTCs) were performed in a programmable climatic chamber at three intervals: 100, 200, and 300 cycles. Each cycle involved freezing to −18 °C and thawing in water at +4 °C, with a total cycle duration of approximately 4–5 h. Durability loss was assessed by measuring residual compressive strength (NP EN 12390-3:2011), splitting tensile strength (ASTM C496), and flexural tensile strength (fib Model Code 2010) after each cycle set. The strength retention ratio was calculated by comparing the degraded strength values to those of the reference specimens cured under standard laboratory conditions (ASTM C192/C192M). The thermal profile of a single cycle is illustrated in Figure 6.

2.2.4. Environmental Impact Assessment

A cradle-to-gate Life Cycle Assessment (LCA) was conducted to evaluate the environmental impacts of 20 RCCP mixtures incorporating RCA, ISF, RSF, and HSF. The assessment followed ISO 14040-44:2006 and EN 15804:2012+A1, aligning with circular economy principles by reducing virgin material consumption and waste generation. The mixtures varied by RCA replacement levels (0% and 50%) and fiber dosages (0%, 0.3%, 0.6%, and 0.9%) as shown in Table 4. The system boundary was defined from raw material extraction and processing (cement production, aggregate production/recycling, ISF production, RSF recovery) to concrete production (cradle-to-gate), excluding transport and manufacturing, which were assumed identical across mixtures and thus not influential for comparative analysis. The functional unit was 1 m3 of concrete, enabling consistent impact comparisons across all designs.
The life cycle inventory (LCI) quantified material and energy inputs, as well as emissions and waste outputs. The environmental impact data for the superplasticizer (SP) were obtained from the International Environmental Product Declaration (EPD) database [41]. Cement and background data were sourced from the European Life Cycle Database (ELCD) [42], while RCA data were collected from suppliers, on-site surveys, and literature [5,43,44]. ISF and RSF data were obtained from local suppliers, with RSF impacts based on Kurda et al. [45]. Aggregate and water inputs were taken from literature [45,46,47], ensuring all data reflected appropriate regional and technological conditions. The life cycle impact assessment (LCIA) covered eight impact categories specified in EN 15804:2012+A1: global warming potential (GWP), ozone depletion potential (ODP), acidification potential (AP), eutrophication potential (EP), photochemical ozone creation potential (POCP), abiotic depletion (elements and fossil fuels), and primary energy demand (renewable and non-renewable: PE-Re, PE-NRe). The CML method was used for GWP, ODP, AP, EP, POCP, and ADP, while cumulative energy demand (CED) was used for energy-related indicators. Impact factors for each material (Table 5 and Table 6) were multiplied by their corresponding quantities in each mix design (Table 4) to calculate total impacts per 1 m3 of RCCP. Finally, a sensitivity analysis was performed by varying cement emissions by ±15% and RCA/fiber GWP values by ±20%, addressing uncertainties in raw material production and recycling processes to ensure robustness of results.

2.2.5. Eco-Efficiency Analysis (MCDA)

The MCDA was conducted to evaluate the eco-efficiency of 20 RCCP mixtures, integrating mechanical performance, durability, and environmental impacts to identify compositions that balance sustainability and functionality, supporting circular economy principles. The MCDA aimed to rank RCCP mixtures based on their eco-efficiency, considering mechanical properties, durability, and environmental impacts. Criteria included compressive strength ( f c m ), secant modulus of elasticity ( E c m ), splitting tensile strength ( f t ), flexural strength ( f c t , L ), fracture energy ( G f ), flexural toughness ( T o u g _ F l e x ) , and compressive toughness ( T o u g _ C o m p ) , alongside durability indicators (compressive, tensile, and flexural strength retention after 300 FTCs: CSR_300FTCs, TSR_300FTCs, FSR_300FTCs). Environmental impacts comprised GWP, AP, EP, POCP, ADP-elements, ADP-fossil fuels, and primary energy consumption (PE-NRe, PE-Re), as detailed in Section 2.2.4. To ensure comparability, all criteria were normalized [6,48,49]. For mechanical and durability criteria (higher-is-better), the normalized value ( X i j ) for specimen (i) and criterion (j) was calculated as:
X i j = x i j m i n x j m a x   x j m i n x j
For environmental impacts (lower-is-better), the inverted formula was used:
X i j = 1 x i j m i n x j m a x   x j m i n x j
where ( x i j ) is the original value, and m i n x j   , m a x   x j   are the minimum and maximum values for criterion (j). Weights were determined using the entropy weighting method, which assigns higher weights to criteria with greater variability to reflect their discriminatory power [6,48]. The process involved four steps as explained below:
(i)
calculating a probability matrix:
P i j = X i j i = 1 n X i j
(ii)
computing entropy:
E j = 1 l n ( n )   i = 1 n P i j l n ( P i j + ε )
where ε = 10−10 which is a small constant added to avoid ln (0);
(iii)
determining divergence:
D j = 1 E j
(iv)
normalizing weights:
w j = D j j = 1 m D j
where (n) is the number of specimens and (m) is the number of criteria. Weights were documented for transparency, with splitting tensile strength ( f t ) and GWP often receiving higher weights due to significant variability.
Two MCDA methods were applied: weighted sum method (WSM) and technique for order of preference by similarity to ideal solution (TOPSIS). WSM calculated a score for each mixture by summing the products of normalized values and weights. TOPSIS ranked mixtures based on their proximity to an ideal solution and distance from a negative ideal solution, using Euclidean distances. Both methods used the same normalized data and weights to ensure consistency, identifying mixtures with optimal mechanical performance, durability, and minimal environmental impact. Finally, to ensure robustness, a sensitivity analysis was conducted by applying equal weights (1/(m) for (m) criteria) to all criteria, comparing rankings with entropy-based results. Consistent rankings across methods confirmed the reliability of the eco-efficiency evaluation, ensuring a transparent and data-driven identification of sustainable RCCP mixtures.

3. Results and Discussions

3.1. Mechanical Properties

3.1.1. Compressive Strength

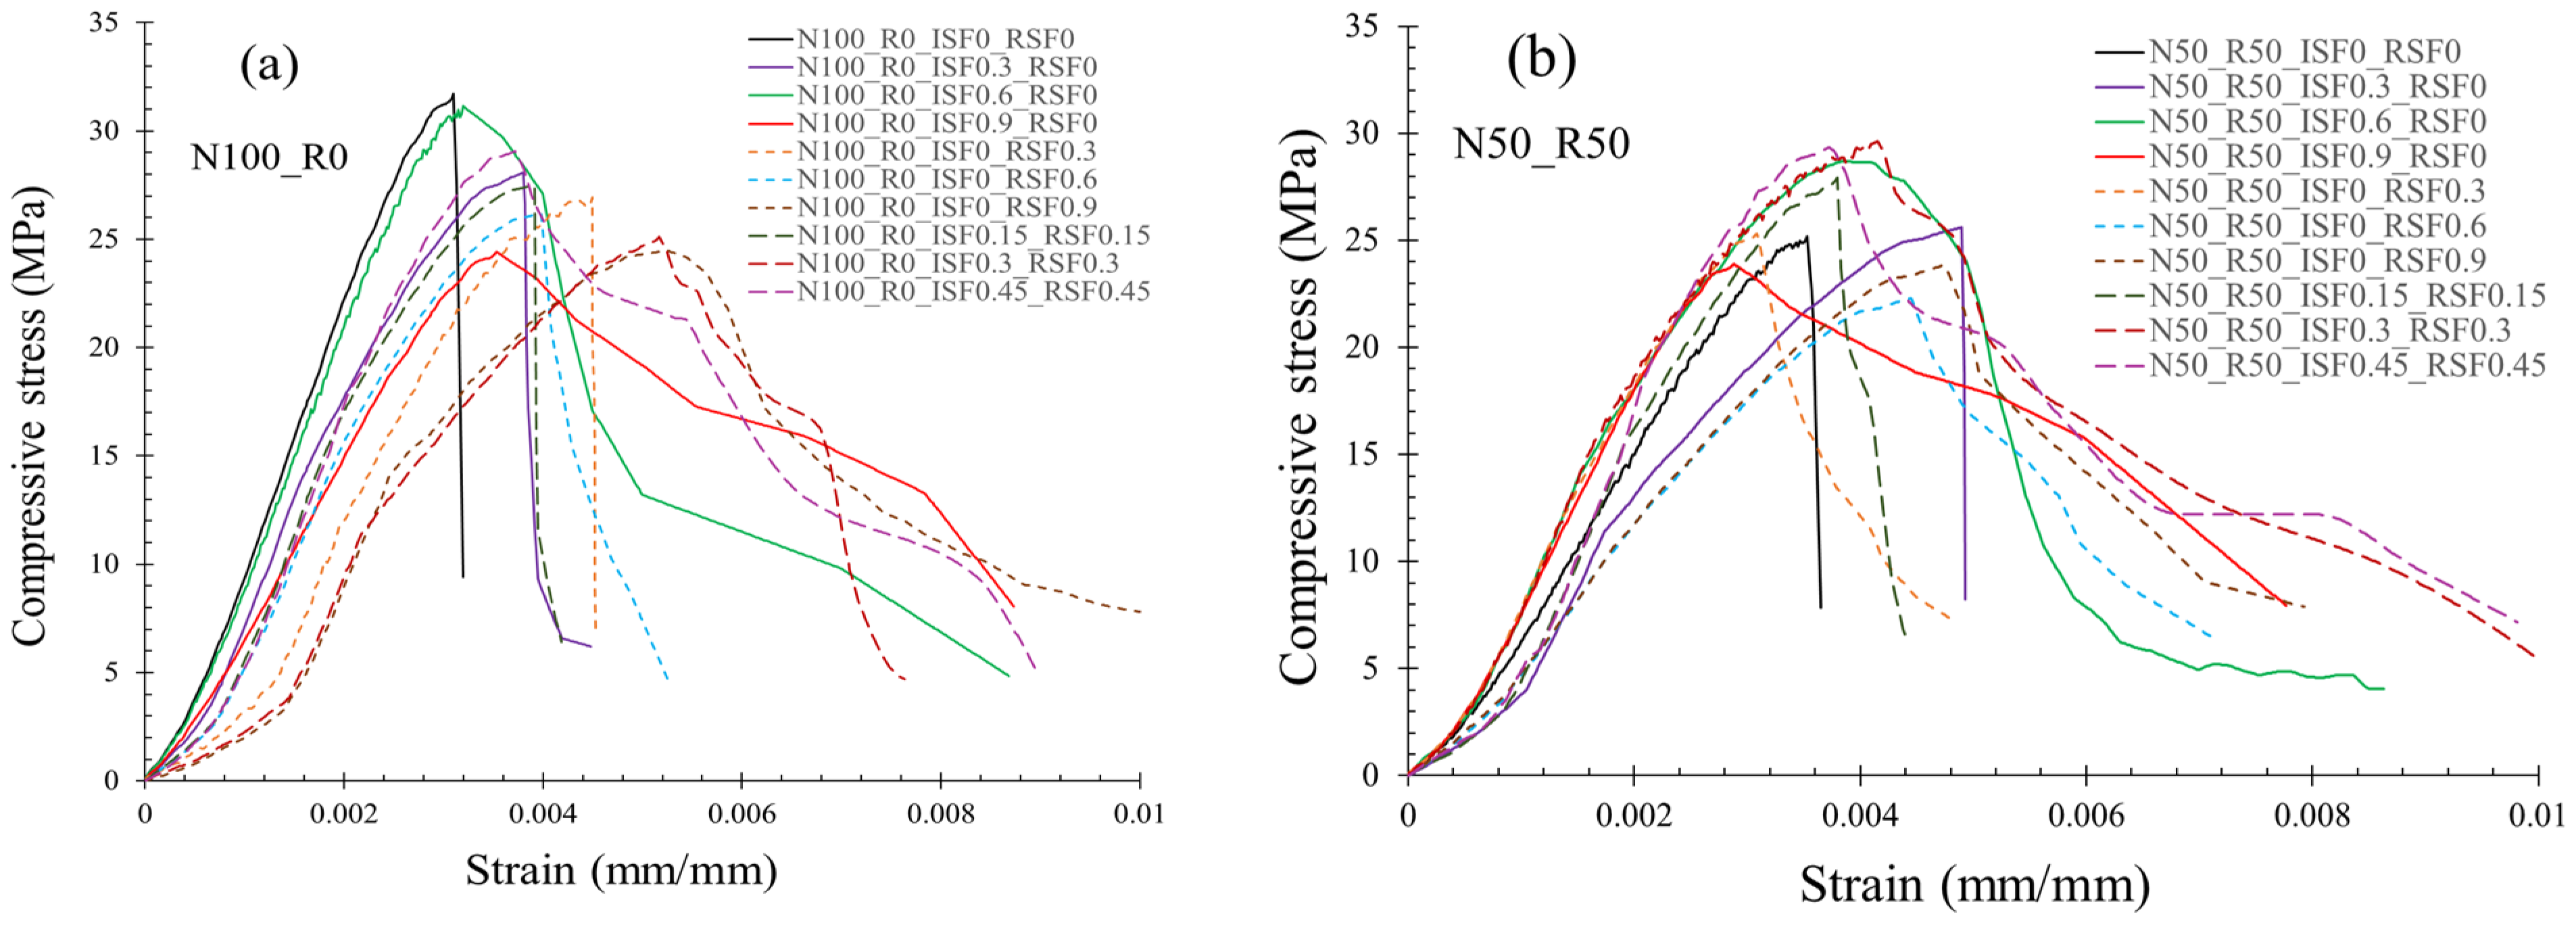
The stress–strain relationships of RCCP mixtures at 28 days is shown in Figure 7, with mean compressive strength ( f c m ), secant modulus of elasticity ( E c m ), compressive toughness ( T o u g _ C o m p ) , and CoV summarized in Table 7. The compressive strength values were significantly influenced by both the RCA content and fiber types. In the N100_R0 group (0% RCA), compressive strength ranged from 24.42 MPa (N100_R0_ISF0.9_RSF0) to 31.72 MPa (N100_R0_ISF0_RSF0), establishing a baseline for NAs. As RCA content increased to 50% (N50_R50 group), the compressive strength decreased to 25.19 MPa (N50_R50_ISF0_RSF0), a reduction of approximately ~21% compared to the N100_R0 baseline. Fiber-reinforced mixtures, particularly HSF at 0.6% dosage (e.g., N50_R50_ISF0.3_RSF0.3 at 29.62 MPa), mitigated this decline, outperforming ISF- or RSF-only mixtures at 50% RCA levels (e.g., ~22.3 MPa for N50_R50_ISF0_RSF0.6). Moreover, the modulus of elasticity followed similar trends. The N100_R0 group again outperformed the others, decreasing stiffness with higher RCA content, reflecting weaker interfacial transition zones (ITZs) in RCAs [48]. Fiber inclusion marginally improved stiffness, especially at 0.6%. This is attributed to enhanced crack-bridging and confinement effect of steel fibers during early loading stages [50,51,52,53,54,55,56].
Figure 7 presents distinct peak stresses, stiffness, and post-peak behavior across groups. The N100_R0 group exhibited the highest peak stresses and stiffness, while N50_R50 displayed flatter curves, indicating reduced stiffness with higher RCA content. The post-peak behavior, particularly in fiber-reinforced mixtures, reflects enhanced ductility, which correlates with compressive toughness ( T o u g _ C o m p ) values in Table 7. Compressive toughness increased significantly with fiber dosage, ranging from 14.29 MPa (N50_R50_ISF0_RSF0) to 43.57 N/mm (N50_R50_ISF0.3_RSF0.3). HSF fiber-reinforced mixtures, particularly N50_R50_ISF0.45_RSF0.45, demonstrated superior performance with a toughness of 41.81 N/mm, surpassing plain, ISF0.9, and RSF0.9 mixtures by 193%, 23%, and 39%, respectively, at equivalent RCA levels. This enhancement is evident in Figure 7b, where HSF mixtures (e.g., N50_R50_ISF0.3_RSF0.3) show a more gradual post-peak stress decline compared to plain or single-fiber mixtures.
The decline in compressive strength with RCA is attributed to its lower density and higher porosity, which weaken the concrete matrix, as reported by Li et al. [57]. Fibers counter this by enhancing crack bridging and energy absorption, significantly improving toughness. HSF mixtures combine shorter (RSF) and longer (ISF) fibers to create a synergistic, multi-scale crack-stabilizing effect [58,59,60]. This results in stronger micro-crack bridging, improved macro-crack resistance, and superior fiber-pullout performance compared to ISF- or RSF-only mixtures. However, higher fiber dosages, such as 0.9% ISF, can occasionally lower compressive strength (e.g., 24.42 MPa in N100_R0_ISF0.9_RSF0) due to fiber clustering, which forms weak zones, as reported by Wu et al. [61]. These results highlight the potential of RCA and HSF to replace up to 50% of NAs, promoting circular economy principles while maintaining sufficient compressive strength and markedly improving toughness for RCCP applications.

3.1.2. Splitting Tensile Strength

The splitting tensile strength of RCCP mixtures ( f t ) at 28 days, as shown in Figure 8, was notably influenced by the RCA content and fiber combination. In general, the inclusion of steel fibers led to substantial gains in tensile strength, especially in hybrid configurations. The plain control mixtures exhibited the lowest performance, with tensile strengths of 3.15 MPa and 3.09 MPa for N100_R0 and N50_R50 groups, respectively. This baseline performance degraded slightly with increasing RCA due to the weaker ITZs and higher porosity of recycled aggregates [62]. Moreover, ISF-only mixtures improved tensile strength by enhancing crack-bridging capacity. For instance, N100_R0_ISF0.9_RSF0 and N50_R50_ISF0.9_RSF0 reached 4.51 MPa and 4.41 MPa, representing increases of ~43% over their plain counterparts. Lastly, HSF combinations outperformed single-fiber mixes across both groups. For example, N100_R0_ISF0.45_RSF0.45 and N50_R50_ISF0.45_RSF0.45 achieved peak values of 4.54 MPa and 4.68 MPa, respectively, surpassing 44% and 51% improvements over plain mixes. The superior performance of HSF is attributed to the synergistic effect of long ISF (macro-crack bridging) and short RSF (micro-crack control), promoting multi-scale crack resistance and better fiber dispersion [31,63].
Finally, coefficient of variations (CoVs) remained below 12% for most HSF mixtures, indicating consistent behavior. Overall, these results align with prior findings [31,57,64,65] that emphasize the effectiveness of steel fiber hybridization in improving tensile performance and toughness of concrete, especially when recycled aggregates are present. The optimized use of HSFs provides a practical means to compensate for RCA-related drawbacks while promoting structural integrity in sustainable pavement materials.

3.1.3. Flexural Strength

The flexural performance of RCCP mixtures at 28 days, evaluated using 3PNBBT, demonstrated clear sensitivity to both RCA content and fiber reinforcement strategy. Key parameters, including initial flexural strength ( f c t , L ) and residual flexural strengths ( f R , 1 f R , 4 ) are summarized in Table 8. Initial flexural strength values ranged from 3.65 MPa (N25_R75_ISF0_RSF0) to 6.32 MPa (N50_R50_ISF0.45_RSF0.45). In plain mixtures, increasing RCA content from 0% to 75% resulted in a ~12% reduction in f c t , L (e.g., 4.14 MPa for N100_R0_ISF0_RSF0 vs. 3.65 MPa for N25_R75_ISF0_RSF0), reflecting the detrimental impact of RCA’s higher porosity and weaker ITZs [21]. The addition of steel fibers, particularly in HSF configurations, significantly enhanced post-cracking load-bearing capacity. HSF mixtures at moderate to high dosages (0.6–0.9%) consistently outperformed single-fiber counterparts. For example, N50_R50_ISF0.45_RSF0.45 not only achieved the highest f c t , L (6.32 MPa) but also maintained superior residual strengths ( f R , 1 : 5.74 MPa, f R , 4 : 3.34 MPa). By comparison, ISF-only mixtures such as N50_R50_ISF0.9_RSF0 recorded f c t , L of 5.92 MPa, f R , 1 : 5.71 MPa, and f R , 4 : 2.45 MPa, while RSF-only mixes (e.g., N50_R50_ISF0_RSF0.9) reached f c t , L of 5.97 MPa, f R , 1 : 5.50 MPa, and f R , 4 : 3.18 MPa.
Figure 9 presents flexural load and stress versus CMOD responses, which reveal the differences in cracking behavior and energy absorption. Figure 10 further illustrates flexural toughness ( T o u g _ F l e x ) and fracture energy ( G f ) up to a CMOD of 3.5 mm. Plain mixtures exhibited the weakest performance, with toughness values between 2.32–2.48 kN·mm and G f below 0.15 N/mm, regardless of RCA content. ISF-only mixtures, particularly at 0.9% volume, demonstrated marked improvements, with toughness exceeding 44 kN·mm and G f reaching 2.55 N/mm. However, RSF-only mixes delivered lower performance, reinforcing that short fibers alone are less effective in bridging macro-cracks [66,67]. On the other hand, HSF mixtures consistently achieved the highest energy absorption. Notably, N50_R50_ISF0.3_RSF0.3 and N50_R50_ISF0.45_RSF0.45 exhibited peak toughness values of 49.8 and 51.1 kN·mm, and G f values of 2.66 and 2.72 N/mm, respectively. These results confirm the synergistic interaction between long and hooked end ISF (for macro-crack bridging) and short RSF (for micro-crack control), which enhances stress redistribution and improves crack resistance across the full CMOD range [66,67,68]. The CMOD curves in Figure 9 further support this behavior. HSF mixtures displayed more gradual stress decay and broader post-peak plateaus, indicating enhanced ductility and sustained load transfer beyond initial cracking. In contrast, single-fiber mixes showed sharper stress declines, reflecting less efficient energy dissipation.
Overall, HSF reinforcement significantly improved the flexural performance and ductility of RCCP, even at high RCA contents. The reductions in f c t , L observed in RCA-rich mixes are attributed to their weaker matrix structure, but the incorporation of steel fibers, especially in hybrid formats, effectively mitigated these effects. These findings reinforce that HSF mixtures provide a robust strategy to enhance residual strength, fracture energy, and toughness in RCCP. As demonstrated, HSF-reinforced RCCPs with up to 50% RCA can match or exceed the mechanical performance of natural aggregate mixtures, promoting reduced reliance on natural resources and aligning with circular economy principles for sustainable pavement infrastructure.

3.2. Durability Performance

3.2.1. Compressive Strength Retention

The freeze–thaw durability of RCCP mixtures was evaluated through compressive strength retention after 100, 200, and 300 FTCs, as shown in Figure 11 and detailed in Table S1 in the Supplementary Materials. The results demonstrate that the fiber type had a significant impact on long-term strength retention. Plain mixtures (ISF0_RSF0) exhibited the greatest degradation, with retention falling from 85.4% (100 FTCs) to ~64% (300 FTCs) in the N100_R0 group. The negative effects were more pronounced as RCA content increased (50%), with retention dropping as low as ~62% at 300 FTCs in N50_R50_ISF0_RSF0. This reduction is attributed to increased porosity and weakened matrix–aggregate bonds in RCAs, which accelerate internal damage under cyclic freeze–thaw exposure [69,70].
The inclusion of steel fibers, particularly in hybrid form, markedly improved freeze–thaw resistance. For instance, N50_R50_ISF0.45_RSF0.45 retained 96.6%, 90.75%, and 86.24% of its compressive strength after 100, 200, and 300 FTCs, respectively, representing an increase of nearly 40% over the plain mix at 300 FTCs. Similarly, N100_R0_ISF0.9_RSF0 achieved 95.5%, 90.2%, and 85.2% retention, confirming the efficacy of ISF at high dosage. HSF mixtures consistently showed the highest retention rates across all groups. For example, N50_R50_ISF0.3_RSF0.3 maintained over 90% retention at 200 FTCs and 85.9% at 300 FTCs, significantly outperforming both ISF-only and RSF-only variants. These improvements are primarily attributed to the combined role of ISF and RSF in enhancing the fiber network density, which reduces permeability, limits internal moisture movement, and restrains crack formation during freezing and thawing, thereby mitigating frost-induced damage and preserving matrix integrity [71,72,73].
Overall, the results confirm that fiber reinforcement, especially in hybrid form, effectively mitigates durability loss in RCCPs under harsh freeze–thaw conditions. RCCP mixtures incorporating up to 50% RCA, when reinforced with HSF at 0.6–0.9% total volume, demonstrated durability equal to or greater than that of 100% natural aggregate mixtures reinforced with ISF-only at the same fiber dosages, underscoring their potential for long-lasting and environmentally sustainable pavement applications.

3.2.2. Tensile Strength Retention

The tensile strength retention of RCCP mixtures under 100, 200, and 300 FTCs is illustrated in Figure 12 and summarized in Table S2 in the Supplementary Materials. The results indicate that RCA content and fiber type substantially influenced tensile strength under freeze–thaw exposure. Plain mixtures exhibited notable degradation, with tensile strength retention dropping from ~86% to ~68% in N100_R0_ISF0_RSF0 and ~81% to ~66% in N50_R50_ISF0_RSF0 across 300 FTCs. The decline was more severe at higher RCA levels due to increased matrix porosity and weaker paste-aggregate interfaces, which accelerated crack development and internal moisture damage [74,75].
Steel fibers significantly enhanced durability, particularly at higher dosages. For instance, N100_R0_ISF0.9_RSF0 and N50_R50_ISF0.9_RSF0 maintained tensile strength retention above 95% at 100 FTCs and above 82% at 300 FTCs. HSF mixtures consistently outperformed ISF- or RSF-only systems. Notably, N50_R50_ISF0.45_RSF0.45 retained 98.0%, 92.3%, and 89.5% of its tensile strength after 100, 200, and 300 FTCs, respectively, representing approximately a 35% improvement over the plain mix and a 10% increase compared to the RSF-only mix at 300 cycles. These gains are attributed to the enhanced fiber bridging, matrix densification, and reduced permeability achieved through the combined action of ISF and RSF. The hybrid network helps limit crack propagation and restrict internal water movement during FTCs, reducing microstructural damage [66,76,77,78].
Overall, the results demonstrate that hybrid steel fiber reinforcement plays a crucial role in mitigating freeze–thaw deterioration and sustaining tensile performance in RCCP mixtures. Consistent with the compressive strength retention trends discussed earlier, HSF proved equally effective in maintaining tensile capacity under cyclic freezing and thawing. RCCP mixtures with up to 50% RCA, reinforced with 0.6–0.9% HSF, maintained tensile strength retention equal to or exceeding that of full-NA mixes, reinforcing the dual benefit of durability and sustainability for cold-region pavement applications.

3.2.3. Flexural Strength Retention

The flexural strength retention of RCCP mixtures after 100, 200, and 300 FTCs varied significantly with RCA content and fiber reinforcement, as illustrated in Figure 13 and detailed in Table S3 in the Supplementary Materials. In plain mixtures (ISF0_RSF0), tensile strength retention after 300 FTCs showed no significant change, decreasing only slightly from 70.2% (N100_R0) to 69.7% (N50_R50). This minor variation may be attributed to RCA’s higher porosity and weaker interfacial transition zones, which can promote microcracking under cyclic freezing and thawing, as noted by Lu et al. [79]. After 100 FTCs, the retention of plain mixtures ranged from 74.5% (N50_R50) to 83.6% (N100_R0), further decreasing to 72% and 78.6%, respectively, after 200 FTCs, highlighting the detrimental effect of RCA with increasing cycles.
Fiber reinforcement markedly improved retention, with HSF mixtures at 0.9% dosage (ISF0.45_RSF0.45) achieving the highest values after 300 FTCs: 84.3% (N100_R0), and 83.9% (N50_R50). Notably, HSF at 0.6% dosage (N50_R50_ISF0.3_RSF0.3) retained 84.7% after 300 FTCs, outperforming ISF-only (78.9%) and RSF-only (76.7%) at the same RCA level and dosage. ISF-only mixtures at 0.9% dosage retained 83.1% (N100_R0) to 81.3% (N50_R50), while RSF-only mixtures ranged from 82.4% (N100_R0) to 80.8% (N50_R50), the latter’s lower performance attributed to shorter fiber lengths limiting macro-crack bridging, as noted by Bao et al. [80]. HSF’s superior retention stems from the synergistic crack-bridging of long ISF and short RSF, enhancing stress redistribution, as supported by Wang et al. [81].
Finally, HSF-reinforced mixtures, even at 50% RCA, demonstrate enhanced freeze–thaw resistance for HSF compared to the steeper declines in plain mixtures. In essence, HSF reinforcement proved to be a robust strategy for safeguarding flexural strength under cyclic environmental stress, especially when applied to RCA-containing mixes. These findings strengthen the case for using HSF as a performance-enhancing and eco-efficient design tool in sustainable pavement solutions.

3.3. Environmental Impacts

A cradle-to-gate LCA was performed on 20 RCCP mixtures using the CML baseline and CED methodologies to quantify environmental impacts per 1 m3 of concrete. The analysis focused on nine key impact categories, including GWP, ODP, AP, EP, POCP, ADP-elements, ADP-fossil fuels, and primary energy consumption (non-renewable and renewable, PE-NRe and PE-Re). Figure 14, Figure 15, Figure 16, Figure 17, Figure 18, Figure 19, Figure 20, Figure 21 and Figure 22 illustrate the variations across these categories, while detailed numerical results are presented in Tables S4 and S5 in the Supplementary Materials.
Among the assessed impact categories, global warming potential (GWP) is a key metric in LCA studies due to its direct link to climate change and the high emissions associated with construction materials [82]. In this study, GWP consistently declined with increasing RCA content (Figure 14). For plain RCCP mixtures, GWP dropped from 337.4 kg CO2-eq in the 100% NA mixtures (N100_R0) to 325.7 kg CO2-eq in the 50% RCA mix (N50_R50), primarily due to the lower embodied carbon of recycled aggregates compared to virgin natural aggregates, as supported by prior studies [83,84]. Among fiber-reinforced mixtures with 0.9% dosage, ISF-only mixtures exhibited the highest GWP values due to the energy-intensive manufacturing of industrial steel fibers (e.g., 427.6 kg CO2-eq for N100_R0_ISF0.9_RSF0). In contrast, RSF-only mixtures demonstrated significantly lower GWP (e.g., 360.1 kg CO2-eq for N100_R0_ISF0_RSF0.9), a reduction of approximately 16%, confirming the environmental benefits of recycled steel fibers [85]. GWP was also influenced by fiber dosage. For instance, in HSF-reinforced mixtures with 50% RCA, increasing the fiber content from 0.3% to 0.9% raised GWP from 344.5 to 382.1 kg CO2-eq, about 10% increase. However, this value remained below that of ISF-only mixtures (e.g., 415.9 kg CO2-eq). Notably, moderate HSF dosages proved to be an effective strategy for balancing environmental performance and mechanical benefits. For example, N50_R50_ISF0.3_RSF0.3 had a GWP of 363.3 kg CO2-eq, which was 15% lower than the ISF-only N100_R0_ISF0.9_RSF0 mix, while still maintaining comparable or superior mechanical strength and freeze–thaw durability.
In contrast to GWP, ODP values remained nearly constant (Figure 15), decreasing marginally from 1.52 × 10⁻⁵ to 1.51 × 10⁻⁵ kg CFC-11-eq as RCA content increased to 50%, suggesting that ozone depletion is less sensitive to variations in aggregate type and more influenced by other components such as cement and admixtures. The ODPs were recorded in RSF-based mixtures (e.g., N50_R50_ISF0_RSF0.9: 1.57 × 10⁻⁵), while ISF-only mixtures exhibited higher ODPs (e.g., N50_R50_ISF0.9_RSF0: 2.03 × 10⁻⁵) due to steel production processes involving refrigerants and solvents. HSF offered intermediate values (e.g., N50_R50_ISF0.45_RSF0.45: 1.8 × 10⁻⁵). The marginal variation across RCA and fiber types underscores that ODP is a less dominant but still relevant indicator in mix selection.
Acidification, expressed in kg SO2-eq, is closely tied to SOx and NOx emissions from raw material extraction and cement production. AP decreased with RCA inclusion (Figure 16), from 0.95 kg SO2-eq (N100_R0) to 0.88 kg (N50_R50, plain). ISF-only mixtures showed higher AP (up to 1.17 kg) due to higher fuel consumption and emissions during steel manufacturing. In contrast, RSF and HSF mixtures recorded lower AP values (e.g., 0.97 kg for N50_R50_ISF0.3_RSF0.3), aligning with prior studies that emphasize the role of recycled steel in reducing acidification impacts [86,87].
EP, which represents nutrient loading (e.g., nitrates, phosphates) into water bodies, is primarily influenced by cement and energy consumption, as illustrated in Figure 17. Similarly to AP, EP decreased with increasing RCA content, with plain mixtures dropping from 0.13 to 0.12 kg PO4-eq as RCA replacement increased from 0% to 50%. Among fiber types, ISF-only had the highest values (up to 0.16 kg), while RSF-only and HSF had lower EP (0.14 and 0.15 kg). Reductions in fiber dosage also curbed eutrophication, especially in HSF mixtures (0.13 kg at 0.3% vs. 0.15 kg at 0.9%), supporting a dosage–performance trade-off strategy.
POCP, which represents the formation of tropospheric ozone (smog), followed comparable trends (Figure 18). In plain mixtures, POCP reduced from 0.066 kg ethene-eq (N100_R0) to 0.062 kg (N50_R50). RSF mixtures consistently outperformed ISF-only ones, e.g., at 0.9% fiber, RSF = 0.065 kg, ISF = 0.096 kg, HSF = 0.08 kg (N50_R50 group). This is attributed to lower volatile emissions during RSF recovery processes. Moderate fiber content (0.3–0.6%) was sufficient to maintain low POCP levels, aligning with environmental goals in urban settings [88,89].
ADP-elements reflects the consumption of scarce mineral resources, primarily influenced by the presence and type of steel fibers and aggregates in this study (Figure 19). Across all RCA levels, RSF mixtures exhibited the highest ADP-elements values, reaching up to 1.75 × 10⁻⁵ kg Sb-eq at 0.9% dosage. Despite being derived from recycled materials, RSF’s elevated ADP-elements can be attributed to additional energy inputs in fiber recovery and preprocessing, as noted in Biswas et al. [90]. Moreover, RCCP mixtures demonstrated greater sensitivity to RCA content, where increasing RCA levels amplified their ADP-elements more noticeably than in RSF or HSF mixtures. In contrast, plain mixture, at 50% RCA, maintained lower and more stable ADP-elements values (0.58 × 10⁻⁵ kg Sb-eq). HSF mixtures fell between the two, offering a moderate environmental profile while preserving performance.
ADP-fossil fuels, measured in MJ, mirrored GWP patterns. ADP-fossil fuels increased with RCA inclusion from 1180.5 MJ (N100_R0) to 1206.7 (N50_R50) for plain mixtures. ISF-only mixtures at 0.9% reached up to 2240.3 MJ, while RSF remained under 1545.1 MJ, validating that using recycled steel significantly reduces fossil fuel depletion (Figure 20b). HSF at 0.6% dosage remained within an acceptable range (e.g., 1664 MJ at N50_R50_ISF0.3_RSF0.3), suggesting it as a sustainable option.
The non-renewable primary energy (PE-NRe) represents energy derived from finite resources, which cannot be replenished on a human time scale [EN 15804]. As shown in Figure 21, cement accounts for ~76.6% of total PE-NRe consumption for plain mixture with 100% NA (N100_R0_ISF0_RSF0), making it the most energy-intensive component in all mixtures. Additionally, CG is the primary contributor to the remaining PE-NRe impact (~21.2%). The presence of ISF in ISF-only mixtures significantly contributes to PE-NRe, accounting for ~27% of total impact (N100_R0_ISF0.9_RSF0), aligning with its influence in GWP, POCP, and ADP-fossil fuels. The replacement of ISF with RSF and the substitution of 50% CG with RCA in N50_R50_ISF0.3_RSF0.3 mix result in a ~27% reduction in total PE-NRe, confirming the energy-saving benefits of sustainable materials. These findings reinforce the role of RSF, and RCA in minimizing fossil energy consumption and promoting resource-efficient RCCP production.
The renewable primary energy (PE-Re) represents energy derived from naturally replenishable, non-fossil sources [EN 15804]. As shown in Figure 22, cement is the dominant contributor to PE-Re consumption, accounting for ~60% of total renewable energy use, while SP and ISF production contributes ~20% and ~19% in N100_R0_ISF0.9_RSF0, making it the next-largest factors. The removal of ISF0.9 and its replacement with RSF0.9 significantly reduces PE-Re impact, lowering its contribution from ~19% to ~2%. Additionally, the incorporation of RCA and NFs has a negligible impact on total PE-Re consumption. The N50_R50_ISF0.3_RSF0.3 exhibit up to ~20% lower renewable energy use compared to N100_R0_ISF0.9_RSF0, confirming that replacing ISF with RSF and integrating RCA effectively reduce PE-Re demand, improving energy efficiency in RCCP production.

3.4. Eco-Efficiency Ranking

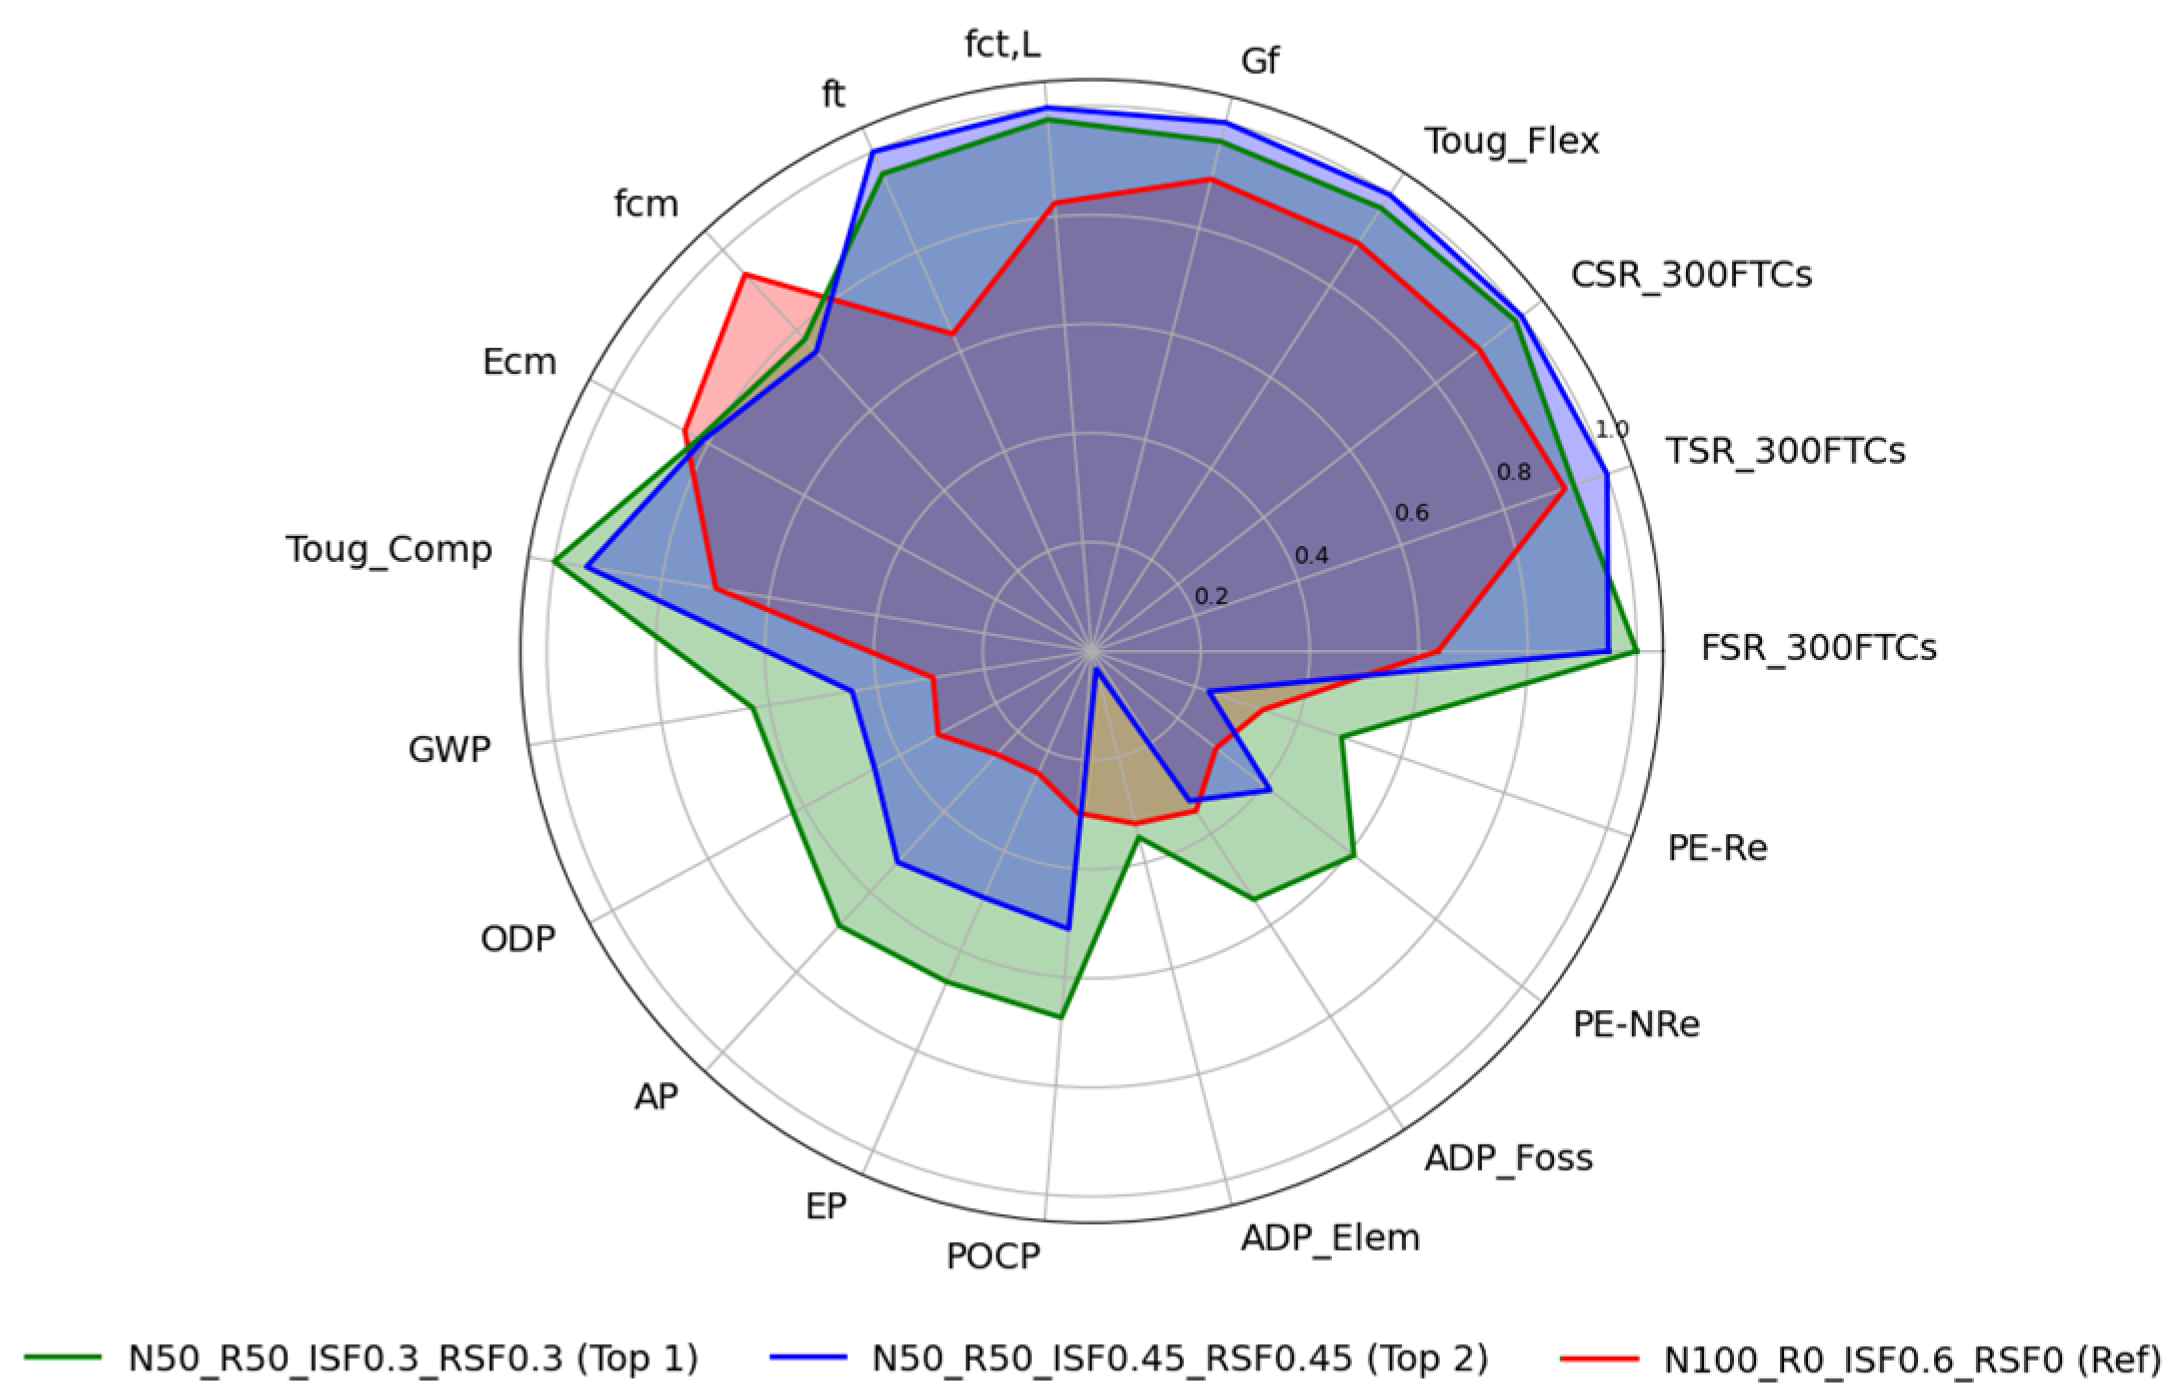
To integrate mechanical performance, durability, and environmental impact into a unified evaluation, the MCDA was conducted using both the WSM and TOPSIS. Table 9 presents the eco-efficiency ranking outcomes of all 20 RCCP mixtures. Moreover, Figure 23 provides a normalized radar plot comparison of the top two most eco-efficient mixtures compared to a conventional control mix (N100_R0_ISF0.6_RSF0) with the same total steel fiber dosage (0.6%) but composed exclusively of ISF and 100% NAs, serving as a reference to highlight the sustainability benefits of fiber hybridization and RCA inclusion. Results reveal that the mixture N50_R50_ISF0.3_RSF0.3 ranked highest in both WSM (0.8) and TOPSIS (0.73), indicating an optimal balance across mechanical, durability, and environmental dimensions. It exhibited strong tensile and flexural strengths ( f t = 4.61 MPa, f c t , L = 6.3 MPa), excellent freeze–thaw resistance (CSR, TSR, and FSR > 85% after 300 cycles), and moderate environmental impacts (e.g., GWP = 363.3 kg CO2-eq, ADP-Fossil = 1664 MJ), outperforming the conventional control mixture by ~30% in eco-efficiency scores.
The second-best eco-efficient mixture, N50_R50_ISF0.45_RSF0.45, also demonstrated a strong composite profile with slightly higher mechanical and durability indices but increased environmental burdens (e.g., GWP = 382.1 kg CO2-eq, ADP-Fossil = 1892.7MJ), lowering its TOPSIS score to 0.72. Nevertheless, it achieved excellent fracture energy ( G f = 2.72 N/mm) and flexural toughness ( T o u g _ F l e x = 51.1 kN·mm), confirming its suitability in high-performance applications. In contrast, N100_R0_ISF0.6_RSF0, selected as the conventional reference mix, ranked much lower (WSM = 0.62; TOPSIS = 0.59). As visualized in Figure 23, this mixture showed strong elastic and compressive strength ( E c m = 33.2 GPa and   f c m = 31.2MPa) but lagged significantly in sustainability performance. It recorded the highest GWP (397.5 kg CO2-eq), ADP-Fossil Fuels (1869.6 MJ), and PE-NRe (2557.6 MJ), demonstrating the environmental costs of relying solely on ISFs and virgin aggregates. Figure 23 further illustrates the holistic comparison of the three mixtures. While N100_R0_ISF0.6_RSF0 excels in a few structural metrics, its environmental footprint is substantially higher, highlighting the benefits of integrating RCA and RSF for a more circular and resource-efficient RCCP design. Both hybrid mixes showed broader and more balanced profiles across all indicators, confirming the effectiveness of combining moderate hybrid fiber dosage with RCA replacement.
In conclusion, the top eco-efficient RCCP mixtures, particularly N50_R50_ISF0.3_RSF0.3, offer a compelling balance between durability, structural efficiency, and environmental responsibility. These results confirm that hybrid fiber configurations, especially in 50% RCA mixes, offer the most sustainable performance without compromising mechanical reliability. These results reinforce the potential of hybrid-fiber, RCA-based RCCP as a robust strategy for eco-efficient pavement development, aligned with circular economy goals and low-carbon construction practices.

4. Conclusions

This study examined the influence of recycled concrete aggregates (RCAs) and industrial, recycled, and hybrid steel fibers on the mechanical behavior, freeze–thaw durability, and environmental performance of roller-compacted concrete pavement (RCCP). The mixtures with 50% RCA and 0–0.9% fiber content were evaluated through a combined framework of mechanical testing, freeze–thaw assessment, life cycle analysis (LCA), and multi-criteria decision analysis (MCDA).
The results show that while 50% RCA content generally reduces strength due to increased porosity, hybrid steel fibers (HSFs) effectively compensate for these losses and enhance overall toughness and freeze–thaw resistance. This indicates that the interaction between RCA and hybrid fibers creates a performance balance not achievable by single-fiber systems.
From a sustainability perspective, incorporating RCA and recycled steel fibers reduces environmental burdens, particularly global warming potential and non-renewable energy demand. MCDA demonstrated that mixtures combining 50% RCA replacement with balanced hybrid fiber dosages (0.6%) deliver the most favorable combination of mechanical, durability, and environmental performance.
Although the findings are promising, they reflect controlled laboratory conditions. Field-scale testing, long-term monitoring, and life cycle cost analysis are needed to validate the practical applicability of the proposed mixtures.

Supplementary Materials

The following Supporting Information can be downloaded at: https://www.mdpi.com/article/10.3390/buildings15234279/s1, Table S1: Compressive strength retention of RCCP specimens exposed to 100, 200, and 300 FTCs; Table S2: Tensile strength retention of RCCP specimens exposed to 100, 200, and 300 FTCs; Table S3: Flexural strength retention of RCCP specimens exposed to 100, 200, and 300 FTCs; Table S4: Baseline results of the CML method for producing 1 m3 of RCCP mixtures; Table S5: Cumulative energy demand (CED) results for the production of 1 m3 of RCCP mixtures.

Author Contributions

Conceptualization, O.H., S.K., M.B. and N.A.; methodology, O.H., S.K., M.B. and N.A.; software, O.H., M.B. and N.A.; validation, O.H., M.B. and N.A.; formal analysis, O.H., M.B. and N.A.; investigation, O.H., S.K., M.B. and N.A.; resources, O.H., M.B. and N.A.; data curation, O.H., S.K., M.B. and N.A.; writing—original draft preparation, O.H., S.K., M.B. and N.A.; writing—review and editing, O.H. visualization, O.H., M.B. and N.A.; supervision, O.H. and S.K.; project administration, O.H. and S.K.; funding acquisition, O.H., S.K., M.B. and N.A. All authors have read and agreed to the published version of the manuscript.

Funding

This work was supported by FCT/MCTES under the R&D Unit Institute for Sustainability and Innovation in Structural Engineering (ISISE), under reference UID/4029/2025, and under the Associate Laboratory Advanced Production and Intelligent Systems ARISE under reference LA/P/0112/2020. Additional institutional support was provided to the research units ISISE (Ref. UIDB/04029/2020, DOI: 10.54499/UIDB/04029/2020), and ARISE (Ref. LA/P/0112/2020).

Data Availability Statement

The original contributions presented in the study are included in the article, further inquiries can be directed to the corresponding authors.

Acknowledgments

The authors gratefully acknowledge the institutional support of ISISE – Institute for Sustainability and Innovation in Structural Engineering, University of Minho. The third author also acknowledges individual FCT support under grant 2021.05328.BD.

Conflicts of Interest

The authors declare no conflicts of interest.

Abbreviations

The following abbreviations are used in this manuscript:
ADP-ElemAbiotic depletion of elements
ADP-fossilAbiotic depletion of fossil fuels
APAcidification potential
CemCement
CGCrushed granite (coarse aggregate)
CMODCrack mouth opening displacement
CSR_300FTCsCompressive strength retention after 300 freeze–thaw cycles
EcmSecant modulus of elasticity
EPEutrophication
fcmUniaxial compressive strength
fct, LInitial flexural tensile strength
FRCFiber-reinforced concrete
FSR_300FTCsFlexural strength retention after 300 freeze–thaw cycles
ftSplitting tensile strength
FTCsFreeze–thaw cycles
GfFracture energy
GHGGreenhouse gas
GWPGlobal warming potential
HSFHybrid ISF/RSF
ISFIndustrial steel fiber
ITZInterfacial transition zone
LCALife Cycle Assessment
LCILife cycle inventory
MCDAMulti-Criteria Decision Analysis
MDDMaximum dry density
NANatural aggregate
ODPOzone depletion
OMCOptimum moisture content
OPCOrdinary Portland Cement
PE_NReNon-renewable energy
PE_ReRenewable energy
POCPPhotochemical ozone creation potential
RCARecycled concrete aggregate
RCCPRoller-compacted concrete pavement
RSRiver sand (fine aggregate)
RSFRecycled steel fiber
SPSuperplasticizer
TOPSISTechnique for Order of Preference by Similarity to Ideal Solution
Toug_CompCompressive toughness
Toug_FlexFlexural toughness
TSR_300FTCsTensile strength retention after 300 freeze–thaw cycles
WatWater
WSMWeighted Sum Method
3PNBBTThree-point notched beam bending tests

References

  1. Razi, N.; Ansari, R. A prediction-based model to optimize construction programs: Considering time, cost, energy consumption, and CO2 emissions trade-off. J. Clean. Prod. 2024, 445, 141164. [Google Scholar] [CrossRef]
  2. Min, J.; Yan, G.; Abed, A.M.; Elattar, S.; Khadimallah, M.A.; Jan, A.; Ali, H.E. The effect of carbon dioxide emissions on the building energy efficiency. Fuel 2022, 326, 124842. [Google Scholar] [CrossRef]
  3. Salles, A.; Salati, M.; Bragança, L. Using City Information Modelling to Evaluate Urban Circularity Through Sustainability Indicators. In Creating a Roadmap Towards Circularity in the Built Environment; Springer Nature: Cham, Switzerland, 2023; pp. 385–394. [Google Scholar]
  4. Bakhshi, M.; Soheili, H.; Dalalbashi, A. Optimization of a structural lightweight fiber-reinforced concrete for best performance under impact loading. Cem. Concr. Compos. 2022, 136, 104875. [Google Scholar] [CrossRef]
  5. Hasheminezhad, A.; King, D.; Ceylan, H.; Kim, S. Comparative life cycle assessment of natural and recycled aggregate concrete: A review. Sci. Total Environ. 2024, 950, 175310. [Google Scholar] [CrossRef]
  6. Shmlls, M.; Abed, M.; Fořt, J.; Horvath, T.; Bozsaky, D. Towards closed-loop concrete recycling: Life cycle assessment and multi-criteria analysis. J. Clean. Prod. 2023, 410, 137179. [Google Scholar] [CrossRef]
  7. Azimi, N.; Schollbach, K.; Oliveira, D.V.; Lourenço, P.B. Effect of acidic environment exposure on mechanical properties of TRM composites. Constr. Build. Mater. 2024, 438, 137142. [Google Scholar] [CrossRef]
  8. Bakhshi, M.; Dalalbashi, A.; Soheili, H. Energy dissipation capacity of an optimized structural lightweight perlite concrete. Constr. Build. Mater. 2023, 389, 131765. [Google Scholar] [CrossRef]
  9. Tang, Y.; Xiao, J.; Liu, Q.; Xia, B.; Singh, A.; Lv, Z.; Song, W. Natural gravel-recycled aggregate concrete applied in rural highway pavement: Material properties and life cycle assessment. J. Clean. Prod. 2022, 334, 130219. [Google Scholar] [CrossRef]
  10. Abedi, M.; Hassanshahi, O.; Rashiddel, A.; Ashtari, H.; Meddah, M.S.; Dias, D.; Arjomand, M.A.; Choong, K.K. A sustainable cementitious composite reinforced with natural fibers: An experimental and numerical study. Constr. Build. Mater. 2023, 378, 131093. [Google Scholar] [CrossRef]
  11. Keleş, Ö.F.; Bayrak, O.Ü.; Bayata, H.F. Experimental investigation on mechanical properties of sustainable roller compacted concrete pavement (RCCP) containing waste rubbers as alternative aggregates. Constr. Build. Mater. 2024, 424, 135930. [Google Scholar] [CrossRef]
  12. Debbarma, S.; Ransinchung, G.D. Achieving sustainability in roller compacted concrete pavement mixes using reclaimed asphalt pavement aggregates–state of the art review. J. Clean. Prod. 2021, 287, 125078. [Google Scholar] [CrossRef]
  13. de Bortoli, A. Understanding the environmental impacts of virgin aggregates: Critical literature review and primary comprehensive life cycle assessments. J. Clean. Prod. 2023, 415, 137629. [Google Scholar] [CrossRef]
  14. Sheikh, E.; Mousavi, S.R.; Afshoon, I. Producing green Roller Compacted Concrete (RCC) using fine copper slag aggregates. J. Clean. Prod. 2022, 368, 133005. [Google Scholar] [CrossRef]
  15. Ramezansefat, H.; Rezazadeh, M.; Barros, J.; Valente, I.; Bakhshi, M. Modelling the High Strain Rate Tensile Behavior of Steel Fiber Reinforced Concrete Using Artificial Neural Network Approach. In International Conference on Fibre-Reinforced Polymer (FRP) Composites in Civil Engineering; Springer: Cham, Switzerland, 2021; pp. 1099–1109. [Google Scholar]
  16. Bakhshi, M.; Valente, I.B.; Ramezansefat, H.; Barros, J.A.O. Evaluation of the inertia force in compressive impact loading on steel fiber-reinforced concrete. In RILEM-Fib International Symposium on Fibre Reinforced Concrete; Springer: Cham, Switzerland, 2021; pp. 277–288. [Google Scholar]
  17. Aghayan, I.; Khafajeh, R.; Shamsaei, M. Life cycle assessment, mechanical properties, and durability of roller compacted concrete pavement containing recycled waste materials. Int. J. Pavement Res. Technol. 2021, 14, 595–606. [Google Scholar] [CrossRef]
  18. Xing, W.; Tam, V.W.; Le, K.N.; Hao, J.L.; Wang, J. Life cycle assessment of sustainable concrete with recycled aggregate and supplementary cementitious materials. Resour. Conserv. Recycl. 2023, 193, 106947. [Google Scholar] [CrossRef]
  19. de Andrade Salgado, F.; de Andrade Silva, F. Recycled aggregates from construction and demolition waste towards an application on structural concrete: A review. J. Build. Eng. 2022, 52, 104452. [Google Scholar] [CrossRef]
  20. Özçelikci, E.; Oskay, A.; Bayer, İ.R.; Şahmaran, M. Eco-hybrid cement-based building insulation materials as a circular economy solution to construction and demolition waste. Cem. Concr. Compos. 2023, 141, 105149. [Google Scholar] [CrossRef]
  21. Bai, W.; Song, Z.; Yuan, C.; Guan, J.; Xie, C.; Huang, H.; Ma, Y. Study on mechanical properties and damage mechanism of recycled concrete containing silica fume in freeze–thaw environment. Constr. Build. Mater. 2023, 375, 130872. [Google Scholar] [CrossRef]
  22. Yang, T.; Gong, L.; Jin, C.; Qin, J.; Dang, D.; Cui, X. Study on the pore characteristics and ITZ properties of recycled aggregate concrete by desert sand subjecting to salt freeze-thaw environments. J. Build. Eng. 2025, 108, 112918. [Google Scholar] [CrossRef]
  23. Zhang, W.; Liu, H.; Liu, C. Impact of rice husk ash on the mechanical characteristics and freeze–thaw resistance of recycled aggregate concrete. Appl. Sci. 2022, 12, 12238. [Google Scholar] [CrossRef]
  24. Gao, D.; Luo, F.; Yan, Y.; Tang, J.; Yang, L. Experimental investigation on the flexural performance and damage process of steel fiber reinforced recycled coarse aggregate concrete. In Structures; Elsevier: Amsterdam, The Netherlands, 2023; Volume 51, pp. 1205–1218. [Google Scholar]
  25. Guo, S.; Ding, Y.; Zhang, X.; Xu, P.; Bao, J.; Zou, C. Tensile properties of steel fiber reinforced recycled concrete under bending and uniaxial tensile tests. J. Build. Eng. 2024, 96, 110467. [Google Scholar] [CrossRef]
  26. Barros, J.; Costelha, H.; Bento, D.; Brites, N.; Luís, R.; Patrício, H.; Cunha, V.; Bento, L.; Miranda, T.; Coelho, P.; et al. A multidisciplinary engineering-based approach for tunnelling strengthening with a new fibre reinforced shotcrete technology. Tunn. Undergr. Space Technol. 2024, 147, 105707. [Google Scholar] [CrossRef]
  27. Bakhshi, M.; Valente, I.B.; Ramezansefat, H.; Barros, J.A.O.; Pereira, E.N.B.; Peixinho, N.R.M. Experimental and analytical study of the high-strain-rate flexural behavior of SFRC. J. Mater. Civ. Eng. 2023, 36, 04024043. [Google Scholar] [CrossRef]
  28. Ramezansefat, H.; Rezazadeh, M.; Barros, J.A.O.; Valente, I.B.; Bakhshi, M. Modeling the Compressive Behavior of Steel Fiber Reinforced Concrete Under High Strain Rate Loads. In RILEM-Fib International Symposium on Fibre Reinforced Concrete; Springer: Cham, Switzerland, 2021; pp. 703–713. [Google Scholar]
  29. Hassanshahi, O.; Salati, M.; Azimi, N.; Bakhshi, M. Hybrid Steel Fibers and RCA in RCC Pavements: Mechanical Recovery, Freeze–Thaw Durability, and Eco-Efficiency. Infrastructures 2025, 10, 321. [Google Scholar] [CrossRef]
  30. Bakhshi, M.; Valente, I.B.; Ramezansefat, H.; Barros, J.A.O. Effect of inertia and test approach on the high-strain-rate tensile behavior of steel fiber reinforced concrete. Cem. Concr. Compos. 2025, 161, 106095. [Google Scholar] [CrossRef]
  31. Wang, Z.; Hu, H.; Papastergiou, P.; Angelakopoulos, H.; Guadagnini, M.; Pilakoutas, K. Effect of fibre length on the mechanical properties of SFRC using recycled Steel fibres. Constr. Build. Mater. 2024, 415, 134890. [Google Scholar] [CrossRef]
  32. Zhang, P.; Wang, C.; Guo, J.; Wu, J.; Zhang, C. Production of sustainable steel fiber-reinforced rubberized concrete with enhanced mechanical properties: A state-of-the-art review. J. Build. Eng. 2024, 91, 109735. [Google Scholar] [CrossRef]
  33. Mahboob, A.; Hassanshahi, O.; Safi, M.; Majid, T.A. Experimental investigation of eco-friendly fiber-reinforced concrete using recycled and natural fibers, integrated with recycled aggregates. Adv. Compos. Mater. 2024, 33, 1101–1130. [Google Scholar] [CrossRef]
  34. Abdolpour, H.; Niewiadomski, P.; Kwiecień, A.; Tekieli, M.; Sadowski, Ł. Fundamental understanding of the mechanical and post-cracking behaviour of ultra-high performance mortar with recycled steel fibers. Constr. Build. Mater. 2023, 374, 130918. [Google Scholar] [CrossRef]
  35. Roshan, N.; Ghalehnovi, M.; Pakzad, S.S. Recycled steel fiber for fiber reinforced concrete production: Fresh and hardened properties, cost, and ecological assessments. J. Build. Pathol. Rehabilitation 2023, 8, 24. [Google Scholar] [CrossRef]
  36. Gu, L.; Liu, Y.; Zeng, J.; Zhang, Z.; Pham, P.N.; Liu, C.; Zhuge, Y. The synergistic effects of fibres on mechanical properties of recycled aggregate concrete: A comprehensive review. Constr. Build. Mater. 2024, 436, 137011. [Google Scholar] [CrossRef]
  37. Zhong, H.; Chen, M.; Zhang, M. Effect of hybrid industrial and recycled steel fibres on static and dynamic mechanical properties of ultra-high performance concrete. Constr. Build. Mater. 2023, 370, 130691. [Google Scholar] [CrossRef]
  38. Mehmandari, T.A.; Shokouhian, M.; Josheghan, M.Z.; Mirjafari, S.A.; Fahimifar, A.; Armaghani, D.J.; Tee, K.F. Flexural properties of fiber-reinforced concrete using hybrid recycled steel fibers and manufactured steel fibers. J. Build. Eng. 2024, 98, 111069. [Google Scholar] [CrossRef]
  39. Dharek, M.S.; Manjunatha, M.; Brijbhushan, S.; Vengala, J.; Tangadagi, R.B. Performance evaluation of hybrid fiber reinforced concrete on engineering properties and life cycle assessment: A sustainable approach. J. Clean. Prod. 2024, 458, 142498. [Google Scholar] [CrossRef]
  40. Zhu, P.; Chen, X.; Liu, H.; Wang, Z.; Chen, C.; Li, H. Recycling of waste recycled aggregate concrete in freeze-thaw environment and emergy analysis of concrete recycling system. J. Build. Eng. 2024, 96, 110377. [Google Scholar] [CrossRef]
  41. Taheri, A.; Azimi, N.; Oliveira, D.V.; Tinoco, J.; Lourenço, P.B. Integrating Experimental Analysis and Gradient Boosting for the Durability Assessment of Lime-Based Mortar in Acidic Environment. Buildings 2025, 15, 408. [Google Scholar] [CrossRef]
  42. Zhang, Y.; Sun, X.; Zhu, X.; Xiao, J. Multi-criteria optimization of concrete mixes incorporating cenosphere waste and multi-minerals. J. Clean. Prod. 2022, 367, 133102. [Google Scholar] [CrossRef]
  43. Rashid, K.; Rehman, M.U.; de Brito, J.; Ghafoor, H. Multi-criteria optimization of recycled aggregate concrete mixes. J. Clean. Prod. 2020, 276, 124316. [Google Scholar] [CrossRef]
  44. Negrin, I.; Kripka, M.; Yepes, V. Multi-criteria optimization for sustainability-based design of reinforced concrete frame buildings. J. Clean. Prod. 2023, 425, 139115. [Google Scholar] [CrossRef]
  45. Hoseini, S.O.; Sohrabi, M.R.; Mousavi, S.R.; Ghasemi, M. November. Studying the rheological features, mechanical properties and flexural toughness of the WSFRSCC by varying the coarse aggregate volume. In Structures; Elsevier: Amsterdam, The Netherlands, 2023; Volume 57, p. 105115. [Google Scholar]
  46. EFCA. Environmental Product Declaration (EPD) Report. In Concrete Admixtures–Plasticisers and Superplasticisers; European Federation of Concrete Admixtures Associations Ltd. (EFCA): Vigo, Spain, 2015. [Google Scholar]
  47. EN 197-1; European Reference Life Cycle Database of the Joint Research Center, Version 3.2: Portland Cement (CEM I). CEMBUREAU Production Mix, at Plant, CEMBUREAU Technology Mix. European Committee for Standardization: Brussels, Belgium, 2015.
  48. Park, W.J.; Kim, T.; Roh, S.; Kim, R. Analysis of life cycle environmental impact of recycled aggregate. Appl. Sci. 2019, 9, 1021. [Google Scholar] [CrossRef]
  49. Hassanshahi, O.; Kameli, S.; Mohammadpour, R.; Bakhshi, M.; Mahboob, A. Experimental Investigation of Sustainable Roller-Compacted Concrete Pavement (RCCP) Reinforced with Natural Fibers: Mechanical Performance, Durability, and Environmental Impacts. Int. J. Pavement Res. Technol. 2025, 1–24. [Google Scholar] [CrossRef]
  50. Salati, M.; Bragança, L.; Mateus, R. Sustainability assessment on an urban scale: Context, challenges, and most relevant indicators. Appl. Syst. Innov. 2022, 5, 41. [Google Scholar] [CrossRef]
  51. Braga, A.M.; Silvestre, J.D.; de Brito, J. Compared environmental and economic impact from cradle to gate of concrete with natural and recycled coarse aggregates. J. Clean. Prod. 2017, 162, 529–543. [Google Scholar] [CrossRef]
  52. Salles, A.; Salati, M.; Bragança, L. Analyzing the feasibility of integrating urban sustainability assessment indicators with city information modelling (CIM). Appl. Syst. Innov. 2023, 6, 45. [Google Scholar] [CrossRef]
  53. Abed, M.; Shmlls, M. Analysis of three generations of recycled concrete: An approach using LCA and weighted sum model. In Materials Today: Proceedings; Elsevier: Amsterdam, The Netherlands, 2023. [Google Scholar] [CrossRef]
  54. Kareem, M.A.; Ajadi, E.O.; Fadipe, O.O.; Ishola, K.; Olawuyi, O.A.; Ayanlere, S.A.; Olatoyan, O.J.; Adeosun, J.O.; Adefajo, A.A.; Oyewo, A.T.; et al. Sustainability-driven application of waste steel and tyre rubber fibres as reinforcement in concrete: An optimization study using response surface methodology. Next Mater. 2024, 7, 100345. [Google Scholar] [CrossRef]
  55. Zong, S.; Liu, Z.; Li, S.; Lu, Y.; Zheng, A. Stress-strain behaviour of steel-fibre-reinforced recycled aggregate concrete under axial tension. J. Clean. Prod. 2021, 278, 123248. [Google Scholar] [CrossRef]
  56. Peen, W.Y.; Keong, C.K. Behaviour of hollow circular section with multiple perforations under compression, flexure and torsion. Lat. Am. J. Solids Struct. 2019, 16, e169. [Google Scholar] [CrossRef]
  57. Li, J.; Zhang, J.; Ni, S.; Liu, L.; Walubita, L.F. Mechanical performance and environmental impacts of self-compacting concrete with recycled demolished concrete blocks. J. Clean. Prod. 2021, 293, 126129. [Google Scholar] [CrossRef]
  58. Yang, Y.; Zhou, Q.; Deng, Y.; Lin, J. Reinforcement effects of multi-scale hybrid fiber on flexural and fracture behaviors of ultra-low-weight foamed cement-based composites. Cem. Concr. Compos. 2022, 128, 104422. [Google Scholar] [CrossRef]
  59. Ramkumar, K.B.; PR, K.R. Impact of hybrid steel fibres on fresh and mechanical properties of Self-compacting concrete. Case Stud. Constr. Mater 2022, 17, e01274. [Google Scholar]
  60. Mahboob, A.; Hasanshahi, O.; Hakimi, A.; Safi, M. Evaluating the performance of hollow core slabs (HCS)-concrete and simplifying their implementation. Recent Prog. Mater. 2023, 5, 1–15. [Google Scholar] [CrossRef]
  61. Wu, Z.; Shi, C.; Khayat, K.H. Investigation of mechanical properties and shrinkage of ultra-high performance concrete: Influence of steel fiber content and shape. Compos. Part B Eng. 2019, 174, 107021. [Google Scholar] [CrossRef]
  62. Yin, D.; Zhang, M.; Xiong, B.; Zhang, S. Study on the physical and mechanical properties of concrete interfacial transition zones (ITZ) with consideration of positional effects. Constr. Build. Mater. 2025, 486, 141985. [Google Scholar] [CrossRef]
  63. Htet, P.; Chen, W.; Hao, H.; Shaikh, F. Influence of micro basalt and recycled macro polypropylene hybrid fibre on physical and mechanical properties of recycled aggregate concrete. J. Build. Eng. 2023, 76, 107083. [Google Scholar] [CrossRef]
  64. Cui, K.; Xu, L.; Tao, T.; Huang, L.; Li, J.; Hong, J.; Li, H.; Chi, Y. Mechanical behavior of multiscale hybrid fiber reinforced recycled aggregate concrete subject to uniaxial compression. J. Build. Eng. 2023, 71, 106504. [Google Scholar] [CrossRef]
  65. Abedi, M.; Sanivada, U.K.; Mirian, S.A.; Fangueiro, R. A self-sensing and self-heating planar braided composite for smart civil infrastructures reinforcement. Constr. Build. Mater. 2023, 387, 131617. [Google Scholar] [CrossRef]
  66. Zia, A.; Zhang, P.; Holly, I. Effectiveness of hybrid discarded tire/Industrial steel fibers for improving the sustainability of concrete structures. Constr. Build. Mater. 2023, 378, 131226. [Google Scholar] [CrossRef]
  67. Yousefi, A.; Bunnori, N.M.; Khavarian, M. Experimental investigation on effect of multi-walled carbon nanotubes concentration on flexural properties and microstructure of cement mortar composite. In Proceedings of the International Conference of Global Network for Innovative Technology and Awam International Conference in Civil Engineering (IGNITE-AICCE’17), Penang, Malaysia, 8–9 August 2017; AIP Conference Proceedings. AIP Publishing: Melville, NY, USA, 2017; Volume 1892. [Google Scholar] [CrossRef]
  68. Wang, Z.; Liang, X.; Wan, S.; Cao, Z.; Weng, S.; Wu, K. Experimental and theoretical investigation on axial tensile behavior of ultra-high performance concrete (UHPC) with recycled steel fibers from waste tires. Constr. Build. Mater. 2024, 456, 139300. [Google Scholar] [CrossRef]
  69. Abedi, M.; Hasanshahi, O.; Barros, J.A.; Correia, A.G.; Fangueiro, R. Three-dimensional braided composites as innovative smart structural reinforcements. Compos. Struct. 2022, 297, 115912. [Google Scholar] [CrossRef]
  70. Yuan, C.; Qu, S.; Bai, W.; Guan, J.; Xie, Y. Study on the mechanical properties and mesoscopic damage mechanism of recycled aggregate concrete under different dynamic strain rates after freeze-thaw cycles. Case Stud. Constr. Mater. 2025, 22, e04182. [Google Scholar] [CrossRef]
  71. Azimi, N.; Oliveira, D.V.; Schollbach, K.; Lourenço, P.B. Durability and bond behavior of textile-reinforced mortar composites under prolonged saline exposure. J. Build. Eng. 2025, 112, 113887. [Google Scholar] [CrossRef]
  72. Azimi, N.; Oliveira, D.V.; Ghiassi, B.; Dalalbashi, A.; Lourenço, P.B. Evaluation of creep effects on textile-reinforced mortar via single-lap shear testing. Constr. Build. Mater. 2025, 497, 143897. [Google Scholar] [CrossRef]
  73. Shao, R.; Wu, C.; Li, J.; Liu, Z. Development of sustainable steel fibre-reinforced dry ultra-high performance concrete (DUHPC). J. Clean. Prod. 2022, 337, 130507. [Google Scholar] [CrossRef]
  74. Zhong, R.; Ai, X.; Pan, M.; Yao, Y.; Cheng, Z.; Peng, X.; Wang, J.; Zhou, W. Durability of micro-cracked UHPC subjected to coupled freeze-thaw and chloride salt attacks. Cem. Concr. Compos. 2024, 148, 105471. [Google Scholar] [CrossRef]
  75. Han, X.; Ding, N.; Chen, A.; Wang, Z.; Xu, Y.; Feng, L.; Ji, Y.; Li, K.; Jing, J.; Sun, S.; et al. Experimental study on freeze-thaw failure of concrete incorporating waste tire crumb rubber and analytical evaluation of frost resistance. Constr. Build. Mater. 2024, 439, 137356. [Google Scholar] [CrossRef]
  76. Hassanshahi, O.; Jorge, M.; Sena-Cruz, J.; Correia, L.; Leite, C.; Hasan, T.; Correia, J.R.; Garrido, M.; Cabral-Fonseca, S. Durability of GFRP composites produced by pultrusion under thermal environments. Procedia Struct. Integr. 2024, 64, 81–88. [Google Scholar] [CrossRef]
  77. El Ouni, M.H.; Shah, S.H.A.; Ali, A.; Muhammad, S.; Mahmood, M.S.; Ali, B.; Marzouki, R.; Raza, A. Mechanical performance, water and chloride permeability of hybrid steel-polypropylene fiber-reinforced recycled aggregate concrete. Case Stud. Constr. Mater. 2022, 16, e00831. [Google Scholar] [CrossRef]
  78. Hasanshahi, O.; Majid, T.A.; Lau, T.L.; Yousefi, A.; Tahara, R.M.K. Seismic performance of the typical RC beam–column joint subjected to repeated earthquakes. In Proceedings of the International Conference of Global Network for Innovative Technology and Awam International Conference in Civil Engineering (IGNITE-AICCE’17), Penang, Malaysia, 8–9 August 2017; AIP Conference Proceedings. AIP Publishing: Melville, NY, USA, 2017; Volume 1892, p. 120014. [Google Scholar] [CrossRef]
  79. Lu, D.; Wang, D.; Wang, Y.; Zhong, J. Nano-engineering the interfacial transition zone between recycled concrete aggregates and fresh paste with graphene oxide. Constr. Build. Mater. 2023, 384, 131244. [Google Scholar] [CrossRef]
  80. Bao, X.; Li, Y.; Chen, X.; Yang, H.; Cui, H. Investigation on the flexural behaviour and crack propagation of hybrid steel fibre reinforced concrete with a low fibre content for tunnel structures. Constr. Build. Mater. 2024, 417, 135253. [Google Scholar] [CrossRef]
  81. Wang, X.; Liu, Y.; Yoo, D.Y. Combined corrosion and inclination effects on pullout behavior of various steel fibers under wet-dry cycle deterioration. Cem. Concr. Compos. 2023, 142, 105229. [Google Scholar] [CrossRef]
  82. Salati, M.; Costa, A.A.; Silvestre, J.D. A Comprehensive Review of Dynamic Life Cycle Assessment for Buildings: Exploring Key Processes and Methodologies. Sustainability 2024, 17, 159. [Google Scholar] [CrossRef]
  83. Ma, X.; Hu, H.; Luo, Y.; Yao, W.; Wei, Y.; She, A. A carbon footprint assessment for usage of recycled aggregate and supplementary cementitious materials for sustainable concrete: A life-cycle perspective in China. J. Clean. Prod. 2025, 490, 144772. [Google Scholar] [CrossRef]
  84. Li, L.; Li, S.; Li, W.; Xiao, H.; Xu, K.; Yang, J. Mechanical properties of soil reinforced by fiber and alkaline-activated rice husk ash, and rainfall erosion model tests. Sci. Total Environ. 2025, 958, 178099. [Google Scholar] [CrossRef]
  85. Hafez, H.; Malchiodi, B.; Tošić, N.; Drewniok, M.; Purnell, P.; de la Fuente, A. Decarbonization potential of steel fibre-reinforced limestone calcined clay cement concrete one-way slabs. Constr. Build. Mater. 2024, 435, 136847. [Google Scholar] [CrossRef]
  86. Dezhampanah, S.; Nikbin, I.; Charkhtab, S.; Fakhimi, F.; Bazkiaei, S.M.; Mohebbi, R. Environmental performance and durability of concrete incorporating waste tire rubber and steel fiber subjected to acid attack. J. Clean. Prod. 2020, 268, 122216. [Google Scholar] [CrossRef]
  87. Kumari, S.; Walia, R. Life cycle assessment of sustainable concrete by utilizing groundnut husk ash in concrete. Mater. Today Proc. 2022, 49, 1910–1915. [Google Scholar] [CrossRef]
  88. Sadhukhan, J.; Sen, S.; Gadkari, S. The mathematics of life cycle sustainability assessment. J. Clean. Prod. 2021, 309, 127457. [Google Scholar] [CrossRef]
  89. Huang, W.; Wang, H. Comprehensive assessment of engineering and environmental attributes of geopolymer pervious concrete with natural and recycled aggregate. J. Clean. Prod. 2024, 468, 143138. [Google Scholar] [CrossRef]
  90. Biswas, W.K.; Zhang, X.; Matters, C.; Maboud, M. Techno-Eco-Efficiency Assessment of Using Recycled Steel Fibre in Concrete. Sustainability 2024, 16, 3717. [Google Scholar] [CrossRef]
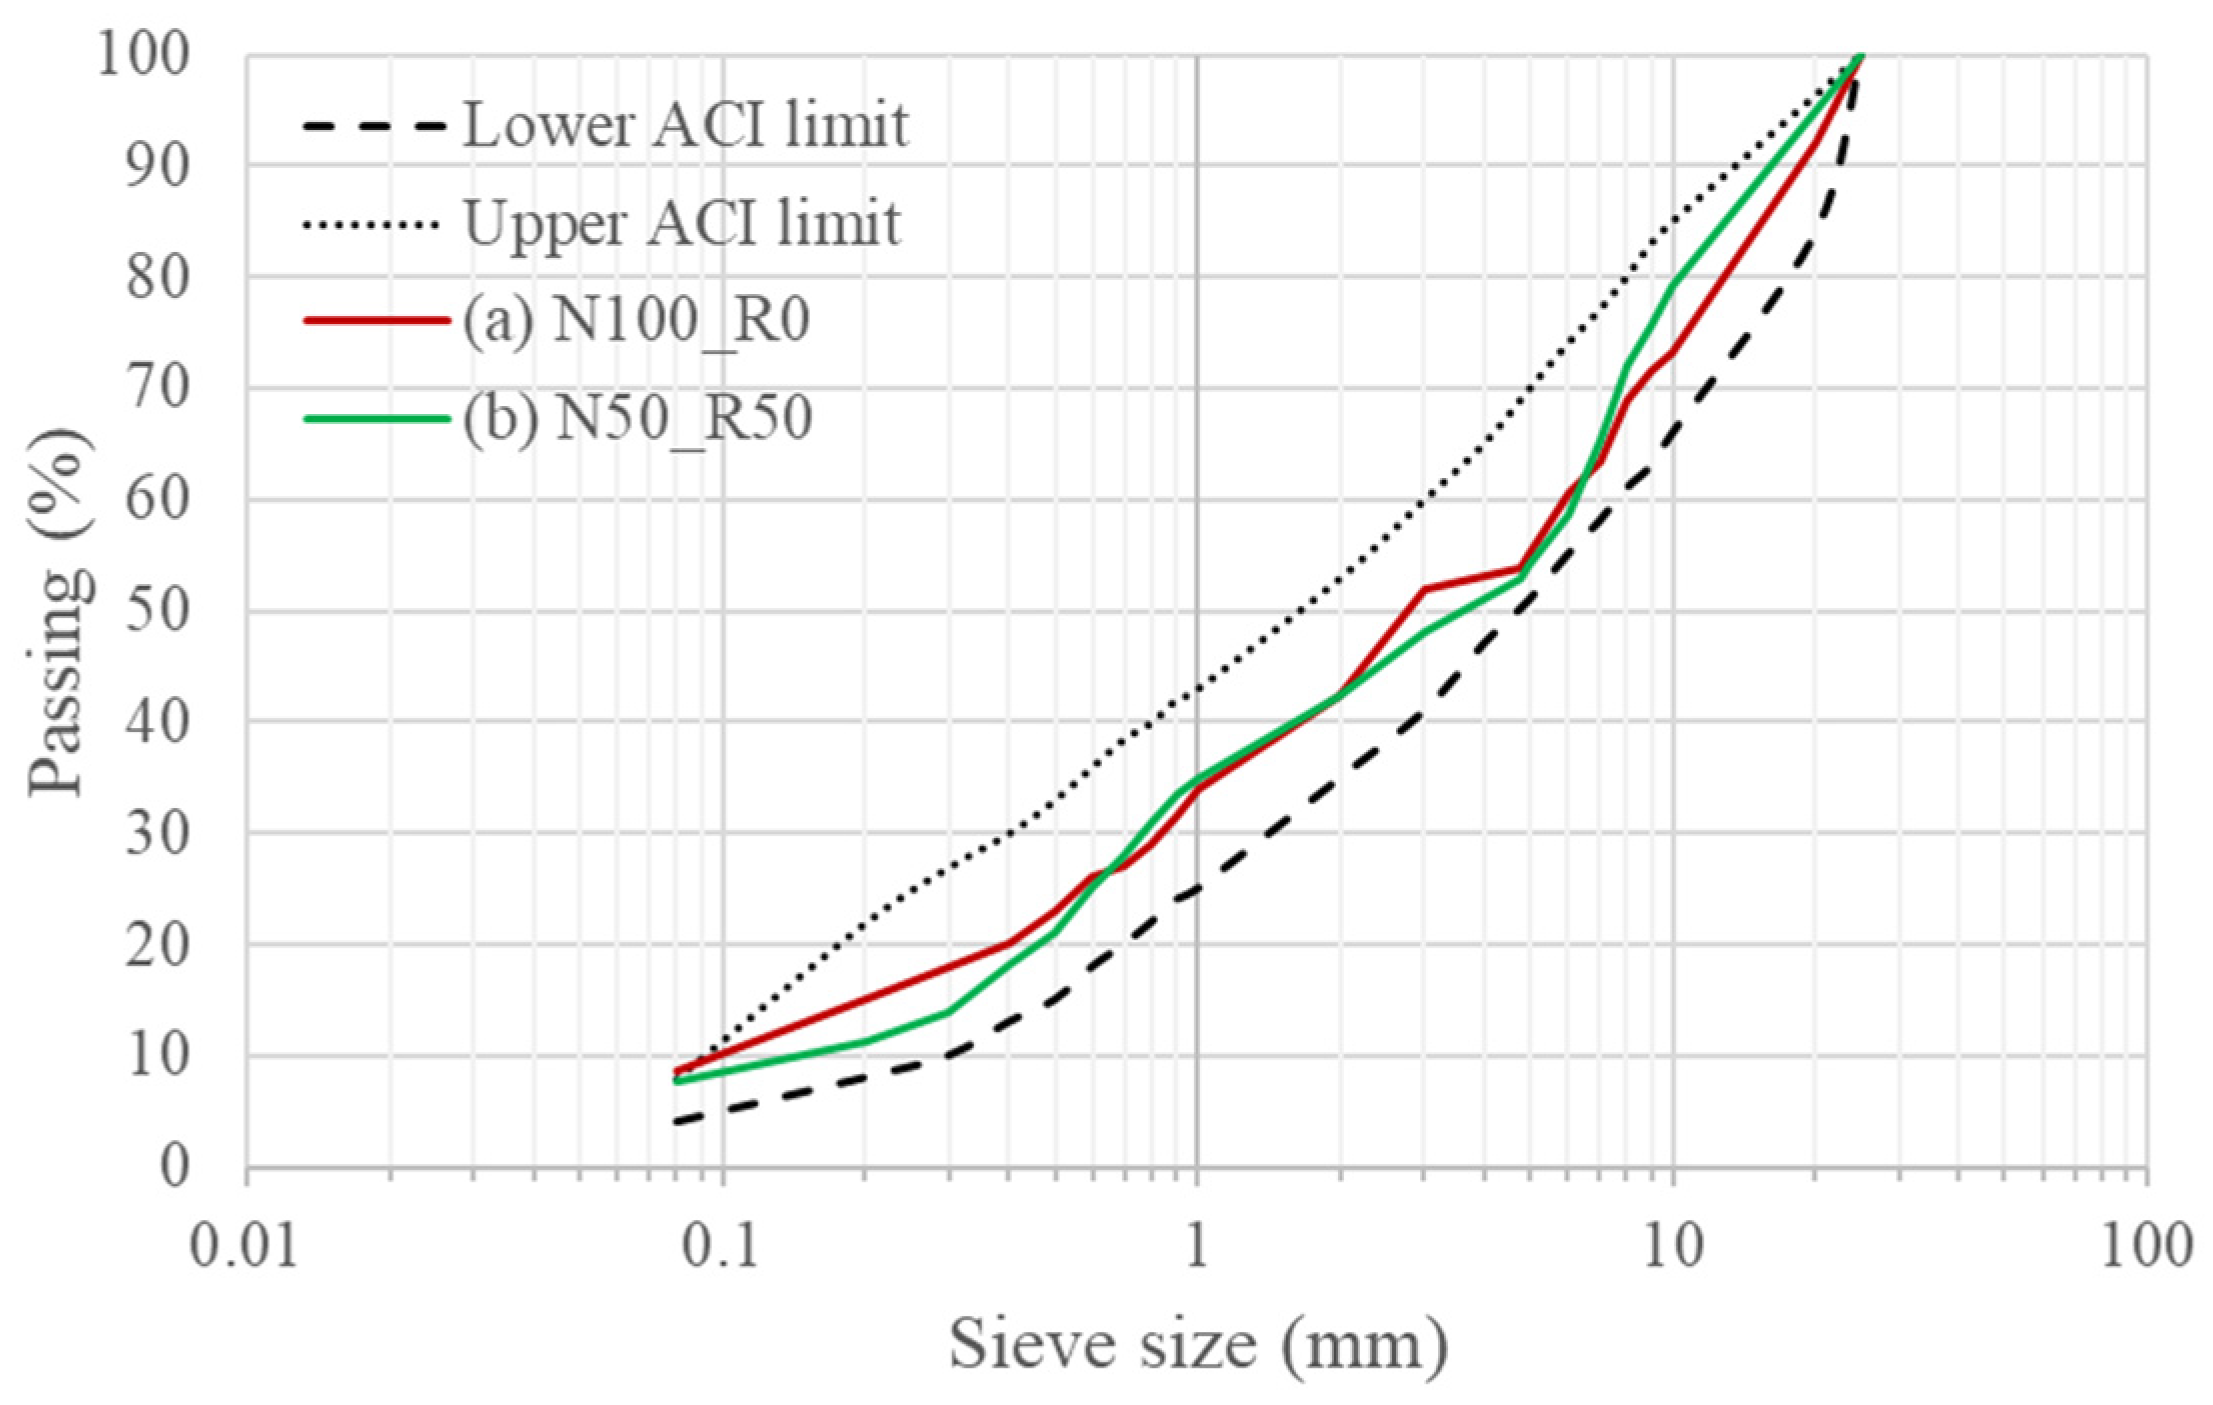
Figure 1. Particle size distribution curve of combined aggregates for two RCCP groups: (a) N100_R0, (b) N50_R50.
Buildings 15 04279 g001
Figure 2. Fibers used in fiber-reinforced RCCP mixtures: (a) ISF, (b) RSF.
Buildings 15 04279 g002
Figure 3. Experimental setup and monitoring systems for uniaxial compressive tests, illustrated with an experimental photo, and front views.
Buildings 15 04279 g003
Figure 4. Experimental setup and loading mechanism for splitting tensile strength tests, including isometric, front, and in-test photographs of the specimen arrangement.
Buildings 15 04279 g004
Figure 5. Experimental setup and monitoring systems for three-point notched beam bending tests (3PNBBT), illustrated with an experimental photo, front, and cross section views.
Buildings 15 04279 g005
Figure 6. Schematic freeze–thaw cycle.
Buildings 15 04279 g006
Figure 7. Compressive stress–strain relationship: (a) N100_R0 Series, (b) N50_R50 Series, at 28 days.
Buildings 15 04279 g007
Figure 8. Splitting tensile strength (MPa) and its corresponding CoV (%) of fiber-reinforced RCCP mixtures: (a) N100_R0 Series, (b) N50_R50 Series, at 28 days.
Buildings 15 04279 g008
Figure 9. Load and flexural stress versus CMOD curves for RCCPs: (a) N100_R0 Series, (b) N50_R50 Series, at 28 days. Note: CMOD = Crack mouth opening displacement; CMOD1–CMOD4 = CMOD levels 1–4.
Buildings 15 04279 g009
Figure 10. Flexural toughness and fracture energy with corresponding CoV (%) up to a CMOD of 3.5 mm: (a) N100_R0 Series, (b) N50_R50 Series, at 28 days.
Buildings 15 04279 g010
Figure 11. Compressive strength retention of RCCPs, subjected to 100, 200, and 300 FTCs: (a) N100_R0 Series, (b) N50_R50 Series.
Buildings 15 04279 g011
Figure 12. Tensile strength retention of RCCPs, subjected to 100, 200, and 300 FTCs: (a) N100_R0 Series, (b) N50_R50 Series.
Buildings 15 04279 g012
Figure 13. Flexural strength retention of RCCPs, subjected to 100, 200, and 300 FTCs: (a) N100_R0 Series, (b) N50_R50 Series.
Buildings 15 04279 g013
Figure 14. Comparison of global warming potential (GWP) for producing 1 m3 of RCCP mixtures: (a) N100_R0 Series, (b) N50_R50 Series. Note: Cem = Cement; Wat = Water; RCA = Recycled concrete aggregate; CG = Crushed granite; RS = River sand; ISF = Industrial steel fiber; RSF = Recycled steel fiber; SP = Superplasticizer.
Buildings 15 04279 g014
Figure 15. Comparison of ozone depletion potential (ODP) for producing 1 m3 of RCCP mixtures: (a) N100_R0 Series, (b) N50_R50 Series. Note:Cem = Cement; Wat = Water; RCA = Recycled concrete aggregate; CG = Crushed granite; RS = River sand; ISF = Industrial steel fiber; RSF = Recycled steel fiber; SP = Superplasticizer.
Buildings 15 04279 g015
Figure 16. Comparison of acidification potential (AP) for producing 1 m3 of RCCP mixtures: (a) N100_R0 Series, (b) N50_R50 Series. Note: Cem = Cement; Wat = Water; RCA = Recycled concrete aggregate; CG = Crushed granite; RS = River sand; ISF = Industrial steel fiber; RSF = Recycled steel fiber; SP = Superplasticizer.
Buildings 15 04279 g016
Figure 17. Comparison of eutrophication potential (EP) for producing 1 m3 of RCCP mixtures: (a) N100_R0 Series, (b) N50_R50 Series. Note: Cem = Cement; Wat = Water; RCA = Recycled concrete aggregate; CG = Crushed granite; RS = River sand; ISF = Industrial steel fiber; RSF = Recycled steel fiber; SP = Superplasticizer.
Buildings 15 04279 g017
Figure 18. Comparison of photochemical ozone creation potential (POCP) for producing 1 m3 of RCCP mixtures: (a) N100_R0 Series, (b) N50_R50 Series. Note: Cem = Cement; Wat = Water; RCA = Recycled concrete aggregate; CG = Crushed granite; RS = River sand; ISF = Industrial steel fiber; RSF = Recycled steel fiber; SP = Superplasticizer.
Buildings 15 04279 g018
Figure 19. Comparison of abiotic depletion potential (ADP-elements) for producing 1 m3 of RCCP mixtures: (a) N100_R0 Series, (b) N50_R50 Series. Note: Cem = Cement; Wat = Water; RCA = Recycled concrete aggregate; CG = Crushed granite; RS = River sand; RSF = Recycled steel fiber; SP = Superplasticizer.
Buildings 15 04279 g019
Figure 20. Comparison of abiotic depletion potential (ADP-fossil fuels) for producing 1 m3 of RCCP mixtures: (a) N100_R0 Series, (b) N50_R50 Series. Note: Cem = Cement; RCA = Recycled concrete aggregate; ISF = Industrial steel fiber; RSF = Recycled steel fiber; SP = Superplasticizer.
Buildings 15 04279 g020
Figure 21. Comparison of non-renewable primary energy consumption (PE-NRe) for producing 1 m3 of RCCP mixtures: (a) N100_R0 Series, (b) N50_R50 Series. Note: Cem = Cement; Wat = Water; RCA = Recycled concrete aggregate; CG = Crushed granite; RS = River sand; ISF = Industrial steel fiber; RSF = Recycled steel fiber; SP = Superplasticizer.
Buildings 15 04279 g021
Figure 22. Comparison of renewable primary energy consumption (PE-Re) for producing 1 m3 of RCCP mixtures: (a) N100_R0 Series, (b) N50_R50 Series. Note: Cem = Cement; Wat = Water; RCA = Recycled concrete aggregate; CG = Crushed granite; ISF = Industrial steel fiber; RSF = Recycled steel fiber; SP = Superplasticizer.
Buildings 15 04279 g022
Figure 23. Normalized comparison of mechanical properties, durability (after 300 FTCs), and environmental impacts for the two most eco-efficient RCCP mixtures, compared with N100_R0_ISF0.9_RSF0 as a control mixture, based on the WSM/TOPSIS eco-efficiency rankings. Note: fcm = Compressive strength; ft = Tensile strength; fct,L = Limit of proportionality tensile strength; Gf = Fracture energy; Ecm = Elastic modulus; Toug_Flex = Flexural toughness; Toug_Comp = Compressive toughness; CSR_300FTCs = Compressive strength retention after 300 freeze–thaw cycles; TSR_300FTCs = Tensile strength retention after 300 freeze–thaw cycles; FSR_300FTCs = Flexural strength retention after 300 freeze–thaw cycles; GWP = Global warming potential; ODP = Ozone depletion potential; AP = Acidification potential; EP = Eutrophication potential; POCP = Photochemical ozone creation potential; ADP_Elem = Abiotic depletion potential (elements); ADP_Foss = Abiotic depletion potential (fossil fuels); PE-NRe = Non-renewable primary energy; PE-Re = Renewable primary energy.
Buildings 15 04279 g023
Table 1. Physical properties of natural and recycled aggregates used in RCCP mixtures.
VariablesCoarse Aggregates (kg/m3)Fine Aggregate (kg/m3)
RCACGRS
Bulk specific gravity (OD)2.352.682.56
Bulk specific gravity (SSD)2.452.722.61
Apparent specific gravity2.552.782.66
Fineness modulus (FM)--2.85
Absorption capacity (%)6.50.80.5
Voids (%)Loose condition352738
Compact condition302233
Note: RCA = Recycled concrete aggregate; CG = Crushed granite; RS = River sand.
Table 2. Chemical oxide composition of ordinary Portland cement (CEM I 42.5R) by weight percentage.
SiO2 (%)Al2O3 (%)Fe2O3 (%)MgO (%)CaO (%)Na2O (%)K2O (%)SO3 (%)Loss of IgnitionSpecific Gravity (g/cm3)
13.483.697.781.2967.460.360.984.821.983.18
Table 3. Physical and mechanical characteristics of industrial and recycled steel fibers.
FibersDensity (Kg/m3)Tensile Strength (MPa)Modulus of Elasticity (MPa)Elongation (%)Diameter (mm)Length (mm)
ISF74001230210,0003.0 ± 1.00.5533.0
RSF74002648 ± 423200,0002.2 ± 1.50.25 ± 0.0826 ± 10
Note: ISF = Industrial steel fiber; RSF = Recycled steel fiber.
Table 4. Mix proportions and material quantities of RCCP mixtures.
ComponentsQuantity (kg/m3)
CemWatRCACGRSISFRSFSPWat/Cem (−)
N100_R0_ISF0_RSF0340159.5-1120930---0.47
N100_R0_ISF0.3_RSF0340154.04-112093021.6-3.40.45
N100_R0_ISF0.6_RSF0340158.6-112093043.2-6.80.47
N100_R0_ISF0.9_RSF0340157.3-112093064.8-10.20.46
N100_R0_ISF0_RSF0.3340156.04-1120930-21.63.40.46
N100_R0_ISF0_RSF0.6340156.2-1120930-43.26.80.46
N100_R0_ISF0_RSF0.9340159.7-1120930-64.810.20.47
N100_R0_ISF0.15_RSF0.15340155-112093010.810.83.40.46
N100_R0_ISF0.3_RSF0.3340159.71-112093021.621.66.80.47
N100_R0_ISF0.45_RSF0.45340157.54-112093032.432.410.20.46
N50_R50_ISF0_RSF0340183.9491560930---0.54
N50_R50_ISF0.3_RSF0340181.449156093021.6-3.40.53
N50_R50_ISF0.6_RSF0340188.1449156093043.2-6.80.55
N50_R50_ISF0.9_RSF0340186.649156093064.8-10.20.55
N50_R50_ISF0_RSF0.3340170.2491560930-21.63.40.5
N50_R50_ISF0_RSF0.6340178.4491560930-43.26.80.52
N50_R50_ISF0_RSF0.9340186.9491560930-64.810.20.55
N50_R50_ISF0.15_RSF0.15340182.449156093010.810.83.40.54
N50_R50_ISF0.3_RSF0.3340181.849156093021.621.66.80.53
N50_R50_ISF0.45_RSF0.4534018549156093032.432.410.20.54
Note: Cem = Cement; Wat = Water; RCA = Recycled concrete aggregate; CG = Crushed granite; RS = River sand; ISF = Industrial steel fiber; RSF = Recycled steel fiber; SP = Superplasticizer.
Table 5. Baseline environmental impacts associated with the production of 1 kg of each raw material, calculated using the CML method under a cradle-to-gate boundary.
Raw MaterialsGWP
(kg CO2-eq.)
ODP
(kg CFC11-eq.)
AP
(kg SO2-eq.)
EP ( kg   P O 4 3 -eq.)POCP
(kg ethene-eq.)
ADP
Elements (kg Sb-eq.)Fossil Fuels (MJ)
Cem0.903234.37 × −1080.002210.0002590.0001661.43 × −1083.47205
Wat0.000263.01 × −10111.31 × −1067.28 × −1075.88 × −1085.83 × −10100.0
RCA0.003966.82 × −10112.97 × −1051.37 × −1056.33 × −1075.5 × −10100.0533
CG0.02442.43 × −10100.0001443.18 × −1057.83 × −1061.09 × −1090.0
RS0.0031451.17 × −10103.59 × −1058.1 × −1067.28 × −1073.28 × −10120.0
ISF1.095887.97 × −1080.002980.0003070.00050.011.371
RSF0.054748.63 × −1090.0003271.72 × −1051.62 × −1051.36 × −1090.642
SP1.882.3 × −10100.002920.001030.0002120.000001129.1
Note: GWP = Global warming potential; ODP = Ozone depletion potential; AP = Acidification potential; EP = Eutrophication potential; POCP = Photochemical ozone creation potential; ADP-Elements = Abiotic depletion potential (elements); ADP-Fossil fuels = Abiotic depletion potential (fossil fuels).
Table 6. CED results for the production of 1 kg of raw materials, detailing total, non-renewable, and renewable energy demand.
Raw MaterialsPE-NRe (MJ)PE-Re (MJ)
Cem4.1120.1322
Wat0.00510.000683
RCA0.050.0001
CG0.3440.000381
RS0.040.0
ISF12.10.21928
RSF0.9910.01527
SP31.41.51
Note: PE-NRe = Non-renewable primary energy; PE-Re = Renewable primary energy.
Table 7. Results for compressive strength, elastic secant modulus, and toughness of cylindrical specimens after 28 days.
Cylinder SpecimensCompressive StrengthSecant Modulus of ElasticityCompressive Toughness
f c m (MPa)CoV (%) E c m (MPa)CoV (%) T o u g _ C o m p (N/mm)CoV (%)
N100_R0_ISF0_RSF031.726.7234431.45.9115.7717.01
N100_R0_ISF0.3_RSF028.14.8932304.445.8818.4219.63
N100_R0_ISF0.6_RSF031.154.233245.584.634.7711.20
N100_R0_ISF0.9_RSF024.426.9129177.75.8939.6213.76
N100_R0_ISF0_RSF0.327.045.7231342.95.5318.5318.07
N100_R0_ISF0_RSF0.626.184.2830987.924.5620.8320.05
N100_R0_ISF0_RSF0.924.56.8229473.85.7238.6614.92
N100_R0_ISF0.15_RSF0.1527.53.8131677.16.5718.0721.87
N100_R0_ISF0.3_RSF0.325.135.5529973.077.5930.6913.85
N100_R0_ISF0.45_RSF0.4529.054.3733358.414.740.4813.11
N50_R50_ISF0_RSF025.194.2930192.086.1214.2913.7
N50_R50_ISF0.3_RSF025.616.4430533.796.4221.2716.46
N50_R50_ISF0.6_RSF028.75.2132481.514.9530.8813.68
N50_R50_ISF0.9_RSF023.95.9128754.65.2434.9310.34
N50_R50_ISF0_RSF0.325.325.530356.736.818.3812.88
N50_R50_ISF0_RSF0.622.296.426576.053.926.6511.69
N50_R50_ISF0_RSF0.923.855.7928210.664.2931.4312.51
N50_R50_ISF0.15_RSF0.1527.945.4431750.454.0618.4714.05
N50_R50_ISF0.3_RSF0.329.627.633012.73.343.578.51
N50_R50_ISF0.45_RSF0.4529.335.3832953.144.3341.817.12
Table 8. Flexural tensile strength parameters obtained from three-point notched beam bending tests (3PNBBT) of RCCP specimens at 28 days.
Notched Beam SpecimensCMOD ≤ 0.05 mmCMOD1 = 0.5 mmCMOD2 = 1.5 mmCMOD3 = 2.5 mmCMOD4 = 3.5 mm
f c t , L (MPa)CoV (%) f R , 1 (MPa)CoV (%) f R , 2 (MPa)CoV (%) f R , 3 (MPa)CoV (%) f R , 4 (MPa)CoV (%)
N100_R0_ISF0_RSF04.146.320.039.29------
N100_R0_ISF0.3_RSF04.47.82.2510.841.5317.341.1728.440.5433.27
N100_R0_ISF0.6_RSF05.925.35.187.14.310.813.4412.522.5519.02
N100_R0_ISF0.9_RSF05.875.75.866.565.048.133.279.432.4311.22
N100_R0_ISF0_RSF0.34.298.512.6711.741.3219.660.8333.420.5137.1
N100_R0_ISF0_RSF0.64.727.094.68.863.6213.113.0118.882.5822.84
N100_R0_ISF0_RSF0.95.946.125.686.924.528.793.6511.082.613.52
N100_R0_ISF0.15_RSF0.154.388.552.6212.311.4219.510.9331.610.6238.88
N100_R0_ISF0.3_RSF0.35.914.15.455.374.287.463.5411.192.8413.88
N100_R0_ISF0.45_RSF0.456.255.566.16.515.07.883.279.772.611.53
N50_R50_ISF0_RSF04.048.520.1412.61------
N50_R50_ISF0.3_RSF04.227.782.5910.891.3217.750.8827.690.6137.94
N50_R50_ISF0.6_RSF05.854.625.475.914.038.393.3911.242.4314.84
N50_R50_ISF0.9_RSF05.924.645.715.384.696.913.527.882.459.69
N50_R50_ISF0_RSF0.34.498.12.0710.851.616.551.3425.160.6934.97
N50_R50_ISF0_RSF0.65.027.44.399.623.8114.093.5218.322.2824.73
N50_R50_ISF0_RSF0.95.975.795.57.014.079.323.8311.933.1815.03
N50_R50_ISF0.15_RSF0.154.588.612.4412.571.5119.551.0830.890.7638.55
N50_R50_ISF0.3_RSF0.36.275.85.837.954.739.54.0410.452.8912.23
N50_R50_ISF0.45_RSF0.456.324.955.746.094.757.194.197.773.349.01
Note: CMOD = Crack mouth opening displacement; CMOD1–CMOD4 = CMOD levels 1–4; f c t , L = Limit of proportionality tensile strength; f R , 1 f R , 4 = Residual flexural tensile strengths at CMOD1–CMOD4.
Table 9. Eco-efficiency ranking of RCCP mixtures based on the WSM and TOPSIS.
Eco-Efficiency RankingWSM RankingTOPSIS Ranking
RCCP MixturesScoreRCCP MixturesScore
1N50_R50_ISF0.3_RSF0.30.8N50_R50_ISF0.3_RSF0.30.73
2N50_R50_ISF0.45_RSF0.450.72N50_R50_ISF0.45_RSF0.450.64
3N100_R0_ISF0.45_RSF0.450.66N100_R0_ISF0_RSF0.90.61
4N100_R0_ISF0_RSF0.90.65N50_R50_ISF0_RSF0.90.61
5N50_R50_ISF0_RSF0.90.65N100_R0_ISF0.45_RSF0.450.6
6N100_R0_ISF0.6_RSF00.62N100_R0_ISF0.6_RSF00.59
7N100_R0_ISF0.3_RSF0.30.59N100_R0_ISF0.3_RSF0.30.58
8N50_R50_ISF0.6_RSF00.57N50_R50_ISF0.6_RSF00.56
9N50_R50_ISF0_RSF0.60.54N50_R50_ISF0_RSF0.60.53
10N100_R0_ISF0.9_RSF00.5N100_R0_ISF0.9_RSF00.5
11N100_R0_ISF0_RSF0.60.5N100_R0_ISF0_RSF0.60.5
12N50_R50_ISF0.9_RSF00.49N50_R50_ISF0.9_RSF00.5
13N50_R50_ISF0.15_RSF0.150.47N50_R50_ISF0.15_RSF0.150.48
14N50_R50_ISF0_RSF0.30.47N50_R50_ISF0_RSF0.30.48
15N100_R0_ISF0_RSF00.45N100_R0_ISF0_RSF00.47
16N50_R50_ISF0_RSF00.41N50_R50_ISF0_RSF00.45
17N100_R0_ISF0_RSF0.30.4N100_R0_ISF0_RSF0.30.43
18N100_R0_ISF0.15_RSF0.150.4N100_R0_ISF0.15_RSF0.150.42
19N50_R50_ISF0.3_RSF00.38N50_R50_ISF0.3_RSF00.41
20N100_R0_ISF0.3_RSF00.38N100_R0_ISF0.3_RSF00.4
Note: WSM = Weighted sum method; TOPSIS = Technique for order preference by similarity to ideal solution.
Disclaimer/Publisher’s Note: The statements, opinions and data contained in all publications are solely those of the individual author(s) and contributor(s) and not of MDPI and/or the editor(s). MDPI and/or the editor(s) disclaim responsibility for any injury to people or property resulting from any ideas, methods, instructions or products referred to in the content.