Abstract
The paper presents a comprehensive analysis of cement-based composites incorporating both fine recycled concrete aggregates (fRAs) and recycled concrete powder (RCP), which were used for 3D concrete printing. The study evaluates properties ranging from fresh-state behaviour to hardened properties, durability, and microstructural characteristics. In the final stage, a life cycle assessment (LCA) was conducted. A study found that it is feasible to print a composite containing up to 100% fRA as a replacement for natural river sand. Notably, an increase in fRA content enhances the buildability of the mix, as confirmed by green strength tests. However, the open time of mixes containing fRA and RCP was shortened. Incorporation of RCP and fRA led to a decrease in shrinkage within the first 24 h of hydration. Mechanical studies reported a significant reduction in compressive strength (up to 55%) when RCP and fRA were introduced to the mix. Despite the reduction in mechanical properties in specific configurations, all mixes—including 100% fRA and 10% RCP—exhibited compressive strengths above 30 MPa, demonstrating their potential suitability for use in the construction industry. The durability properties of mixes modified with fRA show that there is a statistically significant reduction in flexural strength after 25 and 50 freeze–thaw cycles. In terms of compressive strength, cast specimens did not exhibit any notable reduction in mechanical performance after freezing and thawing cycles. The LCA results demonstrate the high potential for using fRA and RCP derived from concrete waste in the additive manufacturing industry.
1. Introduction
1.1. General Remarks
The cement and concrete industries are paramount for the fulfilment of the construction sector’s challenges in achieving sustainability while keeping up with the increasing demand for housing and infrastructure caused by population growth and urbanisation. These industries are currently facing the need to mitigate the impacts of raw clinker production and virgin aggregate consumption, while simultaneously reducing the generation of waste associated with their activities [], which is becoming an increasingly relevant problem because of the increase in construction and demolition activities in Europe and worldwide, e.g., in 2021, the EU-27 produced approximately 840 million tonnes of construction and demolition waste (CDW) [], accounting for over 36% of its total waste generation [].
The construction industry is also a major consumer of natural resources, accounting for over half of the mineral resources extracted from the environment []. It results in significant environmental degradation, diminished soil fertility, and increased pollution levels, along with the depletion of mineral reserves. To address these concerns, the EU is shifting to circular economy models in the construction sector and has set ambitious targets for the reuse and recovery of CDW []. Recovering CDW as a secondary raw material for concrete production provides substantial environmental benefits, such as reducing reliance on natural mineral resources and reducing the volume of CDW directed to landfills [].
The CDW composition differs widely across regions due to variations in economic structures, environmental conditions, and construction practices. Despite these differences, most non-soil CDW (typically 70 to 80% of the total mass []) is composed of concrete, unbound stone, ceramics, and other inorganic materials that fit into waste code W121 of the European Waste Catalogue (Mineral C&D waste). These materials can be recovered as recycled aggregates (RAs) for use in concrete []; however, recycled particles can negatively impact concrete properties due to differences in aggregate characteristics. Unlike rounded fine natural aggregates (sands), recycled aggregates are often angular and rough, having a specific surface area up to 400% larger than rounded fine natural aggregates [].
The literature on the use of fRA in concrete presents mixed findings. Some studies have reported that incorporating fRA can adversely affect the compressive and splitting tensile strength of concrete. For instance, Khatib [] observed that concrete mixes containing 100% fRA experienced reductions in compressive strength of 30%. Conversely, another study [] reported that replacement ratios of up to 30% had no significant impact on the compressive strength of concrete. Durability is typically affected by the incorporation of fRA. For instance, Evangelista and de Brito [] found that the chloride migration coefficient increased by 34% with a complete replacement of fine natural aggregates, and resistance to carbonation decreased (110% increase in carbonation depth). These authors [] argue that concrete with fRA is a sustainable alternative to natural aggregate concrete in structures that are not exposed to aggressive environments.
To increase the market adoption of fRA, a shift towards higher-value applications is essential. A suitable alternative is to incorporate fRA in composites meant for the additive manufacturing (AM) of concrete.
Concrete AM can greatly reduce construction time [] and significantly reduces material consumption [], while reducing workmanship and formwork use, driving higher levels of automation and industrialisation in construction []. Combining AM with sustainable construction materials that incorporate CDW provides a powerful strategy that is resource-efficient. Research on this topic is still exploratory, and the results are promising. In recent years, recycled aggregates have increasingly been incorporated into concrete AM applications as substitutes for natural sand and coarse aggregates [,,,,]. However, the direct use of recycled concrete powder in cementitious mixtures has been comparatively less explored.
Previous studies have examined the influence of recycled concrete powder on flow behavior of mortar samples [], leading to further investigations on mechanical properties, workability, and printability of mortars containing up to 30% cement replacement with recycled concrete powder []. These studies indicated that, while recycled concrete powder incorporation reduced flowability, it enhanced early-age strength and structural buildability during the printing process. The improvements were strongly linked to the higher hydration heat observed in the initial hours of curing. Moreover, the significant water absorption capacity of recycled concrete powder, due to rapid saturation upon mixing, contributed to the loss of flowability in printable mixtures []. For instance, Cavalcante et al. [] investigated 3D printable pastes incorporating recycled concrete powder (RCP) as a partial replacement for cement at levels of up to 50%. Their study assessed rheological properties, printability, and life cycle performance. The results showed that the addition of RCP led to as much as a threefold increase in static yield stress, along with elevated dynamic yield stress values. Variations in viscosity were linked to differences in particle packing density. However, the increased yield stress posed potential challenges to both extrudability and buildability. In a recent study, Qian et al. [] investigated the incorporation of RCP and recycled concrete aggregate in 3D printable cementitious composites. Specifically, the addition of 10% RCP increased the yield stress from 1423 Pa to 1573 Pa, while the viscosity was largely maintained. A study conducted by Robayo-Salazar et al. [] explored the potential use of RP (<75 µm) and fRA (<1.18 mm) derived from the production of 3D printable pastes and mortars. Their research demonstrated the feasibility of replacing 30% (by weight) of Portland cement (PC) with recycled powders (<75 µm). Another study [] found that incorporating fRA can be practical for 3D-printed fibre-reinforced mortars. The findings indicated that, when suitable fibres are incorporated in the concrete mix, the 3D-printed mortar incorporating 100% recycled fine aggregates exhibited superior mechanical properties and enhanced deformation capacity compared to their fibre-free counterparts containing 100% natural fine aggregates.
1.2. Significance
Current research on 3D-printed concrete with fRA and RCP is largely limited to evaluating fresh-state properties (e.g., flowability, buildability) and mechanical performance (e.g., compressive and flexural strength) []. Systematic studies investigating the combined use of fRA and RCP in 3D-printable mixes, as well as their effects on mechanical performance, interlayer bond strength, durability, microstructural development, and life cycle assessment (LCA), are still scarce. This highlights a significant research gap and underscores the need for more comprehensive investigations addressing printability, performance, and sustainability of such mixes. Due to specificities (such as different raw materials and compositions, different types of fRA), inferences from different experimental campaigns addressing different topics may not be scientifically sound. To address this issue, this paper:
- Investigates the influence of fRA and recycled concrete powder (RCP) on the printability of 3DPC.
- Analyses the influence of fRA and RCP on several key fresh and hardened state properties of 3DPC.
- Presents a comparative life cycle assessment in which the economic and environmental impacts of the production of 3DPC with and without fRA and RCP are compared.
To the best of the authors’ knowledge, no prior publication has provided such an extensive analysis of the influence of RCP and fRA on the properties of 3DPC.
2. Materials and Methods
2.1. Raw Materials and 3DPC Mix Design
The mix design of 3DPC is presented in Table 1. Mix M0F is exclusively made with primary raw materials and is used as a reference in the analysis of results. Its total binder content is 830 kg/m3 (70% CEM I 42.5R according to EN 197-1 [], 20% fly ash, and 10% silica fume), and the aggregate-to-binder ratio is 1.57. The specific gravities of OPC, FA, and SF, determined using a helium pycnometer, were found to be 3.07 g/cm3, 2.28 g/cm3, and 2.22 g/cm3, respectively. The fine natural aggregate (fNA) used is river sand with a siliceous nature. The effective water/binder ratio is 0.24, and the 3DPC is also composed of a superplasticiser (2.7 kg/m3) and 6 mm glass fibres with an aspect ratio of 40, nominal diameter of 15 µm, and apparent density of 380–480 kg/m3. The other concretes were defined by: (i) replacement of 10% of cement by RCP, aiming at reduction of clinker content (RAC0); (ii) 10% replacement of cement by RCP and 50% replacement of fNA by fRA; (iii) 10% replacement of cement by RCP and full replacement of fNA by fRA.

Table 1.
Concrete mix design.
All replacements of primary raw materials by secondary ones were made by volume, and compensation water was added when fRAs are used to account for their water absorption. Both options were taken to ensure a scientifically fair comparison, since both the water absorbed by the RA and the differences in density between fRA and fNA would reduce the ratio between aggregates and binder (and, in the case of the water absorption, the free water and the w/c ratio).
The fNA has a grading of 0/2 mm and the properties presented in Table 2. This table also presents the properties of the fRA. Both fRA and RCP were produced from the same source of concrete waste: samples of C30/37 specimens, with ages well over 1 year, produced for conformity testing of different production days of ready-mix concrete. This concrete waste is pure, without any contamination with other materials (e.g., ceramics, clay-like fines, wood, glass, and others), therefore representing a scenario in which concrete rejects are collected at their production site specifically for 3D printing. The concrete waste was crushed with a jaw crusher due to its suitability as a primary crusher for CDW []; afterwards, the samples were sieved, and secondary crushing with a hammer mill was carried out for particles above 2 mm. Sieving separated particles between 0 and 0.125 mm (RCP) and particles between 0.125 mm and 2.0 mm (used as fRA). Concerning shape, since the fNA is rolled sand while the RCP is mostly primary crushed with a jaw crusher, the fRA are expected to be more elongated and flakier than the fNA [], as observed in another publication in which the same protocol and equipment were used to crush fRA [] (and in which the fNAs are the same as those of this paper). The nature of the materials also implies that the fRAs are rougher than the fNA [].
Table 2.
Properties of the fine aggregates used. Test data: average of two samples.
As expected, the fRAs used in this research have: (i) worse properties than the fNA (with a water absorption that is 6.85% larger in absolute terms) and lower density (this is relevant since the replacement of fNA by fRA was carried out by volume) and (ii) better properties (lower water absorption and higher density) than the average properties expected from fRA produced from concrete waste []. It is a consequence of these fRAs being produced from well-controlled concrete waste. Particle size distribution of used materials is presented in Figure 1.
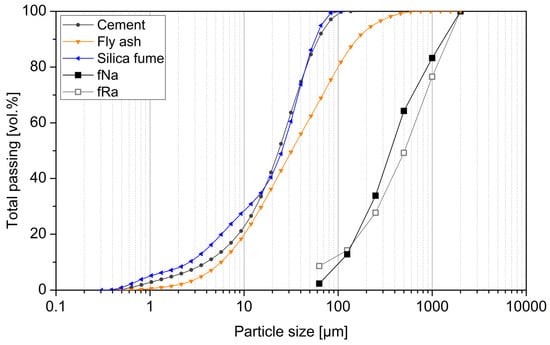
Figure 1.
Particle size distribution of cement, fly ash, silica fume determined using laser diffraction method and aggregates determined using sieve analysis.
2.2. Rheological Tests
In this study, rheological measurements were conducted using an MCR 72 compact rheometer equipped with vane geometry. A ribbed cup with a 120 cm3 capacity was utilised to mitigate wall slip effects. Additionally, the flow table was utilised to determine the workability of prepared mixes.
2.2.1. Static Yield Stress Test
The static yield stress (τs) was determined over 5 min intervals over 20 min after mixing. The peak value (τmax) obtained from the shear stress curve, was used for the analysis. The assessment of static yield stress started five minutes after the completion of the mixing process. First, the samples underwent pre-shearing at a rate of 100 s−1 for 60 s, followed by a rest period of 4 min. A consistent shear rate of 0.1 s−1 was then applied for 60 s, followed by a further resting interval of 4 min. τs was defined as equivalent to τmax, with τs values at each interval recorded to understand the time-dependent rheological behaviour of the samples.
2.2.2. Dynamic Yield Stress Test
A two-stage testing protocol was designed. The first stage involved pre-shearing the material at a fixed shear rate of 100 s−1 for 30 s. After pre-shearing, shear stress measurements were conducted covering a shear rate ( range from 100 s−1 to 5 s−1. The full explanation of the rheology evaluations has already been presented in the authors’ previous studies [].
Regarding the rheological model, since cement-based composites typically exhibit non-Newtonian and pseudoplastic properties, the modified Bingham model (MBM) was chosen (refer to Equation (1)) due to the resulting correlation coefficient (R2) of virtually 1.0 (0.9896).
The values of yield shear stress (τ0) and plastic viscosity (ηp) for each composite were calculated using Equation (1).
2.2.3. Three-Interval Thixotropy Test
The three-interval thixotropy test (3ITT) was used to measure thixotropic recovery. While other calculation methods, such as measuring the hysteresis loop area, have been widely applied in research on cementitious composites, these traditional approaches have limitations. The conventional thixotropic loop method continuously applies shear stress, preventing the undisturbed recovery of the material’s static structure. As a result, the 3ITT method is suggested as a more effective alternative to the standard hysteresis loop area approach for assessing thixotropy [,].
The 3ITT protocol consists of three distinct stages: initially, the fresh cementitious material undergoes a low, constant shear rate (static stage). Subsequently, the sample is subjected to a substantial and constant shear force during the shear stage. Finally, the sample experiences the same low shear force as the first stage (structural recovery stage). To quantify the thixotropic recovery percentage based on 3ITT, Equation (2) was employed.
where: G’recovery is the storage modulus value at the end of the third stage and G’initial represents the storage modulus value at the end of the first stage.
2.3. Adiabatic and Isothermal Calorimetry Tests
2.3.1. Adiabiatic Calorimetry Tests
The concrete mix was prepared using a planetary concrete mixer. It was then placed into an insulated mould and compacted. The specimen was weighed and subsequently placed in the measurement chamber of the calorimeter.
An adiabatic calorimeter (Controls S.p.A., Italy) was used to monitor the temperature rise of the concrete mix during the first 48 h of the hardening process. The measurements were performed on 150 mm cubic specimens following EN 12390-15 []. Four concrete mixes—M0F, RAC0, RAC50, and RAC100—were prepared and tested. All materials were conditioned at an ambient temperature of 20 °C ± 2 °C prior to testing.
Equation (3) was used to measure the cumulative development of heat of hydration based on the test results.
where: qt is the heat release at a time, Ccon is the total heat capacity of the concrete specimen alone, is the intrinsic temperature rise, mcon is the mass of a concrete sample. The total heat capacity of the mix was determined using the specific heat capacity of the mix constituents following the EN 12390-14 [].
Results of heat development were normalised against the mass of cement in the sample using the following Equation (4):
where —value of normalised heat, —total heat, —mass of cement.
2.3.2. Isothermal Calorimetry Tests
All materials used in the experiment were conditioned at a temperature of 20 °C prior to mixing. Calorimetric test mixtures were prepared using these pre-conditioned materials. The dry components were first accurately weighed and homogenised, followed by the addition of water containing a plasticiser. The total batch size for each mixture was 500 g, prepared using a laboratory mixer to ensure uniform consistency.
From each batch, 50 g of the fresh mix was weighed and transferred into calorimeter containers. To ensure proper compaction and eliminate air voids, the samples were subjected to vibration using a vortex vibrating shaker.
The heat of hydration and heat flow were measured using a three-channel isothermal calorimeter (TAM AIR, TA Instruments, New Castle, DE, USA). The system, equipped with dual channels, enabled simultaneous measurement of the sample and a reference sample. The calorimeter software facilitated continuous data acquisition over extended periods, with a thermal accuracy of ±0.02 °C. The calorimetric measurements were conducted for 96 h. The cumulative heat release values were normalised relative to the total mass of each sample [], using the following formula:
2.4. Flow Table
The flow table test was conducted according to EN 1015-3 [] to determine the flowability of the mixes. The test was performed 15 min after water–cement contact.
2.5. Green Strength
The preliminary buildability performance of the mixes was evaluated using an unconfined uniaxial compression test, similar to the method used in [,,]. This test measures the stress–strain relationship of the mix at early ages. The primary outcomes of the test are the maximum green strength and the green Young’s modulus.
The tests were conducted at a constant displacement rate of 15 mm/min and performed either 30 min or 60 min after the water–cement contact. After mixing, specimens were moulded into cylindrical plastic forms measuring 60 mm in diameter and 120 mm in height. After curing until the test age, the specimens were demoulded and placed on the test apparatus.
During the test, the specimen’s deformation was recorded using linear variable differential transformer (LVDT) displacement transducers with an accuracy of 0.01 mm. The transducers were connected to an HBM QuantumX strain gauge bridge (MX840A, HBM, Darmstadt, Germany).
2.6. Early-Age Shrinkage
The effect of RCP and fRA on the total shrinkage development within the first 24 h was examined for all composites. Previous research [] has indicated that this time frame is critical for the deformation of 3D-printed concrete, primarily due to increased water evaporation and the lack of traditional formwork. Shrinkage testing was performed using the shrinkage-cone apparatus manufactured by Schleibinger (Buchbach, Germany). The testing concept and measurement setup are depicted in Figure 2.
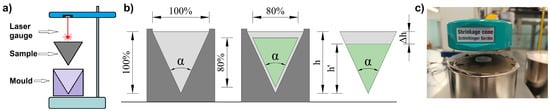
Figure 2.
Early-age shrinkage measuring setup: (a) configuration; (b) sample geometry; (c) sample during test. Reprinted from [].
A steel mould, lined with a friction-reducing foil, was filled with the sample and compacted, with a flat reflective measurement point placed on the upper surface. The distance to the reference point was measured with an accuracy of 2 μm at 5 min intervals. Given the geometry of the sample, the change in height measured by the cone corresponds to the volume change.
The shrinkage measured according to this protocol evaluates the performance of the 3DPC but does not include pumping or printing. It means that the tests do not account for the deformation of the printed element due to the differing surface-to-volume ratios of the sample, nor the tribological and rheological phenomena that occur during pumping and printing. However, it does allow assessing the impact of changes in the binder composition on overall shrinkage.
2.7. Hardened Properties
2.7.1. Strength Development (Cast vs. Printed Samples)
The hardened 3DPC strength properties were tested according to EN 1015-11 [] on both standard and printed samples. The printed samples were extruded through a rectangular nozzle (50 × 8 mm) and consisted of six layers. After 20 h of hardening, they were trimmed into prismatic specimens with dimensions of 40 × 40 × 160 mm. Until cutting, the samples remained covered; afterwards, they were trimmed, labelled, and cured by full immersion in water at 20 °C. The tests were conducted in two orientations: top, where the load was applied vertically to the printing direction, and side, where the sample was loaded horizontally to the printing direction (Figure 3). For flexural and compressive strength testing, 3 and 6 specimens were taken, respectively, with the mean value considered representative.

Figure 3.
Layer orientation in strength tests.
2.7.2. Elastic Modulus
The initial and stabilised elastic moduli of prepared 3DPC were determined in accordance with EN 12390-13 [] on Φ100 × 200 mm samples after 1, 2, and 28 days of curing. Three samples were tested in each set, using a Zwick Toni Technik hydraulic press and a set of three electronic gauges.
2.8. Freeze–Thaw Resistance
Freeze–thaw resistance testing was conducted on both standard samples of 40 × 40 × 160 mm and 3D-printed, multi-layered samples cut to fixed dimensions. The printing conditions and size of the specimens were those presented in Section 2.7. For each mix and sample type (3D-printed or conventionally cast), six specimens were tested as control, along with two test sets in which samples underwent 25 and 50 freeze–thaw cycles, respectively. The testing followed a modified method based on ASTM C666 []. The modified cycles are illustrated in Figure 4.
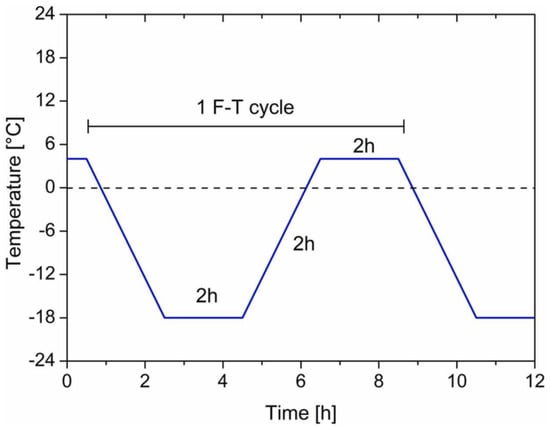
Figure 4.
Freeze–thaw resistance test—scheme [].
2.9. Interlayer Adhesion
The interlayer adhesion was tested by the splitting test method according to European Standard EN 12390-6 []. A similar method was performed in []. The tests were conducted on cubical specimens with edges of 40 ± 5 mm after 1 day of curing. The splitting tensile strength ( [MPa]) was calculated according to the EN 12390-6 [] as shown in Equation (6):
The symbols represent:
—maximum force recorded by an electromechanical press [N];
—the length of the line contact of the specimen [mm];
—the designated cross-sectional dimensions [mm].
2.10. Buildability
Buildability refers to the ability of the printed structure to maintain vertical and lateral stability under the load of subsequent layers []. A 3-degree-of-freedom Cartesian robot equipped with a pump was employed to print the material and check for buildability. The 3DPC was extruded through a screw head at a flow rate of 1.0 litre per minute, and the printing apparatus is the same as described in []. To assess the buildability, a column with a centreline diameter of 150 mm was printed. Each layer had dimensions of 10 mm in height and 30 mm in width, and the printing speed was set to 2500 mm/min. The procedure for printing was similar to the procedure used in [,], with a 15 s interval between consecutive layers, simulating the printing of a structure with a specified perimeter length. The test continued until either structural failure occurred or a maximum of 40 layers was reached. Printing was conducted between 45 and 60 min after water was added to the dry mix ingredients. Following the test, the maximum height of the printed column was recorded.
2.11. X-Ray Micro-Computed Tomography (Micro-CT)
The incorporation of fRA affects the properties of cementitious materials, affecting both their solid and pore characteristics. In this study, the microstructural attributes of representative cast and printed samples, with and without fRA, were analysed using X-ray micro-computed tomography (micro-CT) on specimens with dimensions of 20 × 20 × 20 mm that were scanned using the Waygate Technologies V|tome|xS (Bruker, Portland, OR, USA). The operating voltage of the lamp was 170 kV and the current intensity was 300 μA and, at a magnification of ×10.6, a voxel size of 18.77 um3 was obtained.
Figure 5 illustrates the micro-CT imaging process. The solid and pore structures of the samples were analysed, with an emphasis on key aspects of the pore structure, including porosity, pore size distribution, and pore shape [], due to their influence on material properties. The imaging process involved scanning the prepared specimens to produce a series of 2D images, which were subsequently reconstructed into 3D representations, as shown in Figure 5. These 3D images, saved in 8-bit format, utilised 256 grayscale values (ranging from 0 to 255) to denote the relative density of different regions. To enhance the visualisation of pore features, image segmentation was performed using a modified Otsu method in combination with manual threshold adjustments []. The reconstructed 3D images for each specimen comprised 670 × 670 × 670 voxels, with a pixel size of 2.6 μm. These 3D volume data sets were further divided into layers to facilitate detailed analysis of the pore structures.
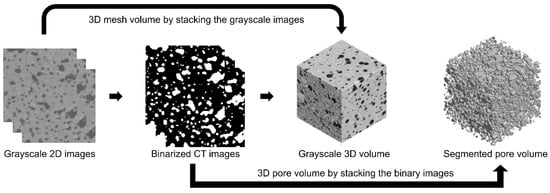
Figure 5.
Micro-CT imaging procedure.
2.12. Environmental and Economic Impact
The impacts of replacing cement with RCP and natural sand with fRA are analysed in three main categories: the content of fRA and RCP, the global warming potential (an indicator of equivalent CO2 emissions to the atmosphere), and the cost of each mix. The content of fRA and RCP is relevant since the primary motivation for the use of recycled aggregates in cementitious materials is the recovery of CDW and the minimisation of the extraction of natural resources []. Global warming potential is assessed since it is a key environmental impact indicator whose reduction is being sought by society, with specific mentions to the construction sector in the European Green Deal [] and clearly defined ambitious targets in the roadmaps of cement associations, including CEMBUREAU [] and the GCCA []. Cost matters since economic considerations have been stated as one of the factors for the low uptake of recycled aggregates by the concrete industry [], as argued in [], where it was found that, for some scenarios concerning a Portuguese case study, the incorporation of recycled aggregates may decrease the GWP of ready-mixed concrete but may not be cost-competitive—this happens because aggregates are bulk materials with low production cost but high transport cost [].
The cost and environmental impacts of the 3DPC were determined through life cycle assessment (LCA), carried out according to EN15804:2012+A2:2019 [], and include all impacts related to the production (information module A1) of raw materials and transport (information module A2) of raw materials to the production site of the 3DPC. The impacts related to the production of the 3DPC itself—transport in the plant, mixing, and other activities (information module A3)—were not included in the LCA due to three reasons:
- The environmental and economic impacts of the production of cementitious materials lie primarily on the production and transport of raw materials, with little impact due to information module 3—the GWP and cost of several concrete mixes presented in scientific publications was determined in [] and the impacts of concrete production are well below 5% of the impact of raw material production and transport.
- The scope of this LCA is to assess the economic and environmental consequences of replacing sand with fRA, and this has no consequence on the impacts of the production of the 3DPC (e.g., fRA use has no relevant consequences on the mixing and ancillary operations carried out at the 3DPC factory).
- Three-dimensional printing is an innovative technology, and it is not yet clear which of the following is the most representative production process: on-site 3DPC production and printing of the structure, pre-cast 3DPC production and printing and on-site assembly, dry-3DPC production, or on-site or at-factory mixing. The impacts related to mixing will differ depending on these conditions, with scarce data available to determine the impacts of each of these hypotheses. The methodology used in this paper ensures a fair comparison of impacts but avoids speculative assessments regarding mixing and printing.
The transport distances and costs of raw materials were determined from reference values representative of the Polish construction sector in 2024 []. To determine the impacts of information module A2, the transport distance of raw materials was determined assuming that the mixes were produced in Szczecin, Poland. Different types of data were used for the GWP of raw materials, based on the availability of information. The types of data were: environmental product declarations (EPDs), the Ecoinvent database [], and peer-reviewed publications. Table 3 presents the inventory of GWP and cost for raw materials, including the respective references.
Table 3.
Inventory of cost and global warming potential per ton of raw material production.
The GWP values of sand and water were determined in LCA software from the Ecoinvent processes [] “Sand 0/2 mm, wet and dry quarry, production mix, at plant, undried RER S (ELCD)” and “Tap Water [RER] market group for|cut-off, U”. The extra water included due to the water absorption of the fRA (see Table 1) was accounted for in the models.
The environmental impact of the production of fRA and RCP was assumed to be the same and equal to the mean impacts of the production of recycled aggregates of several environmental product declarations (EPDs): [,,,,,]. This option is taken to avoid biases caused by specific equipment and processes, since the environmental impact of the production of a recycled aggregate depends on the specific processes and equipment used, and the LCA presented in this paper does not concern a single production method, aiming at wide representativity.
The GWP of transport by ton.km was sourced from the Ecoinvent database [] (“Transport, freight, lorry > 32 metric ton, euro6 [RER]| market for transport, freight, lorry > 32 metric ton, EURO6 | Cut-off” and corresponds to 0.068 kgCO2eq./ton.km), while the transport cost was assumed as the mean cost of road transportation of 20-ton cargo in March 2024 in Europe [] and is 0.082 EUR/ton.km.
3. Results
3.1. Adiabatic and Isothermal Calorimetry
An adiabatic calorimeter was utilised to measure the cumulative heat evolution during the hydration of concrete over time. The specific parameters required for this determination are outlined in Table 4.
Table 4.
Results of adiabatic calorimeter test.
The temperature over time and the normalised specific heat are presented in Figure 6.
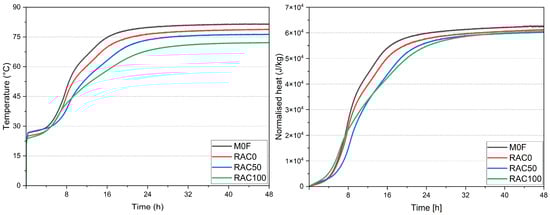
Figure 6.
Results of adiabatic calorimeter test: left—development of temperature, right—normalised heat.
The mixes with fRA and RCP had a lower amount of cement, thus exhibiting a lower overall temperature. Similarly, replacement of fNA with fRA contributed to a further decrease in temperature.
In each of the samples tested, the maximum temperature was reached after about 32 h. As the amount of RCP and fRA in the 3DPC increases, the maximum temperature decreases.
The incorporation of fRA did not significantly influence the normalised heat development in prepared mixes, as seen in Figure 6. The normalised heat flow results (Figure 7) acquired from the isothermal calorimeter have shown a slight delay in peak occurrence and a decrease in its value for mixes with fRA and RCP. It is caused by lower total cement content and the use of additional water in the mixes containing fRA.
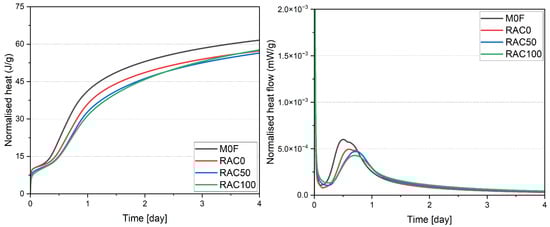
Figure 7.
Results of the isothermal calorimetry test: left—normalised heat, right—normalised heat flow.
3.2. Rheological Properties
Figure 8 illustrates the static yield stress of the mix formulations at 5 min intervals, spanning from 5 min to 20 min of resting time following the completion of the mixing process. The results indicate a gradual increase in shear stress across all mix formulations as the resting time is extended.
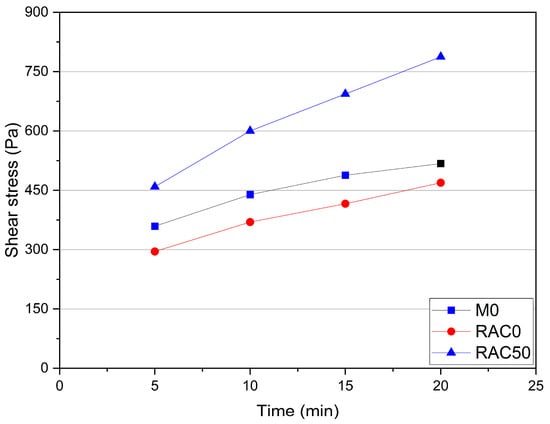
Figure 8.
Static shear stress of mixes (excluding RAC100—description in Section 3.2).
The results indicated that substituting PC with RCP led to a reduction in the static yield stress across all time intervals. This reduction has been reported in other research, which indicated, for example, that the yield stress of a mix containing 10% RCP was reduced by 11.7% compared to the mix containing 100% PC []. Conversely, replacing 50% of natural sand with fRA resulted in an increase in the static yield stress across all recorded time intervals. It is noteworthy that the mix containing 100% fRA, designated as RAC100, due to the required resting time (after pre-shearing) prior to measurement (Section 2.2.1), exhibited excessive stiffness that prevented carrying out the rheological test. The increase in static yield stress observed by incorporating fRA into the mix is consistent with the findings of Zou et al. [], whose research reported that a 3DPC containing 50% fRA exhibited an average increase of 53.2% in static yield stress for every 10 min interval.
The findings (Figure 9 and Table 5) demonstrated that substituting PC with RCP (i.e., RAC0) led to a slight increase in plastic viscosity by 5%, while reducing the yield shear stress by 22% compared to the values registered for the M0F.
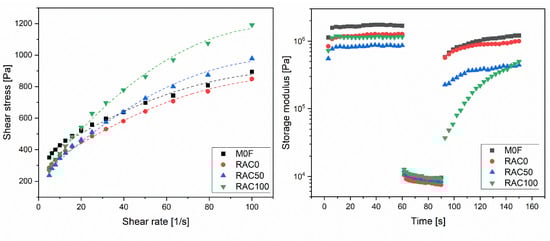
Figure 9.
Rheology measurements of the mix formulations: dynamic shear stress (left) and three-interval thixotropy test (right).
Table 5.
Rheological properties of the mix formulations.
The decrease in yield stress can be attributed to (i) the dilution effect of RCP in the mix formulation and (ii) the particle size of the RCP. Previous studies [,] have indicated that the fine powders in recycled concrete powder primarily comprise low-reactivity crystalline compounds, such as SiO2 and CaCO3, which serve mainly as physical fillers in composite materials owing to their inert nature. These compounds reduce the formation of hydration products and the associated hydration heat in the initial stages, thereby reducing the yield stress. Moreover, the wider particle size distribution of RCP, in comparison to PC particles, also reduces yield stress. These findings are consistent with prior research, which reported an 8% reduction in the fluidity of cementitious paste when 10% of PC was substituted with RCP [].
The plastic viscosity increases due to the irregular surface morphology of the RCP particles (see Figure 9), which enhances the likelihood of interparticle friction and adhesion as the material begins to flow, thereby contributing to an increase in plastic viscosity []. As shown in Table 5, the mix formulation containing 10% RCP (i.e., RAC0) exhibits a slightly higher thixotropic recovery (79%) compared to M0F (72%). This increase can be attributed to the angular shape and porous structure of RCP, which enhances the structural recovery and thus promotes thixotropy.
The results demonstrate that substituting natural sand with fRA follows the same trend as replacing PC with RCP: yield stress decreases and plastic viscosity increases. As presented in Table 5, replacing natural sand with 50% (RAC50) and 100% (RAC100) fRA resulted in reductions in yield shear stress of 20% and 19%, respectively, while the plastic viscosity increased by 36% and 79%, compared to the mix without fRA (RAC0). A remarkable decrease in yield shear stress was observed for RAC50 compared to RAC0. However, incorporating 100% fRA (RAC100) caused a slight increase in yield shear stress, when compared to that of RAC50, although it remained below the values recorded for RAC0 (i.e., 262.8 Pa). This behaviour can be attributed to the timing of the rheology measurements, conducted approximately 15 min after mixing. During this period, the excess water added to offset the high water absorption of fRA was not fully absorbed. Consequently, the increased water content formed a lubricating water film around the main components of the mix, facilitating its initial flow under shear stress. For RAC100, the higher proportion of fRA with high water absorption diminished this lubrication effect, leading to a slight increase in yield shear stress compared to RAC50.
The impact of aggregate replacement on plastic viscosity is more consistent, with a gradual increase observed as the replacement ratio rises from 0% to 100%. The results show that the plastic viscosity increased from 9.6 Pa.s for RAC0 to 13.1 Pa.s for RAC50 and further to 17.2 Pa.s for RAC100. This behaviour can be attributed to the irregular and angular shape of fRA compared to the smooth, rounded shape of natural aggregates. The angular geometry of fRA enhances the interlocking forces between particles, thereby impeding material flow and contributing to higher plastic viscosity. The thixotropic recovery percentage, in contrast, gradually decreased with the inclusion of the fRA. As shown in Table 5, the thixotropic recovery percentage declined from 79% for RAC0 to 51.5% and 43% for RAC50 and RAC100, respectively. It indicates that 3DPCs containing fRA exhibit a weaker and less cohesive matrix, thereby reducing the material’s ability to recover its internal structure after shear. This effect is particularly evident in the case of RAC100 (see Figure 9), where the mix requires more time to reach the maximum structural recovery.
3.3. Flow Table
The results of the flow table spread determination are presented in Figure 10. As shown, all mixes, except RAC100, had the spread flow in the printable range (135–170 mm) [,] at all tested periods. In the case of RAC100, the initial spread exceeded the assumed range due to the additional water used, which was caused by the use of fRA. As seen in Figure 10 a gradual reduction in flow diameter over time can be observed, which reflects the natural increase in viscosity and stiffness of the mixtures as hydration progresses. This trend corresponds to the typical time-dependent loss of workability associated with the ongoing setting of cementitious materials. It is also evident that the use of recycled aggregate reduces mixture flowability—higher replacement levels of natural aggregate consistently result in smaller flow diameters at each measurement stage.
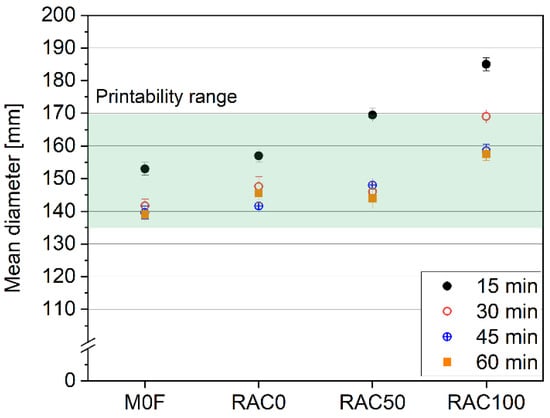
Figure 10.
Results of the flow table test.
3.4. Green Strength
The green strength of evaluated mixes was tested according to the procedure presented in Section 2.5. The example of a failure pattern for a test specimen is presented in Figure 11. It should be noted that the failure pattern observed in most specimens can be classified as a shear failure plane (see Figure 11, left). This type of structural failure aligns with findings reported in the literature [,].
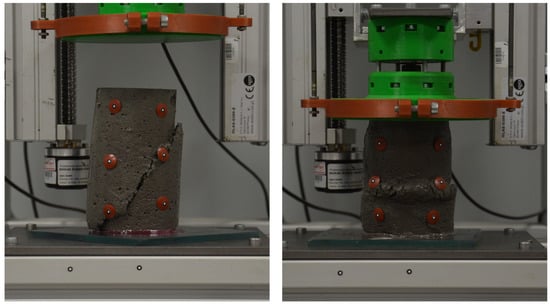
Figure 11.
Examples of failure patterns for tested specimens: left—specimen RAC100 after 60 min, right—specimen 3DRAC50 after 30 min.
The results from the test are collected in Figure 12 and Figure 13. Figure 13 illustrates the maximum stresses () obtained during the uniaxial unconfined compression test. Based on the results, the highest green strength after 30 min from adding water to the dry ingredients was observed in the M0F mix. The results indicated that for this mix is approximately 35% higher than that of the RAC100 mix and 53% higher than the RAC50 mix, which exhibited the poorest performance in the tests. Additionally, M0F has the highest , followed by RAC0 and RAC100, with RAC50 having the lowest .
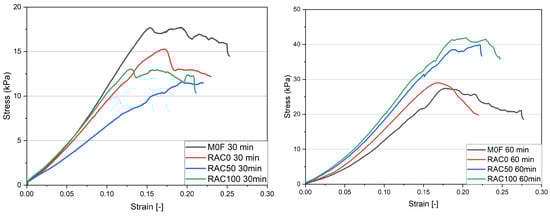
Figure 12.
Stress–strain relationship of specimens: left—after 30 min; right—after 60 min.
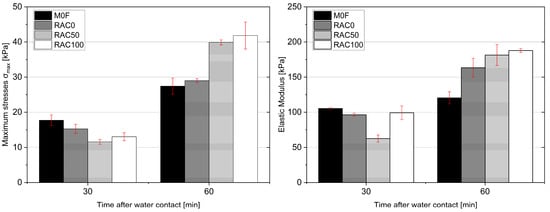
Figure 13.
Maximum stresses (left) and green elastic modulus (right) obtained in the uniaxial unconfined compression test.
The results obtained after 60 min indicated a reversed trend. In this case, the RAC100 and RAC50 mixes demonstrate significantly higher values compared to the M0F and RAC0 mixes. Notably, the RAC100 mix achieves a strength of 41.8 MPa, which is 52.53% higher than that of the M0F mix and 44.23% higher than the RAC0 mix. The difference in strength between the RAC100 and RAC50 mixes is less than 5%. A similar trend is observed for the Young’s modulus results (Figure 13); however, in this case, the pattern is less pronounced compared to .
It should be noted that the M0F, RAC0, and RAC100 mixes tested after 30 min exhibited similar stiffness (based on the plotted curves—Figure 12), although their final strengths differed, as discussed above. For the specimens tested after 60 min, clear differences in stiffness are observed. The specimens with high amounts of recycled aggregate (RAC50 and RAC100) exhibit similar stiffness, which is significantly higher than that of RAC0 and M0F. Notably, after 60 min, the M0F specimens show the lowest stiffness, which is the opposite of the trend observed in the specimens tested after 30 min.
In addition, it is evident that the specimens tested after 60 min exhibit a failure mode more characteristic of brittle solid materials (Figure 12, right—distinct peak), whereas the specimens tested after 30 min display a more plastic response, with no post-peak stress decrease and noticeable deformability. Although both behaviours could correspond to solid and non-solid materials, the 60 min specimens show a more brittle-like response, while the 30 min ones demonstrate plastic deformation typical of more ductile solids.
The observed trend in is primarily attributed to the high content of fRA with significant water absorption in the RAC100 and RAC50 mixes. In the tests conducted after 30 min, the fRA had not yet absorbed enough water to influence the early strength results. Under these conditions, the M0F mix, reinforced with fibres that stiffen the mix, demonstrates the highest strength.
After 60 min, some of the water is absorbed by the fRA, leading to mix stiffening. It directly impacts the results presented in Figure 13, where the RAC100 and RAC50 mixes show improved performance.
3.5. Early-Age Shrinkage
The results for the first 24 h are presented in Figure 14. The partial replacement of cement with RCP reduced the total shrinkage of the 3DPCs, primarily due to the decreased amount of reactive binder. The gradual substitution of natural aggregates with fRA further decreased the shrinkage at 24 h, which can be attributed to the internal curing provided by the water absorbed by the RA during mixing, which is released during hydration and offsets water loss.
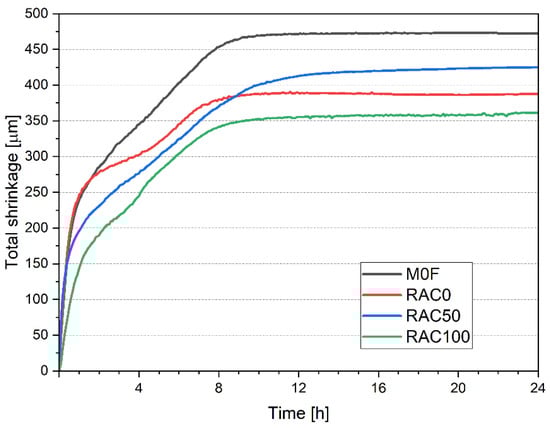
Figure 14.
Total shrinkage development in the first 24 h.
Figure 14 also shows that shrinkage deformations stabilise after 12 h, as confirmed by literature data []. The literature suggests that the incorporation of fRA can reduce early shrinkage. However, the results of this study indicate that this effect is not always straightforward or unidirectional. The partial replacement of natural aggregate led to an earlier flattening of the deformation curve; however, after about 8 h, the shrinkage of RAC50 exceeded that of RAC0. The most likely explanation for this behaviour is the reduced stiffness of the cement matrix, particularly in the early stages of curing, which results in a higher probability of deformation. Additionally, the influence of internal curing can lead to such a development of shrinkage []. Comparing the deformation profile of the reference 3DPC with RAC0 clearly shows that replacing a portion of the binder with a less reactive material (RCP) allowed for a reduction in shrinkage while maintaining satisfactory printing parameters and mechanical strength.
3.6. Strength Development (Cast vs. Printed Samples)
Figure 15 illustrates the flexural strength of the mixes. It was found that the addition of fRA had a slight impact on the mechanical properties of the hardened material. For printed samples, the effect of loading direction after 24 h of curing is negligible, with the maximum difference due to anisotropy being just under 8%. After 48 h, the difference becomes noticeable but remains minimal, with anisotropic effects in the reference 3DPC amounting to 16%. In mixes incorporating fRA, fibre addition reduces the impact of testing direction on strength. No increase in standard deviation was observed as the fRA content increased, suggesting high homogeneity and uniform distribution of the fRA. A 50% incorporation of fRA slightly reduced early flexural strength; however, at 100% replacement, a distinct internal curing effect and a slight strength increase were observed. After 28 days of curing, these trends persisted, though an increase in standard deviation was noted, particularly in reference samples. Anisotropies measured at 28 days were 7%, 1%, and 6%, respectively, which can be considered negligible.
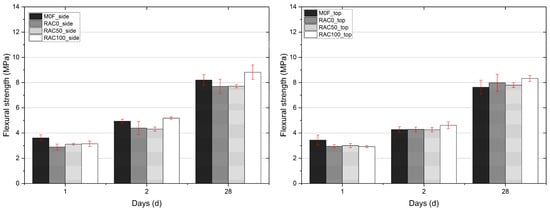
Figure 15.
Flexural strength development tested on printed specimens regarding load direction: left—from side, right—from top.
Figure 16 presents the compressive strength development results for printed specimens. For compressive strength, a clear directional difference is observed for the reference 3DPC. In specimens containing fRA, the addition of glass fibres, which enhance interlayer bonding, reduces these differences, though they remain noticeable. In all tested 3DPCs, printed samples whose compressive loading was parallel to the printing direction showed lower compressive strength than those whose compressive load was perpendicular to the printing direction. For M0F, the compressive strength difference between the parallel and perpendicular loading directions was over 40%, while for 3DPCs made with fRA, the differences were 7% and 21%, respectively. After two days of curing, these differences stabilised across all 3DPCs, ranging from 26% to 15%. After 28 days, the differences were 35%, 8%, and 2%, respectively. It indicates that, as strength developed, the reference sample continued to show substantial anisotropy, albeit with slight changes. In the mixes with fRA, the differences were within the measurement error range.
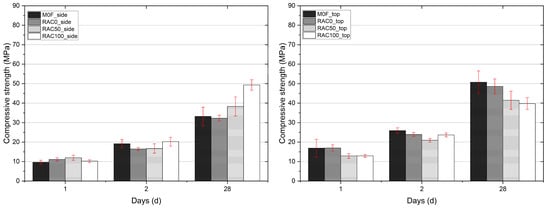
Figure 16.
Compressive strength development tested on printed specimen: left—from side, right—from top.
Figure 17 shows the flexural strength data for loading perpendicular to the printing direction. The incorporation of fRA decreased the flexural strength. The 28-day flexural strength of the RAC100 mix was almost half that of M0F (Figure 17b). The values of the flexural strength of RAC50 were approximately 20% and 25% lower for the specimen loaded from the side and top, respectively.
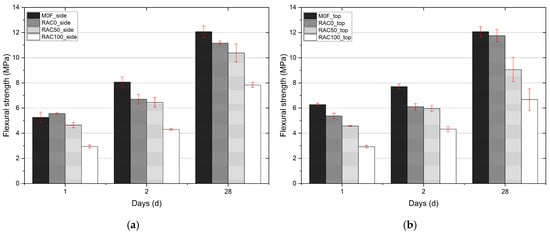
Figure 17.
Flexural strength development tested on cast specimen: (a) from side, (b) from top.
The compressive strength of cast samples (Figure 18) performed from the side decreased significantly as fRA is incorporated, with RAC100 achieving only 45% (1 day), 36% (two days), and 57% (28 days) of the compressive strength of the M0F sample. The respective relative strengths for RAC50 were 67%, 64%, and 92%.
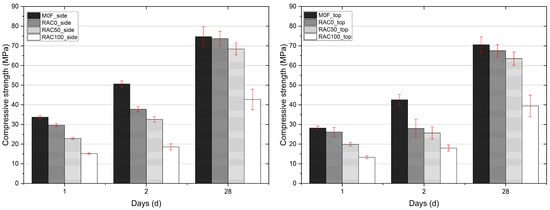
Figure 18.
Compressive strength development tested on cast specimen: left—from side, right—from top.
Similar to the specimen tested from the side, the specimen tested from the top exhibited a negative influence of the content of fRA on the compressive strength. The RAC100 composite achieved 46%, 42%, and 56% of the compressive strength achieved by the reference mix. The RAC50 composite performed better, achieving approximately 71%, 60%, and 90% of the compressive strength exhibited by the reference M0F mix in the respective curing periods. The results are similar, regardless of the direction of testing, proving the absence of anisotropy.
The research shows that the anisotropic nature of printed specimens led to a decrease in mechanical properties (both compressive and flexural strength), which is particularly visible for M0F, RAC0, and RAC50 specimens (the differences are up to 40%). Nevertheless, with increasing recycled aggregate content, the differences between cast and printed specimens decrease. In addition, for RAC100 specimens, the differences are close to the coefficient of variation (CoV). Probably, for printed mixes with recycled aggregates, the high fRA content led to better homogeneity of the printed mix (due to the shape of the aggregate and the distribution curve).
The above-mentioned phenomena show that fRA is a suitable aggregate for 3D concrete printing, as it can reduce the negative impact of the printing process. In addition, it should be noted that there is no coherent research on the anisotropy problem in 3D concrete printing technology. Most research shows a reduction in mechanical properties due to the printing process (i.e., [,]), while other studies report the opposite relationship [,]. The available research does not provide consistent results on this issue when considering worldwide literature.
3.7. Elastic Modulus
Results of the determination of the elastic modulus are presented in Figure 19. Both determinations, for initial and stabilised secant moduli of elasticity, show a clear trend in which the use of a higher amount of fRA decreases the value of this parameter. The more significant decrease in the modulus of elasticity observed for RAC100 can be attributed primarily to the exclusive use of fRA, which generally exhibits inferior mechanical properties compared to natural aggregate. fRAs have higher porosity, lower density, and contain residual composite, all of which contribute to reduced stiffness and overall structural integrity of the composite material.
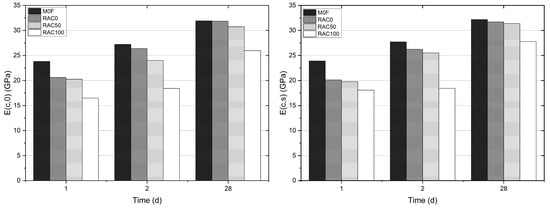
Figure 19.
Results of determination of modulus of elasticity: left—initial modulus, right—stabilised modulus.
In contrast, 3DPC containing a combination of recycled and natural aggregates (RAC50) appears less affected in terms of stiffness. It suggests that even partial inclusion of natural aggregate can mitigate the negative impact of fRA on the rigidity of the cementitious matrix, maintaining a relatively stable modulus of elasticity despite variations in aggregate proportions.
Moreover, RAC100 had the highest amount of additional water introduced to achieve the desired workability (see Table 1). This elevated water content can delay early-age strength development and stiffness gain, further contributing to the observed reduction in the modulus of elasticity during the initial curing period. After 28 days of curing, the results for M0F, RAC0, and RAC50 are almost identical.
3.8. Freeze–Thaw Resistance
Figure 20 presents the residual bending strength results for all samples after the freeze–thaw test, divided into cast and printed specimens. The results indicated that the samples containing fRA showed less variation in flexural strength compared to those with natural sand. This effect is more pronounced in printed samples, where internal curing is critical. The printed samples were sealed only with foil for the first 24 h, whereas the cast samples remained sealed in steel moulds. This technical difference significantly affects the development of the cement matrix microstructure, as the rate of moisture loss differs between the two methods.
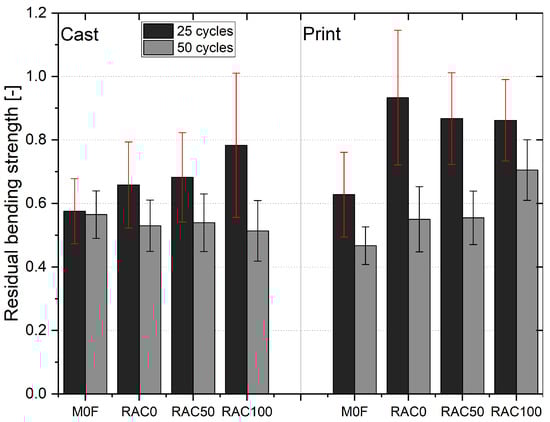
Figure 20.
Residual flexural strength after freeze–thaw test.
The results (Figure 21) show that both cast and 3D-printed concretes maintained their compressive strength after 25 and 50 freeze–thaw cycles. In several cases, the residual values were slightly higher than those of the reference samples, but all results remained within the range of experimental variation. The difference in the variations of results of tested mixes can be explained by the homogeneity of aggregates, where the natural sand tends to have lower difference in the structure and shape of the aggregate than recycled aggregate. These findings indicate that the investigated concretes exhibited high durability under freeze–thaw exposure, with no significant deterioration in compressive performance. Similar behavior has been reported in the literature for 3D-printed concretes and high-performance mortars, where specimens subjected to cyclic freezing and thawing retained their compressive strength, confirming the robustness of well-designed cementitious systems against frost damage [,].
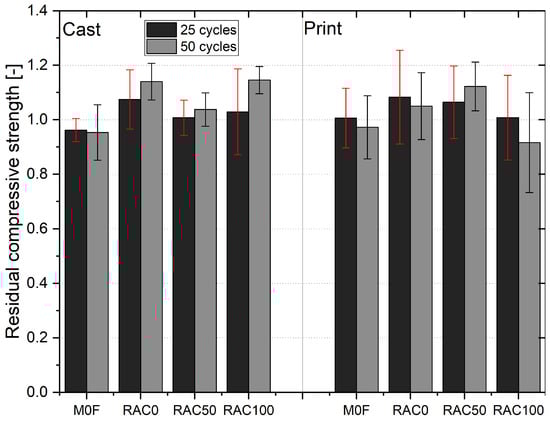
Figure 21.
Residual compressive strength after freeze–thaw test.
3.9. Interlayer Adhesion
The results, presented in Figure 22, indicate that all test data for printed specimens fall within the test scatter, with no discernible effect of incorporating RCP or fRA on this property. These findings agree with those for flexural strength obtained for printed specimens (see Section 3.6).
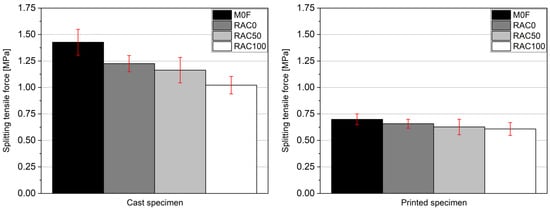
Figure 22.
The comparison of the splitting tensile force for cast (left) and printed (right) specimens.
A decrease in interlayer adhesion with the amount of fRA incorporated was observed for cast specimens. The highest splitting tensile force, 1.43 MPa, was observed in the M0F mix. In contrast, the lowest value was recorded for 3DRAC100, which was 28% lower than that observed for M0F and 17% lower than that observed for RAC0. These results are consistent with the flexural strength measurements for cast specimens under vertical loading (see Figure 17b).
Additionally, for all tested specimens, the results for printed specimens were lower than those for cast specimens. The differences ranged from 40.48% to 51.03%. This disparity indicates that the printing process significantly affects the mechanical properties of the material for this parameter.
3.10. Buildability
Using the methodology outlined in Section 2.10, the buildability of the developed mixes was assessed. This process involved printing each mix in multiple layers and observing the material’s behaviour throughout the printing duration. Figure 23 presents a visual summary of the test outcomes. Furthermore, the compiled test data is presented in Table 6.
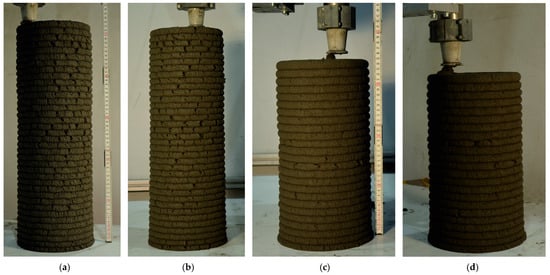
Figure 23.
Buildability test results for mixes: (a) RAC100; (b) RAC50; (c) RAC0; (d) M0F.
Table 6.
Results of the buildability test comparison.
The findings indicated that incorporating a high proportion of fRA into the mixes enhanced buildability. Additionally, these results align with the green strength presented in Section 2.5. A comparison between the green strength data and the buildability test results is illustrated in Figure 24.
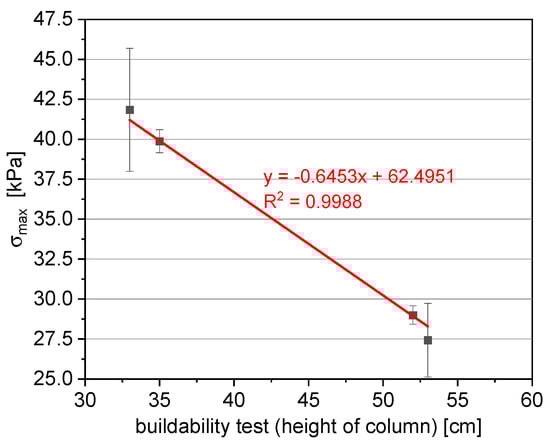
Figure 24.
Comparison between maximum green strength () and buildability test (height of column).
Specifically, the mixes containing fRA (RAC50 and RAC100) successfully withstood the printing process for an average of 52.5 ± 0.5 layers, whereas the mixes M0F and RAC0 collapsed after only 33 and 35 layers, respectively. These findings suggest that using fRA instead of natural aggregate can enhance the buildability properties of the mixes, particularly for those printed 60 min after water contact.
It is worth noting that the comparison between the buildability test and green strength results (as shown in Figure 24) demonstrates a strong correlation between these two tests. This comparison, based on mean values, yields an R2 value close to 1. The results confirm that incorporating fRA can positively impact buildability. The findings align with other research (e.g., []), which also highlights that the use of fRA can positively influence buildability properties. To summarise, the tests demonstrate that it is possible to print slender structures using mixes with fRA, and the load-bearing capacity of these mixes corresponds closely to the green strength results. This observed phenomenon supports the use of these mixes as eco-friendly alternatives for 3D-printed materials.
3.11. X-Ray Micro-Computed Tomography (Micro-CT)
The pore structures of samples containing fRA, both cast and 3D-printed, were analysed using micro-CT imaging, as illustrated in Figure 25. This figure highlights the pore structures of representative samples, focusing on pores larger than the pixel resolution (18.77 μm). In the images, different colours denote pores of varying sizes. For each sample, the left image depicts the overall pore distribution, while the right image isolates relatively large pores (>100 μm). Notably, the M0F series samples exhibit smaller pores compared to the other samples containing fRA. For the RAC series, the cast specimens demonstrate an increase in the proportion of small pores with higher fRA content. In contrast, the printed samples not only show more small pores but also exhibit a higher prevalence of large pore clusters as the fRA content increases.
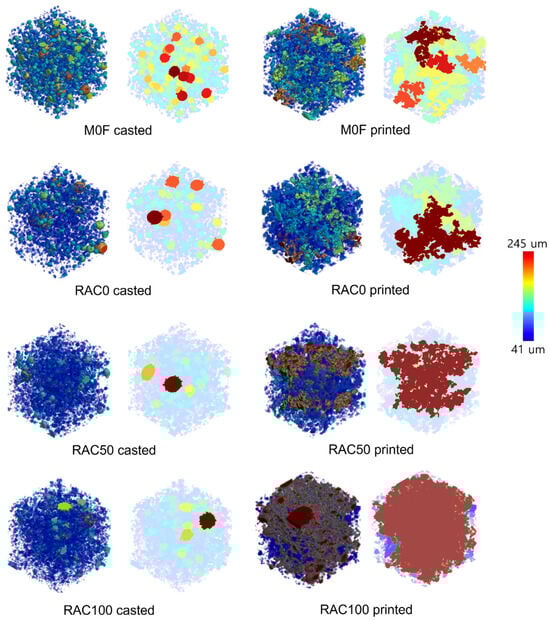
Figure 25.
Visualisation of pore distribution considering the pore sizes (Note: the (left) image is of the overall pore structure, and the (right) image describes relatively large pores.).
Table 7 provides detailed porosity values for each layer of the specimens, revealing that porosity increases with a higher fRA content. Moreover, the cast samples generally exhibit lower porosity than the printed counterparts with the same fRA content. It indicates that fRAs contribute to increased porosity, likely due to substances on their surfaces that create additional space, facilitating pore formation within the samples.
Table 7.
Porosity of each sample.
The porosity comparison between the casted and printed specimens is further described in Figure 26, which presents the local porosity of each sample as a function of specimen height. In this analysis, porosity was measured at eight different heights, providing a detailed comparison of local porosity across the specimens. The results indicate that local porosity varies depending on the specimen type. For the casted specimens, the variation in local porosity is relatively minimal. In contrast, the printed specimens display a distinct variation in porosity with height and exhibit higher overall porosity compared to the casted specimens, even when the RAC proportions remain constant.
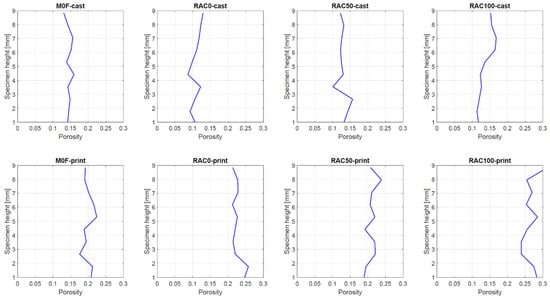
Figure 26.
Local porosity of the specimens according to their height.
The pore characteristics related to pore shape were analysed using 3D pore volume data. Figure 27 illustrates the sphericity values of the specimens. In this study, Wadell’s sphericity was employed to assess the morphology of pores within the samples []. A sphericity value of 1 represents a perfectly spherical pore, while lower values indicate increasing deviation from sphericity, signifying greater anisotropy. The results indicate that specimens incorporating fRA tend to exhibit more anisotropic pores compared to the reference samples (M0F series), particularly in the printed specimens. It suggests that a higher proportion of fRA leads to greater pore anisotropy, with this effect being more pronounced in the printed samples. Such anisotropy in the printed specimens can contribute to a decline in mechanical properties due to the increased likelihood of stress concentration.
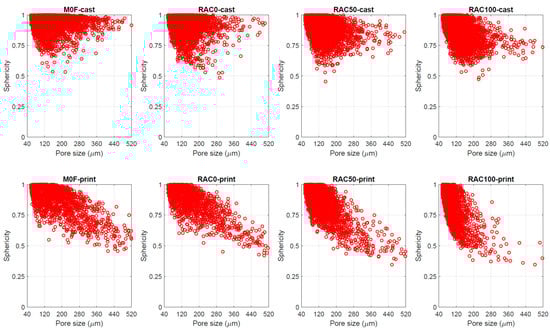
Figure 27.
Sphericity of pores in each specimen.
In addition to analysing pore structures, the overall characteristics of the solid material can be evaluated using micro-CT data. Because the grayscale values in micro-CT images correspond to the relative density of the material’s components, micro-CT data enables a comparative assessment of relative material density. Figure 28 presents the average pixel values of the specimens along their heights. As shown in the figure, the relative solid density is consistently uniform across all specimens, demonstrating the homogeneity of both the cast and printed samples. Notably, the relative density increases as the proportion of fRA rises, suggesting that the fRA utilised in this study possesses a denser solid structure compared to the reference aggregates.
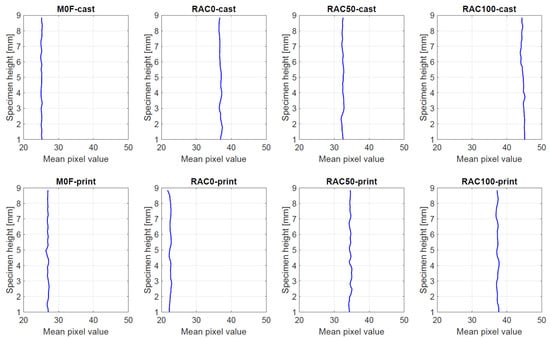
Figure 28.
Relative solid density according to height.
3.12. Environmental and Economic Impact
The transport distances are presented in Table 8. As a starting scenario, the LCA assumes that the recycled materials (RCP and fRA) have a transport distance of 0 km. This option assumes that the CDW plant, which receives the CDW and produces the fRA and RCP, is very close to the location where the 3DPCs are produced. A sensitivity analysis follows, for different scenarios of transport distance, to understand the conditions for the incorporation of fRA to be environmentally favourable and cost-competitive.
Table 8.
Transport distance of the raw materials to the 3DPC production site.
The content of fRA and recycled powder is presented in Table 9. The replacement of cement with RCP dust amounts to a small relative mass of the 3DPC, and its primary motivation is the reduction of GWP, since cement has a significant GWP by tonne (see Table 3). The replacement of sand with fRA results in considerable content of recycled materials, with the 3DPC with complete replacement of sand by fRA having more than half of its weight composed of recycled CDW.
Table 9.
Content of fRA and RCP to the total mass of each 3DPC.
Figure 29 compares the GWP and cost of the 3DPC. The GWP and cost of the 3DPC by m3 are higher than those of a regular-strength concrete—e.g., 275 kg/m3 for a C30/37 concrete in []. This outcome was expected due to the high thixotropy demands of composites for 3D printing, which necessitates a significant powder content and cement content compared to conventional concretes (580 kg/m3 for MOF and 522 kg/m3 for the other composites vs. 350 kg/m3 for the concrete mix presented in []).
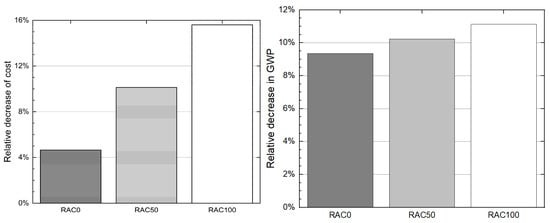
Figure 29.
Relative decrease due to the replacement of cement and sand by RCP and fRA. (Left) cost; (Right) GWP.
About 80% to 85% of the GWP and 95% of the cost of the 3DPCs are associated with the A1 stage (Figure 30). It is primarily attributed to the significant cost and environmental impact of cement production.
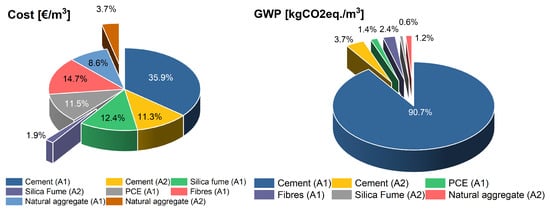
Figure 30.
Percentage of cost and GWP by information module and raw material. Mix M0F. (Left) cost; (Right) GWP.
The replacement of 10% of cement by RCP results in a substantial reduction of GWP, amounting to 9.3%. In contrast, replacing 50% and 100% of natural aggregate with fRA has a marginal influence on the GWP—for instance, combining 10% cement replacement with a 100% aggregate replacement results in a total GWP reduction of 11.1%. These findings underscore the substantial contribution of cement production to the overall GWP of the 3DPCs.
The results for cost are more balanced, where the replacement of 10% of cement by RCP decreases cost by roughly 5%, and each 5% aggregate replacement with fRA corresponds to an additional 5% cost reduction. These cost reductions are partly due to the reduction in transport distance.
Table 10 presents the relative GWP and cost of the M0F, categorised by information module and raw material, complementing the previously discussed analysis. The GWP is dominated by cement, with 91% attributed to its production and an additional 4% to its transport. Similarly, cement accounts for 47% of the total cost, 11% of which is related to transport. Other notable contributors to the cost include fibres, silica fume, and natural aggregate production, each accounting for approximately 10% to 15% of the total cost.
Table 10.
Cost and GWP of the 3DPCs by information module.
The influence of the transport distance of the fRA and RCP on cost is presented in Figure 31. Both fRA and RCP are assumed to be produced in the same CDW plant, resulting in identical transport distances for both materials. The results indicated that incorporating RCP decreases cost, except in scenarios where the recycled materials are sourced from locations over 250 km away. Therefore, due to the proximity of CDW plants to urban centres, under realistic scenarios, it is concluded that the replacement of cement by RCP will decrease the cost of 3DPCs. Similar observations are noted for the replacement of sand with fRA, as the proximity of the CDW plant to the composite production site significantly influences cost reductions. A transport distance of at least 215 km is required for the cost of 3DPCs containing fRA (i.e., RAC50 and RAC100) to surpass that of the 3DPC without fRA but with the same binder content (i.e., RAC0).
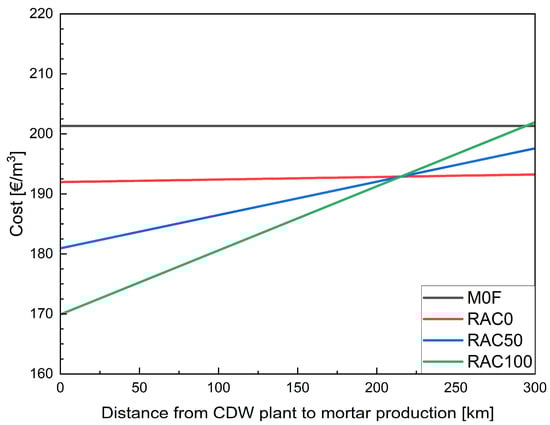
Figure 31.
Influence of the transport distance of the fRA and RCP on the cost of the mixes.
A similar analysis for the GWP of the 3DPCs is presented in Figure 32, confirming trends observed in Figure 20 and Figure 21. Since the replacement of cement with RP has a more substantial impact on GWP than on cost, a transport distance of 650 km is required for mixes with recycled materials to exhibit a higher carbon footprint than the reference mix. In contrast, as the reduction in GWP from the incorporation of RA is smaller than the corresponding cost reduction, the transport distance at which replacing sand with fRA increases the GWP of the 3DPCs is shorter than that observed for cost (108.5 km compared to 215 km). However, as transport distances exceeding 100 km are uncommon in urban centres, the incorporation of fRA is expected to reduce both the GWP and cost of the mixes.
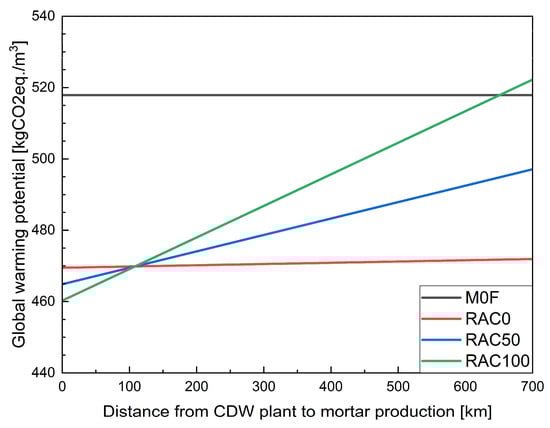
Figure 32.
Influence of the transport distance of the fRA and RP on the GWP of the 3DPCs.
4. Conclusions
Based on the findings, the following conclusions were drawn:
- 1.
- It is feasible to print composites containing up to 100% fRA as a replacement for natural river sand. Notably, an increase in fRA content enhances the buildability of the mix, as confirmed by green strength tests. The results indicate that, due to the high water absorption capacity of fRA, the green strength of the RAC100 and RAC50 mixes significantly increased after 60 min. However, for samples tested within 30 min after water contact, the highest green strength was observed in the mix with a higher cement content (M0F) and in the RAC0 mix (with natural aggregate and reduced cement content). To summarise, the timing after water contact plays a crucial role in green strength development.
- 2.
- The findings show that substituting Portland cement (PC) with recycled powder (RCP), as in the RAC0 mix, led to a slight increase in plastic viscosity, while yield shear stress decreased by 22% compared to the M0F mix. The replacement of natural sand with fRA had a more pronounced effect on rheological behaviour. Replacing 50% and 100% of natural sand with fRA reduced yield shear stress by 20% and 19%, respectively, compared to RAC0. However, RAC100 showed a slight increase in yield shear stress compared to RAC50, likely due to limited lubrication resulting from the higher water absorption of fRA. Thixotropic recovery also declined significantly, from 79% in RAC0 to 51.5% in RAC50 and 43% in RAC100, indicating a reduced ability of the mix to rebuild its internal structure after shear. These results underline the impact of fRA content on both the flowability and structural recovery of the mixes.
- 3.
- The addition of fRA led to a decrease in total shrinkage. This reduction is attributed to the lower binder content in the mixes and the internal curing effect provided by the fRA.
- 4.
- The addition of fRA influences the mechanical properties of the mixes. In terms of compressive strength for printed specimens loaded from the side, the addition of fRA resulted in a slight increase in strength. Conversely, for specimens loaded from the top, as well as for cast specimens, a significant reduction in compressive strength was observed—up to 55% for RAC100. This decline is primarily associated with increased porosity, as confirmed by microstructural analysis.
- 5.
- Anisotropy in 3D-printed samples was found to be minimal in flexural strength, with differences generally below 16% and negligible after 28 days. In compressive strength, the reference mix showed strong directional dependence (>40%), while mixes with fRA and fibres significantly reduced these differences to within experimental variability. Overall, the inclusion of fRA and fibres improves interlayer bonding and limits anisotropy, resulting in more uniform mechanical performance.
- 6.
- In line with the aforementioned findings, microstructural analysis revealed that porosity increases with the addition of fRA, progressing from RAC0 to RAC100. Interestingly, in cast specimens, the M0F mix (without fRA) exhibited the highest porosity. For printed specimens, the M0F mix also showed slightly higher porosity than RAC0 and RAC50.
- 7.
- The durability properties of mixes modified with fRA show that there is a statistically significant reduction in flexural strength after 25 and 50 freeze–thaw cycles. In terms of compressive strength, cast specimens did not exhibit any notable reduction in durability. For printed specimens, a reduction in compressive strength was observed only after 50 cycles, and only in the RAC100 and M0F mixes. However, this reduction is minimal and falls within the coefficient of variation of the results.
- 8.
- The replacement of cement by RCP makes a significant contribution to reducing GWP, whereas replacing sand with fRA leads to a greater cost decrease for short transport distances (e.g., up to 50 km). As the transport distance of the fRA and RCP increases, the increase in the cost of the 3DPC with fRA is more relevant than the increase in their GWP.
- 9.
- To sum up, the research proves that the addition of fRA as a replacement for natural aggregate can be beneficial for 3D printing, particularly when the printing process is carried out approximately 45 min after water contact.
Author Contributions
Conceptualisation, P.S.; methodology, P.S., M.H., M.C., S.S. and J.N.P.; software, M.H. and D.G.; validation, P.S., K.F., S.S., M.T., J.N.P., M.C., M.H. and A.L.-S.; formal analysis, P.S., K.F., S.S., M.T., J.N.P., M.C., G.L., D.G., K.C., D.S., J.B., M.H., B.B. and A.L.-S.; investigation, P.S., K.F., S.S., M.T., J.N.P., M.C., D.G., K.C., D.S., J.B., M.H., B.B. and A.L.-S.; resources, P.S.; data curation, P.S. and M.H.; writing—original draft preparation, P.S., K.F., S.S., M.T., J.N.P., M.C. and M.H.; writing—review and editing, P.S., K.F., S.S., M.T., J.N.P., M.C., G.L., M.H. and A.L.-S.; visualisation, P.S., K.F., S.S., M.T., J.N.P., M.C. and M.H.; supervision, P.S. and M.H.; project administration, P.S. and J.N.P.; funding acquisition, P.S. and J.N.P. All authors have read and agreed to the published version of the manuscript.
Funding
This research was funded in part by the National Centre for Research and Development (NCBR), Poland, within Project no. ERA-MIN3/140/Recycl3D/2022 (ERA-NET Cofund ERA-MIN3 (Joint Call 2021)). The support of FCT through project UIDB/04625/2020 of the CERIS research centre (DOI: 10.54499/UIDB/04625/2020) and the Portuguese Recovery and Resilience Plan, through the Project Interface funding (01/C05-i02/2022.P264), is gratefully acknowledged, along with the funding from FCT for the RECYCL3D project (ERA-MIN3/0001/2021).
Data Availability Statement
The data that support the findings of this study are available from the corresponding author upon reasonable request.
Conflicts of Interest
Author Aleksandra Ludwiczak-Sarzała is employed by the Betotest Poland Construction and Road Laboratory Ltd. The remaining authors declare that the research was conducted in the absence of any commercial or financial relationships that could be construed as a potential conflict of interest.
References
- Omrane, M.; Rabehi, M. Effect of Natural Pozzolan and Recycled Concrete Aggregates on Thermal and Physico-Mechanical Characteristics of Self-Compacting Concrete. Constr. Build. Mater. 2020, 247, 118576. [Google Scholar] [CrossRef]
- Wu, H.; Zuo, J.; Zillante, G.; Wang, J.; Yuan, H. Status Quo and Future Directions of Construction and Demolition Waste Research: A Critical Review. J. Clean. Prod. 2019, 240, 118163. [Google Scholar] [CrossRef]
- Pacheco, J.; De, B.J.; Lamperti, T.M. Use of Recycled Aggregates in Concrete: Opportunities for Upscaling in Europe. Available online: https://publications.jrc.ec.europa.eu/repository/handle/JRC131294 (accessed on 20 August 2025).
- Ajayi, S.O.; Oyedele, L.O.; Akinade, O.O.; Bilal, M.; Owolabi, H.A.; Alaka, H.A.; Kadiri, K.O. Reducing Waste to Landfill: A Need for Cultural Change in the UK Construction Industry. J. Build. Eng. 2016, 5, 185–193. [Google Scholar] [CrossRef]
- European Commission. A New Circular Economy Action Plan. For a Cleaner and More Competitive Europe 2020. Available online: https://eur-lex.europa.eu/legal-content/EN/TXT/?uri=celex:52020DC0098 (accessed on 5 June 2025).
- Skibicki, S.; Federowicz, K.; Hoffmann, M.; Chougan, M.; Sibera, D.; Cendrowski, K.; Techman, M.; Pacheco, J.N.; Liard, M.; Sikora, P. Potential of Reusing 3D Printed Concrete (3DPC) Fine Recycled Aggregates as a Strategy towards Decreasing Cement Content in 3DPC. Materials 2024, 17, 2580. [Google Scholar] [CrossRef] [PubMed]
- Bernardo, M.; Gomes, M.C.; de Brito, J. Demolition Waste Generation for Development of a Regional Management Chain Model. Waste Manag. 2016, 49, 156–169. [Google Scholar] [CrossRef]
- Singh, A.; Miao, X.; Zhou, X.; Deng, Q.; Li, J.; Zou, S.; Duan, Z. Use of Recycled Fine Aggregates and Recycled Powders in Sustainable Recycled Concrete. J. Build. Eng. 2023, 77, 107370. [Google Scholar] [CrossRef]
- Khatib, J.M. Properties of Concrete Incorporating Fine Recycled Aggregate. Cem. Concr. Res. 2005, 35, 763–769. [Google Scholar] [CrossRef]
- Evangelista, L.; de Brito, J. Mechanical Behaviour of Concrete Made with Fine Recycled Concrete Aggregates. Cem. Concr. Compos. 2007, 29, 397–401. [Google Scholar] [CrossRef]
- Evangelista, L.; de Brito, J. Durability Performance of Concrete Made with Fine Recycled Concrete Aggregates. Cem. Concr. Compos. 2010, 32, 9–14. [Google Scholar] [CrossRef]
- Batikha, M.; Jotangia, R.; Baaj, M.Y.; Mousleh, I. 3D Concrete Printing for Sustainable and Economical Construction: A Comparative Study. Autom. Constr. 2022, 134, 104087. [Google Scholar] [CrossRef]
- Venugopal Reddy, P.; Nakkeeran, G.; Roy, D.; Alaneme, G.U. Evaluating the Use of Recycled Fine Aggregates in 3D Printing: A Systematic Review. Discov. Appl. Sci. 2024, 6, 630. [Google Scholar] [CrossRef]
- Wu, P.; Wang, J.; Wang, X. A Critical Review of the Use of 3-D Printing in the Construction Industry. Autom. Constr. 2016, 68, 21–31. [Google Scholar] [CrossRef]
- Aquino Rocha, J.H.; Toledo Filho, R.D. The Utilization of Recycled Concrete Powder as Supplementary Cementitious Material in Cement-Based Materials: A Systematic Literature Review. J. Build. Eng. 2023, 76, 107319. [Google Scholar] [CrossRef]
- Ding, T.; Xiao, J.; Zou, S.; Wang, Y. Hardened Properties of Layered 3D Printed Concrete with Recycled Sand. Cem. Concr. Compos. 2020, 113, 103724. [Google Scholar] [CrossRef]
- Xiao, J.; Zou, S.; Yu, Y.; Wang, Y.; Ding, T.; Zhu, Y.; Yu, J.; Li, S.; Duan, Z.; Wu, Y.; et al. 3D Recycled Mortar Printing: System Development, Process Design, Material Properties and on-Site Printing. J. Build. Eng. 2020, 32, 101779. [Google Scholar] [CrossRef]
- Wu, Y.; Liu, C.; Liu, H.; Zhang, Z.; He, C.; Liu, S.; Zhang, R.; Wang, Y.; Bai, G. Study on the Rheology and Buildability of 3D Printed Concrete with Recycled Coarse Aggregates. J. Build. Eng. 2021, 42, 103030. [Google Scholar] [CrossRef]
- Rahul, A.V.; Mohan, M.K.; De Schutter, G.; Van Tittelboom, K. 3D Printable Concrete with Natural and Recycled Coarse Aggregates: Rheological, Mechanical and Shrinkage Behaviour. Cem. Concr. Compos. 2022, 125, 104311. [Google Scholar] [CrossRef]
- Duan, Z.; Hou, S.; Xiao, J.; Singh, A. Rheological Properties of Mortar Containing Recycled Powders from Construction and Demolition Wastes. Constr. Build. Mater. 2020, 237, 117622. [Google Scholar] [CrossRef]
- Hou, S.; Xiao, J.; Duan, Z.; Ma, G. Fresh Properties of 3D Printed Mortar with Recycled Powder. Constr. Build. Mater. 2021, 309, 125186. [Google Scholar] [CrossRef]
- Zhang, H.; Xiao, J.; Duan, Z.; Zou, S.; Xia, B. Effects of Printing Paths and Recycled Fines on Drying Shrinkage of 3D Printed Mortar. Constr. Build. Mater. 2022, 342, 128007. [Google Scholar] [CrossRef]
- Cavalcante, T.C.; Filho, R.D.T.; Reales, O.A.M. Rheological and Environmental Implications of Recycled Concrete Powder as Filler in Concrete 3D Printing. Buildings 2025, 15, 1280. [Google Scholar] [CrossRef]
- Qian, H.; Hua, S.; Yue, H.; Feng, G.; Qian, L.; Jiang, W.; Zhang, L. Utilization of Recycled Construction Powder in 3D Concrete Printable Materials through Particle Packing Optimization. J. Build. Eng. 2022, 61, 105236. [Google Scholar] [CrossRef]
- Robayo–Salazar, R.; Vargas, A.; Martínez, F.; Mejía de Gutiérrez, R. Utilization of Powders and Fine Aggregates from the Recycling of Construction and Demolition Waste in the 3D Printing of Portland-Based Cementitious Materials. Clean. Mater. 2024, 11, 100234. [Google Scholar] [CrossRef]
- Xiao, J.; Zou, S.; Ding, T.; Duan, Z.; Liu, Q. Fiber-Reinforced Mortar with 100% Recycled Fine Aggregates: A Cleaner Perspective on 3D Printing. J. Clean. Prod. 2021, 319, 128720. [Google Scholar] [CrossRef]
- EN 197-1:2011; Cement—Part 1: Composition, Specifications and Conformity Criteria for Common Cements. iTeh, Inc.: Newark, DE, USA, 2011.
- Marmash, B.; Elliott, K. The Properties of Recycled Precast Concrete Hollow Core Slabs for Use as Replacement Aggregate in Concrete. In Waste Management Series; Woolley, G.R., Goumans, J.J.J.M., Wainwright, P.J., Eds.; Waste Materials in Construction Wascon 2000; Elsevier: Amsterdam, The Netherlands, 2000; Volume 1, pp. 769–781. [Google Scholar]
- Pacheco, J.; de Brito, J. Recycled Aggregates Produced from Construction and Demolition Waste for Structural Concrete: Constituents, Properties and Production. Materials 2021, 14, 5748. [Google Scholar] [CrossRef]
- Nedeljković, M.; Visser, J.; Šavija, B.; Valcke, S.; Schlangen, E. Use of Fine Recycled Concrete Aggregates in Concrete: A Critical Review. J. Build. Eng. 2021, 38, 102196. [Google Scholar] [CrossRef]
- Chougan, M.; Marotta, E.; Lamastra, F.R.; Vivio, F.; Montesperelli, G.; Ianniruberto, U.; Bianco, A. A Systematic Study on EN-998-2 Premixed Mortars Modified with Graphene-Based Materials. Constr. Build. Mater. 2019, 227, 116701. [Google Scholar] [CrossRef]
- Peng, Y.; Unluer, C. Advances in Rheological Measurement and Characterization of Fresh Cement Pastes. Powder Technol. 2023, 429, 118903. [Google Scholar] [CrossRef]
- Peng, Y.; Unluer, C. Evaluation of Rheo-Viscoelasticity of Magnesium-Silicate-Hydrate Mixes Incorporating Different Superplasticizers. Dev. Built Environ. 2024, 20, 100544. [Google Scholar] [CrossRef]
- EN 12390-15:2019; Testing Hardened Concrete—Part 15: Adiabatic Method for the Determination of Heat Released by Concrete During Its Hardening Process. iTeh, Inc.: Newark, DE, USA, 2019.
- EN 12390-14:2018; Testing Hardened Concrete—Part 14: Semi-Adiabatic Method for the Determination of Heat Released by Concrete During Its Hardening Process. iTeh, Inc.: Newark, DE, USA, 2018.
- EN 196-11:2018; Methods of Testing Cement—Part 11: Heat of Hydration—Isothermal Conduction Calorimetry Method. iTeh, Inc.: Newark, DE, USA, 2018.
- EN 1015-3:1999/A2:2006; Methods of Test for Mortar for Masonry—Part 3: Determination of Consistence of Fresh Mortar (by Flow Table). iTeh, Inc.: Newark, DE, USA, 2006.
- Perrot, A.; Rangeard, D.; Pierre, A. Structural Built-up of Cement-Based Materials Used for 3D-Printing Extrusion Techniques. Mater. Struct. 2016, 49, 1213–1220. [Google Scholar] [CrossRef]
- Wolfs, R.J.M.; Bos, F.P.; Salet, T.A.M. Hardened Properties of 3D Printed Concrete: The Influence of Process Parameters on Interlayer Adhesion. Cem. Concr. Res. 2019, 119, 132–140. [Google Scholar] [CrossRef]
- Federowicz, K.; Cendrowski, K.; Sikora, P. Low-Carbon Cementitious Composite Incorporated with Biochar and Recycled Fines Suitable for 3D Printing Applications: Hydration, Shrinkage and Early-Age Performance. Frat. Integrita. Strutr. 2025, 19, 91–107. [Google Scholar] [CrossRef]
- EN 1015-11:1999/A1:2006; Methods of Test for Mortar for Masonry—Part 11: Determination of Flexural and Compressive Strength of Hardened Mortar. iTeh, Inc.: Newark, DE, USA, 2006.
- EN 12390-13:2013; Testing Hardened Concrete—Part 13: Determination of Secant Modulus of Elasticity in Compression. iTeh, Inc.: Newark, DE, USA, 2013.
- ASTM C666-97; Standard Test Method for Resistance of Concrete to Rapid Freezing and Thawing. ASTM International: West Conshohocken, PA, USA, 2017.
- Sikora, P.; Techman, M.; Federowicz, K.; El-Khayatt, A.M.; Saudi, H.A.; Abd Elrahman, M.; Hoffmann, M.; Stephan, D.; Chung, S.-Y. Insight into the Microstructural and Durability Characteristics of 3D Printed Concrete: Cast versus Printed Specimens. Case Stud. Constr. Mater. 2022, 17, e01320. [Google Scholar] [CrossRef]
- EN 12390-6:2009; Testing Hardened Concrete—Part 6: Tensile Splitting Strength of Test Specimens. iTeh, Inc.: Newark, DE, USA, 2009.
- ISO/ASTM 52939:2023; Additive Manufacturing for Construction—Qualification Principles—Structural and Infrastructure Elements. ISO: London, UK, 2023.
- Chougan, M.; Skibicki, S.; Al-Noaimat, Y.A.; Federowicz, K.; Hoffmann, M.; Sibera, D.; Cendrowski, K.; Techman, M.; Nuno Pacheco, J.; Ghaffar, S.H.; et al. Comparative Analysis of Ternary Blended Cement with Clay and Engineering Brick Aggregate for High-Performance 3D Printing. Dev. Built Environ. 2024, 20, 100529. [Google Scholar] [CrossRef]
- Chotard, T.J.; Boncoeur-Martel, M.P.; Smith, A.; Dupuy, J.P.; Gault, C. Application of X-Ray Computed Tomography to Characterise the Early Hydration of Calcium Aluminate Cement. Cem. Concr. Compos. 2003, 25, 145–152. [Google Scholar] [CrossRef]
- Otsu, N. A Threshold Selection Method from Gray-Level Histograms. IEEE Trans. Syst. Man Cybern. 1979, 9, 62–66. [Google Scholar] [CrossRef]
- European Commission. The European Green Deal 2019. Available online: https://commission.europa.eu/strategy-and-policy/priorities-2019-2024/european-green-deal_en (accessed on 5 June 2025).
- Cembureau. The European Cement Association Cementing the European Green Deal, Reaching Climate Neutrality Along the Cement and Concrete Value Chain by 2050. 2020. Available online: https://cembureau.eu/media/kuxd32gi/cembureau-2050-roadmap_final-version_web.pdf (accessed on 5 June 2025).
- GCCA. Concrete Future: The GCCA 2050 Cement and Concrete Industry Roadmap for Net Zero Concrete. Global Cement and Concrete Association. Available online: https://gccassociation.org/concretefuture/ (accessed on 5 June 2025).
- Dias, A.B.; Pacheco, J.N.; Silvestre, J.D.; Martins, I.M.; de Brito, J. Environmental and Economic Life Cycle Assessment of Recycled Coarse Aggregates: A Portuguese Case Study. Materials 2021, 14, 5452. [Google Scholar] [CrossRef]
- Ioannidou, D.; Meylan, G.; Sonnemann, G.; Habert, G. Is Gravel Becoming Scarce? Evaluating the Local Criticality of Construction Aggregates. Resour. Conserv. Recycl. 2017, 126, 25–33. [Google Scholar] [CrossRef]
- EN 15804:2012+A2:2019; Sustainability of Construction Works—Environmental Product Declarations—Core Rules for the Product Category of Construction Products. iTeh, Inc.: Newark, DE, USA, 2009.
- Braga, A.M.; Silvestre, J.D.; de Brito, J. Compared Environmental and Economic Impact from Cradle to Gate of Concrete with Natural and Recycled Coarse Aggregates. J. Clean. Prod. 2017, 162, 529–543. [Google Scholar] [CrossRef]
- Bistyp. Informative Price List of Building Materials. Estimated Labor and Equipment Rental Rates. 3rd Quarter of the Year 2023; Bistyp: Warsaw, Poland, 2023. [Google Scholar]
- Swiss Centre for Life Cycle Inventories. Ecoinvent LCA Database v3.8; Swiss Centre for Life Cycle Inventories: Zurich, Switzerland, 2023. [Google Scholar]
- CEMBUREAU. Environmental Product Declaration (EPD) According to EN 15804 and ISO 14025: Portland Cement (CEM I) Produced in Europe; CEMBUREAU: Brussels, Belgium, 2020. [Google Scholar]
- Teixeira, E.R.; Mateus, R.; Camões, A.F.; Bragança, L.; Branco, F.G. Comparative Environmental Life-Cycle Analysis of Concretes Using Biomass and Coal Fly Ashes as Partial Cement Replacement Material. J. Clean. Prod. 2016, 112, 2221–2230. [Google Scholar] [CrossRef]
- Hájek, P.; Fiala, C.; Kynčlová, M. Life Cycle Assessments of Concrete Structures—A Step towards Environmental Savings. Struct. Concr. 2011, 12, 13–22. [Google Scholar] [CrossRef]
- Semtrio Sustainability Consulting. Environmental Product Declaration in Accordance with ISO 14025 & EN 15804:2012 + A2:2019, S-P-04127: Polymacro from Polyfibres; EPDTurkey: İstanbul, Türkiye, 2022. [Google Scholar]
- Kurda, R.M.S. Sustainable Development of Cement-Based Materials: Application to Recycled Aggregates Concrete. Ph.D. Thesis, Instituto Superior Técnico, Lisbon, Portugal, 2017. Available online: https://scholar.tecnico.ulisboa.pt/records/4Lg24hlX61779gwlzXYsGF0GI01lA5utvCQw (accessed on 5 June 2025).
- EPDItaly. Environmental Product Declaration in Accordance with ISO 14025 and EN 15804:2012+ A2:2019 for Aggregato Riciclato—CIAT, S.P.A.; EPDItaly: Milano, Italy, 2023. [Google Scholar]
- EPDIAustralasia. Environmental Product Declaration in Accordance with ISO 14025 and EN 15804:2012+ A2:2019 for Recycled Crushed Concrete Aggregates from Green Vision Recycling; EPDIAustralasia: Sydney, Australia, 2022. [Google Scholar]
- GlobalEPD. Declaración Ambiental de Producto: ISO 14025:2010 and EN 15804:2012+ A2:2020 for Áridos Reciclados for Federación de Áridos; GlobalEPD: Madrid, Spain, 2022. [Google Scholar]
- EPD International AB. Environmental Product Declaration in Accordance with ISO 14025 and EN 15804:2012+ A2:2019 for Recycled Aggregate Products from Argent Materials Inc.; EPD International AB: Stockholm, Sweden, 2021. [Google Scholar]
- EPD Ireland. Environmental Product Declaration as per ISO 14025 and EN 15804 + A1: Recycled Aggregates from Greenstone Recycling. IMS Site Services Ltd; EPD Ireland: Dublin, Ireland, 2020. [Google Scholar]
- SÜGB. Environmental Product Declaration According to ISO 14025 and EN 15804: Average EPD for Aggregates. Owner of the Declaration: Association of the Swiss Aggregate and Concrete Industry (ASAC); SÜGB: Bern, Switzerland, 2018. [Google Scholar]
- Della. Della—Truck Transport 2024. Available online: https://della.eu/ (accessed on 5 June 2025).
- Deng, X.; Li, J.; Lu, Z.; Zhang, J.; Luo, K.; Niu, Y.; Hu, J.; He, K. Rheological and Early Hydration of Cementitious Material Containing Recycled Concrete Powders Collected from Recycled Aggregates. Constr. Build. Mater. 2023, 393, 132108. [Google Scholar] [CrossRef]
- Zou, S.; Xiao, J.; Duan, Z.; Ding, T.; Hou, S. On Rheology of Mortar with Recycled Fine Aggregate for 3D Printing. Constr. Build. Mater. 2021, 311, 125312. [Google Scholar] [CrossRef]
- Li, Z.; Bian, Y.; Zhao, J.; Wang, Y.; Yuan, Z. Recycled Concrete Fine Powder (RFP) as Cement Partial Replacement: Influences on the Physical Properties, Hydration Characteristics, and Microstructure of Blended Cement. J. Build. Eng. 2022, 62, 105326. [Google Scholar] [CrossRef]
- Tay, Y.W.D.; Qian, Y.; Tan, M.J. Printability Region for 3D Concrete Printing Using Slump and Slump Flow Test. Compos. Part B: Eng. 2019, 174, 106968. [Google Scholar] [CrossRef]
- Ding, T.; Xiao, J.; Qin, F.; Duan, Z. Mechanical Behavior of 3D Printed Mortar with Recycled Sand at Early Ages. Constr. Build. Mater. 2020, 248, 118654. [Google Scholar] [CrossRef]
- Skibicki, S.; Jakubowska, P.; Kaszyńska, M.; Sibera, D.; Cendrowski, K.; Hoffmann, M. Early-Age Mechanical Properties of 3D-Printed Mortar with Spent Garnet. Materials 2022, 15, 100. [Google Scholar] [CrossRef]
- Federowicz, K.; Kaszyńska, M.; Zieliński, A.; Hoffmann, M. Effect of Curing Methods on Shrinkage Development in 3D-Printed Concrete. Materials 2020, 13, 2590. [Google Scholar] [CrossRef] [PubMed]
- Shakor, P.; Nejadi, S.; Sutjipto, S.; Paul, G.; Gowripalan, N. Effects of Deposition Velocity in the Presence/Absence of E6-Glass Fibre on Extrusion-Based 3D Printed Mortar. Addit. Manuf. 2020, 32, 101069. [Google Scholar] [CrossRef]
- Le, T.T.; Austin, S.A.; Lim, S.; Buswell, R.A.; Law, R.; Gibb, A.G.F.; Thorpe, T. Hardened Properties of High-Performance Printing Concrete. Cem. Concr. Res. 2012, 42, 558–566. [Google Scholar] [CrossRef]
- Paul, S.C.; Tay, Y.W.D.; Panda, B.; Tan, M.J. Fresh and Hardened Properties of 3D Printable Cementitious Materials for Building and Construction. Arch. Civ. Mech. Eng. 2018, 18, 311–319. [Google Scholar] [CrossRef]
- Nerella, V.N.; Mechtcherine, V. Chapter 16—Studying the Printability of Fresh Concrete for Formwork-Free Concrete Onsite 3D Printing Technology (CONPrint3D). In 3D Concrete Printing Technology; Sanjayan, J.G., Nazari, A., Nematollahi, B., Eds.; Butterworth-Heinemann: Oxford, UK, 2019; pp. 333–347. ISBN 978-0-12-815481-6. [Google Scholar]
- Zhang, Y.; Zhang, Y.; Yang, L.; Liu, G.; Chen, Y.; Yu, S.; Du, H. Hardened Properties and Durability of Large-Scale 3D Printed Cement-Based Materials. Mater. Struct. 2021, 54, 45. [Google Scholar] [CrossRef]
- Bradshaw, J.; Si, W.; Khan, M.; McNally, C. Emerging Insights into the Durability of 3D-Printed Concrete: Recent Advances in Mix Design Parameters and Testing. Designs 2025, 9, 85. [Google Scholar] [CrossRef]
- Oh, S.-E.; Kim, J.-S.; Maeng, S.K.; Oh, S.; Chung, S.-Y. Influence of Bacterial Biomineralization Conditions on the Microstructural Characteristics of Cement Mortar. J. Build. Eng. 2024, 91, 109455. [Google Scholar] [CrossRef]
- Kleijer, A.L.; Lasvaux, S.; Citherlet, S.; Viviani, M. Product-Specific Life Cycle Assessment of Ready Mix Concrete: Comparison between a Recycled and an Ordinary Concrete. Resour. Conserv. Recycl. 2017, 122, 210–218. [Google Scholar] [CrossRef]
Disclaimer/Publisher’s Note: The statements, opinions and data contained in all publications are solely those of the individual author(s) and contributor(s) and not of MDPI and/or the editor(s). MDPI and/or the editor(s) disclaim responsibility for any injury to people or property resulting from any ideas, methods, instructions or products referred to in the content. |
© 2025 by the authors. Licensee MDPI, Basel, Switzerland. This article is an open access article distributed under the terms and conditions of the Creative Commons Attribution (CC BY) license (https://creativecommons.org/licenses/by/4.0/).