Abstract
This study examined whether layering spatial partitions and symbolic identity cues can transform underdefined university lounges into supportive social environments. In a within-subjects experiment, 60 architecture students experienced three lounge configurations in random order: (A) baseline, (B) partitions presented via mixed reality (MR), and (C) partitions plus identity cues via MR. After each condition, participants rated perceived territorial characteristics (PTC; spatial comfort, openness, territorial control, and symbolic identity) and sense of community (SOC; need fulfillment, membership, influence, and emotional connection). Repeated-measures ANOVAs with sphericity corrections showed stepwise increases (A < B < C) for territorial outcomes—overall PTC, spatial comfort, territorial control, and symbolic identity (ηp2 ≈ 0.61–0.70, all p < 0.001). Openness remained high but was unchanged across conditions and unrelated to SOC (all p > 0.05). For community outcomes, improvements emerged only in Design C across the total score and all subdimensions (A = B < C; ηp2 ≈ 0.17–0.28; all p ≤ 0.01). MR presence did not differ between B and C (all p > 0.05), indicating that gains in C are attributable to territorial/identity cues rather than immersion. Design-wise correlation analyses revealed positive links between territorial control/symbolic identity and SOC indices (r ≈ 0.45–0.78). The findings support a complementary design framework: permeable partitions make boundaries salient, and symbolic identity cues add shared meaning, modestly strengthening community connection. MR serves as a context-embedded preoccupancy evaluation platform for capturing psychosocial responses to spatial design.
1. Introduction
1.1. Background and Aims
In environmental psychology and architectural studies, research on educational facilities has traditionally focused on formal learning environments, such as classrooms, auditoriums, and laboratories. Scholars have examined how design features—including seating layout, lighting/daylighting, acoustic quality (e.g., noise), visual aesthetics, outdoor space quality, and technological integration—shape academic performance, satisfaction, well-being, collaboration, and institutional engagement [1,2,3,4,5,6,7].
As pedagogical approaches shift toward dynamic, student-centered learning, recognition of the role of informal learning and the social dimensions of school environments has grown [8,9]. Informal campus spaces extend learning outside classrooms by supporting independent study, peer collaboration, and social integration [10,11,12,13]. In higher education, informal social spaces such as libraries, atria, cafés, and lounges are the key venues for interactions across courses and cohorts [12,14]. Student lounges, in particular, function as unstructured social zones. They accommodate study, retreat, conversation, and casual encounters, elevating collaboration and a sense of belonging [15,16]. When thoughtfully designed, such lounges are linked to satisfaction and well-being through academic and social integration [17,18].
However, some campus lounges remain loosely defined or lack clear spatial identities for everyday users [12,19]. Mismatches between location, layout, and function often leave spaces ambiguous and unclaimed. Temple [8] argued that learning spaces shape how students perceive and utilize them. When spaces are poorly defined or misaligned with expectations, they fail to support effective learning outcomes. Such spaces can weaken students’ ownership of and attachment to spaces, even though informal spaces are expected to foster both [16]. As interdisciplinary initiatives blur academic boundaries and loosen department-based ownership, many institutions are moving to communal, flexible models and reconfiguring campus layouts [20]. Space itself helps sustain shared meaning and identity in interdisciplinary communities [21].
Ambiguity in spatial definitions, misalignment of functions, and the shift toward communal layouts underscore the importance of design interventions that promote suitable spatial identities and a sense of community. While such psychosocial design outcomes are well-documented in classrooms, they remain underexplored [22] in informal settings, including student lounges. In these settings, how space is claimed, read, and used becomes central to whether social meaning consolidates. Conceptually, this study draws on environmental psychology, which treats territoriality as the behavioral and psychological processes of claiming, controlling, and personalizing space [23,24,25,26]. This study is also grounded in human geography and environmental sociology, which conceptualize territoriality as a socio-spatial strategy that uses bounded, distinguishable spaces to organize social relations [27,28,29,30,31]. Accordingly, we adopt an integrative perspective: environmental psychology guides the analysis of territorial perceptions, and socio-spatial theories inform how boundaries and symbolic cues are configured and interpreted.
In parallel, we take a spatial-affordance perspective—investigating the relational fit between environment and human action [32,33]—to examine how territorial boundaries and identity markers in lounge layouts shape what people can do. In this view, opportunities to pause, gather, or focus tend to align with appraisals of comfort, boundary legibility, and sense of belonging [34]. Because affordances are discovered through active engagement in context, preserving real-world conditions is essential [35,36]. We also draw on a neuroarchitecture/biometric strand of research that grounds design decisions in measurable evidence, using objective appraisal scales and biometrics [37,38]. Methodologically, this field increasingly adopts mobile or immersive protocols to enhance ecological validity [39,40].
Building on these foundations, we examine two minimal spatial cues in an underdefined student lounge at a South Korean university: semi-open partitions (boundary legibility) and identity cues (symbolic meaning). On South Korean campuses, lounges are increasingly serving as social hubs within intermediate-space strategies. However, a broader mix of users and redistributed space can dilute department-level identity, thereby neglecting the sense of belonging [41,42,43,44,45]. We therefore question whether boundary legibility and symbolic identity can convert an underdefined, obsolete lounge into a recognizable, community-supportive place where students’ cohort affiliation remains salient.
Operationally, we use mixed reality (MR) overlays to (1) integrate dual perceptions (physical affordances plus virtual cues) and (2) place the interventions in situ without altering the built environment. We then examine how territorial appraisals relate to facets of sense of community (SOC), without positing causal mediation. Prior studies have examined virtual reality (VR) classrooms and open-plan commons; however, empirical tests are lacking for MR-delivered territorial cues in underdefined university lounges in conjunction with on-site psychosocial measures. We address this gap by manipulating boundary and symbolic elements and assessing responses in the actual lounge context.
MR is framed as a situated pre-occupancy tool. Users can view the real setting with embedded virtual holograms and interact with these elements [46,47], making MR suitable for testing presence, gestures, and interactions [34]. Prior research shows that extended reality (XR) can elicit immersion and responses to environmental cues [48,49,50,51], linking physical and digital settings in authentic ways [52,53]. In this study, MR enables in-context assessment of territorial perception and SOC while the actual lounge remains unchanged [54,55].
1.2. Perceived Territorial Characteristics
The concept of territoriality encompasses boundaries, control, and shared meaning, and environmental psychology emphasizes the regulation of access and the maintenance of privacy as central mechanisms of territorial functioning [23,25,56]. Human geography and environmental sociology interpret territoriality as a socio-spatial strategy for classifying boundaries, communicating, and institutionalizing collective meanings and identities [27,28,30,31]. We adopt these integrated perspectives to examine how partitions (control/legibility) and identity cues (symbolic meaning) relate to perceived territoriality and social connection in a university lounge environment (see Appendix A Table A1).
Building on these foundations, scholars distinguish between control-oriented marking—partitions or reserved areas that communicate boundaries and ownership—and identity-oriented marking—personalization or symbols that express distinctiveness and belonging [26,57]. This distinction corresponds to the design variables: partitions operationalize control-oriented marking, while symbolic identity cues operationalize identity-oriented marking. Behaviors such as claiming desks, displaying personal or group artifacts, and controlling access to shared resources are associated with psychological ownership [26,57]. Such behaviors coordinate shared use in common areas by clarifying who may use what, when, and how. In doing so, they connect partitions and symbolic identity cues with users’ spatial judgments.
In educational settings, classroom studies have reported that spatial and seating arrangements serve as territorial markers, tied to personalization, perceived control, and the defense of space. For example, central seats are defended more frequently than peripheral seats, and students often use explicit verbal claims (e.g., “this is my seat”) [24,58]. Seating preferences also reflect stronger claims and a greater need to define personal space [59]. Beyond the classroom, studies in residence settings have shown that symbolic personalization—through decoration, furniture arrangement, and displays—reinforces students’ territorial claims and perceived control [60]. More broadly, the organization of space—especially the clarity of boundaries, along with access hierarchies, spatial distance, and circulation patterns—is closely tied to satisfaction and a sense of security among dormitory residents [61]. At the campus outdoor scale, features—such as shade, greenery, seating, and proximity to paths—encourage gathering and interaction, illustrating how spatial design shapes social patterns [62].
Overall, prior research has indicated that when territorial indicators—such as appropriate furniture, lighting, signage, and identity markers—are weak or absent, students struggle to discern purpose and identity, which also hinders the fulfillment of their symbolic roles. However, the systematic examination of territoriality in informal spaces remains limited. The psychosocial dynamics of student lounges, in particular, are underexplored despite their growing importance for interaction, belonging, and cohesion [22,63].
1.3. Sense of Community
SOC is the perception of belonging, mutual importance, and need fulfillment through shared commitment and engagement [62]. McMillan and Chavis [64] identified four interrelated dimensions: (1) membership, indicating belonging, emotional safety, personal investment, and identity markers distinguishing insiders from outsiders; (2) influence, referring to reciprocal influence between members and group norms; (3) need fulfillment, denoting the satisfaction of social and psychological needs when values are shared and participation is rewarding; and (4) shared emotional connection, indicating bonds formed through frequent positive interaction and meaningful shared events, including closure and a shared group history. These dimensions are dynamic and mutually reinforcing, as seen in university teams, where shared needs, boundaries, events, and symbols strengthen cohesion.
SOC has been measured in diverse ways [65,66,67,68,69,70,71]. Building on McMillan and Chavis’s [62] conceptual framework, the Sense of Community Index (SCI) [72] is the most widely used instrument to assess the SOC and has extensive evidence of reliability and validity [63,73,74]. The refined SCI-II [75] aligns with the original conceptual model and has shown reliability and validity across territory-based and online communities, cultures, and school populations [76,77,78,79,80].
In higher education, SOC is studied directly and through related constructs, such as belonging, engagement, and interaction. These constructs overlap in their representation of community experiences. SOC is strongly associated with student persistence [81,82,83], academic success [84,85], psychological well-being [86,87], and overall satisfaction [81,88,89,90]. In relation to SOC, Strayhorn [91] defined belonging as feeling accepted, valued, and connected, and links it to engagement across academic and extracurricular domains. Weak belonging is associated with stress, disengagement, academic dissatisfaction, and a higher risk of dropout [92,93,94,95].
A growing body of research shows that the physical design of informal campus spaces—atria, lounges, student unions, and outdoor areas—affects SOC and related experiences such as belonging, connection, support, and attachment, often by extending academic life and catalyzing spontaneous interaction [15,96,97]. Yet systematic tests of how physical and symbolic attributes in such spaces influence territorial perception and SOC in higher education remain scarce.
In the South Korean higher education context, government-led curricular reforms—such as interdisciplinary and major-free-choice systems—are reshaping the educational landscape [98,99]. These reforms blur traditional departmental boundaries and reconfigure academic identity and affiliation [100], thereby influencing how students cultivate community and identity, particularly with their peers [101]. Against these shifts, a central question emerges: under what design conditions do informal spaces foster a sense of belonging and community cohesion? We therefore assess the effects of territorial and symbolic interventions on students’ SOC, with the aim of supporting resilient academic communities in Korean universities.
1.4. Spatial Perception, Affordances, and Adaptive Evidence-Based Design
In a spatial affordance view, environmental settings specify the actions that are feasible for a particular user [32,36]. These possibilities are revealed through action—through movement and engagement in place—rather than from objects considered in isolation [33,35,102]. Action possibilities are read in relation to one’s bodily capacities and the surrounding context. An individual’s physical body scale imposes some limits, and others are probabilistic, as success varies with motor variability and situational costs [103,104]. Within architecture, spatial transitions modulate behavior and neural responses at passability thresholds [105,106], underscoring the significance of boundary conditions. In shared interiors, designed signifiers make intended actions legible and guide engagement [107]. Within this frame, semi-open partitions and identity cues recalibrate boundary legibility and passability, thereby making patterns of use easier to perceive and coordinate.
A complementary stream of research in neuroarchitecture/biometrics seeks to make the links between spatial configuration and perceptual/affective responses measurable [37,38]. Interior form shapes appraisal—curvilinear rooms are often judged as more pleasant than rectilinear rooms [108]—and openness increases preference and aesthetic ratings [109]. Enclosure and virtual windows affect stress: windowless rooms elicit stronger cortisol reactivity [110]. Geometry manipulations—curvature, protrusion, scale, and proportions—influence emotion, with narrow proportions promoting distress and larger symmetric spaces encouraging positive affect, especially for non-designers [111]. Beyond single features, aesthetic responses cluster into coherence, fascination, and hominess with distinct neural covariation [112].
To strengthen ecological validity, recent studies have shifted from static 2D/3D presentations to immersive or mobile brain/body imaging (MOBI) protocols. This method allows free walking and in-place interaction under real spatial constraints [113,114]. Recent studies integrate mobile electroencephalography (EEG) with immersive virtual reality (VR) to support user-centric design processes and decision-making [115]. Likewise, functional near-infrared spectroscopy (fNIRS) has been applied in fully immersive VR to test the stress-recovery effects of interior wall color, combining cortical measures with anxiety scales [116]. Building on this approach, MR enables pre-occupancy evaluation of physical and psychosocial effects of design by blending experimental control with the actual setting [117].
Practically, pattern-language studies advocate small-group niches with partial privacy and flexibility, along with semi-open boundaries—e.g., half-height walls, clustered seating, and alcoves—so that standard rooms are legible, comfortable, and inviting to return [118]. Pattern-language sources also recommend visible displays of group work and notices to render identity legible without obstructing circulation [118]. Later analyses highlight the same balance: partial privacy with permeable edges helps avoid the downsides of extremes; excessive exposure or enclosure is problematic [119]. Post-occupancy and field evidence report privacy/noise dissatisfaction, as well as reduced face-to-face interaction after open-plan space conversions, reinforcing the benefits of calibrated semi-open configurations [120,121]. The workstation partition height affects perceived privacy and lighting effects in an open-plan layout [122].
From an affordance perspective, semi-open partitions and identity cues are intended to increase perceived boundary clarity and group belonging while maintaining openness in a shared lounge. Section 2 reports how these cues were staged and how perceptual and psychosocial responses were captured via MR without altering the built environment.
1.5. Mixed-Reality Simulation Technology
MR sits between real and virtual environments, with digital content overlaid onto physical space and users interacting with both in real time [46]. Unlike fully immersive virtual reality (VR), MR blends physical and digital elements in situ. It preserves the textures, constraints, and affordances of the real-world setting while permitting targeted manipulations of the environment [123,124]. For architectural and environmental psychology research, this hybrid supports ecological validity, as participants remain in the physical environment. However, it retains experimental control through the precise placement and timing of virtual objects [125,126,127].
For example, Long et al. [66] embedded virtual stimuli in everyday contexts to examine perceptions and behaviors under more naturalistic conditions. Shin et al. [128] reported stronger plausibility illusions in MR than in VR and more balanced emotional responses when physical presence was maintained. These results support the use of MR to study environmental cues and psychosocial variables.
With upgraded devices such as Microsoft HoloLens 2 [129], MR offers wider fields of view and improved ergonomics, alongside integrated sensing—eye and hand tracking, depth, and inertial measurement unit (IMU)—and research-mode application programming interfaces (API) that enable access to these streams for behavioral and cognitive assessment [130,131]. These hardware–software advances facilitate stimulus control—such as alignment, occlusion, and interaction—and the reproducible capture of user responses in real-world settings. In turn, these methodological and technological gains have expanded the use of MR across diverse domains, including design, validation, and evaluation in architecture and construction [132,133], education across various disciplines [134,135,136], and psychosocial/behavioral studies [125,137,138,139].
The effectiveness of MR in investigating spatial relationships and psychosocial responses depends on a sense of presence and immersion. Presence is the subjective sense of “being there” in a mediated environment [140] and remains a core validity benchmark [141,142]. In MR, spatial presence has been described as having two complementary reference settings: an inside-out sense of being in a place and an outside-in sense of being with an object in that place [143]. Immersion refers to system-level fidelity and interactivity—encompassing visual, auditory, and input features—that enable a stronger presence and more realistic cognitive and emotional responses [49,51,144,145].
Presence has been measured using diverse instruments—such as the Presence Questionnaire (PQ) [146], the Igroup Presence Questionnaire (IPQ) [147], the ITC-Sense of Presence Inventory (ITC-SPI) [148], and the Slater–Usoh–Steed (SUS) [149]. Although initially developed for VR, these scales have been widely adapted for MR [143,150]. Reviews have noted inconsistent reporting of psychometrics and frequent use of shortened forms [151,152]. In addition, physiological signals, including electroencephalography (EEG), galvanic skin response (GSR), and electrocardiography (ECG), are used to document concurrent psychological and physiological effects in MR settings [151].
In this study, MR functions as a situated platform: high-fidelity overlays allow participants to act in the actual lounge while we measure the perceptual and psychosocial outcomes of specific cues. This approach preserves context yet isolates design variables, yielding actionable evidence for subsequent modifications.
2. Materials and Methods
2.1. Hypotheses
This section outlines the study hypotheses.
- H1 (between-design differences): The three lounge designs—(A) baseline, (B) A + virtual spatial partition, and (C) B + virtual identity cues—produce significantly different mean scores for PTC and SOC.
- H2 (within-design associations): Within each design, PTC is positively correlated with SOC.
To test these hypotheses, MR simulations were used to manipulate physical boundaries and identity elements as independent variables, with PTC and SOC serving as the dependent measures. These constructs, introduced conceptually in Section 1.2, Section 1.3, Section 1.4 and Section 1.5, were translated into measurable variables for empirical assessment (Section 2.4). It should be noted that MR was not modeled as an independent variable in the hypothesis tests. It served solely as a presentation platform—rather than an analytic factor, mediator, or moderator. MR enabled the implementation of design conditions A–C and the measurement of participants’ perceptual and psychosocial responses.
2.2. Setting
The MR-based experimental study was conducted in a student lounge located on the third floor of Building Two at Inha University. The lounge had previously been used by the Chemical Engineering Department, but became underused after the department relocated. The target space is a prototypical university lounge configured according to a pattern language–based, reflecting spatial qualities commonly observed in campus environments. It is located at the center of a linear building, directly connected to the adjacent corridor and stair hall, and partially open toward a large vertical atrium with niche seating areas (Figure 1). With no additional boundary indicators, it allows circulation to flow freely through the space while serving informal uses, such as eating, conversation, and group work.
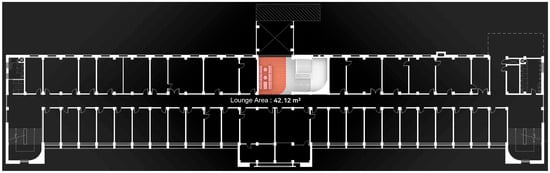
Figure 1.
Experimental setting in the existing student lounge (area marked in red).
The lounge designs were developed using Unity software (v2022.2.10f1) [153] to operationalize the independent variables. The three configurations were as follows (Table 1):

Table 1.
Independent variables: three lounge design conditions.
- Design A: The lounge in its existing state.
- Design B: The lounge with partially open partition furniture that delineates territory while retaining outward visibility to corridors and stairwells.
- Design C: The partitioned lounge supplemented with identity-cue objects that support awareness of the group and social interaction (e.g., institutional and departmental logos, community blackboards, self-adhesive notes, posters, and students’ architectural models).
Design A served as the control group. All existing elements—sofas, tables, finishes, ceiling, and lighting—remained unchanged. This baseline aligns with the recommendations of pattern-language studies for shared rooms. The lounge is situated in the center of the corridor and utilizes movement paths, while allowing for small, movable clusters that provide local privacy [118].
In Design B, semi-open virtual partition furniture defined the lounge relative to the corridor and stair hall while preserving permeability. The partitions articulated virtual boundaries in a co-located setting [154,155]. This reflects the pattern-language studies’ emphasis on partial enclosure without isolation, allowing small groups to work or linger while the lounge remains connected to circulation [118] (Figure 2a).
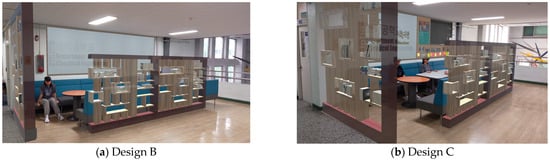
Figure 2.
The MR design intervention overlaid onto the existing lounge environment.
In Design C, virtual identity cues—such as departmental symbols, community boards, posters, and student work—were added alongside the partitions to establish a sense of place identity and collective affiliation [156,157,158]. Making identity visible in standard rooms without blocking circulation is likewise addressed in pattern-language sources [118] (Figure 2b).
2.3. Participants
Participants were recruited among students in the Department of Architecture at Inha University (Korea) through an open departmental call with voluntary enrollment. To ensure safe and stable MR operation and to minimize bias from prior expertise or site familiarity, we excluded individuals with substantial prior MR experience and those who frequently used the target lounge or had health/vision conditions incompatible with MR participation. After screening, 60 eligible participants were confirmed and proceeded to the study. Before data collection, all participants received a full explanation of the procedures and provided written informed consent, which was approved by Inha University’s institutional review board (No. 221128-7A).
The cohort was intentionally homogeneous in disciplinary training (architecture majors), age range (predominantly 20s), and academic status (fourth year and above), with a male-to-female ratio of approximately 60:40. Prior MR proficiency skill was minimal in most participants (78.3% none or little), and familiarity with the lounge space was low (93.3% none or rare). These characteristics yielded a well-controlled sample appropriate for the experimental design (Table 2).
Table 2.
Participants’ demographics and background characteristics (N = 60).
The lounge primarily serves architecture students due to its adjacency to the department. Sampling this primary user group enhances ecological validity and reduces background heterogeneity (e.g., course schedules, project workflows, and space-use norms) that could obscure the effects of the conditions. Although this relatively homogeneous cohort constrains generalizability, we probed the robustness of the effect by testing interactions with participant characteristics—educational status (as a proxy for aesthetic training), MR proficiency, and lounge-use experience (spatial familiarity)—using mixed ANOVAs. None of these factors moderated the condition effects (see Appendix A Table A2), indicating that the main findings are unlikely to be influenced by participant background.
2.4. Variables and Measurement Instruments
Perceived territorial characteristics (PTC) and sense of community (SOC) served as the dependent constructs (see Appendix A Table A3).
For the PTC measure, we operationalized spatial territorial perception by integrating theoretical and design-based indicators. PTC was grounded in theories of territoriality [23,25,27,28,29,30,31]. Within this framework, spatial comfort and openness were adapted from the Korean Educational Development Institute’s Educational Building Design Quality Indicators (EBDQI) [159], which represent essential qualities of multipurpose informal spaces, such as harmony, adequacy, and accessibility. Territorial control and symbolic identity were informed by empirical studies on the links between physical environments and psychosocial processes of territoriality in organizational and educational settings [57,160,161]. Collectively, these four dimensions—spatial comfort, openness, territorial control, and symbolic identity—capture the territorial qualities of the student lounge and are contextualized within the MR design scenarios in this study. All items were rated on a five-point Likert scale ranging from 1 (strongly disagree) to 5 (strongly agree).
SOC was measured using the standardized SCI-II [75]. It comprises four dimensions—need fulfillment, membership, influence, and emotional connection—across 24 subitems. For this study, the 24 substantive items were adapted to the university lounge setting and rated on a four-point Likert scale ranging from 1 (not at all) to 4 (completely). This broad validation enabled a systematic assessment of how physical and symbolic environmental attributes shaped students’ SOC in the informal lounge at Inha University.
Before hypothesis testing, measurement properties were verified via principal component analysis (PCA) with varimax rotation. PCA was conducted within the designs (A–C) and within the dimensions. Component retention used parallel analysis and scree tests; items with loadings of <0.50 or Cronbach’s α of <0.50 were removed. Subscale scores equal the mean of retained items. Overall PTC was computed as the mean of its four subdimensions, and overall SOC as the mean of its four subdimensions; deleted items were excluded from the composites.
Psychometrics were acceptable overall. For PTC, the eigenvalues met the Kaiser criterion (≥1.0), and the variance explained ranged from 50.678% to 76.816%. KMO values were 0.608–0.795, Bartlett’s tests were significant (p < 0.001) in all cases except for symbolic identity under Design A (p = 0.014), and the range of Cronbach’s α was 0.508–0.847. For SOC, the eigenvalues were 2.858–3.999, the variance explained was 54.994–66.645%, the KMO was 0.598–0.857, Bartlett’s tests were p < 0.001 in all cases, and Cronbach’s α was 0.810–0.898.
Appendix A Table A4 summarizes the instrument validation (factor structure and reliability). We therefore concentrate on the main results for H1 and H2 in Section 3 and Section 4.
2.5. Experimental Procedure
Participants completed three within-subject sessions corresponding to Designs A, B, and C. Upon arrival and enrollment, participants completed a sociodemographic survey that captured their general characteristics (details are provided in Section 2.3). Following this pre-survey, they received a brief orientation and MR training to familiarize themselves with the experiment procedure. Each session consisted of 10 min of exposure to a single lounge configuration, followed by a 5-min post-exposure questionnaire. Total time was 45~50 min across the three sessions. To avoid sequence effects, the sessions were presented in a randomized, counterbalanced order. A 1 to 2-day washout interval was used to separate the sessions and minimize carryover effects (Figure 3).
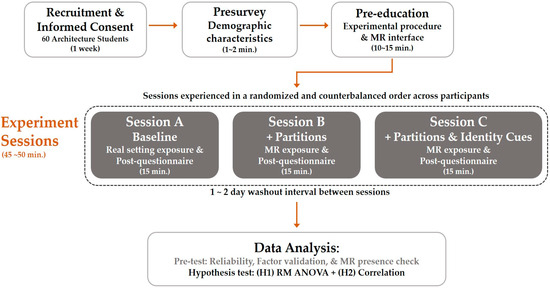
Figure 3.
MR experiment timeline across three design conditions.
Design B and C were delivered as MR overlays via Microsoft HoloLens 2 head-mounted displays (HMD), while Design A served as an in situ baseline (no MR; no presence ratings). The virtual partitions and identity cue elements were calibrated to the site using the lounge floor plan and on-site alignment so that location, scale, and geometry matched the physical setting. For comparability, the partition position and dimensions were held identical in B and C. During each exposure, three trained students enacted typical lounge behaviors—studying, eating, and conversing—to provide ecological context.
Within each exposure, participants followed a simple, standardized script: half the time was spent standing/walking to look around the lounge, and half the time was spent seated in the setting while others acted nearby. After each exposure, participants rated their perceived territorial characteristics (PTC) and sense of community (SOC) in the post-questionnaire survey. During the post-survey, the presence scale was administered only in the MR conditions (B and C) as a manipulation check to confirm that MR provided a suitable context for these psychometric indices.
2.6. Analysis Methods
For H1, condition effects across Designs A–C were examined using repeated-measures ANOVA (RM ANOVA). Sphericity was assessed with Mauchly’s test and, where violated, Greenhouse–Geisser or Huynh–Feldt corrections were applied to the degrees of freedom prior to inference. Effect sizes for omnibus tests were reported as partial ηp2 values. Bonferroni-adjusted pairwise comparisons were used for between-condition contrasts.
For H2, associations among PTC, SOC, and their subdimensions were analyzed separately for each design using Pearson’s r; significant correlations were indicated in the correlation matrices. For significant associations reported in the results, Cohen’s d was provided to indicate the magnitude of the effect. Statistical significance was set at α = 0.05 (two-tailed).
As a preliminary procedural check, we compared the MR presence between Designs B and C to verify comparable immersion across MR-assisted conditions (paired tests) (see Appendix A Table A5 and Table A6). This step did not constitute MR validation.
2.7. Mixed Reality Platform Check
We treat MR as a pre-occupancy evaluation platform rather than a causal factor. Presence was measured solely to verify platform adequacy and equivalence across MR designs.
A short-form presence questionnaire was used from Witmer and Singer’s [146] PQ. As MR combines real and virtual environments, MR research commonly employs adapted or abbreviated VR questionnaires to maintain comparability while accounting for MR’s hybrid characteristics [143,151]. Following this practice, the short-form instrument was calibrated to the present context. Items were tailored to MR-specific features—realism, autonomy, interaction, display quality, interface usability, and equipment comfort—and rated on a seven-point Likert scale from 1 (strongly disagree) to 7 (strongly agree). Internal consistency was acceptable (Cronbach’s α = 0.702). Because MR was used in both Designs B and C, we compared overall presence to confirm platform equivalence.
Mean presence was Design B: M = 5.15/7 and Design C: M = 5.21/7; paired tests showed no significant differences across the item set (all p > 0.05). Item-level summaries appear in Appendix A Table A5. As benchmarked against recent MR studies that used short-form PQ variants, these values fall within the commonly reported range for HMD-based MR tasks (e.g., ≈4.9–6.25/7, depending on the interaction mode or condition) [162,163,164]. Although direct numeric comparisons should be made cautiously, the pattern suggests a moderate to high presence, typical of MR. Mean presence scores fell in the midrange of the accepted band, indicating immersion sufficient for in situ appraisal yet not high enough to obscure design-driven effects [146,165].
To assess potential confounding, we examined correlations between MR presence and key psychosocial indices (Appendix A Table A6). Several weak-to-moderate associations were observed; among the significant correlations, coefficients ranged from r ≈ 0.267 to 0.355, with p < 0.05 or p < 0.01. However, these associations did not alter the design effects reported in Section 3.1. Thus, presence was adequate and statistically comparable between B and C, and the observed patterns aligned with the intended spatial/identity manipulations rather than generalized immersion. Exploratory MR-quality correlations are reported only as a diagnostic and do not offer an alternative account of the core findings. This framing keeps MR at the method level while centering the design cues as the explanatory variables. Confirming adequate and equivalent presence strengthens internal validity by focusing inferences on spatial and symbolic manipulations rather than immersion differences.
3. Results
3.1. Group Differences in Perceived Territorial Characteristics and Sense of Community
An RM ANOVA was used to examine differences in PTC and SOC across the three design conditions (A–C). Sphericity was tested using Mauchly’s W., Greenhouse–Geisser or Huynh–Feldt corrections were applied when appropriate (Table 3).
Table 3.
Repeated-measures ANOVA results across three Designs (A–C).
For PTC, significant main effects of design were observed for overall PTC (F = 126.69, p < 0.001, ηp2 = 0.682), spatial quality (F = 91.10, p < 0.001, ηp2 = 0.607), territorial control (F = 118.09, p < 0.001, ηp2 = 0.667), and symbolic identity (F = 137.24, p < 0.001, ηp2 = 0.699). Bonferroni-adjusted pairwise comparisons showed a consistent pattern of A < B < C, indicating progressive strengthening of territorial appraisal from the baseline (A) to partitions (B) and symbolic cues (C), whereas openness did not differ across conditions (p = 0.301).
For SOC, the omnibus tests were significant for overall SOC (F = 22.87, p < 0.001, ηp2 = 0.279) and for all subdimensions: need fulfillment, membership, influence, and emotional connection (p < 0.01, or p < 0.001). Pairwise comparisons indicated A = B < C, suggesting that perceived community quality improved only with the addition of symbolic identity cues in Design C.
The RM ANOVA confirmed that design manipulations had a substantial effect on both territorial and community-related appraisals, with larger effect sizes for PTC (ηp2 ≈ 0.607–0.699) and moderate ones for SOC (ηp2 ≈ 0.174–0.279).
The outcomes increased progressively from A to C, suggesting that permeable boundaries and symbolic identity elements translate perceived territorial legibility into communal meaning without sacrificing openness. MR Presence did not differ between B and C (all p > 0.05), indicating that Design C’s advantage reflects territorial and symbolic affordances rather than immersion.
3.2. Correlation of Perceived Territorial Characteristics and Sense of Community Measures
Pearson correlations were examined among PTC (1–5) and SOC (6–10) within each design (Table 4). In Design A, strong within-domain correlations were observed among PTC (1–5; r = 0.380–0.780, mostly p < 0.01) and among SOC (6–10; r = 0.519–0.926, all p < 0.01). Cross-domain links were largely absent, with only overall PTC (1) correlating with influence (9) (r = 0.310, p < 0.05, d = 0.653).
Table 4.
Pearson correlations among PTC and SOC subscales.
In Design B, correlations remained high among PTC (1–5; r = 0.284–0.825, mostly p < 0.01) and among SOC (6–10; r = 0.721–0.913, all p < 0.01). Cross-domain associations were again minimal, with a single significant link between symbolic identity (5) and membership (8) (r = 0.266, p < 0.05, d = 0.553).
In Design C, within-domain correlations were high among PTC (1–5; r = 0.399–0.906, mostly p < 0.01) and among SOC (6–10; r = 0.641–0.928, all p < 0.01). Substantive cross-domain associations emerged. Territorial control (4) correlated with overall SOC (6) (r = 0.287, p < 0.05, d = 0.599), need fulfillment (7) (r = 0.280, p < 0.05, d = 0.583), membership (8) (r = 0.271, p < 0.05, d = 0.564), and influence (9) (r = 0.293, p < 0.05, d = 0.613). Spatial comfort (2) was related to need fulfillment (7) (r = 0.259, p < 0.05, d = 0.537) and membership (8) (r = 0.303, p < 0.05, d = 0.635). In addition, overall PTC (1) and membership (8) showed a correlation (r = 0.266, p < 0.05, d = 0.553). Symbolic identity (5) correlated with membership (8) (r = 0.265, p < 0.05, d = 0.551).
Across conditions, within-domain cohesion was high for both PTC and SOC. Cross-domain links were sparse in A and B but present in C, where territorial control showed consistent associations with multiple SOC subscales (d = 0.564–0.613, p < 0.05). Within SOC, membership showed the most consistent cross-domain links (d = 0.551–0.635, p < 0.05). Openness–SOC pairs were nonsignificant (all p > 0.05).
Overall, the significant cross-domain pairs in Design C had small-to-moderate magnitudes, aligning with the observed correlation pattern. Within PTC, within-domain cohesion was high (Table 4); in cross-domain, territorial control yielded the strongest links (r = 0.271–0.293), while within SOC, membership emerged as the most responsive facet (r = 0.265–0.303). Openness remained high yet showed no association with SOC across designs, implying that openness is necessary but insufficient for community formation (see Appendix A Table A7 for the full list of significant cross-domain pairs across Designs A–C).
4. Discussion
4.1. Between-Design Differences
4.1.1. H1 for PTC
The RM ANOVA revealed consistent and progressive increases in PTC across the three design conditions, confirming that both semi-open boundaries and symbolic cues enhanced the participants’ spatial appraisal. Most territorial dimensions—overall PTC, spatial quality, territorial control, and symbolic identity—showed statistically significant improvements from A to B to C (all p < 0.001), whereas the openness subscale remained statistically unchanged. This result suggests that the successive layering of environmental features—first through the introduction of vertical partitions and then through the addition of symbolic cues—systematically strengthened users’ territorial recognition without diminishing the lounge’s perceived openness.
These findings clarify that perceived control, legibility, and identity can be enhanced through subtle environmental modifications, rather than by restricting accessibility or enclosure. These between-condition differences were observable because MR enabled participants to experience the interventions within the intact lounge context, preserving ecological validity.
In Design A, the baseline yielded the lowest territorial scores yet elicited measurable territorial perceptions. Even without explicit boundaries, the spatial layout appeared to provide cues for territorial recognition. Prior research indicates that students prefer specific seating arrangements for reasons such as visibility, concentration, and social proximity [59]. Additionally, repeated seat occupancy in open lecture halls can be interpreted as a form of territorial attachment, with intrusion perceived when others occupy one’s seats [166]. In line with these observations, the baseline lounge—despite the absence of dividers—offered a minimal, sufficient spatial structure that already afforded recognition of personal or group domains, functioning as a neutral yet legible background for the subsequent design interventions.
When semi-open partitions were introduced in Design B, the participants’ territorial perceptions increased significantly, particularly in terms of spatial quality and control. The partitions created partial buffers that subtly separated groups while maintaining transparency and physical continuity. By offering a degree of enclosure, this heightened the awareness of territorial boundaries. This finding supports a prior field study reporting that a centrally placed vertical object in a campus open space subtly marked the setting and increased perceived territoriality and privacy [161]. Similarly, neuroarchitecture studies have demonstrated that even modest shifts in enclosure can elicit the perception of affective aesthetic appraisal and behavioral use patterns, including approach tendencies [109,110]. In this study, the partitions’ permeability preserved the space’s public character and circulation, yet signaled control and recognition of the lounge as a distinct area. Comparable results in a university library hall—where the addition of tables and dividers improved satisfaction and efficiency by reinforcing boundaries in an otherwise open, shared space—converge with this interpretation [167]. These results reaffirm the architectural notion that partial division often performs better than full enclosure as articulated in pattern-language theory, wherein semi-open boundaries are described as optimal conditions for human interaction and self-regulation [118].
In Design C, the addition of virtual symbolic cues yielded the highest overall territorial scores and, most notably, the largest gains in symbolic identity. This increase occurred even though MR presence did not differ significantly between B and C (all p > 0.05), indicating that the stronger response in C stemmed not from technological immersion but from the symbolic content embedded within the environment. This finding highlights the unique role of symbolic artifacts as emotional and cognitive affordances that attach meaning to physical space.
The objects and displays infused the lounge with shared meaning and reinforced participants’ collective identification with the space. As emotional affordances, the symbolic cues clarify who a place is for and why it matters to users—supporting recognition and belonging [34]. The role of symbolic identity cues in shaping users’ interpretation and adaptation to campus environments is well-documented: signage, spatial markers, and coherent visual design effectively reinforce the identity of a place in university public spaces [168]. Permanent displays of student work enhance students’ sense of ownership and identification with their classrooms [169]. Such practices are directly linked to territoriality, with users personalizing settings and asserting psychological claims over specific spaces. In the present context, displaying student architectural models alongside departmental logos and community boards likely had a comparable effect. The lounge was perceived not only as bounded but also meaningfully tied to the collective identity of architecture students. These converging findings support the interpretation that symbolic cues in shared informal spaces enhance the identity of a location by embedding group presence and contributions into the physical environment.
Openness, on the other hand, did not differ significantly across all three conditions. This stability can be interpreted as evidence that the design interventions were effectively calibrated. The semi-open partitions introduced a sense of boundary and control, while preserving visibility and access to surrounding circulation. From a design standpoint, openness functions as an essential quality of communal lounges. When appropriately managed, it can coexist with the cues that signal ownership or identity. The findings demonstrate that a space can remain publicly accessible while still providing sufficient environmental information for users to recognize territorial boundaries and social meaning.
4.1.2. H1 for SOC
Across the three conditions, SOC increased selectively and consistently only when symbolic identity cues were present. The RM ANOVA results showed a clear pattern of A = B < C for all SOC indices (mostly p < 0.001), with moderate effect sizes (ηp2 = 0.174–0.279). Partitions alone did not raise SOC above baseline; adding a symbolic layer in C appears necessary to convert boundary clarity into a more communal reading of the lounge. Because MR presence did not differ between B and C (all p > 0.05), these SOC gains are unlikely to reflect generalized immersion and are better explained by the specific identity affordances introduced in C.
Interpreted from the perspective of need fulfillment—which McMillan and Chavis [64] define as the belief that personal needs for support, recognition, and opportunities for interaction can be met through membership—the visual system in C (departmental logos, murals, and displays of student work) likely functioned as acknowledgment cues. By making the users’ community visible and valued, the lounge communicates that it recognizes its users and supports their participation. This mechanism aligns with frameworks that link territoriality, identity, and belonging [170]; when places signal whom they are for and why they matter, people read them as capable of meeting social and identity-relevant needs.
In the Korean university context, intermediate spaces are increasingly co-locating study and peer support, evolving into user-centered community venues [41,42]. For instance, campus environmental quality and safety cues (e.g., lighting and cleanliness) are associated with stronger interaction and SOC [171]. Among generation Z students, feelings of social belonging on campus mediate the links between trust and life satisfaction [43]. These examples suggest that clear, legible cues embedded in everyday university spaces can facilitate social connection and recognition [171]. Accordingly, Design C operationalizes locally salient levers—territorial legibility and symbolic identity—to convert access into recognition, membership, and participation [41,171].
Building on this premise, empirical observations from informal academic settings show how specific spatial and symbolic moves realize these effects in practice. When furniture and layouts align with intended functions and remain reconfigurable to users’ preferences, students report greater comfort, ownership, and a sense of responsibility—responses that strengthen place identity [12]. In a U.S. college union context, symbolic cues—such as lighting, murals, signage, and mobile furnishings—were associated with higher feelings of belonging and a stronger community identity [172]. Even where movement integration was low, symbolic architectural elements—such as colonnades, garden corners, and pool edges—were shown to sustain gathering and interaction [173]. This previous result suggests that symbols can matter more for participation than circulation alone. Pattern-based guidance similarly points to semi-open clusters and visible displays that express group purpose as being effective ways to increase belonging without impeding flow [118]. Within these evidential fields, the design C’s symbolic layer appears to have translated territorial legibility into shared communal meaning, a step that Design B’s boundary alone did not accomplish.
The distribution of effects across the SOC subdimensions is informative. Gains in need fulfillment and membership indicate that users perceived the lounge not merely as accessible but also as a place where they are recognized and expected—a shift from spatial availability to social invitation. Increases in influence suggest that the space was perceived as one where users could plausibly participate and shape shared norms. The rise in emotional connection indicates that the lounge promoted affective salience, consistent with evidence that identity-bearing displays (e.g., student work) heighten ownership and identification with learning environments [168,169]. These subcomponent changes support a pathway in which boundary clarity establishes a platform for territorial claim, and symbolic cues provide the narrative and acknowledgment that convert that claim into membership, efficacy, and attachment.
At the same time, the magnitude of SOC effects remained moderate relative to the larger territorial effects—an expected pattern for brief encounters in simulated settings. From a design standpoint, the results suggest a practical sequence: define territory with a permeable, semi-open structure and then make identity visible and participatory through curated displays, wall-mounted graphic posters, and editable communal surfaces. Such measures can seed the recognition–membership–influence–connection chain observed in the lounge. Repeated use and continued engagement are likely to consolidate these perceptions into the deeper social bonds [156], which communal lounges are designed to sustain over time.
4.2. Within-Design Associations
H2 for PTC–SOC Correlations
Across the three designs, territorial appraisals showed strong internal cohesion, most notably the coupling of territorial control and symbolic identity (Design C: r ≈ 0.784). By contrast, openness and SOC were nonsignificant across designs (all p > 0.05). This aligns with the design logic: openness was preserved to maintain a public character, and boundary and identity cues were layered to test whether territorial readings would translate into communal meaning.
In baseline A, without explicit markers, territorial perceptions were largely disconnected from community dimensions, except for a minor cross-domain link to influence. This aligns with Lewicka’s observation that spaces lacking symbolic or physical markers may afford agency yet seldom build social attachment [174]. Inviting spatial cues—such as large windows, varied seating, and landscaped walkways—were perceived as enhancing a sense of belonging [175]. Additionally, architectural features and symbolic cues—such as openness, seating arrangements, and orientation—directly influenced perceptions of community belonging [57]. Thus, without explicit territorial or symbolic cues, the lounge supported basic use but offered little basis for stronger social ties or community identification.
In the partitioned condition B, introducing semi-open vertical partitions clarified edges and enhanced legibility, but did not extend into a stronger community perception. Symbolic identity showed only a minor association with membership, indicating that partitions acted more as pragmatic dividers than as social markers. In the affordance view, semi-permeable partitions altered passability and edge salience—reweighting where to enter/exit, linger, or claim micro-areas. Legibility and control increased, but shared meaning did not [102,105,107]. Comparable results are reported in Al-Homoud and Abu-Obeid’s experiment [176], in which a kiosk design with overhangs and vertical elements defined small-group seclusion zones, thereby enhancing privacy and interaction within those groups. In the present study, the semi-open partitions seemed to function as weak symbolic boundaries—signaling territorial edges and perhaps encouraging membership—yet lacking the richness needed to anchor strong community bonds. Minimal partitions can demarcate space and convey some social meaning, but their effects are limited compared to explicit symbolic interventions.
In the identity-marked design C, cross-domain links emerged: territorial control correlated with Overall SOC and Influence, and Membership linked with several PTC measures, including Spatial comfort and Overall PTC (effects in the small to moderate range; d ≈ 0.537–0.635). Identity markers provide the missing bridge by embedding legible group references, helping users interpret territorial claims as shared rather than purely individual. Consistent with place-identity theory, meaningful artifacts embed cultural and social references into space, transforming personal ownership into collective attachment [177]. Educational contexts point in the same direction: murals, student artwork, and symbolic displays increase engagement and strengthen students’ sense of identity and belonging [178]. Territorial personalization extends beyond privacy control or interaction regulation to strengthen inviting, identity-affirming, and cohesive environments [179]. In our setting, logos, communication memos, and displays of students’ building models helped transform the lounge from a neutral, open facility into a recognizable domain for a specific cohort. At the campus scale, coherent and readable settings are favored over fragmented. Style-driven building assemblages sustain everyday attachment and interaction—consistent with the lounge-level effects observed here [180].
It is essential to emphasize that openness did not connect to SOC across any condition, even when it remained high and valued. This suggests that while openness remains desirable, it does not by itself yield community in shared lounges. Openness preserves permeability and visibility yet lacks the symbolic specificity necessary to consolidate a psychosocial SOC. The results, therefore, differentiate design levers; partitions can organize territories and heighten control, but symbolic identity appears critical for translating territorial recognition into community-facing appraisals.
Treating MR as an adequate and equivalent platform supports the inference that observed differences arise from boundary and identity manipulations rather than immersion variance. As a situated pre-occupancy tool, MR elicited concurrent readings of physical affordances and virtual cues, integrating boundary and meaning without altering the built setting. Rather than amplifying presence, MR served as an in situ delivery platform through which psychosocial responses could be observed; its interactive fidelity and ecological plausibility allowed authentic appraisal of territorial and community cues [181,182]. Prior research also suggests that MR presence extends from perceptual immersion to place-making, collective interaction, and shared meaning [183]. In the present study, MR reveals links between territorial recognition and SOC that are difficult to capture with surveys, static renderings, or retrospective instruments.
5. Conclusions
This study examined how spatial partitions and symbolic identity cues in a university lounge relate to territorial perceptions and SOC, using MR to present design alternatives in situ. Territorial measures rose across baseline, partitioned, and identity-enhanced designs. Only the identity-enhanced condition yielded gains in community measures, with improvements across the total SOC score and all subdimensions. These gains also restored the links between territorial and community perception under ecologically credible conditions.
The findings point to a two-part framework. Semi-open partitions clarify edges and support local control. Symbolic cues make group meaning visible and foster belonging. These results suggest a staged path: first secure boundary legibility, then layer identity to move from individual comfort toward communal connection. This refines SOC accounts by linking distinct affordances to distinct facets of community life. Fully open or fully closed layouts work poorly. Semi-open group niches with visible displays keep common rooms legible, comfortable, and easy to return to.
In practice, partitioning should be used carefully, supporting privacy and control without compromising the lounge’s vitality. Logos, artifacts, and displays of student work can cultivate a sense of comfort and shared identity. Informal student spaces should be treated not as residual corridors but as core infrastructure that supports everyday interaction and affiliation. These points are timely as universities reconfigure communal environments amid shifting academic cultures.
MR functioned effectively as a delivery platform for eliciting psychosocial responses. Combining high fidelity with bidirectional interaction across physical and virtual layers preserved contextual realism. It also enabled the assessment of how spatial cues shape perceived qualities and community dynamics. Presence scores supported the adequacy of this purpose, and the approach allowed participants to engage with the proposed modifications in situ without physically altering the lounge. Embedding MR in the educational facility-planning process supports participatory design and the early testing of spatial changes. Coupled with field practice, this approach tests whether the effects observed in the MR evaluation carry over into day-to-day operations.
The limitations of this study include the homogeneous, single-site sample of Korean architecture students, which we treat as a boundary condition for generalization. Because all participants were design students, greater spatial literacy or aesthetic orientation could have shaped appraisals of boundaries and identity cues; however, additional robustness checks found no evidence that educational status, MR proficiency skills, or spatial familiarity altered the pattern of condition effects, suggesting that the observed differences primarily reflect the manipulated spatial and symbolic cues. Presence scores supported the adequacy of the MR setup, yet questions of fidelity and interaction realism remain.
In future studies, replication with non-design majors, multi-site approaches, and cross-disciplinary or culturally diverse cohorts is needed to assess external validity. Familiarity with the venue may heighten sensitivity to spatial legibility and symbolic identity. Future research should include cross-disciplinary samples and test familiarity as a covariate. The relative stability of the openness dimension also suggests the value of examining alternative boundary types and spatial configurations. Broader samples, varied boundary/identity manipulations, and longitudinal follow-ups—ideally pairing behavioral reports with mobile EEG or fNIRS under similar in situ protocols—would help triangulate perceptual–affective responses and strengthen causal interpretations.
While this study focuses on a single university lounge, the implications extend beyond this context. The cue sequence tested here—permeable partitions for legibility and visible identity markers for shared meaning—is transferable to libraries, learning commons, and workplace hubs. MR-based pre-occupancy evaluation enables rapid, in-context iteration with end-users before construction, supporting an evidence-based process that bridges perception and participation. These features broaden the study’s relevance to interior and environmental design practice. Accordingly, the present framework contributes not only to architectural research but also to practical decision-making across diverse cultural and institutional settings.
Author Contributions
Conceptualization, W.K. and M.C.; Methodology, W.K. and M.C.; Software, W.K.; Validation, W.K.; Formal analysis, W.K. and M.C.; Investigation, W.K. and M.C.; Resources, W.K. and M.C.; Data curation, W.K. and M.C.; Writing—original draft preparation, W.K.; Writing—review & editing, M.C.; Visualization, W.K.; Supervision, M.C.; Project administration, W.K.; Funding acquisition, M.C. All authors have read and agreed to the published version of the manuscript.
Funding
This research was supported by INHA UNIVERSITY Research Grant.
Institutional Review Board Statement
This study was conducted in accordance with the Declaration of Helsinki and approved by the Institutional Review Board of Inha University (221128-7A, 28 December 2022).
Informed Consent Statement
Written informed consent has been obtained from all participants for the experiment and its subsequent publication.
Data Availability Statement
The original contributions presented in the study are included in the article, further inquiries can be directed to the corresponding author/s.
Acknowledgments
This article substantially extends the authors’ earlier works (master’s thesis and ISAIA 2024 conference paper), which are cited in the References.
Conflicts of Interest
Author Wontae Kim was employed by the company AUM & LEE Architects & Associates. The remaining author declares that the research was conducted in the absence of any commercial or financial relationships that could be construed as a potential conflict of interest.
Appendix A
Table A1.
Integrated backgrounds of the conceptual framework.
Table A1.
Integrated backgrounds of the conceptual framework.
| Discipline | Core Focus | Key Mechanism | Scholars | Link to This Study |
|---|---|---|---|---|
| Environmental psychology | Regulation of interpersonal space, privacy, and ownership | Control of access, personalization, and defense of territory | [23,24,25,26] | Partitions link to territorial control and legibility |
| Human geography | Socio-spatial organization of boundaries and identity | Spatial classification, boundary communication, and symbolic representation | [27,28,29,30,31] | Partitions/Identity markers link to boundary clarity and signaling |
| Environmental sociology | Collective meaning and group identity | Social construction of belonging and group identity via shared places | [170,174] | Identity markers link to symbolic social meaning |
Table A2.
Mixed ANOVA (Condition X Factor) Interactions.
Table A2.
Mixed ANOVA (Condition X Factor) Interactions.
| Dimension | Factor | F | df1 | df2 | p | ηp2 | |
|---|---|---|---|---|---|---|---|
| PTC | Spatial comfort | Education status | 0.817 | 2 | 116 | 0.444 | 0.014 |
| MR proficiency | 0.704 | 4 | 114 | 0.591 | 0.024 | ||
| Lounge use experience | 1.322 | 2 | 116 | 0.271 | 0.022 | ||
| Openness | Education status | 1.052 | 2 | 116 | 0.353 | 0.018 | |
| MR proficiency | 0.760 | 4 | 114 | 0.553 | 0.026 | ||
| Lounge use experience | 0.466 | 2 | 116 | 0.629 | 0.008 | ||
| Territorial control | Education status | 0.134 | 2 | 116 | 0.874 | 0.002 | |
| MR proficiency | 1.480 | 4 | 114 | 0.213 | 0.049 | ||
| Lounge use experience | 0.436 | 2 | 116 | 0.648 | 0.007 | ||
| Symbolic identity | Education status | 0.821 | 2 | 116 | 0.443 | 0.014 | |
| MR proficiency | 0.361 | 4 | 114 | 0.836 | 0.013 | ||
| Lounge use experience | 0.079 | 2 | 116 | 0.924 | 0.001 | ||
| SOC | Need fulfillment | Education status | 1.367 | 2 | 116 | 0.259 | 0.023 |
| MR proficiency | 0.406 | 4 | 114 | 0.804 | 0.014 | ||
| Lounge use experience | 1.436 | 2 | 116 | 0.242 | 0.024 | ||
| Membership | Education status | 1.100 | 2 | 116 | 0.336 | 0.019 | |
| MR proficiency | 1.768 | 4 | 114 | 0.140 | 0.058 | ||
| Lounge use experience | 1.097 | 2 | 116 | 0.337 | 0.019 | ||
| Influence | Education status | 0.515 | 2 | 116 | 0.599 | 0.009 | |
| MR proficiency | 1.098 | 4 | 114 | 0.361 | 0.037 | ||
| Lounge use experience | 0.787 | 2 | 116 | 0.458 | 0.013 | ||
| Emotional connection | Education status | 1.307 | 2 | 116 | 0.275 | 0.022 | |
| MR proficiency | 0.291 | 4 | 114 | 0.883 | 0.010 | ||
| Lounge use experience | 1.368 | 2 | 116 | 0.259 | 0.023 |
Note. The Condition × Factor interaction effects were not statistically significant for any outcome (all p > 0.05).
Table A3.
Summaries of variables for PTC and SOC.
Table A3.
Summaries of variables for PTC and SOC.
| PTC | Variables | Scholars | |
|---|---|---|---|
| Spatial comfort | SC1 | This space feels comfortable to use. | [159] |
| SC2 | The colors in this space are harmonious. | ||
| SC3 | The decorative elements in this space are harmonious. | ||
| SC4 | The size of this space is appropriate for its use. | ||
| Openness | O1 | This space is easily accessible from other areas. | [159] |
| O2 | I feel no reluctance to use this space | ||
| O3 | This space seems open to anyone. | ||
| O4 | This space feels open. | ||
| Territorial control | TC1 | I feel that my group can influence what happens in this space. | [57,160,161] |
| TC2 | I feel that this space is our territory. | ||
| TC3 | I can set or negotiate how this space is used with others. | ||
| TC4 | I can make a positive impact on what happens in this space. | ||
| TC5 | I can manage interactions in this space when needed. | ||
| Symbolic identity | SI1 | I can recognize what this space stands for. | [57,160,161] |
| SI2 | This space is distinct from other spaces. | ||
| SI3 | This space has symbolic elements. | ||
| SI4 | The symbols in this space influence how I feel about it. | ||
| SI5 | I can express my identity in this space. | ||
| SOC | Variables | Scholars | |
| Need fulfillment | NF1 | My essential needs are met in this lounge community. | [75] |
| NF2 | I value the same things as other lounge users. | ||
| NF3 | This lounge community effectively meets the needs of its members. | ||
| NF4 | I am happy to be part of this lounge community. | ||
| NF5 | When I have a problem, I can talk to members of this lounge community. | ||
| NF6 | People in this lounge community share similar needs, priorities, and goals. | ||
| Membership | M1 | I trust people in this lounge community. | [75] |
| M2 | I know most of the regular users of this lounge. | ||
| M3 | Most regular users of this lounge are familiar with me. | ||
| M4 | This lounge community has recognizable symbols (e.g., displays, logos, memos). | ||
| M5 | I invest time and effort to be part of this lounge community. | ||
| M6 | Being part of this lounge community is part of my identity. | ||
| Influence | I1 | It is important to me to feel that I belong in this lounge community. | [75] |
| I2 | This lounge community can influence other groups on campus. | ||
| I3 | I care about how this lounge community thinks of me. | ||
| I4 | This lounge community influences me. | ||
| I5 | When a problem arises, members of this lounge community work together to solve. | ||
| I6 | This lounge community has good leaders or coordinators. | ||
| Emotional connection | EC1 | Being part of this lounge community is important to me. | [75] |
| EC2 | I enjoy being with members of this lounge community. | ||
| EC3 | I want to remain part of this lounge community for a longer period. | ||
| EC4 | Members of this lounge community share meaningful events or experiences. | ||
| EC5 | I feel hopeful about the future of this lounge community. | ||
| EC6 | Members of this lounge community care about one another. | ||
Table A4.
Principal Component Analysis for SOC and PTC.
Table A4.
Principal Component Analysis for SOC and PTC.
| Dimension | Items Retained | Design | Eigenvalue | Variance (%) | KMO | Bartlett’s Test (χ2, df) | p | Cronbach’s α | |
|---|---|---|---|---|---|---|---|---|---|
| PTC | Spatial comfort | SC1,2,3 | A | 1.794 | 59.786 | 0.652 | 24.914 (df = 3) | <0.001 *** | 0.660 |
| B | 2.028 | 67.600 | 0.678 | 43.625 (df = 3) | <0.001 *** | 0.751 | |||
| C | 2.304 | 76.816 | 0.703 | 77.142 (df = 3) | <0.001 *** | 0.847 | |||
| Openness | O1,2,3,4 | A | 2.251 | 56.269 | 0.624 | 61.099 (df = 6) | <0.001 *** | 0.735 | |
| B | 2.456 | 61.411 | 0.743 | 70.29 (df = 6) | <0.001 *** | 0.785 | |||
| C | 2.267 | 56.681 | 0.633 | 77.928 (df = 6) | <0.001 *** | 0.738 | |||
| Territorial control | TC1,2,4,5 | A | 2.280 | 57.010 | 0.715 | 52.860 (df = 6) | <0.001 *** | 0.735 | |
| B | 2.286 | 57.149 | 0.682 | 62.595 (df = 6) | <0.001 *** | 0.742 | |||
| C | 2.495 | 62.384 | 0.795 | 66.302 (df = 6) | <0.001 *** | 0.792 | |||
| Symbolic identity | SI2,3 4 | A | 1.520 | 50.678 | 0.608 | 10.655 (df = 3) | 0.014 * | 0.508 | |
| B | 1.732 | 57.725 | 0.624 | 22.113 (df = 3) | <0.001 *** | 0.630 | |||
| C | 1.674 | 55.784 | 0.614 | 18.927 (df = 3) | <0.001 *** | 0.576 | |||
| SOC | Need fulfillment | NF1,2,3,4,5,6 | A | 3.300 | 54.994 | 0.746 | 151.036 (df = 15) | <0.001 *** | 0.832 |
| B | 3.947 | 65.779 | 0.815 | 216.834 (df = 15) | <0.001 *** | 0.893 | |||
| C | 3.632 | 60.533 | 0.825 | 619.508 (df = 15) | <0.001 *** | 0.860 | |||
| Membership | M1,2,3,5,6 | A | 3.064 | 61.275 | 0.598 | 186.688 (df = 10) | <0.001 *** | 0.839 | |
| B | 3.008 | 60.161 | 0.668 | 158.083 (df = 10) | <0.001 *** | 0.832 | |||
| C | 2.952 | 59.037 | 0.689 | 154.703 (df = 10) | <0.001 *** | 0.825 | |||
| Influence | I1,2,3,4,5 | A | 2.858 | 57.166 | 0.779 | 99.468 (df = 10) | <0.001 *** | 0.810 | |
| B | 3.185 | 63.704 | 0.812 | 137.029 (df = 10) | <0.001 *** | 0.855 | |||
| C | 3.179 | 63.583 | 0.799 | 128.178 (df = 10) | <0.001 *** | 0.853 | |||
| Emotional connection | EC1,2,3,4,5,6 | A | 3.819 | 63.647 | 0.845 | 181.124 (df = 15) | <0.001 *** | 0.882 | |
| B | 3.999 | 66.645 | 0.857 | 207.865 (df = 15) | <0.001 *** | 0.898 | |||
| C | 3.722 | 62.037 | 0.795 | 179.581 (df = 15) | <0.001 *** | 0.875 |
Note. Only items with Cronbach’s α ≥ 0.50 and factor loadings ≥ 0.50 are reported. Items SI1 and SI5 (α < 0.50) were removed. Items SC4, TC3, M4, and I6 (loadings < 0.50) were removed. Significance code: *** p < 0.001; * p < 0.05.
Table A5.
Comparison of MR Presence between Designs B and C (N = 60).
Table A5.
Comparison of MR Presence between Designs B and C (N = 60).
| Item | Design B | Design C | Mean Diff (C-B) | t (df = 59) | p | ηp2 | |||
|---|---|---|---|---|---|---|---|---|---|
| Mean | SD | Mean | SD | ||||||
| 1 | Presence of being in the lounge | 5.20 | 1.07 | 5.35 | 1.02 | 0.15 | 0.98 | 0.333 | 0.016 |
| 2 | Sense of psychological presence | 5.28 | 0.92 | 5.47 | 1.10 | 0.18 | 1.06 | 0.296 | 0.019 |
| 3 | Resolution/display quality | 5.02 | 1.08 | 5.08 | 0.91 | 0.07 | 0.41 | 0.684 | 0.003 |
| 4 | Realistic materials/lighting | 4.57 | 1.23 | 4.67 | 1.07 | 0.10 | 0.57 | 0.568 | 0.006 |
| 5 | Perceived realism of 3D space | 5.52 | 1.13 | 5.63 | 1.18 | 0.12 | 0.67 | 0.507 | 0.008 |
| 6 | Interaction with objects | 5.03 | 1.04 | 4.90 | 1.02 | −0.13 | −0.77 | 0.442 | 0.010 |
| 7 | Autonomous experience | 5.57 | 1.06 | 5.47 | 1.07 | −0.10 | −0.62 | 0.536 | 0.007 |
| 8 | Interface usability | 5.23 | 0.91 | 5.17 | 1.03 | −0.07 | −0.39 | 0.696 | 0.003 |
| 9 | Equipment comfort | 5.30 | 1.09 | 5.33 | 1.02 | 0.03 | 0.21 | 0.831 | 0.001 |
Note. Paired-t-tests (within-subjects). None of the mean differences were statistically significant (all p > 0.05). Mean trends were slightly higher for Design C, but effects were negligible.
Table A6.
Pearson correlations between the MR presence score and psychosocial dimensions (N = 60).
Table A6.
Pearson correlations between the MR presence score and psychosocial dimensions (N = 60).
| Dimension | Design B | Design C | |||||
|---|---|---|---|---|---|---|---|
| r | p | Cohen’s d | r | p | Cohen’s d | ||
| PTC | Overall PTC | — (ns) | — | — | 0.355 | 0.005 ** | 0.759 |
| Territorial control | — (ns) | — | — | 0.346 | 0.007 ** | 0.738 | |
| Symbolic identity | 0.286 | 0.027 * | 0.597 | 0.349 | 0.006 ** | 0.745 | |
| SOC | Overall SOC | 0.274 | 0.034 * | 0.570 | 0.316 | 0.014 * | 0.666 |
| Need fulfillment | 0.267 | 0.039 * | 0.554 | 0.276 | 0.033 * | 0.574 | |
| Membership | 0.308 | 0.017 * | 0.647 | 0.309 | 0.016 * | 0.650 | |
| Influence | 0.301 | 0.019 * | 0.631 | 0.275 | 0.033 * | 0.572 | |
| Emotional connection | — (ns) | — | — | 0.284 | 0.028 * | 0.592 | |
Note. Design-wise Pearson correlations (r) between perceived MR quality and psychosocial indices (N = 60). Only significant correlations are displayed (p < 0.05). These analyses were conducted as a secondary check to verify alignment with spatial partition and identity cue manipulations. Significance code: ** p < 0.01; * p < 0.05
Table A7.
Significant correlations across three designs (A–C) between PTC and SOC.
Table A7.
Significant correlations across three designs (A–C) between PTC and SOC.
| Pair (Between PTC and SOC) | r | p | Cohen’s d | |
|---|---|---|---|---|
| Design A | Overall PTC—Influence | 0.310 | <0.05 | 0.653 |
| Design B | Symbolic identity—Membership | 0.266 | <0.05 | 0.553 |
| Design C | Overall PTC—Membership | 0.266 | <0.05 | 0.553 |
| Spatial comfort—Need fulfillment | 0.259 | <0.05 | 0.537 | |
| Spatial comfort—Membership | 0.303 | <0.05 | 0.635 | |
| Territorial control—Overall SOC | 0.287 | <0.05 | 0.599 | |
| Territorial control—Need fulfillment | 0.280 | <0.05 | 0.583 | |
| Territorial control—Membership | 0.271 | <0.05 | 0.564 | |
| Territorial control—Influence | 0.293 | <0.05 | 0.613 | |
| Symbolic identity—Membership | 0.265 | <0.05 | 0.551 |
Note. Only significant pairs between PTC and SOC subscales are listed. Cohen’s d is derived as d = 2r/√(1 − r2).
References
- Barrett, P.; Davies, F.; Zhang, Y.; Barrett, L. The impact of classroom design on pupils’ learning: Final results of a holistic, multi–level analysis. Build. Environ. 2015, 89, 118–133. [Google Scholar] [CrossRef]
- Nja, C.O.; Anari, M.I.; Erim, C.M.; Idiege, K.J.; Ilhami, A.; Ukah, J.U.; Eneyo, O.E.; Uwe, U.E.; Cornelius-Ukpepi, B.U. Learning space, students’ collaboration, educational outcomes, and interest: Exploring the physical, social and psychological mediators. Heliyon 2023, 9, e15456. [Google Scholar] [CrossRef]
- Samani, S.A. The influence of light on student’s learning performance in learning environments: A knowledge internalization perspective. J. World Acad. Sci. Eng. Technol. 2011, 81, 540–547. [Google Scholar]
- Mealings, K. The effect of classroom acoustic treatment on listening, learning, and well–being: A scoping review. Acoust. Aust. 2023, 51, 279–291. [Google Scholar] [CrossRef]
- Charousaei, M.; Faizi, M.; Khakzand, M. The impact of the visual layout of university open space on students’ behavior and satisfaction level: The case of Iran University of Science and Technology. Smart Sustain. Built Environ. 2025, 14, 992–1016. [Google Scholar] [CrossRef]
- Abdullah, F.; Yaman, M.; Sanusi, A.N.Z.; Asif, N.; Salim, F. Significant design values for outdoor learning environment in higher learning institutions. J. Archit. Plan. Constr. Manag. 2021, 11, 91–99. [Google Scholar] [CrossRef]
- Goldhaber, A.B.; Khuan, H.; Allysa, R. Impact of ICT integration on quality of education among secondary schools in USA. J. Educ. 2021, 4, 53–61. [Google Scholar] [CrossRef]
- Temple, P. Learning spaces in higher education: An under–researched topic. Lond. Rev. Educ. 2008, 6, 229–241. [Google Scholar] [CrossRef]
- Dugdale, S. Space strategies for the new learning landscape. Educ. Rev. 2009, 44, 50–52. [Google Scholar]
- Cox, A.M. Space and embodiment in informal learning. High. Educ. 2018, 75, 1077–1090. [Google Scholar] [CrossRef]
- Detyna, M.; Ogunbase, A.; Briffa, H. A socio–material approach to investigating classrooms: Student engagement in an innovative learning environment. Learn. Environ. Res. 2025, 28, 473–502. [Google Scholar] [CrossRef]
- Harrop, D.; Turpin, B. A study exploring learners’ informal learning space behaviors, attitudes, and preferences. New Rev. Acad. Librariansh. 2013, 19, 58–77. [Google Scholar] [CrossRef]
- Crook, C.; Mitchell, G. Ambience in social learning: Student engagement with new designs for learning spaces. Camb. J. Educ. 2012, 42, 121–139. [Google Scholar] [CrossRef]
- Matthews, K.E.; Andrews, V.; Adams, P. Social learning spaces and student engagement. High. Educ. Res. Dev. 2011, 30, 105–120. [Google Scholar] [CrossRef]
- Wu, X.; Kou, Z.; Oldfield, P.; Heath, T.; Borsi, K. Informal learning spaces in higher education: Student preferences and activities. Buildings 2021, 11, 252. [Google Scholar] [CrossRef]
- Morieson, L.; Murray, G.; Wilson, R.; Clarke, B.; Lukas, K. Belonging in space: Informal learning spaces and the student experience. J. Learn. Spaces 2018, 7, 12–22. [Google Scholar]
- Manca, S.; Cerina, V.; Tobia, V.; Sacchi, S.; Fornara, F. The effect of school design on users’ responses: A systematic review (2008–2017). Sustainability 2020, 12, 3453. [Google Scholar] [CrossRef]
- Geister, S.; Keser Schenberger, F.; Çetinkaya–Yıldız, E.; Apaydın, S. The Role of Informal Learning Spaces in Promoting Social Integration and Wellbeing in Higher Education. Front. Educ. 2025, 10, 1637874. [Google Scholar] [CrossRef]
- Berman, N. A critical examination of informal learning spaces. High. Educ. Res. Dev. 2020, 39, 127–140. [Google Scholar] [CrossRef]
- APPA Thought Leaders Series 2012. Campus Space…An Asset and a Burden. APPA Leadership in Educational Facilities. Available online: https://share.google/UyTs70cMC3u8OC856 (accessed on 30 August 2025).
- Friedman, J.Z.; Worden, E.A. Creating interdisciplinary space on campus: Lessons from US area studies centers. High. Educ. Res. Dev. 2016, 35, 129–141. [Google Scholar] [CrossRef]
- Painter, S.; Fournier, J.; Grape, C.; Grummon, P.; Morelli, J.; Whitmer, S.; Cevetello, J. Research on Learning Space Design: Present State, Future Directions. Society of College and University Planning. 2013. Available online: https://share.google/JuPixi0N0pBRm0FZ8 (accessed on 27 August 2025).
- Altman, I. The Environment and Social Behavior: Privacy, Personal Space, Territory, and Crowding; Brooks/Cole Publishing Company: Monterey, CA, USA, 1975. [Google Scholar]
- Brown, B.B. Territoriality. In Handbook of Environmental Psychology; Stokols, D., Altman, I., Eds.; Wiley: New York, NY, USA, 1987; Volume 2, pp. 505–531. [Google Scholar]
- Taylor, R.B. Human Territorial Functioning: An Empirical, Evolutionary Perspective on Individual and Small Group Territorial Cognitions, Behaviors, and Consequences; Stokols, D., Altman, I., Eds.; Cambridge University Press: New York, NY, USA, 1988. [Google Scholar]
- Brown, G.; Lawrence, T.B.; Robinson, S.L. Territoriality in organizations. Acad. Manag. Rev. 2005, 30, 577–594. [Google Scholar] [CrossRef]
- Sack, R.D. Human territoriality: A theory. Ann. Assoc. Am. Geogr. 1983, 73, 55–74. [Google Scholar] [CrossRef]
- Sack, R.D. Human Territoriality: Its Theory and History; Stokols, D., Altman, I., Eds.; Cambridge University Press: New York, NY, USA, 1986. [Google Scholar]
- Paasi, A. Boundaries as social processes: Territoriality in the world of flows. Geopolitics 1998, 3, 69–88. [Google Scholar] [CrossRef]
- Paasi, A. Europe as a social process and discourse: Considerations of place, boundaries and identity. Eur. Urban Reg. Stud. 2001, 8, 7–28. [Google Scholar] [CrossRef]
- Paasi, A. Region and place: Regional identity in question. Prog. Hum. Geogr. 2003, 27, 475–485. [Google Scholar] [CrossRef]
- Gibson, J.J. The Ecological Approach to Visual Perception; Houghton Mifflin: Boston, MA, USA, 1979. [Google Scholar]
- Heft, H. Affordances and the body: An intentional analysis of Gibson’s ecological approach to visual perception. Ecol. Psychol. 1989, 1, 123–153. [Google Scholar] [CrossRef]
- Haworth Research. Affordances: Behaviors Encouraged by Desirable, High-Performance Work Environments; Haworth Inc.: Holland, MI, USA, 2024; Available online: https://www.haworth.com/content/dam/digital/north-american-assets/knowledge-and-research/affordances/Affordances_White-Paper.pdf (accessed on 15 October 2025).
- Michaels, C.F.; Carello, C. Direct Perception; Prentice-Hall: Englewood Cliffs, NJ, USA, 1981. [Google Scholar]
- Warren, W.H., Jr. Perceiving affordances: Visual guidance of stair climbing. J. Exp. Psychol. Hum. Percept. Perform. 1984, 10, 683–703. [Google Scholar] [CrossRef]
- Lavdas, A.A.; Salingaros, N.A. Architectural beauty: Developing a measurable and objective scale. Challenges 2022, 13, 56. [Google Scholar] [CrossRef]
- Lavdas, A.A.; Sussman, A. Applications of biometrics in architectural and environmental design. In Environmental Neuroscience; Springer: Cham, Switzerland, 2024; pp. 227–254. [Google Scholar]
- Higuera-Trujillo, J.L.; Llinares, C.; Macagno, E. The cognitive–emotional design and study of architectural space: A scoping review of neuroarchitecture and its precursor approaches. Sensors 2021, 21, 2193. [Google Scholar] [CrossRef]
- Wang, S.; de Oliveira, G.S.; Djebbara, Z.; Gramann, K. The embodiment of architectural experience: A methodological perspective on neuro-architecture. Front. Hum. Neurosci. 2022, 16, 833528. [Google Scholar] [CrossRef]
- Lee, M.A. Analysis of changes in the spatial characteristics of student hub spaces on university campuses—Focused on text mining techniques. J. Korea Inst. Spat. Des. 2025, 20, 819–832. [Google Scholar]
- Eom, S.C.; Lee, S.Y. State of study spaces for use of intermediate space in university campus. J. Korean Inst. Inter. Des. 2022, 31, 55–62. [Google Scholar] [CrossRef]
- Kim, J.S.; Jang, Y.E. The mediating effect of social belonging in the relationship between trust and life satisfaction among generation z university students. Stud. Humanit. Soc. Sci. 2025, 7, 1027–1040. [Google Scholar] [CrossRef]
- Jeong, Y.M.; Kim, T.R. The effects of college students’ sense of community on psychological well-being: The mediating effect of emotional intelligence. J. Converg. Cult. Technol. 2024, 10, 313–319. [Google Scholar]
- Choi, Y.H.; Sung, M.J. Students’ experience of a university and its influence on student–university relationships. Korean J. Advert. 2015, 16, 103–136. [Google Scholar] [CrossRef] [PubMed]
- Milgram, P.; Kishino, F. A taxonomy of mixed reality visual displays. IEICE Trans. Inf. Syst. 1994, 77, 1321–1329. [Google Scholar]
- Johnson–Glenberg, M.C. Immersive VR and education: Embodied design principles that include gesture and hand controls. Front. Robot. AI 2018, 5, 375272. [Google Scholar] [CrossRef]
- John, B.; Kurian, J.C.; Fitzgerald, R.; Goh, D.H.L. Students’ learning experience in a mixed reality environment: Drivers and barriers. Commun. Assoc. Inf. Syst. 2022, 50, 510–535. [Google Scholar] [CrossRef]
- Slater, M.; Wilbur, S. A framework for immersive virtual environments (FIVE): Speculations on the role of presence in virtual environments. Presence Teleoperators Virtual Environ. 1997, 6, 603–616. [Google Scholar] [CrossRef]
- Schuemie, M.J.; Van Der Straaten, P.; Krijn, M.; Van Der Mast, C.A. Research on presence in VR: A survey. Cyberpsychol. Behav. 2001, 4, 183–201. [Google Scholar] [CrossRef] [PubMed]
- Slater, M. Place illusion and plausibility can lead to realistic behaviour in immersive virtual environments. Philos. Trans. R. Soc. B Biol. Sci. 2009, 364, 3549–3557. [Google Scholar] [CrossRef]
- Rincon, E.; Rodriguez–Guidonet, I.; Andrade–Pino, P.; Monfort–Vinuesa, C. Mixed reality in undergraduate mental health education: A systematic review. Electronics 2023, 12, 1019. [Google Scholar] [CrossRef]
- Gerup, J.; Soerensen, C.B.; Dieckmann, P. Augmented reality and mixed reality for healthcare education beyond surgery: An integrative review. Int. J. Med. Educ. 2020, 11, 1–18. [Google Scholar] [CrossRef]
- Kim, W. A Study on the Relationship Between the Design of University Public Lounges and the Sense of Community—Focused on Mixed Reality (MR) Simulation. Master’s Thesis, Inha University, Incheon, Republic of Korea, February 2023. [Google Scholar]
- Kim, W.; Cho, M. Exploring Perceived Territoriality and Community Belongingness in University Lounge Design: A Mixed Reality Simulation Study. In Proceedings of the 14th International Symposium on Architectural Interchanges in Asia (ISAIA 2024), Kyoto University, Kyoto, Japan, 10–12 September 2024. [Google Scholar]
- Harris, P.B.; Brown, B.B. The home and identity display: Interpreting resident territoriality from home exteriors. J. Environ. Psychol. 1996, 16, 187–203. [Google Scholar] [CrossRef]
- Brown, G. Claiming a corner at work: Measuring employee territoriality in their workspaces. J. Environ. Psychol. 2009, 29, 44–52. [Google Scholar] [CrossRef]
- Haber, G.M. Territorial invasion in the classroom: Invadee response. Environ. Behav. 1980, 12, 17–31. [Google Scholar] [CrossRef]
- Kaya, N.; Burgess, B. Territoriality: Seat preferences in different types of classroom arrangements. Environ. Behav. 2007, 39, 859–876. [Google Scholar] [CrossRef]
- Chung, Y.M. User’s Perceptions of Territoriality in Residence Hall Rooms. Ph.D. Thesis, University of Minnesota, Minneapolis, MN, USA, January 2000. [Google Scholar]
- Khajehzadeh, I.; Vale, B. Shared student residential space: A post occupancy evaluation. J. Facil. Manag. 2016, 14, 102–124. [Google Scholar] [CrossRef]
- Abu–Ghazzeh, T.M. Communicating behavioral research to campus design: Factors affecting the perception and use of outdoor spaces at the University of Jordan. Environ. Behav. 1999, 31, 764–804. [Google Scholar] [CrossRef]
- O’Neill, M. Limitless learning creating adaptable environments to support a changing campus. Plann. High. Educ. 2013, 42, 11–27. [Google Scholar]
- McMillan, D.W.; Chavis, D.M. Sense of community: A definition and theory. J. Community Psychol. 1986, 14, 6–23. [Google Scholar] [CrossRef]
- Chipuer, H.M.; Pretty, G.M. A review of the sense of community index: Current uses, factor structure, reliability, and further development. J. Community Psychol. 1999, 27, 643–658. [Google Scholar] [CrossRef]
- Long, D.A.; Perkins, D.D. Confirmatory factor analysis of the sense of community index and development of a brief SCI. J. Community Psychol. 2003, 31, 279–296. [Google Scholar] [CrossRef]
- Obst, P.L.; White, K.M. Revisiting the sense of community index: A confirmatory factor analysis. J. Community Psychol. 2004, 32, 691–705. [Google Scholar] [CrossRef]
- Peterson, N.A.; Speer, P.W.; McMillan, D.W. Validation of a brief sense of community scale: Confirmation of the principal theory of sense of community. J. Community Psychol. 2008, 36, 61–73. [Google Scholar] [CrossRef]
- Peterson, N.; Speer, P.W.; Peterson, C.H.; Powell, K.G.; Treitler, P.; Wang, Y. Importance of auxiliary theories in research on university-community partnerships: The example of psychological sense of community. Collab. J. Community Based Res. Pract. 2017, 1, 5. [Google Scholar] [CrossRef]
- Loomis, C.; Wright, C. How many factors does the sense of community index assess? J. Community Psychol. 2018, 46, 383–396. [Google Scholar] [CrossRef]
- Cope, M.R.; Ward, C.; Jackson, J.E.; Muirbrook, K.A.; Andre, A.N. Taking another look at the sense of community index: Six confirmatory factor analyses. J. Community Psychol. 2020, 48, 1410–1423. [Google Scholar] [CrossRef]
- Chavis, D.M.; Hogge, J.H.; McMillan, D.W.; Wandersman, A. Sense of community through Brunswik’s lens: A first look. J. Community Psychol. 1986, 14, 24–40. [Google Scholar] [CrossRef]
- Chavis, D.M.; Pretty, G.M.H. Sense of community: Advances in measurement and application. J. Community Psychol. 1999, 27, 635–642. [Google Scholar] [CrossRef]
- Flaherty, J.; Zwick, R.R.; Bouchey, H.A. Revisiting the sense of community index: A confirmatory factor analysis and invariance test. J. Community Psychol. 2014, 42, 947–963. [Google Scholar] [CrossRef]
- Chavis, D.M.; Lee, K.S.; Acosta, J.D. The sense of community (SCI) revised: The reliability and validity of the SCI–2. In Proceedings of the 2nd International Community Psychology Conference, Lisboa, Portugal, 4–6 June 2008. [Google Scholar]
- Prezza, M.; Pacilli, M.G.; Barbaranelli, C.; Zampatti, E. The MTSOCS: A multidimensional sense of community scale for local communities. J. Community Psychol. 2009, 37, 305–326. [Google Scholar] [CrossRef]
- Park, H.; Lee, S. The influence of sense of school community on Korean students’ life satisfaction and comparison of sense of community for students’ gender and high school specialties. J. Res. Tech. Careers 2019, 3, 49. [Google Scholar] [CrossRef]
- Richard, M.C.; Lavoie, É.; Watters, B. Validation of the French-language version of the sense of community index-2. SAGE Open 2023, 13, 21582440231180131. [Google Scholar] [CrossRef]
- McClannon, T.W.; Cheney, A.W.; Bolt, L.L.; Terry, K.P. Predicting sense of presence and sense of community in immersive online learning environments. Online Learn. 2018, 22, 141–159. [Google Scholar] [CrossRef]
- Mannarini, T.; Rochira, A.; Talò, C. Negative psychological sense of community: Development of a measure and theoretical implications. J. Community Psychol. 2014, 42, 673–688. [Google Scholar] [CrossRef]
- Boyd, N.M.; Liu, X.; Horissian, K. Impact of community experiences on student retention perceptions and satisfaction in higher education. J. Coll. Stud. Retent. Res. Theory Pract. 2022, 24, 337–365. [Google Scholar] [CrossRef]
- Mendoza, P.; Suarez, J.D.; Bustamante, E. Sense of community in student retention at a tertiary technical institution in Bogotá: An ecological approach. Community Coll. Rev. 2016, 44, 286–314. [Google Scholar] [CrossRef]
- Andrade, M.S.; Miller, R.M.; McArthur, D.; Ogden, M. The impact of learning on student persistence in higher education. J. Coll. Stud. Retent. Res. Theory Pract. 2022, 24, 316–336. [Google Scholar] [CrossRef]
- Shouse, R. Academic press, sense of community, and student achievement. In Redesigning American Education; Section 4; Coleman, J., Schneider, B., Plank, S., Schiller, K., Wang, H., Eds.; Westview Press: Boulder, CO, USA, 2018; pp. 60–86. [Google Scholar]
- Wiseman, R.L.; Gonzales, S.M.; Salyer, K. A cross-cultural analysis of students’ sense of community, degree of involvement, and educational benefits. Intercult. Commun. Stud. 2004, 13, 173–189. [Google Scholar]
- Zhang, H.; Abbott, N.; Waldeck, D.; Holliman, A. Social interaction, sense of belonging, psychological well–being: A study of Chinese international students in UK higher education. Front. Educ. 2025, 10, 1677348. [Google Scholar] [CrossRef]
- Henry, S.K. Extending Our Understanding of Social Belonging: College Students’ Use of Technology, Psychosocial Well-Being, and Sense of Community in University Life. Ph.D. Thesis, University of San Diego, San Diego, CA, USA, May 2010. [Google Scholar]
- Noel–Elkins, A.; Forrester, S.; Elkins, D. Examining the relationship between students’ perceived sense of campus community and satisfaction with school life. Coll. Stud. Aff. J. 2019, 37, 28–38. [Google Scholar] [CrossRef]
- Drouin, M.A. The relationship between students’ perceived sense of community and satisfaction, achievement, and retention in an online course. Q. Rev. Distance Educ. 2008, 9, 267–284. [Google Scholar]
- Wong, W.H.; Chapman, E. Student satisfaction and interaction in higher education. High. Educ. 2023, 85, 957–978. [Google Scholar] [CrossRef] [PubMed]
- Strayhorn, T.L. College Students’ Sense of Belonging: A Key to Educational Success for All Students, 2nd ed.; Routledge: New York, NY, USA, 2018. [Google Scholar]
- Tholen, R.; Wouters, E.; Ponnet, K.; de Bruyn, S.; Van Hal, G. Academic stress, anxiety, and depression among Flemish first-year students: The mediating role of sense of belonging. J. Coll. Stud. Dev. 2022, 63, 200–217. [Google Scholar] [CrossRef]
- Masika, R.; Jones, J. Building student belonging and engagement: Insights into higher education students’ experiences of participating and learning together. Teach. High. Educ. 2016, 21, 138–150. [Google Scholar] [CrossRef]
- Vora, R.S.; Kinney, M.N. Connectedness, sense of community, and academic satisfaction in a novel community campus medical education model. Acad. Med. 2014, 89, 182–187. [Google Scholar] [CrossRef] [PubMed]
- Hausmann, L.R.; Ye, F.; Schofield, J.W.; Woods, R.L. Sense of belonging and persistence in White and African American first-year students. Res. High. Educ. 2009, 50, 649–669. [Google Scholar] [CrossRef]
- Mulrooney, H.M.; Kelly, A.F. The university campus and a sense of belonging: What do students think? New Dir. Teach. Nat. Sci. 2020, 15, 3590. [Google Scholar] [CrossRef]
- Negm, H.; Taha, D.; Saadallah, M. The Effect of the Physical Environment on Social Interaction: The Case of Educational Campuses. In SHAPING URBAN CHANGE–Livable City Regions for the 21st Century, Proceedings of the REAL CORP 2020, 25th International Conference on Urban Development, Regional Planning and Information Society, Aachen, Germany, 15–18 September 2020; CORP–Competence Center of Urban and Regional Planning: Vienna, Austria, 2020. [Google Scholar]
- Lee, S.Y.; Lee, M. Characteristics of campus space for interdisciplinary convergence education: Focused on case study of design colleges. J. Korean Inst. Inter. Des. 2021, 30, 56–66. [Google Scholar] [CrossRef]
- Jeon, J. A study on the liberal arts education system and major free choice system of domestic national and public universities. Soc. Cult. Conv. 2023, 45, 153–173. [Google Scholar]
- Nelson, C. Affiliation and change. In Affiliations: Identity in Academic Culture; Di Leo, J.R., Ed.; University of Nebraska Press: Lincoln, NE, USA, 2003; pp. 209–225. [Google Scholar]
- Wefald, A.J.; Ramirez, J.M. Exploring liminal and dominant spaces in interdisciplinary programs: Fostering community as through relationship-focused practices and collective leadership. J. Leadersh. Stud. 2024, 18, 59–66. [Google Scholar] [CrossRef]
- Rietveld, E.; Kiverstein, J. A rich landscape of affordances. Ecol. Psychol. 2014, 26, 325–352. [Google Scholar] [CrossRef]
- Warren, W.H., Jr.; Whang, S. Visual guidance of walking through apertures: Body-scaled information for affordances. Exp. Psychol. Hum. Percept. Perform. 1987, 13, 371–383. [Google Scholar] [CrossRef]
- Franchak, J.M.; Adolph, K.E. Affordances as probabilistic functions: Implications for development, perception, and decisions for action. Ecol. Psychol. 2014, 26, 109–124. [Google Scholar] [CrossRef]
- Djebbara, Z.; Fich, L.B.; Petrini, L.; Gramann, K. Sensorimotor brain dynamics reflect architectural affordances. Proc. Natl. Acad. Sci. USA 2019, 116, 14769–14777. [Google Scholar] [CrossRef] [PubMed]
- Djebbara, Z.; Fich, L.B.; Gramann, K. The brain dynamics of architectural affordances during transition. Sci. Rep. 2021, 11, 82504. [Google Scholar] [CrossRef] [PubMed]
- Bærentzen, J.; Frisvad, J.; Singh, K. Signifier-based immersive and interactive 3D modeling. In Proceedings of the SIGGRAPH Asia 2019 Posters, Brisbane, Australia, 17–20 November 2019; ACM: New York, NY, USA, 2019; pp. 1–5. [Google Scholar]
- Vartanian, O.; Navarrete, G.; Chatterjee, A.; Fich, L.B.; Leder, H.; Nadal, M.; Rostrup, N.; Skov, M.; Corradi, G. Impact of contour on aesthetic judgments and approach–avoidance decisions in architecture. Proc. Natl. Acad. Sci. USA 2013, 110 (Suppl. S2), S10446–S10453. [Google Scholar] [CrossRef]
- Vartanian, O.; Navarrete, G.; Chatterjee, A.; Fich, L.B.; Leder, H.; Nadal, M.; Rostrup, N.; Skov, M. Preference for openness in architectural design: Evidence from behavioral and fMRI studies. Front. Hum. Neurosci. 2015, 9, 151. [Google Scholar]
- Fich, L.B.; Jönsson, P.; Kirkegaard, P.H.; Wallergård, M.; Garde, A.H.; Hansen, Å. Can architectural design alter the stress response? J. Environ. Psychol. 2014, 38, 31–40. [Google Scholar]
- Shemesh, A.; Leisman, G.; Bar, M.; Grobman, Y.J. A neurocognitive study of the emotional impact of geometrical criteria of architectural space. Archit. Sci. Rev. 2021, 64, 394–407. [Google Scholar] [CrossRef]
- Coburn, A.; Vartanian, O.; Kenett, Y.N.; Nadal, M.; Hartung, F.; Hayn-Leichsenring, G.; Navarrete, G.; González-Mora, J.L.; Chatterjee, A. Psychological and neural responses to architectural interiors. Cortex 2020, 126, 217–241. [Google Scholar] [CrossRef]
- Gramann, K.; Jung, T.-P.; Ferris, D.P.; Lin, C.-T.; Makeig, S.; Gwin, J.T. Toward a new cognitive Neurosci.: Mobile brain/body imaging and the future of real-world Neurosci. NeuroImage 2021, 224, 117479. [Google Scholar]
- Pektaş, Ş.T. A scientometric analysis and review of spatial cognition studies within the framework of Neurosci. and architecture. Archit. Sci. Rev. 2021, 64, 374–382. [Google Scholar] [CrossRef]
- Taherysayah, F.; Westermann, C.; Liang, H.N. Learning from Neurosci.: Integrating users in design processes using brain imaging tools and virtual reality. Intell. Build. Int. 2025, 17, 13–27. [Google Scholar] [CrossRef]
- Dehan, J.I.A.; Li, W.; Wang, X.; Xia, G.; Yu, L. Color matters: Investigating stress recovery in VR-simulated interior environments using fNIRS and anxiety measures. Build. Environ. 2025, 285, 113609. [Google Scholar]
- Wang, X.; Schnabel, M.A. (Eds.) Mixed Reality in Architecture, Design, and Construction; Springer: Berlin/Heidelberg, Germany, 2008. [Google Scholar]
- Alexander, C.; Ishikawa, S.; Silverstein, M. A Pattern Language: Towns, Buildings, Construction; Oxford University Press: New York, NY, USA, 1977. [Google Scholar]
- Stamps, A.E. Effects of permeability on perceived enclosure and spaciousness. Environ. Behav. 2010, 42, 864–886. [Google Scholar] [CrossRef]
- Kim, J.; de Dear, R. Workspace satisfaction: The privacy–communication trade-off in open-plan offices. J. Environ. Psychol. 2013, 36, 18–26. [Google Scholar] [CrossRef]
- Bernstein, E.S.; Turban, S. The impact of the ‘open’ workspace on human collaboration. Philos. Trans. R. Soc. B 2018, 373, 20170239. [Google Scholar] [CrossRef]
- Yıldırım, K.; Güneş, E.; Yılmaz, G.P. The effects of workstation partition heights on employees’ perceptions in open-plan offices. J. Corp. Real Estate 2019, 21, 148–166. [Google Scholar] [CrossRef]
- Roo, J.S.; Hachet, M. One Reality: Augmenting How the Physical World is Experienced by Combining Multiple Mixed Reality Modalities. In Proceedings of the UIST 2017 30th ACM Symposium on User Interface Software and Technology, Quebec City, QC, Canada, 22–25 October 2017. [Google Scholar]
- Milgram, P.; Colquhoun, H. A Taxonomy of Real and Virtual World Display Integration. In Mixed Reality Merging Real and Virtual Worlds; Ohta, Y., Tamura, H., Eds.; Springer: Tokyo, Japan, 1999; pp. 1–26. [Google Scholar]
- Pérez–Muñoz, S.; Castaño Calle, R.; Morales Campo, P.T.; Rodríguez–Cayetano, A. A systematic review of the use and effect of virtual reality, augmented reality and mixed reality in physical education. Information 2024, 15, 582. [Google Scholar] [CrossRef]
- Long, J.W.; Masters, B.; Sajjadi, P.; Simons, C.; Masterson, T.D. The development of an immersive mixed-reality application to improve the ecological validity of eating and sensory behavior research. Front. Nutr. 2023, 10, 1170311. [Google Scholar] [CrossRef]
- Lee, C.; Rincon, G.A.; Meyer, G.; Höllerer, T.; Bowman, D.A. The effects of visual realism on search tasks in mixed reality simulation. IEEE Trans. Vis. Comput. Graph. 2013, 19, 547–556. [Google Scholar] [CrossRef]
- Shin, M.; Sibuea, R.; Lee, H. A comparative study examining the effects of mixed and virtual reality on plausibility illusion and emotional states. J. Media Psychol. 2024, 36, 281–290. [Google Scholar] [CrossRef]
- Microsoft Corporation. Microsoft HoloLens 2; Microsoft: Redmond, WA, USA, 2019–2025. Available online: https://learn.microsoft.com/ (accessed on 30 November 2022).
- Prabhakaran, B.; Guo, H.J. Hololens 2 Technical Evaluation As Mixed Reality Guide. In Proceedings of the International Conference on Human-Computer Interaction, Washington, DC, USA, 29 June–4 July 2024; Springer Nature: Cham, Switzerland, 2024; pp. 145–165. [Google Scholar]
- Palumbo, A. Microsoft HoloLens 2 in medical and healthcare context: State of the art and future prospects. Sensors 2022, 22, 7709. [Google Scholar] [CrossRef] [PubMed]
- Guajardo–Cuéllar, A.; Corona–Echauri, R.; Meza–Flores, R.A.; Vázquez, C.R.; Rodríguez–Arreola, A.; Navarro–Gutiérrez, M. Mixed reality laboratory for teaching control concepts: Design, validation, and implementation. Educ. Sci. 2025, 15, 883. [Google Scholar] [CrossRef]
- Huang, Y. Evaluating mixed reality technology for architectural design and construction layout. J. Civ. Eng. Constr. Technol. 2020, 11, 1–12. [Google Scholar] [CrossRef]
- Banjar, A.; Campbell, A.G. Work–in–Progress—Design of Mixed Reality Educational Applications Using Enhanced ARCS+ G Model for Motivation. In Proceedings of the 2022 8th International Conference of the Immersive Learning Research Network (iLRN), Vienna, Austria, 30 May–4 June 2022; pp. 1–3. [Google Scholar] [CrossRef]
- Banjar, A.; Xu, X.; Iqbal, M.Z.; Campbell, A. A systematic review of the experimental studies on the effectiveness of mixed reality in higher education between 2017 and 2021. Comput. Educ. X Real. 2023, 3, 100034. [Google Scholar] [CrossRef]
- Hauze, S.; Marshall, J. Validation of The Instructional Materials Motivation Survey: Measuring Student Motivation to Learn Via Mixed Reality Nursing Education Simulation. In Proceedings of the E-Learn: World Conference on E-Learning in Corporate, Government, Healthcare, and Higher Education, Las Vegas, NV, USA, 15 October 2018; pp. 576–586. [Google Scholar]
- Hasanzadeh, S.; Polys, N.F.; De La Garza, J.M. Presence, mixed reality, and risk-taking behavior: A study in safety interventions. IEEE Trans. Vis. Comput. Graph. 2020, 26, 2115–2125. [Google Scholar] [CrossRef]
- Eng, K.; Mintz, M.; Delbrück, T.; Douglas, R.J.; Whatley, A.M.; Manzolli, J.; Verschure, P.F.J. An investigation of collective human behavior in large-scale mixed reality spaces. Presence Teleoperators Virtual Environ. 2006, 15, 403–418. [Google Scholar] [CrossRef]
- Bhavadharini, B.; Monica, V.; Anbarasan, R.; Mahendran, R. Virtual, augmented, and mixed reality as a versatile tool in food consumer behavior evaluation: Recent advances in aroma, taste, and texture incorporation. Compr. Rev. Food Sci. Food Saf. 2023, 22, 4925–4956. [Google Scholar] [CrossRef]
- Minsky, M. Telepresence. Omni 1980, 2, 45–52. Available online: http://web.media.mit.edu/minsky/papers/Telepresence.html (accessed on 30 August 2025).
- Skarbez, R.; Brooks, F.P., Jr.; Whitton, M.C. A survey of presence and related concepts. ACM Comput. Surv. 2017, 50, 1–39. [Google Scholar] [CrossRef]
- Skarbez, R.; Brooks, F.P., Jr.; Whitton, M.C. Immersion and Coherence in a Stressful Virtual Environment. In Proceedings of the 24th ACM Symposium on Virtual Reality Software and Technology, Tokyo, Japan, 28 November–1 December 2018; pp. 1–11. [Google Scholar]
- Wienrich, C.; Komma, P.; Vogt, S.; Latoschik, M.E. Spatial presence in mixed realities–considerations about the concept, measures, design, and experiments. Front. Virtual Real. 2021, 2, 694315. [Google Scholar] [CrossRef]
- Lombard, M.; Ditton, T. At the heart of it all: The concept of presence. J. Comput. Mediat. Commun. 1997, 3, JCMC321. [Google Scholar] [CrossRef]
- Slater, M.; Lotto, B.; Arnold, M.M.; Sanchez–Vives, M.V. How we experience immersive virtual environments: The concept of presence and its measurement. An. Psicol. 2009, 40, 193–210. [Google Scholar]
- Witmer, B.G.; Singer, M.J. Measuring presence in virtual environments: A presence questionnaire. Presence Teleoperators Virtual Environ. 1998, 7, 225–240. [Google Scholar] [CrossRef]
- Schubert, T.W.; Friedmann, F.; Regenbrecht, H.T. Decomposing the Sense of Presence: Factor Analytic Insights. In Proceedings of the 2nd International Workshop on Presence, Colchester, UK, 6–7 April 1999. [Google Scholar]
- Lessiter, J.; Freeman, J.; Keogh, E.; Davidoff, J. Development of a New Cross-media Presence Questionnaire: The ITC-sense of Presence Inventory. In Proceedings of the Presence, Delft, The Netherlands, 27–28 March 2000. [Google Scholar]
- Slater, M.; Usoh, M.; Steed, A. Depth of presence in virtual Environments. Presence Teleoperators Virtual Environ. 1994, 3, 130–144. [Google Scholar] [CrossRef]
- Usoh, M.; Catena, E.; Arman, S.; Slater, M. Using presence questionnaires in reality. Presence Teleoperators Virtual Environ. 2000, 9, 497–503. [Google Scholar] [CrossRef]
- Tran, T.Q.; Langlotz, T.; Regenbrecht, H. A Survey on Measuring Presence in Mixed Reality. In Proceedings of the 2024 CHI Conference on Human Factors in Computing Systems, Honolulu, HI, USA, 11–16 May 2024; pp. 1–38. [Google Scholar]
- Chandio, Y.; Interrante, V.; Anwar, F.M. Tap into reality: Understanding the impact of interactions on presence and reaction time in mixed reality. IEEE Trans. Vis. Comput. Graph. 2025, 31, 2567–2667. [Google Scholar] [CrossRef]
- Unity Technologies. Unity, Version 2022.2.10f1; Unity Technologies: San Francisco, CA, USA, 2022. Available online: https://unity.com (accessed on 1 November 2022).
- Lee, H.; Je, S.; Kim, R. Partitioning open–plan workspaces via augmented reality. Pers. Ubiquit. Comput. 2022, 26, 609–624. [Google Scholar] [CrossRef]
- Ouedraogo, I.; Nguyen, H.; Bourdot, P. Where to draw the line: Physical space partitioning and view privacy in AR-based co-located collaboration for immersive analytics. In Proceedings of the 2024 ACM Symposium on Spatial User Interaction, Trier, Germany, 7–8 October 2024. [Google Scholar]
- Banks, J.; Bowman, N.D. Symbolism, purpose, identity, relation, emotion: Unpacking the SPIREs of sense of place across digital and physical spaces. Poetics 2024, 105, 101916. [Google Scholar] [CrossRef]
- Relph, E. Spirit of place and sense of place in virtual realities. Techné Res. Philos. Technol. 2007, 10, 17–25. [Google Scholar] [CrossRef]
- Turner, P.; Turner, S. Place, sense of place, and presence. Presence Teleoperators Virtual Environ. 2006, 15, 204–217. [Google Scholar] [CrossRef]
- Park, S.C.; Cho, J.I.; Choi, H.J.; Noh, G.C.; Chung, T.H.; Park, H.W.; Go, I.R. Development of Design Quality Indicator for the Korean Educational Buildings; Korean Education Development Institute: Seoul, Republic of Korea, 2011. [Google Scholar]
- Abu–Obeid, N.N.; Ibrahim, A.F. The effect of dormitory type and room view on the perception of privacy and territoriality by female residents. Archit. Sci. Rev. 2002, 45, 231–241. [Google Scholar] [CrossRef]
- Abu–Obeid, N.; Al–Homoud, M. Sense of privacy and territoriality as a function of spatial layout in university public spaces. Archit. Sci. Rev. 2000, 43, 211–220. [Google Scholar] [CrossRef]
- Westermeier, F.; Brübach, L.; Latoschik, M.E.; Wienrich, C. Exploring plausibility and presence in mixed reality experiences. IEEE Trans. Vis. Comput. Graph. 2023, 29, 2680–2689. [Google Scholar] [CrossRef]
- Chandio, Y.; Bashir, N.; Interrante, V.; Anwar, F.M. Investigating the correlation between presence and reaction time in mixed reality. IEEE Trans. Vis. Comput. Graph. 2024, 30, 5976–5992. [Google Scholar] [CrossRef] [PubMed]
- Chandio, Y.; Interrante, V.; Anwar, F.M. Reaction time as a proxy for presence in mixed reality with distraction. IEEE Trans. Vis. Comput. Graph. 2025, 31, 3140–3150. [Google Scholar] [CrossRef]
- Schwind, V.; Knierim, P.; Haas, N.; Henze, N. Using presence questionnaires in virtual reality. In Proceedings of the 2019 CHI Conference on Human Factors in Computing Systems, Glasgow, Scotland, UK 4–9 May 2019; pp. 1–12. [Google Scholar]
- Costa, M. Territorial behavior in public settings. Environ. Behav. 2012, 44, 713–721. [Google Scholar] [CrossRef]
- İmamoğlu, Ç.; Gürel, M.Ö. “Good fences make good neighbors”: Territorial dividers increase user satisfaction and efficiency in library study spaces. J. Acad. Librariansh. 2016, 42, 65–73. [Google Scholar] [CrossRef]
- Karimifard, L.; Tabatabaei Malazi, F. Physical factors influencing place identity in higher education environments (case study: Islamic Azad University South Tehran Branch). Space Ontol. Int. J. 2017, 6, 55–68. [Google Scholar]
- Killeen, J.P.; Evans, G.W.; Danko, S. The role of permanent student artwork in students’ sense of ownership in an elementary school. Environ. Behav. 2003, 35, 250–263. [Google Scholar] [CrossRef]
- Gasparini, A. Community and territorial belonging. Comp. Sociol. 2010, 9, 433–462. [Google Scholar] [CrossRef]
- Kim, W.P. Effects of crime prevention through environmental design on the formation of sense of community through social interaction among students in a university campus. Crime Prev. Community Saf. 2018, 9, 281–298. [Google Scholar] [CrossRef]
- Reilly, A. Familiar Faces and Comfortable Spaces: The Role of the College Union in Fostering Sense of Belonging on a College Campus. Ph.D. Thesis, West Chester University, West Chester, PA, USA, May 2023. Available online: https://digitalcommons.wcupa.edu/all_doctoral/194 (accessed on 17 September 2025).
- Askarizad, R.; Rezaei Liapee, S.; Mohajer, M. The role of sense of belonging to the architectural symbolic elements on promoting social participation in students within educational settings. Space Ontol. Int. J. 2021, 10, 1–18. [Google Scholar]
- Lewicka, M. On the varieties of people’s relationships with places: Hummon’s typology revisited. Environ. Behav. 2011, 43, 676–709. [Google Scholar] [CrossRef]
- Samura, M. Understanding campus spaces to improve student belonging. About Campus 2018, 23, 19–23. [Google Scholar] [CrossRef]
- Al–Homoud, M.; Abu–Obeid, N. University outdoor spatial layout effect on perception of students’ interaction and group seclusion. J. Archit. Plan. Res. 2003, 20, 221–233. [Google Scholar]
- Stedman, R.C. Is it really just a social construction? The contribution of the physical environment to sense of place. Soc. Nat. Resour. 2003, 16, 671–685. [Google Scholar] [CrossRef]
- Topilla, L. Art, murals, and student engagement in the transformation of educational environments. Archit. Image Stud. 2025, 6, 158–171. [Google Scholar]
- Greenbaum, P.E.; Greenbaum, S.D. Territorial personalization: Group identity and social interaction in a Slavic–American neighborhood. Environ. Behav. 1981, 13, 574–589. [Google Scholar] [CrossRef]
- Mehaffy, M.W.; Salingaros, N.A.; Lavdas, A.A. The “modern” campus: Case study in (Un) Sustainable urbanism. Sustainability 2023, 15, 16427. [Google Scholar] [CrossRef]
- Papadopoulos, T.; Evangelidis, K.; Kaskalis, T.H.; Evangelidis, G.; Sylaiou, S. Interactions in augmented and mixed reality: An overview. Appl. Sci. 2021, 11, 8752. [Google Scholar] [CrossRef]
- Latochik, M.E.; Wienrich, C. Congruence and plausibility, not presence: Pivotal conditions for XR experiences and effects, a novel approach. Front. Virtual Real. 2022, 3, 694433. [Google Scholar] [CrossRef]
- Wagner, I.; Broll, W.; Jacucci, G.; Kuutii, K.; McCall, R.; Morrison, A.; Schmalstieg, D.; Terrin, J.J. On the role of presence in mixed reality. Presence Teleoperators Virtual Environ. 2009, 18, 249–276. [Google Scholar] [CrossRef]


Disclaimer/Publisher’s Note: The statements, opinions and data contained in all publications are solely those of the individual author(s) and contributor(s) and not of MDPI and/or the editor(s). MDPI and/or the editor(s) disclaim responsibility for any injury to people or property resulting from any ideas, methods, instructions or products referred to in the content. |
© 2025 by the authors. Licensee MDPI, Basel, Switzerland. This article is an open access article distributed under the terms and conditions of the Creative Commons Attribution (CC BY) license (https://creativecommons.org/licenses/by/4.0/).