Abstract
To evaluate the seismic resilience and post-earthquake sustainability of long-span deck-type reinforced concrete arch bridges, this paper constructs a seismic resilience assessment framework based on seismic vulnerability theory, utilizing post-earthquake functional loss and recovery functions. A post-earthquake sustainability evaluation method is further developed using social and environmental indicators. Taking Shatuo Bridge as an engineering case study, the seismic vulnerability, seismic resilience, and post-earthquake sustainability are evaluated. The influences of functional recovery functions and the rise-to-span ratio on seismic resilience are compared and analyzed. The results show that under the same Peak Ground Acceleration (PGA), the seismic vulnerability of the system is greater than that of individual components, and the vulnerability of bearings is greater than that of the main arch ring and columns. The seismic resilience of reinforced concrete arch bridges decreases with increasing PGA, showing a trend that is initially rapid and then slows down. The exponential functional recovery function yields the highest seismic resilience, followed by the linear function, and the triangular function yields the lowest. The resilience obtained by the improved method lies between that of the exponential and triangular functions, consistent with the failure pattern of arch bridges, providing preliminary insights and a methodological reference for seismic resilience assessment. The rise-to-span ratio significantly affects the seismic resilience of deck-type reinforced concrete arch bridges, with a ratio of 1/6 yielding the highest resilience, followed by 1/7, 1/5, 1/8, and 1/4. Under seismic action, the environmental cost caused by damage to the main arch ring is significantly greater than that caused by damage to columns and bearings, and the environmental cost due to column damage is greater than that due to bearing damage. Post-earthquake time loss is primarily controlled by damage to the main arch ring. It is acknowledged that the findings are subject to limitations, including model simplifications and the use of idealized recovery functions, as discussed in the full paper.
1. Introduction
The southwestern region of China features complex topography and significant terrain variations. Reinforced concrete arch bridges are widely used in this area due to their strong spanning capacity, excellent mechanical performance, and esthetic appeal [,]. As one of the most severe natural disasters, earthquakes can cause extensive damage to the load-bearing capacity and normal serviceability of bridge structures, severely disrupting transportation networks and hindering post-disaster emergency response and relief efforts [,]. Therefore, analyzing the seismic performance of reinforced concrete arch bridges in southwestern China is of great importance.
Currently, domestic researchers have conducted extensive studies on the seismic performance of arch bridges and achieved significant results [,,,]. Based on the analysis of seismic vulnerability, Xu et al. [] proposed a seismic risk assessment method for long-span concrete-filled steel tube arch bridges from a risk perspective. They established a finite element model of a long-span concrete-filled steel tube (CFST) arch bridge to analyze the seismic vulnerability of its components and system. Based on the incremental dynamic analysis method, Yazdani et al. [] selected 28 near-field seismic records and conducted a nonlinear dynamic analysis of the arch bridge under the action of near-field vibration. Lei Tisheng et al. [] considered the scour effect during long-term service and analyzed the seismic vulnerability of pile foundations in reinforced concrete arch bridges using IDA. Based on machine learning theory, Kazemi F et al. [] derived the seismic vulnerability curve of reinforced concrete structures. The prediction results can be combined with the considered hazard curve for the seismic hazard assessment of reinforced concrete buildings. Most of these studies are based on vulnerability theory. While seismic vulnerability effectively describes the extent of structural damage under seismic action, managers are more concerned with the rapid restoration of normal operation after an earthquake. Seismic resilience effectively characterizes both the seismic capacity and post-earthquake recovery capability of bridges.
Regarding research on seismic resilience of bridges [,,], Wu et al. [] established finite element time-varying models of cross-sea cable-stayed Bridges under different service lives and analyzed the variation laws of seismic vulnerability and resilience of cross-sea cable-stayed Bridges under the combined effects of corrosion and erosion over time. Mata et al. [] conducted nonlinear dynamic simulations of simply supported beam Bridges using OpenSees, combined with soil–structure interaction effects to capture the real response behavior, established brittleness curves under various damage states, and applied an elastic evaluation framework to quantify functional loss and recovery time. Yang Guojun et al. [] considered chloride ion erosion during long-term service and analyzed the time-varying seismic resilience of RC piers. However, most of these studies focus on girder bridges, with limited research on the seismic resilience of long-span deck-type reinforced concrete arch bridges. Meanwhile, sustainability assessment can effectively reflect the environmental and social impacts of post-earthquake bridge damage [].
To address these gaps, this paper proposes a novel integrated framework for assessing the seismic resilience and post-earthquake sustainability of long-span deck-type reinforced concrete arch bridges. The key innovations include:
- (1)
- An improved resilience assessment method that incorporates multiple functional recovery patterns (exponential, linear, triangular) and a weighted composite approach based on damage probability, providing a more realistic representation of the restoration process;
- (2)
- The integration of environmental and social sustainability indicators into the post-earthquake evaluation, enabling a comprehensive impact assessment;
- (3)
- A systematic investigation into the influence of the rise-to-span ratio on seismic resilience, offering practical insights for the design of such bridges in seismic-prone regions.
Using Shatuo Bridge as an illustrative case study, this paper evaluates its seismic vulnerability, resilience, and sustainability, and analyzes the effects of different recovery functions and rise-to-span ratios on resilience outcomes. This application serves to demonstrate the proposed framework and provide initial insights into the seismic performance of this bridge typology. The results provide insights for the seismic design and recovery planning of such bridges.
2. Seismic Resilience Assessment Method
2.1. Definition of Resilience
Seismic resilience refers to the ability of a structure to maintain functionality and restore target performance after being subjected to seismic action. It is an important indicator for evaluating the seismic performance of structures. Structural seismic resilience is typically assessed based on seismic vulnerability, functional loss functions, and functional recovery functions, as illustrated in Figure 1. The resilience index R is defined as follows:
where t0 and t2 are the start time of the earthquake and the time when bridge repair is completed, respectively; Q is the functionality function of the bridge during the recovery period, as given by Equation (2):
where t1 is the time when bridge repair begins; L(IM) and frec(t, t1, t2−t1) are the post-earthquake functional loss function and recovery function, respectively, with IM being the seismic intensity measure; H(x)is the Heaviside step function, where H(x) = 1 when x ≥ 0, H(x) = 0 when x < 0.
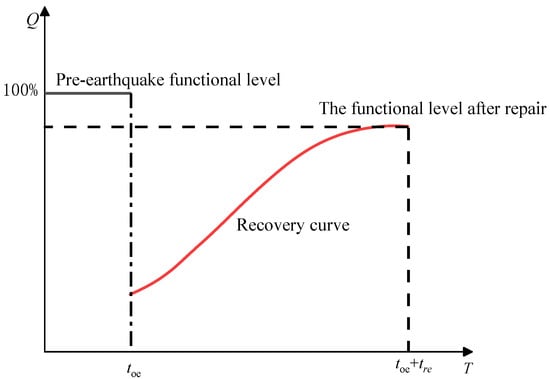
Figure 1.
Seismic toughness of structure.
2.2. Post-Earthquake Functional Loss Function
To accurately quantify the functional loss of a bridge after an earthquake, this paper uses a damage index (DI) to represent the extent of loss under different intensity levels. The damage index is defined as the sum of the products of the probability of each damage state and its corresponding functionality loss ratio, as shown in Equation (3):
where Li is the functionality loss ratio under damage state i, as listed in Table 1 []; PDSi is the damage probability function under damage state i.

Table 1.
Structural function loss ratio.
The damage probability function can be calculated based on the exceedance probability from seismic vulnerability analysis, as given by Equation (4):
where Pf is the exceedance probability of seismic vulnerability.
For the exceedance probability, this paper uses the Incremental Dynamic Analysis (IDA) method [], with the calculation formula as follows:
where µc and µd are the structural resistance and seismic demand, respectively; βc and βd are the logarithmic standard deviations of structural resistance and seismic demand, respectively. Considering that the peak ground acceleration (PGA) is highly correlated with China’s seismic code and PGA can be obtained relatively easily, this paper selects PGA as the seismic motion intensity index, at which point .
2.3. Functional Recovery Function
The functional recovery function describes the repair method and progress during the recovery phase after an earthquake, representing the restorability of the bridge structure. Due to numerous influencing factors during repair, such as maintenance costs, methods, and personnel allocation, the functional recovery function is complex. Based on the work of Cimellaro et al. [], this paper uses three types of functional recovery functions—exponential, linear, and triangular—to represent rapid repair, constant-speed repair, and slow-then-fast repair strategies, respectively. The schematic diagrams of these three functions are shown in Figure 2, and their expressions are given by Equations (6)–(8):
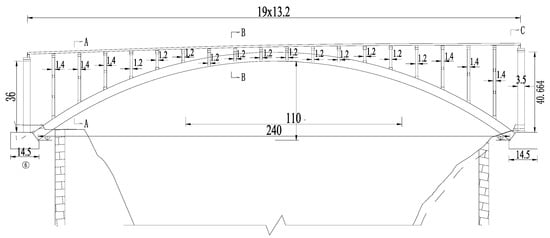
Figure 2.
Elevation of Shatuo Bridge (unit: m).
The total time required for repair can be expressed as:
where ti is the time required to repair damage state.
Since using a single recovery function may lead to biased results in assessing the seismic resilience of reinforced concrete arch bridges, this paper refers to existing research and proposes an improved method based on damage probability [], as given by Equation (10). This improved method does not introduce a new physical recovery curve but rather calculates a composite resilience index. It weights the resilience outcomes from the three idealized functions (Ri) by the probability of the system being in each corresponding damage state (Pfi). This approach aims to provide a more balanced assessment that accounts for the uncertainty in which recovery scenario will be enacted, as it depends on the actual seismic damage incurred.
where Ri is the seismic resilience obtained using the i-th functional recovery function.
2.4. Damage State Definitions for Deck-Type Reinforced Concrete Arch Bridges
Damage indices are essential tools for quantifying the state of structures or components and play a crucial role in assessing the seismic performance of bridges. Based on the seismic damage characteristics of long-span deck-type reinforced concrete arch bridges, this paper considers three types of component damage: the main arch ring, bearings, and columns. As the main reinforced concrete load-bearing components, the damage states of the main arch ring and columns are defined using strain ε, following existing research []. Bearings are highly susceptible to damage during earthquakes (e.g., unseating, falling off, or beam dropping), so displacement d is used to describe their damage states. The specific damage state classifications are shown in Table 2.

Table 2.
Damage state classification of members of upper bearing reinforced concrete arch bridge [].
3. Post-Earthquake Sustainability Assessment
Sustainability assessment comprehensively analyzes the social and environmental impacts of post-earthquake bridge repair, aiding in the selection of economical and environmentally friendly repair or reconstruction plans. Bridge sustainability indicators can be measured using social and environmental metrics.
3.1. Post-Earthquake Social Indicator Analysis
Bridges suffer varying degrees of damage after an earthquake. Under minor earthquakes, the closure of partial lanes during repair reduces bridge capacity, leading to increased vehicle travel time. The resulting time loss can be expressed as:
where i is the damage state; d is the post-earthquake bridge repair time; ADE is the number of vehicles passing the bridge at reduced speed; SO and SD are the normal speed and speed under traffic control, respectively; l is the length of the traffic control zone.
Under severe seismic damage, damaged bridges often become impassable, forcing vehicles to detour. The time loss due to detouring can be expressed as []:
where S is the average detour speed; ADD is the average daily traffic requiring detour during repair; D is the detour distance.
For ADE and ADD, this paper refers to existing research to determine their proportions of total traffic. Based on field data from the case study bridge, the daily traffic volume is taken as 5000 vehicles per day as a representative fixed value for this demonstration, as detailed in Table 3. It is recognized that actual traffic volumes can be variable, and the use of fixed values here is to illustrate the application of the proposed social impact metric within the assessment framework.

Table 3.
Traffic volume allocation for the case study deck-type reinforced concrete arch bridge.
3.2. Post-Earthquake Environmental Indicator Analysis
After an earthquake, the reduced traffic capacity of bridges leads to congestion, causing some vehicles to detour. Therefore, as an initial and focused metric for the use-phase environmental impact, this analysis primarily considers the increase in CO2 emissions due to vehicle detours. This provides a direct, quantifiable link between seismic damage, traffic disruption, and environmental consequences. The environmental cost is calculated as:
where ENDT is the post-earthquake environmental cost; End,c is the CO2 emission per kilometer for cars, typically taken as0.3 kg/km; End,t is the CO2 emission per kilometer for trucks, taken as 0.6 kg/km; cEnv is the cost value of CO2 emissions, taken as 68 RMB/ton based on forecasts from China’s carbon trading network; T is the vehicle composition ratio.
The use of these reference values ensures consistency and facilitates comparison with other studies, though localized factors may cause variation.
4. Engineering Case Analysis
4.1. Project Overview and Finite Element Model Establishment
This paper uses Shatuo Bridge in Yanhe County, Guizhou Province, as the engineering case. It is a deck-type reinforced concrete arch bridge. The main arch ring is a constant-height catenary reinforced concrete box section with a clear span of 240 m, a clear rise of 40 m, and a rise-to-span ratio of 1/6. The arch axis coefficient m is 1.85, the calculated span is 242.7 m, and the calculated rise is 40.45 m. The main arch ring, main girder, and piers are constructed using C60, C50, and C30 concrete, with corresponding elastic moduli of 30.0 GPa, 34.5 GPa, and 36.0 GPa, respectively, and a Poisson’s ratio of 0.2 for all concrete types. HRB400-grade steel reinforcement is employed, which has a Poisson’s ratio of 0.3. The box section is 10 m wide and 4.5 m high. The elevation of Shatuo Bridge is shown in Figure 2.
The finite element model of Shatuo Bridge is established using ANSYS(v19.2), as shown in Figure 3. The main arch ring was modeled using Solid65 solid elements, which are capable of simulating the nonlinear behavior of reinforced concrete, including cracking in three orthogonal directions and crushing. The constitutive model for concrete was based on the William–Warnke failure criterion. The material model for the reinforcing steel, embedded within the Solid65 elements via the real constant definition, was idealized as a bilinear kinematic hardening material. Diaphragm plates were simulated using equivalent loads. Since solid elements are not convenient for applying concentrated forces and moments, Mass21 mass elements were set at positions corresponding to each diaphragm plate to serve as loading nodes for applying equivalent loads. The bearings were simulated using Combin14 spring–damper elements to represent their translational and rotational stiffness characteristics. A linear elastic material model was assigned to these spring elements, with stiffness values determined from bearing design specifications.

Figure 3.
Finite element model of Shatuo Bridge.
Meshing Strategy: A mesh sensitivity analysis was conducted to determine the appropriate element size, ensuring result accuracy while maintaining computational efficiency. The global element size was set to 0.5 m for the main arch ring. Finer meshing was applied at the arch springings and connections with columns, where stress concentrations are expected.
Convergence Checks: The convergence of the model was verified by comparing key output parameters (fundamental frequency and displacement under static load) with those obtained from models with finer meshes (element sizes of 0.3 m and 0.4 m). The differences were found to be less than 2%, confirming that the chosen mesh size of 0.5 m provides sufficiently accurate results.
Damping Assumptions: Rayleigh damping was adopted for the dynamic analysis, with a damping ratio of 5% assigned to the first two dominant vibration modes of the structure.
4.2. Seismic Vulnerability and Functional Loss Analysis of the Long-Span Deck-Type Reinforced Concrete Arch Bridge
4.2.1. Seismic Vulnerability Analysis
In the process of seismic vulnerability analysis, it is first necessary to fully consider the randomness of ground motions and select them reasonably. For this purpose, this paper selected 32 ground motion records from the Pacific Earthquake Engineering Research Center (PEER) that conform to the site characteristics of the example reinforced concrete arch bridge, as listed in Table 4.

Table 4.
Selected ground motions and corresponding PGA.
Based on the seismic damage characteristics of long-span deck-type reinforced concrete arch bridges, this paper analyzes the seismic vulnerability of three types of components: the main arch ring, columns, and bearings. Using Equation (5) and the damage states defined in Table 2, the seismic vulnerability curves for the main arch ring, columns (columns near the crown), and bearings are calculated. The system vulnerability curve for the case-study bridge is calculated using the first-order bound method, as shown in Equation (14). The seismic vulnerability curves for the system and components are shown in Figure 4.
where Pfi is the failure probability of component; Pf is the system failure probability.
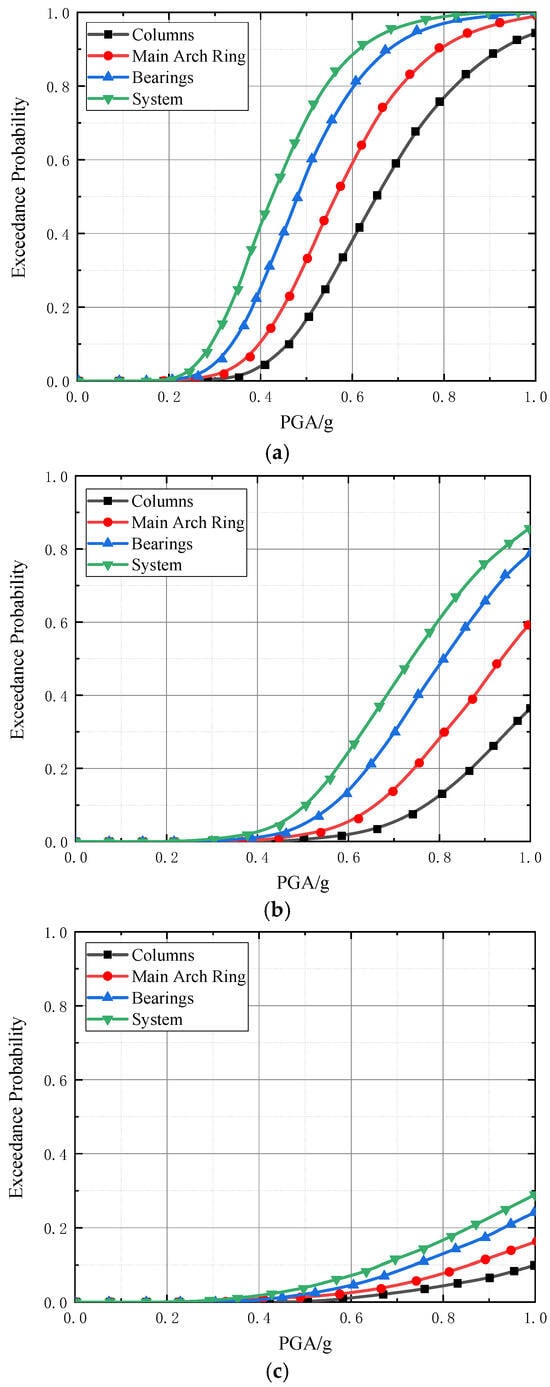
Figure 4.
Seismic vulnerability curves of different components of the case study deck-type reinforced concrete arch bridge: (a) slight damage; (b) moderate damage; (c) severe damage. Note: Due to the extremely low exceedance probability of complete failure for long-span deck-type reinforced concrete arch bridges, results are not presented here. Analysis of Figure 4 shows that for the same component, the exceedance probability for minor damage increases rapidly with PGA. For example, when PGA is 0.3 g and 0.6 g, the exceedance probabilities for minor damage in bearings are 0.048 and 0.814, respectively, an increase of 0.766. From minor to moderate to severe damage, the upper and lower bounds of the vulnerability curves for the same component differ significantly, indicating strong safety reserves after the component enters the minor damage state, preventing rapid progression to the next damage state. Taking bearings as an example, when PGA is 0.8 g, the exceedance probabilities for minor, moderate, and severe damage are 0.968, 0.498, and 0.135, respectively. Analysis of vulnerability curves for the same damage state across different components shows that under the same PGA, the system vulnerability of the case study bridge is greater than that of individual components, and the vulnerability of bearings is greater than that of the main arch ring and columns. For example, under moderate damage with PGA = 0.6 g, the exceedance probabilities for bearings, the main arch ring, and columns are 0.133, 0.054, and 0.022, respectively, all lower than the system exceedance probability of 0.256.
4.2.2. Functional Loss Analysis
Based on Equation (4) and the seismic vulnerability curves from Section 4.2.1, the damage probabilities of the bridge are obtained. Combined with the functionality loss ratios in Table 1, the residual functionality of the bridge is calculated using Equation (3), as shown in Figure 5.
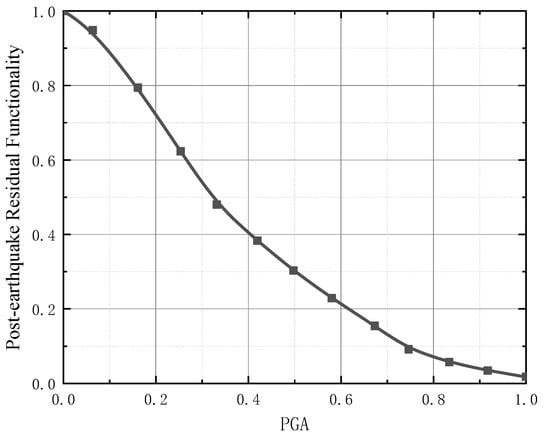
Figure 5.
Post-earthquake functionality loss of the case study reinforced concrete arch bridge.
Figure 5 shows that as the seismic intensity increases, the functionality of the reinforced concrete arch bridge decreases. Under a rare earthquake (PGA = 0.4 g), the residual functionality is only 40%, insufficient for normal use, indicating the need for repair and strengthening. Analyzing the functional loss of reinforced concrete arch bridges can provide references for determining the timing of repairs.
4.3. Seismic Resilience Analysis of the Deck-Type Reinforced Concrete Arch Bridge
Based on the seismic vulnerability curves and post-earthquake functional loss from Section 4.2, combined with the functional recovery functions proposed in Section 2.3, the influence of functional recovery functions on the seismic resilience of long-span deck-type reinforced concrete arch bridges is further explored. Additionally, the influence of different rise-to-span ratios on seismic resilience is investigated.
4.3.1. Influence of Recovery Functions on Seismic Resilience
To explore the influence of different recovery functions on seismic resilience, the exponential, linear, triangular, and improved methods are used for calculation, with the results shown in Figure 6.
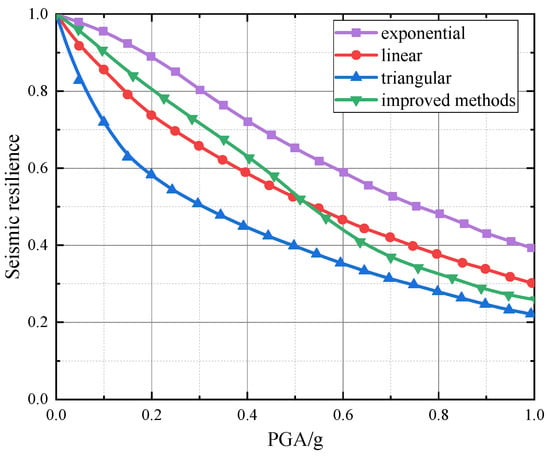
Figure 6.
Comparison of seismic resilience of the deck-type reinforced concrete arch bridge using different functional recovery functions.
Figure 6 shows that the seismic resilience of the deck-type reinforced concrete arch bridge decreases with increasing PGA, showing a trend that is initially rapid and then slows down. The exponential recovery function yields the highest resilience, followed by the linear function, and the triangular function yields the lowest. These results align with the applicable scenarios of the three recovery functions, validating their correctness. The resilience obtained by the improved method lies between that of the exponential and triangular functions. When PGA is small, the improved method’s resilience is close to the exponential function. As PGA increases, it approaches the linear function and eventually exceeds it, approaching the triangular function. This is because under low PGA, the bridge mainly experiences minor damage; as PGA increases, damage progresses to moderate, severe, and complete failure. These results indicate that the improved method’s resilience aligns with the failure pattern of reinforced concrete arch bridges, overcomes the limitations of traditional recovery functions, and provides a more reasonable reference for seismic resilience assessment.
4.3.2. Influence of Rise-to-Span Ratio on Seismic Resilience
To analyze the influence of different rise-to-span ratios on seismic resilience, the improved recovery function method is used to calculate the seismic resilience for ratios of 1/4, 1/5, 1/6, 1/7, and 1/8, with results shown in Figure 7.
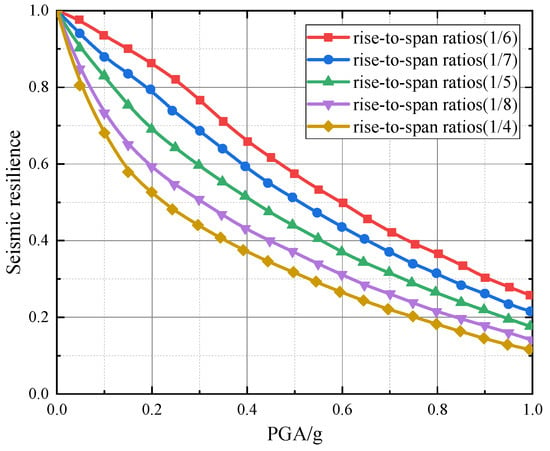
Figure 7.
Comparison of seismic resilience of the deck-type reinforced concrete arch bridge with different rise-to-span ratios.
Figure 7 shows that the rise-to-span ratio significantly affects seismic resilience. The ratio of 1/6 yields the highest resilience, followed by 1/7, 1/5, 1/8, and 1/4. For example, at PGA = 0.4 g, the resilience value for a ratio of 1/6 is 0.658, while the values for 1/7, 1/5, 1/8, and 1/4 are 0.594, 0.516, 0.432, and 0.376, respectively. The difference between the maximum and minimum values is 0.282. These results explain, from a resilience perspective, why ratios of 1/6 and 1/7 are commonly used in engineering practice.
4.4. Post-Earthquake Sustainability Assessment of the Long-Span Deck-Type Reinforced Concrete Arch Bridge
Based on the theory in Section 3, the post-earthquake sustainability of the deck-type reinforced concrete arch bridge is evaluated. The environmental and social indicators for the main arch ring, columns, and bearings are analyzed, with results shown in Figure 8 and Figure 9.
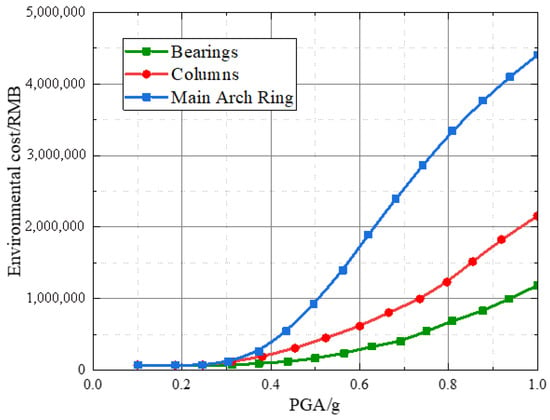
Figure 8.
Comparison of post-earthquake environmental costs for main components of the arch bridge.
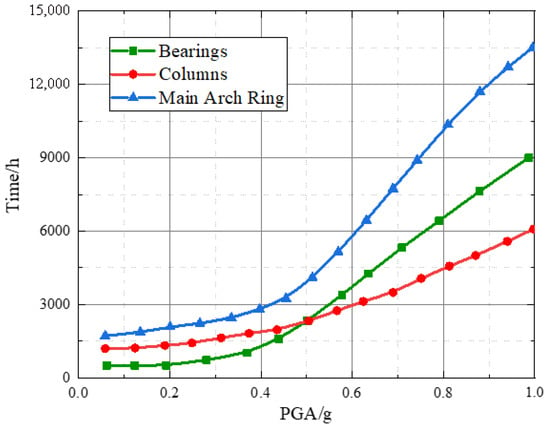
Figure 9.
Comparison of post-earthquake time loss for main components of the arch bridge.
Figure 8 shows that under seismic action, the environmental cost caused by damage to the main arch ring is significantly greater than that caused by damage to columns and bearings, and the environmental cost due to column damage is greater than that due to bearing damage. For example, at PGA = 0.6 g, the environmental cost caused by the main arch ring is 1.860 million RMB, while the costs for columns and bearings are 0.6161 million RMB and 0.3175 million RMB, respectively. Figure 9 shows that post-earthquake time loss is primarily controlled by damage to the main arch ring. When PGA is small, the time loss due to column damage is greater than that due to bearing damage, but when PGA exceeds 0.5 g, the time loss due to bearing damage exceeds that due to column damage.
5. Discussion
5.1. Conclusions
This paper constructs a seismic resilience assessment framework for long-span deck-type reinforced concrete arch bridges based on seismic vulnerability theory, utilizing post-earthquake functional loss and recovery functions. A post-earthquake sustainability evaluation method is developed using social and environmental indicators. Using Shatuo Bridge as a case study, its seismic vulnerability, seismic resilience, and post-earthquake sustainability are evaluated. The influences of functional recovery functions and the rise-to-span ratio on seismic resilience are compared and analyzed. The main conclusions are as follows:
- (1)
- The exceedance probability for minor damage in deck-type reinforced concrete arch bridges increases rapidly with PGA. The significant difference between the upper and lower bounds of vulnerability curves from minor to moderate to severe damage indicates strong safety reserves after components enter the minor damage state. Under the same PGA, the system vulnerability is greater than that of individual components, and the vulnerability of bearings is greater than that of the main arch ring and columns.
- (2)
- The seismic resilience of deck-type reinforced concrete arch bridges decreases with increasing PGA, showing a trend that is initially rapid and then slows down. The exponential recovery function yields the highest resilience, followed by the linear function, and the triangular function yields the lowest. The improved method’s resilience lies between the exponential and triangular functions and aligns with the failure pattern of the bridges, suggesting its potential as a more nuanced assessment approach within the context of the adopted numerical model.
- (3)
- The rise-to-span ratio significantly affects seismic resilience. A ratio of 1/6 yields the highest resilience, followed by 1/7, 1/5, 1/8, and 1/4.
- (4)
- Under seismic action, the environmental cost caused by damage to the main arch ring is significantly greater than that caused by damage to columns and bearings, and the environmental cost due to column damage is greater than that due to bearing damage. Post-earthquake time loss is primarily controlled by damage to the main arch ring.
5.2. Limitations and Future Research
- (1)
- This study presents an integrated framework for assessing seismic resilience and sustainability, demonstrating its application to a long-span deck-type reinforced concrete arch bridge. However, certain limitations should be noted. The finite element model assumed fixed boundary conditions at the arch abutments, neglecting soil–structure interaction (SSI). Given the current focus of the research scope, this simplification is considered acceptable, but it may lead to an overestimation of the overall structural stiffness and affect the calculated seismic requirements. Future research should incorporate SSI effects, particularly for bridges on softer soils, to enhance the realism of the seismic response analysis and generalize the findings.
- (2)
- Regarding the sustainability evaluation, the scope of the environmental impact assessment is a recognized limitation. This study focused specifically on the CO2 emissions generated from vehicle detours during the post-earthquake operational phase. While this effectively captures one significant environmental consequence of traffic disruption, it does not encompass the full life-cycle environmental costs, such as those associated with the embodied energy and carbon of repair materials, waste generated from demolition and reconstruction, or energy consumption during the repair operations. Future research should aim to integrate these broader life-cycle assessment (LCA) principles to achieve a more complete and robust evaluation of post-earthquake environmental sustainability.
- (3)
- This study presents the development and application of an integrated assessment framework. It is important to note that the quantitative results and specific conclusions are derived from a single case study. While Shatuo Bridge is representative of its typology, the generalizability of the absolute values of resilience, sustainability costs, and the optimal rise-to-span ratio to other long-span deck-type reinforced concrete arch bridges with different geometries, site conditions, or traffic patterns should be further investigated through parametric studies or applications to multiple bridges. Furthermore, the findings are based on numerical simulations and have not been validated against experimental data or observed seismic performance from actual earthquakes. Collecting such data for rare events on large-scale infrastructure is challenging, but future validation efforts, perhaps through large-scale testing or detailed post-earthquake reconnaissance, would significantly strengthen the confidence in the predictive capabilities of the framework.
- (4)
- The sustainability assessment conducted in this study has several limitations that also define avenues for future research. Firstly, it focuses on social (time loss) and environmental (CO2 emissions) indicators but does not include an economic cost–benefit analysis of repair strategies or overall economic disruption, which is a critical component of full sustainability. Secondly, the assessment is static; it calculates total impacts but does not dynamically couple the reduction in these impacts with the restoration of functionality over time (resilience–time coupling). Modeling this coupling would provide a more integrated view of the recovery process. Finally, the analysis is deterministic and does not quantify the uncertainties associated with key input parameters (e.g., traffic volume, emission factors, repair durations). A probabilistic or robust optimization approach would be needed to account for this uncertainty and enhance the reliability of the sustainability estimates. Addressing these aspects—economic cost, dynamic coupling, and uncertainty quantification—will be the focus of subsequent research to achieve a more comprehensive sustainability evaluation.
Author Contributions
Conceptualization, J.G., Y.Z. and W.P.; methodology, J.G. and Z.Z.; software, J.G.; validation, Z.Z. and W.P.; formal analysis, J.G.; investigation, J.G., Y.Z., Z.Z., W.P. and G.Z.; resources, J.Z.; writing—original draft preparation, J.G. and Y.Z.; writing—review and editing, Y.Z. and W.P.; supervision, J.G. and Y.Z.; project administration, Z.Z. and W.P.; funding acquisition, Z.Z. and W.P. All authors have read and agreed to the published version of the manuscript.
Funding
This research was funded by the Science and Technology Project of Department of Transportation of Guizhou Province, grant number 2025-122-010; the Doctoral Research Start-up Project of Hunan University of Arts and Science, grant number 24BSQD45; the Doctoral Research Start-up Project of Hunan University of Arts and Science, grant number 21BSQD25; the project was supported by Open Fund of Hunan Province Research Center for Safety Control Technology and Equipment of Bridge Engineering(Changsha University of Science and Technology, grant number 21KC04.
Data Availability Statement
The original contributions presented in this study are included in the article. Further inquiries can be directed to the corresponding authors.
Conflicts of Interest
Authors Jiping Guo and Jijin Zhang were employed by the company Guizhou Communications Investment Group Co., Ltd. The remaining authors declare that the research was conducted in the absence of any commercial or financial relationships that could be construed as a potential conflict of interest.
References
- Shi, J.X.; Majid, T.A.; Ran, Z.H.; Lin, F. Seismic Performance Evaluation of Low-Strength Precast Reinforced Concrete Arch Bridge Columns. J. Earthq. Eng. 2025, 1–19. [Google Scholar] [CrossRef]
- Cardaci, A.; Versaci, A.; Azzola, P. Mathematics and Geometry in the Nembro Reinforced Concrete Arch Bridge. Nexus Netw. J. 2023, 25 (Suppl. 1), 351–358. [Google Scholar] [CrossRef]
- Li, S.Q.; Zhong, J. Development of a seismic vulnerability and risk model for typical bridges considering innovative intensity measures. Eng. Struct. 2024, 302, 117431. [Google Scholar] [CrossRef]
- Chen, M.; Mangalathu, S.; Jeon, J.S. Bridge fragilities to network fragilities in seismic scenarios: An integrated approach. Eng. Struct. 2021, 237, 112212. [Google Scholar] [CrossRef]
- Deng, K.; Yan, G.; Yang, H.; Zhao, C. RC arch bridge seismic performance evaluation by sectional NM interaction and coupling effect of brace beams. Eng. Struct. 2019, 183, 18–29. [Google Scholar] [CrossRef]
- Farahani, E.M.; Maalek, S. An investigation of the seismic behavior of a deck-type reinforced concrete arch bridge. Earthq. Eng. Eng. Vib. 2017, 16, 609–625. [Google Scholar] [CrossRef]
- Mehrbod, A.; Behnamfar, F.; Aziminejad, A.; Hashemol-Hosseini, H. Seismic vulnerability assessment of stone arch bridges by nonlinear dynamic analysis using discrete element method. Int. J. Archit. Herit. 2023, 17, 1791–1812. [Google Scholar] [CrossRef]
- Aldabagh, S.; Khan, S.; Hossain, F.; Alam, M.S. Performance-based seismic assessment and design of long-span concrete deck arch bridges. J. Bridge Eng. 2023, 28, 04023077. [Google Scholar] [CrossRef]
- Xu, L.; Xu, L.; Xie, D.; Zhou, J. Seismic risk assessment methodology for large-span CFST arch bridges in near-fault areas based on fragility analysis. Struct. Saf. 2025, 118, 102656. [Google Scholar] [CrossRef]
- Yazdani, M.; Jahangiri, V.; Marefat, M.S. Seismic performance assessment of plain concrete arch bridges under near-field earthquakes using incremental dynamic analysis. Eng. Fail. Anal. 2019, 106, 104170. [Google Scholar] [CrossRef]
- Fang, D.P.; Li, Q.W.; Li, N.; Wang, F.; Liu, Y.; Gu, D.; Sun, C.; Pan, S.; Hou, G.; Wang, F.; et al. Community earthquake safety toughness assessment system and application demonstration. Eng. Mech. 2020, 37, 28–44. (In Chinese) [Google Scholar] [CrossRef]
- Kazemi, F.; Asgarkhani, N.; Jankowski, R. Machine learning-based seismic fragility and seismic vulnerability assessment of reinforced concrete structures. Soil Dyn. Earthq. Eng. 2023, 166, 107761. [Google Scholar] [CrossRef]
- Huang, C.; Huang, S. Seismic resilience assessment of aging bridges with different failure modes. Structures 2021, 33, 3682–3690. [Google Scholar] [CrossRef]
- Capacci, L.; Biondini, F.; Titi, A. Lifetime seismic resilience of aging bridges and road networks. Struct. Infrastruct. Eng. 2020, 16, 266–286. [Google Scholar] [CrossRef]
- Wei, B.; Jia, J.; Bai, Y.; Du, X.; Guo, B.; Guo, H. Seismic resilience assessment of bridges considering both maximum and residual displacements. Eng. Struct. 2023, 291, 116420. [Google Scholar] [CrossRef]
- Wu, D.; Li, Z.X.; Ding, Y.; Su, L. Time-dependent seismic fragility and resilience assessment of a sea-crossing cable-stayed bridge under combined effects of corrosion and scour. Eng. Struct. 2025, 340, 120702. [Google Scholar] [CrossRef]
- Mata, R.; Nuñez, E.; Amaya, E.; Rojas-Asuero, H.; Santa-María, H.; Vicencio, F. Seismic resilience of simply supported bridges subjected to subduction earthquakes. Structures 2025, 79, 109408. [Google Scholar] [CrossRef]
- Yang, G.J.; Ye, S.; Li, X.M. Time-varying seismic toughness analysis of RC bridge piers under chloride ion erosion. J. Huazhong Univ. Sci. Technol. (Nat. Sci. Ed.) 2023, 51, 60–66. (In Chinese) [Google Scholar] [CrossRef]
- Navarro, I.J.; Penadés-Plà, V.; Martínez-Muñoz, D.; Rempling, R.; Yepes, V. Life cycle sustainability assessment for multi-criteria decision making in bridge design: A review. J. Civ. Eng. Manag. 2020, 26, 690–704. [Google Scholar] [CrossRef]
- Fu, Z.J.; Gao, R.; Li, Y.M. Measuring seismic resilience of building portfolios based on innovative damage ratio assessment model. Structures 2021, 30, 1109–1126. [Google Scholar] [CrossRef]
- Tehrani, P.; Mitchell, D. Seismic response of bridges subjected to different earthquake types using IDA. J. Earthq. Eng. 2013, 17, 423–448. [Google Scholar] [CrossRef]
- Cimellaro, G.P.; Reinhorn, A.M.; Bruneau, M. Seismic resilience of a hospital system. Struct. Infrastruct. Eng. 2010, 6, 127–144. [Google Scholar] [CrossRef]
- Li, Y.M. Study on Evaluation Method of Seismic Toughness of Structure During Whole Life Cycle. Master’s Thesis, Guangzhou University, Guangzhou, China, 2023. (In Chinese) [Google Scholar] [CrossRef]
- Li, X.Z.; Liu, M.; Yang, D.H.; Dai, S.Y.; Xiao, L. Earthquake damage evolution simulation of long-span upper bearing steel truss arch bridge. J. Southwest Jiaotong Univ. 2020, 55, 1207–1214+1223. (In Chinese) [Google Scholar] [CrossRef]
- Jiang, Z.Z.; Li, Y.Y.; Sun, Q.F.; Fan, Y. Research on theoretical model of highway bridge capacity after earthquake. J. Disaster Prev. Reduct. Eng. 2015, 35, 226–231. (In Chinese) [Google Scholar] [CrossRef]
Disclaimer/Publisher’s Note: The statements, opinions and data contained in all publications are solely those of the individual author(s) and contributor(s) and not of MDPI and/or the editor(s). MDPI and/or the editor(s) disclaim responsibility for any injury to people or property resulting from any ideas, methods, instructions or products referred to in the content. |
© 2025 by the authors. Licensee MDPI, Basel, Switzerland. This article is an open access article distributed under the terms and conditions of the Creative Commons Attribution (CC BY) license (https://creativecommons.org/licenses/by/4.0/).