Abstract
Airport environment often exposes passengers to stress, negatively impacting health and wellbeing. This study links plant visibility to passenger stress in Jakarta Terminal 3, applying the Stimulus-Organism-Response model to address a gap in airport research. The mixed methods included a combination of questionnaires (N = 104) and field observations. Statistical and behavioural analyses triangulated the findings. Respondents exhibit positive attitudes towards plants: 78% prefer lush images and 88% agree that seeing plants reduces stress. At the stimulus stage, awareness is high (86%), but visibility varies by zone. Stress levels peak at baggage claim (49%) and other processing areas. At the organism level, visibility is linked to stress only at arrival, with results suggesting that passengers who did not see plants are 4.57 times more likely to have high stress. At the response stage, results suggest that stress is not associated with dwell time, activities, or plant demand. However, those who see plants are 2.21 times more likely to request planting. The findings suggest prioritising plant visibility over volume, highlighting the need for broader scope and diverse data types in future research to yield more robust conclusions.
1. Introduction
In this era of global connectivity, airports have become essential public spaces [1]. The rapid growth of accessible air travel has brought an unprecedented diversity of users, spanning cultures, ages, and needs [2]. Yet, they remain among the most stressful environments that people must travel through [3].
Airport stressors can be divided into three broad categories: procedural, environmental, and internal. Procedural factors include unpredictable queue lengths, uncertainties, and unpredictable changes [4]. Environmental factors include crowding, noise, long corridors, and confusing wayfinding [5]. Internal factors, such as fear of flying, jet lag, fatigue, and travel anxiety [6], often magnify the impact of the first two. Procedural stress is well-studied and its solutions implemented [7], yet the role of terminal design on wellbeing remains under-explored.
Airport studies use conceptual frameworks such as the ‘servicescape’ and the Stimulus–Organism–Response (S-O-R) model to clarify how terminal design influences passenger experience. Researchers frame the terminal as a servicescape, or the physical environment in which the service process takes place [8]. The Stimulus-Organism-Response (S-O-R) model [9] explains how environmental stimuli affect emotions (organism) and subsequent actions (response). Airport research uses this chain, linking warm lighting and décor to better moods [10], using the layout of self-service kiosks to alter passenger behaviour [11], and reporting that architectural aspects such as materials and ceiling height can shift emotions and influence satisfaction [12].
Unlike offices or hospitals, airports move travellers through sequential zones, some notably more stressful than the others [13]. Empirical data show that stress peaks vary by context: multi-country surveys identified security [4,14,15], a UK survey reported baggage claim [13], and the Netherlands reported check-in [16]. These peaks reflect both procedural demands and environmental conditions. Process-heavy zones typically lack decorative elements and connection to the outside, potentially heightening stress.
Regarding procedures, efficiency measures such as mobile apps, self-service kiosks, and sensors have shortened dwell times at check-in, security, and immigration [7]. Recomposure zones are usually located after stressful checkpoints, restoring orientation and control. Facilities ranging from F&B, retail, to more luxurious options such as salons and massages [2], are located after stressful checkpoints [17]. Such amenities; however, are not accessible to all passengers.
Jason Mooi’s 2014 study asks whether airports can be designed as mentally and physically rejuvenating environments for everyone [18]. Varying stress peaks suggest that travel anxiety looms over passengers throughout their journey. This suggests every point should provide equal access to restorative cues to lessen cumulative stress.
Environmental psychology grounded in biophilia hypotheses, such as Attention Restoration Theory (ART) [19], and Stress Reduction Theory (SRT) [20], has a growing body of evidence that indicates that exposure to nature can improve wellbeing. In workplaces, hospitals, schools, and homes, the presence of plants can decrease skin-conductance response [21,22], lower stress levels [23], boost positive feelings [24], and positively affect brain waves and heart rate variability. These environments are increasingly integrating indoor planting and other biophilic elements to harness their benefits.
Airports that adopt nature in new builds (Figure 1)—integrating biophilic elements such as natural light, water features, and natural materials—are motivated by different reasons. Historically, gardens and plants have been used to signal national identity [25], such as Singapore’s garden-city identity reflected in Changi Airport, or Bengaluru’s Kempegowda International Airport’s snapshot of the country’s landscape. With others following suit and seeing success, natural aspects became a dimension of marketing and advertising as pictures of the green features flooded social media [26,27,28]. Furthermore, greenery became a commercial source of revenue, as increased dwell time [27] meant an increase in spending. Finally, in an era of prioritising sustainability efforts, planting serves as a visual representation of the airports’ environmental consciousness [28].
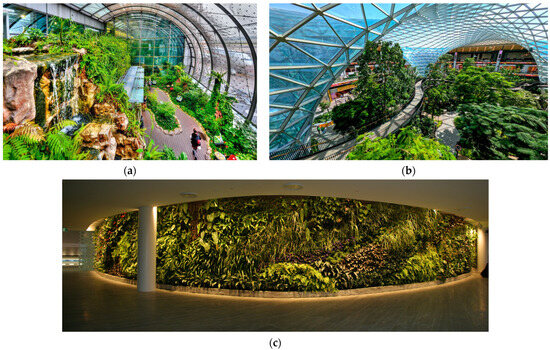
Figure 1.
Indoor planting in airports: (a) Changi Airport’s Butterfly Garden [29]; (b) ORCHARD [30]; (c) Qantas Lounge, Sydney Airport [31].
In terms of spatial distribution, greener areas are often abundant in premium lounges, retail, and “garden” specific attractions. In contrast, process zones such as security or immigration are kept visually sparse, as tighter surveillance is required. Baggage claim zones vary across airports; some combine green walls (Figure 2) and others keep it plain and utilitarian. Therefore, it can be seen that the most stressful points tend to have fewer restorative cues, while post-process zones have plenty.
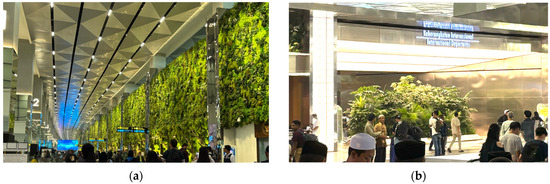
Figure 2.
Focal points of the beautification: (a) baggage claim green wall and (b) departure gate.
In current airport studies, passenger wellbeing is often used as a variable to understand broader outcomes, such as green behaviours [32] and increased spending [33]. Most studies that assess biophilic design elements or plants are limited to either one zone, such as security [15], terminal halls, [34] resting zones, departure lounges and restaurants [35] or a generalisation of the entire terminal [32]. Additionally, existing research groups merge “green”/biophilic elements together [35], without focusing specifically on indoor plants. Behaviour mapping—a common tool for public-space studies [36,37,38]—is seldom used to document terminal planting, despite recent design practice at Portland International Airport [39].
Introducing indoor plantings in high-stress zones could affect the wellbeing of millions of passengers at a lower cost than full terminal retrofits [40]. However, it is still unclear which zones will have the most significant stress-mitigating impact from planting. Therefore, a study is needed to identify where people are stressed, where they already see plants, and where they want plants.
The purpose of this work is to fill this gap by investigating the relationship between indoor plant visibility and passenger stress, following a three-step logic that treats visible planting as a stimulus, passenger stress as an organism state, and demand and behaviour as responses. First, mapping where passengers notice planting (RQ1). Second, testing whether visibility is associated with perceived stress (RQ2). Third, asking whether perceived stress predicts passengers’ behaviour (activities and dwell time) and demand for planting (RQ3).
By combining observation and a survey within a recently refurbished terminal, this study’s findings may serve as a performance review of the latest refurbishment and can inform airports that are considering incorporating additional vegetation. The research could provide evidence-based design recommendations for integrating greenery into high-stress airport zones. It also aims to raise awareness among airport users, designers, planners, and operators of the overlooked psychological value of biophilic elements such as indoor plants.
2. Materials and Methods
This study employs a mixed-method approach, combining both quantitative and qualitative data collection and analysis. The quantitative strand involves a questionnaire, focusing on airport users’ experiences and perceptions, including time spent in different zones, perceived stress levels across zones, awareness and perceived benefits of indoor plants, and preferences for airport spaces with varying levels of indoor plants. The qualitative strand consists of field observations, assessing the presence and placement of plants, and the types of behaviours exhibited by users.
2.1. Case Study
Opened in 2016, Terminal 3 expands Soekarno–Hatta’s capacity and features a contemporary aesthetic distinct from the vernacular design of Terminals 1 and 2 [41]. This expansion responds to the increasing demand for air travel, which remains the most efficient mode of transportation across the archipelago [42]. Greenery was added during InJourney’s 2024–2025 ‘green-beautification’ refurbishments [43] (Figure 2), making the terminal suitable for studying whether the current indoor plant installation contributes to passengers’ wellbeing.
2.2. Questionnaire
A questionnaire was used to explore passengers’ perceptions, stress levels, and awareness of indoor plants as biophilic elements in airport environments. It was selected as the primary tool to capture subjective experiences. Eligibility was determined by age (over 18) and having taken a flight within the last 12 months. The bilingual (English and Indonesian) survey was hosted in Qualtrics for two weeks (15–28 July 2025), distributed online and on-site and at check-in and arrivals. This combination was to enhance representativeness and data reliability, ensuring the sample included recall-based and real-time impressions, therefore addressing the limitations of each approach if they were used alone. Both results were tested for significant differences, and the results are elaborated on in the discussion. After quality checks, 104 complete responses remained for analysis.
The questionnaire was adapted from industry surveys and past studies [7,20], divided into five sections: screening and context (A), stress and airport journey (B), design preferences (C), indoor landscape awareness (D), and demographics (E). Questions were presented in a sequence that minimised bias. For example, items regarding indoor landscaping and its benefits were placed after the design preference. Some questions (B1, B2, D2, D3, D4) used a matrix, allowing respondents to answer for each zone. An option to choose other parts of the airport that make a lasting impression was provided, accompanied by a text box for respondents to specify. Statements such as B2 (stress), D3 (plant benefits), and D4 (plant demand) used a 5-point Likert scale, ranging from 1 (Strongly disagree) to 5 (Strongly agree). D1 (Plant awareness) was a 3-point (yes, no, or unsure) question, whereas D2 (Visibility) allowed multiple selections of zones. B1 (dwell time) used 5-point categorical time ranges, less than 15 min, 15–30 min, 30 min to 1 h, 1–2 h, and more than 2 h. Complete questionnaire is attached in Table 1.

Table 1.
List of questions.
To determine whether participants generally prefer indoor plantings in their terminals (C1), three images with varying plant densities were selected (Figure 3). An open-ended question for C2 allowed respondents to type in the reason for their ranking. Items C1, C2, and D3 reflected baseline attitudes toward planting, which will later be referenced in answering RQ2 and RQ3.
Figure 3.
Images of airports with varying planting schemes: (a) Kempagowda International Airport, Bengaluru [44]; (b) Terminal 5 Heathrow International, London [45]; (c) Terminal 3, Soekarno Hatta International, Jakarta [46].
2.3. Observations
Field observations consisted of a plant audit: documenting every visible planting installation in landside (immigration, baggage claim) and airside (security, departure lounge) zones (As seen in Table 2) [47]. As well as behaviour mapping: place-centred naturalistic observations spanning three consecutive days (18 h total). Check-ins and arrivals were monitored in three daily sessions (09:00–12:00, 13:00–16:00, 16:00–19:00, with snapshots taken every 15 min [48].
Table 2.
Field observations schedule.
2.3.1. Rapid Plant Audit
A rapid plant audit was conducted on the first and last days of fieldwork, covering the landside zones (immigration and baggage claim) and the airside zones (security and departure lounge) in sequence. Similar audits in airport settings have been reported, using web-sourced images to map closed green spaces [49], and general observations of airport zones with photo logs [50]. While not a common practice, as airport-based studies often rely solely on participants’ testimonies [35], this approach sets a precedent for documenting visible green features in terminals.
Annotations cover the current placement, type, and scale of indoor placement [47]. Pictures were also taken in places where it was allowed.
2.3.2. Behavioural Mapping
Observations were recorded using place-centred naturalistic observation [47], in which behaviours were documented in their typical setting without interference. These behaviours are recorded as they occur within specific locations [48]. Behaviour observation was conducted by one person (the author), who objectively observed and noted the posture and activities of people within the observable area, such as standing, sitting, and using a phone. This method is straightforward, minimising subjectivity and requiring no further analysis.
Before proceeding to the main observations, preliminary observations were conducted on the first day to create a base map for the public zones (check-in and arrival), as some parts are outdated and differ from the current design. Additionally, specific postures and activities were noted that will eventually be classified as codes.
Snapshots were taken every 15 min, following practices used in observational studies of public spaces [48,51]. Coding consistency was maintained through immediate notetaking, photo verification, and post-session cross-checks to ensure stability of category assignment across time and locations.
Large zones, such as the check-in hall, were divided into three subzones: between islands A and B, between islands C and D, and the departure gate, with observations made every hour. Activities within these subzones were recorded by walking through the area, whereas the ground-floor arrival hall was monitored from above, using a vantage point on the second floor. Passenger location was plotted as dots [48] and activities coded with alphanumeric symbols (activity codes in Table A1, sample of observation in Figure 4).
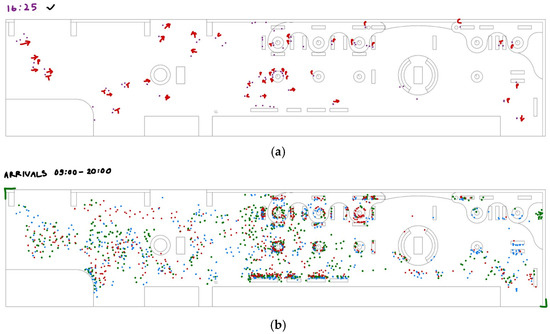
Figure 4.
Sample observations: (a) one-time observation, purple dots indicate locations where people are observed, red arrows depict movement, while red alphabets depict type of activity; (b) aggregated observations, different coloured dots indicate location of people observed in different sessions e.g., green for 9:00–12:00, blue for 13:00–16:00, red for 16:00–19:00.
2.4. Data Analysis
Four analytic strands were implemented in Microsoft Excel 2024 with RealStatistics 9.5.5 and OpenEpi 3.01 (website: www.openepi.com): descriptive, thematic, inferential, and observational. To check for potential recall bias between online and on-site responses, independent-samples t-tests were performed on key variables (stress, visibility, dwell time, and plant demand) to verify sample comparability.
2.4.1. Descriptive
Descriptive analysis includes medians/IQR for ordinal items; frequencies with Wilson 95% CIs for categorical data. Thematic analysis of open-ended answers, coded reflexively to reasons for planting preferences; data available in the Supplementary Materials.
2.4.2. Thematic
Open-ended survey responses were analysed using thematic coding. This study employs reflexive thematic analysis, recognising the author’s expertise and the inherent biases in qualitative analysis [52]. First, statements in Indonesian were translated into English. Then, keywords were extracted from the verbatim statement and clustered into themes. These themes are then reported with counts and short quotations, coded according to their image preference. The top themes that emerge from each image are summarised using frequency tables and bar charts. Some statements contain multiple themes; therefore, the sample size for every summary will be reported. Texts from the other choice in several survey questions are reported with descriptive summaries.
2.4.3. Inferential
Inferential: contingency and non-parametric tests (α = 0.05). Ordinal variables were dichotomised (e.g., high vs. low stress) for 2 × 2 analyses; effect sizes reported as ORs or rank correlations.
2.4.4. Observational
Observational analysis includes visualisation of heat maps, depicting where plants and activities are. Missing data were treated with pairwise deletion for correlational analyses and listwise deletion for 2 × 2 contingency analyses.
This study adhered to ethical standards for research involving human participants, in line with principles in the World Medical Association Declaration of Helsinki [53]. Risk assessment was conducted as part of the ethics application, and no significant physical or psychological risk to participants or researchers was identified. Procedures were reviewed and approved by UCL IEDE’s research ethics committee.
3. Results
Of 153 responses, 127 remained for analysis after removing incomplete entries (respondents who did not complete the survey). From this number, 23 referred to airports other than the Jakarta case study, such as London Stansted, Sphinx, Seoul Incheon, Helsinki, Naples, Gatwick, Ngurah Rai, Kuala Lumpur, Innsbruck, and Eindhoven.
The analyses below used the case study subsample (n = 104), with demographics summaries in Table 3. Whole sample’s descriptive demographic summary and all inferential results are available in Supplementary Materials.
Table 3.
Top 5 sample demographics.
3.1. Baseline Attitudes
Preference and attitude items indicate that passengers generally favour plants. For image ranking (C1) (Figure 5), 78% of respondents chose the lushly planted Image A as their most-preferred terminal scene, 76% placed the moderately planted Image C second and 86% ranked the sparsely planted Image B last. A goodness-of-fit test confirmed these differences were significant (χ2_GOF = 309.46, p < 0.01, Cramer’s V = 0.71, n = 103).
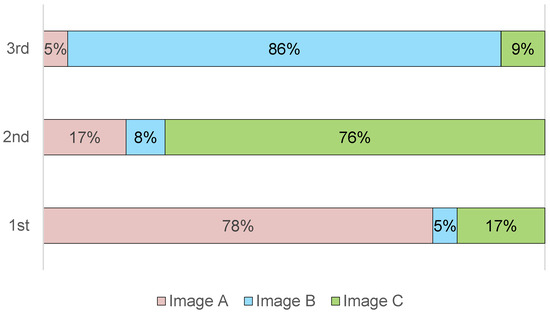
Figure 5.
C1 Image ranking distribution.
Open-ended responses for C2 revealed themes (n = 100, with 129 total mentions), of which ambient comfort (34%) was the most frequently cited factor, followed by greenery (30%), visual qualities, and spatial experience (see Figure 6). Among those selecting Image A (n = 78), ambient comfort (36%) and greenery (35%) were the top reasons. The small group favouring Image B (n = 5) mentioned relaxation, visual quality, and order. Conversely, nearly half of the supporters of Image C (n = 17) preferred its spaciousness and organisation, with additional comments about signage and familiarity. A few participants voiced concerns about the maintenance costs of airport greenery and the potential effect on airfare. Full responses to the open-ended questions and their themes are provided in the Supplementary Materials.
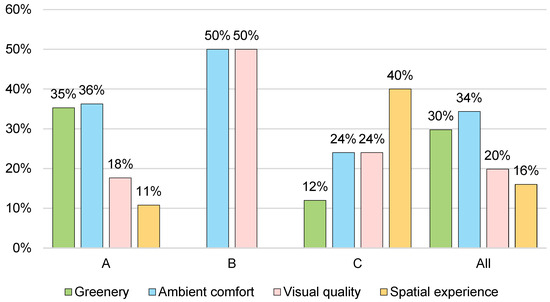
Figure 6.
C2 distribution of identified themes.
Regarding the perceived benefits of plants (D3), out of 104 people, 88% agreed or strongly agreed that seeing plants can help reduce travel stress (57% “agree”, 31% “strongly agree”) (see Figure 7).
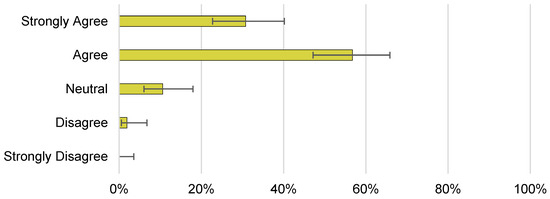
Figure 7.
Distribution of perceived benefits of plants (D3).
These initial findings clearly show that the differences in subsequent zone-specific analyses are not caused by a general dislike of greenery. Instead, they are more likely influenced by visibility and attentional load, which we explore further in the Discussion.
3.2. Per Zone Descriptives
3.2.1. Experiences
For B1, Table 4 depicts that the median for dwell time is shortest in security and immigration (less than 15 min), and the longest in the departure lounge (30–60 min). In terms of distribution (Figure 8), most respondents spent less than 15 min in security (58%), immigration (39%), and exit/arrival hall (42%), 15–30 min at check-in (38%), and 30–60 min in the departure lounge (44%), and baggage claim (46%). However, 37% of respondents also spent 30–60 min in baggage claim.
Table 4.
Per zone dwell time (B1) and perceived stress (B2) median and frequencies.
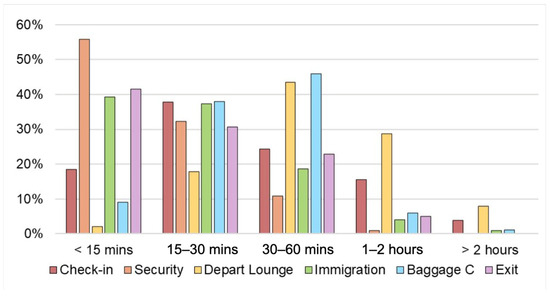
Figure 8.
Distribution of dwell time for each zone (B1).
Question B2 asked respondents to rate how much they agreed with the statement “I find these areas stressful” using a five-point Likert scale (1 = Strongly disagree to 5 = Strongly agree). The median from Table 4 shows that respondents’ feelings were mainly close to neutral, except for baggage claim, making it hard to infer which zones are more stressful than others.
Grouping ‘Agree’ and ‘Strongly agree’ items into a high-stress category reveals a clearer trend. Respondents find baggage claim the most stressful zone, followed by immigration and security. In contrast, other zones have marginally lower numbers, suggesting that respondents feel more relaxed. In both journey directions, stress profile peaks at a procedural choke point—security for departure, baggage claim for arrivals—and drops in departure lounge and exit.
A preliminary analysis was conducted to assess the differences in stress levels within zones. The results show a significant difference in perceived stress between zones (χ2F(5) = 458.4, p < 0.001, n = 97). Effect size indicates strong consensus (Kendall’s W = 0.95).
3.2.2. Visibility and Demand
Overall plant awareness (D1) was high, with most people noticing indoor plants somewhere in the terminal (87%, 95% CI [79–92], n = 103). In the survey design, respondents who ticked unsure were also shown the D2 item. Therefore, the unsure group can be merged with the yes group, totalling 96% of respondents, compared to only four respondents who answered “no”.
Item D2 asked passengers to specify which zone they saw plants in (n = 101). As seen in Table 5, the check-in zone ranked first, with the most people noticing plants; the departure lounge and baggage claim ranked second; and the exit zone ranked third. Very few people saw any plants in security and immigration. The “Others” option was ticked by 7% (95% CI [3–14]) of respondents, but only two cited the place: boarding bridge and commercial zone.
Table 5.
Per zone visibility (D2) and demand (D4) median and frequencies.
For D4, all zones have a median of 4 and an IQR of 3–5 (Table 5), suggesting that respondents generally agree on wanting to see plants in all zones. A total of 38 people selected the other option, with 17 respondents citing toilets/restrooms (8), arrival waiting room, parking zones (3), and the remaining areas, including shopping areas, post-landing foyer, central area, and all areas.
Figure 9 shows the distribution of answers to question D4, indicating an apparent difference between “Agree” and all other answers, with check-in, baggage claim, and exit/arrivals each passing or approaching 50%. “Strongly agree” is the highest response at just above 40%.
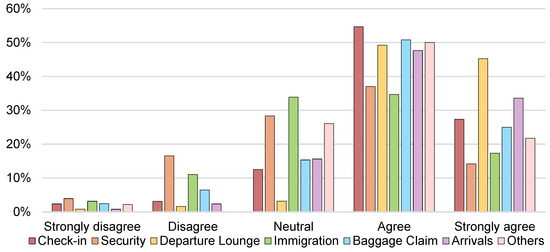
Figure 9.
Distribution for plant demand (D4).
When “Agree” (4) and “Strongly agree” (5) are grouped, more than 50% of respondents agree on wanting to see plants in all zones. The departure lounge is the zone with the highest percentage of respondents wanting plants (93%), followed by immigration (52%), and security (54%).
3.3. Inferential Relationships
Stratified results for the inferential tests regarding the research question variables are summarised in Table 6. Further zone tests were performed when the Woolf test revealed heterogeneity.
Table 6.
Stratified results for tested relationships.
3.3.1. RQ2 Visibility → Stress
The Woolf test confirmed differing effects in individual zones (Woolf p = 0.04). Zone tests revealed mostly negligible effect sizes with inconsistent directions (Table 7), except for arrivals, which suggest that passengers who did not see plants in the arrival hall were 4.57 times more likely to have high stress.
Table 7.
Effect of plant visibility on perceived stress across airport zones.
3.3.2. RQ3a Stress → Plant Demand
Plant demand was expected to be associated with stress levels. The overall stratified test shows no significance. Pooled monotonic trend shows no significance (p = 0.77, ρ = −0.05, n = 552); therefore, its mixed direction is irrelevant. Only security has a significant, weak association (p = 0.01, ρ = 0.25).
3.3.3. RQ3b Stress → Behaviour (Dwell Time)
Consistently across zones, respondents who reported higher stress were 2.84 times more likely to stay longer than 30 min. Mixed results were obtained while conducting zone-specific tests, with departure lounge and immigration showing significant associations and small effect sizes (Table 8). Monotonic association using a pooled 1–5 scale was very weak and not significant (ρ = 0.05, p = 0.19, n = 576).
Table 8.
Effect of perceived stress on dwell time across airport zones.
3.4. Observation Results
Plant audit results are summarised in Figure 10, which illustrates where the author observed plants. The audit complements D2 results, adding nuance to participants’ answers. The complete list of coded images is shown in Figure A1.
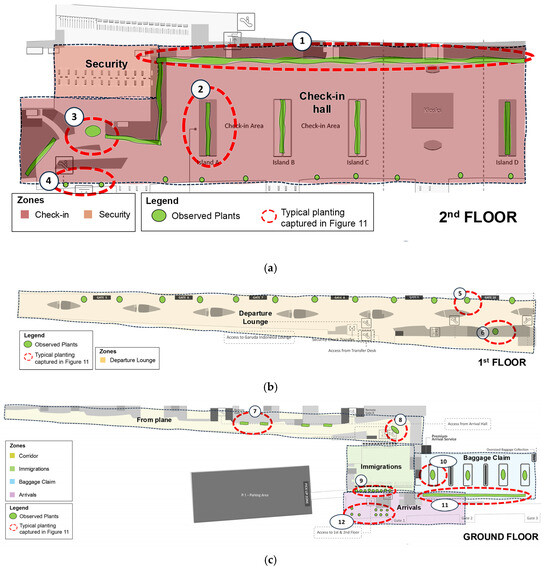
Figure 10.
Planting keymap: (a) 2nd floor; (b) 1st floor; (c) ground floor. Green Red circles and numbers refer to the images in Figure 11.
In the check-in zone, plants were available on top of all the rooflines, integrated with the check-in counter islands (Figure 3), at the departure gate (Figure 2), and along the railing. No plants were observed in the security zones, despite 5% of respondents reporting having seen some.
The departure lounge—despite having fewer plants—was rated second highest for item D2 (47%). Two potted trees were visible in each seating area between gates, whereas trees and small pots were used as decorations in stores and F&B (Figure 11). Most respondents report spending 1–2 h in this zone, which is significantly more time than in other zones. This extra time might increase their chances of noticing and remembering the available plantings.
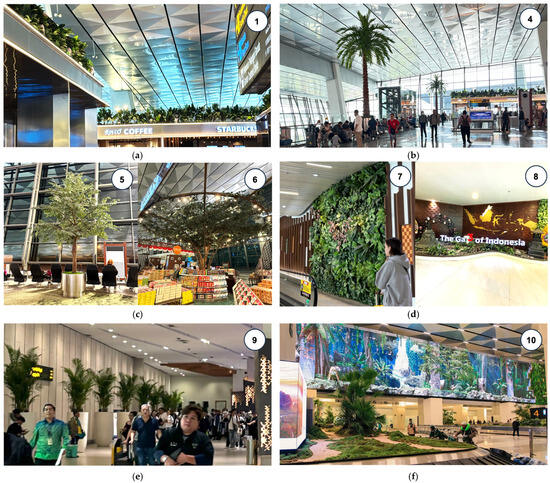
Figure 11.
Images of the terminal: (a) rooftop plants, (b) palms, (c) lounge trees, (d) corridor and corner before immigrations, (e) post immigration, (f) conveyor belts. Numbers on the images refer to the location where the pictures were taken, depicted in Figure 10.
There are notable plantings along the long corridors between disembarking the plane and reaching border control, such as green walls every few metres and an island in the corner before entering the immigration zone (Figure 11).
Immigration and security observations confirm that the zones have the least planting. A row of potted plants lines the wall right after the border control gates (Figure 11), but they are not visible from the beginning of the queue. Low visibility (6%) may be attributed to individuals easily overlooking it while hurrying to the baggage claim.
Objectively, the baggage claim zone has the highest plant-to-volume ratio, with the entire wall on one side covered by a green wall from floor to ceiling (Figure 2). Even if the seating is facing the other way, the conveyor belts have plants in the middle (Figure 11), and the columns have a mirror finish that reflects the green wall. However, only 47% respondents notice it.
The arrival hall is a small holding area with integrated seating, trees, and artificial grass carpet. They are hard to ignore; therefore, even though respondents spent a short time or were just passing through, they reported noticing.
The heat map in Figure 12 shows hotspots around seats near the railing in all subzones, as well as in seating areas and queue lines between check-in counters A and D. As depicted in the floor plan, people sitting and queueing have almost a 360° view of the plants, which confirms high perceived visibility. Hotspots can also be observed in front of the departure gate.
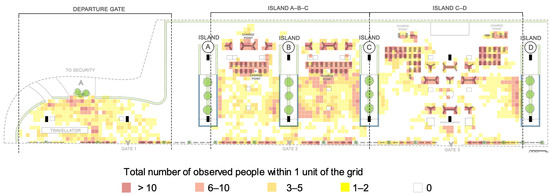
Figure 12.
Check-in heat map A, B, C, D.
The five top activities (Table 9) and the distribution of activities (Figure 13) show differences across subzones. With fewer seating areas, people in the departure zone tend to move around more. Many observations involve lounging and looking around, which aligns with the low stress levels during check-in. The zone itself is a notably social area due to its size and the variety of entertainment and hospitality options available, including restaurants that serve relatives and friends accompanying the passenger. Therefore, other low-stress activities outweigh processional ones like queuing for baggage drop and the check-in itself.
Table 9.
Top 5 activities at check-in.
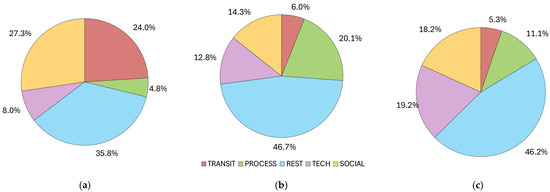
Figure 13.
Distribution of activities in check-in subzones: (a) departure gate, (b) A-B-C, (c) C-D.
The spatial distribution map (Figure 14) shows hotspots around rounded seating phone counters, charging stations, and a currency exchange. The far-right area is significantly sparser than the middle. Although there is another exit to the parking area, more people prefer to use the nearest one. As it is less busy, it is mainly used as a place to sleep.
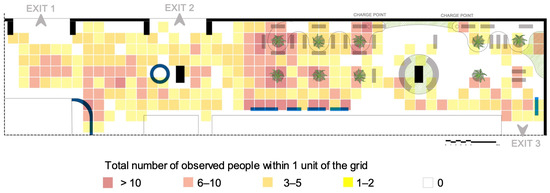
Figure 14.
Arrivals heat map.
In arrivals, almost half of the observations were transit (Table 10). This aligns with B1, where the highest percentage of respondents spent less than 15 min. More solitary activities were observed at arrivals, as the zone was considerably smaller and less accommodating than the check-in area. The high number of device-related activities (Figure 15) coincided with hotspots in front of the counters and seating areas, as passengers mostly purchased data packets and checked their connectivity afterwards.
Table 10.
Top 5 activities in arrivals.
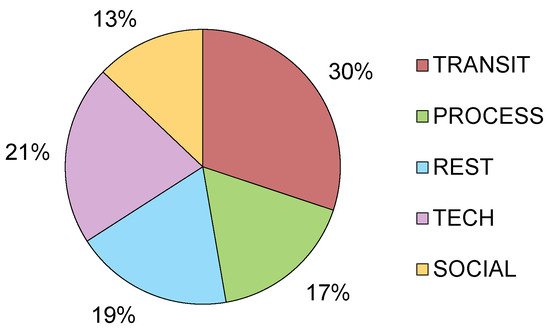
Figure 15.
Distribution of activities in arrivals.
The most significant difference noticed between check-in and arrivals was in resting and transit activities. Almost half of the people observed at check-in (45%) were engaged in resting-related activities, whereas only 19% of arrivals were. Another jarring example is seen in the 30% transit activity in arrivals versus the 8% at check-in. When transit activities are removed entirely, dwell activities show a substantial difference in tech-related activities, suggesting that the people observed at check-in used their phones while on the move.
3.5. Summary
Table 11 summarises the headline findings. First, stress varies across zones, as evidenced by high resting activity at check-in and arrivals. RQ 1 shows that 86% of respondents were aware of plants within the terminal, but gaps exist: only 5% noticed planting at security and immigration. For RQ 2, visibility only predicts stress in arrivals (OR = 4.57). Finally, RQ 3 reveals that no significant associations between stress and demand, but stress does predict longer dwell time across zones (OR_MH = 2.85). Observed dwellings around seating areas and a high number of people lounging and looking around at check-in and arrivals may correspond with higher plant demand.
Table 11.
Summary of key results.
Notable findings outside the RQs are that plant visibility drives demand (OR_MH = 2.21).
4. Discussion
4.1. Insights on Baseline Attitudes
It is evident that passengers favour images with more planting and believe that seeing plants helped them feel less stressed, mirroring biophilia theory [54], its effects on stress [12,24], and preferences for terminal designs with green elements [34]. Thematic analysis of open-text reasons revealed nuance; while most respondents associate plantings with comfort, some concerns about wayfinding emerge, underscoring Bitner’s 1992 study, which warned that servicescape elements must be balanced with functional clarity [8]. These baseline attitudes may explain why weak links between planting and stress are unlikely to occur due to a dislike of plants, but rather from salience and a limited attention load.
4.2. Stress Profile
A stress-level assessment per zone was performed as a diagnostic step before carrying out further inferential analysis. Stress differs significantly by zone, peaking at baggage claim, a pattern also seen in a prior UK survey [13]. It is followed closely by immigration and security, echoing studies in other countries [14,15]. Both are consistent with the insights from past research [13], which show that more than 40% of passengers are most worried about losing their baggage and getting stopped at security. Considering dwell time, people spend under 15 min on security, reflecting efficiency and low stress. Meanwhile, passengers spend 30–60 min at baggage claim, which could increase stress and impact their overall perception of the space.
4.3. Plant Visibility per Zone (RQ1)
Passengers did notice planting, but they perceived it unevenly across different zones. Almost every respondent was aware of greenery at some point in the terminal, yet only 5% recalled seeing any plants in security and immigration. The plant audit further confirms disparities in plant density between zones; however, it also reveals some paradoxes. First, the baggage claim zone has the largest display of greenery compared to the room’s volume, yet a quarter of respondents were unaware of it. By contrast, the departure lounge is expansive with fewer plantings overall, yet it has the same number of perceived visibility as baggage claim (47%).
This uneven perception may stem from several factors, such as the environment, the attention load by zone function, and the time spent in each zone. Lighting might affect visibility, as process-heavy zones such as security and immigration are typically more brightly lit and task-oriented, narrowing attentional focus and reducing awareness of peripheral cues such as greenery. Conversely, discretionary zones such as lounges and retail areas often feature softer lighting, longer dwell times, and lower task demands, which increase the likelihood of noticing plants.
Secondly, sizable planting does not guarantee being registered, as the airport-experience framework argues that passengers’ attention is dominated by the immediate task demand [1]. In process-heavy zones such as baggage claim, passengers might also have to process a lot of visual information at once, looking for a screen to locate the right belt, identify baggage, find the exit sign, etc. Therefore attention capacity becomes overloaded, leaving none to notice the plants. This aligns with environmental psychology theories suggesting that restorative stimuli require available attentional resources to be consciously perceived [8,20,55].
Finally, in addition to the absence of a procedural checklist, dwell time might be another critical factor in visibility, as almost half of passengers (46%) reported spending 1 to 2 h there. Thus, the takeaway from RQ1 is not about how much planting exists but where it is placed relative to the task in each zone.
4.4. Plant Visibility and Passenger Stress (RQ 2)
Seeing planting did not coincide with lower self-reported stress in most zones, except for arrivals. This contrasts with earlier findings in office and healthcare settings, where higher planting density consistently increased perceived greenness [23,56]. Two mechanisms may explain this phenomenon. First, the Stimulus-Organism-Response model states that a sensory cue must reach awareness before it can influence emotion [9]. However, as seen in the uneven visibility results in RQ1, the chain can stall at the organism stage as procedural attention and stress eclipse the restorative stimuli [20]. Second, other airport-based studies bundle planting with other “green atmospherics” items such as daylight, materials, or air quality [35]. Therefore, isolating plants in zones might explain the weak effects observed.
4.5. Stress Level and Behaviour (RQ 3a)
Where behaviour could be examined, two patterns are evident. First, higher stress levels are associated with longer dwell times. However, the finding should be treated cautiously, as the types of procedures drive dwell time, e.g., longer waits in queues produce higher stress. Secondly, behaviour mapping during check-in and arrivals indicates that voluntary pauses and social activities in seating areas might provide a view of available plants. This pattern is consistent with the S-O-R pathway, where stress is low and planting is salient, passengers express approach behaviour by lingering. However, the reported stress is not based on observed people, and mapping was not feasible in high-stress zones; therefore, this report serves as an illustrative context.
4.6. Stress Level and Plant Demand (RQ 3b)
Stress level shows no association with plant demand, which can be attributed to passengers being more concerned about the efficiency of processes in high-stress zones [1]. If the physical environment hinders passengers from accomplishing their goals, the problem needs to be addressed first, overshadowing their need for aesthetics such as plants [8].
Instead, plant demand is significantly driven by visibility, regardless of how they are feeling or how much time they spent in each zone. This mirrors past studies that reported seeing green atmospherics attracts passengers, even if baseline arousal is moderate [35]. The baseline attitude, that respondents have a general preference for images with more planting and believe its benefits in reducing stress, may also explain why passengers do not necessarily need to reach a high stress level to demand more planting.
4.7. Design Implications
Instead of simply adding more plants, this study proposes focusing on the visibility of biophilic elements as a measurable design factor that supports passenger wellbeing and enhances customer experience metrics already tracked by airports. Tools such as line-of-sight mapping and lighting contrast analysis [57,58,59] provide the means to objectively assess visibility. Incorporating visibility analysis to airport design review frameworks such as IATA Level of Service, WELL, or LEED standards [60,61,62] would enable biophilic elements to be incorporated into quantifiable metrics that enhance wellbeing and business goals.
For refurbishments, planting must be placed in passengers’ sight lines and ideally tested first with mock-ups and performance reviews. Process-heavy zones, such as baggage claim, might benefit from trialling integration with signage to ensure visibility. On the other hand, zones with potentially long queues, such as security and immigration, might consider trialling higher plantings at signage level, above the line of heads.
For new builds, these findings suggest that architects and interior designers should integrate visibility analysis into the early stages of spatial planning and design review. This would ensure that planting remains perceptually accessible once operational layouts, signage, and passenger flows are finalised.
4.8. Wider Implications
Interestingly, the results indicate a partial activation of the Stimulus–Organism–Response (S–O–R) sequence. Visibility of plants (stimulus) influenced passengers’ demand (response) even when perceived stress (organism) did not decrease, suggesting a more direct stimulus–response pathway. Similar deviations from the full S–O–R chain have been reported in studies of time-critical or cognitively loaded settings, where environmental cues trigger approach behaviours without measurable emotional change [63,64]. These findings highlight its context-dependent flexibility, showing that the “organism” stage can weaken when attentional capacity is constrained.
From an operational perspective, linking passenger perception to environmental design evaluation can inform post-occupancy assessment and refurbishment decisions. As airports increasingly adopt data-driven design evaluation [65], plant visibility could be integrated as a sub-criterion under spatial comfort, complementing thermal, acoustic, and lighting comfort indicators. Moreover, adding a single-item stress measure alongside satisfaction metrics would help determine whether the design changes affect the organism stage at all.
4.9. Limitations
The survey sample (N = 104) represents a small proportion of total passenger traffic for a major international terminal. Most passenger satisfaction studies use around 300 samples collected over a minimum of 1 month [5,65]. By contrast, this exploratory study emphasises perceptual depth and triangulation with field observation, providing qualitative–quantitative insight within the constraints of a three-month research window. Additionally, this research uses a single case study, which provides a narrow empirical base; therefore, generalisation should be conducted with caution.
Observation and approach for on-site survey participants was performed in public, at landslide zones in the international part of the terminal (check-in and arrivals) for eighteen hours in a tropical summer. Patterns could change in different months or seasons, hours could change from night to earlier in the morning, and locations could change in other unobserved zones and other terminals and airports. The plant audit was a rapid walk-through, which might lead to inaccurate plant visibility, resulting in it being under- or overstated. All observations were recorded by the author, limiting them to objective postures and activities.
As for the analysis, Likert items (1–5) were split into 2 × 2 tables, which may reduce detail [66]. Furthermore, question D3 about seeing plants reducing stress may reflect a general attitude toward plants rather than their feelings about the terminal’s exposure. Finally, some zone-level 2 × 2 contingency tables have small, expected cell counts (<5), leading to wide CIs.
To evaluate potential recall bias due to the predominance of online responses, an independent-samples t-test was conducted on key items comparing online and on-site subsamples. Results showed no significant differences in stress, visibility, or dwell time, except for plant demand in the security zone, where on-site participants reported higher preference (p < 0.05). This suggests that recall effects were minimal, supporting the general comparability of both datasets.
These limits further underscore that the findings are exploratory and need to be expanded and replicated across multiple airport settings and seasons before a general conclusion can be drawn.
4.10. Future Research
Future studies could employ larger, stratified samples to validate these findings across different passenger demographics and terminals. It could expand into field experiments: installing temporary plantings in specific zones and tracking real-time physiological stress symptoms—using portable devices, such as heart rate and brain activity [56]—before and after the intervention. This mimics previous studies in other settings—healthcare, workplaces, and education— and would provide stronger evidence beyond mere correlation. Incorporating objective measures of visual attention (e.g., eye-tracking or gaze mapping) would also provide an objective dataset on plant visibility, rather than relying on subjective perception.
Observations would be carried out in teams to cover a larger area or to focus on smaller zones, enabling detailed behavioural monitoring, such as recording stress-related expressions and micro movements. Furthermore, extending the study duration would provide greater temporal coverage, revealing additional variables, such as passengers’ circadian cycles.
Planting provisions differ across terminals and airports, influenced by factors such as planting types (green wall, free-standing pots, indoor vs. outdoor garden, real vs. artificial) and density. Examining these variables can reveal their effects on passenger response. It could also be extended to multiple airports—designed versus refurbished—to see how planned integration yields a more substantial effect [35].
Finally, pairing passenger data with management records on installation and maintenance costs, and design-intent interviews would address practical concerns of respondents and other airport management seeking justification for refurbishment.
5. Conclusions
This study investigates indoor planting through three questions: where plants are noticed, whether seeing plants relates to stress, and whether stress relates to behaviour and plant demand. Using a mixed-methods approach, the study collected survey and observational data from Terminal 3 at Jakarta International Airport for analysis.
The findings show that, first, passengers prefer environments with lush landscaping and believe it benefits them by lowering stress. However, plant availability and quantity did not predict whether they consciously noticed the plants. Overall plant awareness was high, but it differed within zones, with the lowest visibility at procedural bottlenecks. The plant audit confirmed that plant volume can be invisible if it is outside of the passenger’s task-focused line of sight. Second, stress does vary by zone and is concentrated where procedural activities are central. In most zones, seeing plants does not lower stress, as passengers’ stress may overshadow their effect, or isolating plants reduces their impact compared to integrating them with other biophilic elements. Third, stress and dwell time are correlated, but plant demand is driven by visibility rather than stress.
This study contributes to biophilic design research by isolating plant visibility as a specific variable within “green atmospherics”. Moreover, combining observation and survey methods advances the assessment of how biophilic cues function in dynamic, high-stress environments like airports. Conceptually, it extends the Stimulus–Organism–Response framework to transient public spaces, demonstrating how procedural attention and spatial function can moderate restorative outcomes.
In practice, this study recommends that existing buildings strategically place plants rather than increasing quantity, improve visibility and sightline mapping, and test plant installations to assess perceptions and measure outcomes prior to refurbishments. For new builds to integrate visibility analysis in early stages of design and to incorporate it into existing airport design standards. At the operational level, incorporating perceptual wellbeing indicators into airport post-occupancy evaluations could align environmental quality metrics with psychological comfort and operational performance.
Limitations for this study’s data collection and analyses include a limited sample from a single case study, time constraints, a single observer, and possible loss of nuance due to dichotomisation. Future work should prioritise experiments with various planting types at choke points, combine physiological measurements with longitudinal studies across multiple terminals, and gather input from designers or airport management. Although the findings should be read as exploratory, this study offers a practical, zone-specific take on prioritising plant visibility over quantity to improve passengers’ wellbeing in airports.
Supplementary Materials
The following supporting information can be downloaded at: https://www.mdpi.com/article/10.3390/buildings15224065/s1, Table S1: Open ended questions and themes, Table S2: Whole sample descriptives, Table S3: B2 wilcoxon pair results, Table S4: D2 × B2 per zone 2 × 2. Results, Table S5: B2 × D4 per zone spearman results, Table S6: B2 × D4 per zone 2 × 2 results, Table S7: B2 × B1 per zone spearman results, Table S8: B2 × B1 per zone 2 × 2 results, Table S9: B1 × D4 per zone spearman results, Table S10: B1 × D4 per zone 2 × 2 results, Table S11: D2 × D4 per zone 2 × 2 results, Figure S1: D2 × B2 forest plot, Figure S2: B2 × D4 forest plot, Figure S3: B2 × B1 forest plot, Figure S4: B1 × D4 forest plot, Figure S5: D2 × D4 Forest plot.
Author Contributions
Conceptualization, K.A. and F.A.; Methodology, K.A. and F.A.; Software, K.A.; Validation, K.A.; Formal analysis, K.A.; Investigation, K.A. and F.A.; Resources, K.A.; Data curation, K.A.; Writing—original draft, K.A.; Writing—review & editing, K.A. and F.A.; Visualization, K.A.; Supervision, F.A. All authors have read and agreed to the published version of the manuscript.
Funding
The author gratefully acknowledges financial support from the Indonesian Endowment Fund for Education (LPDP), whose scholarship made the research possible.
Institutional Review Board Statement
The study was conducted in accordance with the Declaration of Helsinki and approved by Bartlett School of Environment Energy and Resources Local Research Ethics Committee (BSEER LREC) at University College London—approval letter: 10 June 2025.
Informed Consent Statement
Informed consent was obtained from all subjects involved in the study.
Data Availability Statement
The raw data supporting the conclusions of this article will be made available by the authors on request.
Acknowledgments
The author thanks the 153 participants who completed the survey and the people who helped spread the online survey. The authors have reviewed and edited the output and take full responsibility for the content of this publication.
Conflicts of Interest
The authors declare no conflicts of interest.
Abbreviations
The following abbreviations are used in this manuscript:
| OR | Odds ratio |
| CMH | Cochran–Mantel–Haenszel |
| MH | Mantel–Haenszel |
| RQ | Research question |
| CI | Confidence interval |
| GOF | Goodness of fit |
Appendix A
Table A1.
List of activities.
Table A1.
List of activities.
| Code | Activity |
|---|---|
| -> (arrow) | Transit/moving |
| ask | Ask standing staff |
| OB | Opening luggage |
| look @ screen | Look at information screen |
| B | Looking around/nowhere |
| makeup/skincare | Wearing makeup/skincare |
| eat | Drinking and eating |
| stretch | Stretching |
| sleep | Sleeping |
| read | Reading book |
| on floor | Activities on the floor |
| laptop | Working on laptop |
| C | Calling on phone |
| P | Looking at phone |
| charge | Charging device, usually while also using |
| take pics | Taking pictures |
| T | Discussing |
| hug | Hugging |
| play | Playing |


Figure A1.
Images of plants inside the terminal: (a) artificial plants along the entire roofline; (b) integrated plants in check-in counters; (c) plant island at the international departure gate; (d) artificial palm trees along the railing; (e) departure lounge; (f) green walls in the hallway between disembarking and immigration; (g) potted plants in front of border control gates; (h) baggage claim plantings on the conveyor belt; (i) baggage claim green walls; (j) arrivals hall. Numbers on the images refer to the location where the pictures were taken, depicted in Figure 10.
References
- Wattanacharoensil, W.; Schuckert, M.; Graham, A. An Airport Experience Framework from a Tourism Perspective. Transp. Rev. 2016, 36, 318–340. [Google Scholar] [CrossRef]
- Edwards, B. The Modern Airport Terminal, 2nd ed.; Taylor & Francis: Abingdon, UK, 2005. [Google Scholar]
- CPP Stress and Airport Travelling; CPP Investments: Toronto, ON, Canada, 2011; Available online: https://www.slideshare.net/slideshow/stress-and-airport-travelling/8514518 (accessed on 24 September 2025).
- da Cunhaa, D.A.; Aguiara, B.; Macárioa, R.; Reisa, V. Evaluating Passenger Stress at Airports to Enhance Passenger Experience. In Proceedings of the 15th World Conference on Transport Research, Mumbai, India, 26–31 May 2019. [Google Scholar]
- Bogicevic, V.; Yang, W.; Cobanoglu, C.; Bilgihan, A.; Bujisic, M. Traveler Anxiety and Enjoyment: The Effect of Airport Environment on Traveler’s Emotions. J. Air Transp. Manag. 2016, 57, 122–129. [Google Scholar] [CrossRef]
- Bor, R. Psychological Factors in Airline Passenger and Crew Behaviour: A Clinical Overview. Travel Med. Infect. Dis. 2007, 5, 207–216. [Google Scholar] [CrossRef]
- Graham, A. Managing Airports: An International Perspective, 6th ed.; Routledge: Abingdon, UK, 2023. [Google Scholar]
- Bitner, M.J. Servicescapes: The Impact of Physical Surroundings on Customers and Employees. J. Mark. 1992, 56, 57–71. [Google Scholar] [CrossRef]
- Mehrabian, A.; Russell, J.A. An Approach to Environmental Psychology; The MIT Press: Cambridge, MA, USA, 1974. [Google Scholar]
- Bogicevic, V. The Effect of Airport Servicescape Features on Traveler Anxiety and Enjoyment. Master’s Thesis, University of South Florida, Tampa, FL, USA, 2014. [Google Scholar]
- Kim, J.H.; Park, J.W. The Effect of Airport Self-Service Characteristics on Passengers’ Perceived Value, Satisfaction, and Behavioral Intention: Based on the SOR Model. Sustainability 2019, 11, 5352. [Google Scholar] [CrossRef]
- Antwi, C.O.; Ren, J.; Zhang, W.; Owusu-Ansah, W.; Aboagye, M.O.; Affum-Osei, E.; Agyapong, R.A. “I Am Here to Fly, but Better Get the Environment Right!” Passenger Response to Airport Servicescape. Sustainability 2022, 14, 10114. [Google Scholar] [CrossRef]
- Priority Pass Airport Stress Survey. Available online: https://www.prioritypass.com/blog/2019/airport-stress-survey (accessed on 15 April 2025).
- Kim, M.H.; Park, J.W.; Choi, Y.J. A Study on the Effects of Waiting Time for Airport Security Screening Service on Passengers’ Emotional Responses and Airport Image. Sustainability 2020, 12, 10634. [Google Scholar] [CrossRef]
- Donnelly, A. Improving the Air Travelers Experience Through Airport Design. Master’s Thesis, State University of New York at Buffalo, Buffalo, NY, USA, 2021. [Google Scholar]
- T-Online Flughafen: Umfrage Deckt Größte Stressfaktoren Auf. Available online: https://www.t-online.de/leben/aktuelles/id_100511940/flughafen-umfrage-deckt-groesste-stressfaktoren-auf.html (accessed on 18 August 2025).
- Livingstone, A.; Popovic, V.; Kraal, B.; Kirk, P.J. Understanding the Airport Passenger Landside Retail Experience. In Proceedings of the DRS 2012 Bangkok-Research: Uncertainty, Contradiction and Value, Bangkok, Thailand, 1–4 July 2012. [Google Scholar]
- Mooi, J. Transforming Borders: Transforming the Airports Built Environment Through Environmental Psychology, Proxemics and Therapeutic Design. Ph.D. Thesis, Carleton University, Ottawa, ON, Canada, 2014. [Google Scholar]
- Kaplan, R.; Kaplan, S. The Experience of Nature: A Psychological Perspective; Cambridge University Press: Cambridge, MA, USA, 1989. [Google Scholar]
- Ulrich, R.S.; Simons, R.F.; Losito, B.D.; Fiorito, E.; Miles, M.A.; Zelson, M. Stress Recovery during Exposure to Natural and Urban Environments. J. Environ. Psychol. 1991, 11, 201–230. [Google Scholar] [CrossRef]
- Aristizabal, S.; Byun, K.; Porter, P.; Clements, N.; Campanella, C.; Li, L.; Mullan, A.; Ly, S.; Senerat, A.; Nenadic, I.Z.; et al. Biophilic Office Design: Exploring the Impact of a Multisensory Approach on Human Well-Being. J. Environ. Psychol. 2021, 77, 101682. [Google Scholar] [CrossRef]
- Yin, J.; Zhu, S.; MacNaughton, P.; Allen, J.G.; Spengler, J.D. Physiological and Cognitive Performance of Exposure to Biophilic Indoor Environment. Build. Environ. 2018, 132, 255–262. [Google Scholar] [CrossRef]
- Beukeboom, C.J.; Langeveld, D.; Tanja-Dijkstra, K. Stress-Reducing Effects of Real and Artificial Nature in a Hospital Waiting Room. J. Altern. Complement. Med. 2012, 18, 329–333. [Google Scholar] [CrossRef]
- Han, K.T.; Ruan, L.W. Effects of Indoor Plants on Self-Reported Perceptions: A Systemic Review. Sustainability 2019, 11, 4506. [Google Scholar] [CrossRef]
- Chi, P.G.; Idris, M.Z.; Yusoff, S.O.S. Tourism Service Design: Promoting Malaysia Cultural through National Brand in Kuala Lumpur International Airport (KLIA). Int. J. Acad. Res. Bus. Soc. Sci. 2018, 8, 686–695. [Google Scholar] [CrossRef] [PubMed]
- Mironov, L. Airport Aura: A Spatial History of Airport Infrastructure; ETH Zurich: Zürich, Switzerland, 2020; ISBN 978-3-7281-3991-7. [Google Scholar] [CrossRef]
- Sabljic, S. A Design Investigation into the Desired Way of Influencing Peoples Waiting Experience at a Future Airport. Bachelor’s Thesis, University of Twente, Twente, The Netherlands, 2016. [Google Scholar]
- Bamidele, R.O.; Ozturen, A.; Haktanir, M.; Ogunmokun, O.A. Realizing Green Airport Performance through Green Management Intransigence, Airport Reputation, Biospheric Value, and Eco-Design. Sustainability 2023, 15, 2475. [Google Scholar] [CrossRef]
- LEPL Changi Airport Terminal 3 Outdoor Butterfly Garden—LEPL. Available online: https://www.lepl.com.sg/projects/changi-airport-t3-butterfly-garden/ (accessed on 26 August 2025).
- Hamad International Airport ORCHARD. Available online: https://dohahamadairport.com/press-releases/news/hamad-international-airport-marks-one-year-opening-orchard (accessed on 26 August 2025).
- Patrick Blanc Qantas Lounge Sydney. Available online: https://www.verticalgardenpatrickblanc.com/realisations/sydney/qantas-lounge-sydney (accessed on 26 August 2025).
- Han, H.; Koo, B.; Chua, B.L.; Sul, H.K.; Jenny Kim, J. Travelers’ Intentions for Green Behaviors at Airports: Exploring the Effect of Green Physical Surroundings Using Mixed Methods. J. Hosp. Tour. Manag. 2020, 45, 569–579. [Google Scholar] [CrossRef]
- Han, H.; Lho, L.H.; Kim, H.C. Airport Green Environment and Its Influence on Visitors’ Psychological Health and Behaviors. Sustainability 2019, 11, 7018. [Google Scholar] [CrossRef]
- Hasanzade, M.P.; van Oel, C.J.; Pazhouhanfar, M. Passengers’ Preferences for Architectural Design Characteristics in the Design of Airport Terminals. Archit. Eng. Des. Manag. 2023, 19, 586–601. [Google Scholar] [CrossRef]
- Han, H.; Olya, H.G.T.; Untaru, E.N.; Ispas, A.; Kim, J.J.; Kim, W. Impact of Airport Green Atmospherics on Mental Health Value, Image, and Loyalty Among Visitors and Workers. Bus. Strategy Environ. 2020, 29, 1186–1198. [Google Scholar] [CrossRef]
- Bendjedidi, S.; Bada, Y.; Meziani, R. Urban Plaza Design Process Using Space Syntax Analysis: El-Houria Plaza, Biskra, Algeria. Int. Rev. Spat. Plan. Sustain. Dev. 2019, 7, 125–142. [Google Scholar] [CrossRef]
- Yin, Y.; Shao, Y.; Meng, Y.; Hao, Y. The Effects of the Natural Visual-Aural Attributes of Urban Green Spaces on Human Behavior and Emotional Response. Front. Psychol. 2023, 14, 1186806. [Google Scholar] [CrossRef]
- Cox, A.; Loebach, J.; Little, S. Understanding the Nature Play Milieu: Using Behavior Mapping to Investigate Children’s Activities in Outdoor Play Spaces. Child. Youth Environ. 2018, 28, 232–261. [Google Scholar] [CrossRef]
- ZGF How Biophilic Design Is Transforming the Airport Experience. Available online: https://metropolismag.com/viewpoints/biophilic-design-passenger-centric-spaces/ (accessed on 3 July 2025).
- Hähn, N.; Essah, E.; Blanusa, T. Biophilic Design and Office Planting: A Case Study of Effects on Perceived Health, Well-Being and Performance Metrics in the Workplace. Intell. Build. Int. 2021, 13, 241–260. [Google Scholar] [CrossRef]
- Landscaping of Soekarno-Hatta Airport—AKDN. Available online: https://the.akdn/en/how-we-work/our-agencies/aga-khan-trust-culture/akaa/landscaping-soekarno-hatta-airport (accessed on 18 August 2025).
- Nasution, A.A.; Azmi, Z.; Siregar, I.; Erlina, I. Impact of Air Transport on the Indonesian Economy. In Proceedings of the MATEC Web of Conferences, Vienna, Austria, 21 November 2018; EDP Sciences: Les Ulis, France; Volume 236. [Google Scholar]
- Tempo. Melihat Wajah Baru Terminal 3 Bandara Soekarno-Hatta Yang Bernuasa Hutan Tropis; Tempo: Jakarta, Indonesia, 2025. [Google Scholar]
- Goel, E. Kempegowda International Airport Bengaluru—Terminal 2. Available online: https://www.som.com/projects/kempegowda-international-airport-bengaluru-terminal-2/ (accessed on 27 August 2025).
- Chapman Taylor Heathrow Airport T5. Available online: https://www.chapmantaylor.com/projects/t5-heathrow-airport (accessed on 27 August 2025).
- InJourney Airports T3 Check-in Counters|Soekarno Hatta. Available online: https://soekarnohatta.injourneyairports.id/en (accessed on 27 August 2025).
- Ittelson, W.H.; Rivlin, L.G.; Prohansky, H.M. The Use of Behavioral Maps in Environmental Psychology. In Environmenntal Psychology: People and Their Physical Setting; Ittelson, W.H., Rivlin, L.G., Prohansky, H.M., Eds.; Holt, Rinehart & Winston: New York, NY, USA, 1970. [Google Scholar]
- Ng, C.F. Behavioral Mapping and Tracking. In Research Methods for Environmental Psychology; John Wiley & Sons: Hoboken, NJ, USA, 2016; pp. 29–51. [Google Scholar]
- Trofimova, T.E. Greenspace Design for Airports. In IOP Conference Series: Earth and Environmental Science; Institute of Physics Publishing: Philadelphia, PA, USA, 2020; Volume 459. [Google Scholar]
- Sanders, T.; Flores, S.; Hoelting, M. A Data-Driven Approach to Elevating Airport Experiences: Insights from Ontario International Airport’s Journey Mapping Analysis. J. Airpt. Manag. 2024, 19, 33–56. [Google Scholar] [CrossRef]
- Vidal, D.G.; Teixeira, C.P.; Fernandes, C.O.; Olszewska-guizzo, A.; Dias, R.C.; Vilaça, H.; Barros, N.; Maia, R.L. Patterns of Human Behaviour in Public Urban Green Spaces: On the Influence of Users’ Profiles, Surrounding Environment, and Space Design. Urban For. Urban Green. 2022, 74, 127668. [Google Scholar] [CrossRef]
- Braun, V.; Clarke, V. Toward Good Practice in Thematic Analysis: Avoiding Common Problems and Be(Com)Ing a Knowing Researcher. Int. J. Transgender Health 2023, 24, 1–6. [Google Scholar] [CrossRef]
- WMA. WMA Declaration of Helsinki. Available online: https://www.wma.net/policies-post/wma-declaration-of-helsinki/ (accessed on 21 August 2025).
- Wilson, E.O. Biophilia; Harvard University Press: Cambridge, MA, USA, 1984; ISBN 9780674074422. [Google Scholar]
- Kaplan, S. The Restorative Benefits of Nature: Toward an Integrative Framework. J. Environ. Psychol. 1995, 15, 169–182. [Google Scholar] [CrossRef]
- Al Sayyed, H.; Al-Azhari, W. Investigating the Role of Biophilic Design to Enhance Comfort in Residential Spaces: Human Physiological Response in Immersive Virtual Environment. Front. Virtual Real. 2025, 6, 1411425. [Google Scholar] [CrossRef]
- Zhang, G.T.; Verbree, E.; Wang, X.J. An Approach to Map Visibility in the Built Environment from Airborne LiDAR Point Clouds. IEEE Access 2021, 9, 44150–44161. [Google Scholar] [CrossRef]
- Wu, Z.; Wang, Y.; Gan, W.; Zou, Y.; Dong, W.; Zhou, S.; Wang, M. A Survey of the Landscape Visibility Analysis Tools and Technical Improvements. Int. J. Environ. Res. Public Health 2023, 20, 1788. [Google Scholar] [CrossRef] [PubMed]
- Cavaglià, M.; Speroni, A.; Blanco Cadena, J.D.; Mainini, A.G.; Poli, T. Exploring Built Environment Visual Interactions: A SoftBIM Data-Driven Approach for a Database About the Outdoor View. Buildings 2024, 14, 3340. [Google Scholar] [CrossRef]
- IATA. Airport Development Reference Manual, 12th ed.; International Air Transport Association: Geneva, Switzerland, 2022. [Google Scholar]
- V2 2020; WELL Building Standard. IWBI: New York, NY, USA, 2020.
- USGBC LEED, v4.1. Building Design and Construction Guide 2021. USGBC: Washington, DC, USA, 2021.
- Vieira, V.A. Stimuli–Organism-Response Framework: A Meta-Analytic Review in the Store Environment. J. Bus. Res. 2013, 66, 1420–1426. [Google Scholar] [CrossRef]
- Kim, J.; Lennon, S.J. Effects of Reputation and Website Quality on Online Consumers’ Emotion, Perceived Risk and Purchase IntentionBased on the Stimulus-organism-response Model. J. Res. Interact. Mark. 2013, 7, 33–56. [Google Scholar] [CrossRef]
- Han, H.; Quan, W.; Lho, L.H.; Yu, J. Eco-Design of Airport Buildings and Customer Responses and Behaviors: Uncovering the Role of Biospheric Value, Reputation, and Subjective Well-Being. Sustainability 2020, 12, 10059. [Google Scholar] [CrossRef]
- MacCallum, R.C.; Zhang, S.; Preacher, K.J.; Rucker, D.D. On the Practice of Dichotomization of Quantitative Variables. Psychol. Methods 2002, 7, 19–40. [Google Scholar] [CrossRef] [PubMed]
Disclaimer/Publisher’s Note: The statements, opinions and data contained in all publications are solely those of the individual author(s) and contributor(s) and not of MDPI and/or the editor(s). MDPI and/or the editor(s) disclaim responsibility for any injury to people or property resulting from any ideas, methods, instructions or products referred to in the content. |
© 2025 by the authors. Licensee MDPI, Basel, Switzerland. This article is an open access article distributed under the terms and conditions of the Creative Commons Attribution (CC BY) license (https://creativecommons.org/licenses/by/4.0/).