1. Introduction
The ground motions with a rupture distance (Rrup) of less than 20 km are classified as near-field motions, which pose significant threats to engineering structures such as bridges due to their unique characteristics [
1,
2]. Compared with far-field ground motions, near-fault motions exhibit distinctly different features, including velocity pulse effects [
3], directivity effects [
4,
5], site effects [
6], and remarkable vertical ground motion components [
7]. These characteristics lead to more complex and less predictable structural seismic responses [
8]. Pulse effects manifest as high-energy seismic waves within short time intervals, which can impose substantial instantaneous impacts on structures [
9,
10,
11]. Directivity effects, related to the direction and velocity of fault rupture, may cause significant amplification of ground motion in specific directions [
4,
12]. Site effects refer to the influence of local geological conditions on ground motions; for instance, basin or valley topography may amplify seismic waves, resulting in more severe damage [
6]. Vertical ground motions alter structural force mechanisms and affect safety, particularly for long-span bridges and tall-pier bridges, where their influence cannot be neglected [
13].
Owing to the aforementioned complex characteristics of near-fault ground motions, bridge structures face severe challenges in seismic design [
14,
15]. Traditional response spectrum theory, predominantly developed based on the properties of far-field ground motions, does not adequately account for the intricate features of near-fault seismic events. Near-fault pulse-like ground motions, characterized by large amplitude, long period, and high energy content, expose the limitations of current code-specified response spectrum methods in accurately capturing their impact on bridge structures [
16,
17,
18,
19]. Consequently, research focused on developing response spectra that better represent near-fault ground motion characteristics is of paramount importance for advancing the seismic design of bridges.
In the field of bridge engineering, simply supported girder bridges represent one of the most common structural systems, widely employed in ordinary highway bridges, urban municipal bridges, and high-speed railway bridges [
20,
21]. However, due to their inherent structural characteristics of relatively poor integrity, multi-span simply supported girder bridges often exhibit more pronounced dynamic responses under seismic action compared to other types of girder bridges [
22,
23]. Historical earthquake damage investigations have shown that simply supported girder bridges demonstrate high vulnerability in destructive earthquakes. The resulting damage not only severely compromises the safety performance of the bridge structure but also significantly impedes post-earthquake traffic recovery and emergency rescue operations [
24].
The seismic performance of bridge structures under near-fault ground motions has garnered significant attention in recent research [
25,
26]. Existing studies have primarily focused on three areas: the distinctive features of such motions [
27,
28], the resulting bridge seismic responses [
26,
29], and the development of corresponding design strategies [
30]. Research indicates that near-fault motions, characterized by pronounced velocity pulses, induce failure modes in girder bridges that differ markedly from those caused by far-field motions. These include a higher propensity for pier damage and even unseating of bridge spans. The inherent pulse effect significantly amplifies structural deformations and internal forces, while the directivity effect further complicates the response, necessitating careful consideration of the relative orientation between the fault rupture and the bridge alignment. In response, the strategic selection and placement of isolation or energy dissipation devices have proven effective in mitigating these effects [
31]. However, a fundamental challenge persists due to the scarcity of recorded near-fault motion data. This scarcity often precludes robust statistical analysis of their characteristics and hinders a complete understanding of their impact on structural behavior.
Therefore, this study conducts a comprehensive collection of actual near-fault ground motion records from domestic and international sources, followed by systematic investigation through response spectrum analysis. Statistical analyses are performed to examine the influencing patterns of site effects, pulse effects, and vertical ground motions on near-fault seismic response spectra. Subsequently, these actual ground motions are input into a typical girder bridge model developed using MIDAS Civil 2023 (v3.1) software, enabling multi-perspective analysis and discussion of the structural response characteristics.
2. Selection of Ground Vibration Records
The ground vibration records in this paper are selected from the NGA-West2 strong ground motion database [
32], which mainly covers the earthquake-prone countries and regions such as the United States, Japan, and Taiwan, China. The selection principles are as follows:
Moment magnitude (of earthquake) Mw ≥ 5;
Peak ground acceleration PGA ≥ 0.02 g.
Each group contains one vertical component and two horizontal components, resulting in 941 sets of ground vibration records, of which 1882 are horizontal ground vibrations and 941 are vertical ground vibrations.
Since the site conditions recorded by the stations obtained from the NGA-West2 database are expressed in terms of the equivalent shear wave velocity Vs30 within 30 m below the ground surface, the sites in China are classified into four Site Classification according to the equivalent shear wave velocity Vs30 of the soil layer overlying the site at 20 m below the ground surface and the soil thickness. In China, the site condition is divided into four Site Classification based on the dual indexes of the equivalent shear wave velocity Vs30 and soil thickness of the soil overlying the site 20 m below the surface. In this paper, the correspondence between the Vs30 and the Site Classification specified in the Chinese code is shown in
Table 1 referring to [
33].
The selected ground motion records were classified according to fault distance, pulse-like characteristics, and site class, with the resulting distributions presented in
Table 2. Owing to the limited number of records for Site Classes I
0 and IV, Site Classes I
0 and I
1 were grouped together as Site Class I, and Site Class IV was omitted from subsequent analysis to uphold the robustness of the statistical findings. Accordingly, the identification of pulse-like motions was conducted using an established wavelet-based quantitative procedure [
34].
First, the peak ground acceleration ratio PGA
V/PGA
H for each set of ground motion records was calculated. As a scalar parameter, PGA effectively quantifies the maximum acceleration response along three orthogonal directions, proving particularly suitable for assessing the high-frequency characteristics of near-field ground motions and the structural response of elements sensitive to vertical loading. This ratio PGA
V/PGA
H is defined as the peak acceleration of the vertical component divided by the larger peak acceleration of the two horizontal components from the same station (i.e., the same set). The selection of PGA as the primary metric for characterizing the relative intensity between the vertical and horizontal components of ground motion is a decision stemming from a trade-off among its direct representation of high-frequency inertial forces, the clarity of its physical interpretation, and the universality of available engineering data. As a scalar parameter, PGA effectively quantifies the maximum acceleration response along three orthogonal directions, proving particularly suitable for assessing the high-frequency characteristics of near-field ground motions and the structural response of elements sensitive to vertical loading. The ratios of the 941 ground motion records were grouped into intervals of 0.1, and the frequency of samples in each interval was counted to obtain the probability density distribution of the peak ratios, as shown in
Figure 1. The probability density distribution of PGA
V/PGA
H exhibits a left-steep and right-gentle pattern, approximating a log-normal distribution, with the fitted curve shown as the red line in the figure. The minimum value of PGA
V/PGA
H lies within the interval (0, 0.2), while the maximum falls within (3.7, 3.8). The mean value is 0.615, with a 95% confidence interval of [0.589, 0.640]. The standard deviation is 0.388, accompanied by a 95% confidence interval of [0.554, 0.607]. The fitted cumulative distribution probability curve of PGA
V/PGA
H is shown in
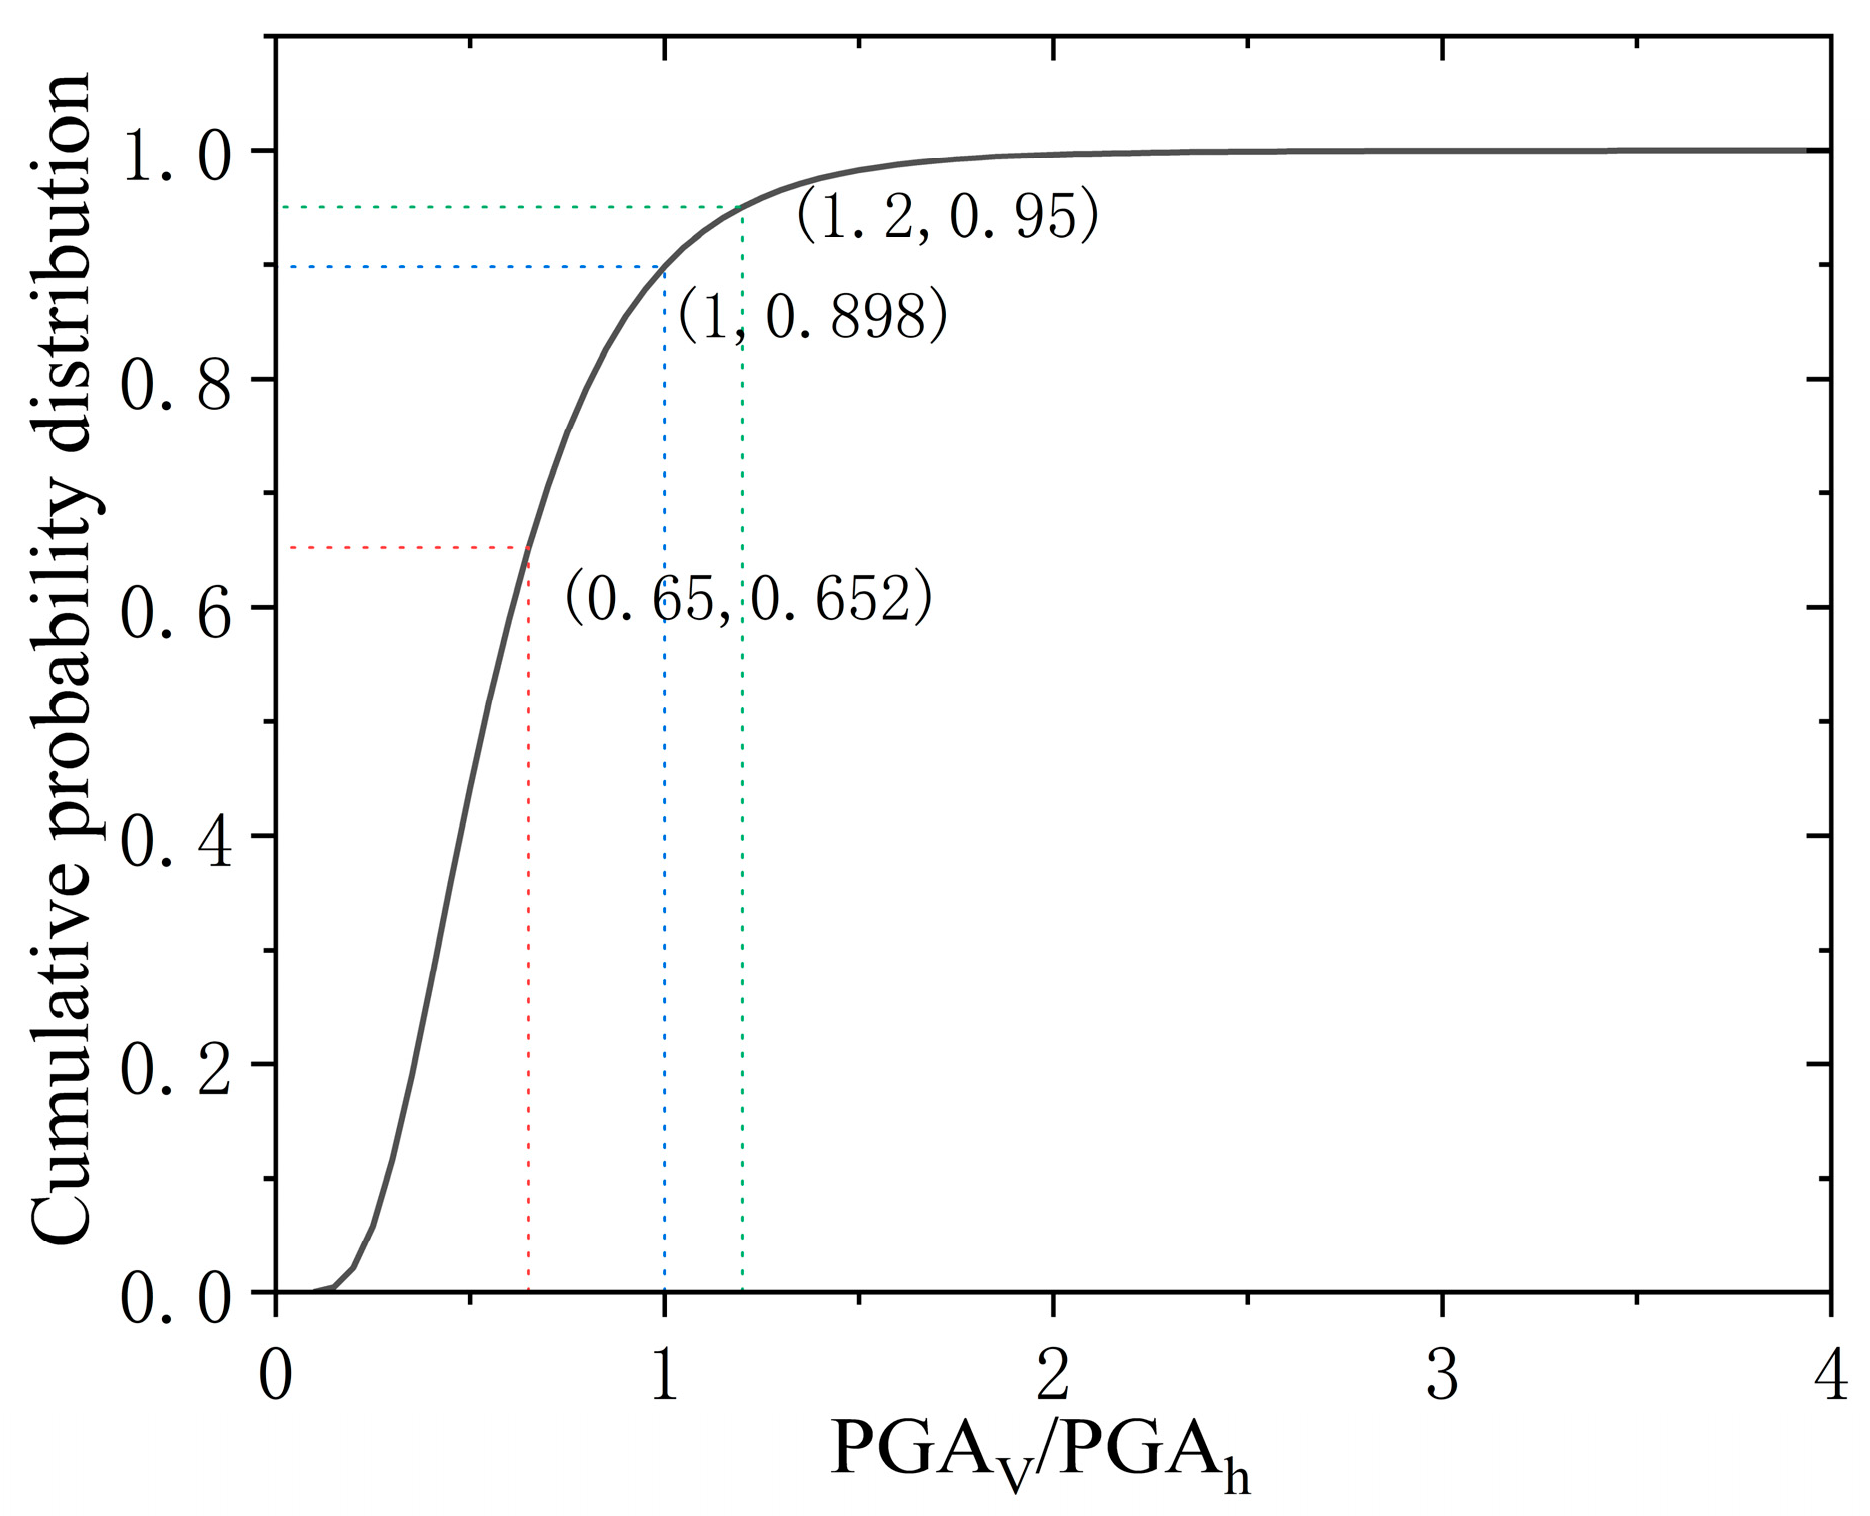
Figure 2. The conventional approach in many seismic design codes, which equates the vertical seismic action to a fixed fraction (e.g., 0.65) of the horizontal action, is critically examined against empirical data. Our analysis reveals that the probability of the vertical-to-horizontal peak acceleration ratio (V/H) exceeding 0.65 is 34.8%. Moreover, this ratio surpasses 1.0 and 1.2 with probabilities of 10.2% and 5.0%, respectively. These significant probabilities demonstrate that the simplified code provision is potentially unconservative, as it fails to represent the high intensity of vertical shaking observed in real events, particularly in near-fault regions. Consequently, a more sophisticated consideration of vertical ground motion, especially for near-field conditions, is essential for ensuring structural safety.
The distribution of the peak ground acceleration ratio PGA
V/PGA
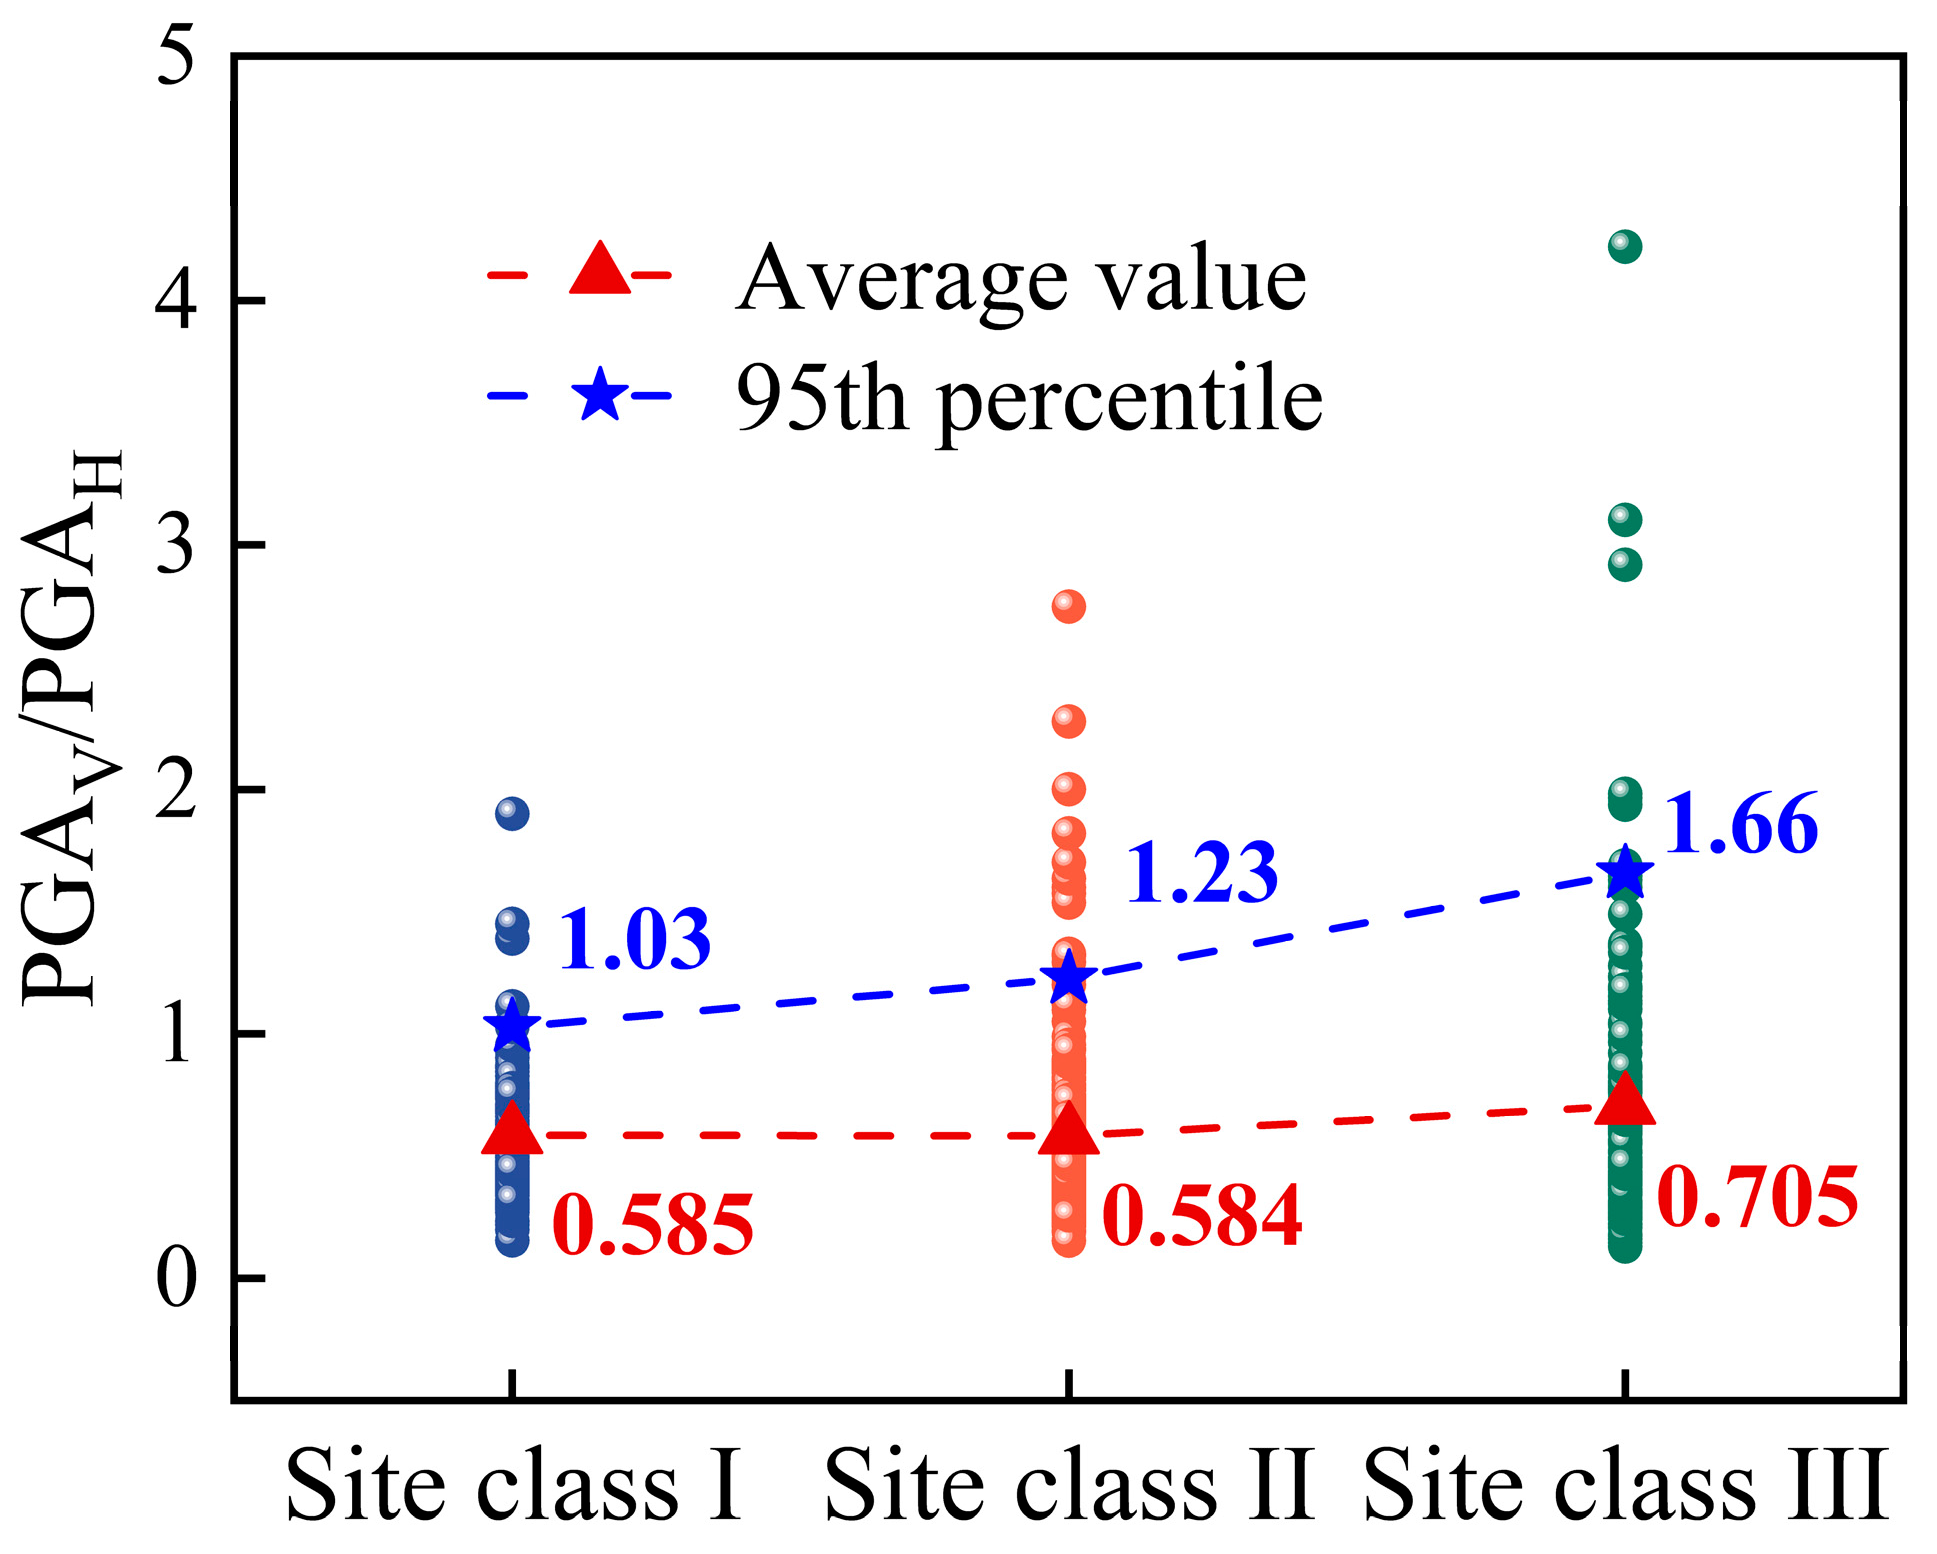
H across different Site Classes is shown in
Figure 3. The probability density distributions for the three Site Classes are similar to that in
Figure 1, all approximately log-normal, yet exhibit distinct variations in detail. This is more clearly illustrated by the statistical parameters provided in
Table 3. Both the mean value and the probability of exceeding 0.65 are the highest for Site Class III and the lowest for Site Class I. This indicates a decreasing trend in both the mean PGA
V/PGA
H ratio and the probability of exceeding 0.65 with increasing equivalent shear wave velocity, Vs30. Softer soil conditions, characterized by lower Vs30, are associated with a higher probability of exceeding the 0.65 threshold and a greater likelihood of ground motions with larger peak acceleration ratios.
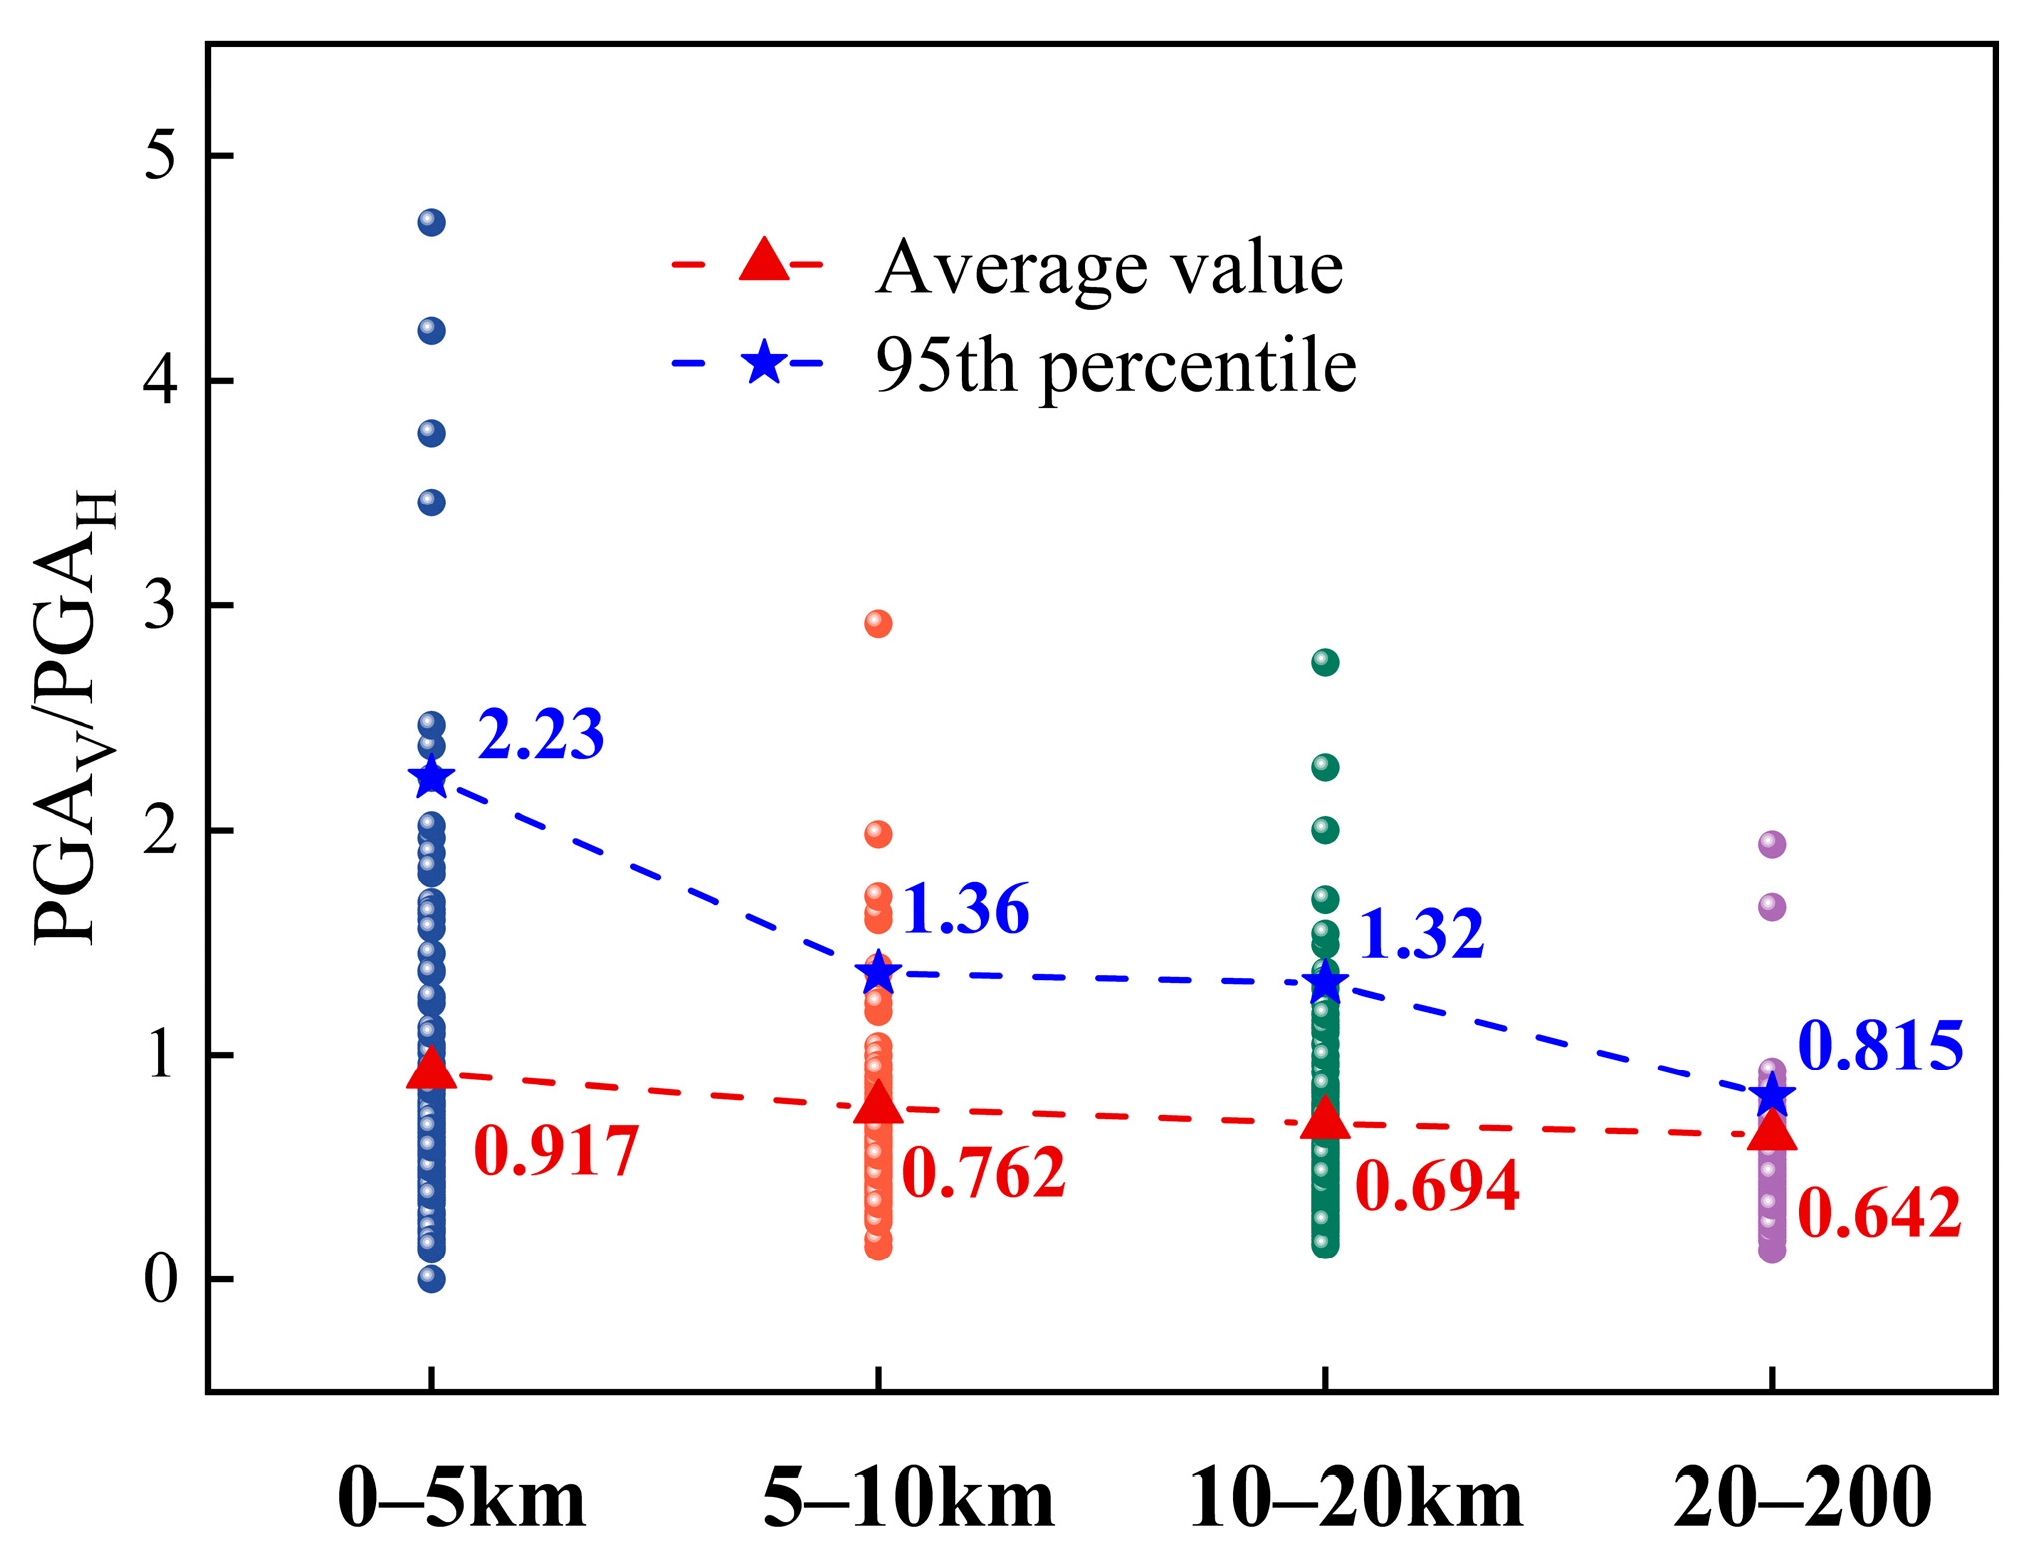
Figure 4 illustrates the distribution of the peak ground acceleration ratio PGA
V/PGA
H with respect to rupture distance. Overall, the ratio exhibits a clear decaying trend as the rupture distance increases. The distribution is not uniform but demonstrates significant spatial heterogeneity. In the near-fault region (<20 km), PGA
V/PGA
H values show considerable variability, typically ranging between 0.8 and 1.5. This can be primarily attributed to forward-directivity and fling-step effects, which generate long-period, large-amplitude velocity pulses. These pulses are evident not only in the horizontal components but also often induce corresponding high-frequency acceleration pulses in the vertical component, leading to a sharp increase in PGA
V. In this region, using a fixed ratio (such as 0.65) is highly unsafe, as it would significantly underestimate the vertical seismic action and pose a threat to structural components such as bridge bearings, columns, and shear walls. As the rupture distance increases into the intermediate- to far-field region, the pulse effects diminish, resulting in a notable decrease in the peak ratio and a reduction in data scatter.
3. Characterisation of Near-Site Vibration Response Spectra
The seismic design of structures in most current national codes relies on a seismic influence coefficient curve—also termed the standard or design response spectrum. This spectrum, which estimates the seismic demands on a structure during its service life, is typically derived from the statistical analysis of numerous ground motion records and refined through empirical calibration. A key limitation, however, is that these code-specified spectra are calibrated primarily against the characteristics of intermediate- to far-field ground motions. Consequently, they have not yet been adequately updated to encapsulate the unique dynamic features inherent to near-fault earthquakes.
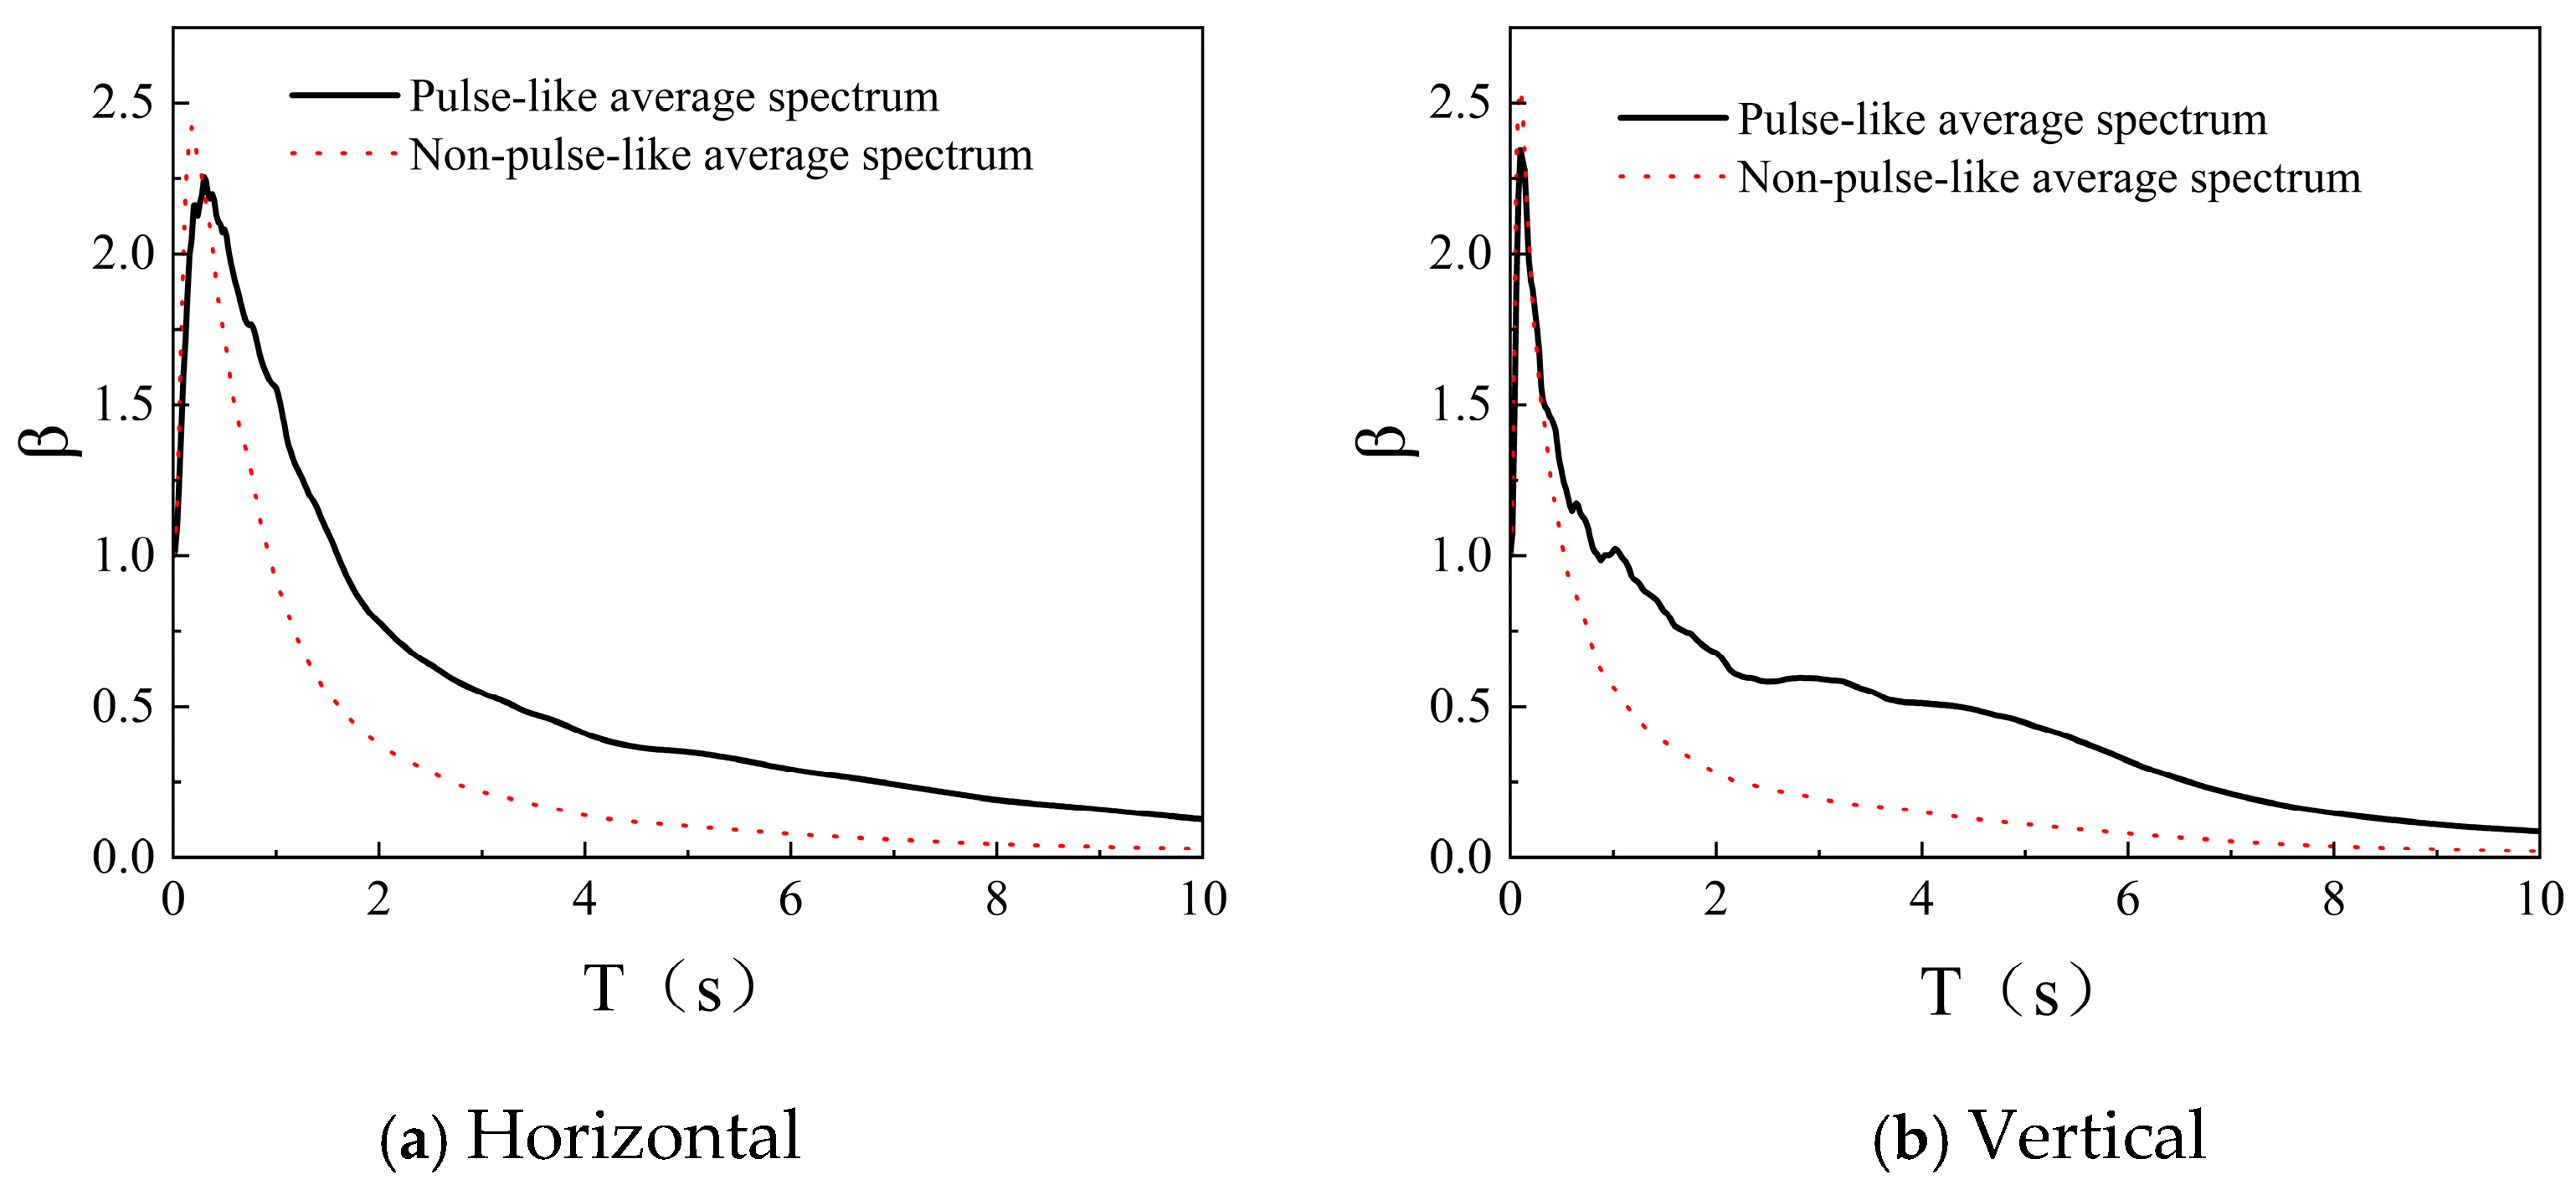
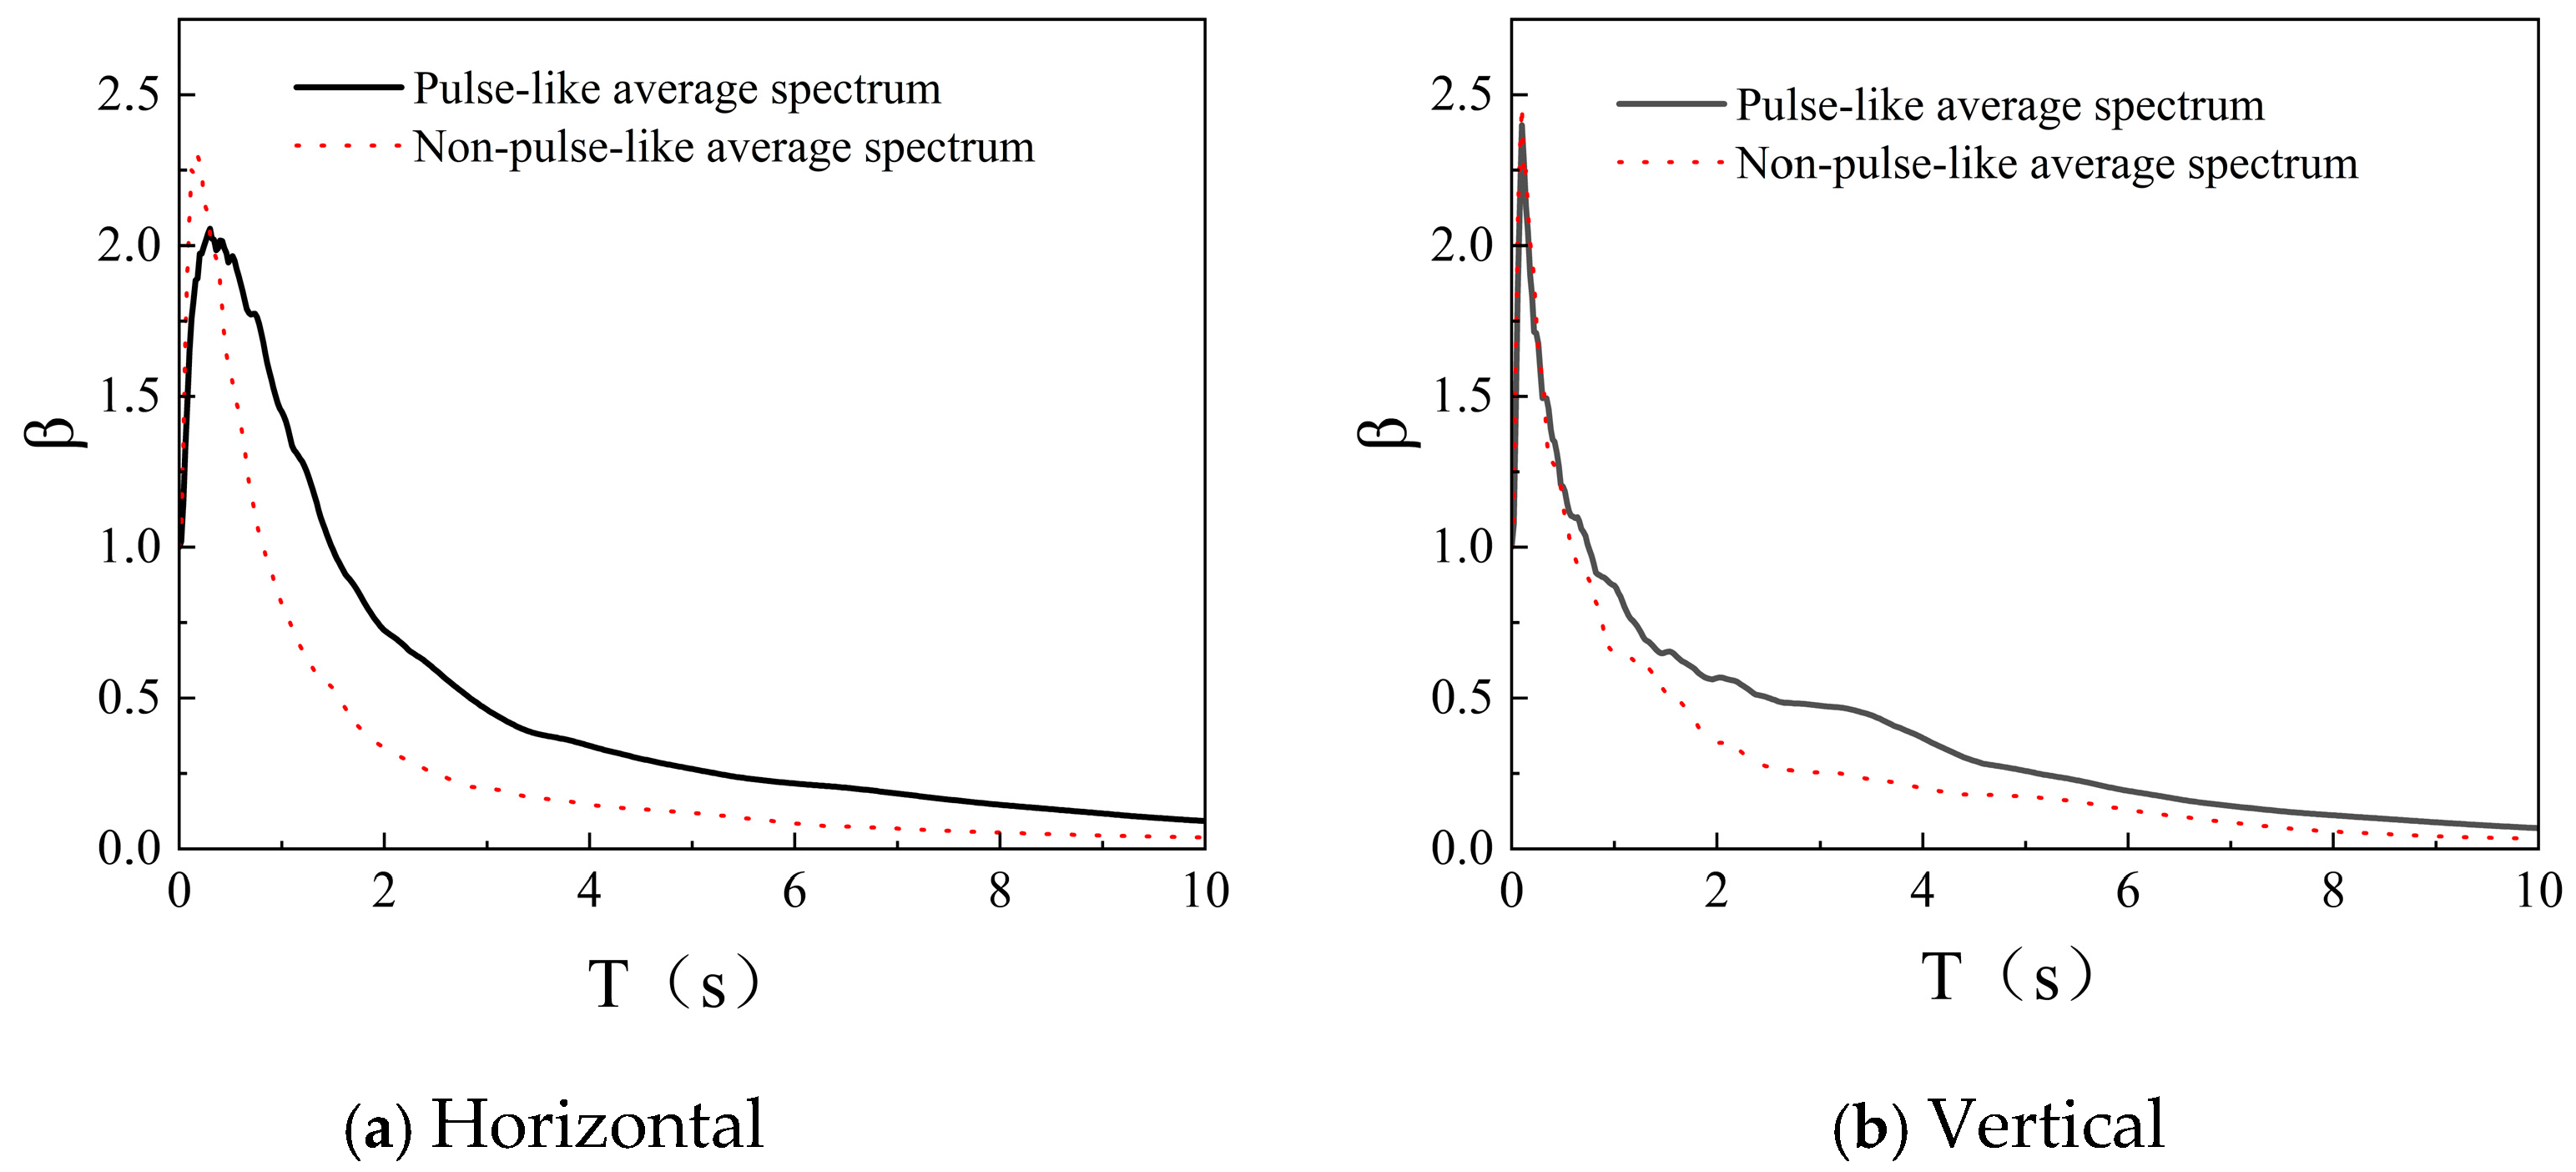
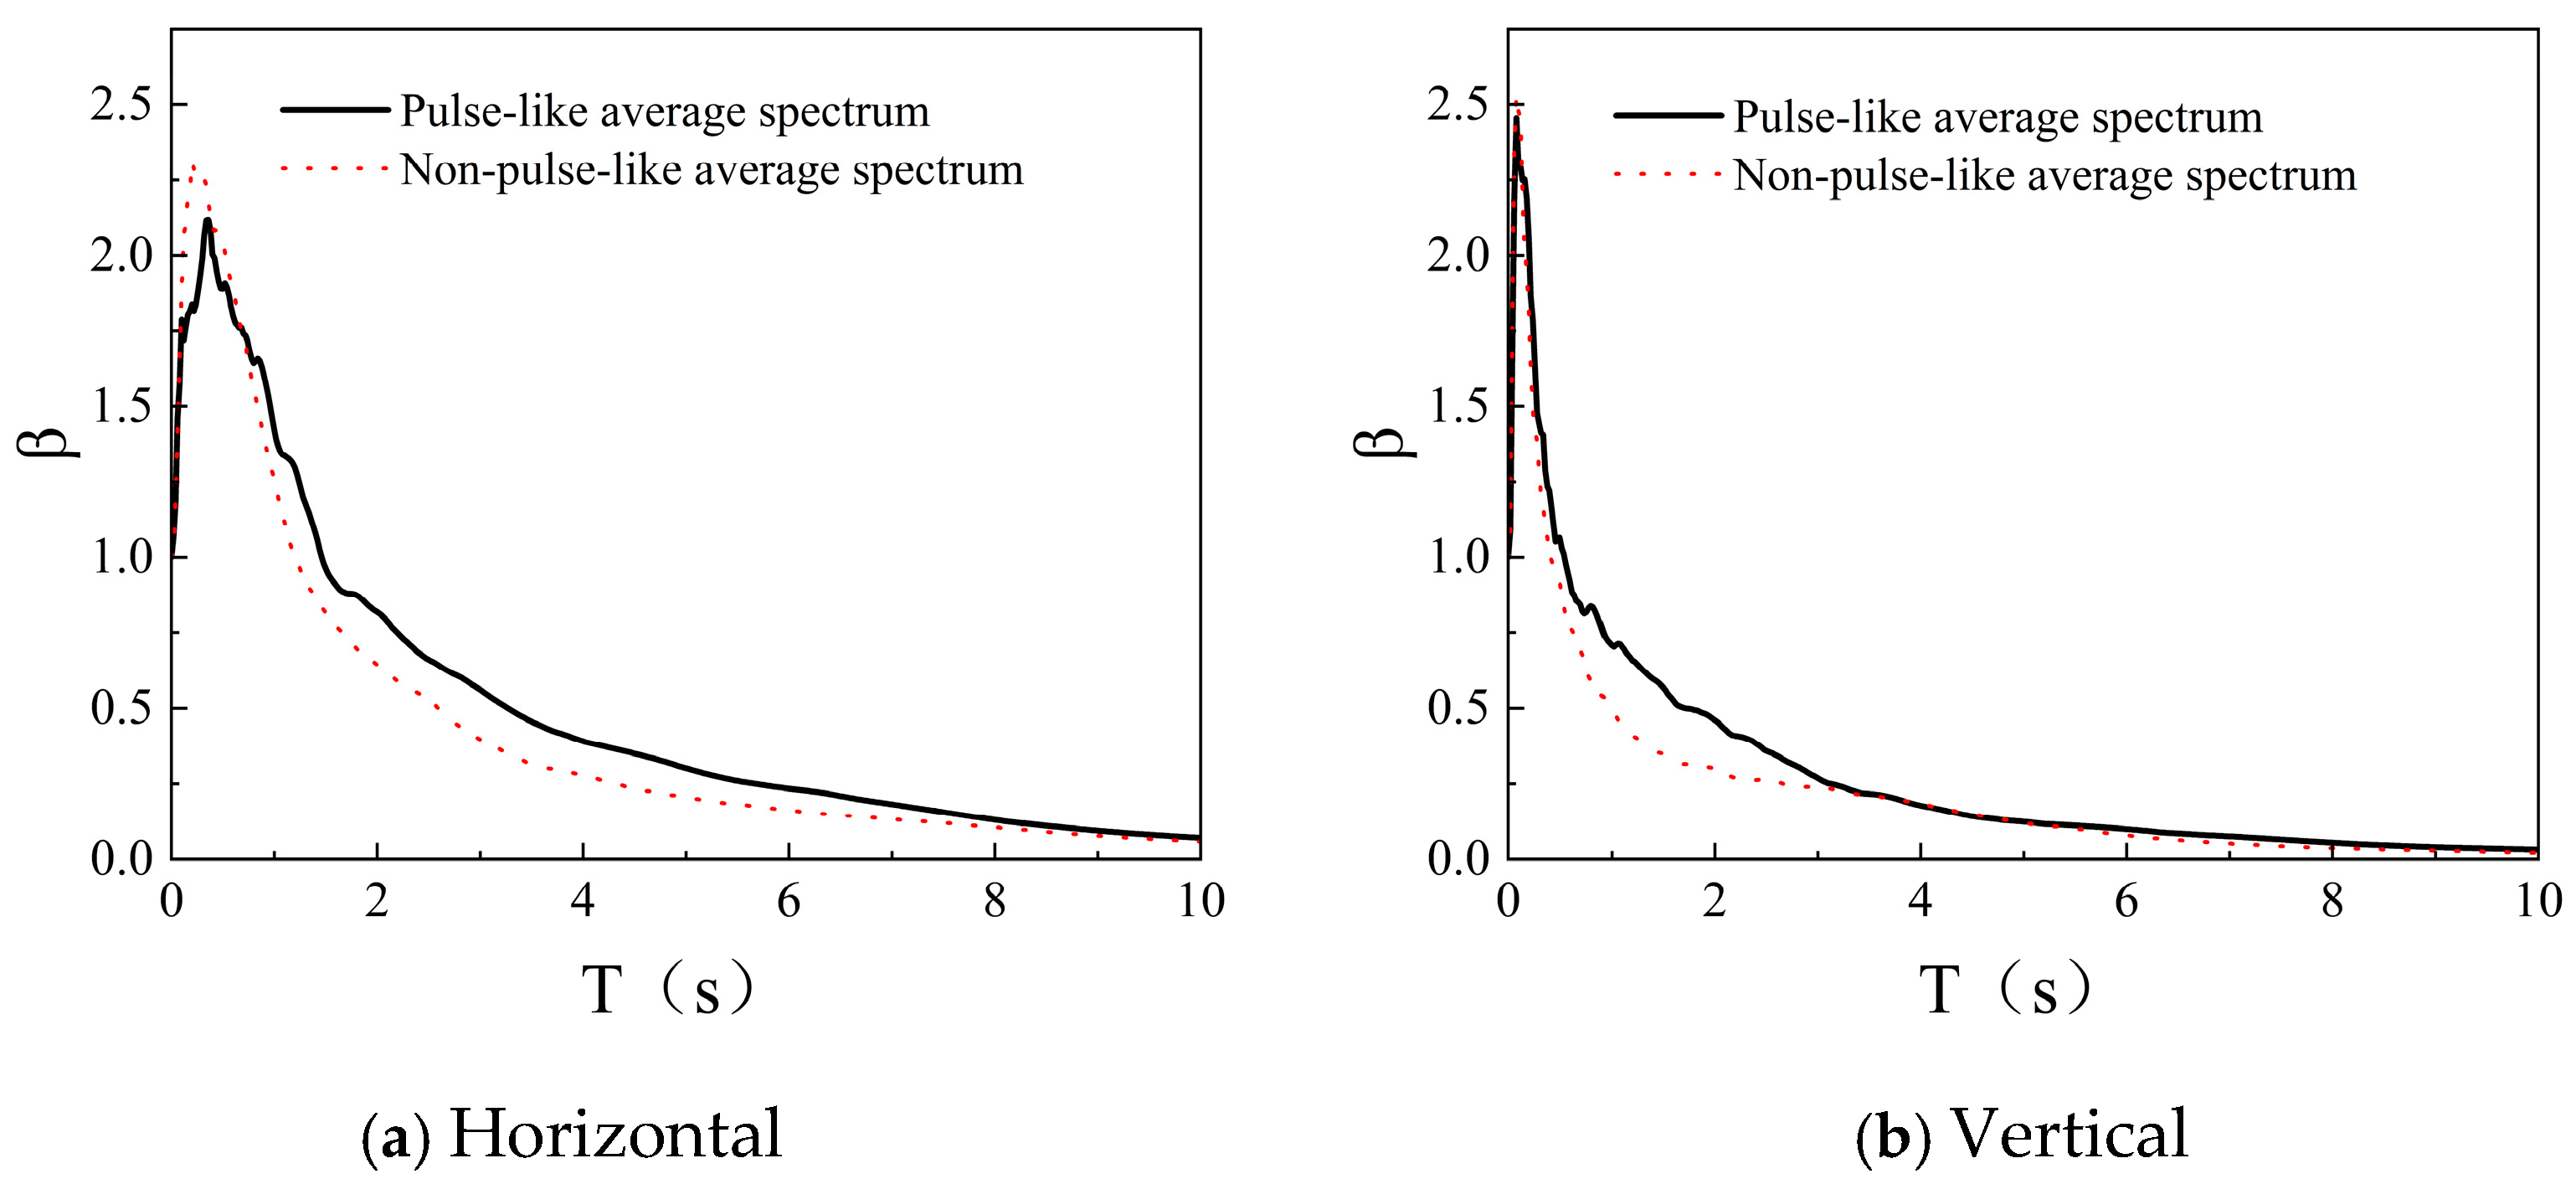
The selected ground motion records in this study are categorized based on Site Classification, pulse characteristics, and component direction (horizontal or vertical). Specifically, the records are first classified according to Site Classes I, II, and III. Within each Site Class, they are further subdivided based on whether they exhibit pulse-like features and by their horizontal or vertical component orientation. For each ground motion record, the elastic acceleration response spectrum is computed with GMSignal, a specialized and widely recognized software for seismic engineering applications. Each spectrum is then normalized by dividing it by the corresponding peak ground acceleration (PGA) of the record, resulting in the dynamic amplification factor β(T). This process generates normalized response spectrum curves, assuming a damping ratio of 0.05. Finally, the normalized spectra are averaged within each category to produce the final data curves, as shown in
Figure 5. The resulting dimensionless spectrum eliminates the influence of ground motion intensity (PGA), retaining only the spectral characteristics—that is, the extent to which different frequency components are amplified. This allows the study to focus specifically on the influence of ground motion frequency content on structural response.
Based on the characteristics of the normalized response spectra, this study focuses on analyzing their variations with Site Class, near-fault pulse effects, and ground motion direction (horizontal and vertical), as illustrated in
Figure 5,
Figure 6 and
Figure 7.
A clear distinction is observed in the normalized response spectra due to pulse effects. Non-pulse motion spectra are typically unimodal and smooth, decaying rapidly at long periods. In contrast, the spectra of pulse-like motions are flatter and shifted rightward, a direct consequence of their velocity pulses, which leads to systematically higher mean and median values and a global enhancement of long-period energy. This trend, prominent in Site Classes I and II (
Figure 5 and
Figure 6), identifies the pulse effect as the dominant factor driving the “heavy-tailed” distribution of spectral values and the occurrence of extreme amplification events at long periods. Neglecting this effect therefore risks a significant underestimation of the seismic threat to medium- and long-period structures.
Differences are also observed between the horizontal and vertical spectral shapes. The horizontal spectra generally exhibit higher peak values, indicating stronger energy input in the horizontal direction and more pronounced seismic demands for horizontal structural resistance. In comparison, the vertical spectra are relatively flat, reflecting differences in the distribution and transmission of vertical ground motion energy compared to the horizontal component. This highlights the spatial non-uniformity of ground motions, underscoring the need to separately consider horizontal and vertical seismic design requirements.
Spectral characteristics—such as the peak period and attenuation behavior—also vary across different Site Classes. From Site Class I to Site Class III, the spectral peak generally shifts toward longer periods, indicating an increase in the characteristic period, while the spectral shape evolves from “tall and narrow” to “short and broad.” Among the three Site Classes, Site Class I is associated with the highest dynamic amplification factors probabilistically. Its spectral shape is sharp and exhibits distinct narrow-band pulse characteristics, with energy concentrated in a relatively narrow frequency band near the characteristic period. This is primarily because stiff sites experience minimal attenuation when transmitting pulse waves from bedrock to the surface, efficiently conveying pulse energy while preserving its original form, thereby resulting in extremely high amplification.
Site Class II demonstrates amplification capabilities intermediate between Site Classes I and III. The spectral peaks are broader and less smooth, sometimes exhibiting bimodal or broad unimodal shapes. This behavior results from the combined effects of the pulse period and the site’s predominant period. Medium-stiff soil layers both amplify and filter incoming pulse waves, and their intrinsic predominant period may induce “beating” or “tuning” effects, leading to highly complex responses.
Site Class III shows the smallest maximum amplification factor, a significant rightward shift in the characteristic period, and a broad distribution of spectral values. The spectral shape is wide, flat, and exhibits a pronounced long-period platform. This is because soft soil layers strongly filter and absorb high-frequency components of pulse waves while significantly amplifying long-period components and extending the shaking duration. As a result, the impulsive nature of the motion is weakened, but the duration of energy input is prolonged.
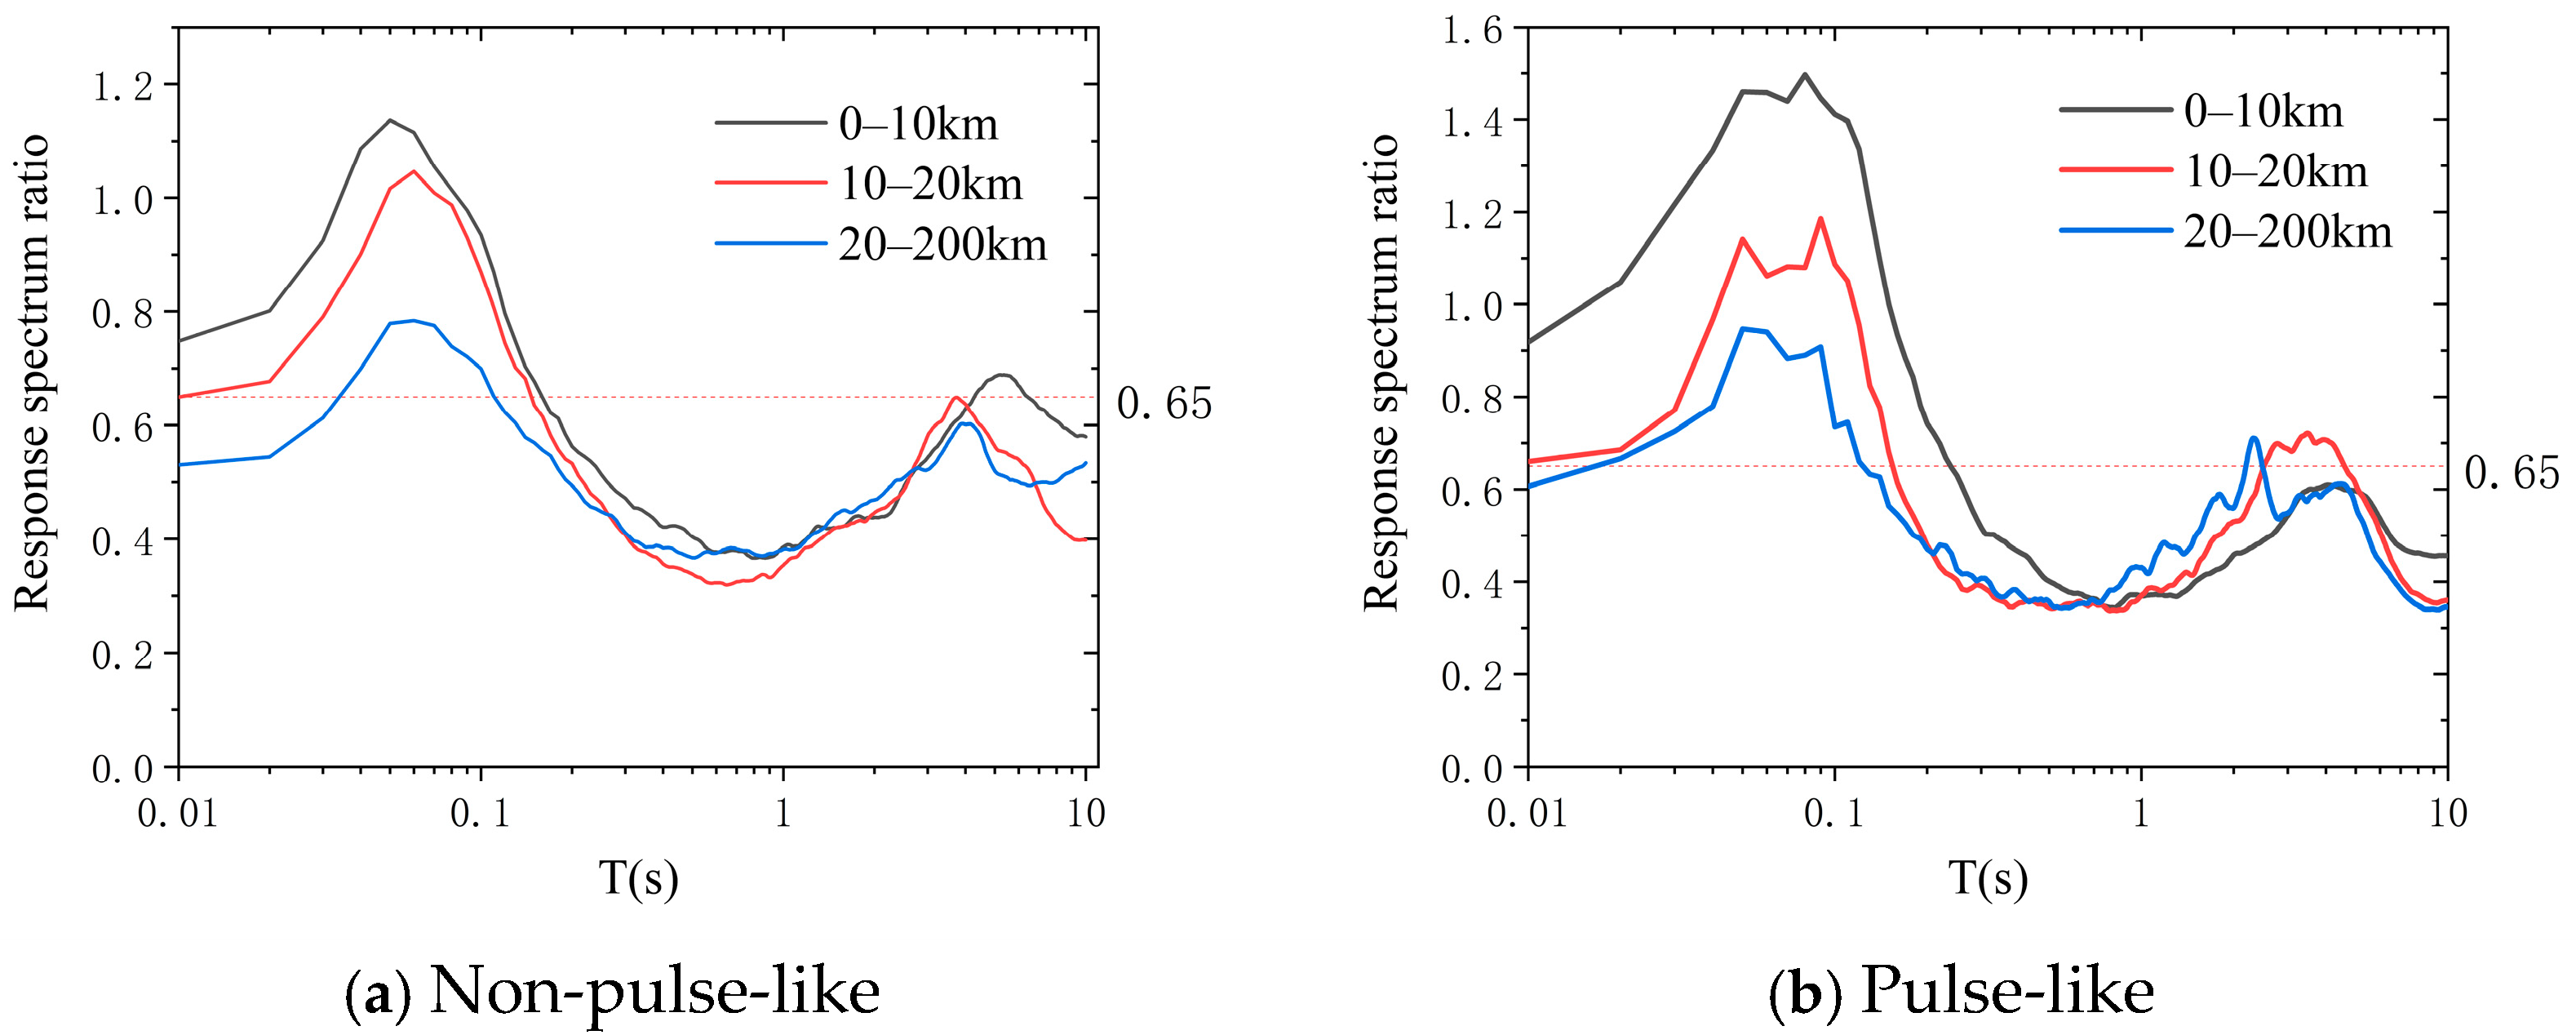
Next, this study investigates the ratio of the normalized vertical-to-horizontal response spectra for near-fault ground motions, with a focus on its spectral characteristics and its dependencies on fault distance, site classification, and pulse effects. As shown in
Figure 8 and
Figure 9, the response spectral ratio is not constant but varies significantly with period, generally exhibiting a pattern of “short-period amplification, intermediate-period transition, and long-period attenuation”.
In the short-period range, the ratio often approaches or even slightly exceeds 1.0, indicating that the intensity of vertical ground motion is comparable to that of the horizontal component at very short periods. A distinct peak plateau appears in the intermediate-period range, where the ratio reaches its maximum—frequently exceeding 1.0 and, under specific conditions, reaching values between 1.5 and 2.0. This represents the most notable characteristic of vertical ground motions, reflecting their rich high-frequency energy content.
In the long-period range, the ratio gradually decreases with increasing period and eventually stabilizes at a constant value, typically below 0.65, illustrating the increasingly dominant role of horizontal ground motion in this region.
Figure 8 indicates that ground motions in the near-fault region exhibit significant vertical characteristics, with the response spectral ratio generally exhibiting a decreasing trend as the rupture distance increases. In the near-fault region, the spectral ratio is generally high in the short-period range, reaching values between 0.8–1.0 or even higher. This can be attributed to the presence of notable forward-directivity and fling-step effects within 20 km of the rupture, which enhance vertical ground motions.
Site classification plays a pivotal role in the behavior of the vertical-to-horizontal spectral ratio. Softer sites (Class III) induce a significant amplification of the ratio, especially within specific short-period bands, as they disproportionately amplify the high-frequency content of vertical motions. This is attributed to the distinct dynamic response of soft soils, which is absent on stiffer sites (Classes I and II). The latter are associated with lower and more uniformly distributed ratios, as evidenced by the mean ratio for Site Class I, which remains nearly constant between 0.55 and 0.6. This stability stems from the minimal amplification of high-frequency components on firm ground, resulting in a relatively invariant ratio across the period range.
Furthermore, the pulse effect significantly alters the distribution of the vertical-to-horizontal (V/H) response spectral ratio across periods. Comparative analysis clearly shows that the spectral ratio for pulse-like ground motions is markedly higher than that for non-pulse-like records. This discrepancy is particularly pronounced in the short-period range (T < 0.3 s), where the pulse effect leads to a substantial increase in the ratio, resulting in a prominent peak plateau that often significantly exceeds 1.0 and can reach values above 2.0. This phenomenon reflects a resonance effect between the high-frequency components of the pulse and the characteristics of vertical ground motion.
In the intermediate-period range (0.3 s ≤ T ≤ 1.0 s), the ratio decreases rapidly from its peak and gradually approaches conventional levels, though it remains higher than that of non-pulse ground motions. In the long-period range (T > 1.0 s), the ratio declines further, eventually converging toward the V/H ratio observed in non-pulse records.
4. Modelling Analysis of a Typical Simply Supported Girder Bridge
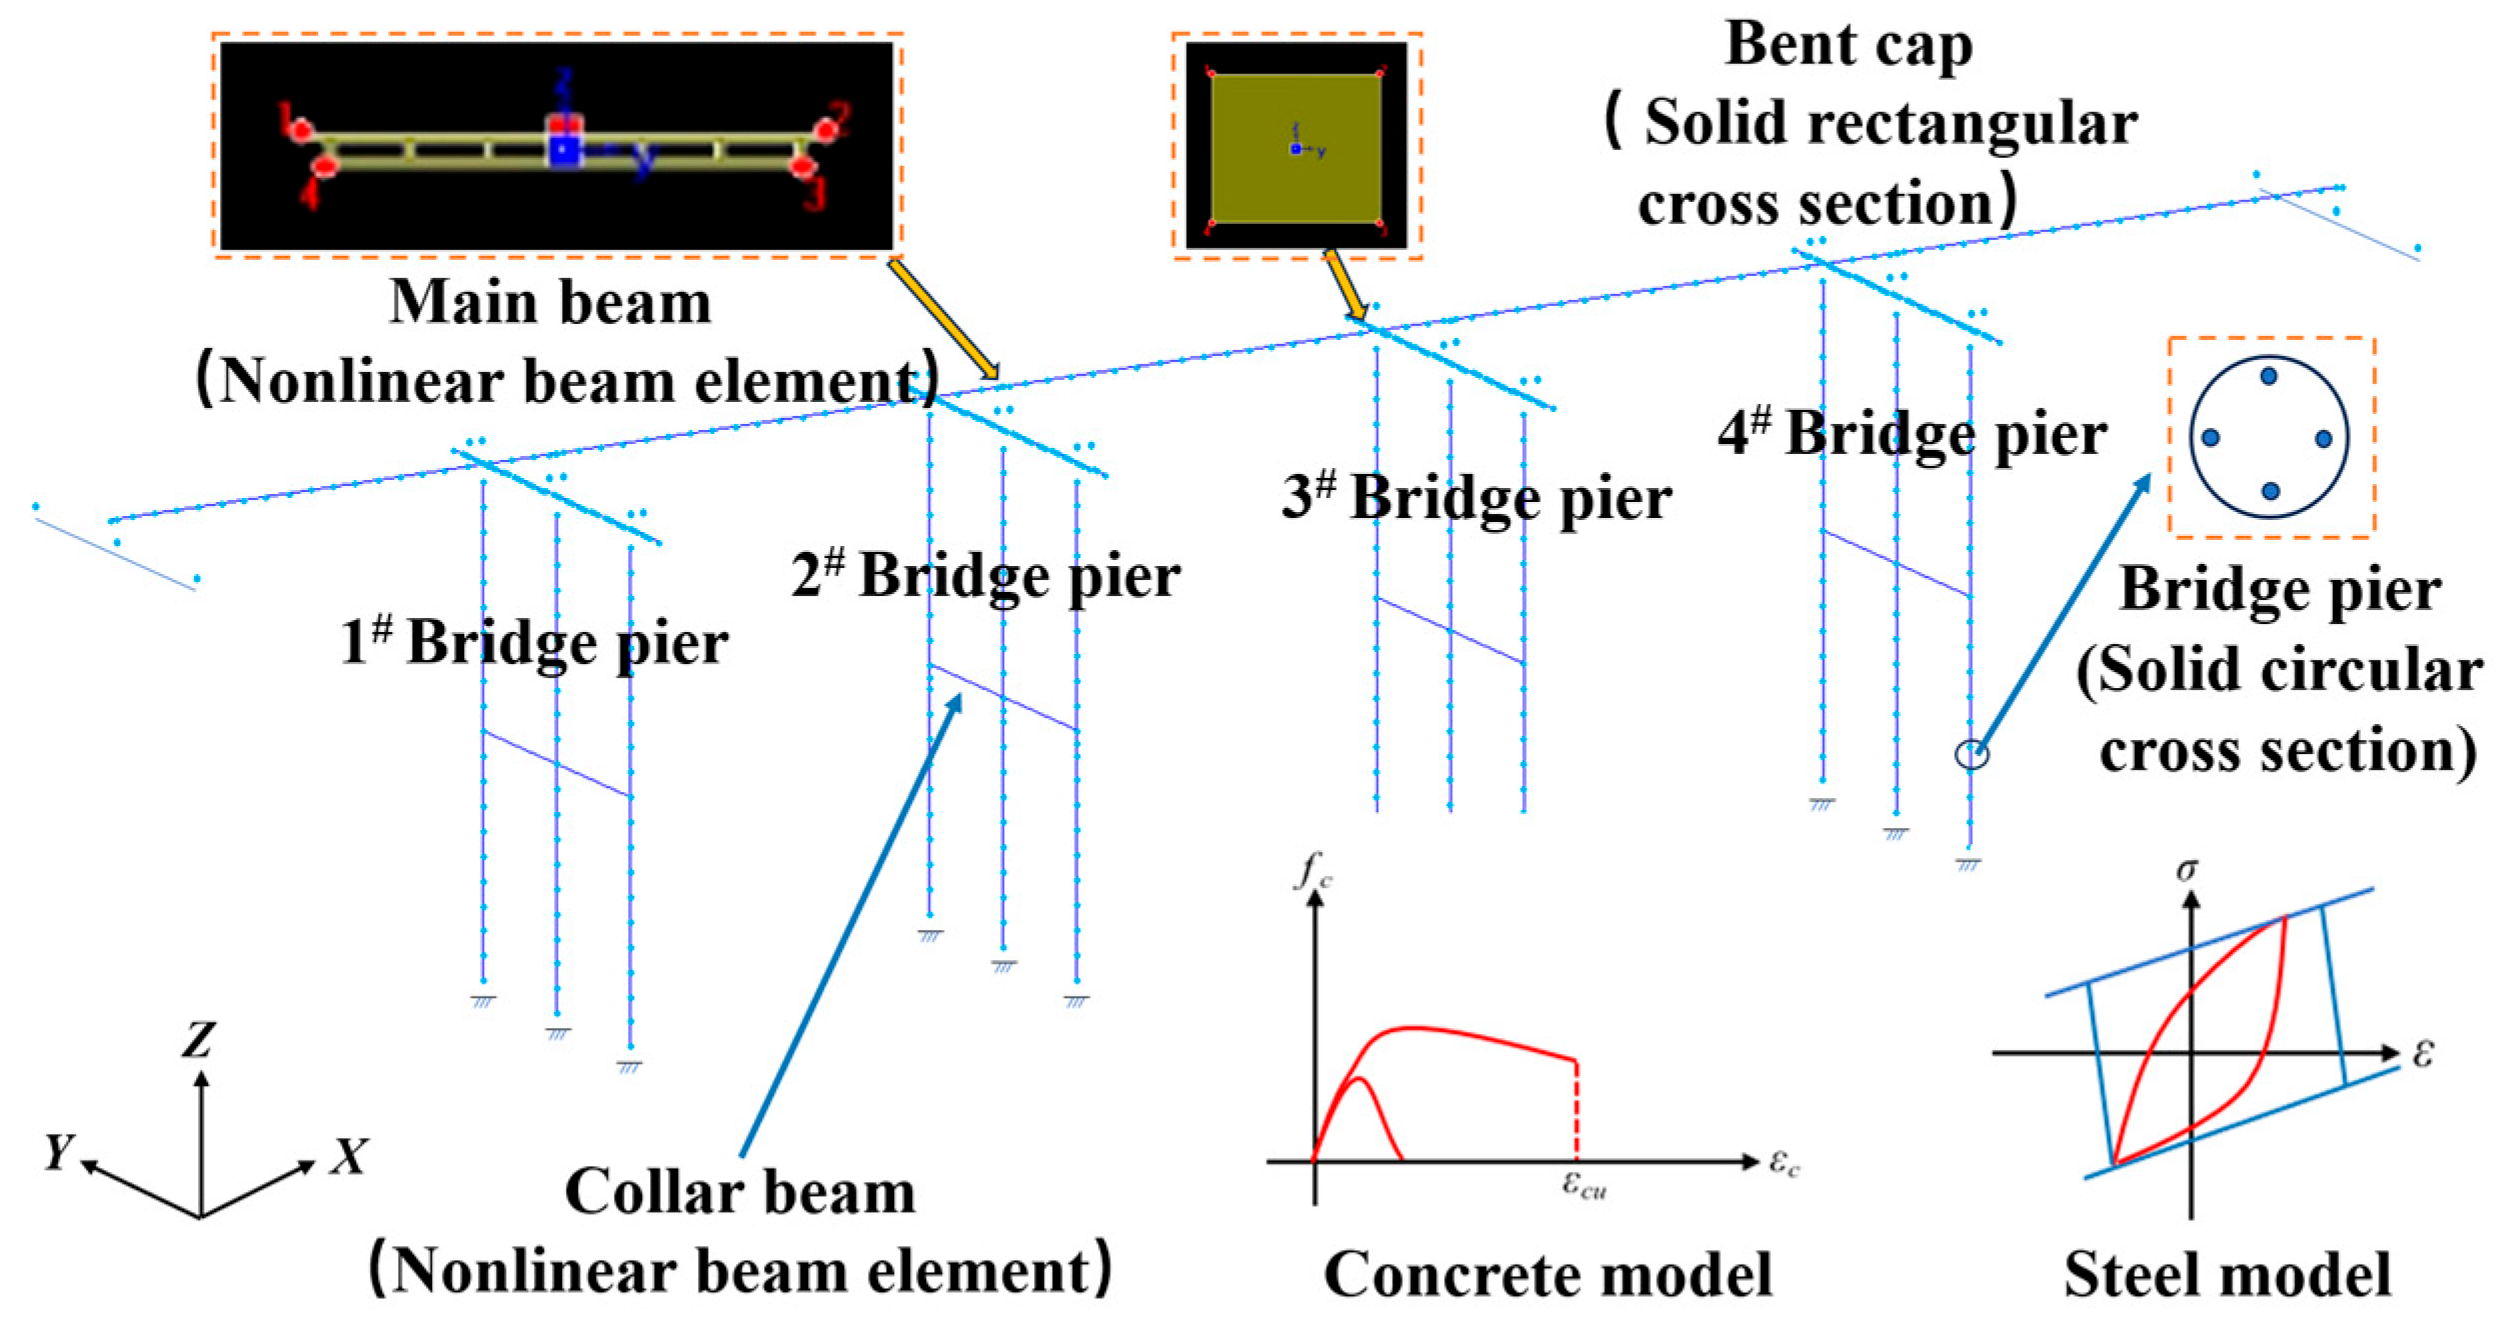
The engineering context of this study is a typical girder bridge with a total length of 105.92 m. The bridge is configured with five equal spans of 20 m each, and the main girders consist of simply supported prestressed concrete hollow slabs; see the
Figure 10. In terms of the transverse layout of the single deck, concrete crash barriers with a width of 0.5 m are installed on both sides, resulting in a clear deck width of 15.25 m, thereby forming a complete deck system. The substructure employs cylindrical piers with a diameter of 1.4 m, the pier is 20 m high, and the effects of pile–soil interaction on the structural global response are not considered in this phase. The supports are of the GYZ-type elastomeric bearing pads, with dimensions of 250 × 63 mm.
A three-dimensional full-bridge simulation model was developed using the finite element analysis platform Midas Civil 2023 (v3.1). The pier columns were modeled as nonlinear beam-column elements with circular cross-sections, utilizing the Concrete04 constitutive model for concrete and the Steel02 model for longitudinal reinforcement. The girder and cap beams were simplified as nonlinear beam elements. Both the piers and girder components were simulated using spatial beam elements. The laminated rubber bearings in the prototype structure were simulated using elastic link elements. This modeling approach allows for the definition of independent stiffness values in all six degrees of freedom, enabling a precise representation of the bearing’s primary directional mechanical properties. The key mechanical parameters were determined based on the material characteristics and geometric dimensions of the bearings. This method enables an effective analysis of the internal forces and deformations in the bearings under both static and dynamic loads, thereby providing a reliable computational basis for the overall structural response of the bridge. In terms of boundary conditions, fixed constraints were applied at the abutment foundations and the bottom of the piers to accurately reflect the influence of actual support conditions on the structural dynamic characteristics.
The seismic response characteristics of a bridge structure are closely related to its inherent dynamic properties. Key information such as natural vibration periods and corresponding mode shapes can be obtained through modal analysis of the model.
Table 4 presents the first three natural periods and their corresponding modal mass participation factors. The results indicate that the longitudinal stiffness of the structure is considerably lower than its transverse and vertical stiffness, forming a typical longitudinally flexible system. This dynamic behavior is primarily attributed to the weak longitudinal restraint provided by the movable bearings and the inherent longitudinal flexibility of the piers, implying that the bridge will undergo significant longitudinal displacements and deformations during seismic events.
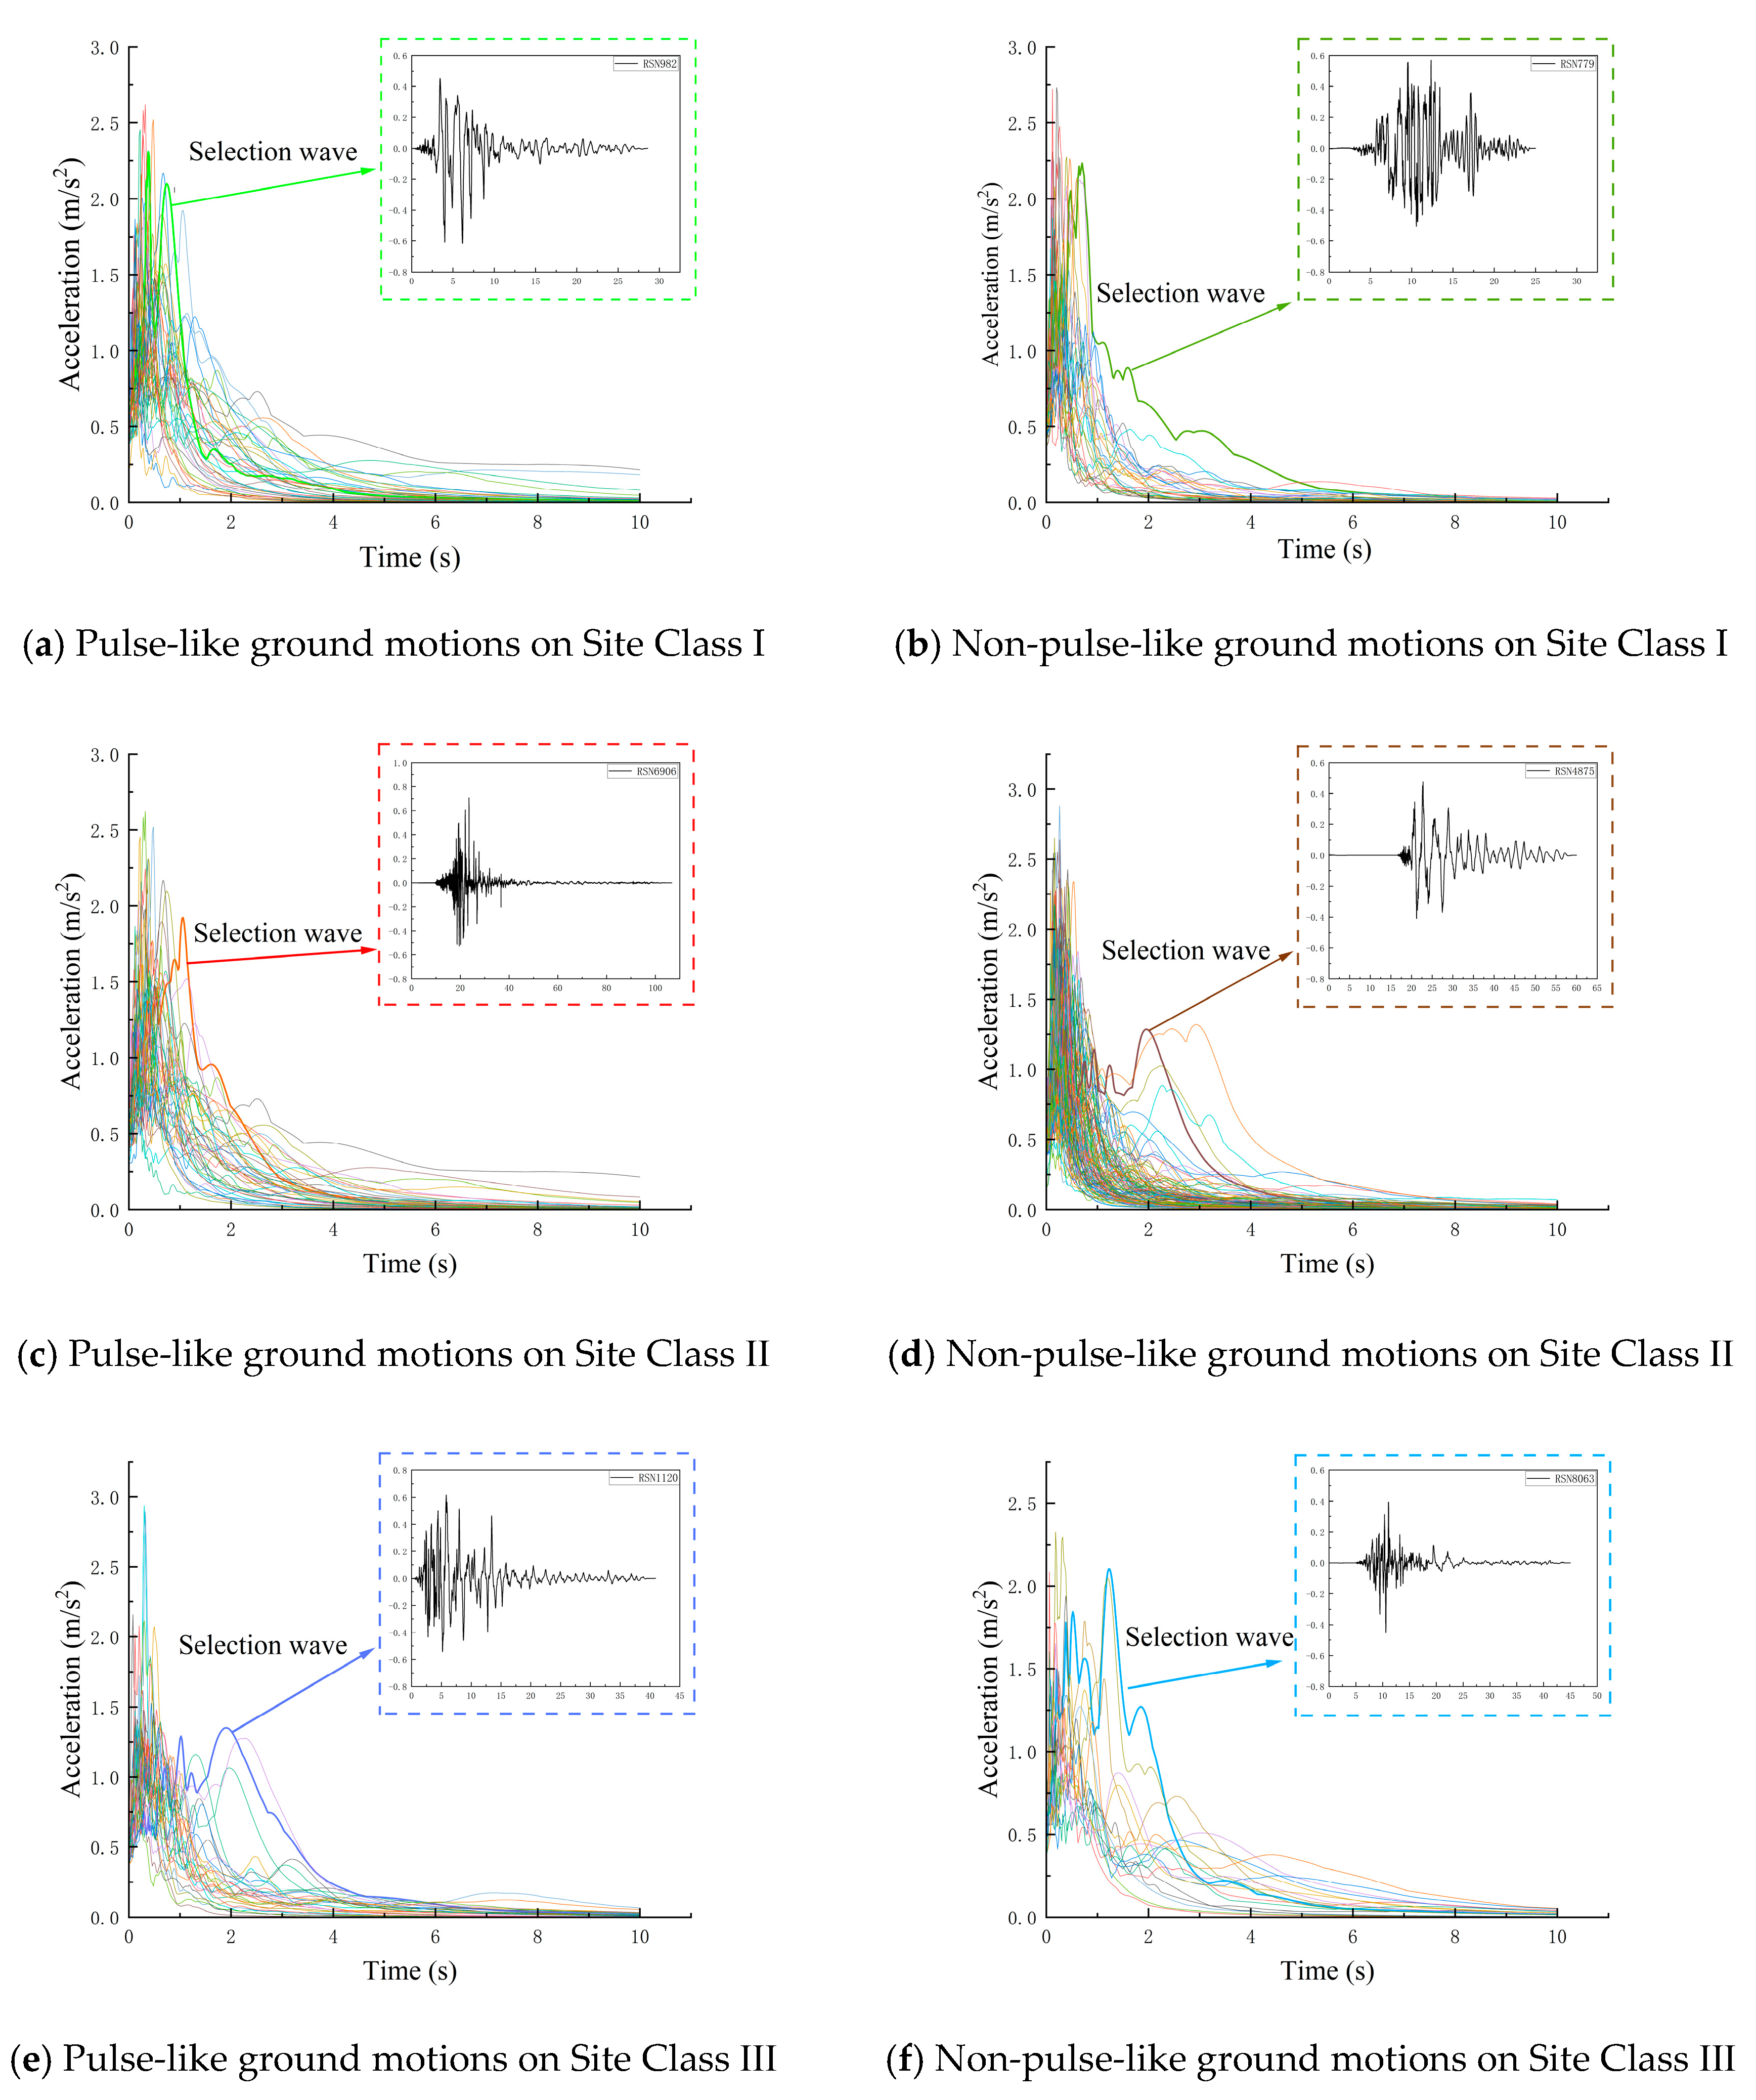
This study investigates the influence of pulse effects, site characteristics, and the vertical component of near-fault ground motions on the seismic response of a typical girder bridge using time-history analysis. The ground motion records were first categorized by site class, near- versus far-field conditions, and the presence of pulse effects. From each category, records were selected based on the “most unfavorable principle”—i.e., those with prominent spectral accelerations within the period range of the bridge’s first three modes (1.0–1.7 s), as illustrated in the
Figure 11 [
35]. To enable a consistent comparative analysis, the peak horizontal acceleration of all selected records was scaled to 0.1 g.
Table 5 summarizes the selection of ground motion records for the analysis, classified according to site class, pulse effects, and fault distance (near-fault vs. far-fault). Specific information provided for each record includes the seismic event, recording station, record name, magnitude, and site class.
5. Typical Girder Bridge Response Analysis
This study employs nonlinear time history analysis to systematically investigate the effects of near-fault pulse motions, site conditions, and vertical ground motions on structural responses. To capture potential plastic deformation in the bridge piers, fiber hinge models were employed. The numerical integration within the hinge zones was conducted using the Gauss-Legendre quadrature method, with 3 Gauss points specified along the hinge length to ensure sufficient accuracy in calculating the moment-curvature relationship. In addition, the full Newton-Raphson iteration method was adopted as the core solver for the nonlinear equation system. A convergence tolerance of 0.001 was enforced for both force and displacement norms to ensure that the computational results satisfied the equilibrium equations at each time step, thereby guaranteeing the accuracy of the analysis.
Based on the established typical girder bridge model, a series of nonlinear dynamic analyses will be conducted under selected ground motion records. The analysis cases are designed as follows. (1) Only horizontal or vertical ground motions are considered individually to compare the differences in structural responses—such as Pier bottom shear (PBS), Pier bottom axial forces (PBAF), Pier bottom moment (PBM) induced by pulse-like and non-pulse-like records across different site classes. This aims to quantify the individual and coupled influences of pulse effects and site conditions. (2) Simultaneous horizontal and vertical ground motions are input, with peak accelerations scaled in a 1:0.65 ratio (horizontal to vertical) applied to the bridge model. The analysis focuses on identifying differences in key response parameters. Special attention is paid to whether such coupling effects become more pronounced under pulse-like ground motions. The objective is to quantitatively reveal how near-fault pulse-like motions, site conditions, and vertical seismic motion individually and jointly amplify structural dynamic responses, thereby providing theoretical support and design recommendations for the seismic design and performance assessment of similar bridge structures.
Table 6 summarizes the response results of different internal force parameters from the time-history analysis of the simply supported girder bridge model subjected to horizontal pulse-like ground motions on a Site Class I. The internal forces in the piers exhibit a pattern characterized by a symmetrical distribution, with the central piers experiencing greater demands. The internal force values at Pier 1 and Pier 4 are similar, as are those at Piers 2 and 3. However, internal force indicators such as the base shear and base bending moment in Piers 2 and 3 are significantly larger than those in Piers 1 and 4, designating Piers 2 and 3 as the critical seismic force-resisting elements. Owing to the high symmetry of the bridge’s seismic response and the consistently larger responses of the central piers, Pier 3 was chosen as the subject for the follow-up comparative investigation.
As indicated by the comparative bar charts in
Figure 12, under various site conditions, the axial force at the pier base induced solely by vertical ground motions is significantly greater than that resulting from horizontal motions alone, yet remains comparable to the response under combined loading. This suggests that vertical seismic action plays a dominant role in the axial force response of the pier. As site conditions become softer, the axial force exhibits an increasing trend. This behavior can be attributed to the filtering and amplification effects of different soil types on seismic waves: soft soils (Site Class III) enrich the low-frequency components of ground motions, thereby amplifying the vertical vibrational response of the bridge. Furthermore, the axial forces under near-fault pulse-like ground motions are generally higher. Characterized by high energy content, long-period components, and short-duration intense impulses, such motions significantly amplify the axial force demand at the pier base.
The base shear force under isolated horizontal ground motions is significantly greater than that induced by vertical motions alone, yet remains comparable to the results from combined horizontal and vertical excitation; see
Figure 13. This indicates that the horizontal seismic component dominates the shear force response in the piers. The base shear force in Site Class III is markedly higher than that in Site Classes I and II. Particularly under near-fault non-pulse ground motions, the base shear in Site Class III exceeds that in Site Class I by approximately 83.7% and surpasses Site Class II by about 21.9%. This demonstrates the stronger amplification effect of soft soil sites (Site Class III) on the structural response, primarily attributable to the filtering and amplification of seismic waves by different soil layers. Soft soils typically amplify long-period components, which may approach the fundamental natural period of the structure. Furthermore, pulse-type ground motions generally in-duce higher base shear forces. The horizontal shear forces under pulse-like motions are amplified by factors of 2.53, 1.78, and 1.38 in Site Classes I, II, and III, respectively, compared to their non-pulse-like counterparts. The high-energy, long-period pulse components inherent in near-fault ground motions can trigger intense quasi-resonance phenomena when the predominant pulse period closely matches the fundamental natural period of the bridge structure, leading to a substantial increase in pier base shear.
In
Figure 14, the bending moment at the pier base induced by vertical ground motions remains relatively small across all site classes and ground motion types. This response parameter is predominantly governed by horizontal ground motions and is also influenced by bidirectional seismic coupling effects. Soft and thick soil deposits (Site Class III) filter out high-frequency components and significantly amplify long-period content, resulting in comparatively higher bending moments in Site Class III than those in the other two site classes. Similarly, the pulse effect enriches the long-period components of ground motions, thereby amplifying structural responses. This behavior is consistent with the characteristic rightward shift and flattened decay of the response spectra observed for pulse-like ground motions.
Hereafter, a comprehensive assessment of pier damage under various scenarios is presented. While researchers have proposed diverse criteria for pier limit states—peak drift, curvature ductility, or displacement ductility among others—this study adopts the four-level damage classification in [
36]: slight, moderate, severe, and complete. The associated limit states are demarcated by (i) first yield of longitudinal reinforcement, (ii) global yield of the pier, (iii) extreme-fiber concrete compression strain reaching 0.002, and (iv) attainment of maximum displacement.
Table 7 summarises the mapping between these ductility indices and the qualitative damage states employed herein.
A longitudinal Pushover analysis was performed on Pier No. 3 of the simply supported girder bridge to pinpoint its yield point [
37]. By aligning the resulting capacity curve with the limit-state criteria listed in
Table 7, the pier-top displacements corresponding to each damage threshold were extracted and are reported in
Table 8.
Based on the time-history results of the typical simply supported girder bridge under the previously defined ground-motion suites, the peak longitudinal displacement at the top of Pier 3 was extracted for each case and normalized to yield the displacement-ductility demand. These ductility factors were then compared with the limit-state thresholds in
Table 7 to classify the damage state of the pier for every scenario.
Table 9 summarises the seismic damage states of Pier 3 of the simply supported bridge model under the selected ground-motion sets.
Under the same type of ground motion, the structural ductility demand μd gradually increases from Site Class I to Site Class III, accompanied by a corresponding escalation in the extent of structural damage. For near-fault pulse-like ground motions, μd rises from 0.202 on Site Class I to 0.213 on Site Class II, and further to 0.224 on Site Class III, with the damage state escalating from “minor damage” to “moderate damage”.
Site soils filter and amplify specific frequency components of seismic waves. Site Class I, characterized by high stiffness and short natural vibration period, tends to amplify high-frequency components of seismic waves. In contrast, Site Class III (soft soil), with low stiffness and long natural vibration period, significantly amplifies long-period components. The fundamental natural period of the typical simply supported bridge studied in this paper falls within the medium-to-long period range. When Site Class III amplifies long-period seismic waves, its vibration period becomes more likely to approach the natural period of the structure, inducing a quasi-resonance effect that leads to larger structural deformations and higher ductility demands. Consequently, structures founded on soft Site Class III soils exhibit higher μd values and more severe damage.
Furthermore, pulse-like ground motions consistently generate the highest μd values across all site classes and are the only type that triggers “moderate damage”. Near-fault non-pulse records reduce μd by 7–15% and consistently remain within the “minor damage” threshold. Far-field records result in the lowest displacement demands, with only Site Class III exhibiting μd = 0.181, just reaching the “minor damage” threshold, while other site classes remain in the “no damage” state.
Near-fault pulse-like ground motions typically contain a long-duration, high-intensity velocity pulse. This high-energy input acts as a sudden “impact” or “jerk” on the structure, delivering substantial energy within an extremely short duration. The structure lacks sufficient time to dissipate energy through cyclic vibrations, resulting in exceptionally large instantaneous deformations and a sharp increase in ductility demand μd. Therefore, this type of ground motion induces the most severe structural damage among all ground motion types.
6. Conclusions
Based on the systematic selection of 941 ground motion records from the NGA-West2 database, this study investigates the influence of site class, pulse effects, and vertical ground motion components on near-fault seismic characteristics and bridge structural responses through normalized response spectrum analysis and nonlinear time-history simulations of a typical simply supported girder bridge. The main conclusions are as follows.
The peak ground acceleration ratio (PGAV/PGAH) exhibits significant variability and site dependence, approximately following a log-normal distribution. Both the mean value and the probability of exceeding 0.65 increase noticeably as site conditions become softer. Within the near-fault region (<20 km), the PGAV/PGAH ratio shows considerable dispersion, indicating that adopting the code-specified fixed ratio of 0.65 would significantly underestimate vertical seismic actions, thereby compromising structural seismic safety.
Pulse effects markedly alter the shape and energy distribution of normalized response spectra. Pulse-like ground motions cause the spectra to shift rightward, resulting in broader and flatter shapes with slower decay in the long-period range, demonstrating a distinct “heavy-tail” characteristic. This significantly increases the seismic demand for medium- to long-period structures. In contrast, non-pulse ground motions exhibit relatively smooth spectral shapes with rapid attenuation. Neglecting pulse effects may lead to a severe underestimation of seismic risk in near-fault regions.
The vertical-to-horizontal response spectrum ratio exhibits significant period sensitivity, following a general trend of “short-period amplification, intermediate-period transition, and long-period decay.” Within the short- to intermediate-period range, the ratio often exceeds 1.0, with maximum values reaching 1.5–2.0. The pulse effect further amplifies the ratio in the short-period range, and soft site conditions (Site Class III) also significantly elevate spectral ratios, indicating rich high-frequency energy content in the vertical component of near-fault ground motions.
The internal force responses at the pier base are governed by distinct seismic components and are interactively influenced by site and pulse effects. Axial force is primarily induced by vertical ground motions, whereas shear forces and bending moments are dominated by their horizontal counterparts. A critical synergistic effect occurs on soft sites (Site Class III), which filter and amplify long-period components, in combination with pulse-like motions that are inherently rich in such periods. When these amplified periods align with the fundamental period of the bridge, resonant amplification significantly increases the bending moments, shear forces, and axial forces. This coupled site-pulse effect poses the greatest threat to the safety of these critical structural members.
Similarly, the aforementioned conclusions are further corroborated through the analysis of the pier-top displacement ductility coefficient and its corresponding damage states.
The current seismic design codes rely on a coarse site classification system, which fails to adequately capture the dynamic property variations within the same site category. To address this limitation, it is recommended to adopt the “site-specific design response spectrum” approach. For major projects or those on complex sites, site-specific seismic hazard analyses considering detailed soil profiles and equivalent shear wave velocity should be mandated, enabling the development of custom design response spectra through probabilistic methods. This transition from macro-classification to micro-customization will substantially enhance both the precision and safety of seismic design.
This study aims to elucidate how near-fault pulse effect, site condition, and vertical ground motion individually and collectively amplify structural dynamic responses, thereby providing a theoretical basis and design recommendations for the seismic design and performance assessment of similar structures. Notwithstanding its contributions, this study has limitations that outline key future research paths. These include a systematic evaluation of the quantitative effects of different pier types and an assessment of how simplifications like ignored soil–structure interaction and nonlinear bearings influence the dynamic response. Advancing bridge seismic theory and simulation accuracy will require a combined approach of parametric research and refined modeling.

