Abstract
Shield tunneling beneath existing railways remains a critical challenge in urban infrastructure development, as it risks destabilizing overlying soil structures and compromising railway safety. This study presents an integrated methodology combining physical model tests and three-dimensional numerical simulation, validated by their mutual agreement, to capture the settlement and deformation induced by twin shield tunneling beneath an operational railway under the complex geological conditions of the Qingdao Metro. A parametric study was subsequently conducted to systematically evaluate the influence of critical construction parameters, including grouting pressure, grout stiffness, and chamber pressure, on railhead settlement. Additionally, a comparative analysis assessed the effectiveness of settlement control measures, including D-type beam reinforcement, deep-hole grouting reinforcement, and their combined application. Results show that railhead deformation primarily manifests as settlement, with cumulative effects from sequential tunneling of the left and right lines. Proximity to fault zones intensifies crown subsidence, while tunneling induces significant soil stress relaxation, particularly in geologically weaker strata. Within optimal ranges, increased grouting pressure, chamber pressure, and grout stiffness effectively reduce railhead settlement; however, their efficacy diminishes beyond specific thresholds. The combined D-type beam and deep-hole grouting reinforcement scheme proved most effective in controlling settlement, ensuring railway operational safety and construction stability. These findings provide essential theoretical and practical guidance for optimizing shield tunneling strategies in complex urban environments, enhancing the safety and reliability of critical railway infrastructure.
1. Introduction
With rapid urbanization and rising population density, metro tunneling has become a key means of expanding urban space and easing traffic congestion [1,2]. Among available methods, shield tunneling is widely used in metro construction because it offers high efficiency, limited ground disturbance, and strong adaptability [3,4,5]. However, shield tunneling inevitably disturbs the ground and can induce surface settlement. The risk is greater when tunneling beneath existing railways or other sensitive structures, where deformation may affect adjacent embankments. Complex geological conditions—such as faulted or fractured zones—further increase the difficulty of settlement control and pose additional safety risks [5,6,7,8]. Therefore, a systematic evaluation of the mechanisms by which shield tunneling beneath existing railways influences ground deformation is essential for both engineering practice and theoretical research.
To further investigate the effects of ground disturbances induced by shield tunneling, many scholars in China and abroad have conducted studies on settlement prediction and reinforcement using empirical formulas, numerical simulations, and physical model tests [9,10,11]. Among these approaches, the empirical formula method is commonly adopted for preliminary engineering assessments due to its simplicity. Peck [12] proposed the classical Gaussian settlement trough theory, which has been widely applied to predict the surface settlement of shallow tunnels. Based on extensive monitoring data, Attewell [13] supplemented Peck’s model by suggesting that longitudinal ground surface settlement follows a parabolic distribution. With the advancement of computer technology, numerical simulation has gradually replaced empirical formulas as the primary analytical tool. It allows comprehensive consideration of multiple factors affecting surface settlement, such as face support pressure [14], grouting parameters [15,16,17] and soil elastic modulus [7,18]. Numerical models can predict ground responses under multi-factor coupled conditions and thus offer higher accuracy and adaptability. However, their reliability strongly depends on boundary conditions, initial stress settings, and the selection of constitutive models; therefore, validation through physical experiments remains essential. In recent years, data-driven approaches such as machine learning have also been introduced for settlement prediction during shield tunneling. Models like LSTM are trained using tunneling data—such as face pressure and ground settlement—to capture nonlinear coupling, temporal correlations, and multiscale fluctuations, enabling rapid prediction [19,20]. Nevertheless, due to limitations in sample size, generalization ability, and physical interpretability, these approaches are usually combined with mechanistic models and experimental observations to improve engineering applicability. Physical model testing, as an intuitive and reliable reproduction method, can accurately capture the interaction between soil and structures and has been widely employed to simulate ground deformation induced by shield tunneling [21]. Moreover, model tests are frequently used to verify the reliability of numerical simulations and the validity of simplified boundary assumptions. They offer distinct advantages under complex conditions, such as inclined structures, or close-proximity tunneling [22]. Therefore, a combined research approach integrating numerical simulations with physical model testing can more comprehensively reveal the disturbance mechanisms of shield tunneling and enhance both the accuracy of settlement prediction and the controllability of engineering practice. Although the above methods have achieved substantial progress in predicting and controlling settlement during shield tunneling, few studies have systematically examined the cumulative settlement effects and railhead responses during parallel twin-line tunneling under complex geological conditions. Current research mainly relies on numerical simulations and field monitoring data, with limited physical model verification of ground–structure interaction. Furthermore, systematic comparison and quantitative assessment of the settlement control effects of different reinforcement measures under similar geological conditions are still lacking.
In this study, drawing on the complex geological conditions of the Qingdao Metro Line 2 project, both physical model tests and numerical simulation models were developed to analyze the settlement responses of the railhead and tunnel under two conditions: right-line tunneling and subsequent continuous left-line tunneling. The deformation characteristics and the impact of the broken zone were systematically investigated. To verify the accuracy of the numerical simulation results, indoor physical model tests were conducted, and a comparative analysis confirmed the reliability of the numerical simulations in predicting settlement trends and magnitudes. Furthermore, based on the numerical simulations, the influence mechanisms of key construction parameters on railhead settlement responses were examined in depth, and the effectiveness of various reinforcement measures, such as grouting and D-type beam reinforcement, for settlement control was evaluated.
2. Engineering Background
The section between International Cruise Port Station and Taishan Road Station on the west extension of Qingdao Metro Line 2 is located in Shinan District, Qingdao, China. It adopts a configuration of two single-track, single-bore shield tunnels arranged side by side, with the left tunnel measuring 499.053 m and the right tunnel 489.890 m in length. The horizontal center-to-center spacing between the tunnels is approximately 15 m. The tunnels intersect the existing railway at an angle of 40°, with a burial depth of approximately 18 m and a tunnel radius of 3.1 m. As shown in the engineering geological profile in Figure 1, the tunnel passes through, from top to bottom, railway subgrade, miscellaneous fill, coarse gravel sand, moderately weathered granite, and slightly weathered granite. The main tunnel structure is located within the moderately and slightly weathered granite layers. In addition, a fractured zone approximately 36 m in length and inclined at about 70° is present beneath the railway. Detailed geotechnical parameters of the soil and rock layers are provided in Table 1. The study section is located along the Jiaozhou–Jinan Railway, a national Class I line. The track is a ballasted track with 60 kg/m rails, a crushed stone ballast bed, and reinforced concrete sleepers. The subgrade height is approximately 4.40 m. The shield tunnel passes beneath the main line of the Jiaozhou–Jinan Railway, where the permitted train speed is 60 km/h. The maximum single-axle load of the train is 17 tonne. In this study, drawing on the complex geological conditions of the project, the rail settlement and deformation characteristics induced by twin shield tunneling beneath the existing railway were investigated, with particular emphasis on the excavation of the right-line tunnel and the cumulative effects of twin-line tunneling. The designed operating speed of the railway underpass section lies within an urban area where construction safety risks are high and any incident could have serious consequences. In accordance with the Code for Design of High-Speed Railways [23], and the Technical Code for Monitoring of Urban Rail Transit Engineering [24], and with reference to domestic metro projects that have successfully crossed existing railways as well as expert opinions from the project team, the control criteria adopted for the segment crossing the railway subgrade are as follows: the railhead settlement must not exceed 4 mm and the subgrade settlement or heave must not exceed 10 mm. According to the Technical Code for Structural Safety Protection of Urban Rail Transit Engineering [25], during shield tunnel construction, the vertical displacement of the vault, the horizontal displacement of the haunch, and the vertical displacement at the construction site shall all remain below the warning threshold of 10 mm and the control limit of 20 mm.
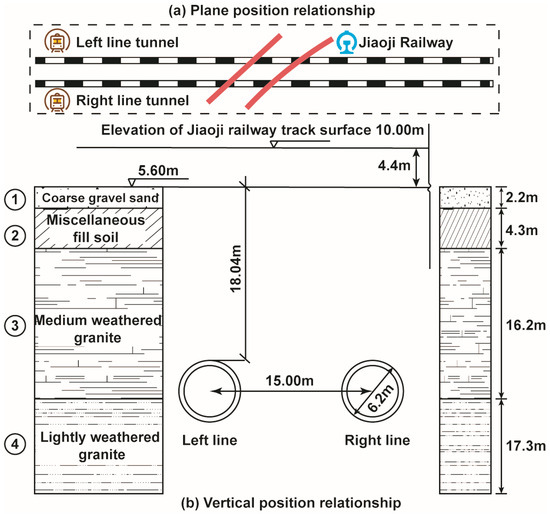
Figure 1.
Engineering geological profile along the twin-tunnel alignment.

Table 1.
Detailed geotechnical parameters of soil and rock layers.
3. Laboratory Model Test of Dual-Mode Shield Tunneling Beneath an Existing Railway
3.1. Preparation and Measurement of Model Soil Samples
3.1.1. Similarity Principles in Model Testing
To gain deeper insight into the variations in earth pressure and surface settlement induced by shield tunneling beneath an existing railway, this study took the engineering geological conditions of Qingdao Metro Line 2 as the research background. Based on similarity theory, a physical model test was carried out, and corresponding soil-similarity materials were prepared to establish the experimental model. Considering both engineering conditions and laboratory constraints, the geometric similarity ratio of the model box was set to CL = 1:50; as shown in Table 2, the similarity ratios of the soil similarity materials were: unit weight Cγ = 1; Poisson’s ratio Cμ = 1; internal friction angle Cφ = 1; cohesion CC = 1:50; elastic modulus CE = 1:50. The data obtained from the model test were converted using these similarity ratios, enabling the simulation to reasonably reflect the deformation characteristics under engineering geological conditions and ensuring compliance with the requirements of similarity theory.

Table 2.
Comparison of physical parameters of similar soil materials.
3.1.2. Similarity Materials for Soil in the Model Test
In the physical model test, soil similarity materials were prepared using quartz sand, iron powder, and barite powder as the primary aggregates, with gypsum as a modifier and rosin dissolved in alcohol as the cementing agent. The quartz sand had a particle size of 30–60 mesh, while both the iron powder and barite powder were in the range of 300–400 mesh. The gypsum used was a standard slow-setting type, the rosin was of Grade I quality, and the alcohol had a purity of 95%. With reference to the engineering geological conditions of Qingdao Metro Line 2 as the research background, the test selected the corresponding soil properties, and multiple sets of orthogonal mix tests were conducted (as shown in Table A1 and Table A2, Figure A1 and Figure A2). The internal friction angle and cohesion of the materials were determined through uniaxial compression tests and density tests. The optimal material proportions were finally determined (see Table 3). Considering that the geotechnical parameters of the miscellaneous fill, coarse gravel sand, and railway subgrade were significantly reduced after geometric scaling, these layers were simplified as dry sand in the physical model test [26]. This study primarily focuses on the mechanical response and deformation characteristics of the soil–structure system during shield tunneling, emphasizing spatial interaction. Meanwhile, the physical model test had a short duration, did not consider groundwater effects, and the tunnel deformation and surface settlement were mainly governed by construction parameters. Therefore, a quasi-static assumption was adopted, and time effects were neglected. In addition, the model materials were cured under standard conditions to the specified age before testing, and their mechanical properties remained nearly constant during the experiment. Based on these considerations, the influence of time-dependent factors on the test results was considered to be of low sensitivity and to have only a minor effect on the final conclusions.

Table 3.
Specific mix proportions of soil similarity materials.
3.2. Fabrication Process of the Physical Model Test
3.2.1. Physical Model Test Chamber
As shown in Figure 2a, a physical model test chamber was designed and fabricated based on a geometric similarity ratio of 1:50, with dimensions of 1.5 m × 1.5 m × 1.0 m (length × width × height), and openings were reserved in the front and rear panels for tunnel excavation. Petroleum jelly was applied to the inner walls to reduce boundary friction, and frictional resistance was neglected during the test.
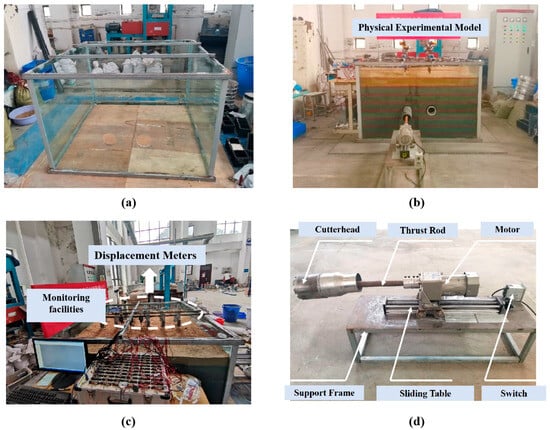
Figure 2.
Tunnel excavation and simulation equipment: (a) Actual view of the physical model test chamber; (b) Schematic diagram of tunnel excavation; (c) Model layout diagram; (d) Shield tunneling simulation device.
3.2.2. Tunneling Equipment and Procedures
The tunnel excavation simulation device consisted of a sliding platform, motor, cutterhead, and force transmission rod, with the entire platform fixed to a supporting frame to ensure stability during shield tunneling. The tunnel lining was simulated using polyethylene (PE) pipes, and the grouting layer was prepared with a water-gypsum mixture at a mass ratio of 2:1. The upper railway structure, including sleepers and rails, was made of plexiglass, and the rail assembly was bonded with adhesive to simulate the actual fastening system. According to the Design Code for High-Speed Railways [23], in this study, the train load was equivalent to a uniform load of 60 kPa. The same uniform load was applied in both the numerical model and the physical model test. In the physical model tests, weight bags were placed on the rail structure to apply the load, ensuring that the applied pressure was equivalent to a uniform load of 60 kPa, thereby achieving a simulation of the train load. The detailed layout is shown in Figure 2b–d.
Based on the engineering background, this study mainly analyzed two tunneling conditions: right-line tunneling, and left-line tunneling following the completion of the right line. The tunneling process primarily included the following stages: soil excavation, shield advancement, grouting pressure application, face pressure control, segment assembly, and grout layer hardening.
3.2.3. Monitoring Items and Methods
This study primarily monitored the variations in railhead settlement, surface settlement, vault settlement, and soil pressure during shield tunneling. The specific methods were as follows: Railhead settlement was measured using displacement gauges with a sensitivity of 0.3 mV/mm, connected to a static strain acquisition system in a half-bridge configuration. Surface settlement was monitored by displacement gauges in combination with embedded spheres in the soil, where the displacement of the spheres was used to quantify settlement. Vault settlement was measured using dial indicators and a custom auxiliary device. Soil pressure was monitored with GR-WXTY50 earth pressure cells manufactured by Changsha Guorui Electronic Technology Co., Ltd., Changsha, China Data acquisition was conducted using a DH3816 static strain collector (manufactured by Jiangsu Donghua Testing Technology Co., Ltd., Jingjiang City, China) to ensure the validity and accuracy of the monitoring data.
3.3. Analysis of Physical Model Test Results
3.3.1. Surface Settlement
To investigate the surface settlement pattern induced by shield tunneling, six monitoring points (DB-1 to DB-6) were arranged along the tunnel axis in the laboratory model, as shown in Figure 3a. Surface settlement data were recorded at 5 cm excavation intervals.

Figure 3.
Surface Displacement Gauge Layout and Displacement Variations at Characteristic Points during Shield Tunneling: (a) Layout schematic of surface displacement gauges; (b) Surface displacement variations at characteristic points during right-line tunnel excavation; (c) Surface displacement variations at characteristic points during left-line tunnel excavation.
Figure 3b,c illustrates the surface settlement patterns induced by the shield tunneling of the right and left-line tunnels. During the excavation of the right-line tunnel, monitoring points DB-1 and DB-2 exhibited significant settlement, with a sharp increase observed when the shield face approached the monitoring section, indicating possible plastic deformation of the surrounding ground. The initial deformation rate was rapid. In addition, excavation of the right-line tunnel caused varying degrees of settlement at the surface monitoring points above the left-line tunnel and between the two tunnel bores. The settlement curves at DB-3 to DB-6 were comparatively gentler than those at DB-1 and DB-2, indicating that the farther the distance from the excavation face, the weaker the disturbance and the smaller the settlement magnitude and rate.
During the excavation of the left-line tunnel, the surface settlement trends at DB-5 and DB-6 were similar to those at DB-1 and DB-2. The left-line excavation induced secondary disturbance in the soil, and due to the superposition effect of the prior right-line disturbance, the settlement above the left-line exceeded that of the right-line. However, it remained lower than the settlement recorded at the monitoring point located between the two tunnels, indicating that the soil between the left and right tunnel bores experienced the most cumulative disturbance, resulting in the greatest surface settlement.
3.3.2. Soil Pressure
To further investigate the variation patterns of soil pressure induced by shield tunneling, earth pressure cells were installed in the physical model box, as shown in Figure 4a. Figure 4b,c present the soil pressure variations after the completion of the right-line and left-line tunnel tunneling, respectively. It can be observed that soil pressure changed continuously during the shield tunneling process. Although the amplitude of variation differed among monitoring points, the overall trend remained generally consistent.
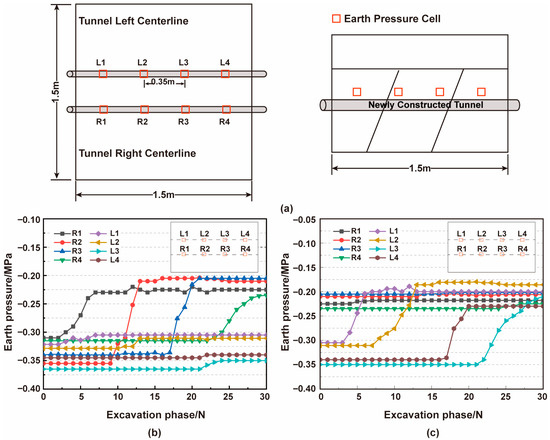
Figure 4.
Earth pressure cell layout and soil pressure variations during shield tunneling: (a) ayout of earth-pressure cells in the model box; (b) Soil pressure variation after completion of right-line tunneling; (c) Soil pressure variation after completion of left-line tunneling.
As shown in Figure 4b, the initial soil pressure values recorded by the earth pressure cells varied significantly before shield tunneling, mainly due to the influence of geological conditions and the angle between the railway and the tunneling direction. Monitoring points R2 and R3, located beneath the railway subgrade, exhibited higher initial soil pressures compared to R1 and R4. Following the excavation of the right-line tunnel, overall soil pressure was released, with varying degrees of reduction observed at R1-R4. Notably, R2 and R3 were situated within the fractured zone, and their soil pressure reductions were significantly greater than those at R1 and R4, which were embedded in moderately weathered granite.
As shown in Figure 4c, after the completion of the left-line tunneling, the recorded soil pressure reductions at monitoring points L1 through L4 were 34.43%, 40.19%, 40.00%, and 32.35%, respectively. The pressure cells L2 and L3, located within the fractured zone, exhibited greater pressure release compared to L1 and L4. These results indicate that shield tunneling leads to soil stress release, which is more pronounced in geologically weaker strata. Additionally, the excavation of the left-line tunnel influenced the soil pressure distribution at points along the previously excavated right-line tunnel.
4. Numerical Simulation Analysis
4.1. Construction of the Numerical Calculation Model
In this study, a three-dimensional finite element model was developed using ABAQUS (2021, Dassault Systèmes, Vélizy-Villacoublay, France) to simulate the structural response during shield tunneling beneath the railway. As shown in Figure 5a, based on Saint-Venant’s principle, the model was extended 3 to 5 times the tunnel diameter on both sides and below the tunnel. The final computational domain measured 75 m in the X-direction (horizontal tunnel direction), 120 m in the Y-direction (excavation direction), and 44.4 m in the Z-direction (vertical direction).

Figure 5.
Numerical Simulation Model and Construction Process of Shield Tunneling: (a) Schematic of the numerical simulation model; (b) Relative position between railway rail and tunnel; (c) Simulation of the construction process; (d) Schematic of the equivalent layer.
The Mohr-Coulomb constitutive model was adopted for the soil layers, while the shield machine, segmental lining, grouting layer, and track structure (rails and sleepers) were modeled using linear elastic constitutive behavior. The effects of jointed strata and groundwater were not considered. The rail was oriented at an angle of approximately 45° to the tunnel axis, and the rails were bonded to the railway subgrade through tie constraints. The model also included a 30 m-wide fractured zone with a dip angle of 75°. The structural layout of the rail was illustrated in Figure 5b, and the material parameters were listed in Table 1. According to the Design Code for High-Speed Railways [23], the equivalent soil column method was adopted to convert the combined static and dynamic train loads into an equivalent static uniform load. Considering the actual conditions of Qingdao Metro Line 2, with 60 kg/m rails, a maximum single-axle load of 17 tonne, and a maximum operating speed of 60 km/h, We referred to the conversion relationship specified in the Design Code for High-Speed Railways: under the conditions of using 60 kg/m rails and an operating speed of ≤160 km/h, the equivalent pressure is approximately 59.7 kPa. Considering the actual engineering conditions, this study accordingly adopted 60 kPa as the equivalent uniform load applied on the railhead to satisfy the requirements of train operation.
4.2. Simulated Construction of the Shield Tunnel
As shown in Figure 5c, the construction process was simulated using the stiffness transfer method. Given that each segment ring is 1.5 m in length, the tunnel was excavated in steps of 3 m (equivalent to two rings). The right-line tunnel was excavated first, followed by the left-line tunnel and both were implemented using a step-by-step excavation approach.
4.3. Selection of Computational Parameters for Shield Tunnel Simulation
In practical engineering, the shield tunnel lining was assembled from six precast segmental units. In this study, to maintain consistency with the physical model test, the modified conventional method was adopted to reduce the longitudinal stiffness of the segmental lining, with a reduction coefficient η set to 0.7, resulting in a reduced elastic modulus of 2.42 × 10⁴ MPa. The grouting layer was simplified as a homogeneous elastic equivalent layer concentric with the segmental lining. Its thickness was determined based on the theoretical tail void (Δ), using the formula with a reduction coefficient η = 1. The structural configuration of the equivalent grouting layer is illustrated in Figure 5d.
The shield tunneling parameters were defined as follows: the tail grouting pressure was set to 0.3 MPa to simulate the grout injection process, with the pressure acting perpendicularly on the surrounding soil. In determining the face-support pressure, this study comprehensively considered both theoretical analysis and engineering experience. The active earth pressure and the at-rest earth pressure at the tunnel axis depth were used as reference boundaries. Based on these reference values, together with recommended ranges from similar engineering projects and field construction experience, a uniform face support pressure of 0.15 MPa was adopted. Subsequent analyses of the relationship between face pressure and railhead settlement further verified the rationality of this selected value. The thrust of the jack pressure was defined as 0.2 MPa to meet the mechanical requirements for stable shield advancement.
4.4. Deformation Analysis
4.4.1. Railhead Deformation
To investigate the impact of shield tunneling beneath the railway on the track structure, the settlement curves of rails 1 to 8 under different construction stages were extracted, as shown in Figure 6. The results indicated that the settlement profiles exhibited a typical “single-peak” distribution in all cases. After the completion of right-line tunneling, the peak settlement occurred above the right tunnel crown, with maximum railhead settlements ranging from 3.94 mm to 4.48 mm. Rail 6, located within the fractured zone, exhibited the most pronounced settlement. As the left-line tunnel advanced beneath the railway section, settlement further increased. Upon completion of the left-line tunneling, the settlement trough shifted toward the central axis, and the peak value significantly increased, reaching a maximum of 6.96 mm, which exceeds the allowable limit specified in relevant design codes [23,24,25].
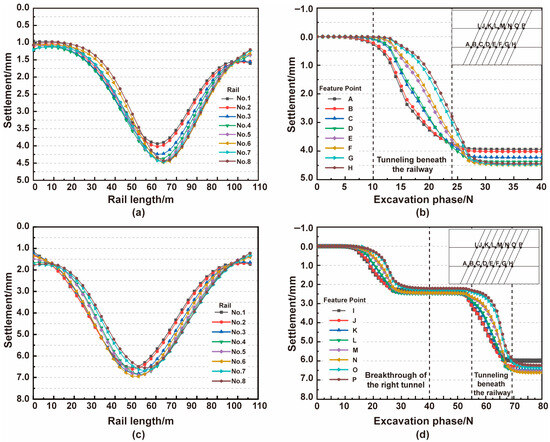
Figure 6.
Railhead settlement curves and characteristic point responses during right-line and left-line tunneling: (a) Railhead settlement curve during right-line tunneling; (b) Railhead settlement curves of rail monitoring points during right-line tunneling; (c) Railhead settlement curve during left-line tunneling; (d) Railhead settlement curves of rail monitoring points during left-line tunneling. (A–P) denote the monitoring points along the right and left tunnel axes, respectively.
4.4.2. Subgrade Deformation
As shown in Figure 7, the settlement contour maps of the railway subgrade were presented for both the right-line and left-line tunneling completions. After the right-line tunneling, the subgrade deformation was predominantly vertical settlement, with a maximum settlement of 4.48 mm, located directly above the crown of the right tunnel. Following the completion of the left-line tunneling, settlement remained the dominant deformation mode, with the maximum displacement increasing to 7.00 mm. The settlement center shifted to the area directly above the central axis between the two tunnels, and the overall deformation intensified. Although the magnitude of settlement satisfies the requirements specified in the applicable construction design codes, the cumulative disturbance from twin tunnels’ excavation still poses a significant impact on the subgrade structure, indicating the necessity for enhanced dynamic monitoring and protective measures.
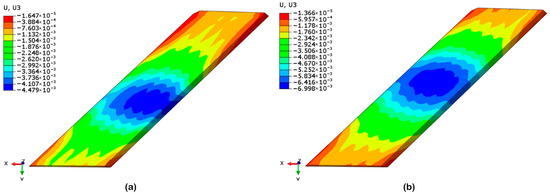
Figure 7.
Plan view of vertical settlement contour maps of the railway subgrade during the right-line and left-line tunneling stages: (a) Vertical settlement contour map of the railway subgrade after right-line tunneling; (b) Vertical settlement contour map of the railway subgrade after left-line tunneling.
4.4.3. Tunnel Deformation Analysis
To analyze the impact of shield tunneling on tunnel deformation, monitoring points were arranged at the crown, shoulder, and invert of the tunnel, to record the deformation responses at different positions. Figure 8b,c presents the deformation curves of each monitoring point. The results indicated that, after the completion of the right-line tunneling, crown settlement was mainly concentrated in the fractured zone, reaching 10.83 mm. Subsequently, the tunneling of the left-line induced a significant superimposed disturbance effect, with the crown settlements of the right and left tunnels increasing to 11.73 mm and 11.92 mm, exceeding the warning threshold defined in the relevant practical engineering design standards. The horizontal displacement of the tunnel shoulders exhibited a symmetrical distribution. The tunneling of the left-line tunnel imposed a certain degree of lateral compression on the soil between the two tunnels, resulting in a slight rightward displacement of the entire right-line tunnel. The uplift at the tunnel invert slightly decreased following the left-line tunneling, indicating a stress compensation effect. Overall, crown settlement serves as the primary deformation control indicator. Additional reinforcement and monitoring are recommended in the fractured zone to ensure structural stability.

Figure 8.
Displacement variations of tunnel monitoring points: (a) Settlement curve of the tunnel crown; (b) Heave curve of the tunnel invert; (c) Horizontal displacement curve of the tunnel haunch.
5. Comparative Analysis Between Numerical Simulation and Physical Model Test Results
5.1. Railhead Settlement
As shown in Figure 9a, displacement meters were installed at Rail 1 and Rail 6. By analyzing the monitoring data obtained after the completion of the right-line and left-line tunneling, the railhead settlement curves were compared with the numerical simulation results (Figure 9b,c). To ensure comparability with the numerical simulation results, the physical model test data were converted based on similarity theory.
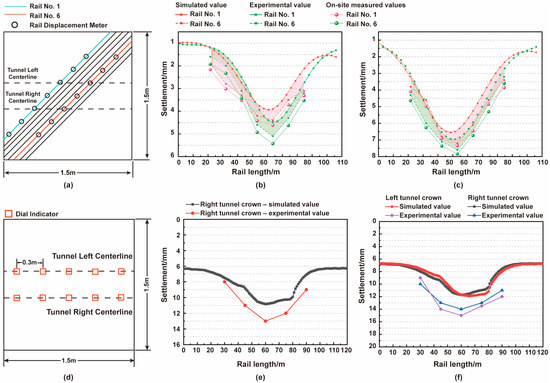
Figure 9.
Comparison of settlement between physical model test and numerical simulation: (a) Layout of displacement meters on rails; (b) Railhead settlement comparison after completion of right-line tunneling; (c) Railhead settlement comparison after completion of left-line tunneling; (d) Layout of dial gauges at tunnel vault; (e) Vault settlement comparison after completion of right-line tunneling; (f) Vault settlement comparison after completion of left-line tunneling.
As shown in Figure 9b, the settlement curves of the physical model and numerical simulation showed consistent trends. After the completion of the right-line tunneling, the maximum settlement at Rail 1 was 3.94 mm in the numerical simulation and 4.40 mm in the physical model, with a difference of 0.46 mm, approximately 11.7% higher in the physical model. The field-measured value was 4.63 mm, which was 17.5% higher than the numerical simulation and 5.2% higher than the physical model. For Rail 6, the maximum settlement was 4.48 mm in the numerical simulation and 5.10 mm in the physical model, with a difference of 0.62 mm, approximately 13.8% higher in the physical model. The field-measured value was 5.41 mm, which was 20.8% higher than the numerical simulation and 6.1% higher than the physical model. The settlement peaks for both rails were located above the right-line tunnel crown, with good agreement in the settlement trough shape. As shown in Figure 9c, after the completion of the left-line tunneling, the settlement trough shifted toward the centerline between the two lines. The maximum settlement at Rail 1 was 6.55 mm in the numerical simulation and 7.20 mm in the physical model, with a difference of 0.65 mm, approximately 10.0% higher in the physical model. The field-measured value was 7.34 mm, which was 12.1% higher than the numerical simulation and 1.9% higher than the physical model. For Rail 6, the maximum settlement was 6.96 mm in the numerical simulation and 7.60 mm in the physical model, with a difference of 0.64 mm, approximately 9.2% higher in the physical model. The field-measured value was 7.84 mm, which was 12.6% higher than the numerical simulation and 3.2% higher than the physical model. Consistency analysis indicated that after right-line tunnel excavation, at the same monitoring points, the root mean square error (RMSE) for Rail 1 and Rail 6 was 0.70 mm and 0.55 mm, respectively, with mean absolute errors (MAE) of 0.66 mm and 0.53 mm. The numerical simulation slightly underestimates settlements, with the most pronounced underestimation at the maximum settlement point of Rail 6 compared to field measurements. The settlement peaks were located above the right-line tunnel crown, and the trough shapes align well. After the completion of the two lines tunnel, the RMSE for Rail 1 and Rail 6 increased to 0.74 mm and 0.79 mm, respectively, with MAEs of 0.72 mm and 0.74 mm. The settlement peak shifted to the centerline between the two lines. The physical model tests and numerical simulations underestimated the measured surface settlement, primarily due to the idealized assumptions of soil conditions and loading, as well as parameter simplification. The models did not fully account for the stratification and anisotropy of the rock mass, nor for the coupled effects of groundwater seepage and pore pressure variations.
During construction, transient fluctuations in parameters like tail grouting pressure (0.25–0.35 MPa), chamber pressure (0.12–0.18 MPa), and jack thrust force (0.18–0.22 MPa) occur but are short-lived and spatially random, resulting in low sensitivity to maximum settlement. Due to limited field data, analysis was restricted to monitoring points corresponding to the physical model. After dual-line excavation, field-measured settlements at Rail 1 and Rail 6 are 12.1% and 12.6% higher than the numerical simulation, respectively, but these differences have minimal impact, indicating that transient parameter fluctuations have limited influence on maximum settlement. Despite these discrepancies, the numerical simulation and physical model show high consistency with field-measured settlement trends, with RMSE and MAE remaining relatively small, confirming their reliability in predicting railhead settlement.
5.2. Crown Settlement
Figure 9d–f present the arrangement of dial indicators on the tunnel crown, along with a comparison of crown settlement results obtained from numerical simulation and physical model tests during the right-line and left-line tunneling. The experimental data were converted based on similarity ratios. The results indicated that the crown displacement trends of both left and right tunnels were generally consistent, and crown settlement becomes more pronounced as the tunnel approaches the fractured zone. After the completion of the right-line tunneling, the maximum crown settlement of the right-line tunnel was 10.83 mm in the numerical simulation and 14.00 mm in the physical model test, with a difference of 3.17 mm. Consistency analysis based on physical model measurement points yields an RMSE of 1.81 mm. Following the completion of the left-line tunneling, the combined effects of left- and right-line construction result in a maximum crown settlement of the right-line tunnel of 11.73 mm in the numerical simulation and 15.50 mm in the physical model, with a difference of 3.77 mm and an RMSE of 2.72 mm. For the left-line tunnel crown, the maximum settlement was 11.92 mm in the numerical simulation and 16.50 mm in the physical model, with a difference of 4.58 mm and an RMSE of 3.41 mm. The slightly larger values observed in the physical model tests were attributed to the disturbance of surrounding soil caused by shield tunneling. Nevertheless, the overall trends were consistent, and the deviations relatively small, demonstrating the high reliability of the numerical simulation in predicting crown settlement. The RMSE range of 1.81–3.41 mm indicated controlled errors, confirming the reliability of the numerical simulation for predicting crown settlement.
In summary, the numerical simulation results showed a high degree of agreement with the physical model tests, verifying the accuracy and reliability of the numerical simulation in predicting railhead settlement and crown deformation induced by tunnel construction.
6. Influence of Construction Parameters on Shield Tunneling Beneath Railways and Corresponding Control Measures
6.1. Influence of Construction Parameters on Shield Tunneling Beneath Railways
During the shield tunneling process beneath the railway, controlling Railhead settlement is critical to ensuring construction safety and the structural stability of the rail system. Grouting pressure, grout stiffness (The equivalent layer modulus of the soil after being reinforced by grouting materials, Mpa), and chamber pressure are key construction parameters that significantly influence face stability and settlement control, as well as the deformation behavior of the surrounding soil. To evaluate the influence of these parameters, numerical simulations were conducted under simplified geological conditions without considering the fractured zone. Grouting pressure was set to 100 kPa, 200 kPa, 300 kPa, 400 kPa, and 500 kPa; grout stiffness to 50 MPa, 100 MPa, 150 MPa, 200 MPa, and 250 MPa; and chamber pressure to 100 kPa, 150 kPa, 200 kPa, 250 kPa, and 300 kPa. The grouting layer was represented by an equivalent elastic layer, and the grout hardening process was neglected. A parametric study based on the control variable method was employed to investigate the influence of each parameter on railhead settlement. Figure 10 illustrates the settlement curves and the variation in maximum settlement under different parameter settings after the completion of the right tunnel and the left tunnel.
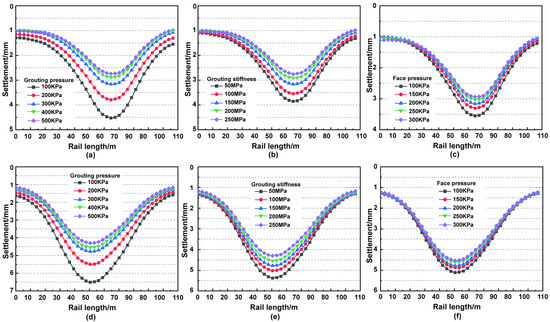
Figure 10.
Variation in railhead settlement under different construction parameters: (a,d) Railhead settlement curves under different grouting pressures during right-line and left-line tunneling; (b,e) Railhead settlement curves under different grout stiffness during right-line and left-line tunneling; (c,f) Railhead settlement curves under different earth chamber pressures during right-line and left-line tunneling.
The research results, as shown in Figure 10, indicated that the settlement curves under both working conditions exhibited a unimodal pattern for all three parameters. An increase in grouting pressure, grout stiffness, and earth chamber pressure was effective in reducing the maximum railhead settlement, although the underlying mechanisms and variation trends differ among the parameters. Specifically, the maximum railhead settlement decreased with increasing grouting pressure. As the grouting pressure increased from 100 kPa to 500 kPa, the maximum railhead settlement was reduced by 1.79 mm and 2.17 mm under the right-line and left-line tunneling conditions, respectively. While grouting pressure and maximum railhead settlement exhibited an inverse relationship, the reduction in settlement became progressively smaller as the pressure increased. When the pressure increased from 200 kPa to 300 kPa, the rate of reduction slows down; beyond 400 kPa, further changes in settlement become negligible. Excessive grouting pressure may lead to grout overconsumption, and in severe cases, may cause segment uplift or cracking.
Grout stiffness also plays a positive role in settlement control. As grout stiffness increases, the maximum railhead settlement continued to decrease. Under all levels of grout stiffness, the railhead exhibited settlement without any occurrence of heave. When grout stiffness increased from 50 MPa to 250 MPa, the maximum railhead settlement decreased by 1.10 mm and 1.08 mm for the right-line and left-line tunneling, respectively. However, when the grout strength reached 200 MPa, the rate of reduction in settlement began to plateau. These findings indicated that grout stiffness had a significant influence on railhead settlement. A higher initial grout stiffness enhanced the support capacity of the surrounding ground, improved stability, and contributed to overall tunnel safety. Therefore, timely grouting was essential during the tunneling process.
As the earth chamber pressure increased from 100 kPa to 300 kPa, the maximum railhead settlement was reduced by 0.61 mm and 0.58 mm for the right-line and left-line tunneling, respectively. The relationship between earth chamber pressure and maximum railhead settlement was approximately linear. However, as pressure increased further, the slope of the settlement curve became gentler, indicating a diminishing marginal effect. Within a reasonable range, increasing earth chamber pressure can significantly contribute to settlement reduction. Through further analysis of the influence of chamber pressure variation on surface heave, this study calculated and compared the stress states of the ground under different stratigraphic conditions during the shield excavation stage. The results showed that the at-rest earth pressure at the tunnel center is approximately 271 kPa. When the chamber pressure increased to 300 kPa, the difference from the at-rest earth pressure was small, the overall deformation remained controllable, and no obvious opposite-side shear or instability was observed. Therefore, it can be concluded that within the 100–300 kPa pressure range, the risk of surface heave was low. It was recommended to maintain the chamber pressure within the range of 200–250 kPa to ensure face stability while effectively mitigating railhead settlement and minimizing ground disturbance during construction.
6.2. Study on Reinforcement Measures for Twin Shield Tunneling Beneath Existing Railways
The results indicated that, in the absence of reinforcement measures, twin shield tunneling may lead to railhead settlement and tunnel crown settlement exceeding the control standards, thereby adversely affecting the tunnel structure. Therefore, based on the numerical simulation, this study selected Rail 6 and the tunnel crown as evaluation objects to comparatively analyzed the control effectiveness of the D-type beam reinforcement method, the deep-hole grouting reinforcement method, and their combined reinforcement scheme.
6.2.1. D-Type Temporary Beam
In this study, the adopted D-type beam structure consisted of longitudinal beams, transverse beams, brackets, and connecting plates, with tie constraints applied between the longitudinal and transverse beams to enhance overall stiffness. The longitudinal beams used D24-type beams with a length of 24.5 m, while the transverse beams were I-beams with a length of 3.2 m. All components of the beam structure were made of 16 Mnq steel. The supporting piles were cast-in-place reinforced concrete piles with a diameter of 1.5 m and a length of 18 m, installed on both sides of the railway subgrade. A three-dimensional model of the reinforcement system was developed using the ABAQUS (2021, Dassault Systèmes, France) finite element software. Figure 11a illustrates the configuration and reinforcement scheme of the D-type beam.
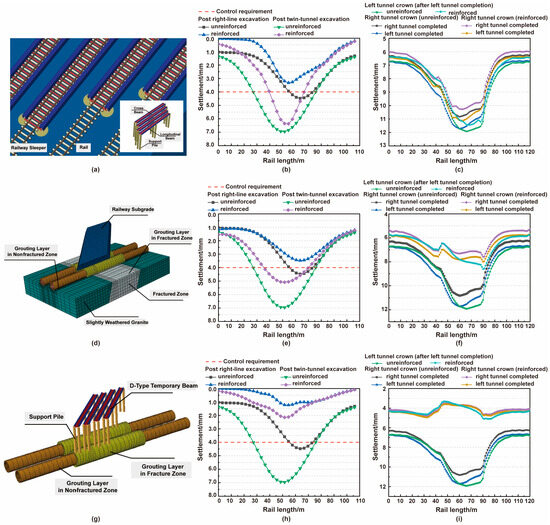
Figure 11.
Finite element models of different reinforcement schemes and comparison of reinforcement displacements: (a) Finite element model of D-type beam reinforcement; (b) D-type beam reinforcement railhead displacement; (c) D-type beam reinforcement crown displacement; (d) Numerical model of the combined reinforcement scheme; (e) Combined reinforcement railhead settlement displacement comparison; (f) Combined reinforcement tunnel crown settlement displacement comparison; (g) Numerical model of the combined reinforcement scheme; (h) Combined reinforcement railhead settlement displacement comparison; (i) Combined reinforcement tunnel crown settlement displacement comparison.
Figure 11b,c present a comparison of the settlement of Rail 6 and the tunnel crown before and after the implementation of the D-type beam reinforcement. The results show that, after applying the D-type beam, the maximum railhead settlement under the right-line tunneling decreased from 4.48 mm to 3.32 mm, with a control efficiency of 25.89%; under the double-line tunneling, the maximum railhead settlement decreased from 6.96 mm to 6.37 mm, with a control efficiency of 8.48%. Regarding tunnel crown settlement, after the completion of the right-line tunneling, the maximum crown settlement decreased from 10.83 mm to 10.28 mm. Upon completion of the double-line tunneling, the maximum crown settlement of the right tunnel decreased from 11.73 mm to 11.12 mm, while that of the left tunnel decreased from 11.92 mm to 11.44 mm. The corresponding control efficiencies for the tunnel crown settlement were 5.07%, 5.20%, and 4.03%.
Although the D-type beam provided a certain degree of structural support, enhancing the overall stiffness of the upper structure and reducing the direct effect of train loads on the rail-thus mitigating railhead settlement-it still failed to meet the control requirements, with the maximum displacement exceeding the warning threshold. This is mainly because, while the D-type beam effectively supports the upper railway structure, its additional self-weight increases the compressive stress on the underlying strata, thereby limiting its effectiveness in controlling crown settlement.
6.2.2. Deep-Hole Grouting
Deep-hole grouting inside the tunnel is implemented through reserved grouting holes in the segmental lining, targeting the soil within a certain range behind the lining for secondary reinforcement. In this study, under the condition that the model dimensions, stratum parameters, static loads, and boundary conditions remain unchanged, the grouting effect was simulated by modifying the properties of the soil within a specified radial range outside the shield. Specifically, the shield tunneling zone was divided into fractured and non-fractured regions. In the non-fractured region, the grouting range was set to 0.5 m around the tunnel, while in the fractured zone, it was extended to 2.0 m. During construction, the 2 m grouting range in this study refers to the area surrounding the tunnel within the fractured zone, where the rock mass integrity index (Kv) is between 0.30 and 0.50. Secondary reinforcement of the soil behind the segmental lining was carried out through 16 grouting holes arranged on each segment ring. The deep-hole grouting method is employed through the reserved holes, using a 1:1 cement–sodium silicate double-liquid grout injected by a high-pressure double-liquid pump, which can achieve an effective reinforcement radius of approximately 2 m within the fractured zone. The soil within these ranges is replaced with equivalent reinforced geomaterials for numerical analysis. The hardening process of the grout is not considered in the simulation. Figure 11d illustrates the division of grouting zones and the numerical model for secondary grouting reinforcement.
Figure 11e,f present the comparison of railhead settlement and crown deformation before and after deep-hole grouting reinforcement. The results indicate that the depth and width of the settlement trough were significantly reduced after reinforcement. Upon completion of the right-line and left-line tunneling, the maximum railhead settlements decreased from 4.48 mm to 3.47 mm and from 6.96 mm to 5.09 mm, with control efficiencies of 22.54% and 26.87%, respectively. Deep-hole grouting significantly improved ground stability and effectively reduced railhead deformation, although the overall settlement still did not fully meet the control standards. After the left-line tunneling, the maximum crown settlements of the right and left tunnels decreased to 8.00 mm and 8.61 mm, with control efficiencies of 31.80% and 27.77%, respectively. All settlement values remained below the warning threshold, demonstrating the good reinforcement effect of deep-hole grouting.
These findings suggest that deep-hole grouting significantly improves the compactness of the reinforced soil, compensates for ground loss during shield tunneling, and reduces the influence of railway loading on the tunnel crown. Consequently, it effectively limits the range of construction-induced disturbances, thereby controlling ground deformation and railhead settlement.
6.2.3. Combined Reinforcement
To further enhance the stability of the track structure during shield tunneling, this study proposes a combined reinforcement scheme that simultaneously adopts the D-type beam system and deep-hole grouting. This integrated approach reinforces both the upper structure and the underlying ground. The D-type beam provides structural support and constraint, while the deep-hole grouting improves ground stability, thereby significantly enhancing the overall resistance to deformation. Figure 11g presents the numerical model of the combined reinforcement scheme.
As shown in Figure 11h,i, the variations in railhead deformation and tunnel crown settlement before and after the implementation of the combined reinforcement scheme are presented. The results indicate that the depth and width of the railhead settlement trough were significantly reduced after reinforcement. Upon completion of the right-line and double-line tunneling, the maximum railhead settlements were reduced to 1.23 mm and 2.15 mm, with control efficiencies of 72.54% and 69.11%, respectively. After the left-line tunneling, the maximum crown settlements of the right and left tunnels were further reduced to 4.95 mm and 5.11 mm, with control efficiencies of 57.80% and 57.13%, respectively, all within acceptable limits.
This improvement is primarily attributed to the enhanced soil conditions above the tunnel crown provided by deep-hole grouting, which mitigated the adverse effects of the D-type beam’s self-weight and the railway loading. Compared with individual reinforcement methods, the combined approach proved most effective. On one hand, deep-hole grouting significantly increased the strength of the surrounding ground, reducing overall deformation; on the other hand, the D-type beam enhanced the structural stiffness of the track, improving its load-bearing capacity and overall stability. Together, these measures synergistically reduced the adverse effects of shield tunneling on the railway structure.
7. Conclusions
This study takes the twin-mode shield tunneling beneath the Jiaozhou–Jinan Railway in the section between International Cruise Port Station and Taishan Road Station of Qingdao Metro Line 2 (West Extension) as the engineering background. Based on the geological and construction conditions of this project, numerical simulations were conducted using the ABAQUS (2021, Dassault Systèmes, France) finite element software, and laboratory model tests were carried out to investigate the deformation behavior of the railway during shield tunneling. Furthermore, the effects of different reinforcement schemes on railhead settlement and tunnel crown settlement were analyzed through simulation, and corresponding reinforcement measures were proposed. The main conclusions are as follows:
- During the double-line shield tunnel construction under the railway, the left-line excavation creates a cumulative effect on the existing disturbance in the right-line, leading to increased railhead settlement. Particularly in areas near the broken zone, the settlement of the tunnel crown increases significantly, and the release of soil pressure becomes more evident. After the left-line excavation is completed, the bottom of the right-line arch is affected by the stress compensation effect, which alleviates the heave. Numerical simulations have shown consistent trends in railhead settlement and tunnel crown deformation, thus proving the reliability of the simulation results. Therefore, physical model tests have validated the accuracy of the numerical simulations, and particular attention should be paid to the deformation and stress changes in weak soil layers during construction to prevent uncontrolled secondary deformations.
- The different construction parameters have a significant influence on the railhead settlement induced by shield tunneling. Increasing the grouting pressure, grout stiffness, and soil chamber pressure can effectively reduce railhead settlement; however, their control effects exhibit critical thresholds. When the grouting pressure increases to 400 kPa, the reduction in settlement tends to stabilize, indicating that excessively high grouting pressure not only provides limited improvement but may also lead to grout wastage. When the grout stiffness reaches 200–250 MPa, its control effect on railhead settlement becomes noticeably weaker. As the soil chamber pressure increases from 100 kPa to 300 kPa, the railhead settlement decreases almost linearly, but the slope gradually flattens, especially within the 200–300 kPa range, where the improvement in settlement control becomes significantly less pronounced. Therefore, to achieve a balance between settlement control and structural stability, construction parameters should be dynamically optimized according to the site-specific geological conditions.
- Comparison of different reinforcement schemes reveals that the use of D-type beams alone can enhance the overall integrity of the superstructure and reduce the influence of railway loads on the subgrade, but it imposes additional pressure on the underlying strata, leading to limited effectiveness in controlling tunnel crown deformation. In contrast, deep-hole grouting significantly improves the strength of the surrounding soil and compensates for ground loss caused by tunneling, offering notable control over crown settlement but with limited effect on railhead settlement. The combined application of D-type beams and deep-hole grouting provides simultaneous reinforcement of both the railway structure and the surrounding ground, significantly improving the overall control of settlement deformation, and has thus been identified as the most effective and comprehensive solution.
8. Limitations and Future Research
- In this study, the train load was simplified as an equivalent static uniform load of 60 kPa to highlight the influence of shield tunneling on the overlying railway structure. However, this simplification does not fully capture the dynamic axle-load spectra (such as speed and actual axle loads) and the moving load effects during train operation. Future research will incorporate the effects of train dynamic loads to more accurately simulate the time-varying stress and deformation responses induced by train operation.
- In this study, the influence of groundwater was neglected in the numerical simulations, and an isotropic, linear-elastic framework was adopted. Pore-pressure and partially drained effects, as well as the nonlinear behavior of soil under cyclic loading, were not considered, which may lead to an underestimation of local settlement or a shift in peak settlement. Under coupled pore-pressure–consolidation and partially drained boundary conditions, drainage limitations and reductions in effective stress during construction can cause a certain degree of soil softening, thereby amplifying the settlement peak; as pore pressure dissipates, the long-term total settlement may continue to increase. When the nonlinear cumulative effects induced by cyclic loading are further considered, the settlement response may be further intensified. Based on these insights, future research will incorporate consolidation–pore-pressure coupling and nonlinear soil constitutive models to more accurately characterize soil–structure interactions under partially drained and cyclic loading conditions, thereby improving the predictive accuracy and engineering applicability of the model.
9. Applications
This study conducted numerical analysis and comparative verification based on the Qingdao Metro project, and further explored its applicability to similar shield tunneling projects. Regarding the applicable geological conditions, this study mainly focuses on granite formations with locally developed fractured zones, representing typical rock or semi-rock geological conditions. For soft or water-saturated soils, the mechanical properties, pressure transfer mechanisms, and deformation characteristics may differ significantly; therefore, the conclusions and parameter optimization results presented in this paper should not be directly extrapolated to such geological conditions. The proposed analytical method and computational procedure are applicable to railway or urban rail transit projects with structural types and geological conditions similar to those in this study. For cross-project applications, the model can be reused by appropriately adjusting soil parameters, load levels, and boundary conditions. In terms of implementation, key parameters such as soil layer properties and external load values should first be determined from geotechnical investigation data, and the analysis can be validated using monitoring indicators such as vault settlement and surface deformation. Within this framework, since the model simplifies both geological conditions and train loads through equivalent and idealized representations, it is best suited for assessing settlement trends, identifying potential risks, and comparing alternative design schemes. However, it should not be directly adopted for final design purposes, as certain discrepancies may still exist compared with actual engineering conditions.
Author Contributions
Conceptualization, W.L. and S.W.; validation W.L. and S.W.; formal analysis, Y.W. (Yankai Wu); investigation, Y.W. (Yankai Wu); resources W.L. and S.W.; data curation, C.G.; writing—original draft preparation, W.L. and S.W.; visualization, Y.W. (Yugang Wang); supervision, R.S.; project administration, Y.W. (Yankai Wu); funding acquisition, Y.W. (Yankai Wu) and C.G. All authors have read and agreed to the published version of the manuscript.
Funding
This research was funded by the National Natural Science Foundation of China (grant number 42507259) and the Natural Science Foundation of Shandong Province of China, grant number ZR2022MD061 and ZR2024QD113.
Data Availability Statement
Some or all data, models, or code that support the findings of this study are available from the corresponding author upon reasonable request.
Conflicts of Interest
Author Changhui Gao was employed by the company Shandong Hi-Speed Group Co., Ltd. The remaining authors declare that the research was conducted in the absence of any commercial or financial relationships that could be construed as a potential conflict of interest.
Appendix A

Table A1.
Orthogonal test factor level table.
Table A1.
Orthogonal test factor level table.
| Factor | A | |||
|---|---|---|---|---|
| Standard | ||||
| 1 | 15% | 20% | 2% | |
| 2 | 20% | 30% | 6% | |
| 3 | 25% | 40% | 10% | |
| 4 | 30% | 50% | 14% | |
| 5 | 35% | 60% | 18% | |
Note: (1) A represents quartz sand; B represents iron powder; C represents barite powder; D represents rosin; and E represents alcohol, all in weight units; (2) Gypsum accounts for 10% of the total mass, and alcohol and rosin together account for 10% of the total mass; (3) Rosin dissolves in alcohol to form a binder.

Table A2.
Orthogonal test plan table.
Table A2.
Orthogonal test plan table.
| Test Number | A | ||
|---|---|---|---|
| 1 | 15 | 20 | 2 |
| 2 | 15 | 30 | 10 |
| 3 | 15 | 40 | 18 |
| 4 | 15 | 50 | 6 |
| 5 | 15 | 60 | 14 |
| 6 | 20 | 20 | 18 |
| 7 | 20 | 30 | 6 |
| 8 | 20 | 40 | 14 |
| 9 | 20 | 50 | 2 |
| 10 | 20 | 60 | 10 |
| 11 | 25 | 20 | 14 |
| 12 | 25 | 30 | 2 |
| 13 | 25 | 40 | 10 |
| 14 | 25 | 50 | 18 |
| 15 | 25 | 60 | 6 |
| 16 | 30 | 20 | 10 |
| 17 | 30 | 30 | 18 |
| 18 | 30 | 40 | 6 |
| 19 | 30 | 50 | 14 |
| 20 | 30 | 60 | 2 |
| 21 | 35 | 20 | 6 |
| 22 | 35 | 30 | 14 |
| 23 | 35 | 40 | 2 |
| 24 | 35 | 50 | 10 |
| 25 | 35 | 60 | 18 |
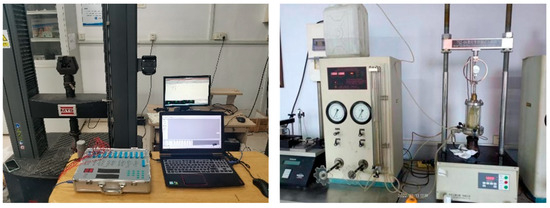
Figure A1.
Specimen parameter measurement.
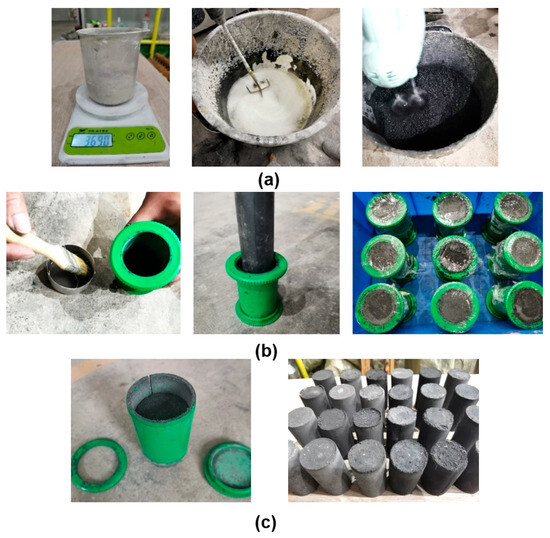
Figure A2.
Sample production flow chart: (a) Weigh various materials, prepare cementing solution, and mix them; (b) After applying release agent to the mold, it shall be filled compacted and maintained with fresh film; (c) Demoulding after compaction and curing for 1 day.
References
- Broere, W. Urban underground space: Solving the problems of today’s cities. Tunn. Undergr. Space Technol. 2016, 55, 245–248. [Google Scholar] [CrossRef]
- Zhang, D.M.; Huang, Z.K.; Yin, Z.Y.; Ran, L.Z.; Huang, H.W. Predicting the kpaing effect on leakage-induced tunnels and ground response in saturated soils. Tunn. Undergr. Space Technol. 2017, 65, 76–90. [Google Scholar] [CrossRef]
- Shahrour, I.; Zhang, W. Use of soft computing techniques for tunneling optimization of tunnel boring machines. Undergr. Space 2021, 6, 233–239. [Google Scholar] [CrossRef]
- Sahoo, J.P.; Kumar, B. Support pressure for stability of circular tunnels driven in granular soil under water table. Comput. Geotech. 2019, 109, 58–68. [Google Scholar] [CrossRef]
- Cheng, X.; Guo, Y.; Zhu, X.; Li, W.; Hu, W.; Xu, L.; Xie, L. Analytical study on additional stress field of double shield TBM tunneling based on Mindlin theory. Appl. Math. Model. 2025, 142, 115980. [Google Scholar] [CrossRef]
- He, C.-Y.; Zheng, H.-Y.; Ding, Z.; Huang, F. Theoretical study on the soil additional stress and principal stress axis deflection during shield tunneling. Tunn. Undergr. Space Technol. 2025, 159, 106511. [Google Scholar] [CrossRef]
- Ding, Z.; Zhang, M.-B.; Zhang, X.; Wei, X.-J. Theoretical analysis on the deformation of existing tunnel caused by under-crossing of large-diameter slurry shield considering construction factors. Tunn. Undergr. Space Technol. 2022, 133, 104913. [Google Scholar] [CrossRef]
- Zhang, T.; Li, Z.; Wang, R.; Zheng, G.; Lei, H.; Fan, Q. Geostress-associated settlements of a raft-foundation building due to shield tunnelling in soft ground. Can. Geotech. J. 2025, 62, 1–12. [Google Scholar] [CrossRef]
- Di, H.; He, P.; Li, X.; Xiao, F.; Chen, H. Influence of large-diameter shield tunneling on deformation of adjacent high-speed railway subgrade in soft soils and effectiveness of protective measures. Tunn. Undergr. Space Technol. 2024, 156, 106260. [Google Scholar] [CrossRef]
- Lyu, H.-M.; Shen, S.-L.; Zhou, A.; Chen, K.-L. A novel method to calculate pressure on the twin-tunnel in layered strata. MethodsX 2020, 7, 101126. [Google Scholar] [CrossRef]
- Cao, K.; Chen, M.; Zhang, M.; Ding, W.; Shang, C.; Ruan, H.; Huang, X. Calculation method for the response changes of existing bridge piles caused by side penetration of shield tunnels considering construction factors and cumulative impact of excavation. Comput. Geotech. 2024, 172, 106472. [Google Scholar] [CrossRef]
- Peck, R.B. Deep excavations and tunnelling in soft ground. In Proceedings of the 7th International Conference on Soil Mechanics and Foundation Engineering, Mexico City, Mexico, 22–30 August 1969. [Google Scholar]
- Attewell, P.B.; Woodman, J.P. Predicting the dynamics of ground settlement and its derivatives caused by tunnelling in soil. Ground Eng. 1982, 15, 13. [Google Scholar]
- Ma, S.; Li, J.; Li, Z. Critical support pressure of shield tunnel face in soft-hard mixed strata. Transp. Geotech. 2022, 37, 100853. [Google Scholar] [CrossRef]
- Hua, Y.-S.; Zhang, D.-M.; Huang, H.-W. Model test study of soil grouting effect on shield tunnel longitudinal structural behavior. Eng. Geol. 2025, 347, 107912. [Google Scholar] [CrossRef]
- Su, D.; Yang, W.-H.; Lin, X.-T.; Zhang, X.; Zhang, Z.; Chen, X. Soil-carrying effect induced by super-large-diameter shallow-buried shield tunneling and treatment measures: A case study in Zhuhai, China. Tunn. Undergr. Space Technol. 2024, 153, 106037. [Google Scholar] [CrossRef]
- Luo, W.; Yuan, D.; Jin, D.; Lu, P.; Chen, J.; Yang, G. Centrifugal Modeling of the Relationship between Tunnel Face Support Pressure and Ground Deformation in Water-Rich Sandy Soil. Appl. Sci. 2022, 12, 5802. [Google Scholar] [CrossRef]
- Ren, L.; Yang, Z.; Zheng, J.; Chen, S.; Guan, Z. Experimental and numerical studies on the longitudinal equivalent bending stiffness of shield tunnel by considering axial force. Structures 2025, 75, 108776. [Google Scholar] [CrossRef]
- Wang, G.; Shan, Y.; Lin, W.; Tian, Z.; Zhou, S.; Alberti, G.S.; Detmann, B.; Zhou, T.; Chen, J. A lightweight physics-data-driven method for real-time prediction of subgrade settlements induced by shield tunneling. Comput. Civ. Infrastruct. Eng. 2025, 40, 3259–3278. [Google Scholar] [CrossRef]
- Chen, L.; Tian, Z.; Zhou, S.; Gong, Q.; Di, H. Attitude deviation prediction of shield tunneling machine using Time-Aware LSTM networks. Transp. Geotech. 2024, 45, 101195. [Google Scholar] [CrossRef]
- Jin, H.; Yuan, D.; Wang, E.; Jin, D.; Liu, H.; Shen, X. Tunneling posture of passive articulated EPB shield in soft soil: A multibody mechanical model-based investigation. Tunn. Undergr. Space Technol. 2025, 158, 106387. [Google Scholar] [CrossRef]
- Tang, X.; Xin, G.; Song, D. Mutual influence mechanism between soft soil interlayers and shield tunnels under seismic action: Laboratory tests and numerical simulations. Earthq. Res. Adv. 2025, 100393. [Google Scholar] [CrossRef]
- NRA. Code for Design of High-Speed Railway; National Railway Administration: Beijing, China, 2014. [Google Scholar]
- MOHURD. Code for Vonitoring Measurement of Urban Rail Transit Engineering; Ministry of Housing and Urban-Rural Development of the PRC: Beijing, China, 2013. [Google Scholar]
- MOHURD. Technical Code for Protection Structures of Urban Rail Transit; Ministry of Housing and Urban-Rural Development of the PRC: Beijing, China, 2013. [Google Scholar]
- Sijin, H.; Yunhong, L. Design and Construction Analysis of Metro Shield Tunnel Crossing Railway Station Yard. Mod. Tunn. Technol. 2012, 49, 166–170. [Google Scholar] [CrossRef]
Disclaimer/Publisher’s Note: The statements, opinions and data contained in all publications are solely those of the individual author(s) and contributor(s) and not of MDPI and/or the editor(s). MDPI and/or the editor(s) disclaim responsibility for any injury to people or property resulting from any ideas, methods, instructions or products referred to in the content. |
© 2025 by the authors. Licensee MDPI, Basel, Switzerland. This article is an open access article distributed under the terms and conditions of the Creative Commons Attribution (CC BY) license (https://creativecommons.org/licenses/by/4.0/).