You are currently viewing a new version of our website. To view the old version click .
Buildings
  • Article
  • Open Access

13 October 2025

Steel Strand Corrosion and Corrosion-Induced Cracking in Prestressed Concrete Under Stray Current

,
and
1
China Railway Economic and Planning Research Institute Co., Ltd., Beijing 100038, China
2
School of Civil Engineering, Beijing Jiaotong University, Beijing 100044, China
*
Author to whom correspondence should be addressed.
Buildings2025, 15(20), 3681;https://doi.org/10.3390/buildings15203681 
(registering DOI)
This article belongs to the Section Building Materials, and Repair & Renovation

Abstract

Due to the presence of stray current in the subway environment, the durability issues of subway structures differ from those of general structures. This study simulates the combined effects of chloride ions and stray current in the subway environment through electrochemical corrosion experiments, thereby analyzing the corrosion morphology and mechanical property degradation of steel strands and the corrosion-induced cracking of concrete. The experimental results indicate that stray current affects the strength and ductility of steel strands as well as the cracking of concrete. The corrosion difference coefficient μc at different positions is greater than 1.6 and the average corrosion degree ηave is less than 7%. The corrosion morphology gradually changes from non-uniform to uniform corrosion until the ηave is greater than 12%. The concrete crack width under a stray current of 60 mA is 10.67 times that of cracks under 20 mA after 42 days, which is approximately linearly related to the current intensity. Based on the experimental results, a corrosion-induced crack prediction model for prestressed concrete under stray current is proposed, with the main influencing factors being current intensity, concrete tensile strength, and protective layer thickness. These findings can provide valuable references for the durability analysis of subway structures.

1. Introduction

Compared with ordinary prestressed concrete, the subway environment has stray currents, resulting in more intricate durability problems. Quantifying the corrosion degree of prestressed concrete under stray current is an important challenge in ensuring the durability of subway structures. Due to factors such as construction process deficiencies, beam cracking, and improper maintenance, external chlorides penetrate the interior of the prestressed concrete [,]. Stray currents can accelerate the electrochemical reaction between chloride ions and steel, further expediting the corrosion process. This type of durability damage within the beam is a concealed defect, making it difficult to detect through inspections. The corrosion of prestressed tendons intensifies, posing a serious threat to the safe operation of subway structures.
Many studies have been conducted on the durability degradation of concrete, especially on the corrosion mechanism of steel bars, the chloride ion transport mechanism, and the degradation of material mechanical properties [,,]. The corrosion models for steel bar cross-sectional loss can be mainly classified into uniform corrosion and non-uniform corrosion [,,]. Zhou et al. [] suggested that the corrosion of steel bars can be inferred from the depth of concrete carbonation, which can lead to uniform corrosion. Campione et al. [,] developed a corrosion model for prestressed steel wires based on the depth of corrosion pits. Jikal et al. [] suggested that the corrosion of steel strands is a process of the continuous formation and coalescence of corrosion pits, and that surface corrosion can be regarded as uniform corrosion. Lee et al. [] suggested that the mechanical properties of steel strands declined rapidly with the acceleration of chloride corrosion, the failure mode under tensile test was brittle failure. Li et al. [,] suggested that steel strands are more prone to non-uniform corrosion, and that the failure mode is likely fracture caused by stress corrosion in conventional environments. Ma et al. [,] proposed a prediction model of microstructure degradation in concrete and a new method to detect concrete cracking.
For the impact of corrosion of steel bars or steel strands on concrete, uniform corrosion can lead to a decrease in the bond strength at the steel–concrete interface, thereby increasing the possibility of concrete cracking []. However, non-uniform corrosion has a relatively minor effect on the bond strength, and corrosion pits are unlikely to damage the concrete protective layer [,]. Zhu et al. [] conducted corrosion tests under multiple factors to explore the influence of non-uniformly corroded steel bars on the cracking of concrete protective layers. Otiño et al. [,] determined the relationship between the generation rate of corrosion products and the mass loss of steel bars through chloride ion corrosion tests, and established a model for the expansion force of corrosion products. Michel et al. [] proposed a prediction model for the concrete protective layer cracking caused by uniformly corroded steel bars. Zhao et al. [] established a distribution model of corrosion products under the non-uniform corrosion of steel bars based on the Gaussian model. Wang et al. [] conducted corrosion tests on prestressed concrete specimens under different stresses and analyzed the effect of prestress on the protective layer cracking and crack width.
At present, research mainly focuses on the effects of factors such as chloride and carbonation on concrete structures, and there is little research on corrosion under stray currents. When stray currents and chlorides are present in the environment, their combined effect will exacerbate the corrosion of prestressed concrete, and the corrosion characteristics will also change accordingly. Therefore, this study aims to explore the corrosion characteristics of prestressed concrete under stray current through electrochemical corrosion tests. The mechanical properties of steel strands and the cracking mechanism of concrete after corrosion are analyzed. The prediction model for prestressed concrete cracking under stray current is established, taking into account the thickness of the concrete protective layer, concrete tensile strength, and stray current intensity.

2. Materials and Methods

2.1. Materials and Specimens

The concrete materials used in this study were as follows: the cement was Ordinary Portland Cement (PO.42.5) produced by Shandong Shanshui Cement Plant (Jinan, China). The chemical composition of the cement is listed in Table 1. The fine aggregate was river sand with fineness modulus of 2.6 and apparent density of 2600 kg/m3. The coarse aggregate was crushed stone with continuous gradation of 5 to 20 mm and apparent density of 2740 kg/m3. The concrete mix proportion is shown in Table 2.
Table 1. Chemical composition of cement (wt%).
Table 2. Mixture proportion of concrete.
The specimen size was 150 mm × 150 mm × 150 mm with a Φ 15.2 steel strand embedded in it with no prestress. The cover height was 67 mm. All specimens were cured in a standard environment (relative humidity of 90 ± 5% and temperature of 20 ± 2 °C) for 28 days.

2.2. Experimental Setup

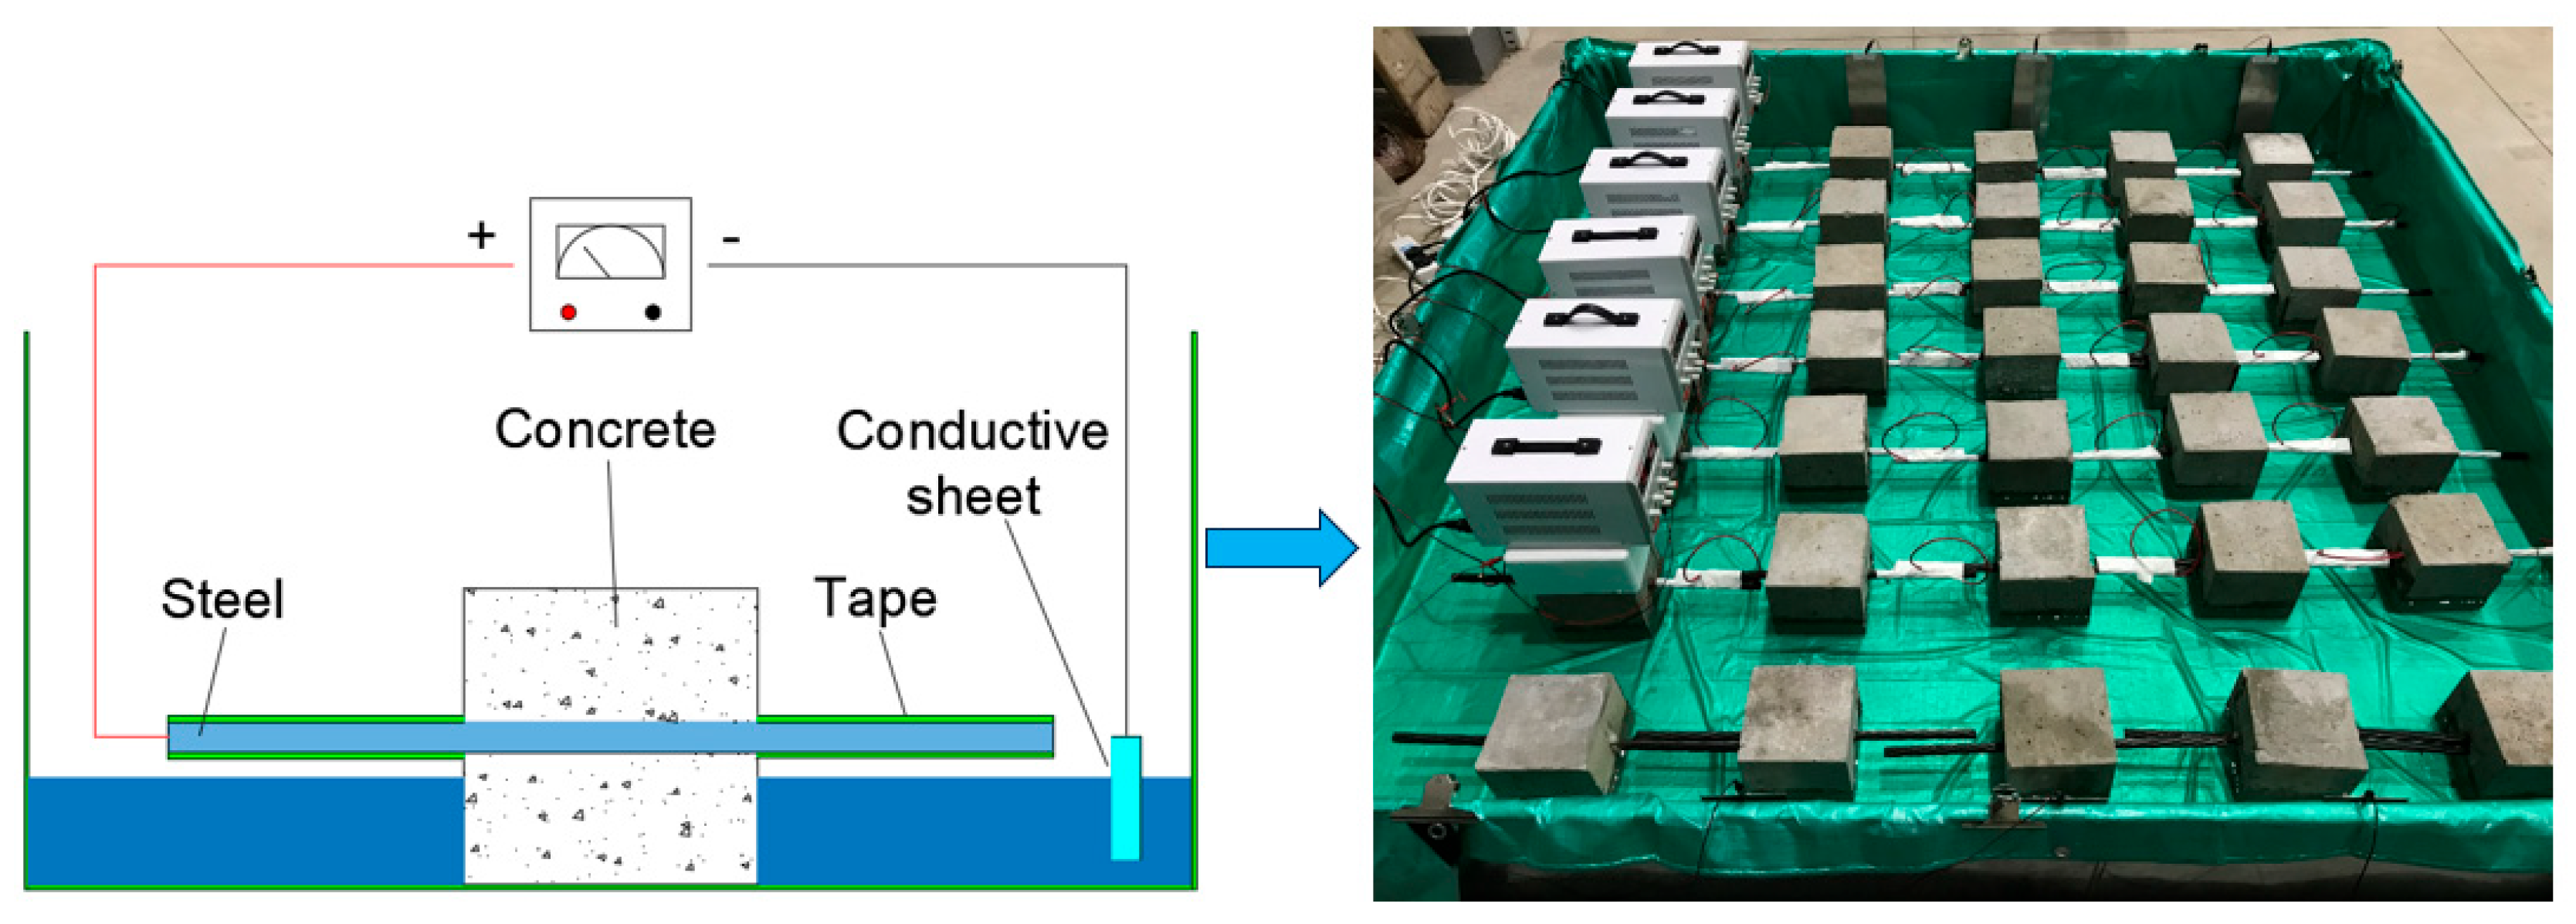
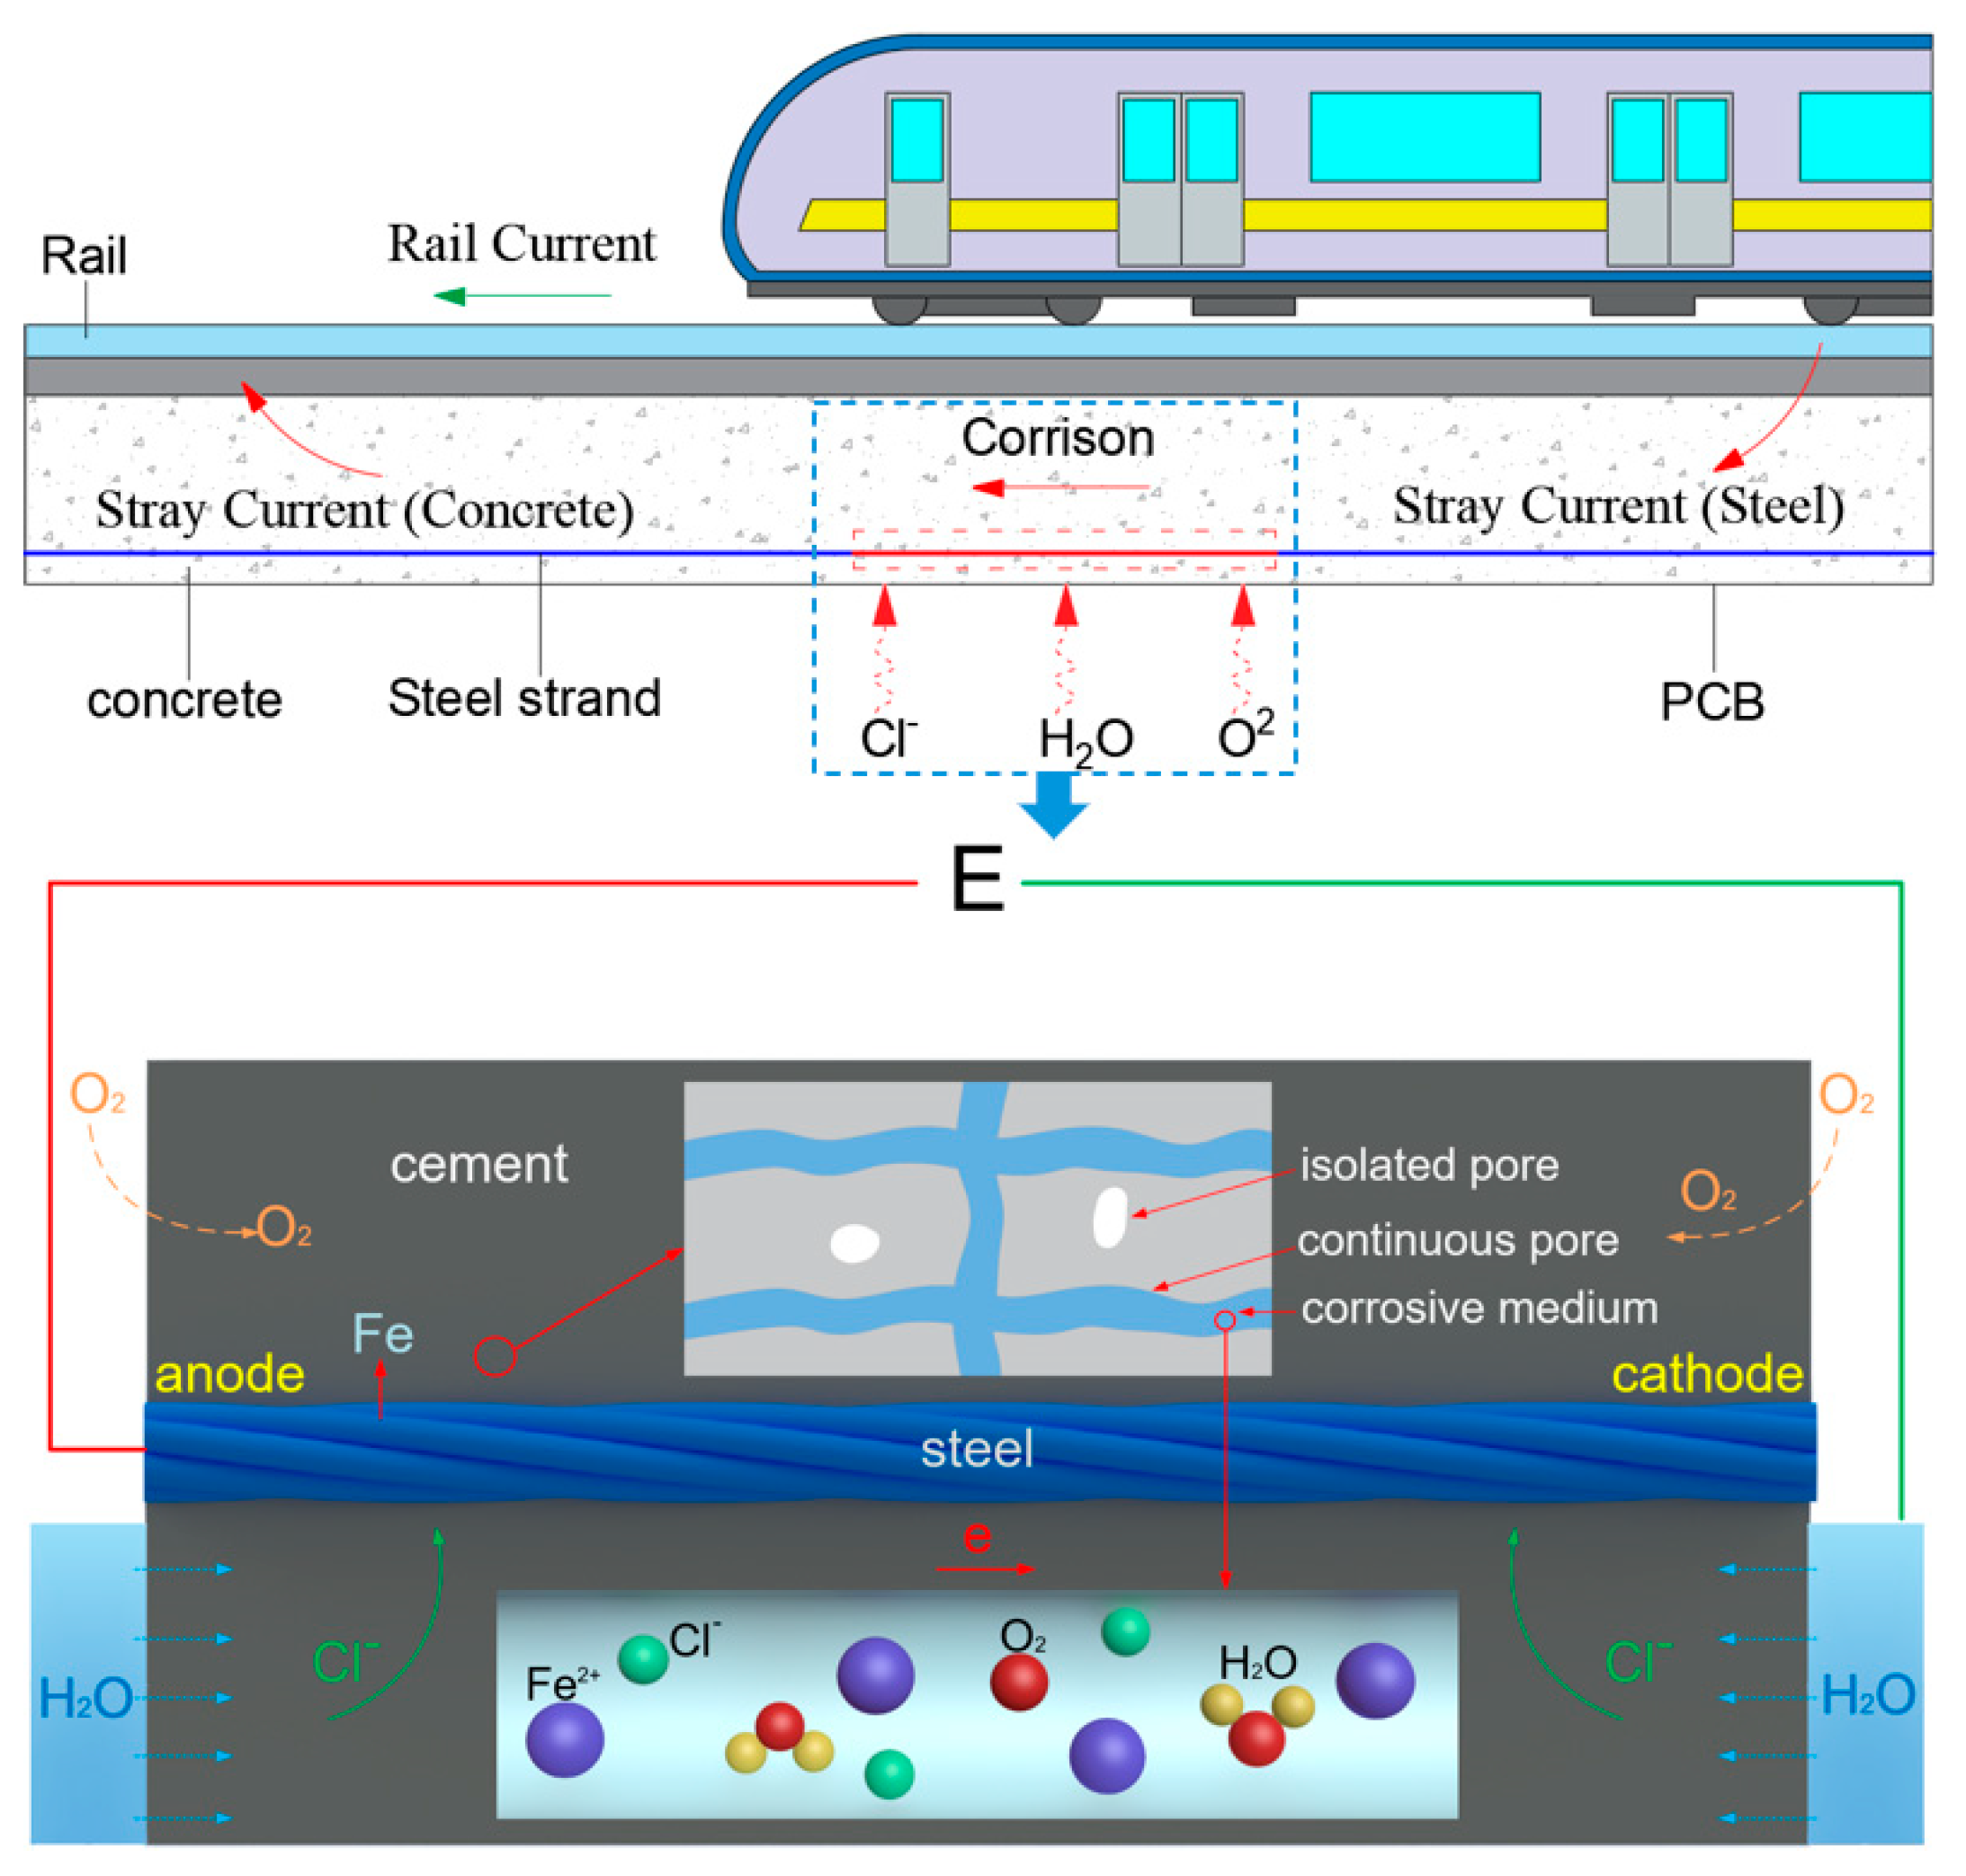
The corrosion test in this study was set up by placing the concrete specimens in a NaCl solution and passing a direct current through the steel strands in the concrete to simulate the corrosion process through the coupling of stray current and chloride ions, as shown in Figure 1. An iron sheet was used to make a corrosion pool with dimensions of 2000 mm × 2000 mm × 300 mm. An anti-corrosion cloth was laid inside the pool to ensure that the current and corrosion solution did not react with the pool during the test. The corrosion solution was 5% NaCl. According to research on stray currents [], constant currents of 20 mA, 40 mA, and 60 mA were applied, respectively, using a direct current power supply. The test times were set to 42 days, 49 days, 56 days, 63 days, and 70 days, respectively. The experimental design is shown in Figure 2.
Figure 1. Schematic diagram of prestressed concrete corrosion under stray current.
Figure 2. Setup of corrosion test under stray current.
In order to obtain the corrosion mechanism of prestressed concrete under the action of stray current and chloride ions, group S was used for cracking analysis and group PS for steel strand corrosion. The test groups were set up for stray current corrosion as shown in Table 3.
Table 3. Corrosion test groups under stray currents.

2.3. Measurement of Steel Strand Corrosion Rate

After the stray current corrosion test, the internal steel strands were taken out. According to GB/T 50082-2024 [], the floating rust on the surface of the steel strands was first removed, and the steel strands were washed with an acid solution until the corrosion products on the surface had dissolved. Then, the remaining acidic substances on the strand surface were neutralized with lime water and, finally, rinsed clean with water. After drying for 4 h, the steel strand mass was measured with an electronic scale, and the masses of uncorroded and corroded steel strands were denoted as m1 and m2, respectively. The corrosion rate of the steel strands can be expressed as
η = m 1 m 2 m 1 × 100 %
where η represents the actual corrosion weight loss rate of the steel strand; ml is the initial mass of the steel strand; and m2 is the mass of the steel strand after pickling and drying.

2.4. Measurement of Cracks in Concrete Protective Layer

The first cracking time of the specimens needed to be recorded. A concrete crack width gauge was used for measurement in this study, with a measurement range of 0 to 10 mm and a measurement accuracy of 0.01 mm. The crack width was measured every 6 h until the end of the test.

2.5. Mechanical Performance Tests of Corroded Steel Strands

After the corrosion test, the steel strands were treated in accordance with GB/T 5224-2023 []. A tensile test of the steel strands was conducted using a WAW-1000 electro-hydraulic servo universal testing machine (Jinan, China) with a force measurement range of 20 kN to 1000 kN and displacement measurement resolution of 0.013 mm. A preload of approximately 100 MPa was applied to the specimen at the beginning to eliminate slippage between the strands and the anchoring device. The load is applied continuously until it reaches 80% of the ultimate strength of the strands, with an increase rate of 0.2 kN/s.

3. Results and Discussion

3.1. Concrete Cracking from Steel Strand Corrosion

The cracked states of the specimens after corrosion of 20 mA, 40 mA, and 60 mA stray current are shown in Figure 3, Figure 4 and Figure 5. Each specimen has corrosion-induced cracking along the direction of the steel strands, and most of the cracks are near the middle of the plane, where the concrete surface is closest to the steel strands. At the beginning of the corrosion process, soluble rust precipitated from the pore cracks of the concrete. As the corrosion progressed, the corrosion products inside the specimens accumulated and expanded, and the concrete surface layer of the 60 mA group specimens cracked first along the steel strand direction. The corrosion cracking of the 20 mA specimens was significantly lower than that of those in the 60 mA group. As the corrosion degree of the steel strands increased, the width of the concrete cracks grew, and the expansion effect of the corrosion products became more obvious.
Figure 3. Corrosion cracking of specimens under stray current of 20 mA: (a) η = 2.35%; (b) η = 2.92%; (c) η = 3.86%; (d) η = 4.81%.
Figure 4. Corrosion cracking of specimens under stray current of 40 mA: (a) η = 6.80%; (b) η = 7.59%; (c) η = 8.28%; (d) η = 9.75%.
Figure 5. Corrosion cracking of specimens under stray current of 60 mA: (a) η = 11.52%; (b) η = 12.74%; (c) η = 14.37%; (d) η = 15.08%.
After the specimens were electrified and corroded, the crack width was measured on the concrete surface. The corrosion crack conditions (length, width, and area) of the specimens are shown in Table 4. When the test time was 42 days, the average crack width of the S2-1 specimen was 3.4 times that of S1-1, and S3-1 was 10.7 times that of S1-1. When the test time was 49 days, the average crack width of S2-2 was 3.1 times that of S1-2, and S3-2 was 8.4 times that of S1-2. By 56 days, the average crack width of S2-3 was 2.5 times that of S1-3, and S3-3 was 5.7 times that of S1-3. When the test time was 63 days, the average crack width of the S2-4 specimen was 2.1 times that of S1-4, and s3-4 was 4.2 times that of S1-4. In the early stage of corrosion, as the current value increases, the corrosion rate of steel strands accelerates. After reaching a certain degree of corrosion, the increase in the corrosion rate of the steel strands slows down as the current increases. This is because the accumulation of corrosion products on the surface of the steel strands has a delaying effect on the corrosion process.
Table 4. Corroded crack widths of specimens under different currents.
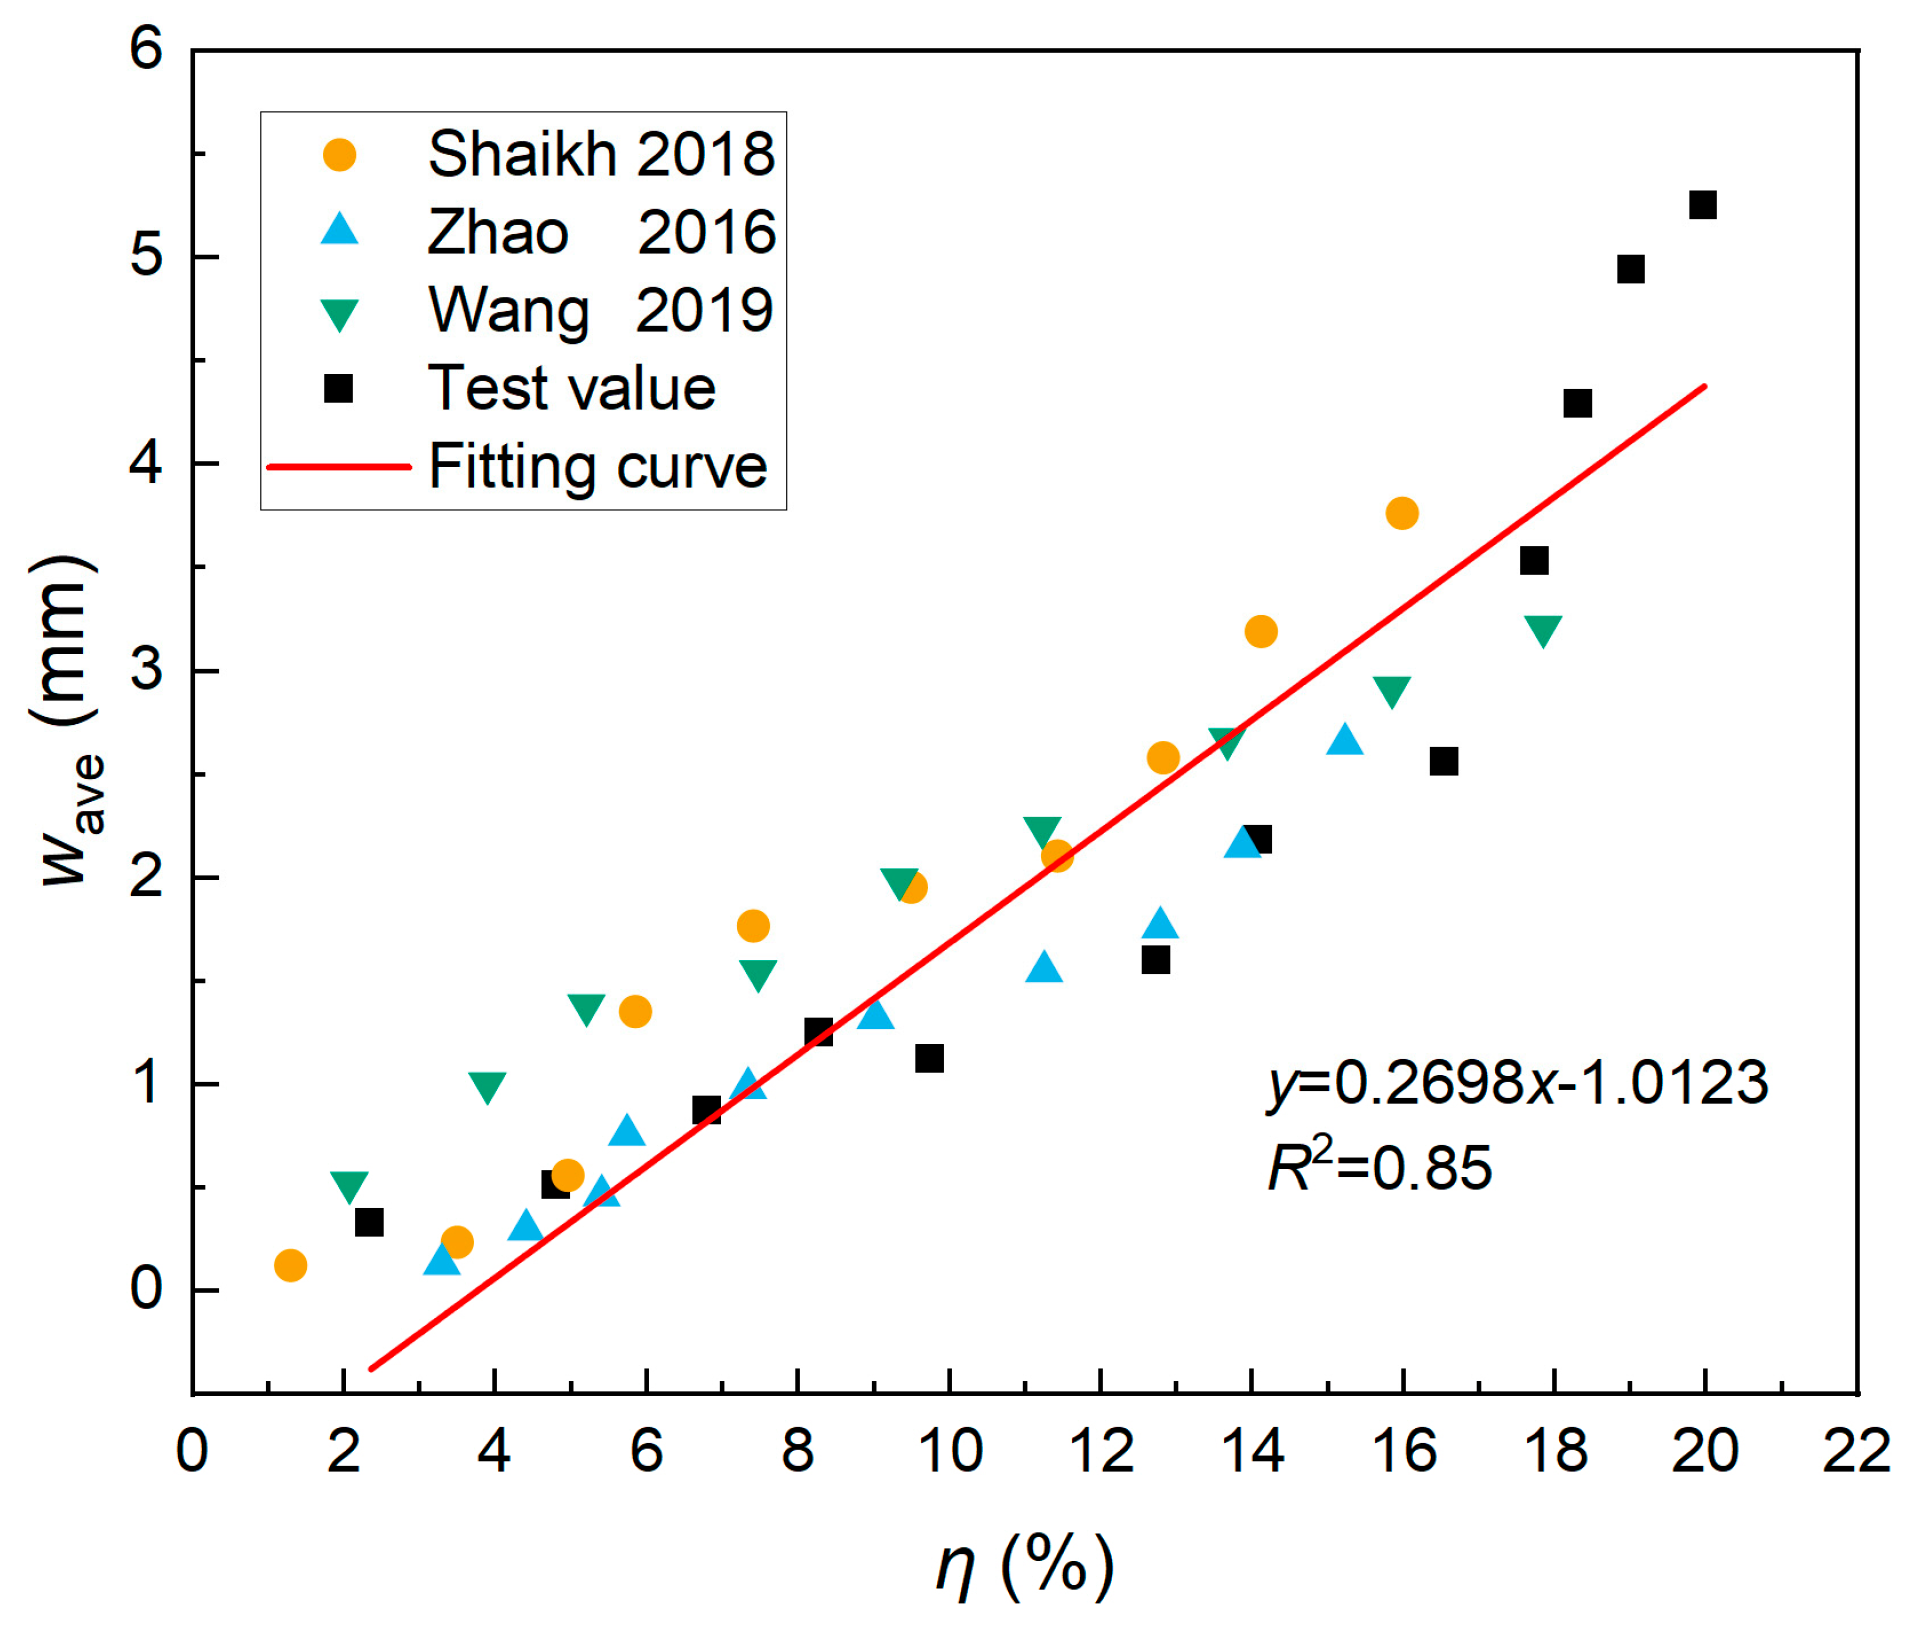
The assessment of the corrosion of the steel strands is an important part of the durability analysis and life prediction of prestressed concrete structures in service. Some researchers conducted corrosion cracking tests on reinforced concrete specimens and concluded that there was a certain relationship between the width of concrete cracks and the corrosion rate of reinforcing bars. Therefore, based on the test results and existing research, the relationship between the average crack width of the specimens and the corrosion rate of the steel strands was analyzed, as shown in Figure 6.
Figure 6. Relationship between crack width and corrosion rate [,,].
The concrete protective layer of the sample used in this study exhibited no significant cracks when the corrosion rate of the steel strand was less than 2. As the corrosion degree increased, the critical corrosion rate of the rust-swelling cracking of the concrete protective layer was approximately 2%. The average width of the corrosion cracks was roughly linearly related to the corrosion rate of the steel strands, a result that is similar to the corrosion cracking of ordinary reinforcing bars.

3.2. Corrosion Characteristics of Steel Strands

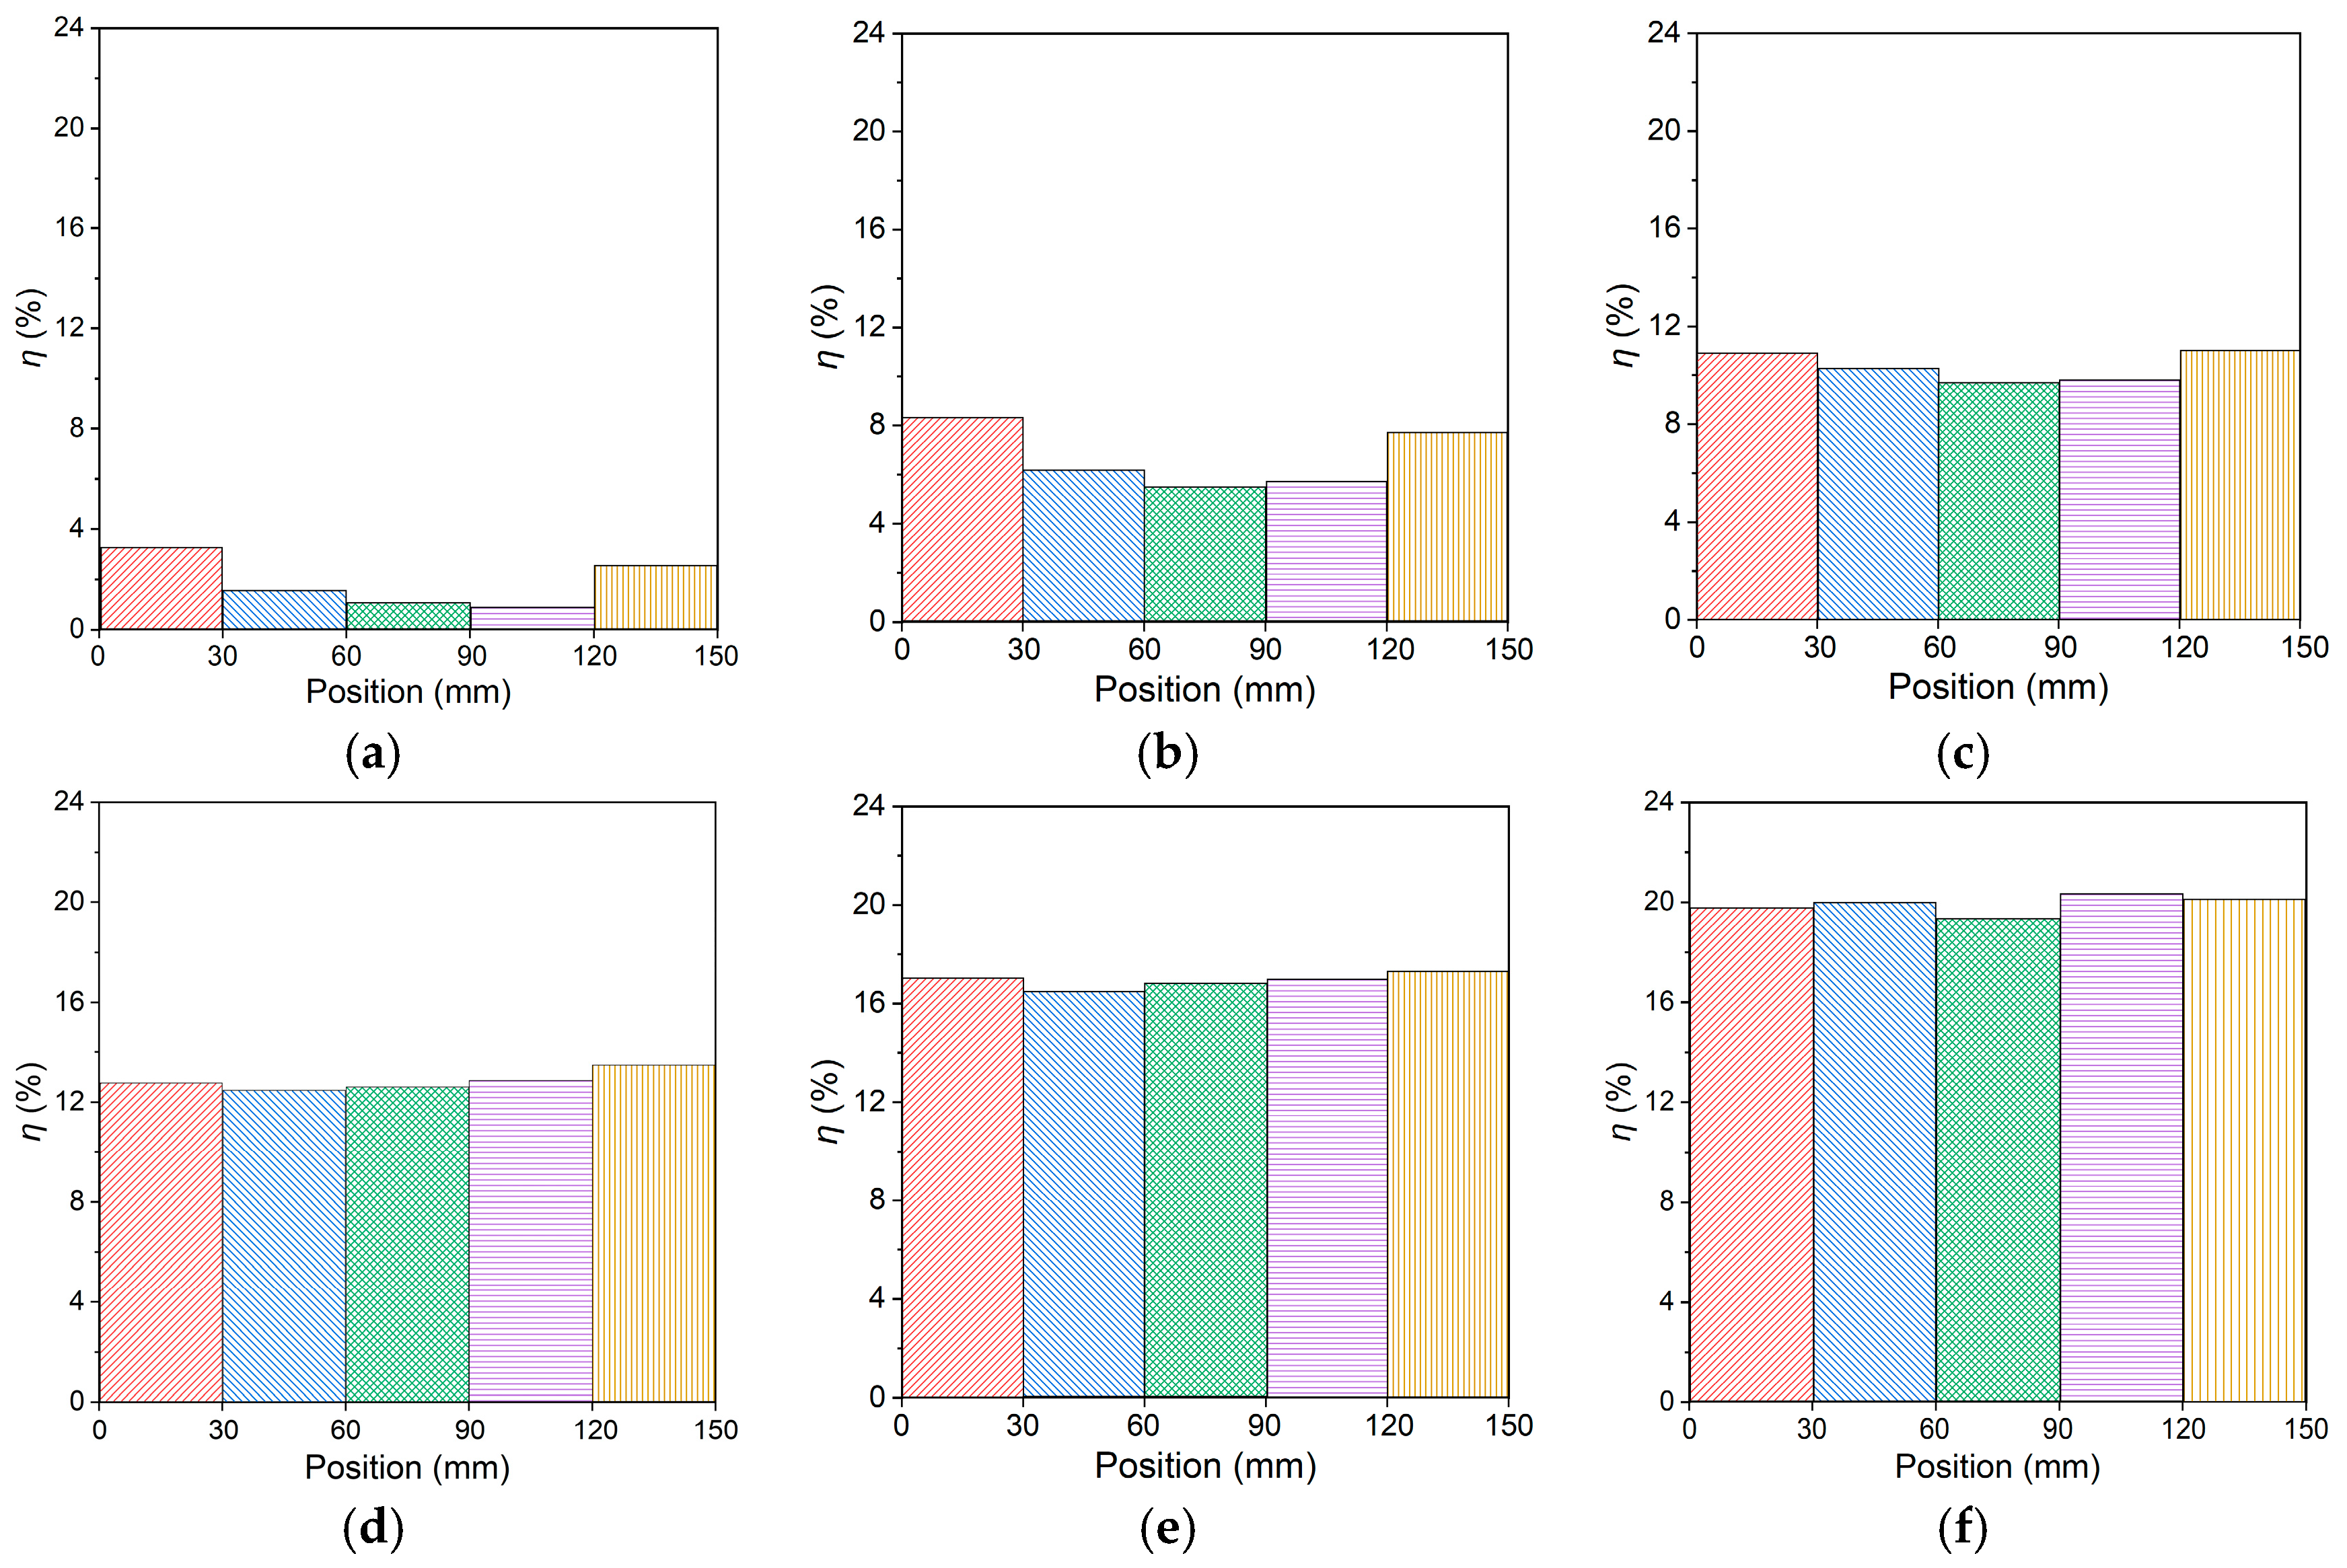
In order to analyze the corrosion rates of steel strands at different positions after electrochemical corrosion, six groups of steel strand samples were selected with corrosion differences after the corrosion test. The steel strands in the corrosion area were evenly divided into five sections, and the corrosion rate of each section was tested in accordance with the specifications. The corrosion rates of the steel strands at different positions in the corroded area are shown in Figure 7.
Figure 7. Corrosion rate at different positions of the steel strands: (a) η = 2.35%; (b) η = 6.80%; (c) η = 9.75%; (d) η = 12.74%; (e) η = 16.55%; (f) η = 19.97%.
On the whole, the corrosion rate in the middle of the steel strand is lower than that at other positions. The higher the average corrosion rate, the more even the corrosion degree of the steel strands at different positions. This may be due to the fact that the ends of the steel strand are more easily exposed to air, and some corrosion products dissolve in the solution, resulting in a higher corrosion rate. As the corrosion progresses, corrosion products start to accumulate, hindering the corrosion rate of the steel strands. The electric field accelerates chloride ion ingress along the exposed concrete surface, enabling direct contact with steel strands and resulting in a uniform overall corrosion rate in the corroded area. In order to more intuitively analyze the corrosion morphology changes in the steel strands at different corrosion rates, the ratio of the maximum to minimum corrosion rates is taken as the corrosion difference coefficient μ along the length of the steel strand, which can be expressed as follows:
μ c = η m a x η m i n
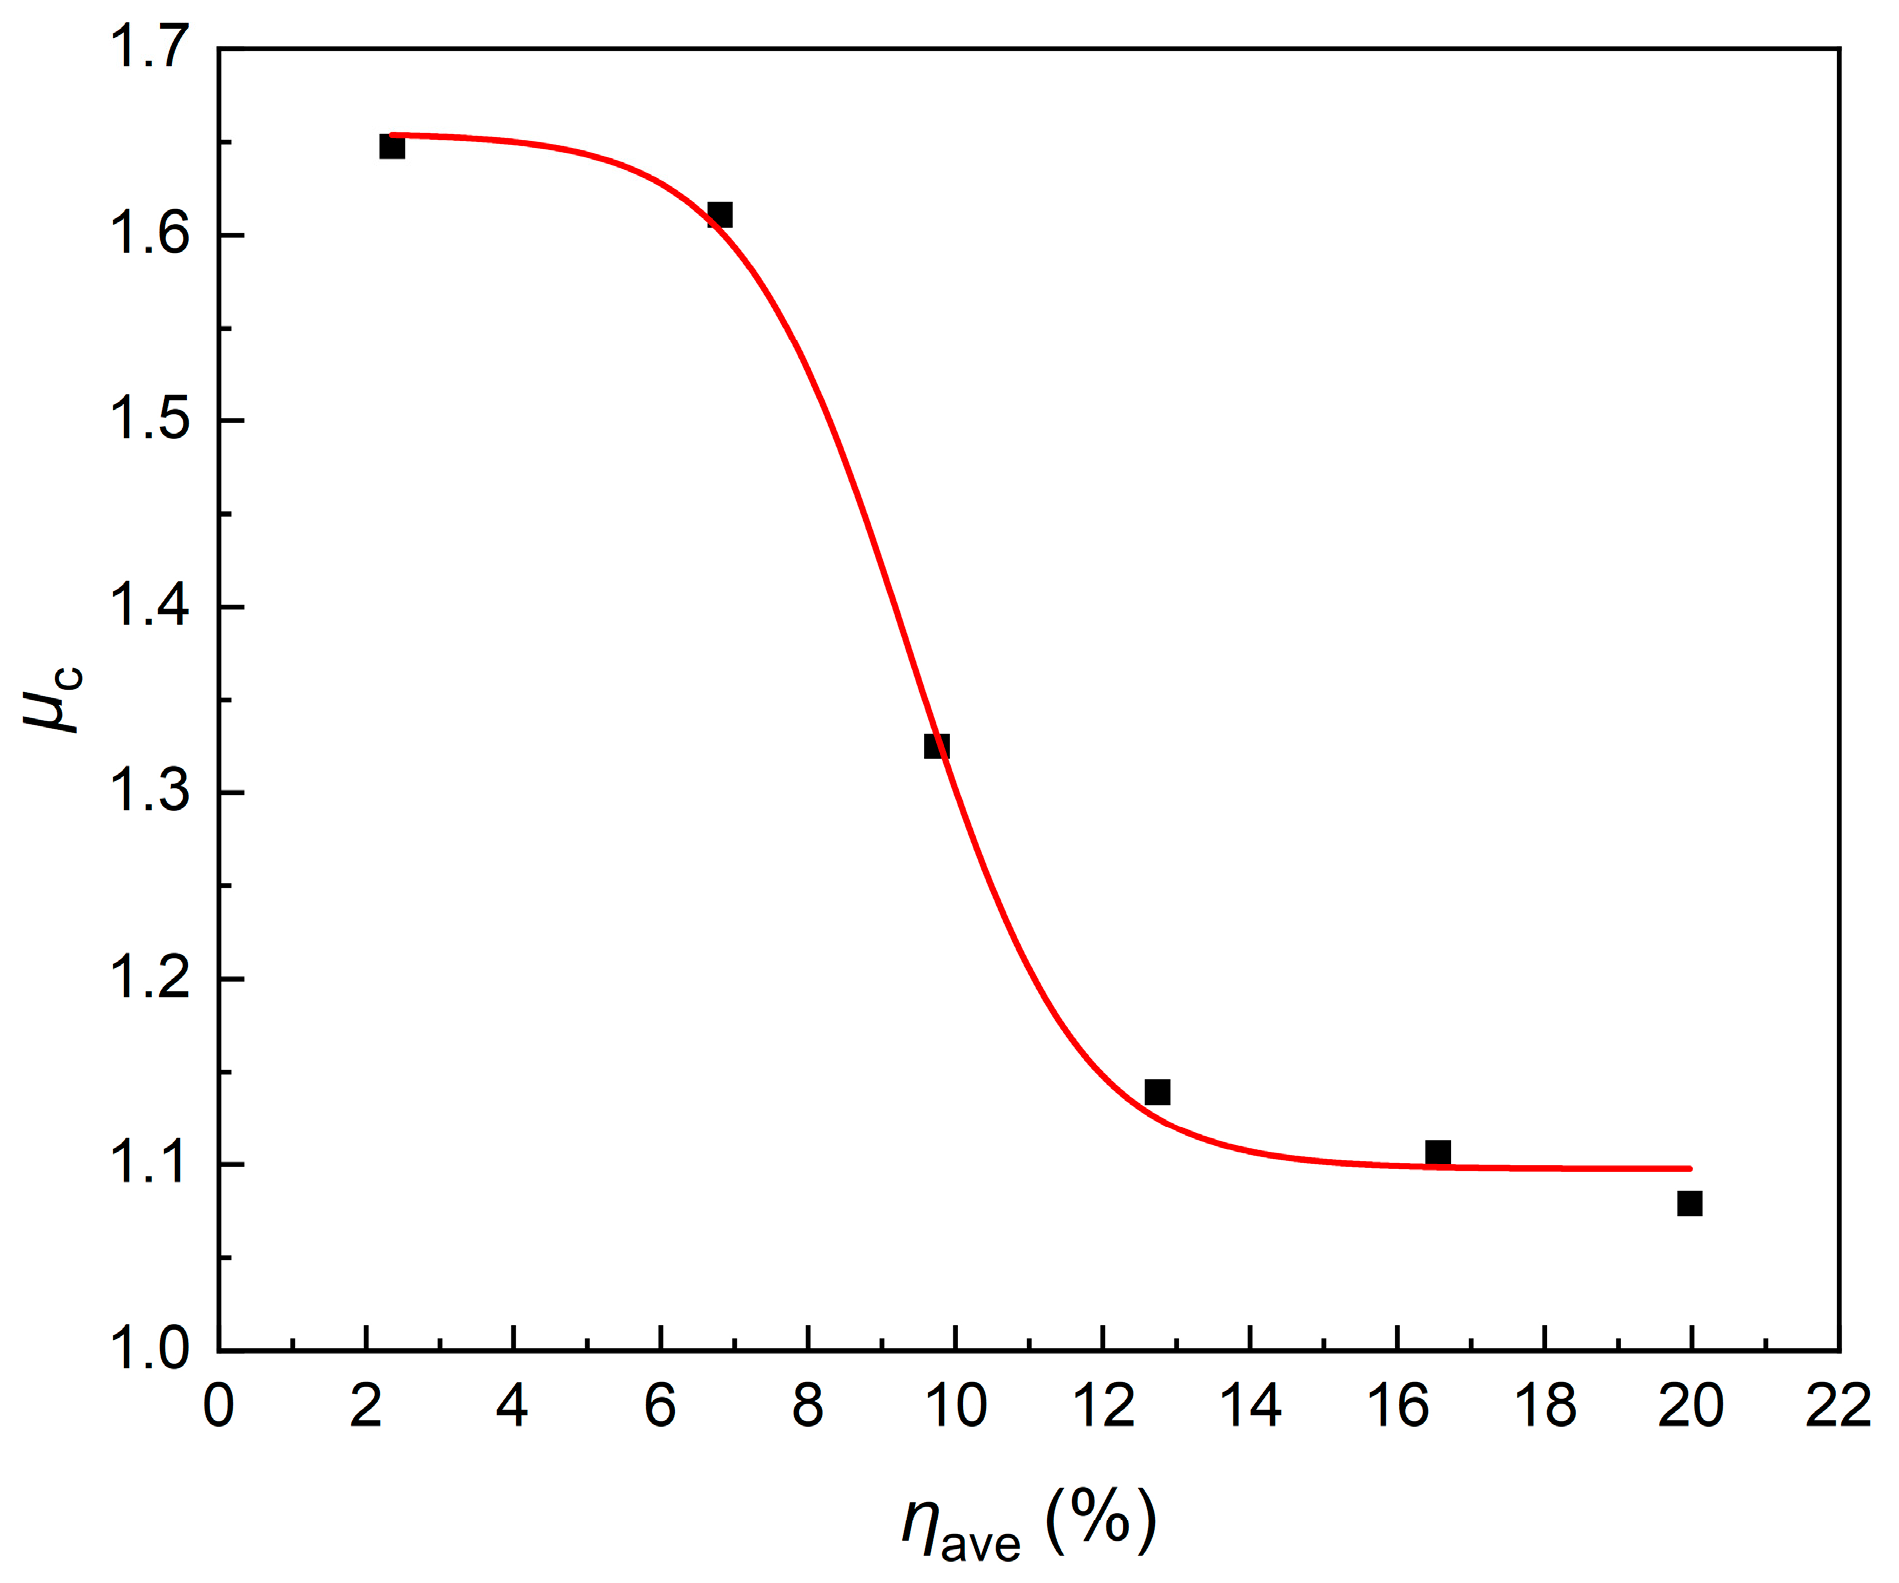
where ηmax is the maximum corrosion rate of the steel strand along its length, and ηmin is the minimum corrosion rate along the length of the steel strand. The relationship between the average corrosion rate ηave and the corrosion difference coefficient μ of the steel strand is shown in Figure 8.
Figure 8. The relationship between the average corrosion degree ηave and the corrosion difference parameter μc of the steel strand.
As shown in Figure 8, when the average corrosion rate ηave of the steel strand is less than 7%, the corrosion difference coefficient μ is greater than 1.6, and the corrosion difference of the steel strand is at a higher level. Subsequently, as the corrosion degree increases, the difference is continuously reduced. When the ηave is greater than 12%, the corrosion rates are basically the same, and the corrosion difference coefficient μ is less than 1.1.

3.3. Mechanical Properties of Corroded Steel Strands

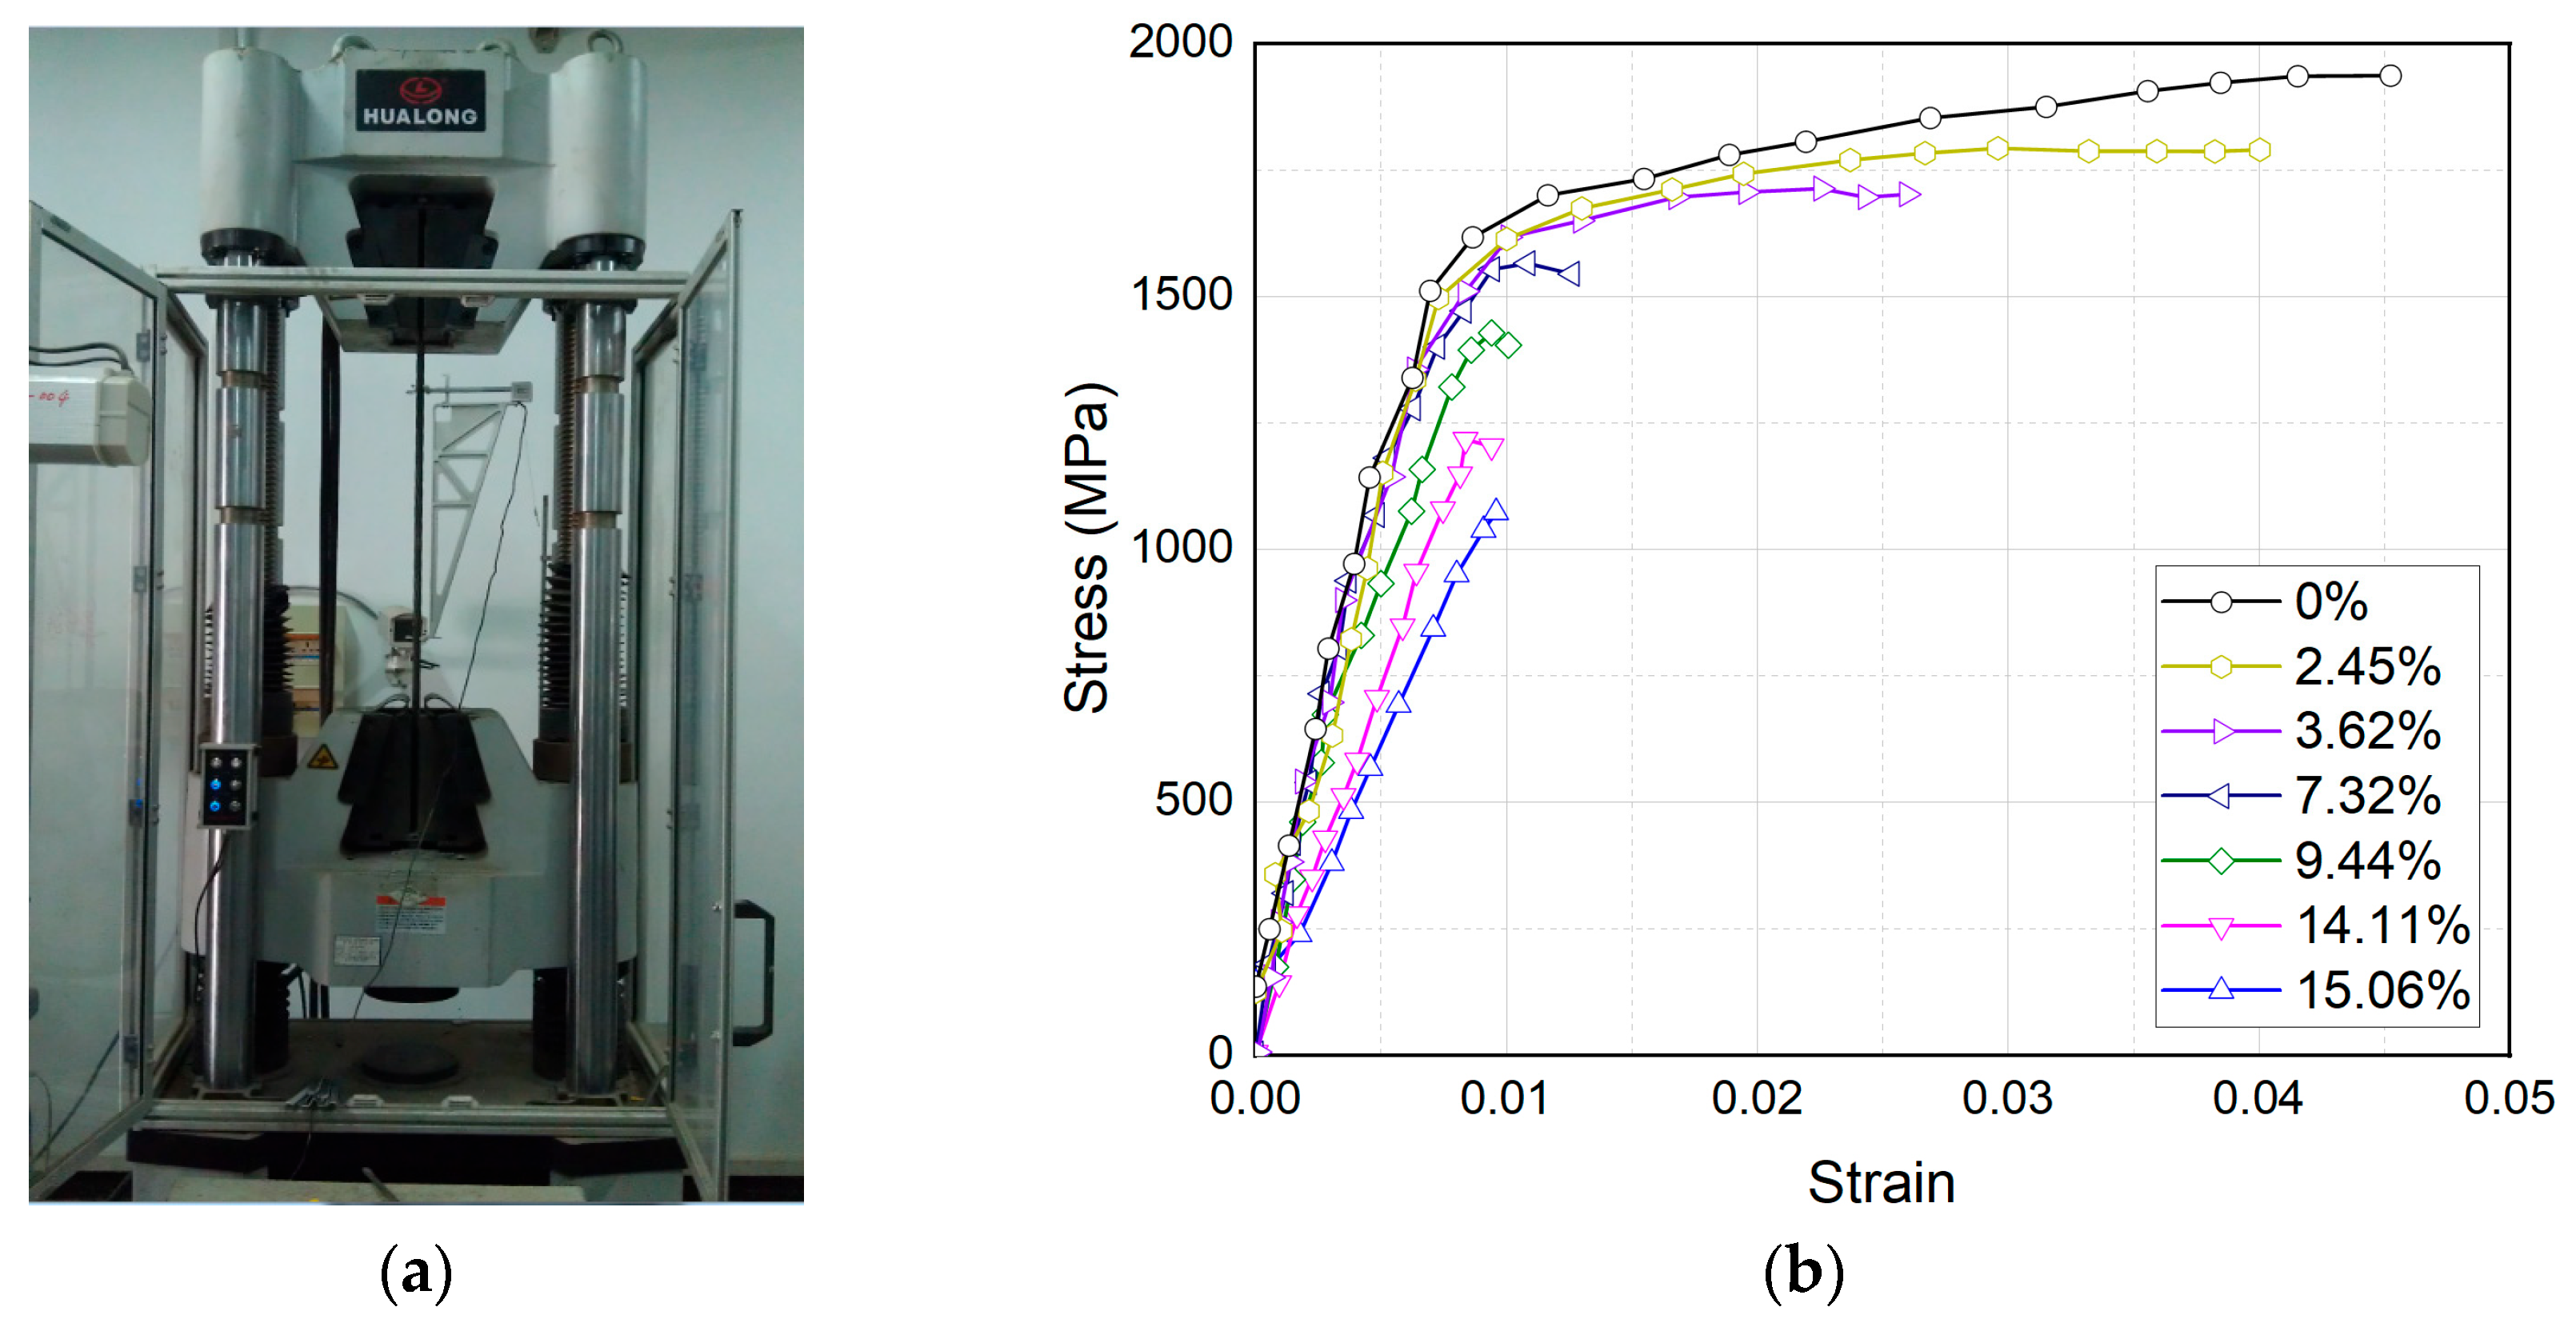
Fifteen corrosion steel strands were selected from the specimens for tensile testing, as shown in Figure 9a. The test results for the steel strand specimens with different degrees of corrosion are shown in Table 5.
Figure 9. Tensile test of prestressed steel strands: (a) test setup; (b) stress–strain curve of steel strand.
Table 5. Tensile test results for steel strands.
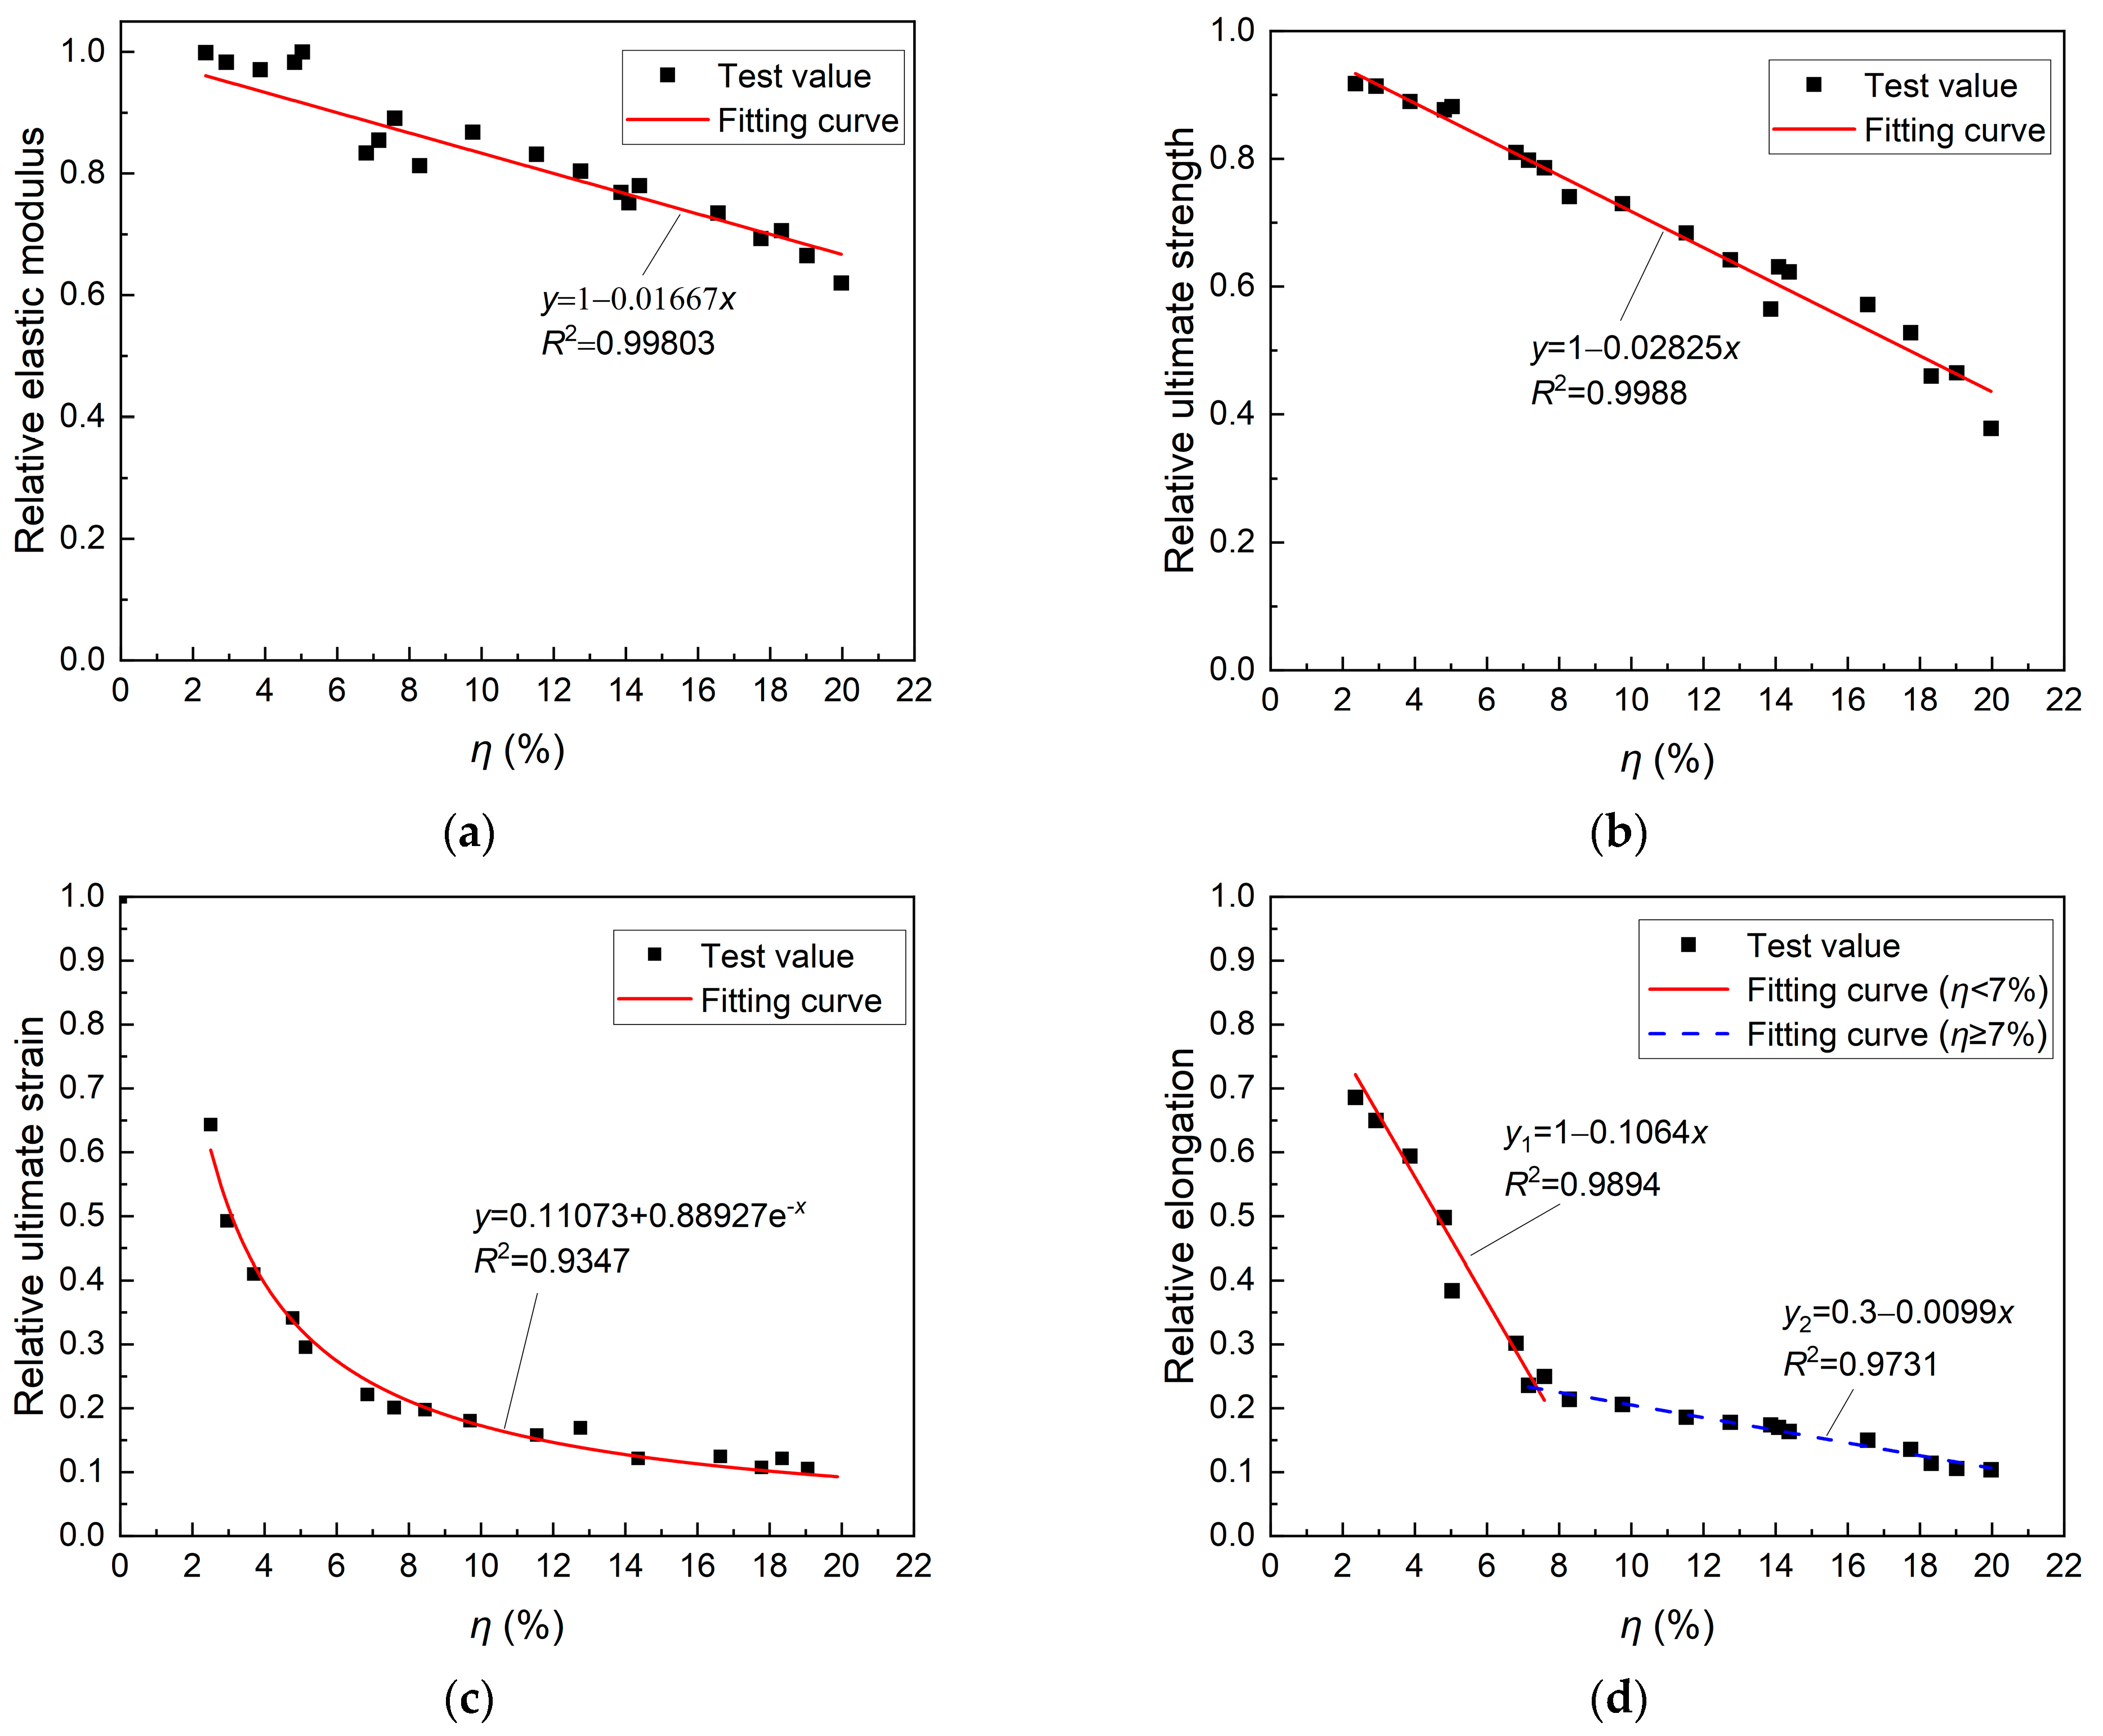
To compare the effects of different stray current corrosion levels on the mechanical properties of the steel strands, stress–strain curves of the steel strands within gauge lengths at different corrosion rates through tensile tests were created, as shown in Figure 9b. When the corrosion rate increased to 7.59%, the ultimate strength of the corroded strands decreased by 21.4% compared with that of the uncorroded strands. When the corrosion rate increased to 15.86%, the ultimate strength of the steel strand decreased by 42.8%. It can be observed that the ductility of the steel strand, characterized by uniform elongation, decreases as the corrosion rate increases. The yield platform and strain hardening zone of the stress–strain curve gradually decrease with increasing corrosion rate, disappearing when the corrosion rate is greater than 7%. This may be due to the changes in the metal lattice structure caused by corrosion, including the accumulation of dislocation grains and stress concentration on the single crystal grains, which leads to a shift in the failure mode from ductile failure with intergranular fracture to brittle failure with trans granular fracture. Therefore, the critical corrosion rate ηcrit can be introduced, which was set as 7% based on the test results. The changes in the mechanical properties of the corroded steel strands were analyzed, including changes in ductility, elastic modulus, and ultimate strength. Fitting curves for the mechanical properties were plotted based on the test results, as shown in Figure 10.
Figure 10. Changes in the mechanical properties of the corroded steel strands: (a) elastic modulus; (b) ultimate strength; (c) ultimate strain; (d) elongation.
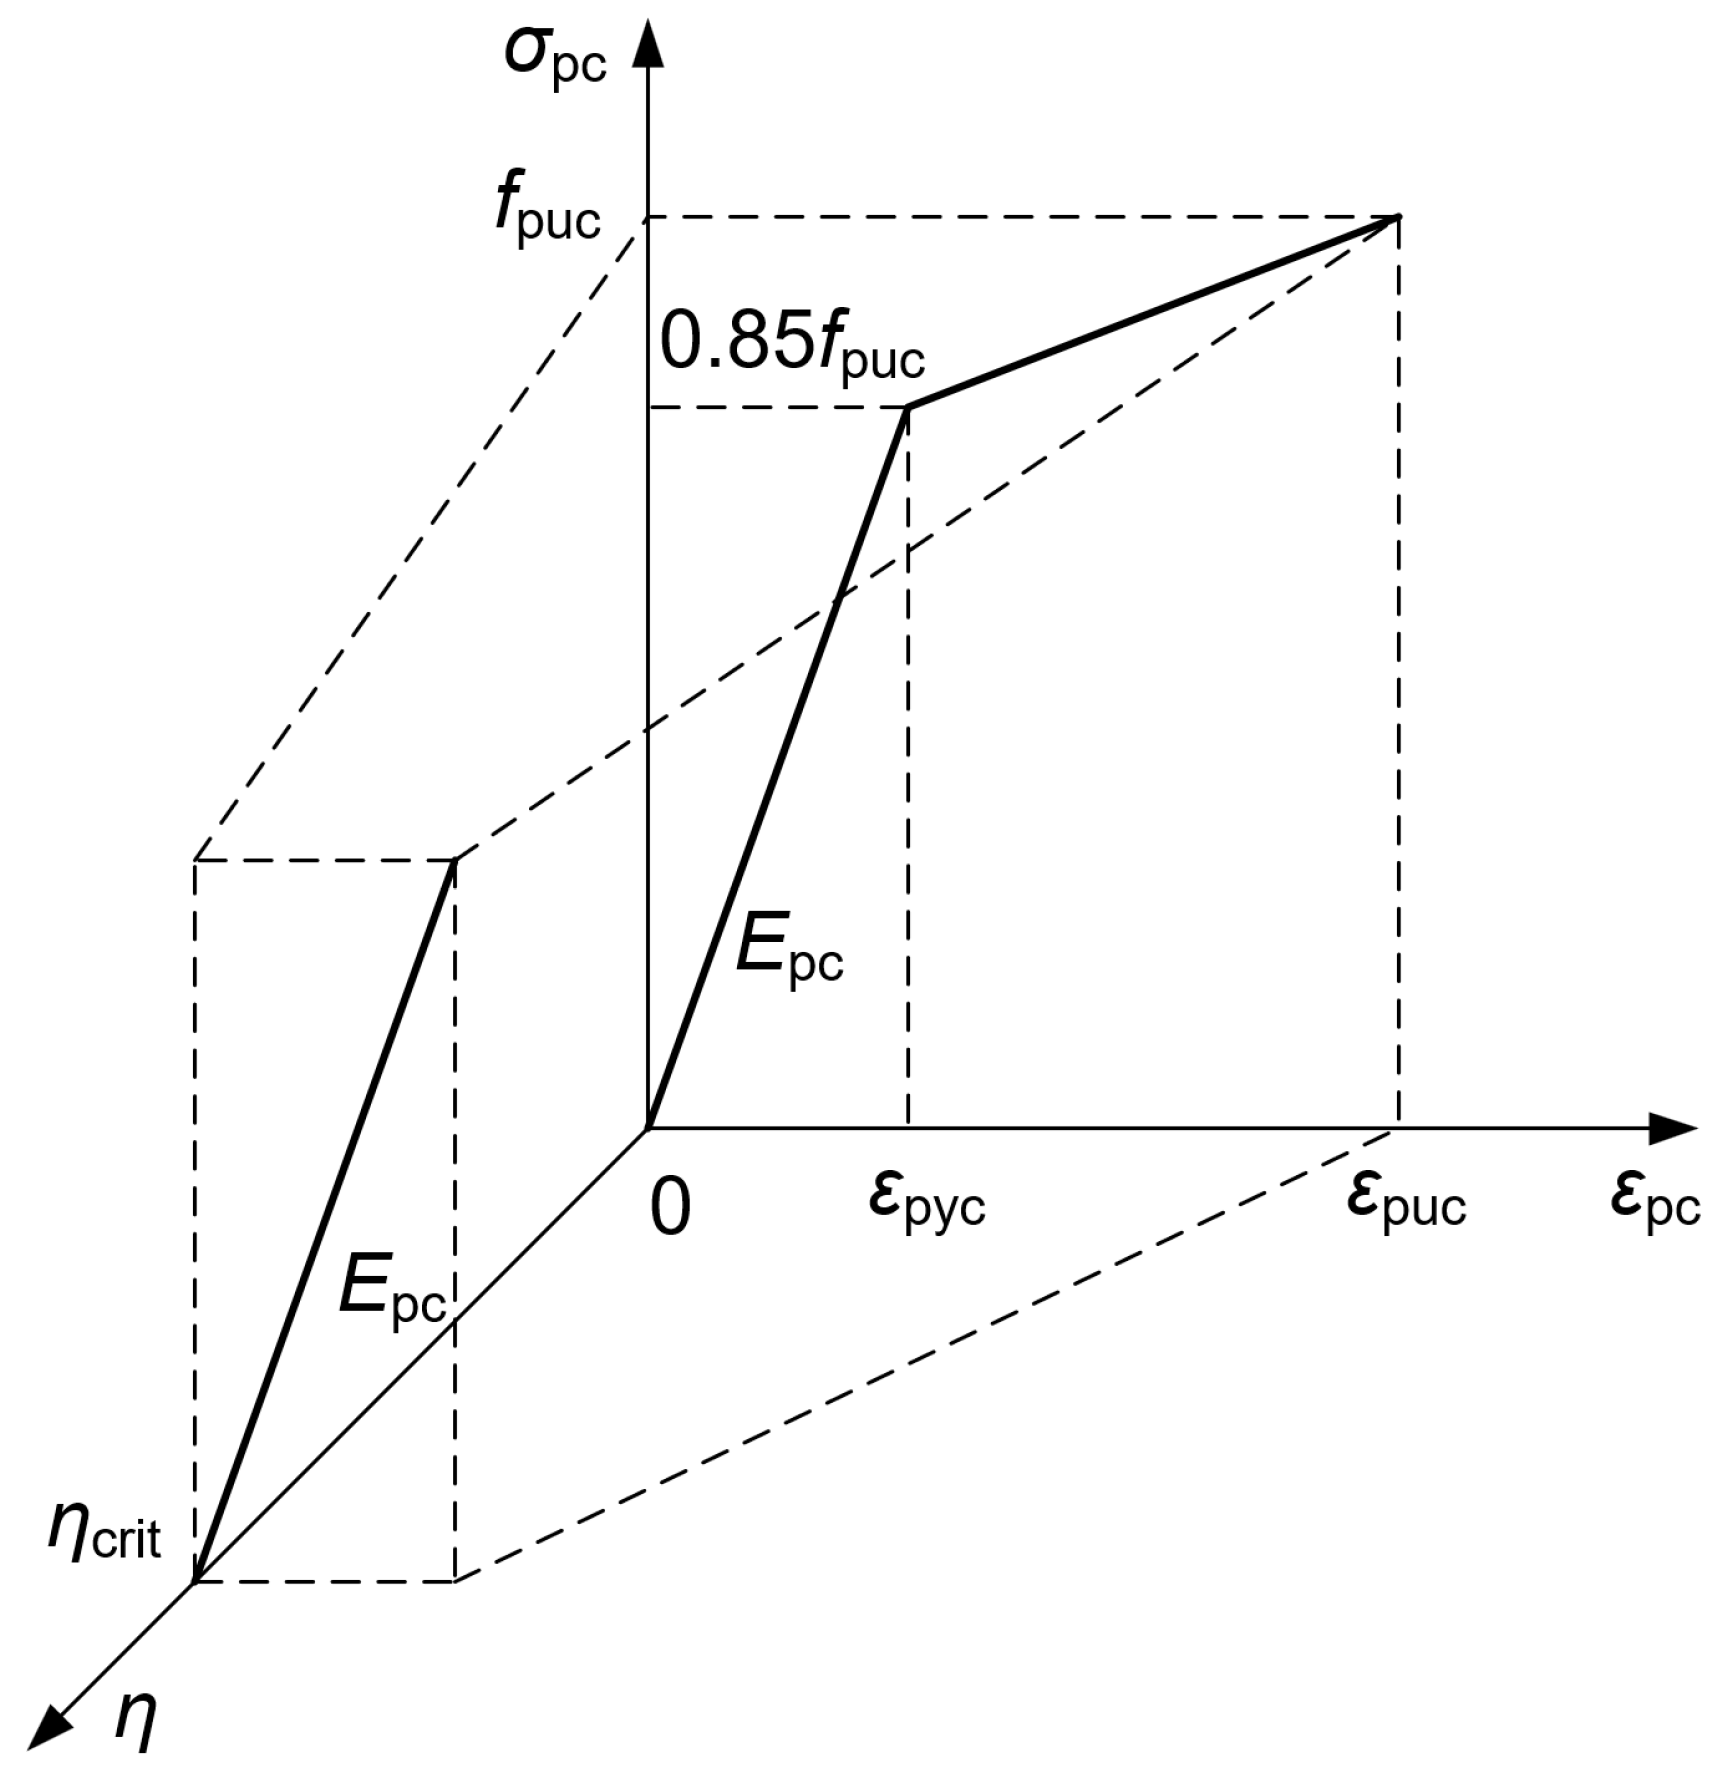
Considering the simplicity of practical engineering applications, the double polyline model was used in this study to describe the constitutive relationship of corroded steel strands. This model ignores the effect of corrosion on the yield strength of the steel strand, and 0.85 times the ultimate strength is defined as the nominal yield strength of the steel strand. Considering the existence of the critical corrosion rate ηcrit, a constitutive relationship model with straight lines passing through the nominal yield strength and ultimate strength was constructed, as shown in Figure 11.
Figure 11. Constitutive model for corroded prestressed strand.
The elastic–plastic phase of the curve changes with the corrosion rate as η < ηcrit. The elastoplastic phase disappears, and the curve has only the elastic phase as ηηcrit. The constitutive relationship of the corroded strand can be expressed as follows:
σ p c = { E p c ε p c ε p c ε p y c 0.85 f p u c + 0.15 f p u c ε p u c ε p y c ( ε p c ε p y c ) ε p y c < ε p c ( η < η crit )
σ p c = E p c ε p c       ( η     η crit )
where σpc is the stress of the corroded steel strand, εpc is the strain of the corroded steel strand, and εpyc = 0.85fpuc/Epc. fpuc, Epc, εpuc are the ultimate strength, elastic modulus, and ultimate strain of the corroded steel strand, respectively. Their values are shown in Table 6.
Table 6. Characteristic values for constitutive models.
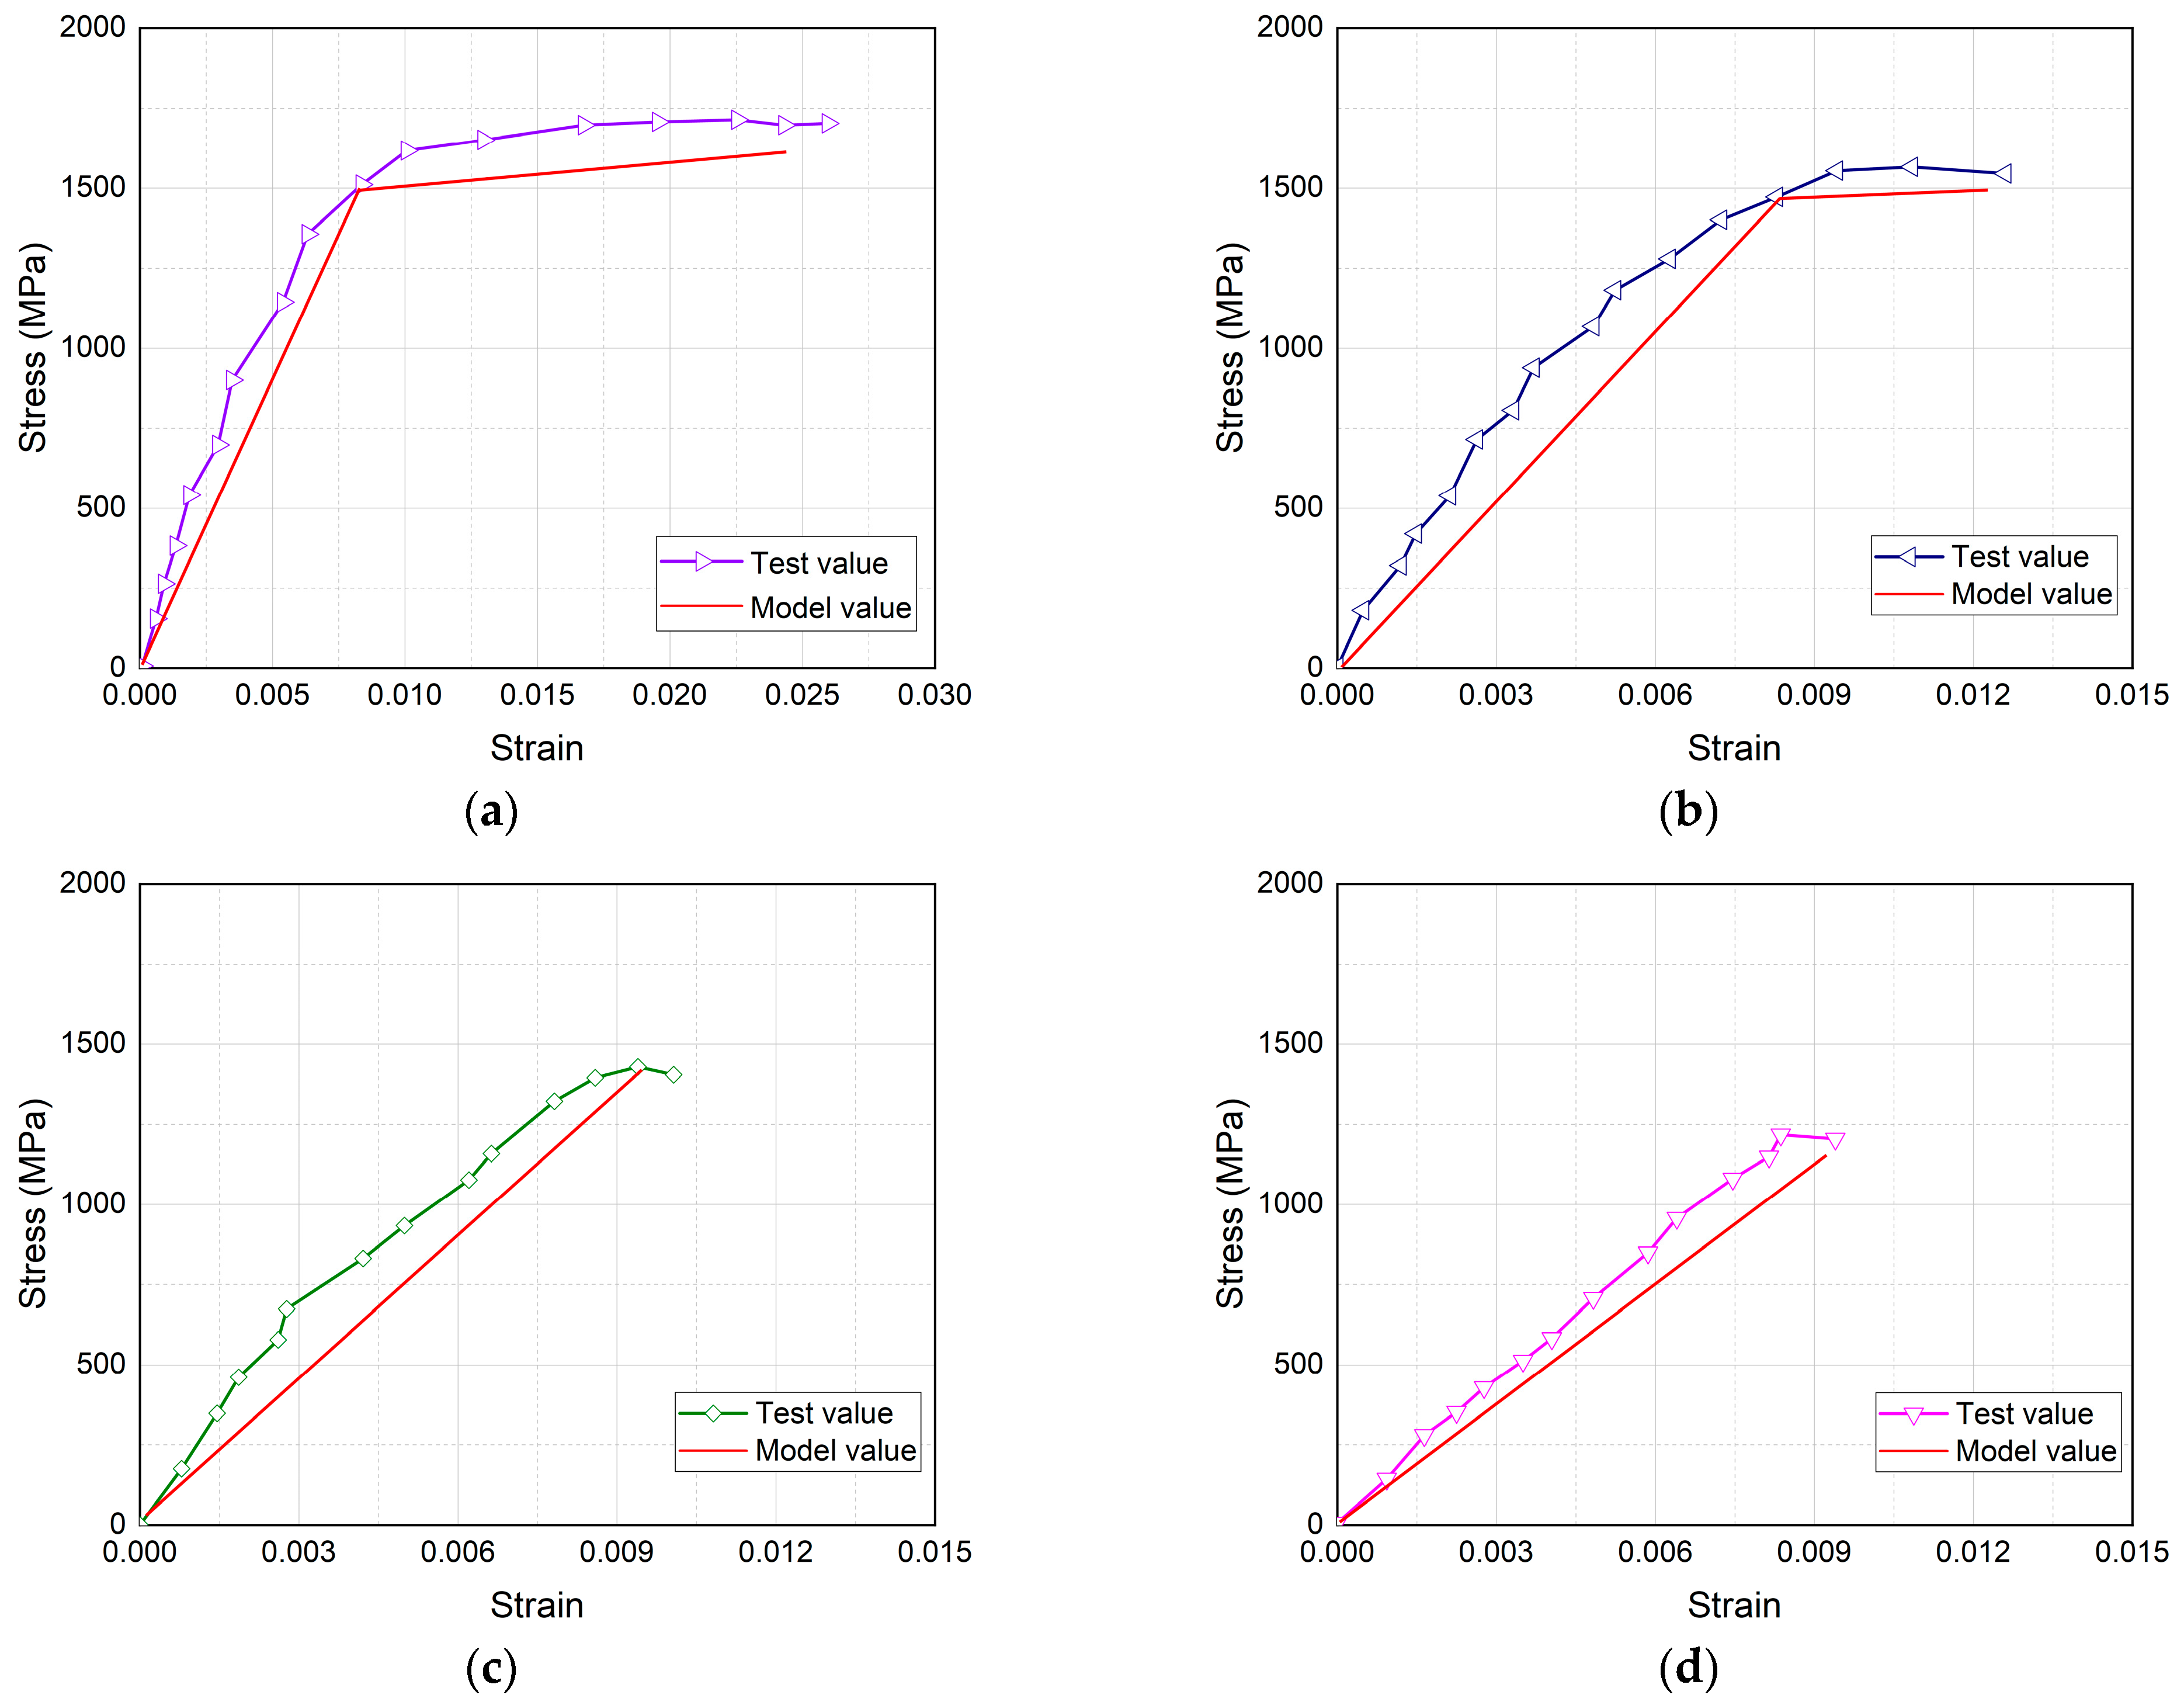
In this study, the stress–strain curves of the corroded steel strands obtained from the test were compared with the established constitutive model to verify applicability and accuracy. The results indicate that the model curves are in good agreement with the test results, as shown in Figure 12.
Figure 12. Comparison of constitutive model with test results of corroded steel strand: (a) η = 3.86%; (b) η = 7.15%; (c) η = 9.75%; (d) η = 14.08%.

3.4. Corrosion-Induced Cracking Analysis of Prestressed Concrete Under Stray Current

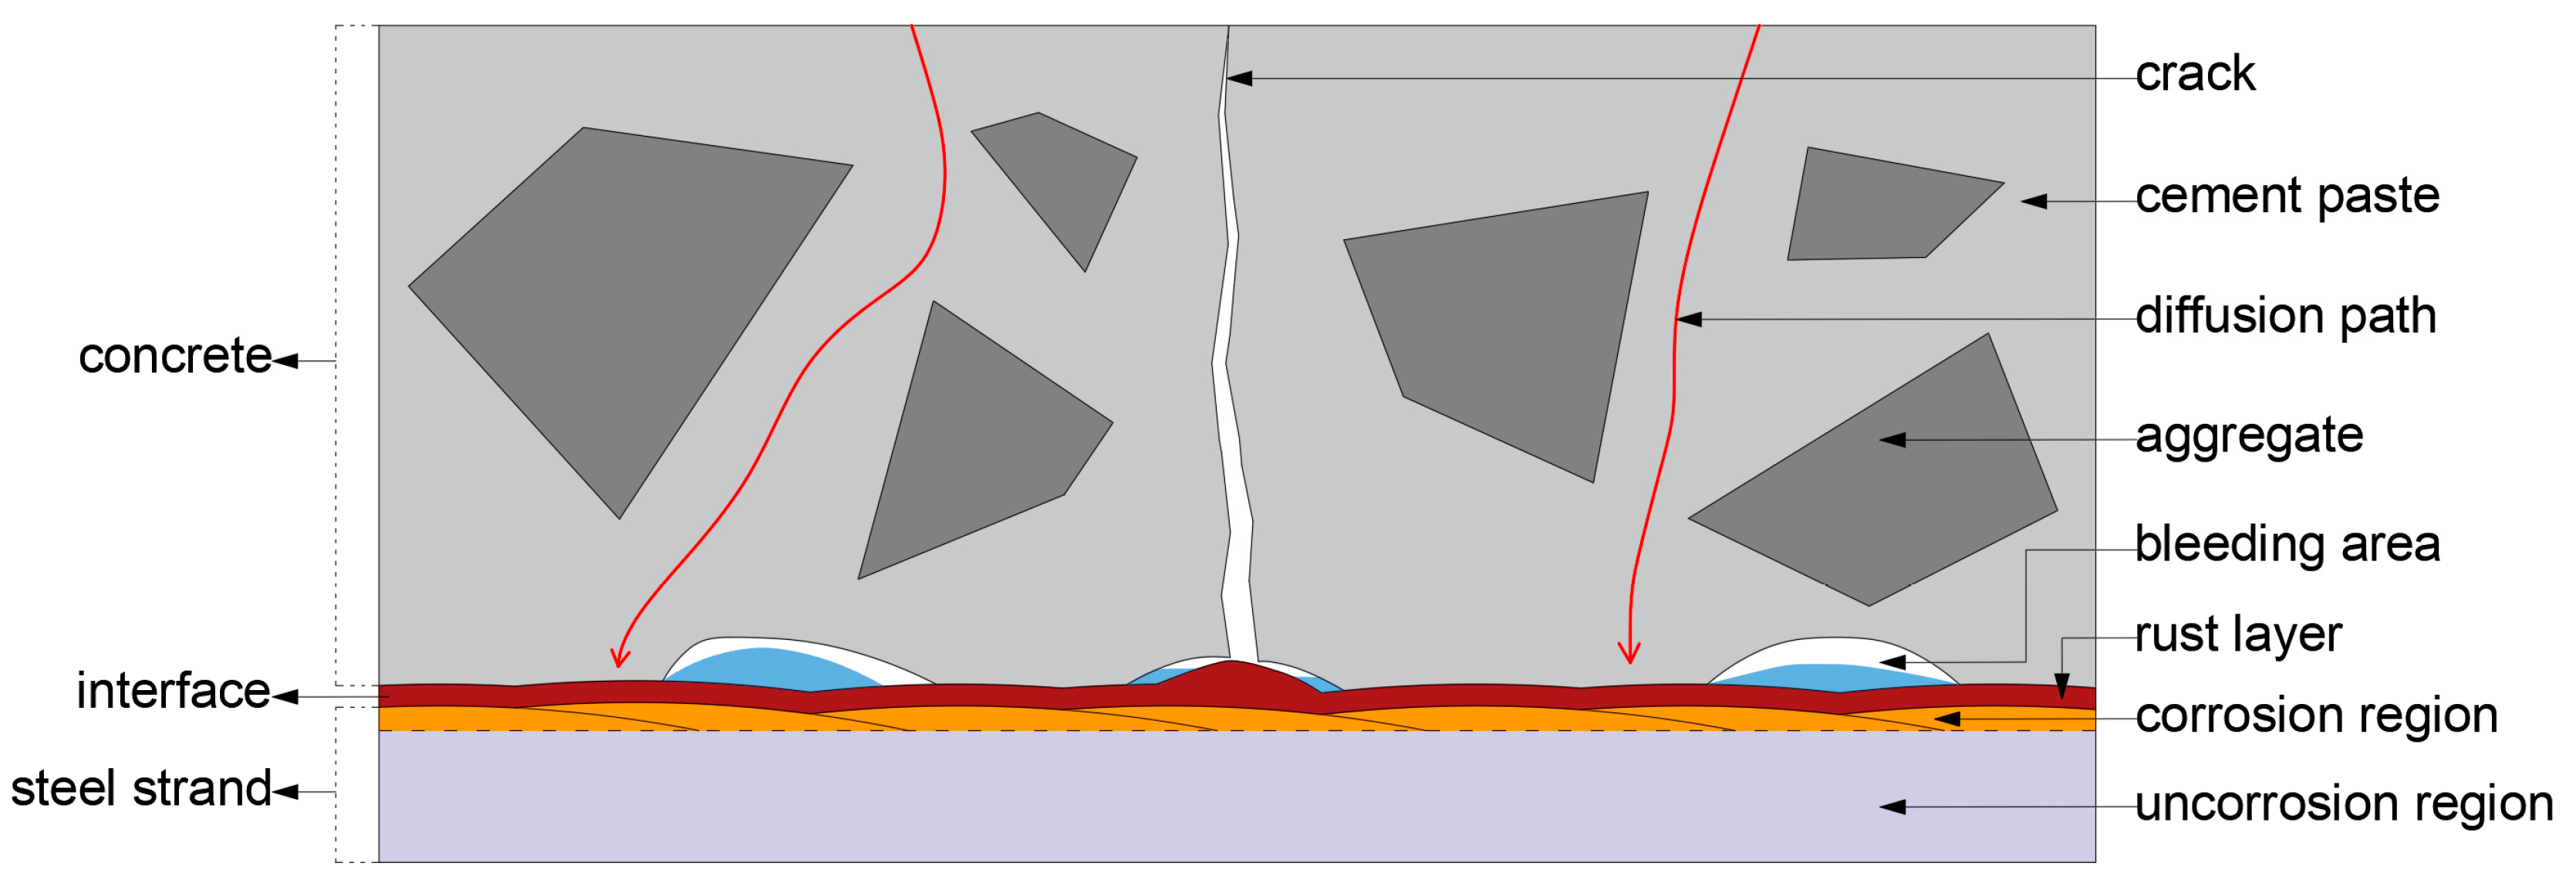
Due to the presence of stray current, chloride ions in the environment rapidly invade the interior of the concrete through the pore structure of the concrete, causing the corrosion of the steel bars or prestressed tendons. The electrochemical corrosion process of steel strands is shown in Figure 13.
Figure 13. Electrochemical corrosion of steel strands under stray current.
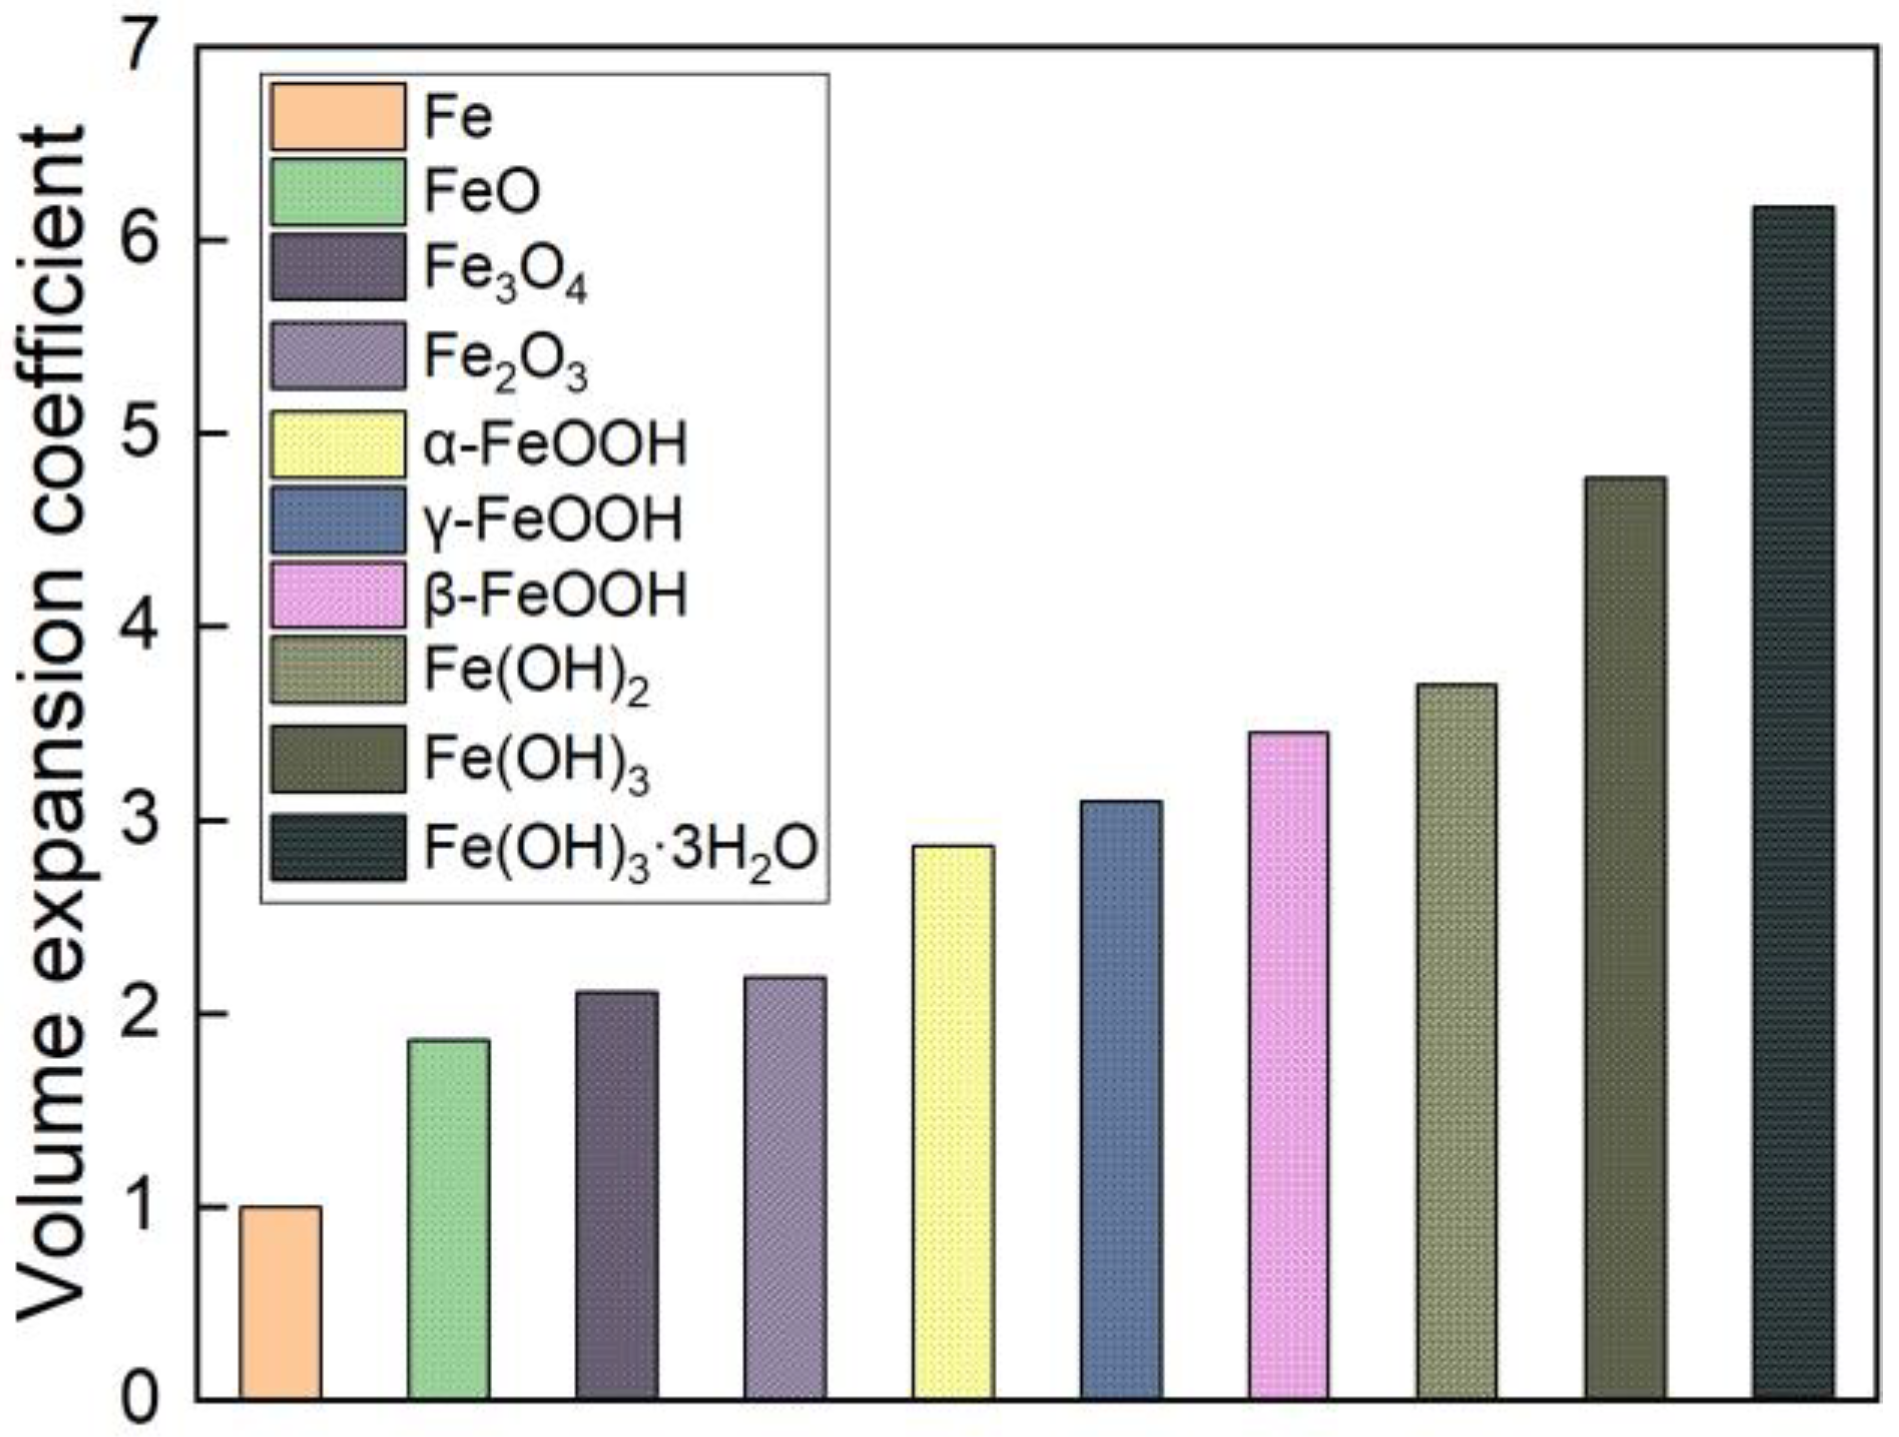
Researchers have determined the composition and corresponding expansion rates of the corrosion products of iron through spectral analysis [], finding that the corrosion products include Fe2O3, Fe3O4, α-FeOOH, β-FeOOH, and γ-FeOOH. The relative volume expansion rates of each product are shown in Figure 14.
Figure 14. Volume expansion coefficient of iron corrosion products.
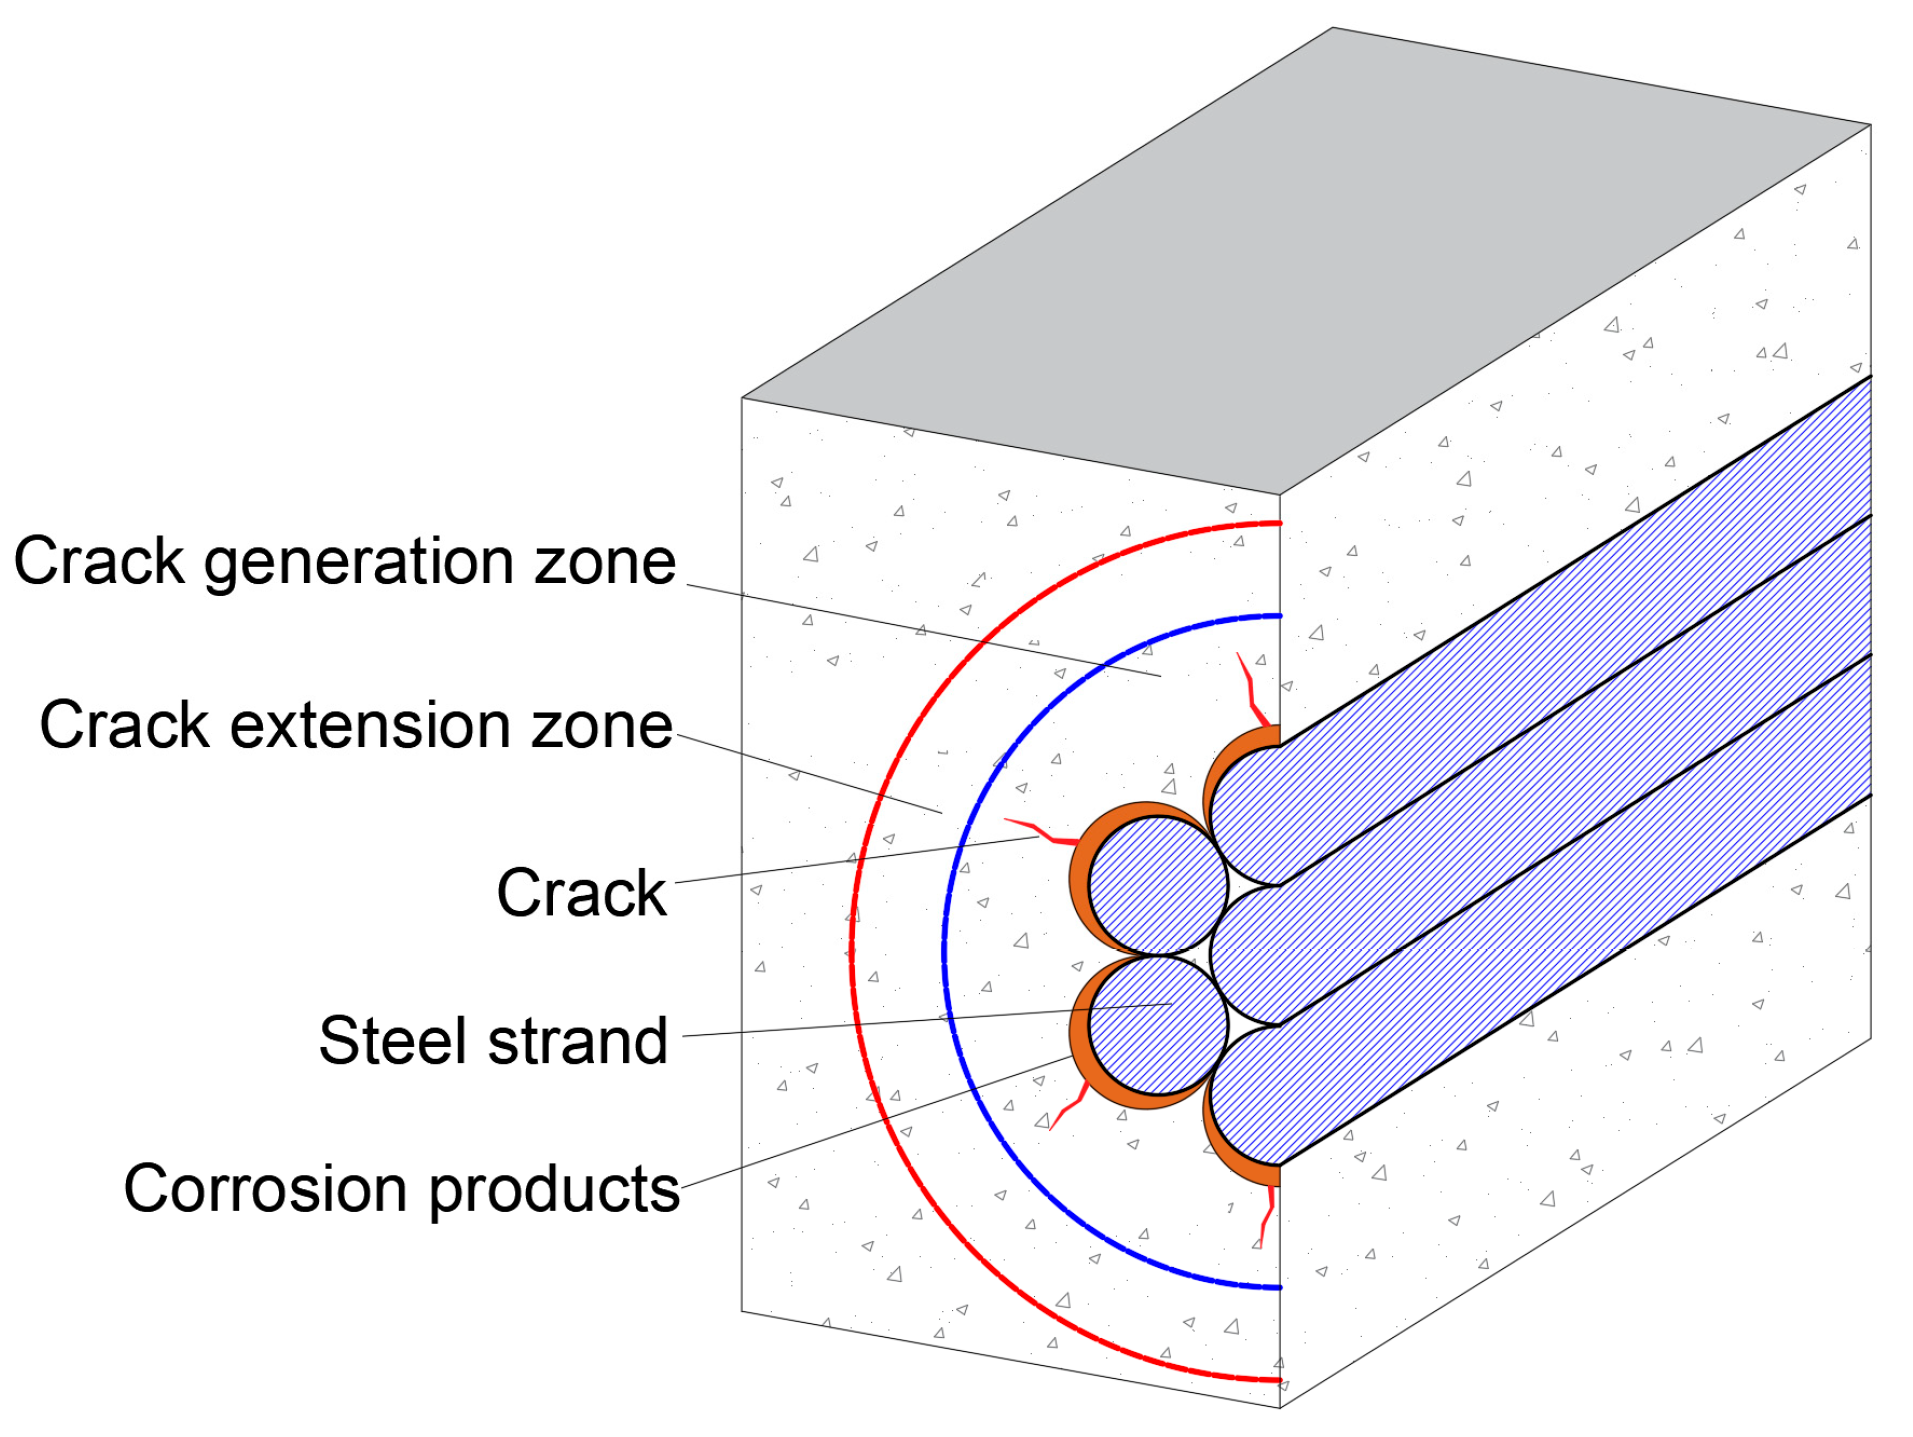
The volume of corrosion products per unit amount of iron is greater than the volume of iron itself. When rust gradually forms and penetrates the surrounding concrete pores along the steel strands to a certain extent, microcracks gradually appear in the concrete due to the presence of volume expansion force. As the corrosion intensifies further, the microcracks gradually increase and expand, eventually forming longitudinal cracks throughout the concrete, as shown in Figure 15. During the test in this study, the corrosion of the steel strand tended to be uniform, the overall corrosion degree intensified, and the cross-sectional area shrank under the stray current. Therefore, it can be assumed that the concrete material itself is a uniform material, uniform corrosion products will form around the surface of the steel strand, and the corrosion products will exert uniform expansive stress on the concrete around them, as shown in Figure 16.
Figure 15. Concrete cracking by corrosion of steel strands.
Figure 16. Cracking section of corroded prestressed concrete.
There are three stages in the prestressed concrete cracking process:
(1)
Free expansion stage. As the corrosion spreads on the surface of the steel, the porous area will gradually be filled with corrosion products. When the total amount of corrosion products mt is less than the amount of corrosion products mp required to fill the porous area around the steel–concrete interface, the formation of corrosion products does not exert corrosion expansion stress on the surrounding concrete.
(2)
Stress development stage. As the corrosion process accumulates and intensifies, when the total amount mt of corrosion products exceeds the amount mp of corrosion products required to fill the porous area around the steel–concrete interface, the formation of corrosion products begins to exert expansion pressure on the surrounding concrete, and this pressure increases with corrosion products.
(3)
Cracking stage. When the total amount mt of corrosion products reaches the critical amount mcrit of corrosion products, the corrosion expansion force exceeds the tensile strength of the concrete, causing the concrete to crack. mcrit mainly depends on the performance of the concrete and the thickness of the protective layer.
There are two important parameters, mp and mcrit, for the corrosion model to predict the cracking time for concrete.
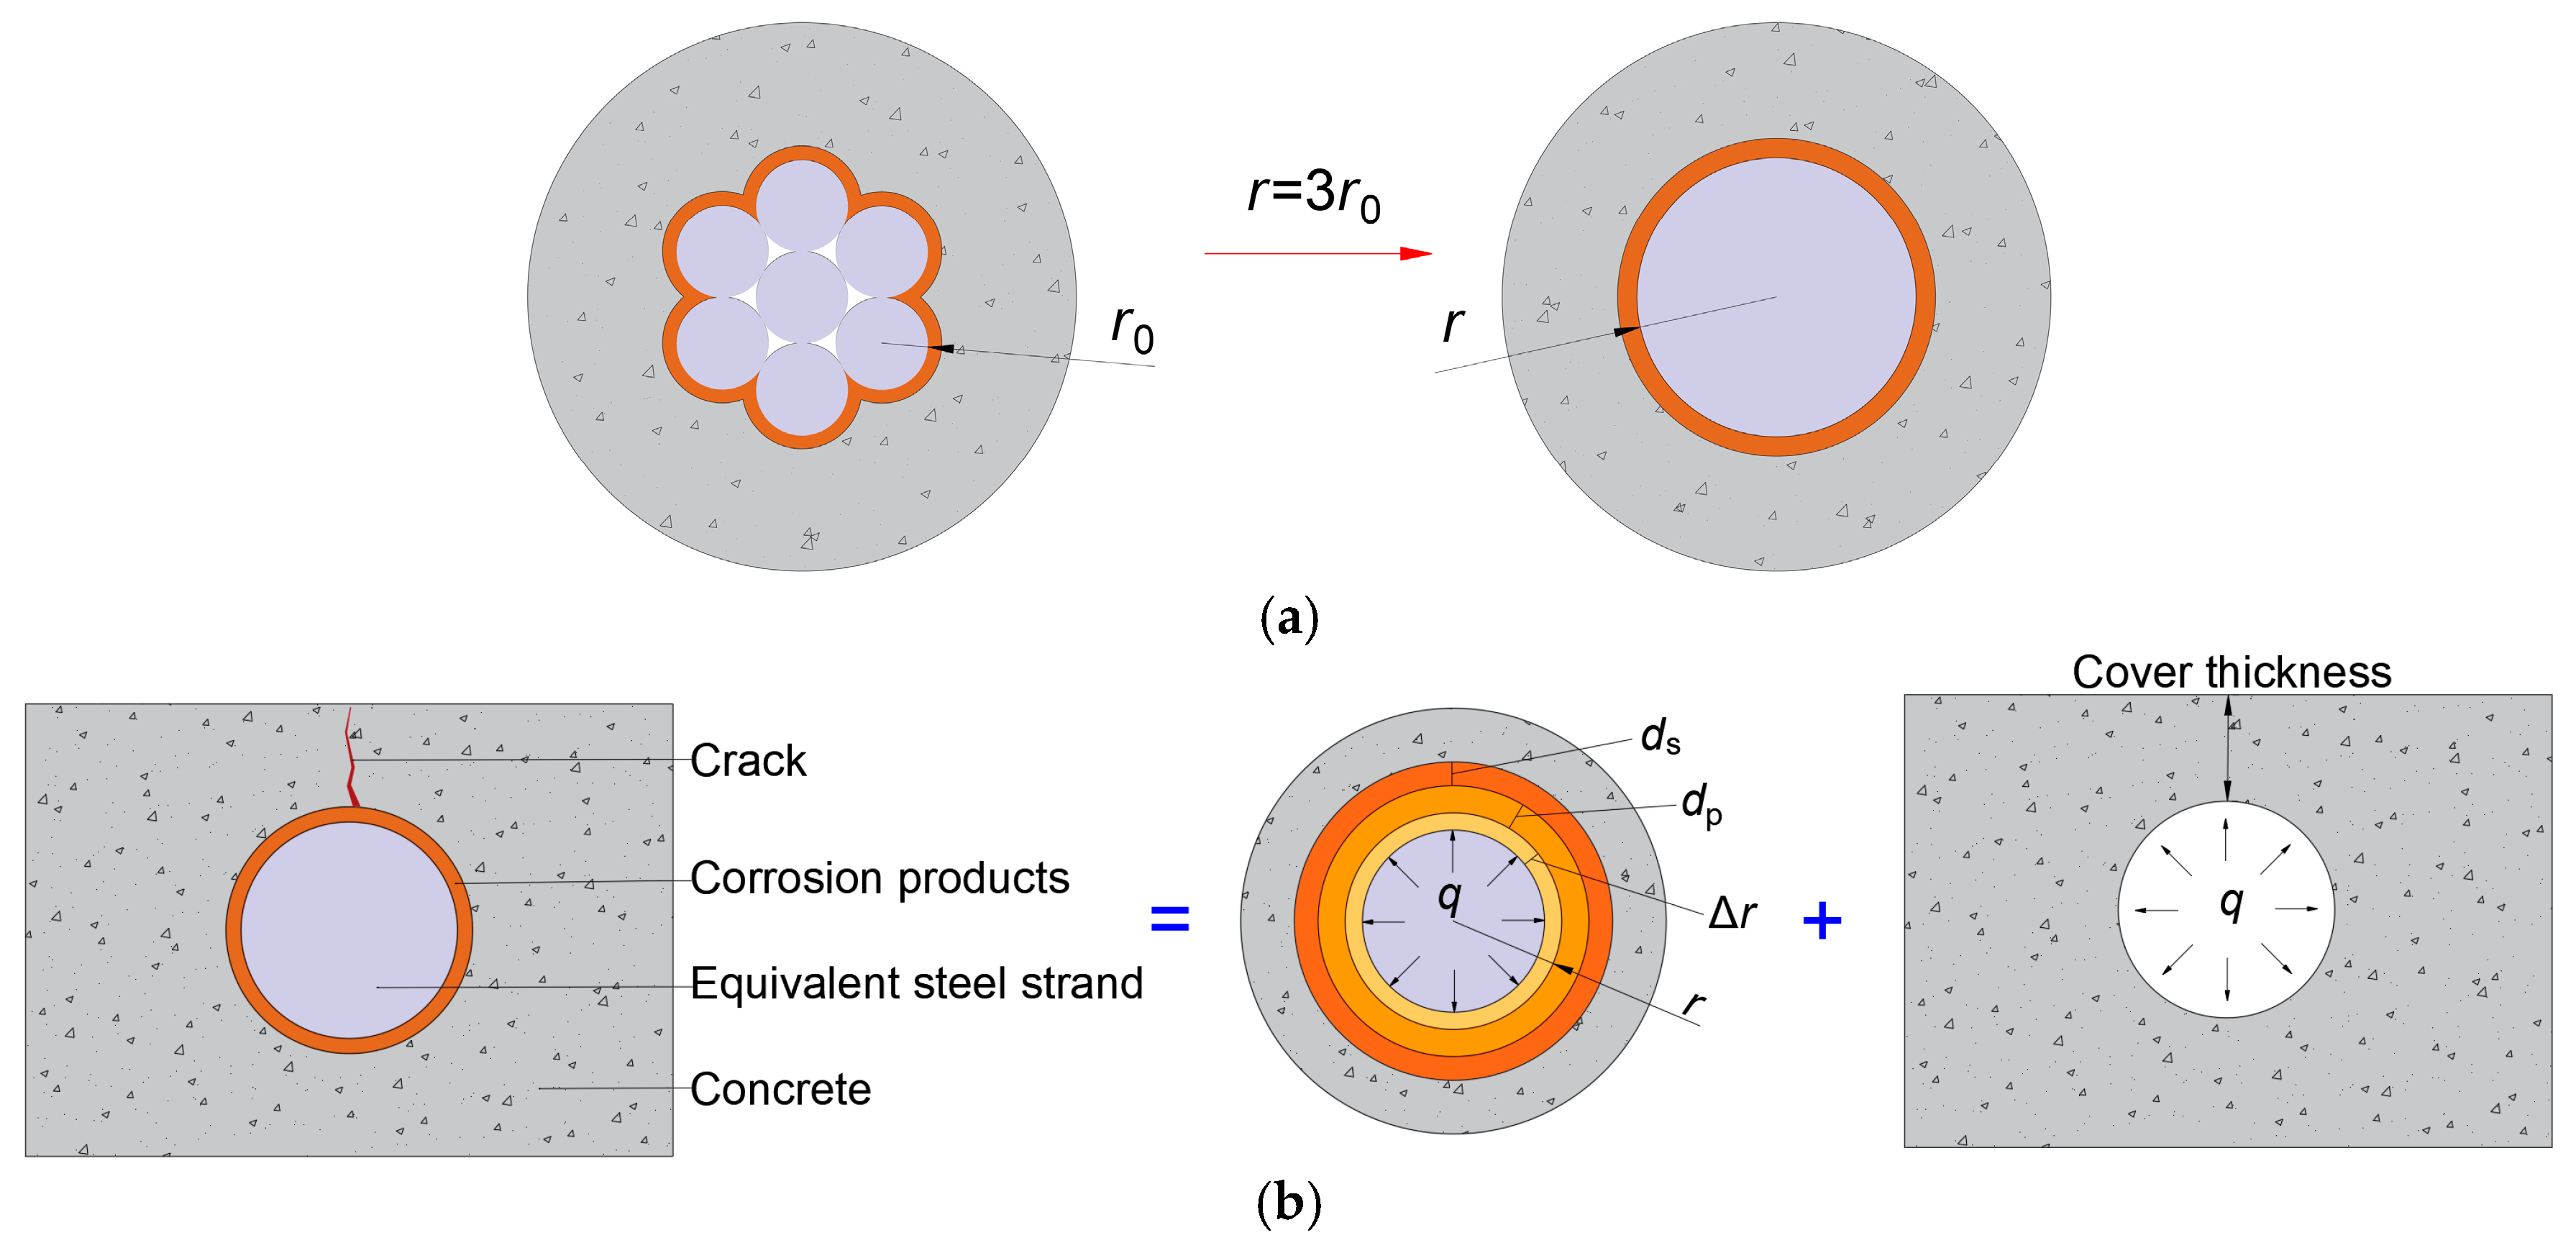
For the steel strands commonly used in engineering, since they are made by twisting multiple steel wires, only the outer part is in contact with the chloride ions. The contact area of the cross-section is approximately 1/2 of the total surface. Since the corrosion degree is averaged, the corrosion of each wire in contact with the concrete on the cross-section of the steel strand is consistent, and the cross-section of the steel strand can be analyzed as a circular cross-section with the same surface area, as shown in Figure 17a. The corrosion surface area of the steel strand is the same before and after equivalence, indicating that the equivalent radius r of the steel strand is three times the radius r0 of a single steel wire of the steel strand.
Figure 17. Calculation model for prestressed concrete crack under stray current: (a) equivalent cracking section of corroded prestressed concrete; (b) crack model after equivalence.
The crack model of the corroded steel strands in the concrete after equivalence was established, as shown in Figure 17b. The steel–concrete interface can be analogized to the transition zone between the cement paste and the aggregate, whose pore structure is affected by the water–cement ratio, degree of hydration, and steel strand size. mp can be expressed as follows:
m p = ρ r V p
where ρr is the density of the corrosion product, and Vp is the volume of the pores around the steel–concrete interface.
The thickness of the porous area around the steel–concrete interface depends on the total volume Vp of the pores nearby. When the amount of corrosion products reaches mp, the radius of the corrosion steel strands with an original radius of r will increase to r + dp. Since dp is much smaller than r, mp can be expressed as
m p = ρ r π ( r + d p ) 2 π r 2 2 = ρ r π r d p
where dp is the thickness of the porous area around the steel–concrete interface, which is generally 10 μm to 20 μm. It can be seen that mp is related to the size of the prestressed steel strands, the density of the corrosion products, and the properties of the steel–concrete interface.
Since the corrosion products first fill the pores of the surrounding concrete and then gradually increase to exert expansive stress on the concrete, the critical quantity of the corrosion products mcrit can be considered to be composed of two parts: mp is the amount of corrosion products that fill the pores around the steel–concrete interface, and ms is the amount of corrosion products that generate critical tensile stress. For prestressed tendons of unit length, since ds is much smaller than r, ms can be expressed by the following equation:
m s = ρ r π ( r + d p ) d s + Δ m / ρ
where ds is the thickness of the corrosion product when tensile stress occurs; Δm is the corrosion mass per unit length of prestressed wire; and ρ is the density of the prestressed steel strands.
The critical quantity of the corrosion product mcrit can be expressed as follows:
m c r i t = m p + m s = ρ r π ( d p + d s ) r + Δ m / ρ
The difference between the volume of corrosion products per unit length of prestressed steel strands and the volume of prestressed wires consumed can be expressed as
m r ρ r Δ m ρ = π r + d p + d s 2 r 2
where mr is the amount of corrosion product. It can be simplified as follows:
m r ρ r Δ m ρ = π r d p + d s
Considering the concrete is a thick-walled cylinder with an inner radius r1 = r + dp and an outer radius r2 = c + r + dp, where c is the thickness of the concrete cover. The volume expansion stress q of the corrosion product on the concrete can be expressed as follows:
q = E e f d s r + d p c + r + d p 2 + r + d p 2 c + r + d p 2 r + d p 2 + μ = E e f d s r 1 r 2 2 + r 1 2 r 2 2 r 1 2 + μ
where μ is the Poisson’s ratio of the concrete; Eef is the effective elastic modulus of the concrete; Eef = Ec/(1 + φc); and φc is the creep coefficient of the concrete. In this case, since the elastic modulus of the steel is approximately seven times that of the concrete, it is assumed that the radial displacement of the concrete under the expansion force is equal to the thickness of the corrosion product ds in the direction of the force on the concrete.
Considering that the cracking occurs above the prestressed steel strands, the minimum stress required to cause the cracking is equal to the tensile strength of the concrete. According to static equilibrium conditions, the expansion force of the corrosion products at the time of the concrete cracking can be expressed as
q = c f t r + d p
The radial deformation of the concrete at corrosion cracking ds can be obtained as follows:
d s = c f t E e f r 2 2 + r 1 2 r 2 2 r 1 2 + μ
Therefore, the critical quantity of the corrosion product mcrit can be expressed as
m c r i t = ρ r π c f t E e f r 2 2 + r 1 2 r 2 2 r 1 2 + μ + d p r + Δ m / ρ
The critical amount of corrosion products required to cause concrete cracking mainly depends on the tensile strength of the concrete, the thickness of the protective layer, and the corrosion degree of the steel strands.
Based on previous research [], a linear relationship between the corrosion amount of steel Δm and the corrosion product amount of steel mr can be expressed as follows:
Δ m = k m w m r
where kmw is the ratio of the molecular weight of the metal to that of the corrosion product. For iron, the general range of kmw is 0.523 to 0.622 []. The value of kmw for predicting cracking time can be calculated separately as 0.523 for Fe(OH)3 and 0.622 for Fe(OH)2, thereby yielding the corrosion cracking time range.
Figure 18 shows a comparison of different corrosion-induced cracking models. The parameters for comparative analysis are selected as a protective layer thickness of 48 mm, and a steel bar (steel strand) diameter of 16 mm. The dashed line in Figure 18 represents the model based on uniform corrosion, and the solid line represents the non-uniform corrosion of the steel bar. The results show that the width of the surface cracks on the protective layer increased with the increase in the steel corrosion rate. Overall, under the same corrosion rate, the crack width caused by the non-uniform corrosion of steel bars was smaller than that caused by uniform corrosion. The results of previous models [,] based on uniform corrosion are significantly larger than the model established in this study. This may be due to the rapid dissolution of corrosion products into water under the action of the electric current, resulting in a relatively weakened expansion force. The results of previous models [,] based on non-uniform corrosion are significantly lower, mainly due to the accumulation of corrosion products at the corrosion pit, which hinders the propagation of longitudinal cracks.
Figure 18. Comparison of different corrosion-induced cracking models [,,,].
When stray current passes through prestressed steel strands, the rate of corrosion mass loss of the strands η can be predicted according to Faraday’s Law:
η = I s c M z F = i S M z F
where Isc is the corrosion current, i is the equivalent corrosion current density, t is the corrosion time, M is the atomic mass of iron (56 g/mol), S is the surface area of the steel strand in contact with the concrete, z is the charge carried by the iron ion, and F is the Faraday constant (96,485 C/mol).
As the stray current passes through a strand of length l, the total surface area of the steel wire in contact with the concrete is S0. The equivalent to the corrosion current density i can be expressed as follows:
i = I s c S 0
When the concrete cracks due to the corrosion of the prestressed steel strands, the corrosion amount of steel Δm can be expressed as
Δ m = k m w m c r i t = I s c S M S 0 z F t c
The cracking time tc can be expressed as
t c = k m w m c r i t S 0 z F I c o r r S M = K c m c r i t I s c
For the 1860 MPa prestressed strand with a diameter of 15.2 mm, the cracking time tc can be expressed as follows:
t c = 2 K c c f t r 2 2 + r 1 2 r 2 2 r 1 2 + μ + d 0 E e f i E e f
The cracking values of the concrete protective layer obtained by the proposed model in this paper were compared with the experimental results, as shown in Figure 19. As the current increases, the curve of the cracking time decreases, and the rates of decrease gradually slow down. The error of the cracking time is 13% as the current is 20 mA, and the error is 5% as the current is 60 mA. The error observed at 10 mA is primarily attributed to the increased current, which accelerates the accumulation of corrosion products. As the expansion force increases, the cracking time shortens. When the corrosion products accumulate to a certain extent, the surface of the steel strand will be covered, and the corrosion trend gradually becomes uniform, leading to the more gentle development of the expansion force.
Figure 19. Comparison between model results and experimental results.

4. Conclusions

In this study, the corrosion process of prestressed concrete under stray current was simulated through electrochemical corrosion testing. The corrosion characteristics and mechanical properties of prestressed concrete were analyzed, and a prediction model for the corrosion cracking of prestressed concrete was established. The main conclusions are as follows:
(1)
Electrochemical corrosion tests were conducted on specimens to simulate the characteristics of the metro environment. The results indicate that the stray current had a significant impact on the corrosion cracking of the specimens. The width of the rust-swelling crack was roughly linearly related to the corrosion rate under stray current. Due to the influence of stray current, the corrosion degree of the steel strand was relatively low in the middle, and the difference decreased as the corrosion rate increased. When the average corrosion degree ηave of the steel strand was less than 7%, the corrosion difference coefficient μc at different positions was greater than 1.6. When the average corrosion degree ηave was greater than 12%, the corrosion rates at different positions were basically the same, and the corrosion difference coefficient μc was less than 1.1.
(2)
Mechanical property tests were conducted on the steel strands after electrification corrosion. The results indicate that when the corrosion rate was low (η < 7%), the failure mode of the corrosion specimens was mainly toughness failure with a small change in elastic modulus, which could maintain common mechanical properties, and the ultimate strength and elongation changed significantly. When the corrosion rate was high (η > 7%), the failure mode of the steel strand gradually changed from toughness mode to brittle mode, with a significant cross-sectional loss of individual steel wire and a significant decrease in elastic modulus. The steel strands broke suddenly during stretching, resulting in a relatively discrete ultimate strength value at a high corrosion rate. Based on the test results, a model for the degradation of mechanical properties of corroded steel strands was presented.
(3)
Considering the cracking of prestressed concrete caused by the stray current corrosion of steel strands, the corrosion cracking process was simplified and analyzed based on the test results. The corroded steel strand was treated equivalently, and a prediction model for prestressed concrete corrosion cracking considering the influence of stray current was established. The main influencing factors of the model are stray current intensity, concrete tensile strength, and the protective layer thickness of the prestressed concrete.

Author Contributions

Conceptualization, Y.N. and E.Z.; methodology, Y.N.; software, Y.N.; validation, Y.N. and L.C.; formal analysis, Y.N. and L.C.; investigation, Y.N.; resources, Y.N. and E.Z.; data curation, Y.N. and E.Z.; writing—original draft preparation, Y.N. and E.Z.; writing—review and editing, Y.N., L.C., and E.Z.; visualization, L.C.; supervision, E.Z.; project administration, E.Z.; funding acquisition, E.Z. All authors have read and agreed to the published version of the manuscript.

Funding

This research was funded by the Scientific Research Projects of Beijing Subway, grant number 51727813.

Data Availability Statement

The data provided in this study can be made available upon reasonable request.

Conflicts of Interest

Authors Yuancheng Ni and Liangjiang Chen were employed by the company China Railway Economic and Planning Research Institute Co., Ltd. The remaining authors declare that the research was conducted in the absence of any commercial or financial relationships that could be construed as a potential conflict of interest.

References

  1. Tu, B.; Dong, Y.; Fang, Z. Time-Dependent Reliability and Redundancy of Corroded Prestressed Concrete Bridges at Material, Component, and System Levels. J. Bridge Eng. 2019, 24, 04019085. [Google Scholar] [CrossRef]
  2. Vereecken, E.; Botte, W.; Lombaert, G.; Caspeele, R. Assessment of Corroded Prestressed and Posttensioned Concrete Structures: A Review. Struct. Concr. 2021, 22, 2556–2580. [Google Scholar] [CrossRef]
  3. Bui, H.T.; Maekawa, K.; Tan, K.H. Microcell and Macrocell Corrosion of Steel Bars in Reinforced Concrete Slabs under Different Corrosive Environments and Cathode/Anode Configurations. Cem. Concr. Compos. 2023, 138, 104989. [Google Scholar] [CrossRef]
  4. Peng, L.; Zeng, W.; Zhao, Y.; Li, L.; Poon, C.; Zheng, H. Steel Corrosion and Corrosion-Induced Cracking in Reinforced Concrete with Carbonated Recycled Aggregate. Cem. Concr. Compos. 2022, 133, 104694. [Google Scholar] [CrossRef]
  5. Tian, Y.; Jiang, H.; Fan, X.; Zhang, G.; Jin, N.; Zeng, Q.; Jin, X.; Yan, D.; Peng, Y.; Wang, J. Corrosion Damages of Reinforced Concrete Characterized by X-Ray CT and DVC Techniques. Constr. Build. Mater. 2023, 409, 134218. [Google Scholar] [CrossRef]
  6. Chen, F.; Li, C.-Q.; Baji, H.; Ma, B. Quantification of Non-Uniform Distribution and Growth of Corrosion Products at Steel-Concrete Interface. Constr. Build. Mater. 2020, 237, 117610. [Google Scholar] [CrossRef]
  7. Hu, J.; Deng, P.; Li, X.; Zhang, J.; Wang, G. The Vertical Non-Uniform Corrosion of Reinforced Concrete Exposed to the Marine Environments. Constr. Build. Mater. 2018, 183, 180–188. [Google Scholar] [CrossRef]
  8. Xi, X.; Yang, S.; Li, C.-Q. A Non-Uniform Corrosion Model and Meso-Scale Fracture Modelling of Concrete. Cem. Concr. Res. 2018, 108, 87–102. [Google Scholar] [CrossRef]
  9. Zhou, Y.; Gencturk, B.; Willam, K.; Attar, A. Carbonation-Induced and Chloride-Induced Corrosion in Reinforced Concrete Structures. J. Mater. Civ. Eng. 2015, 27, 04014245. [Google Scholar] [CrossRef]
  10. Campione, G.; Zizzo, M. Influence of Strands Corrosion on the Flexural Behavior of Prestressed Concrete Beams. Structures 2022, 45, 1366–1375. [Google Scholar] [CrossRef]
  11. Li, R.; Miao, C.; Zhang, Y.; Wang, Y.; Chen, X. Corrosion Characteristics and Damage Constitutive Model of Galvanized Steel Wires for Bridge Cables. Structures 2021, 34, 3414–3426. [Google Scholar] [CrossRef]
  12. Jikal, A.; Majid, F.; Chaffou, H.; Ghorba, M.E. Influence of Corrosion on the Mechanical Behavior of Strand of a Non-Rotating Wire Rope: Experimental Study. Procedia Struct. Integr. 2019, 18, 731–741. [Google Scholar] [CrossRef]
  13. Lee, J.; Lee, Y.-J.; Shim, C.-S. Probabilistic Prediction of Mechanical Characteristics of Corroded Strands. Eng. Struct. 2020, 203, 109882. [Google Scholar] [CrossRef]
  14. Li, H.; Yang, Y.; Wang, X.; Tang, H. Effects of the Position and Chloride-Induced Corrosion of Strand on Bonding Behavior between the Steel Strand and Concrete. Structures 2023, 58, 105500. [Google Scholar] [CrossRef]
  15. Xia, R.; Zhou, J.; Zhang, H.; Zhou, D.; Zhang, Z. Experimental Study on Corrosion of Unstressed Steel Strand Based on Metal Magnetic Memory. KSCE J. Civ. Eng. 2019, 23, 1320–1329. [Google Scholar] [CrossRef]
  16. Ma, Z.; Wu, Y.; Fang, K.; Zhang, Y.; Wang, C. Developing Fully Recycled Alkali-Activated Mortar Made with Waste Concrete Fines as a Substitute for Both Binder and Sand: Multi-Properties Evaluation. Constr. Build. Mater. 2025, 477, 141323. [Google Scholar] [CrossRef]
  17. Wang, C.; Lu, Y.; Dai, Y.; Wu, H.; Ma, Z. In-Situ 4D CT Analysis of Microcrack Evolution in Carbonated Fiber-Reinforced Recycled Aggregate Concrete. Cem. Concr. Compos. 2025, 163, 106161. [Google Scholar] [CrossRef]
  18. Shaikh, F.U.A. Effect of Cracking on Corrosion of Steel in Concrete. Int. J. Concr. Struct. Mater. 2018, 12, 3. [Google Scholar] [CrossRef]
  19. Cheng, X.; Su, Q.; Ma, F.; Liu, X.; Liang, X. Investigation on Crack Propagation of Concrete Cover Induced by Non-Uniform Corrosion of Multiple Rebars. Eng. Fract. Mech. 2018, 201, 366–384. [Google Scholar] [CrossRef]
  20. Guzmán, S.; Gálvez, J.C. Modelling of Concrete Cover Cracking Due to Non-Uniform Corrosion of Reinforcing Steel. Constr. Build. Mater. 2017, 155, 1063–1071. [Google Scholar] [CrossRef]
  21. Zhu, W.; Yu, K.; Xu, Y.; Zhang, K.; Cai, X. A Prediction Model of the Concrete Cracking Induced by the Non-Uniform Corrosion of the Steel Reinforcement. Materials 2020, 13, 830. [Google Scholar] [CrossRef]
  22. Otieno, M.; Beushausen, H.; Alexander, M. Chloride-Induced Corrosion of Steel in Cracked Concrete–Part II: Corrosion Rate Prediction Models. Cem. Concr. Res. 2016, 79, 386–394. [Google Scholar] [CrossRef]
  23. Zhao, Y.; Dong, J.; Wu, Y.; Jin, W. Corrosion-Induced Concrete Cracking Model Considering Corrosion Product-Filled Paste at the Concrete/Steel Interface. Constr. Build. Mater. 2016, 116, 273–280. [Google Scholar] [CrossRef]
  24. Michel, A.; Otieno, M.; Stang, H.; Geiker, M.R. Propagation of Steel Corrosion in Concrete: Experimental and Numerical Investigations. Cem. Concr. Compos. 2016, 70, 171–182. [Google Scholar] [CrossRef]
  25. Zhao, Y.; Zhang, X.; Jin, W. Influence of Environment on the Development of Corrosion Product-Filled Paste and a Corrosion Layer at the Steel/Concrete Interface. Corros. Sci. 2017, 124, 1–9. [Google Scholar] [CrossRef]
  26. Wang, L.; Dai, L.; Bian, H.; Ma, Y.; Zhang, J. Concrete Cracking Prediction under Combined Prestress and Strand Corrosion. Struct. Infrastruct. Eng. 2019, 15, 285–295. [Google Scholar] [CrossRef]
  27. Charalambous, C.A.; Aylott, P.; Buxton, D. Stray Current Calculation and Monitoring in DC Mass-Transit Systems: Interpreting Calculations for Real-Life Conditions and Determining Appropriate Safety Margins. IEEE Veh. Technol. Mag. 2016, 11, 24–31. [Google Scholar] [CrossRef]
  28. GB/T 50082-2024; Standard for Test Methods of Long-Term Performance and Durability of Concrete. Ministry of Housing and Urban-Rural Development: Beijing, China, 2024.
  29. GB/T 5224-2023; Steel Strand for Prestressed Concrete. State Administration for Market Regulation and Standardization Administration of China: Beijing, China, 2023.
  30. Raman, A.; Kuban, B.; Razvan, A. The Application of Infrared Spectroscopy to the Study of Atmospheric Rust Systems-I. Standard Spectra and Illustrative Applications to Identify Rust Phases in Natural Atmospheric Corrosion Products. Corros. Sci. 1991, 32, 1295–1306. [Google Scholar] [CrossRef]
  31. Dillmann, P.; Mazaudier, F.; Hœrlé, S. Advances in Understanding Atmospheric Corrosion of Iron. I. Rust Characterization of Ancient Ferrous Artefacts Exposed to Indoor Atmospheric Corrosion. Corros. Sci. 2004, 46, 1401–1429. [Google Scholar] [CrossRef]
  32. Andrade, C.; Alonso, C.; Molina, F.J. Cover Cracking as a Function of Bar Corrosion: Part I-Experimental Test. Mater. Struct. 1993, 26, 453–464. [Google Scholar] [CrossRef]
  33. Zhang, R.; Castel, A.; François, R. Concrete Cover Cracking with Reinforcement Corrosion of RC Beam during Chloride-Induced Corrosion Process. Cem. Concr. Res. 2010, 40, 415–425. [Google Scholar] [CrossRef]
  34. Vidal, T.; Castel, A.; François, R. Analyzing Crack Width to Predict Corrosion in Reinforced Concrete. Cem. Concr. Res. 2004, 34, 165–174. [Google Scholar] [CrossRef]
  35. Liu, T.; Weyers, R.W. Modeling the Dynamic Corrosion Process in Chloride Contaminated Concrete Structures. Cem. Concr. Res. 1998, 28, 365–379. [Google Scholar] [CrossRef]
  36. Alonso, C.; Andrade, C.; Rodriguez, J.; Diez, J.M. Factors Controlling Cracking of Concrete Affected by Reinforcement Corrosion. Mat. Struct. 1998, 31, 435–441. [Google Scholar] [CrossRef]
Disclaimer/Publisher’s Note: The statements, opinions and data contained in all publications are solely those of the individual author(s) and contributor(s) and not of MDPI and/or the editor(s). MDPI and/or the editor(s) disclaim responsibility for any injury to people or property resulting from any ideas, methods, instructions or products referred to in the content.

Article Metrics

Citations

Article Access Statistics

Multiple requests from the same IP address are counted as one view.