Abstract
The load transfer mechanism of piles in karst cavity areas was investigated through field tests, and an orthogonal test was carried out to establish a calculation method for negative skin friction induced by backfilling. The results indicate that the negative skin friction of piles is strongly influenced by the type of cavity. When cavities were completely filled with limestone breccia mixed with silty clay and the applied load reached 3628 kN, the unit side friction ranged from 15 to 22 kPa. In contrast, when cavities remained unfilled, soil settlement occurred around the pile after backfilling, leading to the development of negative skin friction. For cavities with heights of 3–12 m, it is recommended that the bearing capacity of piles be calculated by considering negative skin friction at depths of 0H, 0.106H, 0.214H, and 0.271H (where H denotes the cavity height). Based on 21 orthogonal tests, the sensitivity ranking of factors affecting negative skin friction was determined as follows: cavity height > elastic modulus of backfill > pile diameter > cavity span > pile length > cavity position. The calculated values of negative skin friction were further validated against engineering data, showing a variation trend consistent with the test results, with a relative error of only 7.4%.
1. Introduction
Pile foundations are widely used in construction projects in karst regions because of their high load-bearing capacity, ability to penetrate karst cavities, and effectiveness in transferring loads to more competent rock layers [,,]. When piles pass through karst cavities, backfilling with rubble and clay is commonly employed as a treatment method, typically at a ratio of 4:6. However, the consolidation settlement of the backfill can induce negative skin friction along the sides of the pile foundations. Neglecting the effects of negative skin friction may lead to safety risks in engineering construction. Therefore, investigating the distribution and calculation methods of negative skin friction in pile foundations within karst regions is of great practical significance.
Currently, many scholars are investigating the vertical bearing characteristics and the calculation methods of negative skin friction for pile foundations in karst regions. Chen investigated the load-bearing characteristics of piles under 11 different karst cavity conditions through centrifuge model tests and established a formula for calculating pile bearing capacity []. Feng conducted a load test on a pile passing through a 25.5 m giant cavity and determined the influence range of the pile when the backfilling method was applied []. Jiang established a formula for calculating the backfill–settlement curve in the super-large karst cave in the karst area based on the load transfer exponential function and verified the calculated results with engineering examples []. Zhao proposed a calculation method for the safe roof thickness of the karst cave, considering the side resistance of the rock-socking section of the pile foundation in the karst area using a theoretical method []. Kiyosumi analyzed the model tests of shallow foundations above karst cavities and proposed three failure modes for the cavity–foundation system []. Dong conducted the static load tests on bridge pile foundations in karst areas and found that the hyperbolic model provided conservative and highly accurate predictions of the pile’s ultimate bearing capacity []. Yin studied the influence of the underlying cave on the bearing characteristics of a single pile. This research showed that the influence of the cave height on the ultimate bearing capacity of a single pile was not obvious. The influence of the roof thickness, span and rock strength on the bearing capacity of pile was greater []. Huang used the numerical simulation software to analyze the failure modes of the karst cavities under load, concluding that the ratio of top slab thickness to cavity span significantly affected the failure mechanism []. Xie conducted orthogonal numerical simulations on karst pile foundations under various influencing factors and found that cavity height had little impact on the vertical bearing characteristics of the piles, while the ultimate vertical bearing capacity decreased with increasing cavity span and increased with the strengthening of the top slab rock []. Wang and Hei combined field tests and theoretical methods to provide design and calculation methods for pile foundations in karst areas under different influencing factors [,]. Johanssen proposed using the limit equilibrium method to calculate negative skin friction by determining the average vertical effective stress in the surrounding soil, then applying a negative skin friction coefficient to obtain the final value [].
At present, the main method for calculating negative skin friction is to use a negative skin friction coefficient. This coefficient is primarily an empirical value, and therefore the accuracy of the calculation is relatively low. Although this method is simple to apply, it is generally adopted in design specifications [,,,]. Huang regarded the pile response as a weighted average of complete and adjusted states and analyzed the load transfer function of the pile foundation, proposing parameter selection strategies and investigating the influence of different factors []. Zhou proposed a novel method for calculating negative skin friction that comprehensively accounts for the whole process of stress state alterations occurring during soil deformation and described the relationship between soil deformation and stress using a hyperbolic mechanical model []. Chen conducted field tests on bridge pile foundations treated by backfilling and provided guidelines for determining the range of negative skin friction at different cavity heights []. Qiu derived the variation patterns of the end resistance and side friction under different pile diameters based on the Mindlin, representing side friction distributions as stress coefficients multiplied by unit resistance and proposing a novel formula for stress coefficients under spatial conditions []. Mao and Zhao studied the calculation model of pile side friction resistance in elastic and plastic sections of the pile’s foundation. They proposed a calculation method for determining the neutral point position of piles and the magnitude and distribution law of the negative skin friction resistance of the pile foundation. This was based on load transfer and the effective stress method [,]. Few previous studies have investigated the negative skin friction of piles induced by the settlement of backfilling materials after karst cave treatment.
This study addresses this gap by combining orthogonal testing with field validation to establish a calculation method for negative skin friction under such conditions. The load transfer mechanism of the pile foundation of the bridge passing through the karst cave was studied using a field test. The influence of different fillings on the load transfer mechanism of the pile foundation was investigated. The negative skin friction range at different cave heights was analyzed using numerical simulation. A calculation method was adopted for negative skin friction in pile foundations treated with the backfilling method in karst areas. In addition, the sensitivity of negative skin friction in pile foundations to the above factors was evaluated.
2. Materials and Methods
2.1. Field Test
2.1.1. Engineering Overview and Geological Conditions
The field test was conducted as part of the Xuefeng Bridge project along the Puyan Expressway. The stratigraphy of the bridge site, from top to bottom, comprises Quaternary Holocene alluvial–diluvial deposits, Quaternary colluvial deposits, residual deposits, and the underlying bedrock of Tertiary Fotan Formation basalt. The geological characteristics are summarized in Table 1.

Table 1.
Geological conditions.
2.1.2. Test Pile and Karst Cave Parameters
In the pile foundation of Xuefeng Bridge, pile Z11#-2 passes through a double-layer karst cavity. Due to the convenience of material acquisition, the simplicity of construction, and the low cost of materials, most of the karst caves on site are treated by backfilling with rubble and clay. The ratio of rubble to clay for backfilling is 4:6. The design parameters of the test pile are shown in Table 2, the original filling conditions of the karst cavity are detailed in Table 3, and the physical and mechanical properties of the soil and rock layers at the test pile location are presented in Table 4. In Table 2, l is the length of Z11#-2; D is the diameter of Z11#-2; hr is the embedded Depth of the pile; H is the height of the cave; B is the transverse span of the cave; and L is the longitudinal length span of the cave. In Table 3, qik is lateral resistance standard value. In Table 4, Es is the Young’s modulus; μ is the Poisson’s ratio; c is the cohesion; φ is the internal friction angle; and γ is the unit weight.

Table 2.
Parameters of Z11#-2 and karst cave.

Table 3.
Filling condition of karst cave at pile position Z11#-2.

Table 4.
Physical and mechanical properties of rock and soil layers.
2.1.3. Test Equipment
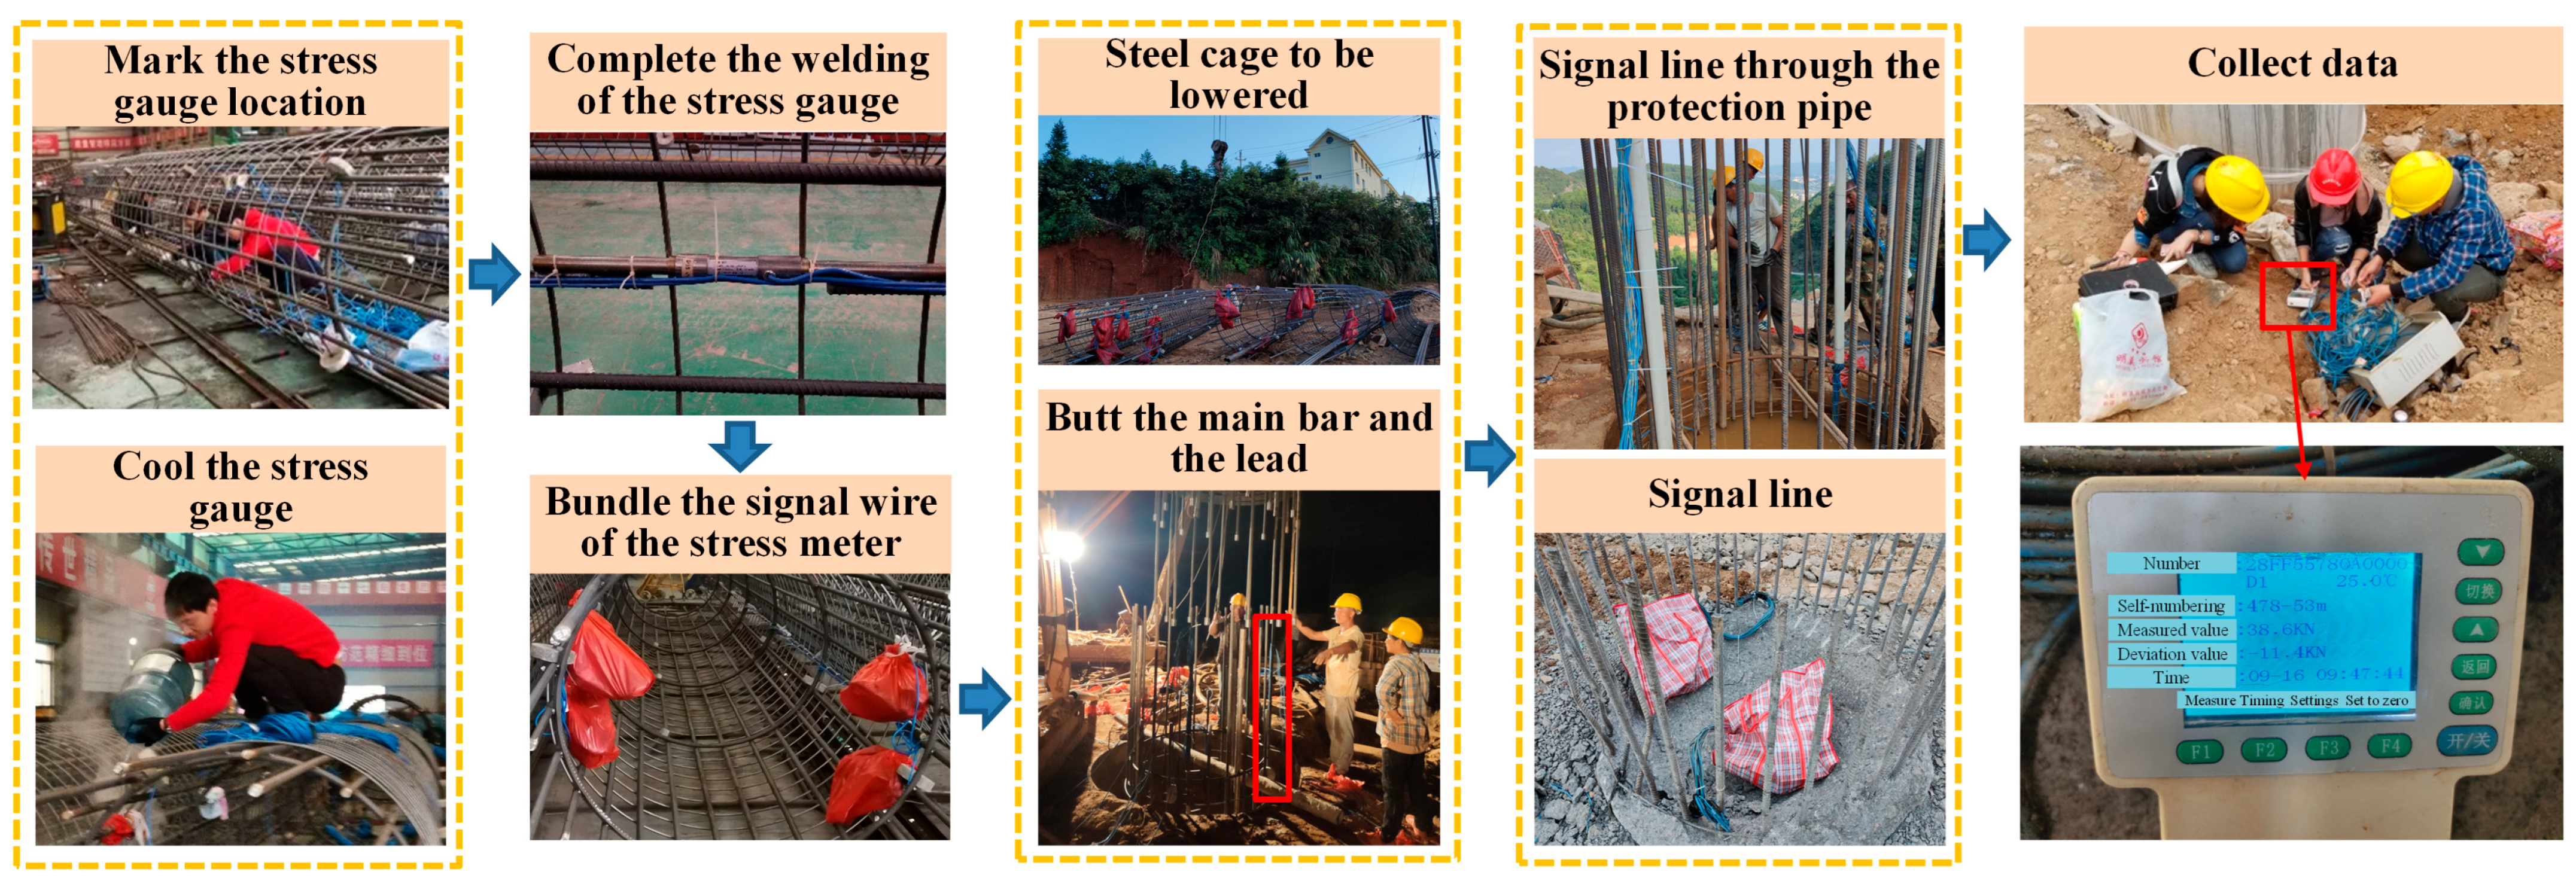
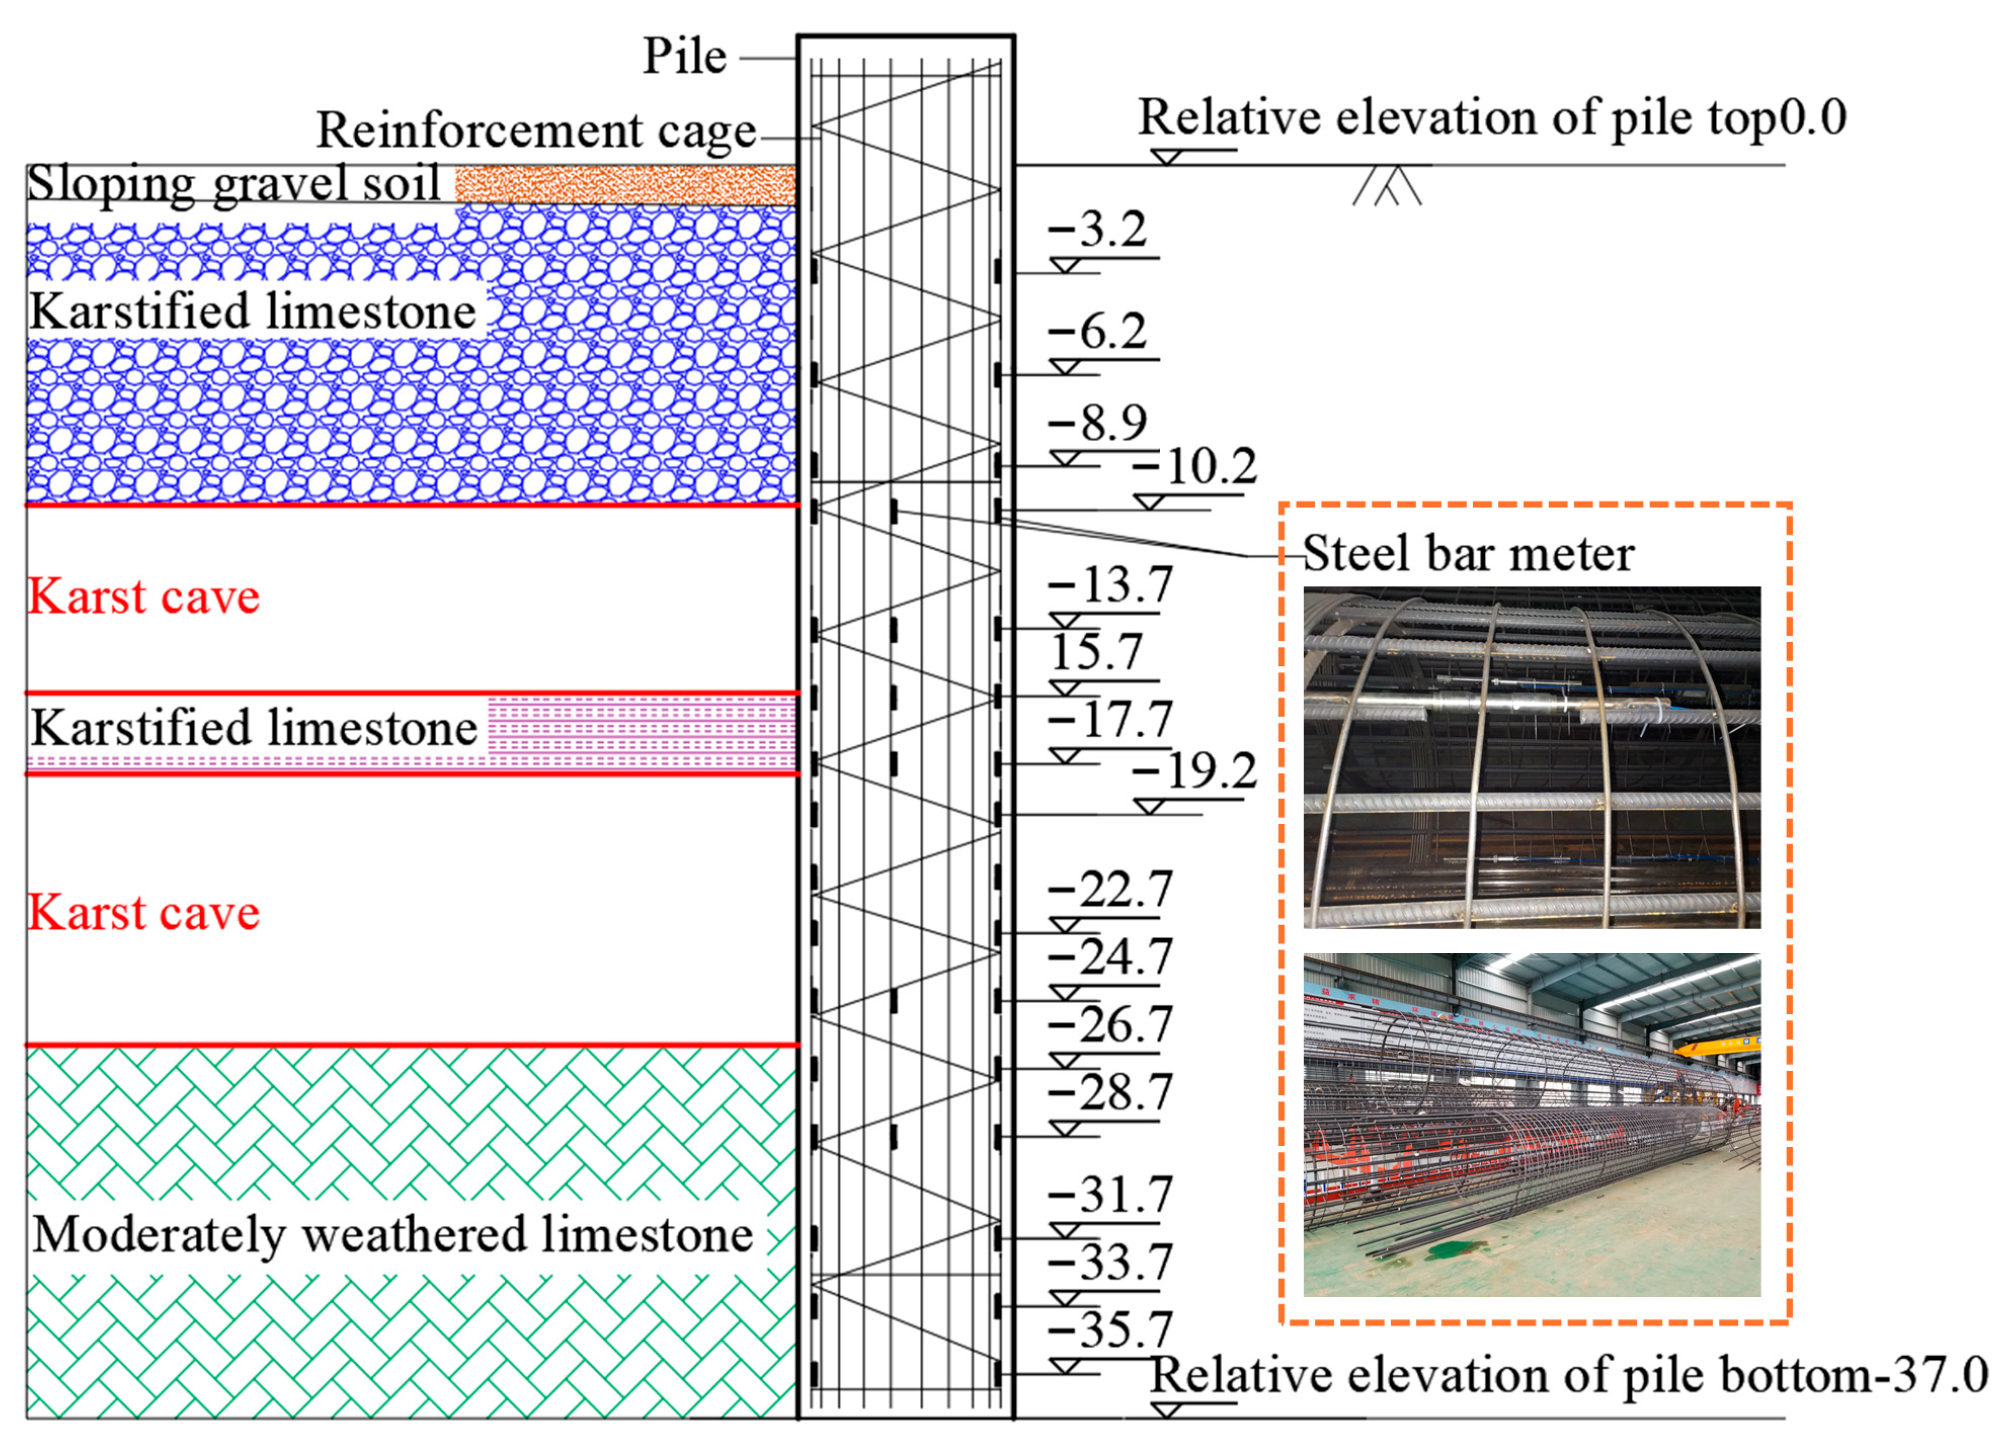
To analyze the load transfer characteristics of bridge pile foundations in karst areas and to measure the axial force and side friction of the pile, YT-ZX-0400 (Yituo Technology Co., Ltd., Changsha, China) intelligent vibrating-wire rebar stress meters were used in the test. These sensors have a measuring range of 20 kN to 220 kN with an accuracy of ±0.25% F.S. The stress meters were welded to the main reinforcement bars of the reinforcement cage at intervals of approximately 2 m, with two sensors symmetrically arranged at the same cross-section. Measurement points were densified at soil layer interfaces and at the junctions between karst cavities and soil layers. The depths of the measurement points are shown in Figure 1, while the installation process of the rebar stress meters is illustrated in Figure 2.

Figure 1.
Position of measuring points of Z11#-2 (Unit: m).

Figure 2.
The process of laying reinforcement stress gauge.
2.1.4. Test Loading
When analyzing the load transfer behavior of highway bridge pile foundations in karst areas, the primary external load applied to the pile foundation in the field tests was the self-weight of the upper structure of the pile foundation corresponding to different construction stages. The upper loads borne by the pile in the field test differ from those of the loading methods used in standard static load tests. The measured test data are not strictly proportional. The load levels applied to the test pile are shown in Table 5. In Table 5, Load 1 is the weight of foundation beam; Load 2 is Load 1 and the weight of the pier column; Load 3 is Load 2 and the weight of the cap beam; Load 4 is Load 3 and the weight of the beam; Load 5 is Load 4 and the weight of the deck and protection barrier.

Table 5.
Upper load at each construction stage of Z11#-2.
The data of the rebar stress meter is read twice at each stage, and the average value is taken as the final test result. The test nodes are as follows: (1) The first is before welding the stress gauge. (2) After the stress gauge is welded, it is necessary to check the integrity of the stress gauge. (3) The data of the rebar stress meter is read before each stage of concrete pouring. After the concrete pouring is completed, continuous monitoring should be carried out every day until the data of the rebar stress meter is stable.
2.1.5. Test Data Processing Method
The axial force of the pile is calculated based on the force applied on the test components. The following assumptions are made in the calculation. The rebar is in close contact with the concrete, meaning the strain of the rebar and concrete is the same at the same cross-section. Both the rebar and concrete are treated as linear elastic materials, meaning their material properties satisfy Hooke’s Law. From this, the axial force of the pile is derived by converting the readings based on the rebar. The axial force and unit pile side friction of Z11#-2 can be obtained by Equations (1) and (2) [].
where Qi is the axial force of pile; FGi, EHi and AHi are the axial pressure of the main reinforcement where the stress gauge is located, the elastic modulus, and the cross-sectional area of concrete, respectively (EHi is 2.8 × 10⁴ MPa). EGi and AGi are the elastic modulus and the cross-sectional area of a main reinforcement, respectively (EGi is 2.0 × 10⁵ MPa, the diameter of the main bar is 28 mm). n is the reinforcement number (n is 28). Ti is the unit side friction (i is the number of stress meter, 1 to 17 from pile top to tip), representing the force on the unit side area of the pile element. U is the circumference of the pile. li is the distance between adjacent stress meter (Figure 1).
2.2. Numerical Simulation
Model Design
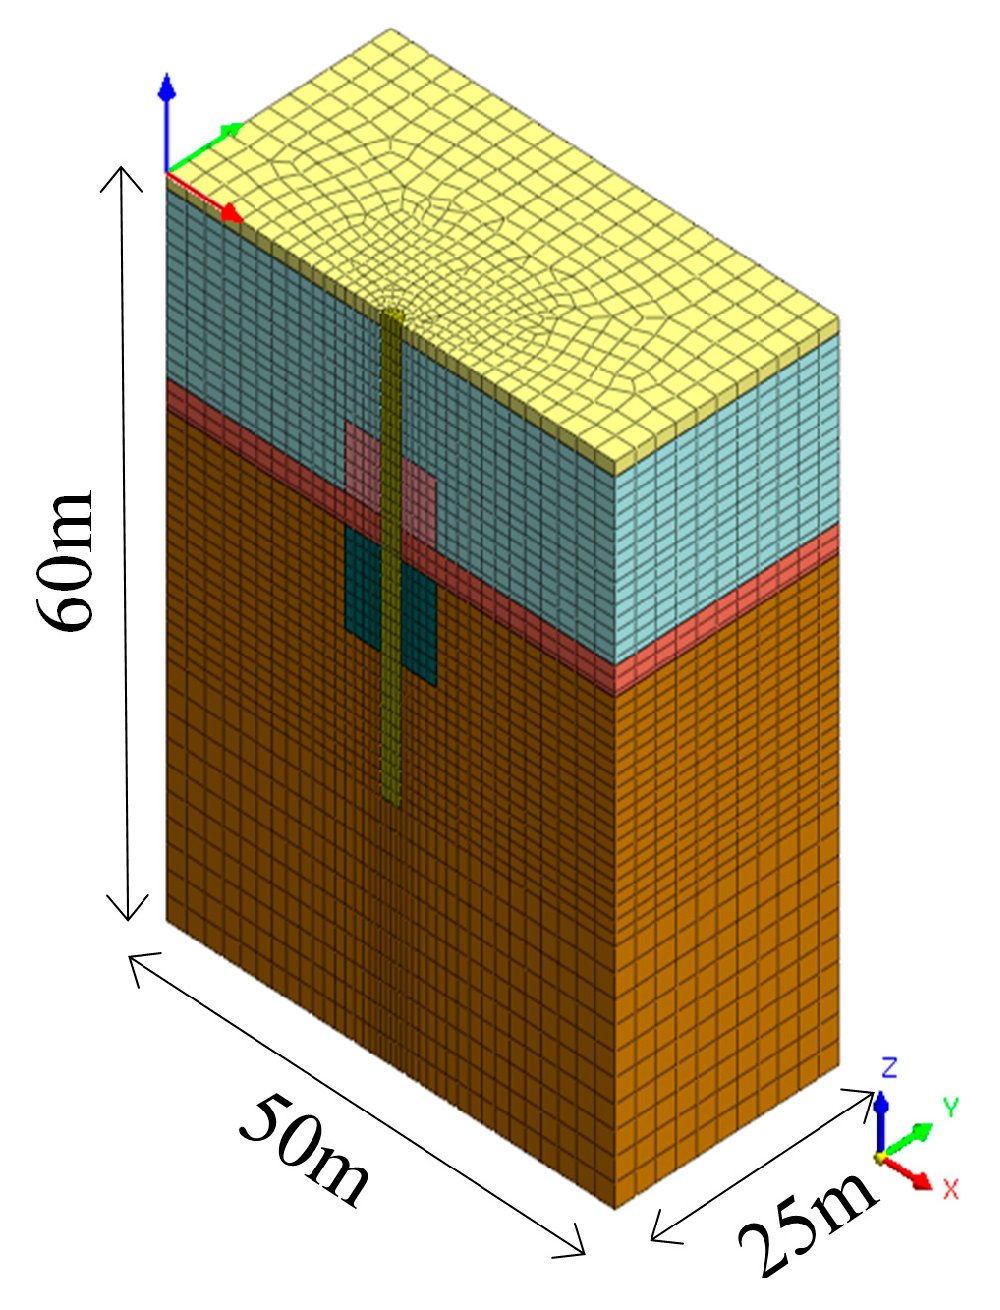
To ensure the accuracy of the numerical simulation, the model was constructed based on the test pile, incorporating parameters such as pile length, pile diameter, soil materials, soil layer thickness, karst cavity type, and material properties. The soil was assumed to follow the Mohr–Coulomb yield criterion and behave as a homogeneous elastoplastic body, while the pile was modeled as a linear elastic material. Goodman contact elements were adopted to account for sliding between materials with different properties or significant stiffness contrasts. The interface parameters were set with a cohesion of 16 kPa and an internal friction angle of 15° []. Although these parameters should vary with soil type and depth in practice, uniform values were used to simplify the model and ensure computational stability, while still capturing the overall load transfer mechanism of piles in karst conditions. The self-weight stress of the soil was also considered and incorporated as an initial condition in the analysis. The bottom and side boundaries of the model were constrained in the X, Y, and Z displacement directions, and a stepwise load was applied at the pile top.
For meshing, the rock and soil mass far from the pile were divided into layers at 3 m intervals in the X and Y directions. As the radial distance from the pile center decreased to within 10 times the pile diameter, the mesh was refined progressively from coarse to dense. The pile had a length of 37 m and a diameter of 2 m, with an elastic modulus of 30,000 MPa, a Poisson’s ratio of 0.2, and a unit weight of 24 kN/m3 []. A sectional view of the computational model for the in situ test pile is shown in Figure 3, while the physical and mechanical properties of the soil and rock layers are listed in Table 4.

Figure 3.
Computational model.
The working condition of the negative skin friction resistance range is studied. In order to study the negative skin friction resistance range of the pile foundation when backfilling, a method is adopted to treat karst caves at different heights. The numerical simulation is used to expand the research data. The pile length is 24 m; the pile diameter is 2.0 m. The karst cave is a cavity. The analysis scheme is shown in Table 6. In the numerical simulation, the axial force of the pile was determined by extracting the local resultant forces of individual pile elements, whereas unit side friction was derived from Equation (2). The FEM results are provided and discussed in detail Section 3.1.3 and Section 3.2.

Table 6.
Working conditions of different cave heights.
2.3. Orthogonal Test
An orthogonal experimental study is conducted to investigate the influence of pile length, pile diameter, elastic modulus of backfill material, karst cavity height, cavity span, and cavity position on the negative skin friction characteristics of the pile foundation. Both the maximum negative skin friction and the negative skin friction range proportion are taken as the peak values observed during the pile loading process. The six influencing factors, the pile diameter, pile length, backfill material elastic modulus, cavity height, cavity span, and cavity position, are assigned variation ranges. The steps are determined based on five levels for each parameter. The specific values of these factors are listed in Table 7. P is the cave position coefficient of cave is the ratio of the distance between cave bottom and pile bottom to pile length.

Table 7.
Level values of influencing factors on negative skin friction of bridge piles.
3. Results
3.1. Test Results
3.1.1. Analysis of the Axial Force of the Pile
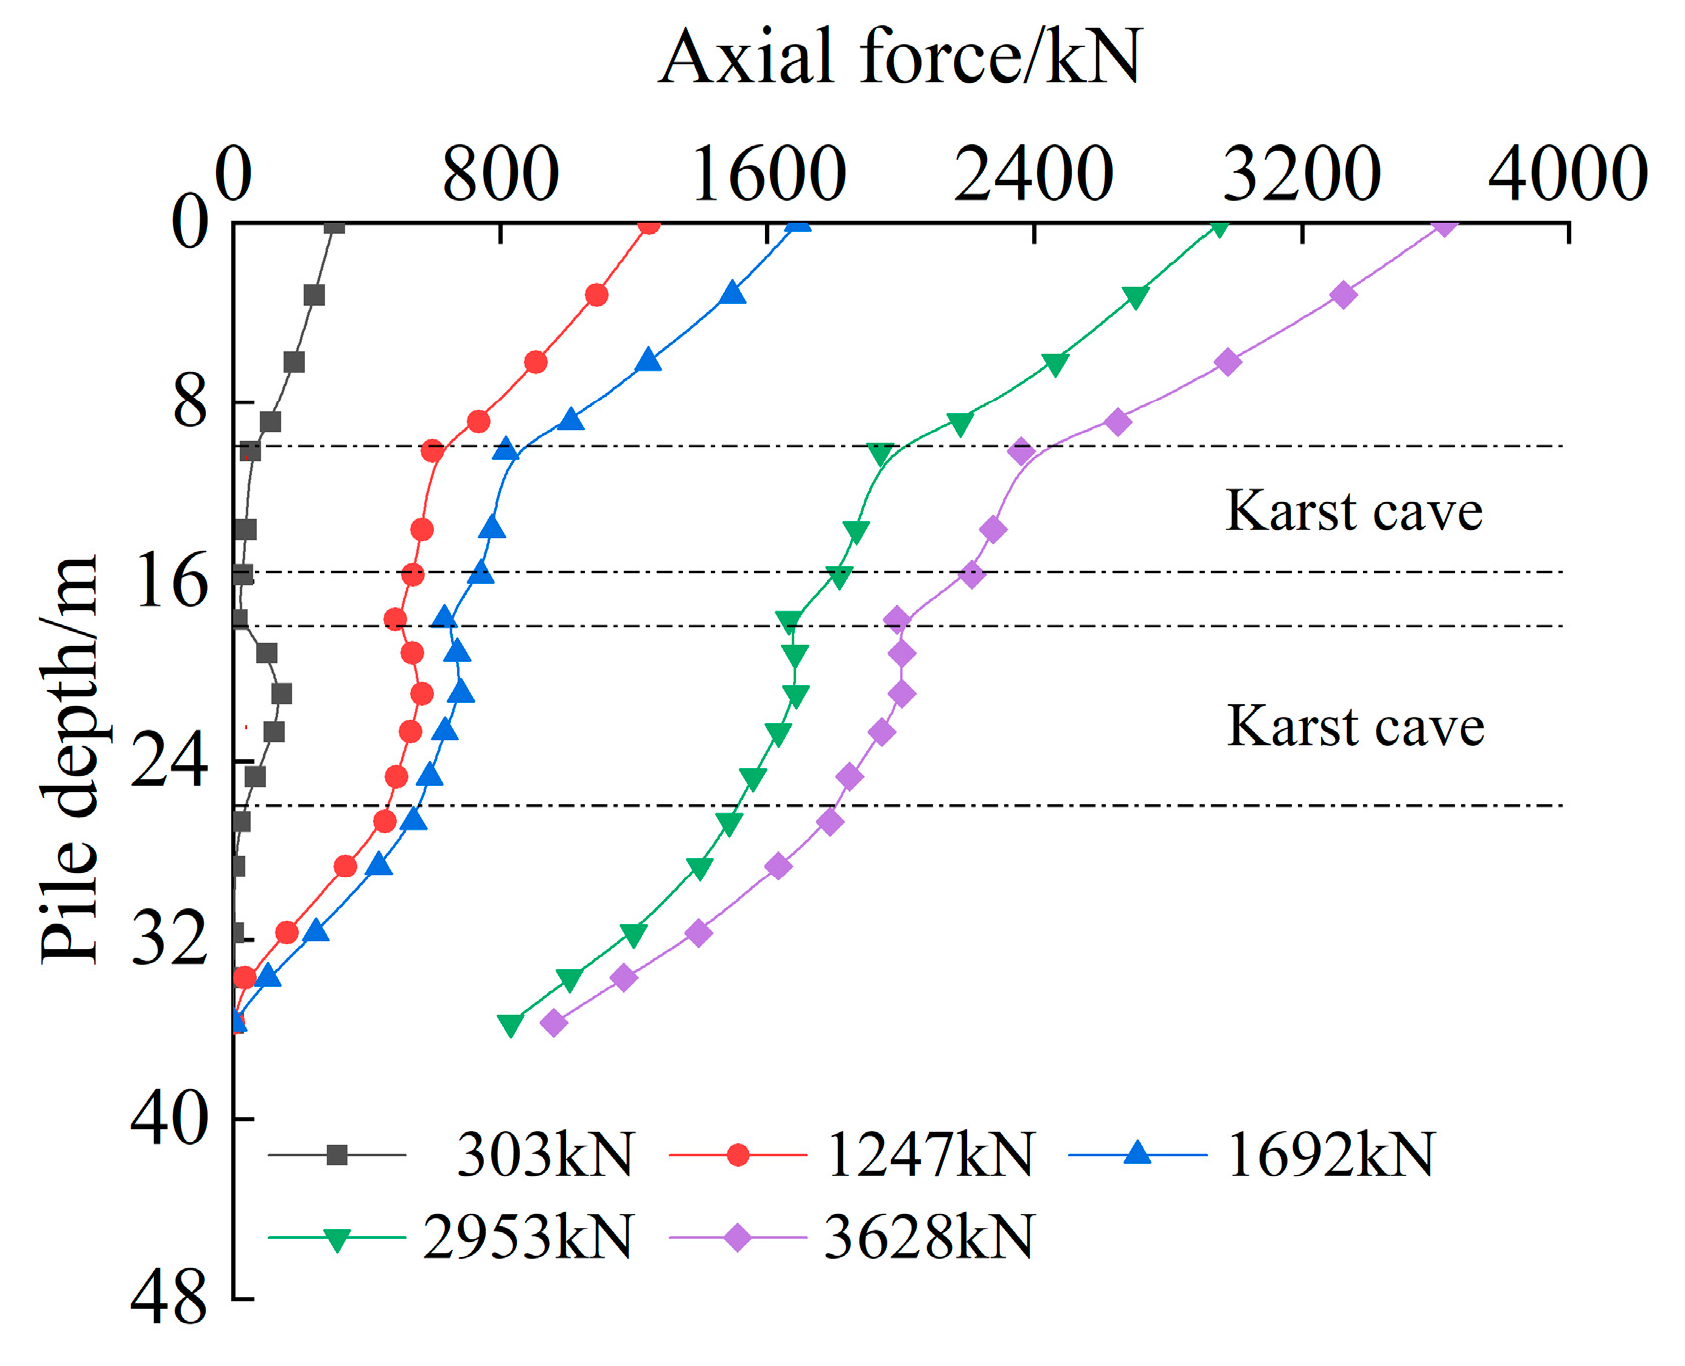
The distribution of the axial force along the Z11#-2 pile under various load conditions is shown in Figure 4.

Figure 4.
Distribution law of axial force of Z11#-2.
As shown in Figure 4, the axial force of the pile generally decreases as the pile depth increases under the same upper load on the pile foundation. However, within the range of the second layer of karst cavity (18.0–26.0 m), the axial force slightly increases and then decreases as the pile depth increases. The rate of decay of the axial force is faster within the bedrock layer. In the range of the first layer of karst cavity (10.0–15.6 m), the rate of decay of the axial force is slower. This is mainly because the surrounding soil and rock provide some lateral resistance to the pile foundation. As the pile depth increases, the lateral resistance continuously acts, gradually reducing the axial force. The first layer of karst cavity (10.0–15.6 m) is fully filled with limestone gravel and clay, which provides relatively low friction resistance to the pile foundation; thus, the axial force decay rate in this layer is slower. The second layer of karst cavity (18.0–26.0 m) is a large void, treated by the backfill method during construction. A significant amount of clay, gravel, cement, and other materials were backfilled. The backfill material undergoes consolidation settlement and settles relative to the downward displacement of the pile. The negative skin friction appears on the pile side surface. This leads to an increase in the axial force of the pile in the karst cavity region. As the pile depth increases, the difference between the settlement of the backfill material and the settlement of the pile foundation decreases. The rate of increase in the axial force slows. In the lower part of the karst cavity, the settlement deformation of the backfill material relative to the pile displacement becomes upward, providing upward friction to the pile foundation, causing the axial force to decrease.
Under different upper loads on the pile top, the distribution pattern of the axial force along the pile depth remains similar. The greater the upper load on the pile foundation, the faster the decay rate of the axial force of the pile. In the second layer of karst cavity (18.0–26.0 m), the increase in axial force becomes smaller under higher applied loads. It is because greater pile settlement under higher loads increases the relative displacement between the pile and the surrounding soil, thereby mobilizing more lateral resistance along the pile shaft. At the same time, as the applied load increases, the settlement of the pile foundation and that of the backfill material become more comparable, resulting in reduced negative skin friction. Consequently, the incremental increase in axial force within this cavity layer diminishes.
3.1.2. Analysis of the Unit Side Friction of the Pile
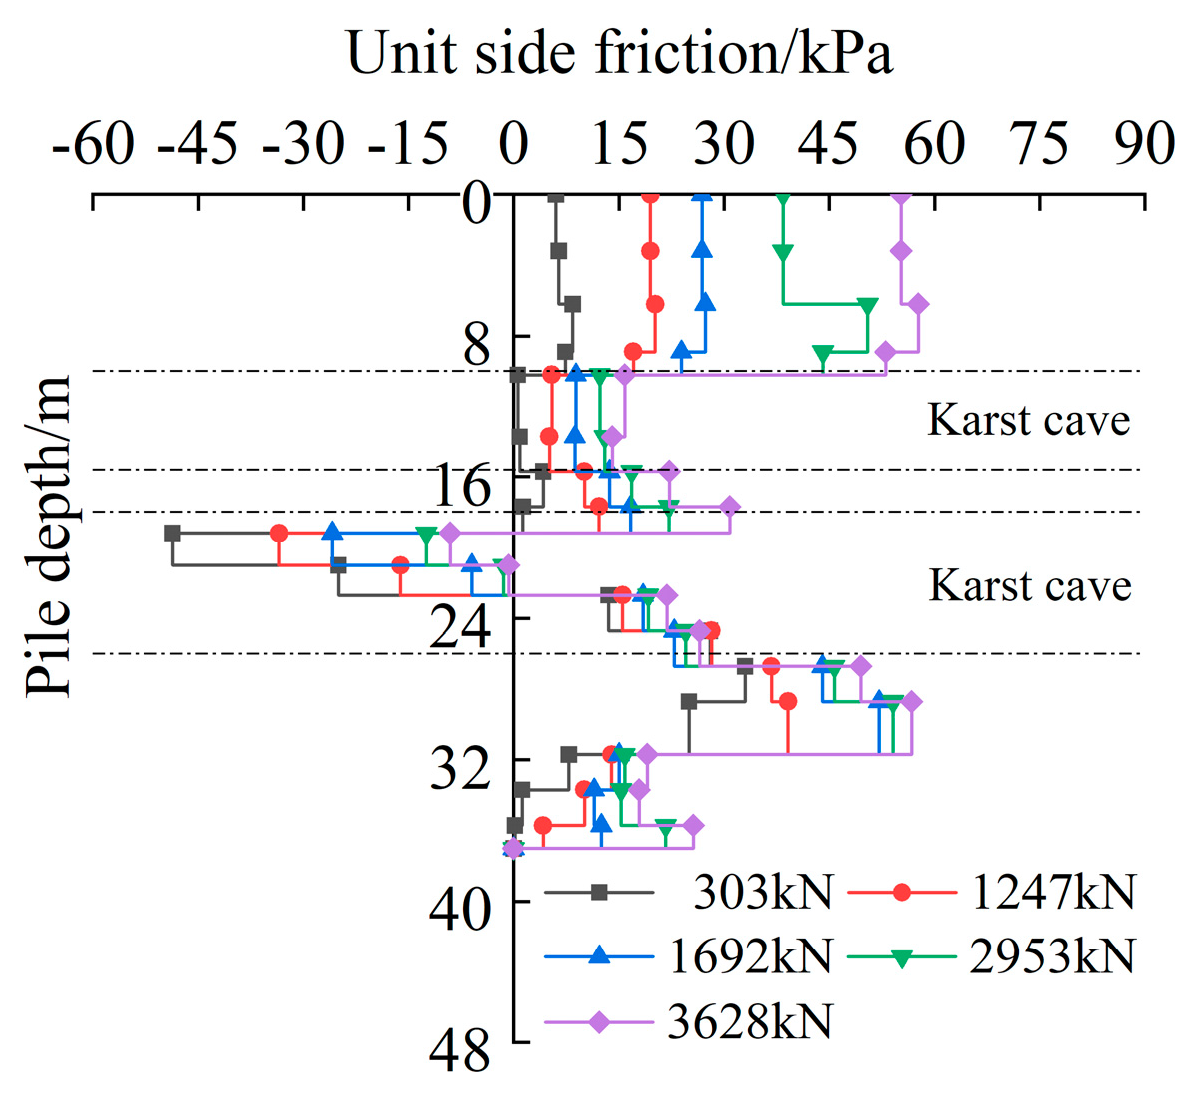
The distribution pattern of unit side friction along the Z11#-2 pile under different loading conditions is shown in Figure 5.

Figure 5.
Distribution law of unit side friction of Z11#-2.
As shown in Figure 5, the unit side friction of the pile in the same soil layer decreases with increasing pile depth under the same upper load. The negative side friction within the cavity also gradually decreases with increasing pile depth. Within the first layer of the karst cavity (10.0–15.6 m), the unit side friction of the pile decreases significantly. In the second layer of the karst cavity (18.0–26.0 m), the negative side friction develops, transitioning from negative to positive within the cavity. The primary reason for this behavior is that the first cavity (10.0–15.6 m) is fully filled with limestone breccia mixed with silty clay, which has low shear strength. When the relative displacement occurs between the pile and the surrounding soil, the filling material provides limited frictional resistance to the pile. The second cavity (18.0–26.0 m) is a large void that is treated using a backfilling method during construction. The clay, crushed stone, and cement were used as backfill, which underwent consolidation settlement. Since the settlement of the material exceeds that of the pile foundation, the negative side friction develops at the upper section of the karst cavity. As the pile depth increases, the differential settlement between the pile and the backfill material decreases downward, causing the unit side friction to transition from negative to positive. The relative displacement between the pile and the surrounding soil changes direction at the neutral plane. Above the neutral plane, the soil settles more than the pile, resulting in negative side friction, whereas below the neutral plane, the pile settles more than the soil, generating positive side friction. We sincerely thank the reviewer for this valuable suggestion.
An increase in the load applied at the pile top leads to a corresponding increase in the mobilized unit skin friction along the pile. At the same depth, the negative skin friction gradually decreases, whereas the positive skin friction within the cavity increases. This behavior can be attributed to the greater settlement deformation of the pile foundation under higher loads, which increases the relative displacement between the pile and the surrounding rock and soil. In the 18.0–22.7 m section of the second karst cavity, the settlement of the backfill material exceeds that of the pile foundation. As the applied vertical load increases, the differential settlement between the pile and the backfill material diminishes, thereby reducing the negative skin friction. In contrast, in the 22.7–26.0 m section of the cavity, the settlement of the pile foundation surpasses that of the backfill material. As the load increases, the relative displacement between them becomes larger, resulting in a gradual increase in positive skin friction.
3.1.3. Comparison Between Numerical Simulation and Field Test Results
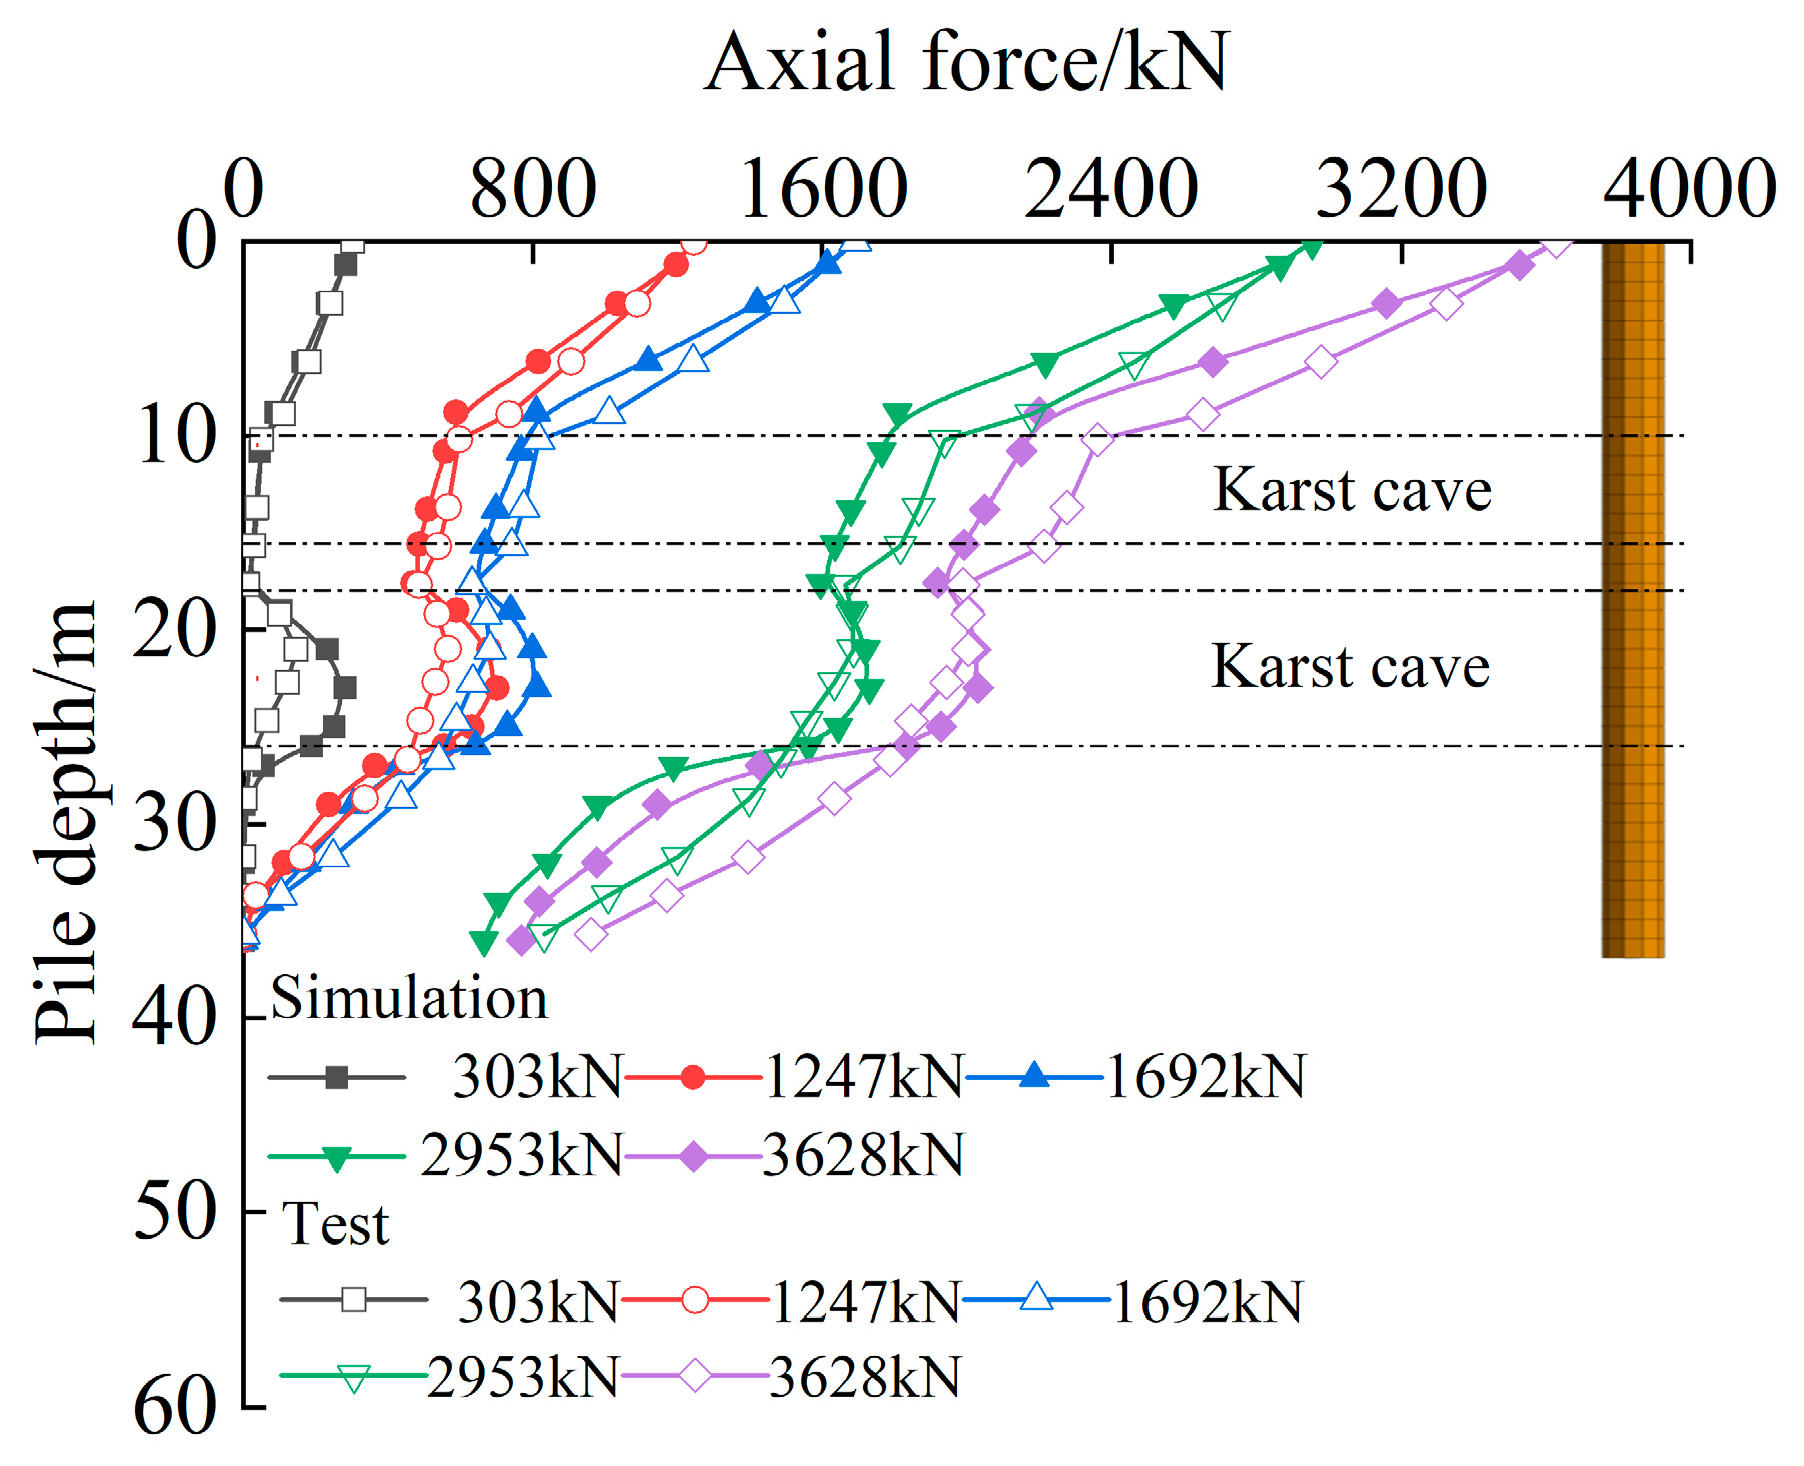
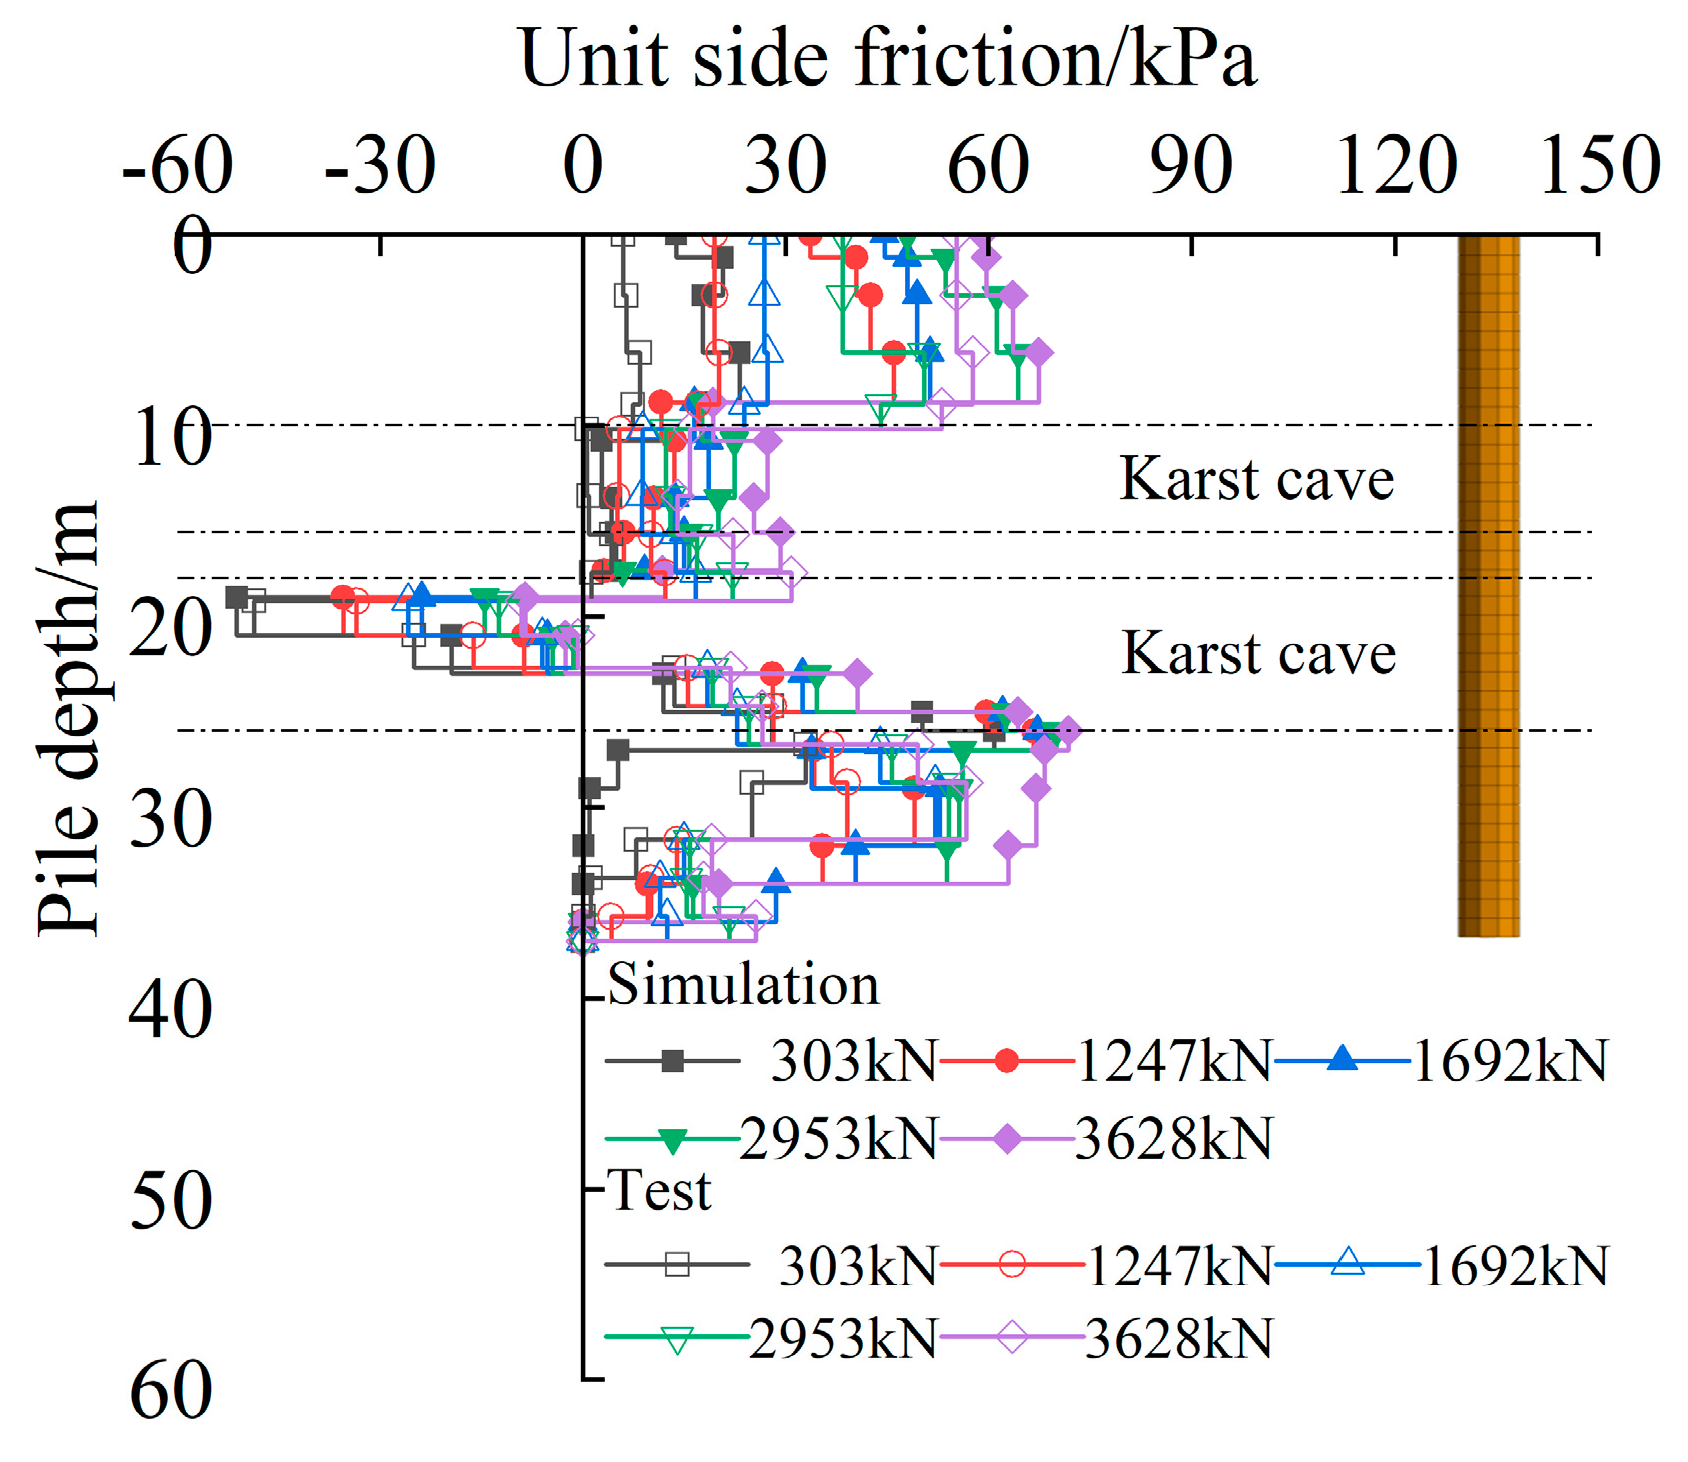
The comparison of the distribution of axial force and side friction resistance along the Z11#-2 pile in the numerical simulation and the field test results under various loading conditions is shown in Figure 6 and Figure 7, respectively. The depth of the neutral point under different load levels is shown in Table 8.

Figure 6.
Comparison of the axial force.

Figure 7.
Comparison of the unit side friction.

Table 8.
Depth of neutral points under different load levels.
As shown in Figure 6, the axial force distribution obtained from the numerical simulation aligns with the field test results. The axial force of the pile decreases with increasing pile depth, and the attenuation rate significantly increases within the bedrock layer under the same loading conditions. The axial force distribution along the pile depth follows a similar pattern under different loading conditions. As the applied load on the pile on the pile foundation increases, the attenuation rate of the axial force also increases. Within the 10.0–15.6 m range of the karst cave, the axial force of the pile decreases slightly. In the 18.0–26.0 m range of the karst cave, the axial force initially increases and then decreases with depth, with a more pronounced increase when the upper pile load is smaller. The increase in the axial force within the karst cave obtained from the numerical simulation is larger than that observed in the field test. Because the numerical simulation is based on an idealized model that is not affected by external conditions.
As shown in Figure 7, the unit side friction distribution obtained from the numerical simulation is generally consistent with the field test results. Within the 10.0–15.6 m range of the karst cavity, the unit side friction of the pile decreases significantly. In the 18.0–26.0 m range, the negative side friction occurs, transitioning from the negative to positive within the cavity. As the upper load on the pile foundation increases, the negative side friction at the same depth gradually decreases, while the positive side friction within the cavity increases. The maximum positive side friction occurs within the bedrock layer. Under the same loading conditions, the positive side friction in the same soil layer outside the karst cavity decreases with increasing pile depth. The negative skin friction within the cavity also decreases with increasing pile depth.
The maximum negative skin friction gradually decreases with the increasing load. The neutral point moves upward and the proportion of the negative skin friction decreases. The maximum negative skin friction in the numerical simulation is observed under a vertical load of 303 kN. At an applied load of 303 kN, the maximum negative skin friction predicted by the numerical simulation is 2.53 kPa different from the experimental value, representing a relative error of only 5.0%. At a load of 303kN, the neutral point remains relatively deep, while at 3628 kN, it has shifted upward by 1.12 m. The proportions of the negative skin friction are 53.00%, 43.50%, 41.00%, 40.38%, and 39.00%, respectively. It can be seen that the maximum negative skin friction obtained from the numerical simulation is generally larger than the field test results. This discrepancy arises because the numerical simulation is based on an idealized model that is not influenced by external conditions. During the initial settlement phase, under the same load, the instantaneous settlement of the backfill material in the field test is smaller than that in the numerical simulation. The maximum negative skin friction value in the simulation is higher. The use of numerical simulation results in pile foundation design will be biased toward safety.
3.2. Numerical Simulation Results
Analysis of the Negative Skin Friction Distribution of the Piles with Different Cave Heights
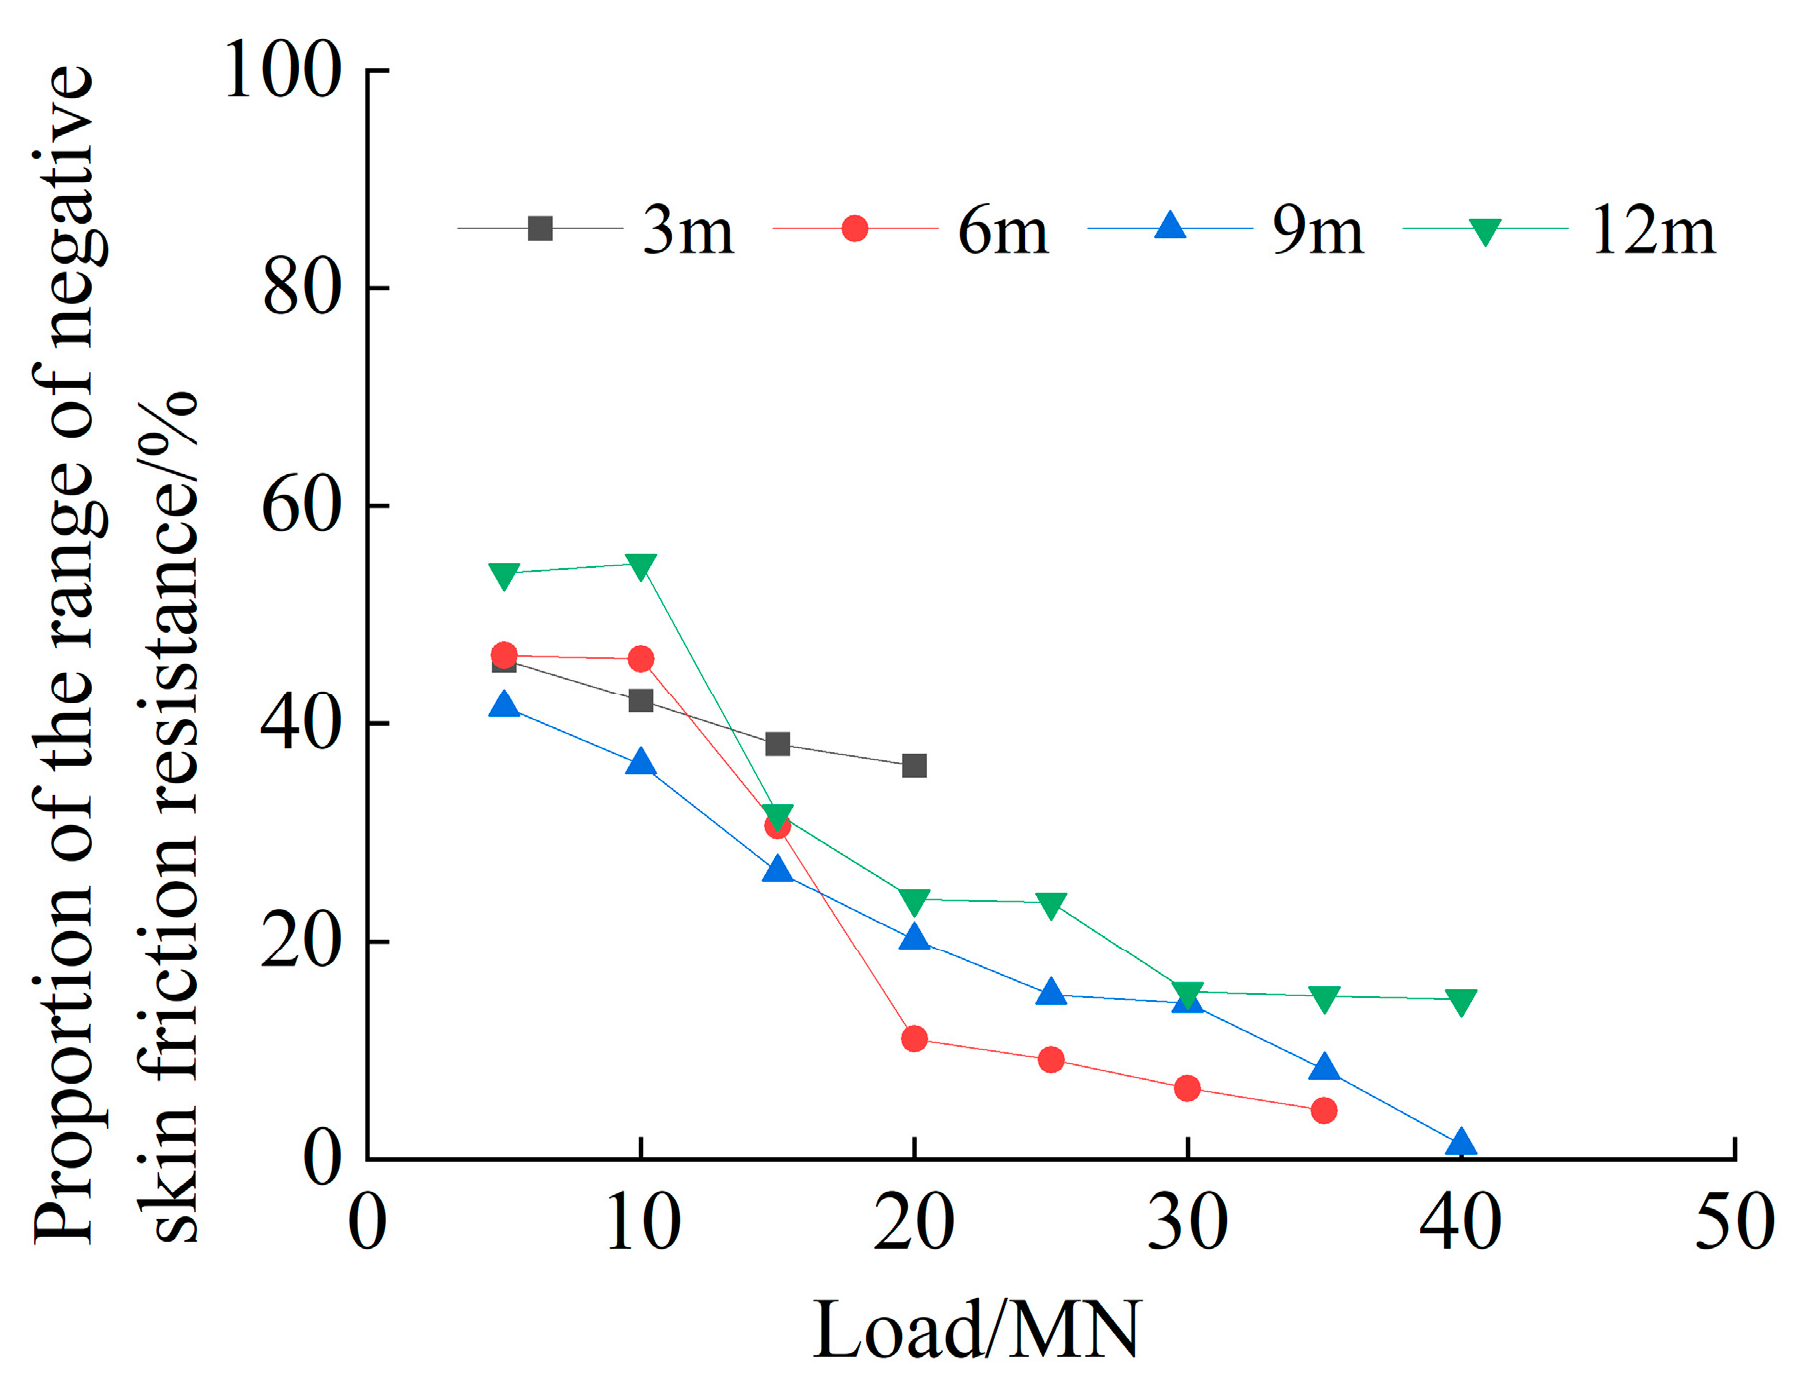
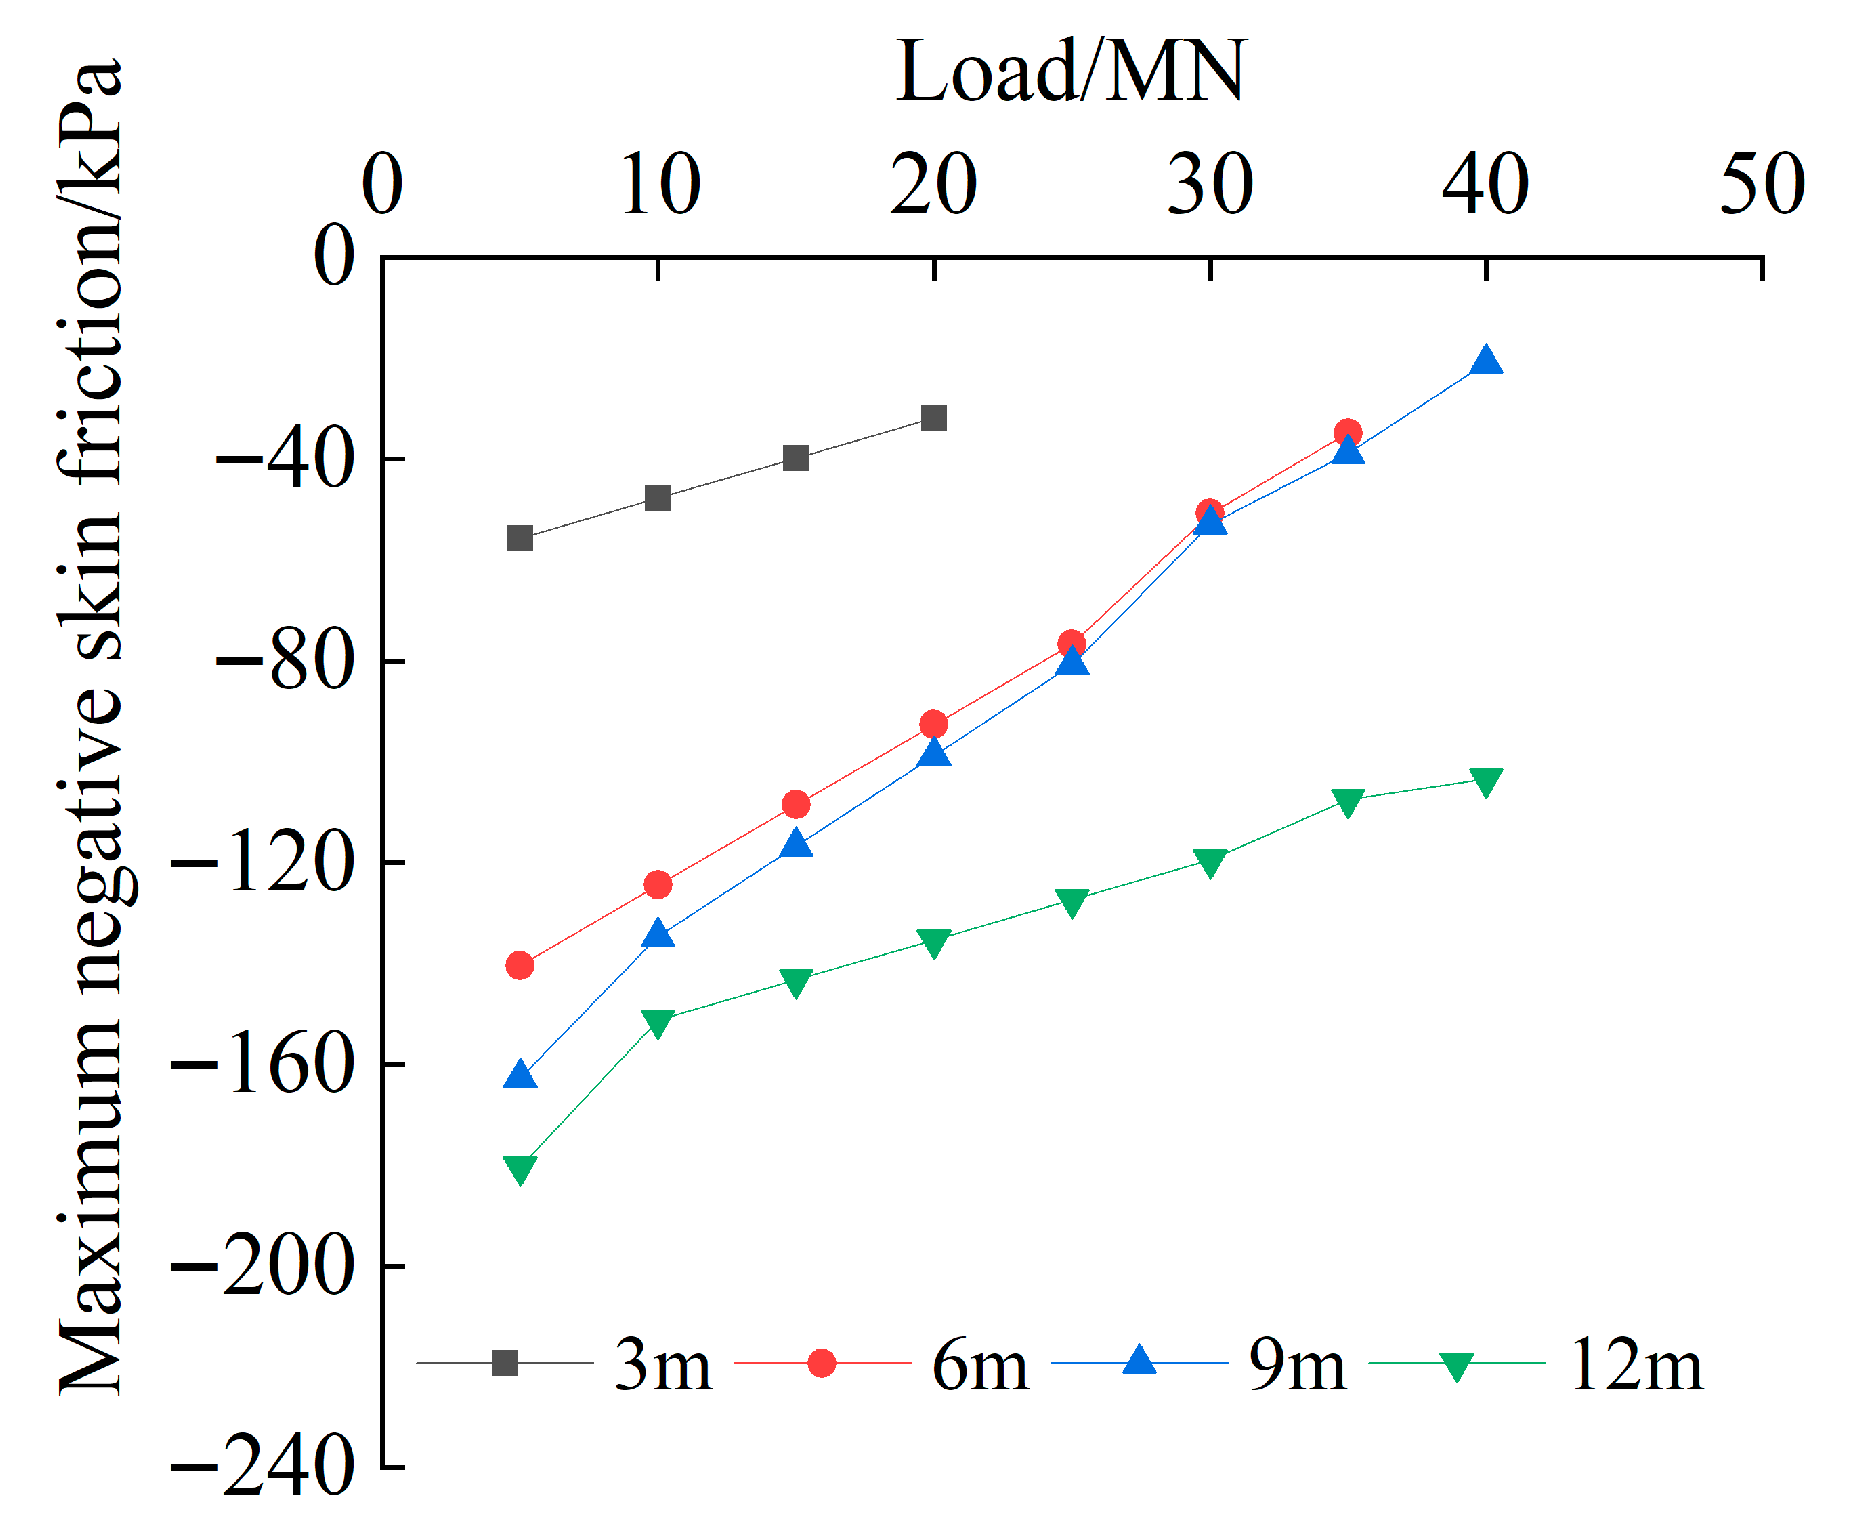
The range proportion of the negative skin friction resistance and the maximum value of the negative skin friction at different cave heights are shown in Figure 8 and Figure 9.

Figure 8.
The range proportion of negative skin friction.

Figure 9.
The maximum value of negative skin friction.
As shown in Figure 8 and Figure 9, the proportion of the negative skin friction zone increases with cavity height. In this study, the range of negative skin friction caused by backfilling materials and considered in bearing capacity calculations corresponds to the region above the neutral axis. As cavity height increases, the neutral point shifts downward and the maximum negative skin friction gradually increases. Conversely, with an increasing applied load, the proportion of the negative skin friction zone decreases, the neutral point rises, and the maximum negative skin friction decreases. When the load reaches 5 MN, both the proportion of the negative skin friction zone and the maximum negative skin friction reach their highest values.
For cavity heights of 3 m, 6 m, 9 m, and 12 m, the corresponding proportions of the negative skin friction zone at the pile’s ultimate bearing capacity are 0%, 10.61%, 21.38%, and 27.14%, respectively, while the maximum negative skin friction values are 0 kPa, 89.36 kPa, 92.22 kPa, and 138.61 kPa, respectively. This trend can be explained by the increase in backfill settlement with greater cavity height, which amplifies the differential settlement between the pile foundation and the backfill material. As a result, the location where their relative displacement is zero moves downward, expanding the proportion of the negative skin friction zone and lowering the neutral point. In contrast, as the applied load increases, pile settlement grows and the differential settlement between the pile and the backfill decreases. This reduces the relative displacement, causing the zero-displacement point to shift upward, which in turn decreases both the proportion of the negative skin friction zone and the maximum negative skin friction.
When the karst cavity height ranges from 3 m to 12 m, it is recommended that the bearing capacity of pile foundations be calculated by considering negative skin friction within ranges of 0H, 0.106H, 0.214H, and 0.271H (where H is the cavity height) below the top surface of the karst cavity. In designing pile bearing capacity, the lateral resistance of the pile within the cavity should be disregarded, while the adverse effects of the maximum negative skin friction in this range should be taken into account.
3.3. Orthogonal Test Results
Analysis of the Parameter Sensitivity
For each influencing factor, the corresponding level values are selected from Table 7, while certain values that do not align with actual working conditions are excluded. Finite element models are established for the 21 different combinations listed in Table 8 to analyze the negative skin friction range proportion and maximum negative skin friction. The computed results are presented in Table 9. The factors A to F represent pile length, pile diameter, elastic modulus of backfill material, karst cave height, cave span, and cave position coefficient, respectively. The axial force at different simulated pile positions can be obtained by extracting the planar resultant force. The unit pile side friction can be calculated by Equation (2). By analyzing the distribution of resistance on the pile, the range of negative skin friction on the pile side and the maximum negative skin friction can be determined in different influencing factors.

Table 9.
Calculated values of orthogonal test.
According to the range analysis principle, the greater the range of the experimental values, the stronger the influence of the factor on the negative skin friction range proportion and the maximum negative skin friction. As shown in Table 9, the influence degree of each factor on two parameters of the negative skin friction is determined. The average values and range values of the negative skin friction range proportion for different levels of each factor are presented in Table 10, while the maximum values of negative skin friction are shown in Table 11. The range value represents the difference between the maximum and minimum average responses of each factor at different levels, which was used to evaluate the relative influence of each factor on the model output. Based on this method, the factors were then ranked according to their sensitivity.

Table 10.
Average percentage and range of negative skin friction range.

Table 11.
Maximum average value and range of negative skin friction.
As shown in Table 10, the range values of the experimental results corresponding to pile length, pile diameter, the elastic modulus of the backfill material, cavity height, cavity span, and cavity location are 4.6, 16.9, 23.0, 24.7, 9.6, and 1.1, respectively. Therefore, the sensitivity degree of different factors to the range of negative skin friction is ranked from the largest to the smallest as cavity height, the elastic modulus of backfill material, pile diameter, cavity span, pile length, and cavity location. As shown in Table 11, the range values of the experimental results corresponding to pile length, pile diameter, elastic modulus of backfill material, cavity height, cavity span, and cavity location are 13.419, 46.533, 65.120, 70.610, 27.747, and 5.615, respectively. Therefore, the sensitivity of different factors to the maximum negative skin friction is ranked from the largest to the smallest as cavity height, the elastic modulus of backfill material, pile diameter, cavity span, pile length, and cavity location. The influence of cave height and elastic modulus of backfill material should be emphasized in calculating the negative skin friction resistance of pile of bridge in karst areas.
3.4. Calculation Formula for the Negative Skin Friction in Piles with Cavity Treated by the Backfilling Method
Calculation Formula of the Negative Skin Friction Range Proportion
Equations (3) and (6) are the standard forms of linear regression equations. Using the orthogonal experimental data in Table 9, Equations (5) and (8) were derived by applying the least-squares method.
The empirical formula method is used to regress the negative skin friction range proportion, yielding the following Equation (3).
where, l is pile length; D is pile diameter; Es is elastic modulus of backfill soil; H is cavity height; S is the biggest cavity span; P is cavity location; C is comprehensive influence factor of the negative skin friction range proportion; and a1, b1, f1, g1, i1, and j1 are influence coefficients of the negative skin friction range proportion of each factor.
Taking the logarithm on both sides of Equation (4) can be obtained. Y1 is lnα and C1 is ln C.
According to the orthogonal test data in Table 9, the correlation coefficient of the regression Equation (4) is obtained by using linear regression method, as shown in Table 12.

Table 12.
The correlation coefficient of the regression Equation (4).
The formula for the negative skin friction range ratio can be obtained as Equation (5). The R-squared value is 0.995. The cavity location is identified as an insignificant factor.
The calculation formula of the maximum negative skin friction is established. The empirical formula method is used to regress the maximum negative skin friction, yielding the formula for the maximum negative skin friction as Equation (6).
where K is comprehensive influence factor of the maximum negative skin friction; a2, b2, f2, g2, i2, and j2 are the influence coefficients of the maximum negative skin friction of each factor.
Taking the logarithm on both sides of Equation (6), Equation (7) can be obtained. Y2 is ln qnmax and C2 is ln K.
According to the orthogonal test data in Table 7, the correlation coefficient of the regression Equation (7) is obtained using a linear regression method, as shown in Table 13.

Table 13.
The correlation coefficient of the regression Equation (7).
The formula for maximum negative skin friction is obtained as Equation (8). The R-squared value is 0.996. The cavity location is identified as an insignificant factor.
3.5. Engineering Verification
In order to determine the feasibility of the formulas for the negative skin friction range ratio and the maximum negative skin friction, the Z11#2 pile is selected for verification. The calculated values, engineering measured values, and numerical simulation results are compared and analyzed.
The Z11#2 pile is an end-bearing pile with a diameter of 2 m and a length of 37 m. As shown in Figure 1, the first cavity layer, located between 10.0 m and 15.6 m of the designed pile length, is filled with limestone angular gravel mixed with silty clay. It is light brown, wet, soft-plastic, loose, and a fully filled cavity. The second cavity layer, located between 18.0 m and 24.0 m of the designed pile length, is an unfilled cavity, and backfilling was used during construction. The cavity has a width of 9 m. The elastic modulus of the backfill material is 6.8 MPa. The physical and mechanical properties of rock and soil layers are shown in Table 4.
The unit side friction of the pile within the cavity range was calculated using the formulas derived in this paper.
The negative skin friction range ratio is as follows.
The maximum negative skin friction is as follows.
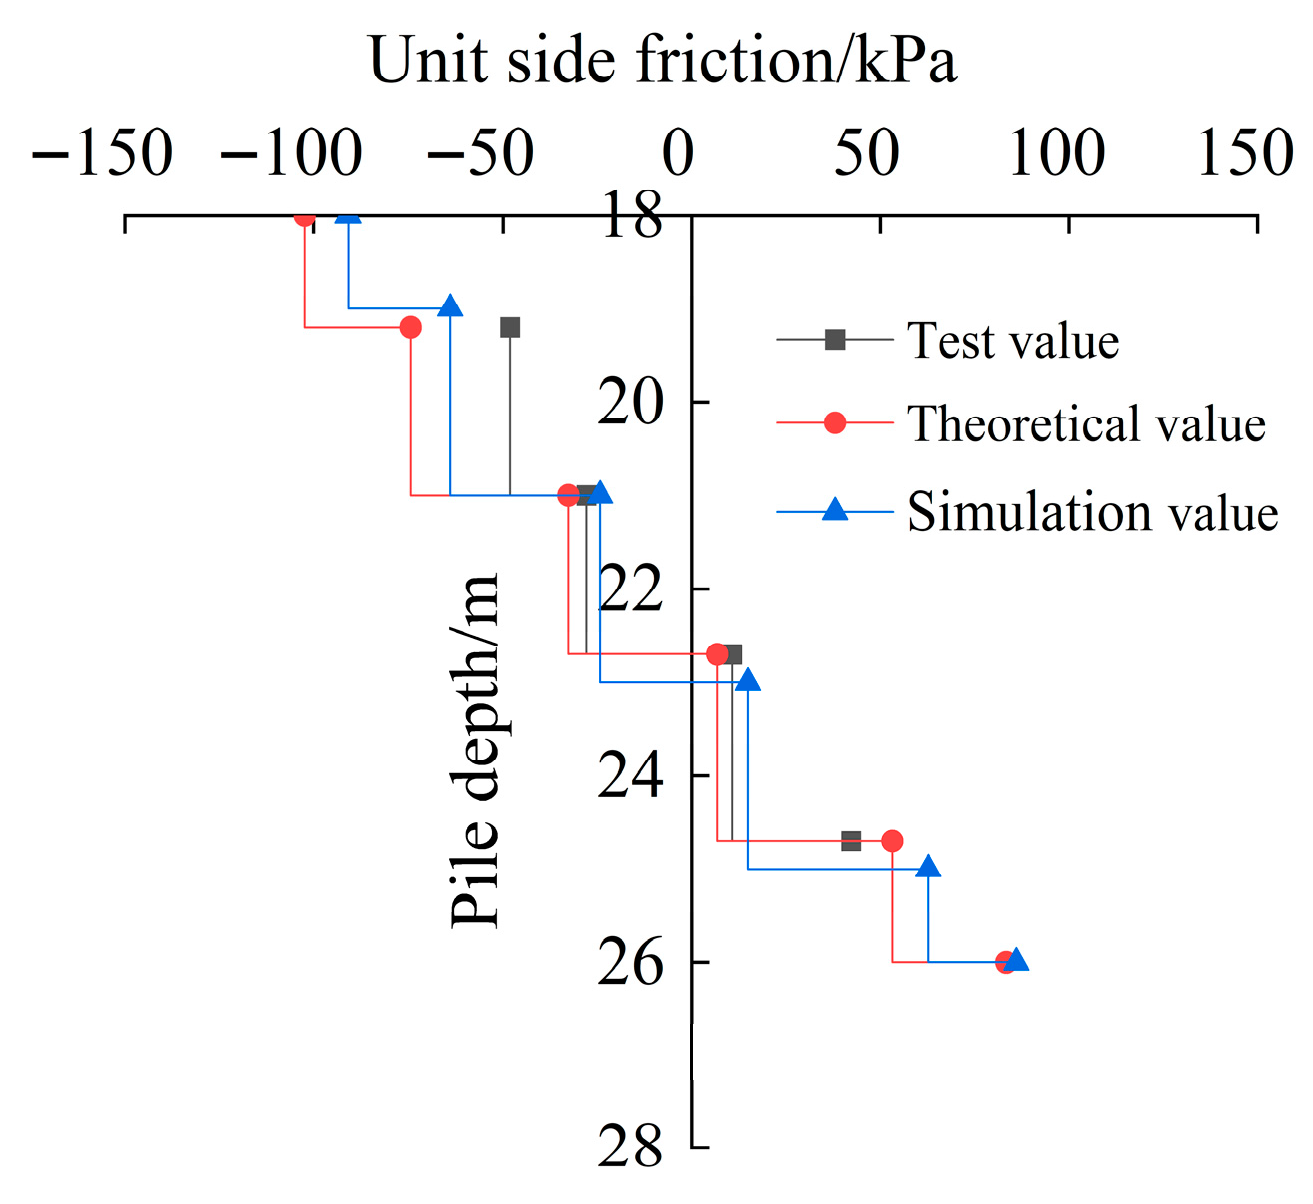
The variation curve of pile side friction within the cavern range is shown in Figure 10.

Figure 10.
The variation curve of unit side friction within the cavern range.
As shown in Figure 8, the variation patterns of the pile side friction within the cavern range obtained from field tests, numerical simulations, and theoretical calculations are consistent. The negative skin friction of the pile within the cavern range decreases as the pile depth increases. In the range of 18–21 m, the pile side friction is negative, and in the range of 22.7–26 m, the pile side frictional resistance becomes positive. The theoretical value of the negative skin friction range ratio calculated using the theoretical calculation is 55.1%, while the test value is 51.3%, with a relative error of only 7.4%. Using the formula for the maximum negative skin friction, the theoretical maximum negative skin friction is 102.317 kPa, while the numerical simulation value is 91.00 kPa. The maximum negative skin friction calculated theoretically (102.317 kPa) is 11.1% greater than the numerical result (91.00 kPa), indicating that the theoretical approach provides a conservative estimate suitable for design purposes. Due to the limitations of the test, the strain gauges are placed at a depth of 19.2 m on the pile, and the measured maximum negative skin friction corresponds to the value at that depth. The field measurement yielded a smaller value (48.12 kPa), which reflects the stress state at the instrumented depth rather than the absolute maximum, due to the strain gauges not being placed exactly at the cavern roof. While the measured value cannot capture the peak friction, it still supports the general trend of load transfer. This limitation has been clarified, and future tests will optimize the instrumentation layout to obtain peak values for more precise comparison. It can be concluded that the theoretical negative skin friction value is greater than the numerical simulation values, and the theoretical value of the negative skin friction range ratio is slightly larger than numerical simulation values.
4. Discussion
The calculation method for negative skin friction proposed in this paper demonstrates variation patterns that are consistent with the field results. The calculated values and ranges of negative skin friction are slightly higher, thereby providing a safer design basis for bridge pile foundations in karst areas. This method offers a useful reference for the design of pile foundations under the backfilling treatment of karst cavities.
In this study, single representative values of interface cohesion (16 kPa) and friction angle (15°) were adopted. In practice, these parameters should vary with soil type and depth. This simplification is acknowledged as a limitation, and future work will incorporate depth-dependent and soil-specific interface parameters to refine the model. Inevitably, the numerical model also involved other simplified assumptions. These may not fully capture the complexity of karst conditions. Nevertheless, these assumptions were necessary to ensure computational feasibility and to emphasize the key factors influencing negative skin friction. The close agreement between model predictions and field test results supports the reliability of the proposed approach within the defined scope.
5. Conclusions
This study, based on the practical engineering of bridge pile foundations in the karst region of the Pu-Yan Expressway, investigates the calculation method for the negative skin friction of the piles in caverns treated with the backfilling method in karst areas. The study combines field tests and numerical simulations, leading to the following conclusions:
- (1)
- The generation of pile side negative skin friction in karst areas is influenced by the type of cave. When the cavern is a fully filled type, it provides relatively small positive friction to the pile foundation. When the cavern is a non-filled type. The filling material undergoes greater settlement after backfilling, generating negative skin friction on the pile surface. The type of cavern must be considered in pile foundation design.
- (2)
- According to the negative skin friction range and the maximum negative skin friction of different cave height, it is suggested that the bearing capacity of pile foundations could be calculated according to negative skin friction in the range of 0 H, 0.106 H, 0.214 H, and 0.271 H (H is cave height) below the top surface of karst cave when the height of karst cave is 3 m–12 m. The research results can provide references for the design of drilling piles embedded in rocky soils.
- (3)
- The sensitivity of different factors to the maximum negative skin friction is ranked from the largest to the smallest as cavity height, the elastic modulus of backfill material, pile diameter, cavity span, pile length, and cavity location. When calculating the negative skin friction of bridge pile foundations in karst areas, special attention should be given to the influence of cavern height and the elastic modulus of backfill material.
- (4)
- The paper provides a calculation formula for the negative skin friction of bridge pile foundations treated with the backfilling method in karst areas. The formulas for calculating the maximum negative skin friction and the negative skin friction range ratio are verified in practical engineering, showing that the calculated variation patterns of negative skin friction align with the actual results, with a relative error of only 7.4%.
- (5)
- Future research could extend this study by considering different karst cave geometries, backfilling materials, and treatment techniques, as well as by incorporating long-term monitoring of negative skin friction under varying geological conditions. Moreover, the further refinement and validation of the proposed calculation methods through large-scale field tests would provide more comprehensive insights and enhance their applicability in practical engineering.
Author Contributions
H.C. carried out the tests and numerical simulations, researched the date and wrote the manuscript, Z.F. and X.W. designed the experiments, Y.L. contributed to the figures and tests. All authors have read and agreed to the published version of the manuscript.
Funding
This research was funded by Transport Department of Fujian Province of China, grant number No. 2018Y032.
Data Availability Statement
The original contributions presented in this study are included in the article. Further inquiries can be directed to the corresponding author.
Conflicts of Interest
The authors declare no conflicts of interest.
References
- Liu, C.F.; Chen, Z.L.; Yun, Z.; Zhao, Y.; Liu, J.; Yi, J.T.; Qi, D.K. Torsional dynamic response of a pile embedded in layered unsaturated viscoelastic soils. J. Build. Eng. 2025, 100, 111773. [Google Scholar] [CrossRef]
- Chen, H.Y.; Feng, Z.J.; Wu, M.; Zhou, G.M.; Chen, L.; Zhang, C. Study on the vertical bearing performances of piles on karst cave. Sci. Rep. 2023, 13, 4944. [Google Scholar] [CrossRef]
- Liang, J.W.; Zhang, G.L.; Ba, Z.N.; Liang, J.L.; Zhao, H. Seismic response analysis of high-rise frame-core tube building on fluid-saturated soil considering soil-pile-structure interaction. J. Build. Eng. 2023, 63, 105563. [Google Scholar] [CrossRef]
- Chen, H.Y.; Feng, Z.J.; Xia, C.M.; Liu, X.Z.; Wang, Y.R. Bearing characteristic centrifugal test and bearing capacity calculation method of pile passing through karst cave. Chin. J. Undergr. Space Eng. 2023, 19, 856–866. [Google Scholar]
- Feng, Z.J.; Chen, H.Y.; Bai, S.F.; Cai, J.; Xia, C.M.; Yuan, C.F.; Huang, Z.Q. Experimental study on load transfer mechanism of highway bridge pile foundation passing through huge karst cave. Chin. J. Rock Mech. Eng. 2023, 42, 3700–3711. [Google Scholar] [CrossRef]
- Jiang, W.J.; Yan, D.Y.; Wang, M.M.; Li, Y.; Chen, Y.W.; Jiang, C.L.; Chen, Z. Load-settlement law and calculation research of large-scale karst cave backfill-based pile foundation. Chin. J. Geomech. Eng. 2017, 39, 67–70. [Google Scholar]
- Zhao, M.H.; Zhu, Z.R.; Huang, M.H.; Yang, C.W.; Xu, Z. Calculation of safe thickness of the roof in karst areas considering the side resistance of rock-socketed piles. Rock Soil Mech. 2018, 39, 4201–4210. [Google Scholar] [CrossRef]
- Kiyosumi, M.; Kusakabe, O.; Ohuchi, M. Model tests and analyses of bearing capacity of strip footing on stiff ground with voids. J. Geotech. Geoenviron. Eng. 2011, 137, 363–375. [Google Scholar] [CrossRef]
- Dong, Y.X.; Feng, Z.J.; Hao, Y.M.; Yao, H.S.; Zhang, X.W.; Xie, F.G. Pile bearing capacity test and reasonable rock-socketed depth in karst areas. J. Traf. Transp. Eng. 2018, 18, 27–36. [Google Scholar] [CrossRef]
- Yin, K.L.; Hao, S. Numerical simulation study on the influence of karst on pile bearing capacity in Wuhan area. Hydrogeol. Eng. Geol. 2015, 42, 96–102. [Google Scholar] [CrossRef]
- Huang, M.; Zhang, B.; Chen, F.; Huang, Z.; Zhang, X. Numerical calculation of load transfer characteristics of pile foundations in beaded karst caves. J. Eng. Geol. 2017, 25, 1574–1582. [Google Scholar] [CrossRef]
- Xie, S. Influence of underlying karst on pile bearing characteristics based on finite difference method. J. Yangtze River Sci. Res. Inst. China 2019, 36, 77–81. [Google Scholar]
- Wang, P.S.; Zhang, P.Y.; Hu, W. Seismic response analysis of rock-socketed piles in karst areas under vertical loads. Appl. Sci. 2023, 13, 784. [Google Scholar] [CrossRef]
- Hei, X.D.; Zhang, M.B.; Sun, H.F.; Wang, B.; Zhang, Q.S.; Zhu, Q.X.; Zhu, W.Q.; Lv, S.F. Research on the design of pile foundation and analysis of engineering problems in a karst area. Build. Sci. 2023, 39, 165–173. [Google Scholar] [CrossRef]
- Johannessen, I.J.; Bjerrum, L. Measurements of the compression of a steel pile to rock due to settlements of the surrounding clay. In Proceedings of the 6th International Conference on Soil Mechanics and Foundation Engineering, Montreal, QC, Canada, 8–15 September 1965; pp. 261–264. [Google Scholar] [CrossRef]
- JTG 3363-2019; Compilation Group of People’s Republic of China. Code for Design of Ground Base and Building Foundation. China Architecture and Building Press: Beijing, China, 2019.
- Chen, H.Y.; Feng, Z.J.; Cai, J.; Xia, C.M.; Dong, J.S. Centrifugal test on vertical bearing characteristics of pile foundation affected by beaded caverns. J. Harbin Inst. Technol. 2023, 55, 83–92. [Google Scholar]
- Kong, G.Q.; Yang, Q.; Yang, G.; Yang, Q.L. Research progress on pile shaft pull-down force and pile top settlement caused by negative skin friction. J. Hohai Univ. (Nat. Sci.) 2010, 38, 411–417. [Google Scholar] [CrossRef]
- Architectural Institute of Japan. Recommendations for Design of Building Foundations; Maruzen Publishing Co., Ltd.: Tokyo, Japan, 2001. [Google Scholar]
- Huang, M.; Zhang, B.Q.; Chen, F.Q.; Xu, D.X. A new progressive load transfer model of pile-soil interaction based on disturbed state concept. Rock Soil Mech. 2017, 38, 167–172. [Google Scholar] [CrossRef]
- Zhou, G.Y.; Gan, F.; Zhen, G.; Zhou, H.Z.; Wang, H.; Bi, Q.; Liu, B.; Zhang, Y.Y. Calculation method of negative skin friction for end-bearing piles based on soil deformation. Rock Soil Mech. 2025, 46, 930–942. [Google Scholar] [CrossRef]
- Chen, H.Y.; Feng, Z.J.; Bai, S.F.; Dong, J.S.; Xia, C.M.; Cai, J. Experimental study on load transfer mechanism of bridge pile foundation passing through karst cave. Rock Soil Mech. 2023, 44, 1405–1415. [Google Scholar] [CrossRef]
- Qiu, M.B.; Liu, J.L.; Qiu, R.D.; Gao, W.S. Vertical additional stress coefficient of a single pile based on Mindlin solution. Chin. J. Geotech. Eng. 2014, 47, 130–137. [Google Scholar] [CrossRef]
- Mao, J.Q.; Jiang, Y. Settlement calculation method of group pile foundation based on single pile static load test results. J. China Railw. Soc. 2017, 1, 97–103. [Google Scholar] [CrossRef]
- Zhao, M.H.; Lei, Y.; Liu, X.M. Calculation of pile negative skin friction based on shear displacement method. J. Hunan Univ. (Nat. Sci.) 2013, 35, 1–7. [Google Scholar]
- Niu, F.S.; Xu, J.C.; Ma, K. Field experimental study of transmitted characteristics of pile foundation under vertical load in loess slope. Rock Soil Mech. 2014, 35, 1899–1906. [Google Scholar] [CrossRef]
- Mortazavi, B.H.; Mostafaei, H.; Shahbodagh, B.; Vahab, M.; Hashemolhosseini, H.; Khoshghalb, A. Effect of Sample Preparation on the Reliability of Large-Scale Physical Modeling in Geotechnical Systems: A Case Study. Geotech. Geol. Eng. 2024, 42, 2693–2707. [Google Scholar] [CrossRef]
Disclaimer/Publisher’s Note: The statements, opinions and data contained in all publications are solely those of the individual author(s) and contributor(s) and not of MDPI and/or the editor(s). MDPI and/or the editor(s) disclaim responsibility for any injury to people or property resulting from any ideas, methods, instructions or products referred to in the content. |
© 2025 by the authors. Licensee MDPI, Basel, Switzerland. This article is an open access article distributed under the terms and conditions of the Creative Commons Attribution (CC BY) license (https://creativecommons.org/licenses/by/4.0/).