Abstract
Global climate change and rapid urbanization have intensified urban heat risks, particularly in cities such as Jinan that face pronounced heat-related environmental challenges. This study takes Jinan’s main urban area as a case example, integrating the Local Climate Zone (LCZ) framework with the Hazard–Exposure–Vulnerability–Adaptability (HEVA) model to develop multi-temporal heat risk maps. The results indicate the following: (1) High-risk zones are primarily concentrated in the densely built urban core, whereas low-risk areas are mostly located in peripheral green spaces, water bodies, and forested regions. (2) Heat risk shows clear diurnal patterns, peaking between noon and early afternoon and expanding outward from the city center. (3) LCZ6 (open low-rise), despite its theoretical advantage for ventilation, exhibits unexpectedly high levels of heat hazard, exposure, and vulnerability. (4) SHAP-based analysis identifies land surface temperature (LST), floor area ratio (FAR), impervious surface area ratio (ISA), housing value, building coverage ratio (BCR), and the distribution of cooling facilities as the most influential drivers of heat risk. These findings offer a scientific foundation for developing multi-scale, climate-resilient urban planning strategies in Jinan and hold significant practical value for improving urban resilience to extreme heat events.
1. Introduction
The combined effects of global climate change and rapid urbanization are reshaping the thermal environment of cities []. According to the IPCC’s Sixth Assessment Report, global average temperatures have increased by approximately 0.99 °C since the Industrial Revolution, while temperatures in China have risen by 1.38 °C, significantly outpacing the global average []. This warming trend is particularly pronounced in urban areas, where changes in land cover—such as increased building density and reduced natural surfaces—combined with intensified human-induced heat emissions, have led to a continuous intensification of the urban heat island (UHI) effect. In the summer of 2022, eastern China experienced the strongest and longest-lasting extreme heatwave since 1961, with high temperatures persisting for 79 days in the middle and lower reaches of the Yangtze River []. This heatwave caused catastrophic impacts on people’s lives and socio-economic development. Against this backdrop, urban heat risk has evolved from a climatological issue to a comprehensive challenge encompassing public health, energy security, and urban sustainability [,,,,,].
To address the growing urban heat risk, the primary objective is to establish a scientifically grounded and operational heat risk assessment system [,,,]. In recent years, the widespread availability of open-source geospatial data has driven significant advancements in heat risk assessment methods. The “Clinton Risk Triangle” model, which is widely adopted in the academic community, offers clear logic and strong operational feasibility [,,,,]. This model consists of three key risk indices: hazard–exposure–vulnerability (HEV). Hazard refers to the potential intensity of the thermal environment that affects human health, with high temperatures typically used as an indicator. Exposure refers to the population at risk, with population density commonly used as a parameter. Vulnerability focuses on populations that are particularly sensitive to heat-related disasters, such as the elderly, children, low-income residents, and other vulnerable groups. In recent years, most studies have combined LST datasets with static population data to construct heat risk assessment frameworks, with evaluations conducted at global, national, metropolitan, and urban scales. For instance, Tuholske et al. (2021) estimated daily exposure to extreme heat for urban populations across 13,115 residential areas between 1983 and 2016 []. Wu et al. (2024) integrated multi-source remote sensing and socioeconomic data to map heat risk in the Yangtze River Delta region [], while Zhou et al. (2021) examined Beijing’s low-density areas by associating heat risk mapping with urban form parameters from an LCZ perspective []. Despite these advances, fine-scale heat risk assessments at the urban-district level remain limited, largely due to the scarcity of datasets with high spatial and temporal resolution. With recent progress in satellite imaging, high-resolution LST products, particularly those from ECOSTRESS, have seen growing application. A key advantage of ECOSTRESS is its ability to capture multiple observations during both daytime and nighttime, thereby reflecting the diurnal dynamics of urban surface temperatures. At the same time, reliance on census-based population data fails to reflect the reality of urban mobility and activity patterns. Emerging data sources such as mobile phone signaling records can bridge this gap by providing dynamic, near–real-time insights into population distribution. Several studies have highlighted this potential: for example, Chang et al. (2025) employed ECOSTRESS data to analyze thermal anisotropy across different LCZs and their diurnal and seasonal variations [], while Chen et al. (2022) combined high-temperature intensity and frequency assessments with mobile phone positioning data to evaluate diurnal thermal exposure risks in Beijing []. Building on this foundation, some studies have introduced “adaptability” as an independent dimension, leading to the development of the HEVA framework []. This framework emphasizes the positive role of proactive interventions, such as urban design and public policy, in mitigating risks. The HEVA framework has been increasingly applied in various heat risk assessments [,,,].
Jinan City experiences exceptionally severe summer heat, making it a representative case for urban thermal environment research. According to data from the Jinan Meteorological Bureau, the city’s annual mean temperature in 2024 was 15.5 °C, which is 1.4 °C above the long-term average of 14.1 °C and sets a new historical record. In the same year, Jinan experienced 35 high-temperature days (daily maximum ≥ 35 °C), including a consecutive 12-day heatwave in June, underscoring the city’s pronounced vulnerability to extreme summer conditions. Geographically, Jinan is characterized by hilly terrain in the south, located at the northern foothills of the Mount Tai range, and flat terrain in the north, forming part of the North China Plain. This “higher in the south and lower in the north” topography restricts north–south airflow, and under weak wind conditions further hampers the dispersion of hot air, thereby intensifying and prolonging extreme summer heat within the urban area. (Figure 1). Additionally, rapid urbanization has led to the dense development of high-rise buildings, exacerbating the urban heat island effect. However, most existing studies have focused on macro-scale patterns of Jinan’s UHI [,,,], while relatively few have examined the spatial differentiation mechanisms of heat risk within the city. This gap prevents the identification of relationships with internal urban structures at finer scales, making it difficult to link thermal risks to specific urban planning measures, thus limiting the effectiveness of climate-adaptive strategies.
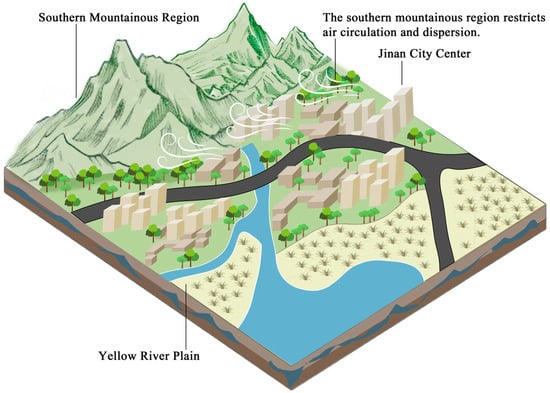
Figure 1.
Schematic diagram of terrain ventilation mechanism.
The Local Climate Zones framework offers a novel approach to address these challenges. By dividing the city into distinct climate zones, the LCZ framework accurately reflects the climatic variations within urban areas. The LCZ framework classifies areas based on factors such as land surface type, building density, and vegetation coverage, providing a standardized approach for urban climate research []. In recent years, the LCZ framework has proven advantageous in analyzing thermal environments, heat island effects, and their spatial distributions, particularly in fine-scale studies. This approach overcomes the limitations of traditional climate classification methods in meso- and micro-scale research [,,,,,,,]. For example, Wang et al. (2024) integrated multi-source data with random forest algorithms, mathematical statistics, ring-layer analysis, and Pearson correlation analysis to investigate seasonal variations in the spatiotemporal heterogeneity and driving mechanisms of surface thermal environments []. Sharmin et al. (2024) examined the spatiotemporal dynamics of LST, NDVI, and UHI in relation to LCZs in Cardiff, finding that high-density building-type LCZs exhibited a stronger SUHI effect []. Similarly, Xu et al. (2025) combined multi-source data, including LST and vegetation indices, with Spearman correlation analysis and boosted regression tree models to evaluate the influence of three-dimensional landscape indicators on LST across Shanghai’s LCZs []. More recently, some scholars have extended this perspective to heat risk assessment within the LCZ framework, emphasizing how urban form and land cover characteristics can amplify or mitigate thermal risks. For example, Ma et al. (2023) used multi-source big data and machine learning techniques to generate an LCZ map of Changzhou and conducted a city-wide thermal health risk assessment []. Lan et al. (2025) subdivided LCZs into street blocks and used SHAP to analyze the driving mechanisms of thermal risks in different LCZs []. Chen et al. (2025) applied the LCZ framework to assess thermal vulnerability over 15 years in Foshan, Guangdong, examining the impact of landscape indicators on thermal vulnerability []. Chang et al. (2025) studied the thermal anisotropy patterns and their diurnal and seasonal variations in different LCZs in Arizona []. These studies demonstrate the applicability and robustness of the LCZ framework in urban thermal environment research and provide a strong basis for extending its application to fine-scale heat risk assessments. Despite these advances, most studies remain focused on static urban spatial analysis, often overlooking the spatiotemporal heterogeneity of “people” as the core carriers of thermal risk.
Given this gap, the present study uses Jinan’s urban core as a case to advance LCZ-based heat risk research, addressing the limitations of static data and the neglect of dynamic analysis. By integrating multi-temporal land surface temperature (LST) data from ECOSTRESS with hourly population data from Baidu Huiyan, we establish an HEVA-based heat risk assessment framework. The key innovation lies in moving beyond traditional static assessments by constructing multi-temporal heat risk maps that capture fine-scale intraday variations. This approach provides a more precise understanding of the spatiotemporal differentiation mechanisms of heat risk at the human–land interaction interface. Specifically, this study (1) maps the spatial distribution of LCZs and reveals the dynamic characteristics of heat risk in Jinan’s urban core; (2) quantifies disparities in heat risk across LCZ types and identifies dominant driving factors using the SHAP model; and (3) proposes climate-adaptive planning strategies at macro, meso, and micro levels based on LCZ differentiation and dynamic risk assessment. The findings provide scientific evidence for mitigating the urban heat island effect, improving urban livability, and strengthening climate resilience in Jinan, while also establishing a replicable paradigm for multidimensional urban heat risk research.
2. Study Area and Data
2.1. Study Area
Jinan, the capital city of Shandong Province, serves as the province’s political, economic, cultural, and educational hub (Figure 2). Located in the mid-latitude zone, it experiences a temperate monsoon climate. The city’s topography slopes from south to north, with low mountains and hills in the south, a foothill plain in the central area, and the Yellow River alluvial plain in the north [].
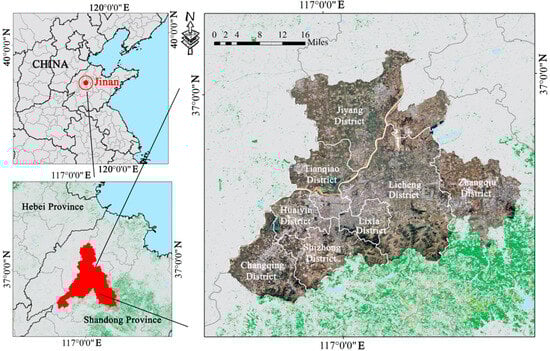
Figure 2.
Location of the study area (made by the author).
Jinan administers 10 districts and 2 counties. This study focuses on the main urban area as defined in the Jinan City Master Plan for Territorial Space (2021–2035) [], which includes the districts of Lixia, Shizhong, Huaiyin, Tianqiao, and Licheng, as well as the clusters of Changqing, Zhangqiu, Jiyang, and the New and Old Growth Drivers Transition Pilot Zone on the north bank of the Yellow River. This area covers approximately 2014 km2, accounting for 20.6% of the city’s total area, yet accommodates 54.9% of its population and generates 65.3% of its economic output []. Its built environment is characterized by high intensity, high density, and rapid expansion, making it a hotspot for the urban heat island (UHI) phenomenon, which constitutes a critical consideration in evaluating heat-related risks.
2.2. Data Collection and Preprocessing and Their Supporting Role in Research
2.2.1. Data Collection and Preprocessing
The foundational data for this study were drawn from five categories: satellite imagery, land use data, building outline data, point of interest data, and socioeconomic data (Table 1). Owing to substantial differences in sources and resolutions, all datasets were resampled to a standardized spatial resolution of 30 m. In addition, they were uniformly projected and converted into raster format using the WGS_1984_UTM_Zone_49N coordinate system to ensure the consistency and validity of the assessment results.

Table 1.
Data sources used in this study.
2.2.2. The Role of Data in Supporting Research
- (1)
- Landsat-8 OLI-TIRS data: Landsat-8 imagery (30 m resolution) was obtained from the USGS EarthExplorer platform. For this study, clear-sky imagery from 12 June 2024, was selected. Two adjacent scenes (path/row 122/34 and 122/35) were mosaicked to cover the main urban area of Jinan. Preprocessing included radiometric calibration, atmospheric correction, and cropping. Key indicators were derived as follows:Land surface temperature (LST): extracted from the thermal infrared band after atmospheric correction, serving as the core heat hazard indicator.Normalized Difference Vegetation Index (NDVI) and fractional vegetation cover (FVC): used as positive indicators of thermal adaptation. FVC was calculated from NDVI using a pixel-based binary model. Normalized Difference Water Index (NDWI): employed to identify water body distribution, representing thermal adaptation capacity.
- (2)
- WorldPop population data: Static population data (100 m resolution) were obtained from the WorldPop project. These data were resampled to 30 m to align with other datasets and used as the baseline for calculating population density in the heat exposure dimension.
- (3)
- Housing value data: Housing transaction records for Jinan City were collected from Lianjia.com, yielding 6775 entries with geographic coordinates and average prices. Kriging interpolation was applied to convert these point-based data into a continuous 30 m raster surface, serving as a socioeconomic indicator of adaptive capacity.
- (4)
- Land use data: Land use data (10 m resolution) were sourced from the Zenodo platform. After resampling to 30 m, impervious surface classes were extracted to calculate the impervious surface area (ISA), defined as the proportion of impervious pixels within each grid cell.
- (5)
- Building contour data: High-precision vector building footprints were obtained from the AutoNavi Open Platform. Using ArcGIS, four built-environment indicators related to heat exposure were derived: building coverage ratio (BCR), floor area ratio (FAR), sky view factor (SVF), and surface roughness (SR).
- (6)
- Point of interest (POI) data: POI data were collected via the AutoNavi Maps API, yielding 17,562 records with location, name, and category attributes. Medical facilities (e.g., hospitals and community health service centers) and cooling-related facilities (e.g., parks and large shopping malls) were extracted. Kernel density estimation was then used to derive medical facility density and cooling facility density, both representing adaptive capacity.
- (7)
- Dynamic population data (Baidu Huiyan): To capture diurnal variations in heat exposure, Baidu Huiyan mobility data were employed in place of static census-based population data. Rapid urbanization and economic activities have produced substantial daily shifts, with populations concentrating in city centers during the day and dispersing at night. Baidu Huiyan data, derived from the location information of over one billion Baidu service users (e.g., maps and search), offer extensive spatial coverage, high penetration, and reliable temporal resolution, making them particularly suitable for dynamic population mapping [,,]. A key advantage of the Baidu Huiyan dataset is its high temporal resolution, which provides hourly population distributions for the detailed characterization of migration and aggregation patterns associated with heat avoidance behavior. Unlike traditional static census data, it captures the dynamic spatial behavior of urban residents and offers time-specific population information that is essential for heat risk assessment. In this study, hourly Baidu Huiyan data from 15 June 2024—a representative summer heatwave day in Jinan—were used. These data effectively reflect intraday population dynamics under extreme heat conditions and are well-suited for analyzing the temporal characteristics of heat exposure.
- (8)
- ECOSTRESS LST data: Hourly LST data were obtained from ECOSTRESS products, retrieved using a temperature–emissivity separation algorithm applied to five thermal infrared bands []. The satellite revisit cycle ranges from three to five days depending on latitude. Because continuous LST observations for a single day were unavailable, images from multiple dates between June and August of 2019–2024 were selected, each representing a specific time segment of summer heat patterns. Although temporal variability cannot be fully eliminated, the consistency of diurnal patterns and the stable seasonal UHI effect in Jinan allow for a reliable representation of spatial heat patterns. To minimize atmospheric interference, only images acquired under clear skies and calm or light winds were used. Dates were selected to be as close as possible to reduce temporal bias, resulting in nine images (Table 2).
Table 2. Selected ECOSTRESS LST datasets.
2.2.3. Data Validation
For NDVI, NDWI, and FVC derived from Landsat 8 imagery, as well as surface roughness, sky view factor, floor area ratio, building coverage, and other indicators from building footprint data, spatial overlays and visual comparisons with Sentinel-2 imagery from corresponding periods were conducted to verify spatial plausibility. Moreover, the reliability of datasets such as WorldPop [], POI [], ECOSTRESS [], and land use data [] has been validated in previous studies. Collectively, these datasets are of high quality and provide a robust foundation for subsequent analyses.
3. Methodology
The research process consists of four main steps (Figure 3). First, the World Urban Database and Access Portal Tools (WUDAPT) workflow is applied to classify Local Climate Zones (LCZs) for Jinan’s main urban area, using Google Earth in conjunction with the System for Automated Geoscientific Analyses (SAGA) to generate an LCZ map. Second, within the HEVA (Hazard–Exposure–Vulnerability–Adaptation) framework, both a static heat risk map and a diurnal variation heat risk map are produced. Third, the LCZ-based analysis examines the spatial distribution of heat risk, its components, and their diurnal dynamics across LCZ types. Shapley Additive exPlanations (SHAP) analysis is then employed to rank the contributions of heat risk indicators within different LCZs. Finally, targeted strategies and recommendations are proposed from macro-, meso-, and micro-scale perspectives.
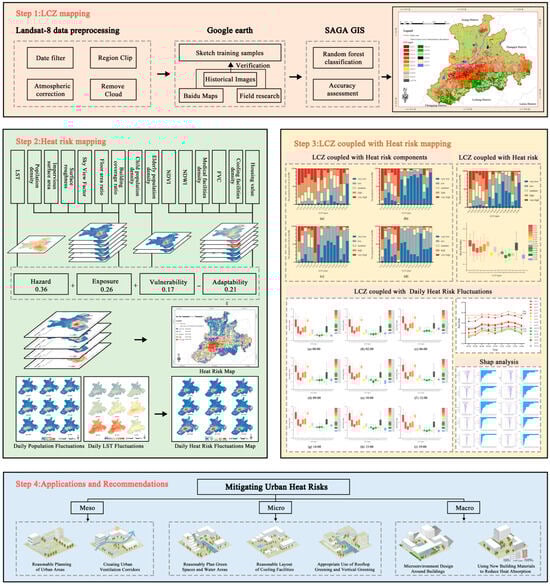
Figure 3.
Study framework and workflow (made by the author).
3.1. LCZ Classification
The LCZ classification system divides urban and natural landscapes into 17 categories—10 built types and 7 natural types—at the local scale [] (Figure 4). Each LCZ type is associated with parameters relevant to urban climate, covering four aspects: urban form, land cover, surface materials, and human activity. LCZs are widely used in urban planning, building energy analysis, carbon emission studies, outdoor thermal comfort assessment, and UHI research. In this study, LCZ classification follows the WUDAPT protocol proposed by Bechtel et al. []. The workflow includes the following:
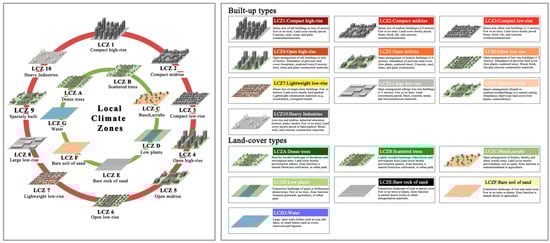
Figure 4.
LCZ types and definitions, modified from Stewart and Oke [].
- (1)
- Data acquisition and preprocessing: Landsat 8 OLI_TIRS imagery for the study area was downloaded from the USGS EarthExplorer platform. The imagery included spectral bands (B1–B7) suitable for land cover classification. Preprocessing involved radiometric calibration, atmospheric correction, coordinate projection transformation, and image mosaicking/cropping.
- (2)
- Training sample delineation: Training areas (TAs) were delineated using the Level 0 template from the WUDAPT platform. Polygons were digitized in Google Earth based on the spatial characteristics of each LCZ classification. The surface attributes of TAs were verified against Baidu Street View, historical imagery, and field surveys. For each LCZ, a minimum of 20–30 TAs was delineated, with additional samples allocated according to stratified sampling principles. Due to limited sample availability and difficulties in defining some LCZ types in Jinan’s main urban district, the study area was ultimately classified into 16 categories, comprising 10 built-up types (LCZ 1–10) and 6 natural cover types (LCZ A–B, 7–G).
- (3)
- LCZ classification in SAGA GIS: Preprocessed Landsat 8 imagery and TA data were imported into SAGA GIS, which provides remote sensing image extraction and spatial analysis capabilities. Spectral information was extracted, and the Random Forest supervised classification algorithm was applied to generate the LCZ map of the study area.
- (4)
- Classification validation and refinement: The resulting LCZ classification was exported as a KML file and cross-checked in Google Earth. Discrepancies between classification results and observed land cover were corrected by selecting additional TAs and reapplying the classification process until satisfactory consistency with actual conditions was achieved.
- (5)
- Accuracy assessment: Independent TAs were delineated following the procedure in step (2). A confusion matrix was constructed to compare the classified LCZ map with validation TAs. The overall accuracy, users’ accuracy, producers’ accuracy, and the Kappa coefficient were then calculated to evaluate classification performance.
3.2. Heat Risk Assessment
3.2.1. Indicator Selection
Most existing studies adopt the HEV (Hazard–Exposure–Vulnerability) framework proposed in the IPCC Fifth Assessment Report. This framework has since been extended through the inclusion of “adaptation” as an additional dimension, forming the HEVA (Hazard–Exposure–Vulnerability–Adaptation) system, which provides a more comprehensive basis for thermal risk evaluation.
In this study, a heat risk assessment model is established under the HEVA framework, comprising 15 secondary indicators across four primary dimensions (Table 3). (1) Hazard refers to the intensity of heat stress within the urban thermal environment, with land surface temperature (LST) serving as the primary indicator. (2) Exposure describes the likelihood of individuals or urban systems being affected by heat, incorporating parameters such as the population density, impervious surface area ratio (ISA), surface roughness (SR), sky view factor (SVF), floor area ratio (FAR), and building coverage ratio (BCR). (3) Vulnerability captures the sensitivity of populations to heat, particularly for children and elderly groups who are more susceptible to thermal stress. (4) Adaptation represents the ability of individuals or urban systems to cope with heat risk, reflected in environmental indicators such as the Normalized Difference Vegetation Index (NDVI), Normalized Difference Water Index (NDWI), and fractional vegetation cover (FVC), as well as in infrastructural and socioeconomic indicators including the density of medical and cooling facilities and housing value.
Table 3.
Selected indicators and their significance.
The directional attributes (+/–) indicate the expected relationship between each indicator and heat risk, where (+) denotes a positive contribution (increasing risk) and (–) denotes a negative contribution (reducing risk). To enable comparability across indicators with different scales and to prevent negative values in the aggregation process, all indicators were normalized to the range [0, 1] using the range-standardization method.
3.2.2. Weight Determination
To improve objectivity and minimize bias from subjective judgment, this study adopts the entropy weight method to determine indicator weights. Thermal risk assessment involves multidimensional indicators across natural, social, and economic domains. Traditional expert-based weighting incorporates professional knowledge but inevitably introduces subjectivity, which may result in unequal weight allocation. By contrast, the entropy weight method is an objective approach based entirely on the inherent dispersion of data. Its core principle is that indicators with greater variability (i.e., lower entropy values) provide more information and have stronger discriminative power across spatial units, and should therefore receive higher weights. This method reduces subjectivity, ensures mathematical rigor, and enhances the fairness and reliability of the comprehensive assessment.
The calculation proceeds in two stages. (1) Information entropy is calculated for each indicator using the following:
where denotes the proportion of the i-th sample for the j-th indicator, m is the total number of samples, and is the standardized value. (2) The weight of each indicator is determined as follows:
where represents the weight of the j-th indicator and n is the number of indicators.
The resulting weights are presented in Table 4. In this model, heat risk is the target layer, with hazard, exposure, vulnerability, and adaptation serving as the four criterion layers. The value of each criterion layer is calculated as follows:
Table 4.
Weighting results for indicators.
The overall heat risk is then obtained using the following:
where j represents the number of indicators within each criterion layer, is the value of the criterion layer, is the value of the indicator, and is the weight of the indicator.
3.3. Population Daily Change Data Processing
Baidu Insight Population Location Data are derived from statistical terminal positioning records collected via the Baidu Maps Location SDK. The dataset partitions the country into a uniform grid of 200 m × 200 m cells using the Baidu Mercator coordinate system. For each grid cell, Baidu aggregates the number of devices accessing location services within an hourly interval and assigns this value to the centroid of the corresponding cell. Importantly, Baidu Huiyan data do not represent raw individual trajectories but are spatially aggregated, privacy-preserving products. Each hourly value therefore reflects the number of devices triggering location services, providing statistical aggregates rather than precise locations.
To prepare these data for subsequent analysis, a series of preprocessing steps were carried out in ArcGIS:
- (1)
- Point conversion: The centroid of each 200 m grid cell was treated as a representative point, and the corresponding population heat value was assigned. This conversion transformed gridded data into a point dataset suitable for kernel density estimation.
- (2)
- Kernel density estimation: The Kernel Density Analysis tool in ArcGIS Pro was employed to generate a continuous surface from the point dataset. A quadratic kernel function was applied, and the search radius was set to 1000 m, balancing smoothing with the spatial influence of population activity. The output resolution was standardized to 30 m to ensure consistency with other datasets.
- (3)
- Population correction: To reconcile the dynamic Baidu Huiyan data with static population baselines, WorldPop data were used as a reference. A correction coefficient was computed as the ratio of the Huiyan-derived totals to the WorldPop population totals. The adjusted population density for each grid cell was then obtained according to the following formula:
4. Results
4.1. LCZ Map of the Main Urban Area of Jinan City
The spatial differentiation of LCZs in the main urban area of Jinan City is strongly shaped by its distinctive natural geographical setting (Figure 5a). The combined influence of natural topography and urban expansion has resulted in the present LCZ distribution pattern. Built types account for 45.93% of the total area, while natural types comprise 54.07% (Figure 5e).
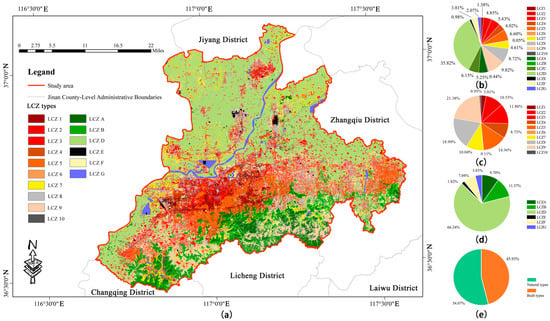
Figure 5.
(a) LCZ map of the main urban area of Jinan City (made by the author). (b) Percentage of all LCZs (made by the author). (c) Percentage of built-up LCZs (made by the author). (d) Percentage of land-cover LCZs (made by the author). (e) Percentage of built-up LCZs and land-cover LCZs (made by the author).
- (1)
- Built types are predominantly concentrated in the central urban area, extending eastward along major transportation corridors from the urban core to peripheral zones.
- (2)
- Natural types are mainly distributed in the northern Yellow River Plain and the mountainous areas in the south.
- (3)
- Among built types, LCZ6, LCZ8, and LCZ9 dominate (Figure 5c).
- (4)
4.2. Spatial Characteristics of Thermal Risk
To classify heat risk and its criterion-level indicators, this study employed the natural breakpoint method (Jenks optimization). This technique is grounded in the intrinsic statistical characteristics of the dataset. By iteratively minimizing within-class variance and maximizing between-class variance, the method identifies natural division points where adjacent values differ most substantially. The natural breakpoint method is widely applied in geography, environmental science, and spatial analysis, and is regarded as a robust and conventional approach. Compared with equal-interval or quantile classification, it provides a more objective representation of the actual data distribution while minimizing potential biases introduced by arbitrary thresholds.
In this study, heat risk values and the four criterion-level indicators (heat hazard, heat exposure, heat vulnerability, and heat adaptation) were classified into five categories: very low, low, moderate, high, and very high. This classification approach ensures a clear spatial differentiation of risk levels and facilitates the effective identification of high-risk zones within Jinan’s central urban area. The corresponding maps present the spatial distribution results, with classification thresholds for each category explicitly reported.
- (1)
- Hazard: High-hazard zones (high and very high) are concentrated in the southwest, particularly in commercial cores (e.g., Lixia and Shizhong Districts) and along major transport corridors (Figure 6a). Low-hazard zones (very low and low) are found mainly at the urban fringe, in large green spaces, and in areas with abundant water bodies, where natural cooling mechanisms mitigate heat accumulation.
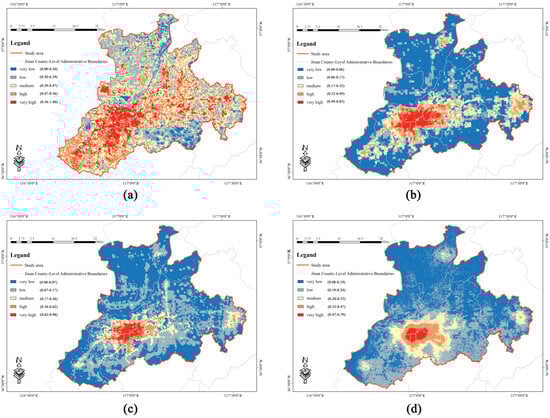 Figure 6. (a) Map of heat hazard in the main urban area of Jinan City (made by the author). (b) Map of heat exposure in the main urban area of Jinan City (made by the author). (c) Map of heat vulnerability in the main urban area of Jinan City (made by the author). (d) Map of heat adaptability in the main urban area of Jinan City (made by the author).
 - (2)
- Exposure: Compared to hazard, exposure displays more pronounced spatial clustering (Figure 6b). High-exposure areas are concentrated in dense urban cores with high population density, compact building structures, and limited vegetation—primarily LCZ1, LCZ2, and LCZ6. Low-exposure areas occur in peripheral zones adjacent to mountains, water bodies, and extensive green space, such as the southern slopes of Qianfo Mountain, natural areas along the north bank of the Yellow River, and low-density suburbs.
- (3)
- Vulnerability: High-vulnerability zones are typically older residential areas, districts with significant aging populations, and economically disadvantaged neighborhoods (Figure 6c). These are located mainly on the western and southwestern edges of the urban core. Low-vulnerability zones occur in newer developments in the east and north, as well as in areas bordering natural landscapes.
- (4)
- Adaptability: High-adaptability zones correspond to central urban areas with advanced infrastructure, abundant public services, and stronger economic conditions (Figure 6d). Low-adaptability zones are found in suburban districts where adaptive resources are less developed.
4.3. Daily Dynamic Changes in Heat Risk Maps
4.3.1. LST and Daily Dynamic Characteristics of Population Density
The statistical characteristics of diurnal LST in the study area are presented in Table 5. The results show a marked variation in summer LST across different times of the day.
Table 5.
The statistical characteristics of diurnal LST in the studied area.
- (1)
- Early morning, evening, and night: Average LST values remain relatively low at approximately 25 °C.
- (2)
- Daytime increase: With the rise of solar altitude, intensification of solar radiation, and increased human activity, LST rises sharply, peaking at 43.36 °C at 14:18. Both the average temperature and standard deviation during midday are significantly higher than those at other times.
The integrated heat risk map (Figure 7) reveals a clear spatial gradient: the highest risk occurs in the intensely developed urban core, with risk levels progressively decreasing toward suburban and rural areas.
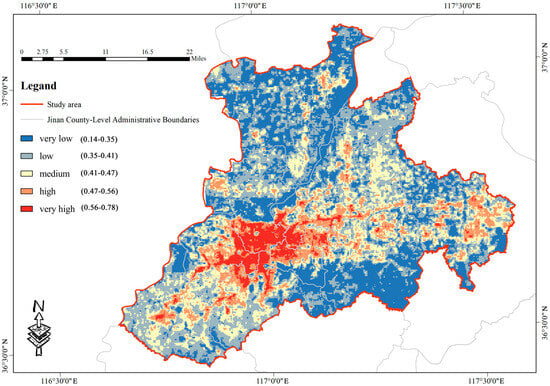
Figure 7.
Map of heat risk in the main urban area of Jinan City (made by the author).
The spatial distribution of LST (Figure 8a) reveals a temporal pattern of increase followed by decline. High-temperature zones are concentrated in the urban core, expanding outward from morning to mid-afternoon due to anthropogenic heat emissions and heat retention by impervious surfaces. By late afternoon, temperatures begin to decline, yet residual heat stored in dense built-up areas sustains elevated LST into the night.
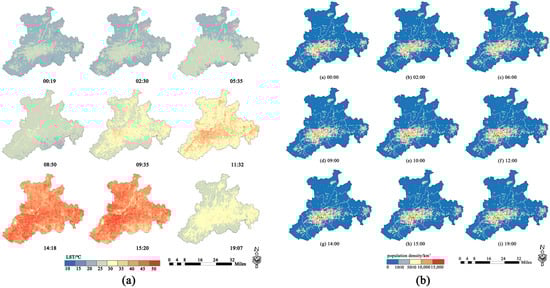
Figure 8.
(a) Spatial distribution of LST at different times (made by the author). (b) Spatial distribution of population density at different times. (made by the author).
At night, a radial gradient emerges, with higher LST in the urban core and lower LST toward the periphery, where more open layouts enhance heat dissipation. During the day, cooler zones are in parks, water bodies, and forested areas, which have high vegetation coverage and permeable surfaces, slowing heat accumulation. At night, however, these areas tend to exhibit relatively higher LST compared to their surroundings due to heat release patterns. Overall, the diurnal spatiotemporal distribution of LST aligns with expected summer urban thermal dynamics and provides a robust basis for urban heat island analysis.
By integrating WorldPop data with Baidu Huiyan population data, the spatial distribution of population density at different hours is shown in Figure 8b. (1) Spatial pattern: Population activity is concentrated in the main urban core. (2) Temporal pattern: The number of active individuals rises sharply between 06:00 and 12:00, peaks at midday, and remains relatively stable until 15:00. By 19:00, activity becomes more dispersed, consistent with evening commuting. From midnight to 06:00, population density declines steadily, reflecting nighttime rest periods.
These patterns demonstrate the feasibility and reliability of using Baidu Huiyan data to capture hourly variations in urban population distribution.
4.3.2. Daily Dynamic Characteristics of Heat Risk Maps
The spatial pattern of heat risk at various times (Figure 9) indicates that overall heat risk in the study area rises from morning to early afternoon, then declines toward nightfall. (1) High-risk zones: These remain concentrated in the urban core throughout the day, particularly in commercial districts and densely populated areas such as Lixia and Shizhong Districts. (2) Low-risk zones: These consist mainly of parks, urban green spaces, and other areas with substantial vegetation cover, which provide cooling and microclimate regulation. (3) Temporal variation: In the early morning, heat risk is low. As solar radiation intensifies, risk levels rise and spread outward from the city center, peaking around 14:00. At night, risk levels decrease, showing a layered pattern radiating from the center toward the periphery along major transportation corridors (Figure 10).
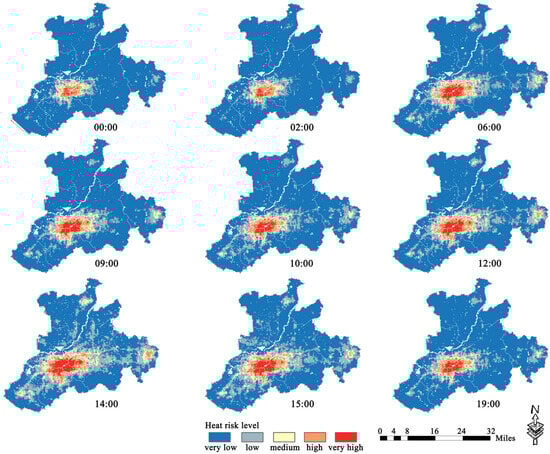
Figure 9.
Spatial distribution of heat risk at different times (made by the author).
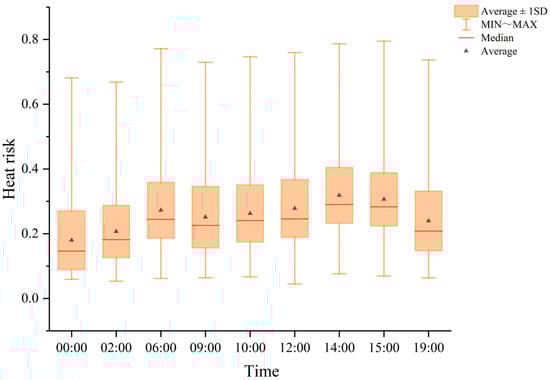
Figure 10.
Changes in heat risk values at different times (made by the author).
4.4. Heat Risk Analysis Based on LCZ
4.4.1. Heat Risk Component Analysis Based on LCZ
Different LCZ types in the main urban area of Jinan exhibit significant spatial variations and structural heterogeneity across the four dimensions of heat risk: heat hazard, heat exposure, heat vulnerability, and heat adaptability.
In terms of heat hazard, built-up areas (LCZ1, LCZ2, LCZ3, LCZ5, and LCZ6) have a high proportion of “high” and “very high” ratings, primarily concentrated in the core areas of the main urban district (Figure 11a). These regions exhibit pronounced heat accumulation, characterized by dense building clusters and extensive impervious surfaces, forming typical urban heat island centers. In contrast, natural areas (LCZA and LCZB) and water bodies (LCZG) generally have lower heat hazard ratings, reflecting their ecological role in temperature regulation. Notably, although LCZ6 is theoretically classified as an open low-rise building zone with potential advantages for ventilation and heat mitigation, in Jinan’s main urban area, the proportions of heat hazard, exposure, and vulnerability in LCZ6 are significantly higher than the average.
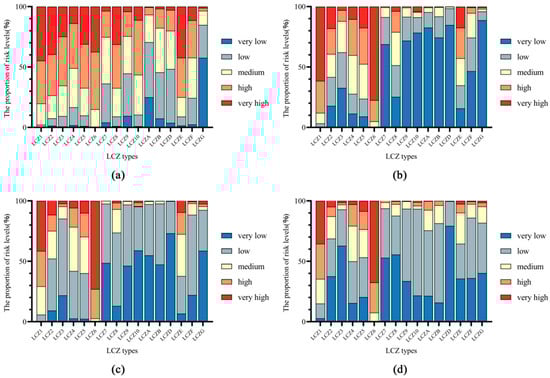
Figure 11.
(a) The proportion of hazard with different LCZ types in the main urban area of Jinan City (made by the author). (b) The proportion of exposure with different LCZ types in the main urban area of Jinan City (made by the author). (c) The proportion of vulnerability with different LCZ types in the main urban area of Jinan City (made by the author). (d) The proportion of adaptability with different LCZ types in the main urban area of Jinan City (made by the author).
In terms of heat exposure, typical residential and mixed-use commercial zones such as LCZ1, LCZ2, LCZ4, LCZ5, and LCZ6 show relatively high levels of exposure, which is related to the mixed urban functions and high daytime population densities in these zones (Figure 11b). Conversely, green spaces and water bodies in LCZA, LCZB, LCZD, and LCZG generally show “low” or “very low” exposure levels, highlighting the positive effect of open spaces in reducing heat exposure.
In terms of heat vulnerability, LCZ6 ranks the highest, followed by LCZ1, LCZ2, LCZ5, LCZE, and LCZ4 (Figure 11c). This ranking is similar to that observed for heat exposure. The high concentration of elderly residents and children in urban built-up areas leads to increased vulnerability in these regions. In contrast, the vulnerability levels of natural-type LCZ zones are predominantly characterized as “low” or “very low.” In terms of heat adaptability, older urban areas generally exhibit higher adaptability levels due to their well-developed public service infrastructure (Figure 11d). In contrast, adaptability levels are generally lower in newly developed urban areas, indicating an uneven spatial distribution of adaptation resources across the city.
4.4.2. Thermal Risk Analysis Based on LCZ
By overlaying the LCZ map with the heat risk map, the spatial distribution of heat risk across different LCZ types can be analyzed. LCZ1 represents high-density, high-rise building areas, where heat risk is generally high (Figure 12a). The concentration of high-rise buildings and the large proportion of impervious surfaces result in substantial heat accumulation and slow dissipation. Furthermore, LCZ1 typically encompasses urban commercial and core areas characterized by dense populations and building layouts that obstruct solar radiation and limit ventilation, creating a closed thermal environment. This further intensifies heat exposure, leading to a higher heat risk index. During extreme high-temperature events, LCZ1 is especially prone to simultaneous high exposure and high vulnerability, thereby exacerbating heat risks.
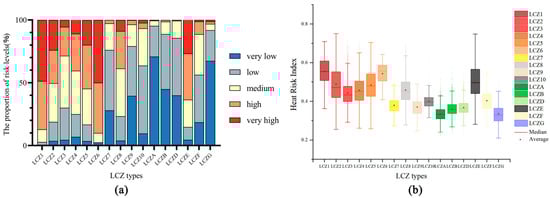
Figure 12.
(a) The proportion of heat risk across different LCZ types in the main urban area of Jinan City (Made by the author). (b) The box plot of heat risk values for LCZs (made by the author).
Although LCZ6 consists of open, low-rise buildings, its average heat risk is second only to LCZ1 (Figure 12b). Among the building types, LCZ9 has the lowest average heat risk, as it is often interspersed with forested areas that provide cooling effects. The average heat risk for LCZ4 and LCZ5 is lower than that for LCZ1–LCZ3, indicating that greater building openness is generally associated with reduced heat risk. In contrast, LCZ8 and LCZ10 show significantly higher average heat risks, likely because these categories mainly comprise large-scale factories and heavy industrial areas, where extensive impervious surfaces absorb large amounts of solar radiation.
Among natural environment types, LCZG exhibits the lowest average heat risk, indicating its strong capacity to mitigate high-temperature hazards, followed by LCZA, LCZB, and LCZD. In contrast, LCZE and LCZF, being exposed to direct sunlight for prolonged periods, show higher heat risks due to the continuous absorption of solar radiation.
To examine the influence of LCZ types on the diurnal variation in heat risk, the overall distribution and daily variation patterns of heat risk intensity for different LCZ types are presented in Figure 13. The results show that heat risk levels across different LCZs generally follow a pattern of increasing first and then decreasing over the course of the day, with peak values occurring between 12:00 and 15:00 (Figure 14). Across the nine time periods analyzed, LCZ6 consistently records the highest heat risk levels, followed by LCZ1. Except for LCZ7, LCZE, and LCZF, natural-type LCZs consistently exhibit lower heat risk levels than building-type LCZs.
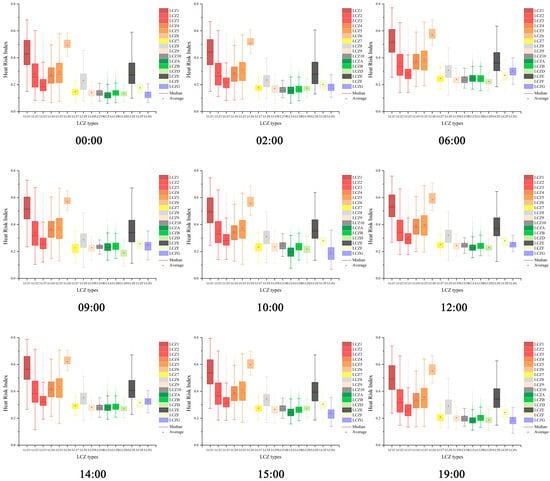
Figure 13.
Box plot illustrating the variation in heat risk values across LCZ types at different times (made by the author).
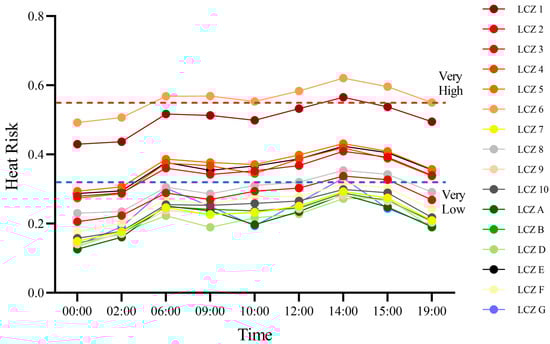
Figure 14.
Changes in the average heat risk value in the LCZ area at different times (made by the author).
4.4.3. Contribution Analysis of Heat Risk Indicators Under Different LCZs
To evaluate the influence of individual indicators in the high-temperature risk assessment, SHAP was applied as a tool for interpretable model analysis. SHAP is based on the Shapley value concept from cooperative game theory, which enables a fair allocation of feature contributions to model predictions and effectively addresses the instability issues associated with traditional feature importance analyses.
First, a multicollinearity test was conducted on the 15 assessment indicators included in the heat risk assessment system. Eleven indicators with variance inflation factor (VIF) values ≤ 10 were retained: LST, FAR, housing value, ISA, cooling facilities, FVC, SVF, BCR, NDVI, SR, and NDWI. Subsequently, the BP-SHAP model was applied to analyze the contribution of heat risk indicators for building-type LCZs. SHAP analysis was conducted in Visual Studio Code 1.85 using a trained BP neural network model. The model consisted of three fully connected layers, including an input layer with 11 nodes, a hidden layer with 17 nodes, and an output layer with 1 node, with the Sigmoid function used as the activation function. The shap. DeepExplainer library was applied as the explainer. To balance computational efficiency and accuracy, 100 samples were randomly selected from the training set to construct the background dataset, which served as the reference baseline for feature distribution. This sample size ensured both computational feasibility and an adequate representation of the underlying data distribution. The results show that LST is the most significant contributor to heat risk across all building-type LCZs, confirming its role as the primary driver of thermal risk (Figure 15). In LCZ1, LCZ2, LCZ5, and LCZ6—where heat risk levels are relatively high—the indicators with higher contribution rankings include LST, FAR, ISA, housing value, BCR, and cooling facilities. These findings suggest that targeted improvements to these indicators in high-risk areas could help regulate and mitigate urban thermal risk.
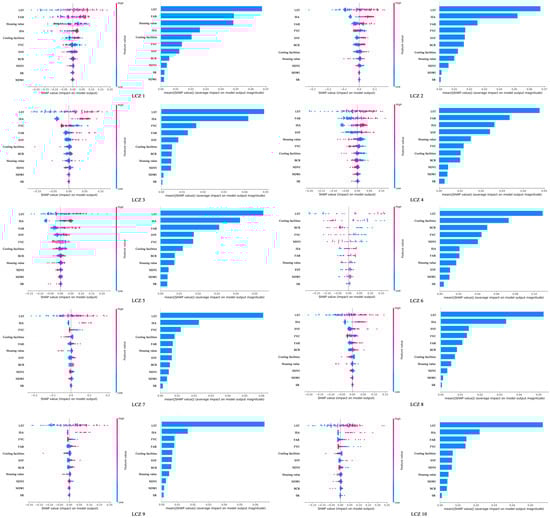
Figure 15.
SHAP summary plot accompanied by a bar chart showing mean importance. Each point represents a sample, with red indicating high feature values and blue indicating low feature values (made by the author).
5. Discussion
5.1. The Necessity of Studying the Dynamic Changes of Heat Risk over Days
The spatial and temporal distributions of heat hazards and heat exposure exhibit pronounced variability. Conventional research often relies on static population density data for analysis, thereby overlooking the temporal mobility and varying activity intensities of populations. In reality, population distribution and behavioral patterns change throughout the day—for instance, during peak commuting hours or nighttime rest periods—which can substantially alter both the intensity and spatial configuration of individual heat exposure [,,].
In this study, dynamic population data and LST information were integrated by combining hourly Baidu Huiyan population data with ECOSTRESS LST products. This approach enables a more refined and temporally responsive heat risk assessment, capturing real-time fluctuations in heat risk patterns. Such methodological advancements provide both practical data support for heat risk evaluation and actionable insights for urban planning.
The findings reveal that daytime high-risk periods are concentrated between 12:00 and 15:00. This phenomenon can be explained by the concurrence of maximum solar radiation—during which intense summer sunlight sharply raises urban surface temperatures—and periods of increased population activity. Commercial and office districts, in particular, experience increased population density and mobility during these hours. The convergence of these factors significantly amplifies heat risk in this timeframe.
Recognizing this temporal concentration of risk offers valuable references for urban disaster early warning systems, the spatial allocation of welfare and cooling facilities, and climate-adaptive design strategies. The timely implementation of cooling interventions and evacuation measures during these hours could help reduce heat-related health risks.
5.2. Thermal Risk Differences Between LCZ Types
Research indicates that high-intensity built-up areas such as LCZ1, LCZ2, LCZ4, LCZ5, LCZ6, LCZ8, and LCZE exhibit elevated thermal risk levels. This distribution pattern highlights the intrinsic link between urban form and the thermal environment: these LCZ types are characterized by high building density, extensive impervious surfaces, and limited green space. Such conditions not only intensify the absorption and storage of solar radiation, creating strong “heat source” effects, but also restrict ventilation and reduce ecological regulation, thereby amplifying heat hazards. At the same time, these areas serve as densely populated economic hubs, where both static and dynamic exposure levels are high, further aggravating the health impacts of extreme heat.
LCZ6 is particularly noteworthy. Although its open, low-rise form should theoretically promote ventilation and heat dissipation, this study finds unusually high thermal risk levels, contradicting previous research [,]. This inconsistency underscores the challenges of applying LCZ theory to specific urban contexts. In Jinan, LCZ6 zones are concentrated in older districts, often enclosed by high-rise buildings that obstruct airflow. These areas also lack greenery and shading while hosting a larger proportion of elderly residents, compounding social vulnerability. By contrast, natural land cover types such as forests, croplands, and water bodies provide strong thermal mitigation through vegetation transpiration and surface evaporation, effectively buffering solar radiation [,,]. The stark disparity between built-up and natural zones reflects how surface property changes alter terrestrial energy balances during urbanization. This finding highlights the importance of preserving and restoring ecological spaces in urban planning to strengthen climate resilience. Moreover, it demonstrates that LCZ classification alone is insufficient for accurate heat risk assessment; robust evaluation requires integrating morphological characteristics with socioeconomic dimensions.
A detailed examination of LCZ6 reveals the following:
- (1)
- Heat hazard: LCZ6 is frequently surrounded by dense high-rise buildings in adjacent LCZ1–3 zones, obstructing ventilation corridors and restricting airflow. Although its low-rise layout should support ventilation, the absence of shading exposes surfaces directly to solar radiation, increasing heat absorption. Moreover, limited blue–green infrastructure reduces local evapotranspiration, creating pronounced hotspots [,,,].
- (2)
- Heat exposure: LCZ6 is both a residential core and a cultural/tourism hub, producing high levels of static and dynamic exposure. During summer heatwaves, the influx of tourists and residents generates strong “spatiotemporal clustering,” with actual exposure exceeding census-based estimates [,].
- (3)
- Heat vulnerability: These districts contain disproportionately high numbers of elderly and children, groups highly sensitive to extreme heat. The elderly face elevated risks of heatstroke and related complications during prolonged heatwaves, making LCZ6 especially vulnerable compared with other LCZ types [,].
- (4)
- Heat adaptation: Despite high hazard, exposure, and vulnerability, LCZ6 shows relatively strong adaptive capacity. A dense network of hospitals and community health centers ensures timely medical care, while the district’s central location provides convenient transportation and well-developed public services, supporting efficient warnings and emergency response [,].
In summary, the combination of aging building stock, poor ventilation, high population density, limited ecological infrastructure, and a large share of vulnerable residents makes LCZ6 one of the most heat-risk-prone zones. Although systemic adaptability provides partial mitigation, infrastructure-based adaptation has clear limits. It cannot fully compensate for the persistent environmental deficiencies driving heat hazards, nor eliminate the growing risks of extreme heat.
5.3. Application and Limitations
Based on the research findings, targeted strategies are proposed across three scales—macro, meso, and micro—to manage urban heat risk.
At the macro level, urban master planning exerts decisive influence on heat risk mitigation. For future urban expansion, Jinan should prioritize LCZ types with lower thermal risk, such as LCZ3, LCZ7, and LCZ9 (built-up types), as well as LCZA, LCZB, LCZD, and LCZG (natural types). These zones offer more favorable thermal adaptation conditions. Moreover, the deliberate planning of urban ventilation corridors is essential to facilitate cross-regional air circulation and heat dissipation [,]. Such corridors can be established through strategic arrangements of green belts, water bodies, and transport networks, thereby improving air quality and mitigating heatwave impacts. Continuous monitoring of high-risk zones should also be integrated into urban management systems.
At the meso level, differentiated management aligned with LCZ-specific thermal risk characteristics is crucial. In low-risk areas with abundant greenery and water bodies, enhancing green infrastructure can further bolster resilience. Conversely, high-risk zones such as commercial cores and dense residential areas (e.g., LCZ1, LCZ2, LCZ4, and LCZ5) require interventions including increased vegetation coverage, park creation, rooftop and vertical greening, and the strategic placement of cooling facilities to mitigate urban heat island effects [,,].
At the micro level, building design and localized measures play a vital role. Climate-responsive architectural strategies—such as high-reflectivity materials, improved shading, and microclimate designs incorporating vegetation and water features—can reduce heat absorption and enhance thermal comfort. Such measures are particularly important for safeguarding vulnerable groups.
In conclusion, a multi-scale approach integrating macro planning, meso-level management, and micro-level design can collectively reduce heat exposure risks and enhance urban adaptive capacity, offering robust strategies for managing future extreme heat events.
In constructing daily temperature variation sequences using ECOSTRESS data, limitations associated with sensor operation modes and climatic conditions made it difficult to obtain clear-sky imagery from multiple consistent time points within a single summer. To ensure both temporal coverage and data quality, multi-annual imagery (2019–2024) captured under clear, low-wind summer conditions was employed to assemble representative diurnal temperature variation processes. These datasets were used solely to construct a “typical day” diurnal variation pattern, rather than to analyze interannual differences. During this period, large-scale urban expansion and redevelopment within Jinan’s main urban area were relatively limited, ensuring stability in the underlying urban form.
To minimize discrepancies, imagery was rigorously screened for meteorological consistency, and all supplementary datasets were harmonized to 2023–2024 conditions to maintain spatial coherence within the assessment framework. This data processing strategy, while constrained by current data availability, provides a reliable basis for analyzing diurnal thermal dynamics. Nevertheless, future research should prioritize the acquisition of more synchronized, high-resolution dynamic temperature datasets across multiple seasons to improve the accuracy, timeliness, and robustness of heat risk assessments.
6. Conclusions
This study employed the HEVA model to evaluate heat risk in the main urban area of Jinan City, constructing a dynamic heat risk map and applying the LCZ framework to investigate its influence on thermal risk patterns. Furthermore, SHAP analysis was utilized to elucidate the driving mechanisms behind heat risk in different LCZ types, thereby providing a scientific foundation for climate-adaptive urban planning. The main conclusions are as follows:
- (1)
- Heat risk exhibits pronounced spatial variation and diurnal dynamics: High-risk zones are concentrated in the densely built-up urban core, whereas low-risk zones are located in peripheral areas and blue–green spaces. Risk intensity follows a unimodal daily cycle, peaking between 12:00 and 15:00, coinciding with both maximum surface temperatures and peak population activity.
- (2)
- Association between heat risk and LCZ types: Although LCZ6 (open low-rise areas) theoretically possesses ventilation advantages, in the main urban area of Jinan, its heat risk remains significantly elevated. This is attributable to high building coverage, scarce green space, and a high concentration of vulnerable populations, which collectively drive elevated levels of heat hazard, exposure, and vulnerability.
- (3)
- Key determinants of heat risk: SHAP analysis identifies LST, FAR, ISA, housing value, BCR, and the distribution of cooling facilities as the most influential factors in determining heat risk in Jinan’s main urban area.
This study integrates multi-temporal ECOSTRESS LST data with Baidu Huiyan mobility data to overcome the limitations of traditional static assessments, establishing a refined heat risk assessment framework that captures spatiotemporal population dynamics. While confirming the applicability of the LCZ framework, the results also reveal its local limitations. In particular, anomalous risks identified in LCZ6 under specific socioeconomic contexts deepen the understanding of how built environment patterns interact with heat risks. These findings not only provide a valuable case reference for related research but also offer robust data support and policy guidance for climate-resilient urban planning in Jinan, especially in reducing heat exposure, optimizing urban spatial structures, and enhancing adaptive capacity among vulnerable populations.
Author Contributions
Conceptualization, Z.R. and H.C.; methodology, Z.R. and S.S.; software, H.C.; validation, S.S. and H.C.; formal analysis, H.C.; investigation, M.L.; resources, S.S. and J.Z.; data curation, H.C. and M.L.; writing—original draft preparation, Z.R., H.C., and H.W.; writing—review and editing, Z.R., H.C. and H.W.; visualization, H.C. and M.L.; supervision, J.Z.; project administration, Z.R.; funding acquisition, S.S. All authors have read and agreed to the published version of the manuscript.
Funding
This research was funded by National Natural Science Foundation of China, grant number (52408079), the Overseas Science and Technology Talent Recognition Project and the Doctoral Scholars Grant Program of Shandong Jianzhu University (No. X24024), and the doctoral fund of Shandong Jianzhu University (X20020S0101).
Data Availability Statement
Data are contained within the article.
Conflicts of Interest
The authors declare no conflicts of interest.
Abbreviations
The following abbreviations are used in this manuscript:
| LCZ | Local Climate Zone |
| UHI | Urban heat island |
| HEV | Hazard—Exposure –Vulnerability |
| HEVA | Hazard—Exposure –Vulnerability—Adaptability |
| LST | Land surface temperature |
| FAR | Floor area ratio |
| ISA | Impervious surface area |
| BCR | Building coverage ratio |
| POI | Point of interest |
| NDWI | Normalized Difference Water Index |
| NDVI | Normalized Difference Vegetation Index |
| FVC | Fractional vegetation cover |
| SR | Surface roughness |
| SVF | Sky view factor |
| WUDAPT | World Urban Database and Access Portal Tools |
| SAGA | System for Automated Geoscientific Analyses |
| GIS | Geographic Information System |
| HR | Heat risk |
| SHAP | SHapley Additive exPlanations |
References
- Liu, H.; Huang, B.; Gao, S.; Wang, J.; Yang, C.; Li, R. Impacts of the Evolving Urban Development on Intra-Urban Surface Thermal Environment: Evidence from 323 Chinese Cities. Sci. Total Environ. 2021, 771, 144810. [Google Scholar] [CrossRef] [PubMed]
- AR6 Synthesis Report: Climate Change 2023. Available online: https://www.ipcc.ch/report/ar6/syr/ (accessed on 31 July 2025).
- Chen, Y.; Wang, A. Role of Land–Atmosphere Coupling in Persistent Extreme Climate Events in Eastern China in Summer 2022. Atmos. Ocean. Sci. Lett. 2024, 17, 100419. [Google Scholar] [CrossRef]
- Park, J.; Kim, A.; Kim, Y.; Choi, M.; Yoon, T.H.; Kang, C.; Kang, H.J.; Oh, J.; Bell, M.L.; Kim, H.; et al. Association between Heat and Hospital Admissions in People with Disabilities in South Korea: A Nationwide, Case-Crossover Study. Lancet Planet. Health 2024, 8, e217–e224. [Google Scholar] [CrossRef] [PubMed]
- Huang, Y.; Mao, F.; Xu, Y.; Qi, J.; Zhang, W.; Li, C.; Zhou, M. Association between Urban Heat Islands and Heat-Related Mortality in 70 Pairs of Adjacent Urban-Rural Counties among 8 Topographic Regions in China. Sustain. Cities Soc. 2025, 121, 106182. [Google Scholar] [CrossRef]
- Murage, P.; Macintyre, H.L.; Heaviside, C.; Vardoulakis, S.; Fučkar, N.; Rimi, R.H.; Hajat, S. Future Temperature-Related Mortality in the UK Under Climate Change Scenarios: Impact of Population Ageing and Bias-Corrected Climate Projections. Environ. Res. 2024, 259, 119565. [Google Scholar] [CrossRef]
- Zeng, P.; Sui, Y.; Liu, Y.; Xu, H.; Cheng, D.; Che, Y.; Helbich, M. Heat Risk during Hot Weather Is Associated with Poorer Self-Reported Mental Health: A Cross-Sectional Study in Shanghai, China. Cities 2025, 164, 106078. [Google Scholar] [CrossRef]
- Sahani, J.; Kumar, P.; Debele, S.; Emmanuel, R. Heat Risk of Mortality in Two Different Regions of the United Kingdom. Sustain. Cities Soc. 2022, 80, 103758. [Google Scholar] [CrossRef]
- Nuñez, Y.; Hoyos, N.; Arellana, J. High Land Surface Temperatures (LSTs) Disproportionately Affect Vulnerable Socioeconomic Groups in Barranquilla, Colombia. Urban Clim. 2023, 52, 101757. [Google Scholar] [CrossRef]
- Cresswell, K. A Florida Urban Heat Risk Index: Assessing Weighting and Aggregation Approaches. Urban Clim. 2023, 51, 101646. [Google Scholar] [CrossRef]
- Ma, J.; Liu, D. A Multiscale Examination of Heat Risk Spatiotemporal Dynamics in Chinese Urban Agglomerations: A Hierarchical Assessment Method and Planning Framework. Int. J. Disaster Risk Reduct. 2025, 117, 105198. [Google Scholar] [CrossRef]
- Shehayeb, R.; Ortlepp, R.; Schanze, J. An Indicator-Based Methodology for the Drought and Heat Risk Assessment of Urban Green Infrastructure. Ecol. Indic. 2025, 174, 113461. [Google Scholar] [CrossRef]
- Wang, S.; Sun, Q.C.; Huang, X.; Tao, Y.; Dong, C.; Das, S.; Liu, Y. Health-Integrated Heat Risk Assessment in Australian Cities. Environ. Impact Assess. Rev. 2023, 102, 107176. [Google Scholar] [CrossRef]
- Zou, B.; Fan, C.; Li, J.; Wang, M.; Liao, Y.; Zhou, X. Assessing the Impact of Land Use Changes on Urban Heat Risk under Different Development Scenarios: A Case Study of Guangzhou in China. Sustain. Cities Soc. 2025, 130, 106532. [Google Scholar] [CrossRef]
- Zhang, C.; Yang, Y.; Yu, L. Assessing Urban Surface Thermal Environment and Heat Health Risk in Chinese Cities: A Twenty-Year Study. Urban Clim. 2025, 59, 102304. [Google Scholar] [CrossRef]
- Qian, W.; Rao, F.; Li, X.; Lai, D. Mapping Priority Zones for Urban Heat Mitigation in Shanghai: Heat Risk vs. Shelter Provision. Comput. Environ. Urban Syst. 2025, 121, 102330. [Google Scholar] [CrossRef]
- Lin, L.; Zhao, Y. Optimizing Local Climate Zones to Mitigate Urban Heat Risk: A Multi-Models Coupled Approach in the Context of Urban Renewal. Build. Environ. 2025, 282, 113282. [Google Scholar] [CrossRef]
- Wang, X.; Li, B.; Yao, L. Investigating Urban and Rural Heat Risk over Long Time-Series: A Case Study of Beijing-Tianjin-Hebei Urban Agglomeration in China. Sustain. Cities Soc. 2025, 119, 106081. [Google Scholar] [CrossRef]
- Tuholske, C.; Caylor, K.; Funk, C.; Verdin, A.; Sweeney, S.; Grace, K.; Peterson, P.; Evans, T. Global Urban Population Exposure to Extreme Heat. Proc. Natl. Acad. Sci. USA 2021, 118, e2024792118. [Google Scholar] [CrossRef]
- Wu, H.; Xu, Y.; Zhang, M.; Su, L.; Wang, Y.; Zhu, S. Spatially Explicit Assessment of the Heat-Related Health Risk in the Yangtze River Delta, China, Using Multisource Remote Sensing and Socioeconomic Data. Sustain. Cities Soc. 2024, 104, 105300. [Google Scholar] [CrossRef]
- Zhou, Y.; Zhang, G.; Jiang, L.; Chen, X.; Xie, T.; Wei, Y.; Xu, L.; Pan, Z.; An, P.; Lun, F. Mapping Local Climate Zones and Their Associated Heat Risk Issues in Beijing: Based on Open Data. Sustain. Cities Soc. 2021, 74, 103174. [Google Scholar] [CrossRef]
- Chang, Y.; Weng, Q.; Voogt, J.A.; Xiao, J. Urban Thermal Anisotropies by Local Climate Zones: An Assessment Using Multi-Angle Land Surface Temperatures from ECOSTRESS. Remote Sens. Environ. 2025, 322, 114705. [Google Scholar] [CrossRef]
- Chen, B.; Xie, M.; Feng, Q.; Wu, R.; Jiang, L. Diurnal Heat Exposure Risk Mapping and Related Governance Zoning: A Case Study of Beijing, China. Sustain. Cities Soc. 2022, 81, 103831. [Google Scholar] [CrossRef]
- Guo, R.; Guo, F.; Dong, J.; Wang, Z.; Zheng, R.; Zhang, H. Finer-Scale Urban Health Risk Assessment Based on the Interaction Perspective of Thermal Radiation, Human, Activity, and Space. Front. Archit. Res. 2024, 13, 682–697. [Google Scholar] [CrossRef]
- Guo, F.; Fan, G.; Zhao, J.; Zhang, H.; Dong, J.; Ma, H.; Li, N. Urban Heat Health Risk Inequality and Its Drivers Based on Local Climate Zones: A Case Study of Qingdao, China. Build. Environ. 2025, 275, 112827. [Google Scholar] [CrossRef]
- Zhang, H.; Gao, J.; Zhao, J.; Guo, F.; Bai, J.; Wang, Z.; Zhu, P. Applicability of Local Climate Zones in Assessing Urban Heat Risk—A Survey of Coastal City. Cities 2025, 164, 106068. [Google Scholar] [CrossRef]
- Lan, H.; Zhang, H.; Gao, J.; Bai, J.; Wang, H.; Lu, C.; Geng, H. Heat Risk Assessment in Arid Zones Based on Local Climate Zones: A Case of Urumqi, China. Buildings 2025, 15, 1672. [Google Scholar] [CrossRef]
- Chen, J.; Shi, X.; Shi, Y.; Delina, L.L. Assessing Heat Vulnerability Risk of Jinan and Guangzhou’s Older Populations Based on Multisource Remote Sensing Data. Build. Environ. 2025, 271, 112622. [Google Scholar] [CrossRef]
- Dong, F.; Chen, J.; Yang, F. A Study of Land Surface Temperature Retrieval and Thermal Environment Distribution Based on Landsat-8 in Jinan City. In IOP Conference Series: Earth and Environmental Science; IOP Publishing: Bristol, UK, 2018; Volume 108, p. 042008. [Google Scholar] [CrossRef]
- Wu, S.; Zhang, C.; Yang, Z.; Rong, Y.; Wang, Y. Research on Surface Temperature Inversion and Spatiotemporal Distribution Characteristics Based on Landsat Data. In IOP Conference Series: Earth and Environmental Science; IOP Publishing: Bristol, UK, 2020; Volume 450, p. 012031. [Google Scholar] [CrossRef]
- Tan, L.; Robert, T.L.K.; Zhang, Y.; Huang, S.; Zhang, Z. Multidimensional Assessment of the Spatiotemporal Evolution, Driving Mechanisms, and Future Predictions of Urban Heat Islands in Jinan, China. Sci. Rep. 2025, 15, 11056. [Google Scholar] [CrossRef] [PubMed]
- Stewart, I.D.; Oke, T.R. Local Climate Zones for Urban Temperature Studies. Bull. Am. Meteorol. Soc. 2012, 93, 1879–1900. [Google Scholar] [CrossRef]
- Ma, L.; Huang, G.; Johnson, B.A.; Chen, Z.; Li, M.; Yan, Z.; Zhan, W.; Lu, H.; He, W.; Lian, D. Investigating Urban Heat-Related Health Risks Based on Local Climate Zones: A Case Study of Changzhou in China. Sustain. Cities Soc. 2023, 91, 104402. [Google Scholar] [CrossRef]
- Su, R.; Yang, C.; Xu, Z.; Luo, T.; Yang, L. Assessment of Fine-Scale Urban Heat Health Risk and Its Potential Driving Factors Based on Local Climate Zones in Shenzhen, China. IJGI 2024, 13, 367. [Google Scholar] [CrossRef]
- Yu, P.; Zhang, L.; Yu, P. The Marginal Effect of Landscapes on Urban Land Surface Temperature within Local Climate Zones Based on Optimal Landscape Scale. Urban Clim. 2024, 57, 102110. [Google Scholar] [CrossRef]
- Zhang, H.; Wang, C.; Yang, H.; Ma, Z. How Do Morphology Factors Affect Urban Heat Island Intensity? An Approach of Local Climate Zones in a Fast-Growing Small City, Yangling, China. Ecol. Indic. 2024, 161, 111972. [Google Scholar] [CrossRef]
- Ming, Y.; Liu, Y.; Liu, X.; Tian, Z. Demographic Disparity in Diurnal Surface Urban Heat Island Exposure Across Local Climate Zones: A Case Study of Chongqing, China. Sci. Total Environ. 2024, 923, 171203. [Google Scholar] [CrossRef]
- Chen, H.; Dong, N.; Cao, Q.; Chen, G.; Zheng, X. Spatial-Temporal Assessment of Urban Heat Vulnerability Analysis Based on Local Climate Zone in Guangzhou-Foshan Metropolis. Sustain. Cities Soc. 2025, 130, 106618. [Google Scholar] [CrossRef]
- Wang, R.; Lu, T.; He, B.; Wang, F.; Huang, Q.; Qian, Z.; Min, J.; Li, Y. Seasonal Urban Surface Thermal Environment Analysis Based on Local Climate Zones: A Case Study of Chongqing. Sci. Total Environ. 2024, 954, 176577. [Google Scholar] [CrossRef]
- Sharmin, T.; Chappell, A.; Lannon, S. Spatio-Temporal Analysis of LST, NDVI and SUHI in a Coastal Temperate City Using Local Climate Zone. Energy Built Environ. 2024, article in press. [Google Scholar] [CrossRef]
- Xu, H.; Sun, F.; Zeng, P.; Bao, X.; Che, Y. Impact of Diurnal Variation in 3D Urban Landscape Metrics on Land Surface Temperature in Shanghai: A Local Climate Zone Perspective. Energy Build. 2025, 336, 115624. [Google Scholar] [CrossRef]
- Notice of the People’s Government of Jinan City on Issuing the Jinan City Land Use Master Plan (2021–2035). Available online: http://www.jinan.gov.cn/art/2025/1/17/art_2613_4994801.html?xxgkhide=1 (accessed on 1 August 2025).
- 2024 Jinan Statistical Yearbook. Available online: http://jntj.jinan.gov.cn/col/col27523/index.html (accessed on 1 August 2025).
- Zhu, H.; Wan, W.; Wang, L.; Yang, W.; Cai, M. Dynamic Assessment of Airport Noise Impact: A Case Study of Shenzhen Airport. Transp. Res. Part D Transp. Environ. 2025, 143, 104741. [Google Scholar] [CrossRef]
- Geng, H.; Lin, T.; Van Bodegom, P.M.; Hu, M.; Zheng, Y.; Jia, Z.; Zhang, J.; Guo, X.; Chen, Y.; Lin, M.; et al. Forest or Grassland? A Quantitative Analysis of Urban Residents’ Green Exposure Preference by Using Multi-Temporal Mobile Signal Data. Urban For. Urban Green. 2025, 108, 128826. [Google Scholar] [CrossRef]
- Zhao, L.; Tang, X.; Xing, X.; Cai, C. Big Data Analysis of Park and Green Space Serviceability for Elderly Population—Case Study of Core Area of Beijing. Sens. Mater. 2022, 34, 4369. [Google Scholar] [CrossRef]
- Yao, X.; Zeng, X.; Zhu, Z.; Lan, Y.; Shen, Y.; Liu, Q.; Yang, F. Exploring the Diurnal Variations of the Driving Factors Affecting Block-Based LST in a “Furnace City” Using ECOSTRESS Thermal Imaging. Sustain. Cities Soc. 2023, 98, 104841. [Google Scholar] [CrossRef]
- Huang, X.; Li, L.; Yan, X.; Ji, W.; Zhao, K.; Zhao, X. Assessment of Heat Exposure Risk for Urban Populations and Spatio-Temporal Patterns: A Perspective of Urban Functional Zones in Xi’an, China. Urban Clim. 2024, 55, 101992. [Google Scholar] [CrossRef]
- Zhang, X.; Liu, L.; Zhao, T.; Zhang, W.; Guan, L.; Bai, M.; Chen, X. GLC_FCS10: A Global 10 m Land-Cover Dataset with a Fine Classification System from Sentinel-1 and Sentinel-2 Time-Series Data in Google Earth Engine. Earth Syst. Sci. Data 2025, 17, 4039–4062. [Google Scholar] [CrossRef]
- Bechtel, B.; Alexander, P.; Böhner, J.; Ching, J.; Conrad, O.; Feddema, J.; Mills, G.; See, L.; Stewart, I. Mapping Local Climate Zones for a Worldwide Database of the Form and Function of Cities. IJGI 2015, 4, 199–219. [Google Scholar] [CrossRef]
- Zhang, J.; Yao, X.; Chen, Y.; Lin, M.; Lin, T.; Zheng, Y.; Geng, H.; Zheng, Y.; Wu, X.; Zhang, G.; et al. Spatiotemporal Dynamic Mapping of Heat Exposure Risk for Different Populations in City Based on Hourly Multi-Source Data. Sustain. Cities Soc. 2024, 107, 105454. [Google Scholar] [CrossRef]
- Chen, T.-L.; Lin, H.; Chiu, Y.-H. Heat Vulnerability and Extreme Heat Risk at the Metropolitan Scale: A Case Study of Taipei Metropolitan Area, Taiwan. Urban Clim. 2022, 41, 101054. [Google Scholar] [CrossRef]
- Elmarakby, E.; Elkadi, H. Prioritising Urban Heat Island Mitigation Interventions: Mapping a Heat Risk Index. Sci. Total Environ. 2024, 948, 174927. [Google Scholar] [CrossRef]
- Petzold, J.; Mose, L. Urban Greening as a Response to Climate-Related Heat Risk: A Social-Geographical Review. Sustainability 2023, 15, 4996. [Google Scholar] [CrossRef]
- Xu, C.; Huang, Q.; Haase, D.; Dong, Q.; Teng, Y.; Su, M.; Yang, Z. Cooling Effect of Green Spaces on Urban Heat Island in a Chinese Megacity: Increasing Coverage versus Optimizing Spatial Distribution. Environ. Sci. Technol. 2024, 58, 5811–5820. [Google Scholar] [CrossRef] [PubMed]
- Li, X.; Lin, K.; Shu, Y.; Lin, X. Comparison of the Influences of Different Ventilation Corridor Forms on the Thermal Environment in Wuhan City in Summer. Sci. Rep. 2023, 13, 13416. [Google Scholar] [CrossRef]
- Islam, M.R.; Shahfahad; Talukdar, S.; Rihan, M.; Rahman, A. Evaluating Cooling Effect of Blue-Green Infrastructure on Urban Thermal Environment in a Metropolitan City: Using Geospatial and Machine Learning Techniques. Sustain. Cities Soc. 2024, 113, 105666. [Google Scholar] [CrossRef]
- Li, X.; Lin, K.; Cheng, D.; Zou, H.; Shu, Y.; Jin, Z.; Zhu, J. Meteorological Effects of Ventilation Corridor in Central Urban Areas: A Case Study of Wuhan. Sust. Cities Soc. 2024, 114, 105752. [Google Scholar] [CrossRef]
- Liu, D.; Zhou, R.; Ma, Q.; He, T.; Fang, X.; Xiao, L.; Hu, Y.; Li, J.; Shao, L.; Gao, J. Spatio-Temporal Patterns and Population Exposure Risks of Urban Heat Island in Megacity Shanghai, China. Sustain. Cities Soc. 2024, 108, 105500. [Google Scholar] [CrossRef]
- Fastl, C.; Arnberger, A.; Gallistl, V.; Stein, V.K.; Dorner, T.E. Heat Vulnerability: Health Impacts of Heat on Older People in Urban and Rural Areas in Europe. Wien. Klin. Wochenschr. 2024, 136, 507–514. [Google Scholar] [CrossRef]
- Singh, C. Nirwan Effective Heat Adaptation Must Engage with Unequal Heat Risk. One Earth 2024, 7, 1320–1323. [Google Scholar] [CrossRef]
- Lao, X.; Istrate, A.-L.; Pilla, F. Navigating Vulnerable Community-Based Urban Heat Adaptation under SDG 11. npj Urban Sustain. 2025, 5, 49. [Google Scholar] [CrossRef]
- Liu, W.; Zhang, G.; Jiang, Y.; Wang, J. Effective Range and Driving Factors of the Urban Ventilation Corridor Effect on Urban Thermal Comfort at Unified Scale with Multisource Data. Remote Sens. 2021, 13, 1783. [Google Scholar] [CrossRef]
- Zhang, R.; Xie, J. Planning and Implementation of Ventilation Corridor in Coastal Cities Based on the Overall Urban Design. J. Coast. Res. 2020, 107, 105–108. [Google Scholar] [CrossRef]
- Tamoria, M.A.J.; Park, H. Urban Cooling Effect of Rivers: Its Role in Climate Change Mitigation. Int. J. Glob. Warm. 2023, 30, 123–136. [Google Scholar] [CrossRef]
- Gallay, I.; Olah, B.; Murtinova, V.; Gallayova, Z. Quantification of the Cooling Effect and Cooling Distance of Urban Green Spaces Based on Their Vegetation Structure and Size as a Basis for Management Tools for Mitigating Urban Climate. Sustainability 2023, 15, 3705. [Google Scholar] [CrossRef]
Disclaimer/Publisher’s Note: The statements, opinions and data contained in all publications are solely those of the individual author(s) and contributor(s) and not of MDPI and/or the editor(s). MDPI and/or the editor(s) disclaim responsibility for any injury to people or property resulting from any ideas, methods, instructions or products referred to in the content. |
© 2025 by the authors. Licensee MDPI, Basel, Switzerland. This article is an open access article distributed under the terms and conditions of the Creative Commons Attribution (CC BY) license (https://creativecommons.org/licenses/by/4.0/).