Article

Axial Compression and Uplift Performance of Continuous Helix Screw Piles

1
Department of Civil and Environmental Engineering, Western University, London, ON N6A 5B9, Canada
2
Civil Engineering Department, University of Benghazi, Benghazi P.O. Box 1308, Libya
*
Author to whom correspondence should be addressed.
Buildings 2025, 15(19), 3620; https://doi.org/10.3390/buildings15193620
Submission received: 26 August 2025 / Revised: 27 September 2025 / Accepted: 7 October 2025 / Published: 9 October 2025
(This article belongs to the Special Issue Research on Sustainable Materials in Building and Construction)

Abstract

This study investigates the axial performance of continuous helix screw piles compared to helical piles through full-scale compression and tension load testing in layered soils. Twenty-three piles were installed and tested. The results demonstrate that screw piles can achieve considerable axial capacity with lower installation torque than helical piles, particularly under tensile loading. The capacity-torque relationship for screw piles was more consistent across both compression and tension, likely due to reduced soil disturbance from the smaller helix projection. Strain gauge measurements indicated that screw piles act primarily as friction piles with the threaded shaft carrying most of the load, especially in stiff clay. On the other hand, the smooth portion of the pile shaft contributed only marginally to resistance in compression and none in tension. The calculated capacity based on theoretical equations aligned well with field results in compression, with screw piles best represented by cylindrical shear failure in sand and a combination of cylindrical shear and individual bearing failure in clay. However, there is greater variability between calculated and measured uplift capacity, possibly due to soil disturbance effects. Additionally, the commonly used helix spacing ratio (S/D) was found to be less applicable to screw piles in predicting failure mode due to their smaller shaft-to-helix diameter difference.

1. Introduction

Over the past twenty years, helical piles have gained increased popularity due to their low noise levels, ease of installation, and rapid deployment. Their low environmental impact and minimal disruption to construction sites have made them a preferred foundation option for structures such as transmission towers, solar panel arrays, pipeline anchors, and various commercial buildings [1,2]. Numerous improvements have been made over the years to the geometry of pile designs.
One of the more recent innovations is the continuous helix screw pile (CHSP), referred to herein as ‘screw piles’ to differentiate it from helical piles. Their design consists of a smooth steel shaft with a continuously spiraling multi-pitch helix, commonly referred to as threads. The lengths of the threaded and smooth portions of the pile depend on the soil type and condition. Compared to helical piles, screw piles require less installation torque, especially in hard soils [3].
Several studies evaluated the performance of screw piles in cohesive and cohesionless soils [4,5,6]. Findings from these studies indicated that the shaft contribution to the overall pile capacity was minimal, as adhesion along the smooth shaft was negligible. This was attributed to soil disturbance during installation, which created annular gaps around the shaft. As a result, the load was primarily carried by the helical threads, while tip resistance was negligible. The lack of tip resistance in the referenced studies is attributed to the tapered threaded segment at the pile tip, which resulted in a pointed end, as well as the limited projection of the threads beyond the main shaft, measuring only 10 to 15 mm.
The above-mentioned investigations calculated the pile axial capacity using conventional theoretical models for helical piles, based on either a cylindrical shear mechanism or individual bearing plates, depending on helix spacing and diameter. For screw piles, considering the threads of a continuous helix pile as individual helices, the pitch of the continuous helix can be defined as spacing between each thread, and the S/D ratio is the pitch-to-diameter ratio, which is typically lower than 3. Therefore, most of these studies suggested that cylindrical shear failure is possibly the predominant failure mechanism for screw piles.
On the other hand, Chen et al. [7] assumed IBM failure as the governing failure mode in their laboratory-scale compression tests on aluminum screw piles embedded in sand. Their piles consisted of a 60 cm long smooth shaft followed by a 24 cm long threaded shaft, and various pitch configurations were investigated to assess their influence on pile behavior. The tested piles had S/D ratios equal to 0.6, 1.3, and 2. Even with these low S/D ratios, they observed IBM failure mode using digital imaging observations and discrete element modeling.
Elsherbiny & El Naggar [8] used numerical modeling to characterize the failure mode of multi-helix piles with spacing ratios of 1D, 2D, and 3D. By examining the soil displacement contours and the contribution of each helix to the load distribution, they concluded that for piles in sand, the failure mode depends on the dilation angle and spacing ratio; IBM was dominant for piles in dense and medium sand, while CSM was seen in piles in loose sand. Moreover, they noticed a transition in the failure mode in the same pile from IBM to CSM for piles in dense and medium sand as the applied load increased.
Lutenegger [9] also reported a transition in failure mode from IBM to CSM in the early stages of pile loading up to a displacement equal to 5% of helix diameter. This transition was observed in piles in stiff clay with interhelix spacing of 1.5D, 2.25D, and 3D. Lanyi-Bennett & Deng [10] tested double-helix piles with interhelix spacing of 1.5D, 3D, and 5D in homogeneous clay. Using strain gauges above and below each helix, they established the failure mode through axial compression load tests.It was concluded that IBM behavior was the dominant mode for all piles; however, for piles with a 3D interhelix spacing, the load distribution indicated increased interhelix resistance (i.e., CSM contribution) with an increase in applied axial load, confirming the findings reported by Lutenegger and Elsherbiny & El Naggar [8,9].
The observations reported by Elsherbiny & El Naggar, Lutenegger, and Lanyi-Bennett & Deng [8,9,10] collectively indicate that both failure modes can coexist and contribute to the pile capacity at certain points during loading and possibly at failure as well. Establishing the failure mechanism of screw piles, individual bearing mechanism (IBM) or cylindrical shear mechanism (CSM), from field test results remains a challenge due to the number of threads involved and the impracticality of instrumenting each individual thread. Assuming the failure mode follows CSM due to the low spacing ratio (lower than 1.5) may not be accurate because it only considers the helix spacing ratio, and not helix diameter/shaft diameter ratio. For helical piles, the difference between shaft and helix diameters is usually much greater than in screw piles.
The objective of this study is to evaluate the performance of screw piles in layered soil through instrumented axial compression and tension pile load tests of different embedded depths and diameters. The load transfer mechanism was evaluated through strain gauge results, and compared to theoretical load distribution calculated using different failure modes. Another objective is to establish the capacity-torque correlation of screw piles and compare it with helical piles.

2. Pile Geometry and Material

The piles used in this study were manufactured using hollow steel pipe (shaft) fitted with continuous helical threads or helical plates welded to it. The tip of screw piles was cut at a 45-degree angle to facilitate installation and reduce required torque. The helical threads start at a certain depth along the shaft and continue towards the pile tip. The shaft was made from structural steel with a minimum yield strength 345 MPa and a minimum tensile strength of 425 MPa. Helical plates and threads were press formed from steel plate with a minimum yield strength 303 MPa and minimum tensile strength of 448 MPa. The geometric parameters of the tested screw and helical piles are presented in Figure 1 and Table 1.

3. Site Investigation

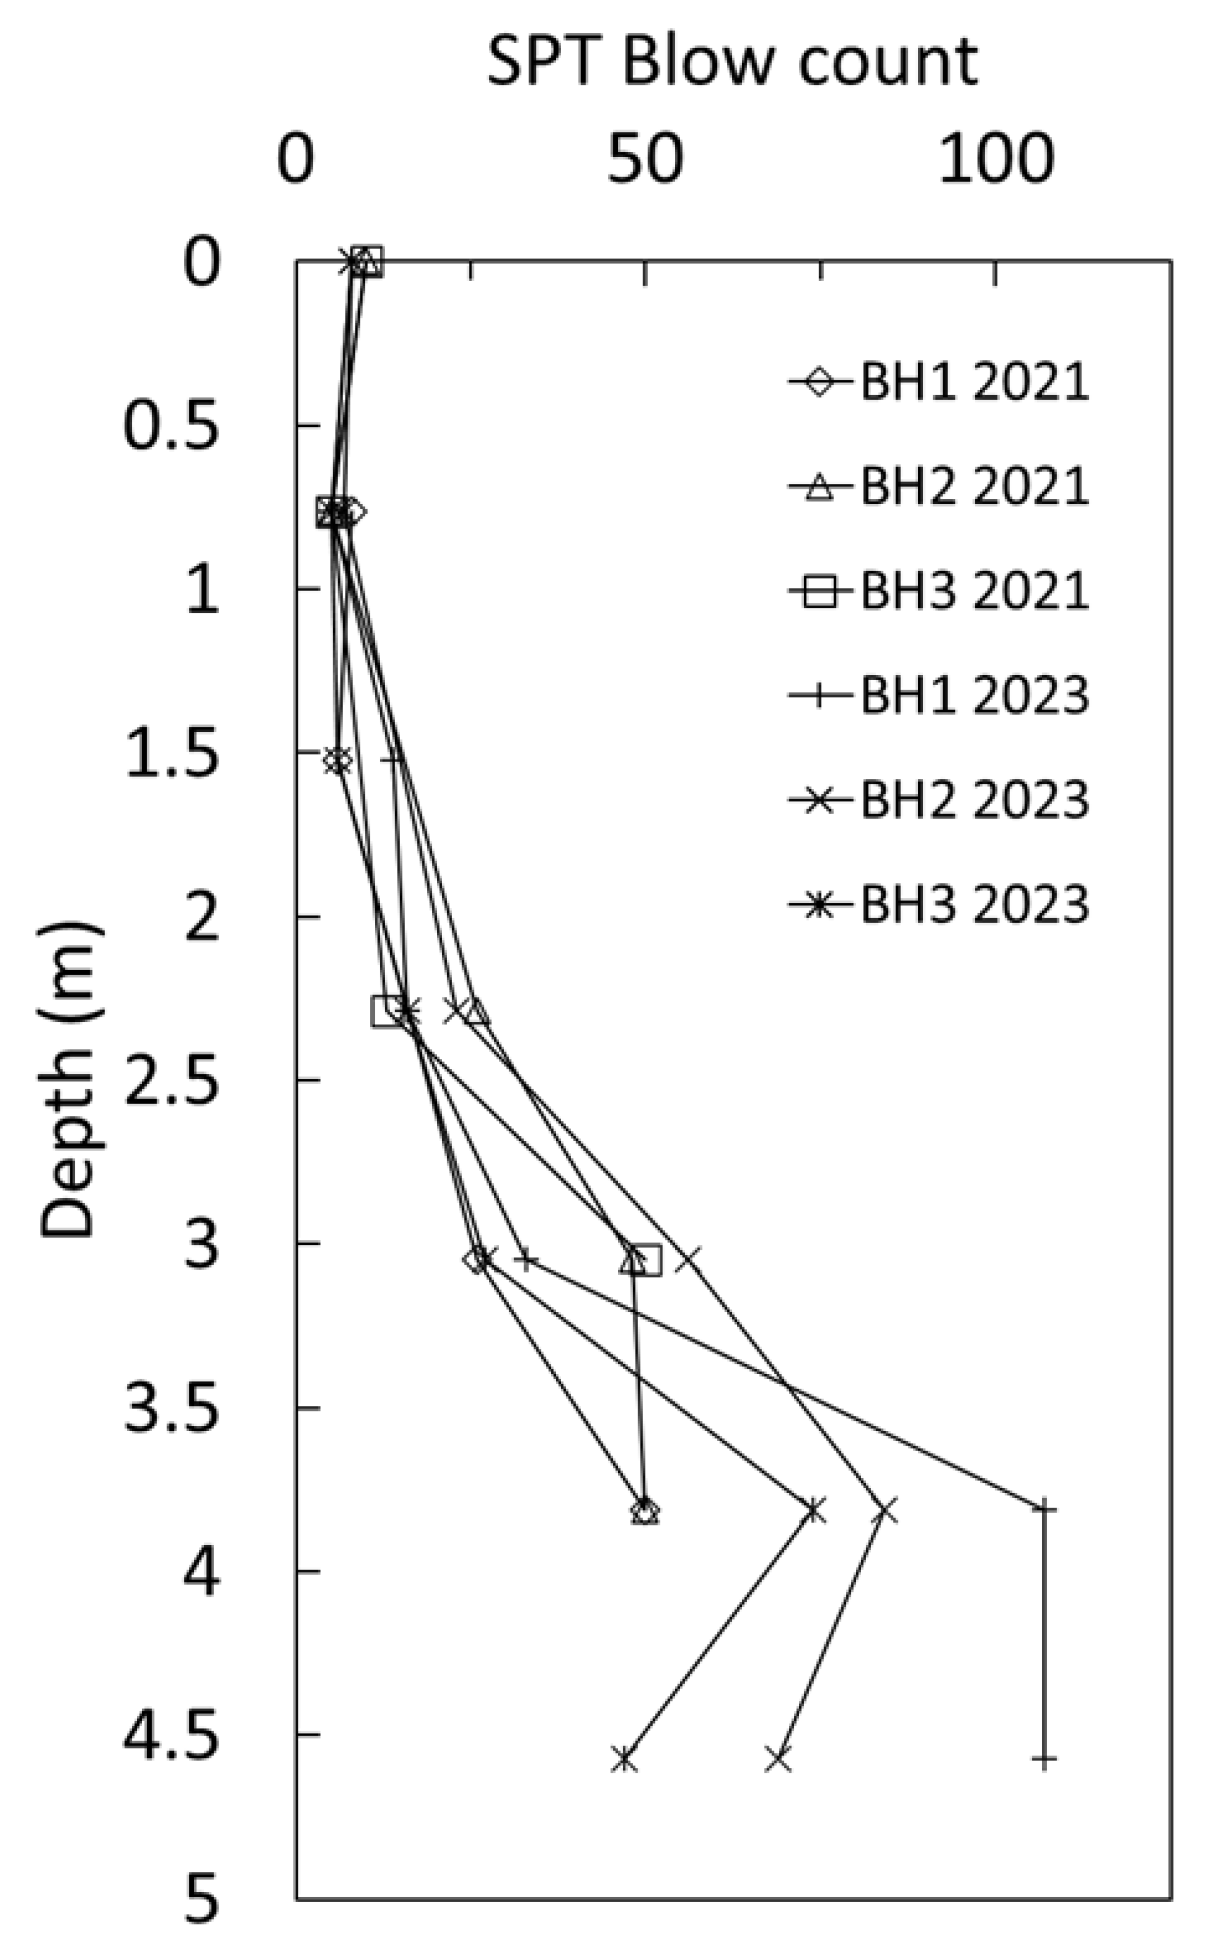
The test site is located in the northeast of the city of London Ontario, Canada, close to London International Airport. The soil consists of 2.3 m of silty sand soil underlain by a layer of stiff to hard, low plasticity clay. Six SPT boreholes were drilled to a depth of 4.6 m below ground surface in the test site area, and split spoon samples were collected and tested in the laboratory to characterize the soil. Three boreholes were drilled in 2021, and three were drilled in 2023. The SPT blow count profile for the six boreholes is plotted in Figure 2. Sieve analysis and particle size distribution were performed in accordance with ASTM D7928 standard [11] for split spoon samples collected in 2023. In addition, Atterberg limits tests were conducted on fine soil samples.
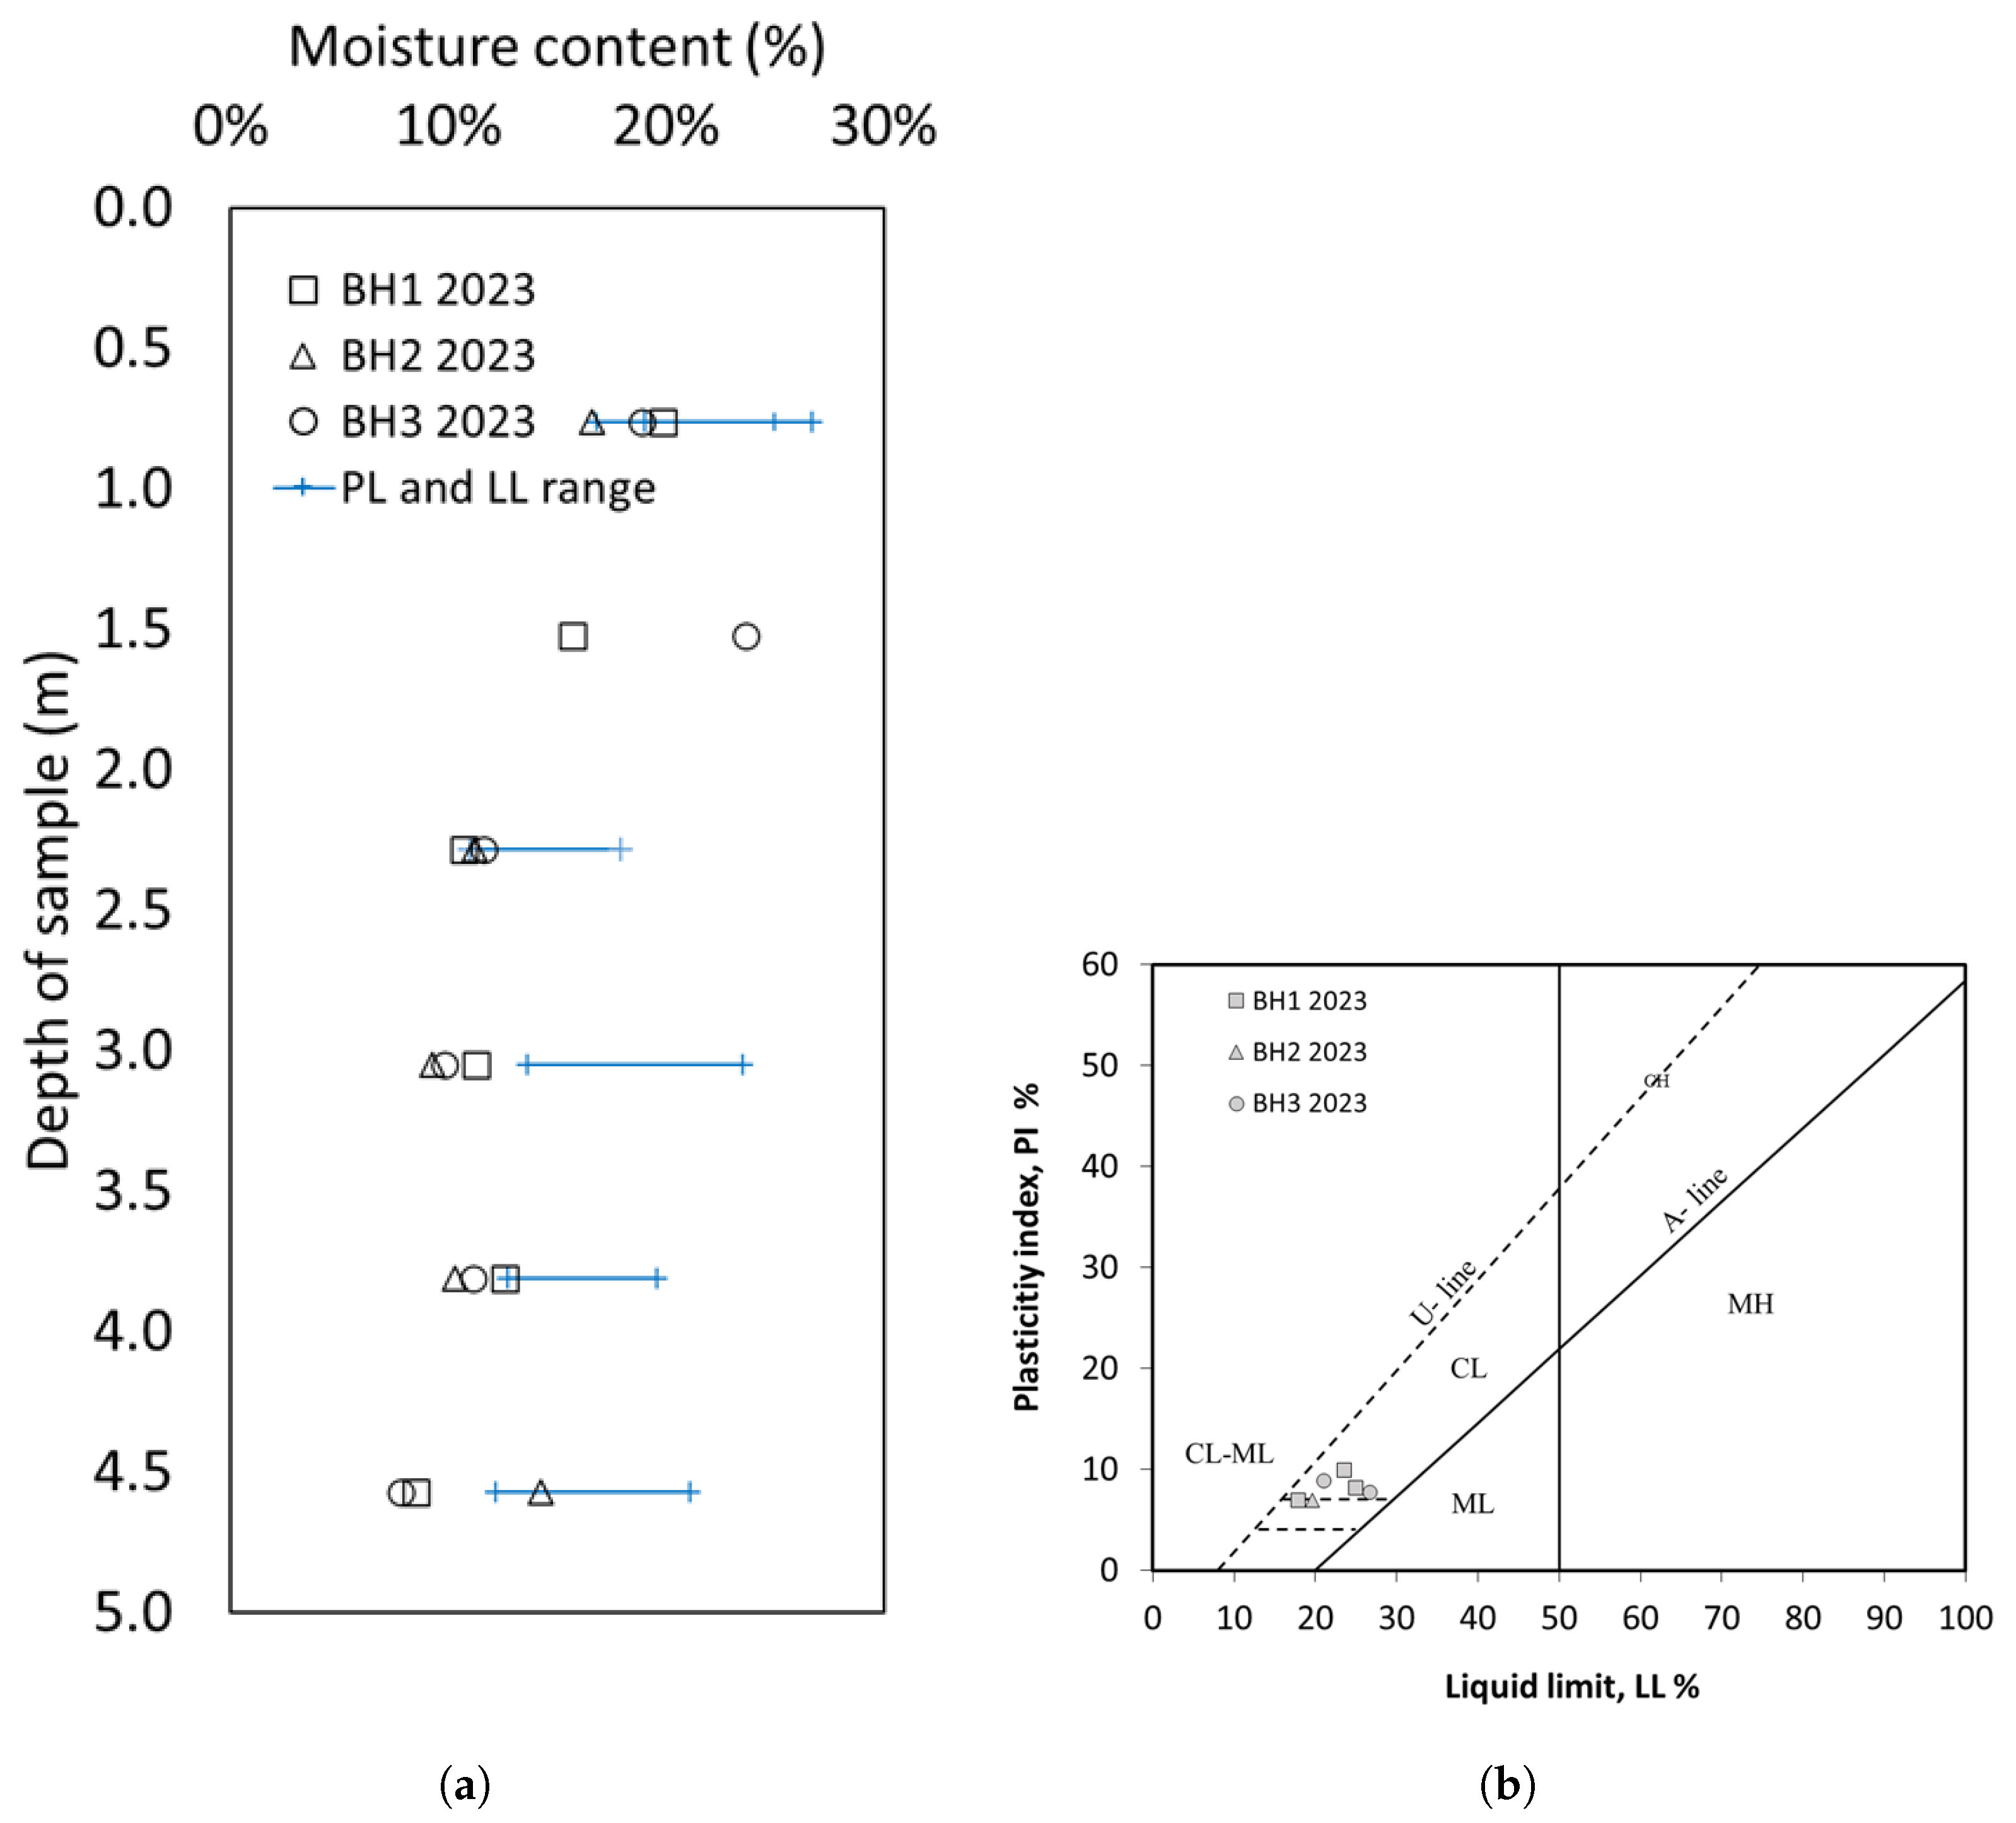
The natural moisture content and Atterberg limits are plotted in Figure 3a. The cohesive soil samples had moisture contents lower than their plastic limits. The soil was classified using the Unified Soil Classification System in accordance with ASTM D2487 standard [12]. Figure 3b shows the plasticity chart of the fine-grained samples. The fine soil samples were classified as low plasticity clay, and the undrained shear strength of the clay ( S u ) was determined using Equation (1), a correlation for low plasticity clay [13]:
S u = 5.36 N 60 ( kPa )
where N 60 is the SPT blow-count number N corrected to correspond to hammer energy efficiency of 60%.
Table 2 summarizes soil properties for the soil profile based on SPT and laboratory tests.

4. Estimated Pile Capacity

Screw piles are installed in the ground by applying torque to the pile head. The installation torque measurement provides valuable information about the capacity of the pile and potentially useful information about soil frictional resistance as well. The installation torque is widely used in practice to determine helical piles capacity using torque-capacity correlation equation [14], i.e.,
Q u = K t × T
where Q u is the pile capacity (kN), K t is an empirical torque factor (m−1), and T is the installation torque (kN/m) averaged over the last 1m of installation. For small diameter (less than 88 mm in diameter) helical piles, K t ranges from 10 to 33 m−1 depending on soil conditions and pile geometry. This method was first introduced by Hoyt & Clemence [14].
The theoretical capacity of screw piles comprises three components. The first component is the frictional resistance along the smooth part of the pile shaft, Q s h a f t , which is calculated as [15]:
Q s h a f t = π d 2 L × σ v K s tan δ = π d 2 L × β σ v
where d (m) is the shaft diameter, L (m) is the embedded length of the smooth shaft, σ v (kPa) is the average effective vertical stress along the shaft, K s is the lateral earth pressure coefficient, and δ is the interface friction angle between the pile material and the surrounding soil. The term K s tan δ is also referred to as the combined shaft resistance factor or ( β ), and f s = σ v × β is the unit shaft resistance (kPa).
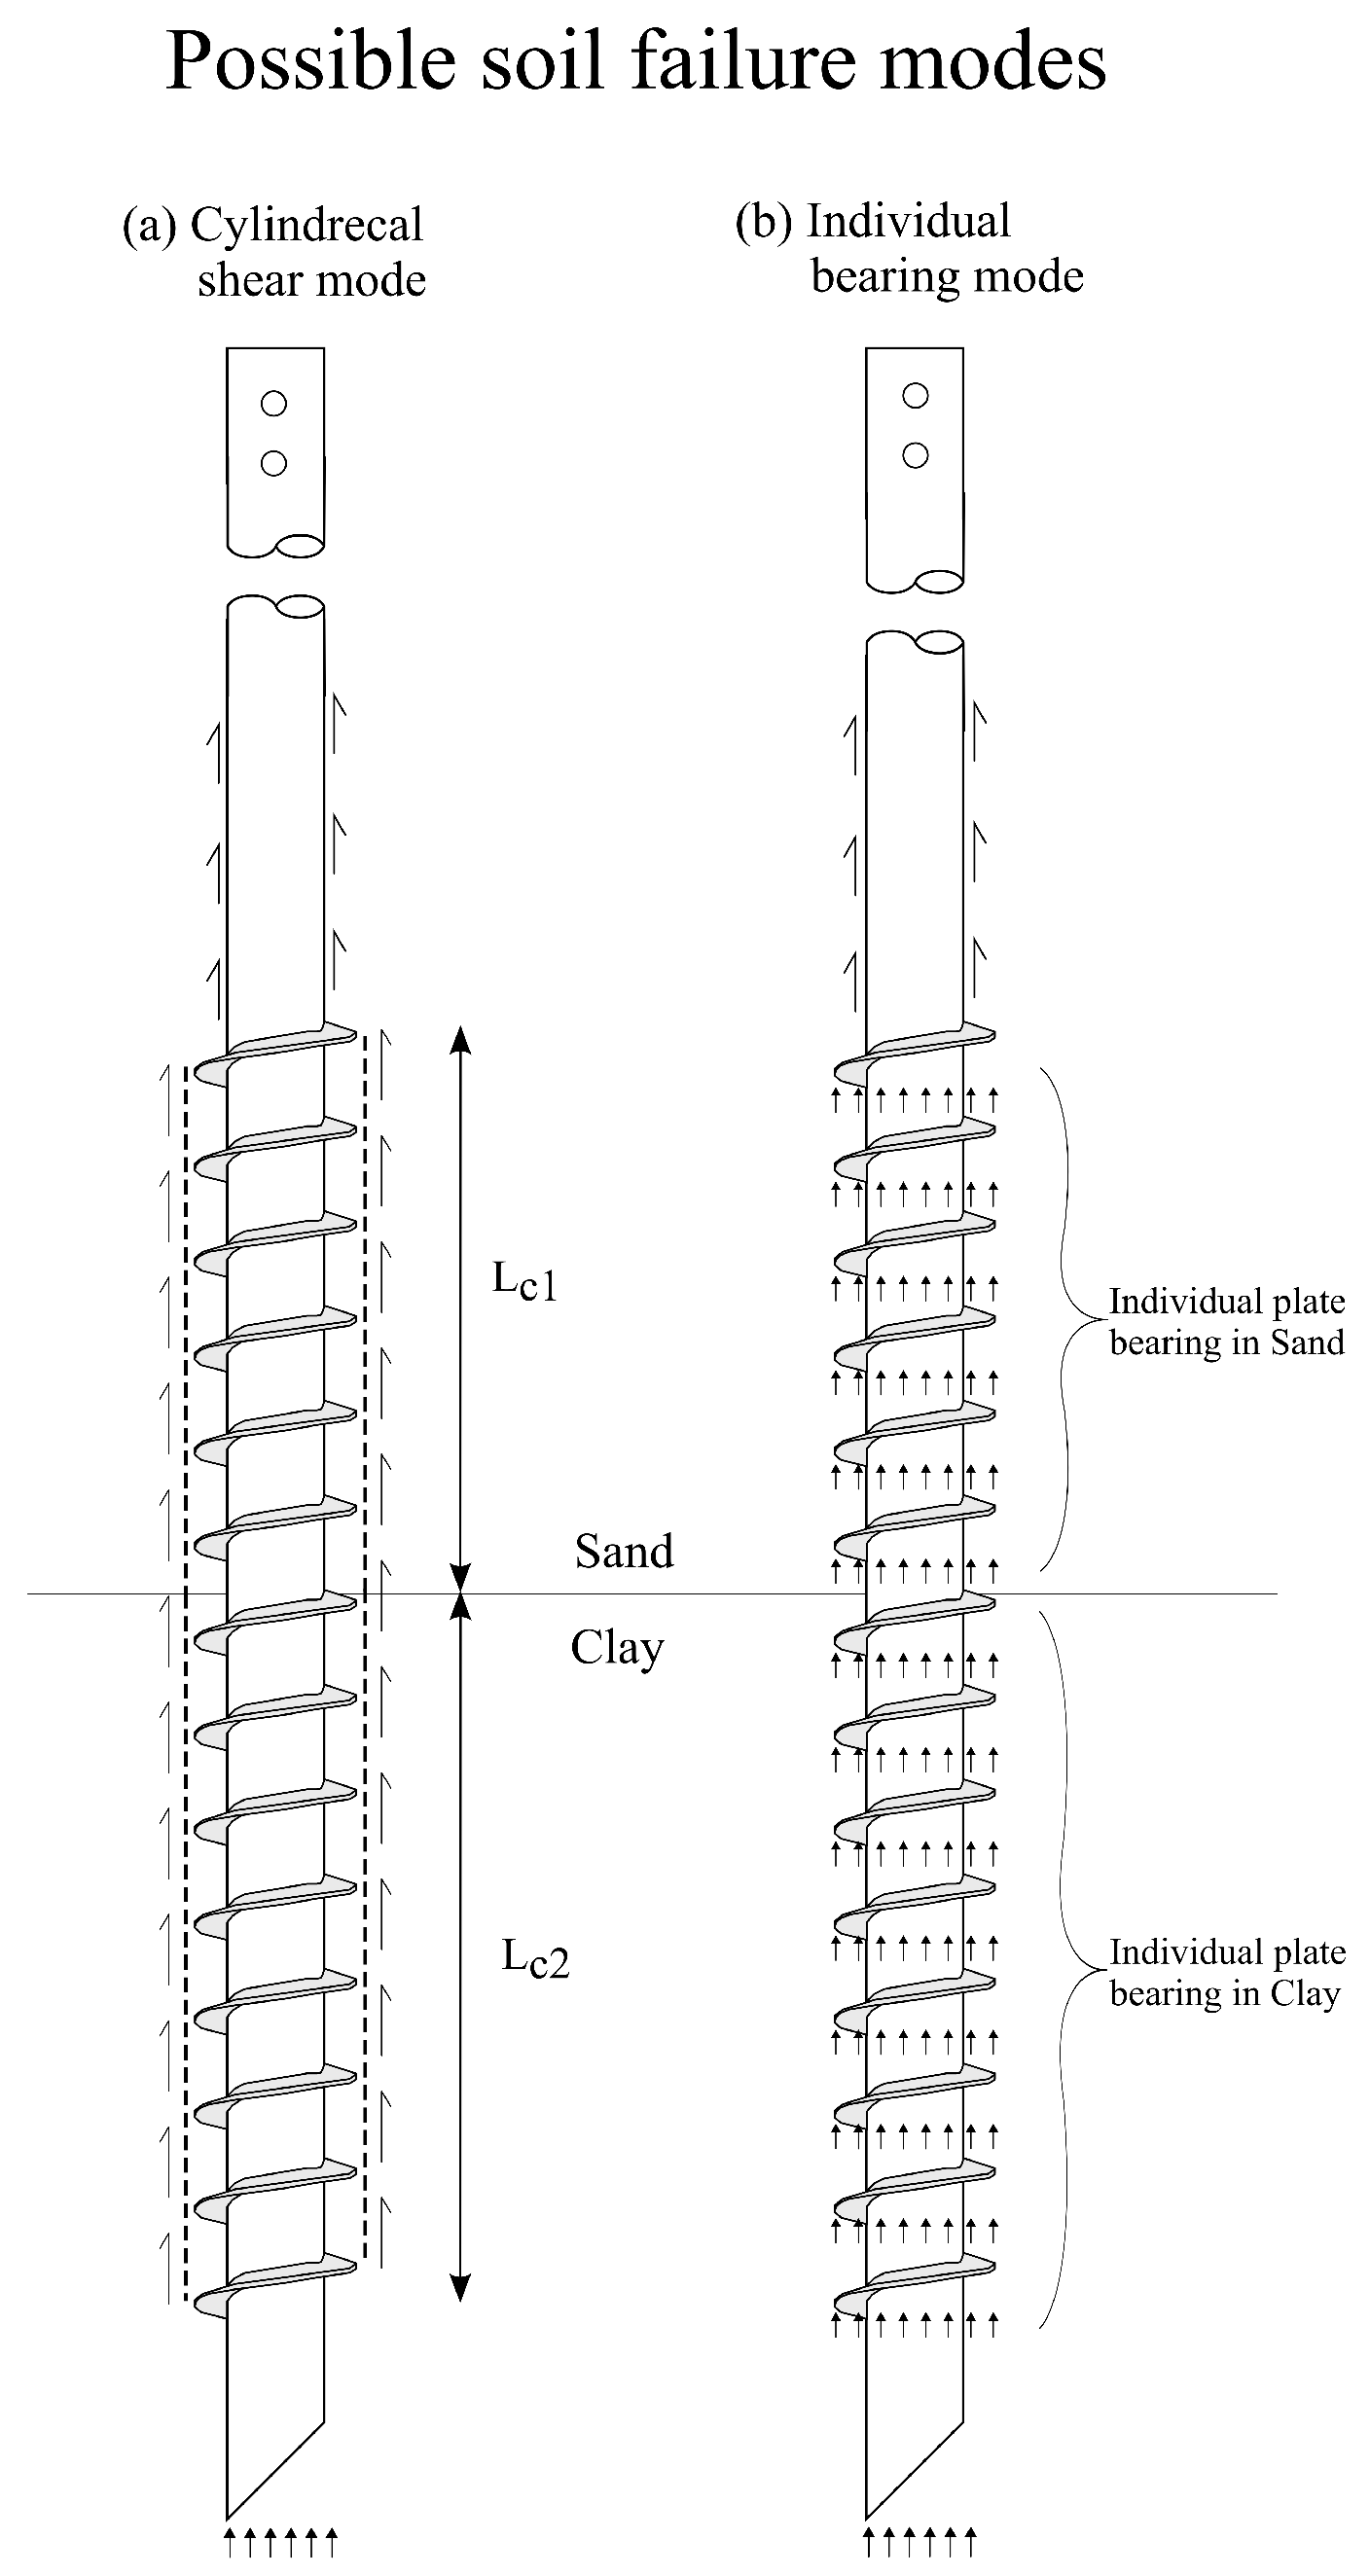
The second component of the pile capacity is derived from the soil resistance along the pile threaded shaft Q t h , which is calculated assuming either cylindrical shear failure mode (CSM) or individual plate bearing mode (IBM) as illustrated in Figure 4. For helical piles with multiple helices, the cylindrical shear mode is assumed to govern the failure mechanism if the spacing between the helices is less than 3 times the average diameter of the helices (i.e., S/D ≤ 3) [8,16,17].
The value of Q t h calculated based on the CSM mode depends on the type of soil surrounding the threads. In sandy soils, Q t h can be calculated as:
Q t h _ s a n d = π D h × L c 1 × σ v K s tan ϕ
where D h is the helix diameter, L c 1 is the length of the threaded shaft in sand, and ϕ is the effective friction angle of sand.
In cohesive soils, the capacity of the threaded shaft assuming CSM failure surface is based on the soil undrained shear strength, i.e.,
Q t h _ c l a y = π D h × L c 2 × S u
where L c 2 is the length of the threaded shaft in clay and S u is the average undrained shear strength along L c 2 .
In the case of individual plate bearing mode, Q t h in sandy soil and in cohesive soil are calculated based on Equations (6) and (7), respectively [18]:
Q t h _ s a n d = π D h 2 i = 1 n γ i H i N q
Q t h _ c l a y = π D h 2 i = 1 n C u i N c
where: n is the number of threads, γ i , H i , and C u i are the unit weight, embedment depth, and undrained cohesion of the ith thread, N q and N c are the bearing capacity factors for sand and clay.
The third component of the pile capacity is its base bearing capacity Q b , which depends on the type of soil underneath the tip. In Sandy soil, it is given by:
Q b = π 4 D h 2 × γ H N q
where H is the embedment depth of the last helical thread. In cohesive soils, it is given by:
Q b = π 4 D h 2 × S u N c
For clay under undrained conditions, it is common to assume N c = 9 [18].

5. Experimental Program

In total, 23 full-scale piles were installed and subjected to axial tension and compression load tests. The test piles were as follows: 3 Piles of type S1, 4 piles of type S2, 4 piles of type S3, 3 piles of type S4, 3 piles of type H1, and 6 piles of type H2. The layout of the test site and borehole location is shown in Figure 5. Two piles of type S1, three piles of type S3, and two piles of type S4 were instrumented with electrical strain gauges at 5 levels along the pile shaft. A pair of strain gauges was attached to the pile at each level to enable measuring both axial and flexural strains during loading. Four of the installed screw piles, namely S1–C1, S1–C2, S3–C2, and S3–C3, were re-torqued an additional 0.3 m two months after the axial compression tests were performed. These re-torqued piles were then tested in axial tension and renamed as S2R–T1, S2R–T2, S4R–T1, and S4R–T2, respectively. The uplift performance of the re-torqued piles was compared to that of freshly installed piles.
The test results were used to estimate the axial capacity of all piles and construct the capacity-torque correlation for the tested piles. The strain gauge data were used to calculate the load distribution along the pile, enabling a more detailed analysis of screw pile behavior. This data also helped estimate the shaft frictional resistance and assess the contribution of the threaded shaft to the overall capacity.

5.1. Test Setup and Procedure

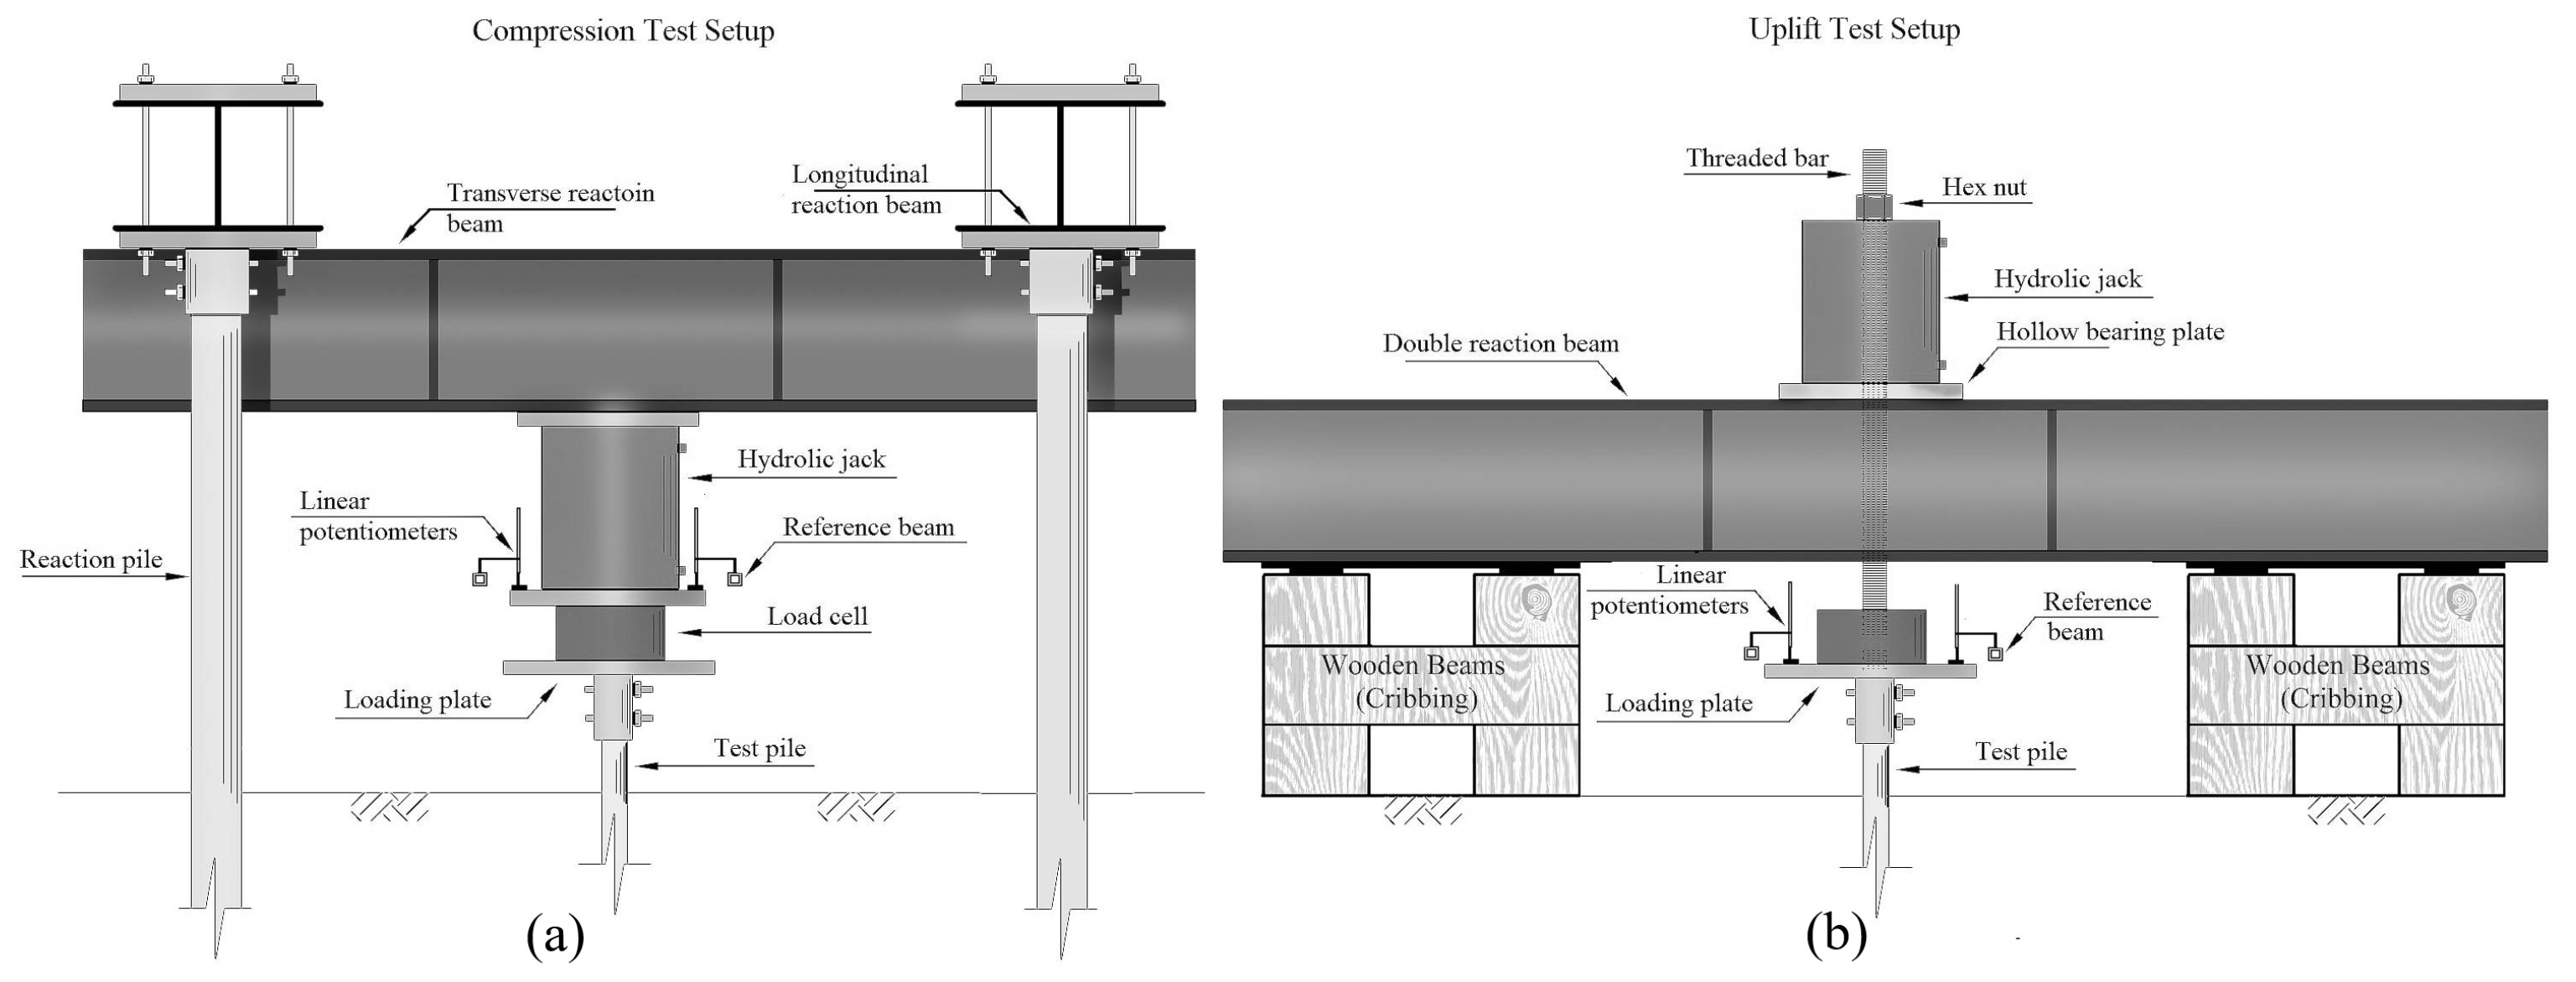
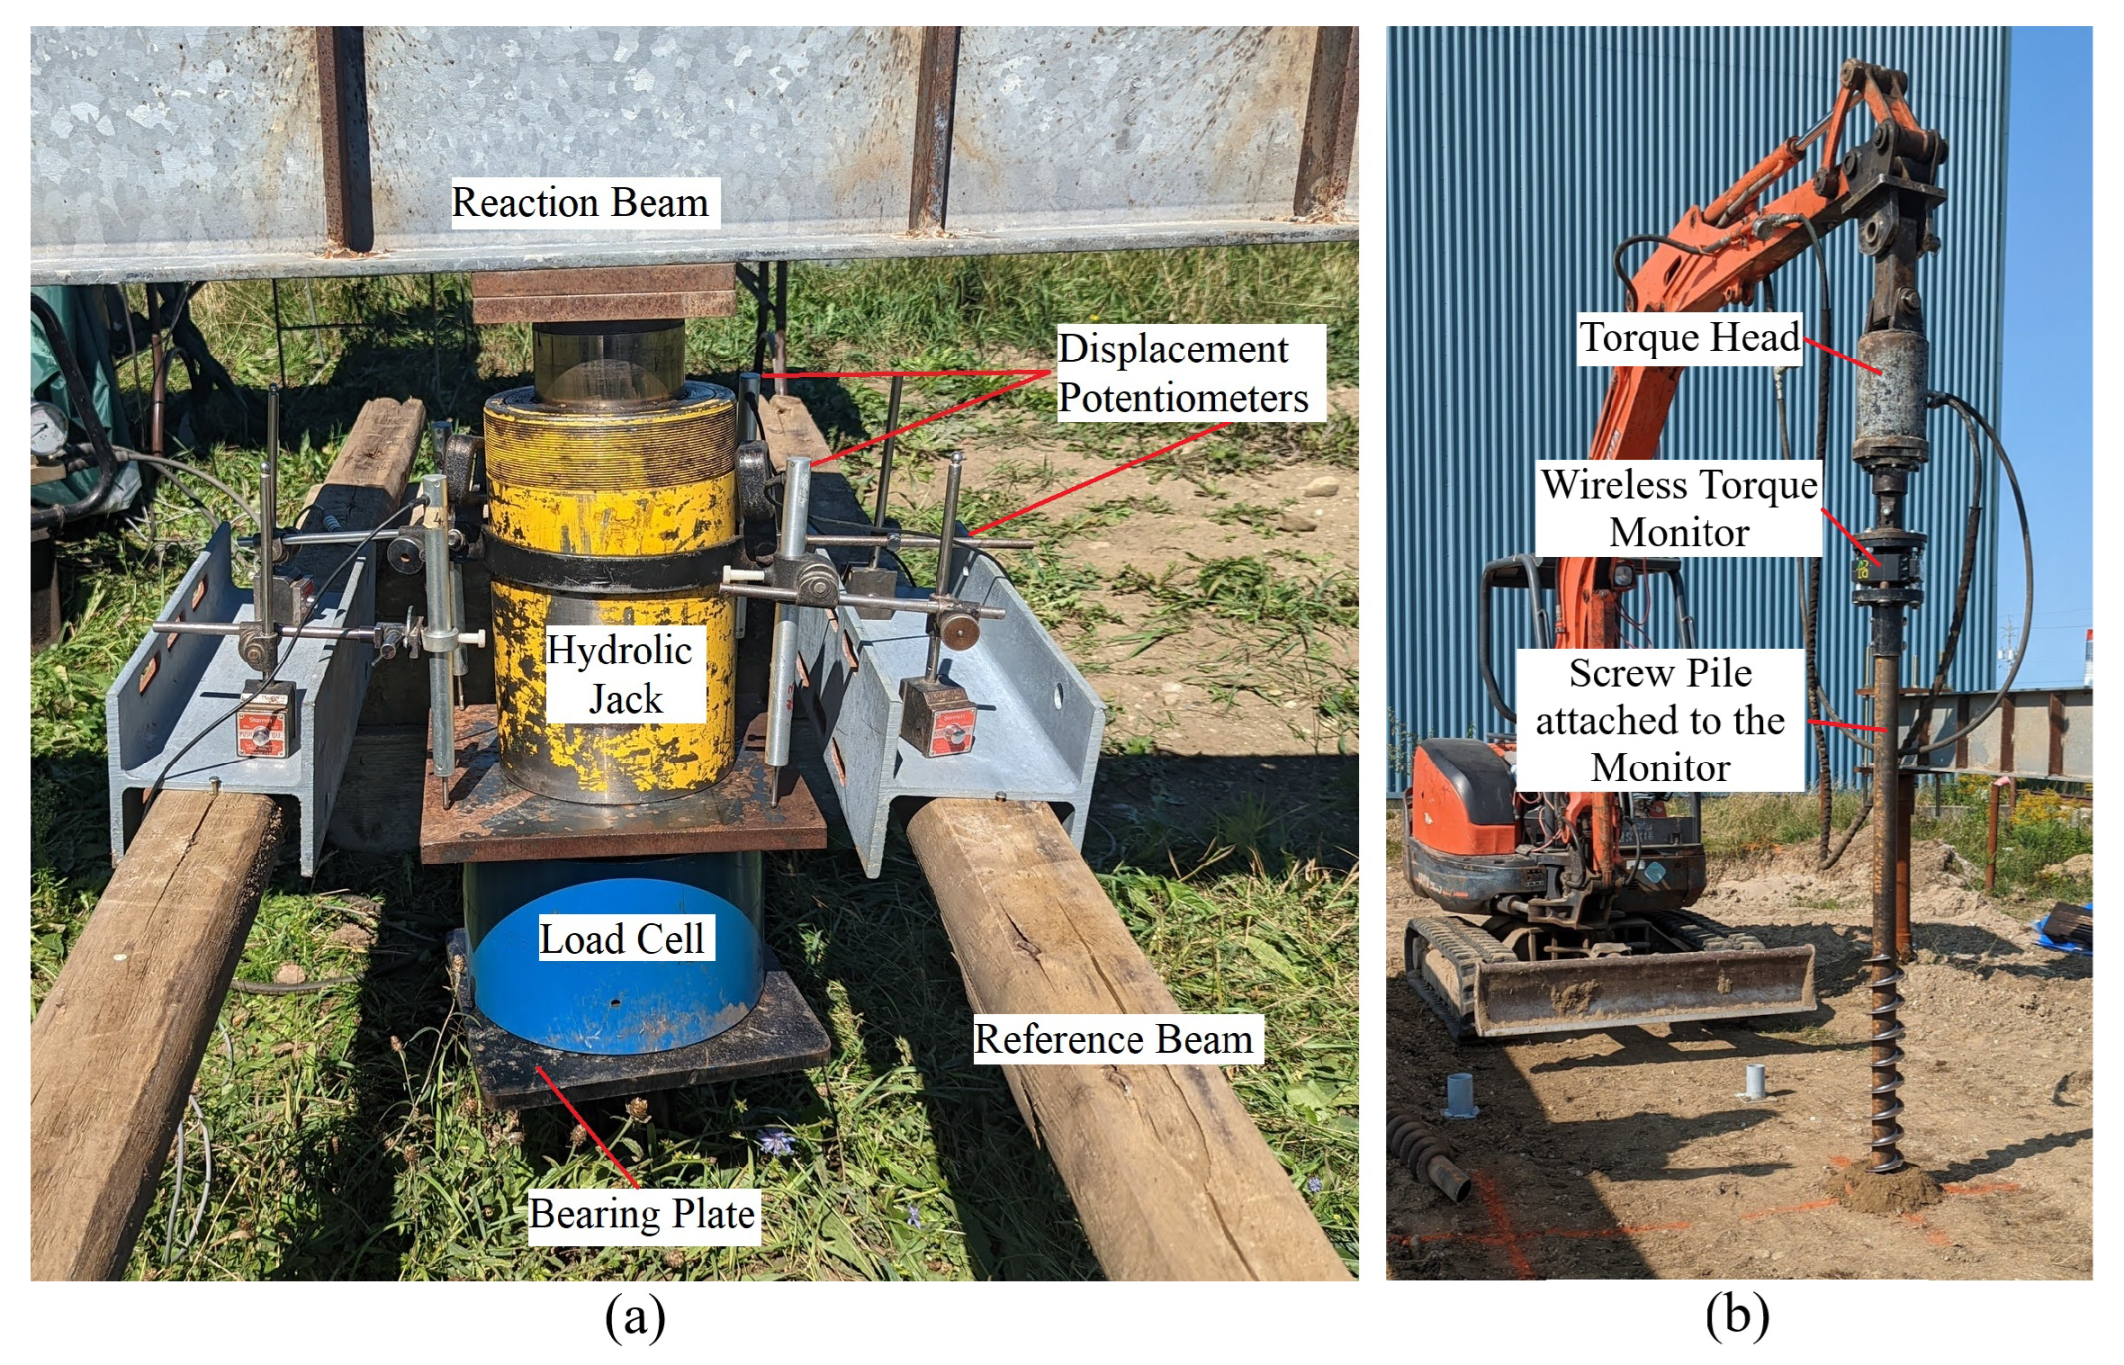
Compression and uplift tests were performed in accordance with the quick load test procedure outlined in ASTM standards [19,20]. The test setup is shown in Figure 6, which comprises the reaction system for compression tests consisting of four reaction piles and three reaction beams, two longitudinal and one transverse beam. The pile head instrumentation is shown in Figure 7a. For all pile load tests, each load increment was 5 kN, and was kept for 5 min before the next load increment was applied. The loading continued until plunging failure occurred, after which the load was reduced gradually in four equal increments, each maintained for 5 min. In the uplift test setup, one main double-web reaction beam was used, resting on wooden cribs. A threaded tension rod was inserted through the hydraulic jack in an opening between the double-web beam to attach to the load cell, as shown in Figure 6b. The rod was fixed to the jack with a hex nut. The distance between all piles was kept equal to or greater than five times the helix diameter to satisfy the ASTM standards.

5.2. Instrumentation

The pile head displacement was measured using four linear potentiometers placed at the corners of the bearing plate, as shown in Figure 7a. The average displacement of all four potentiometers was used as the pile head displacement to mitigate any possible misalignment with the vertical axis. The load was measured using a 400 kN capacity load cell (Interface, Scottsdale, AZ, USA) placed on top of the bearing plate. The load cell can measure both compression and tension loads.
The installation torque was logged for all piles every 15cm of installation depth using a wireless torque monitor (Pro-Dig, Elwood, KS, USA) attached to the torque head of the installation machine (Figure 7b). The torque monitor also recorded motor RPM and rotation angle with an accuracy of 0.3%.
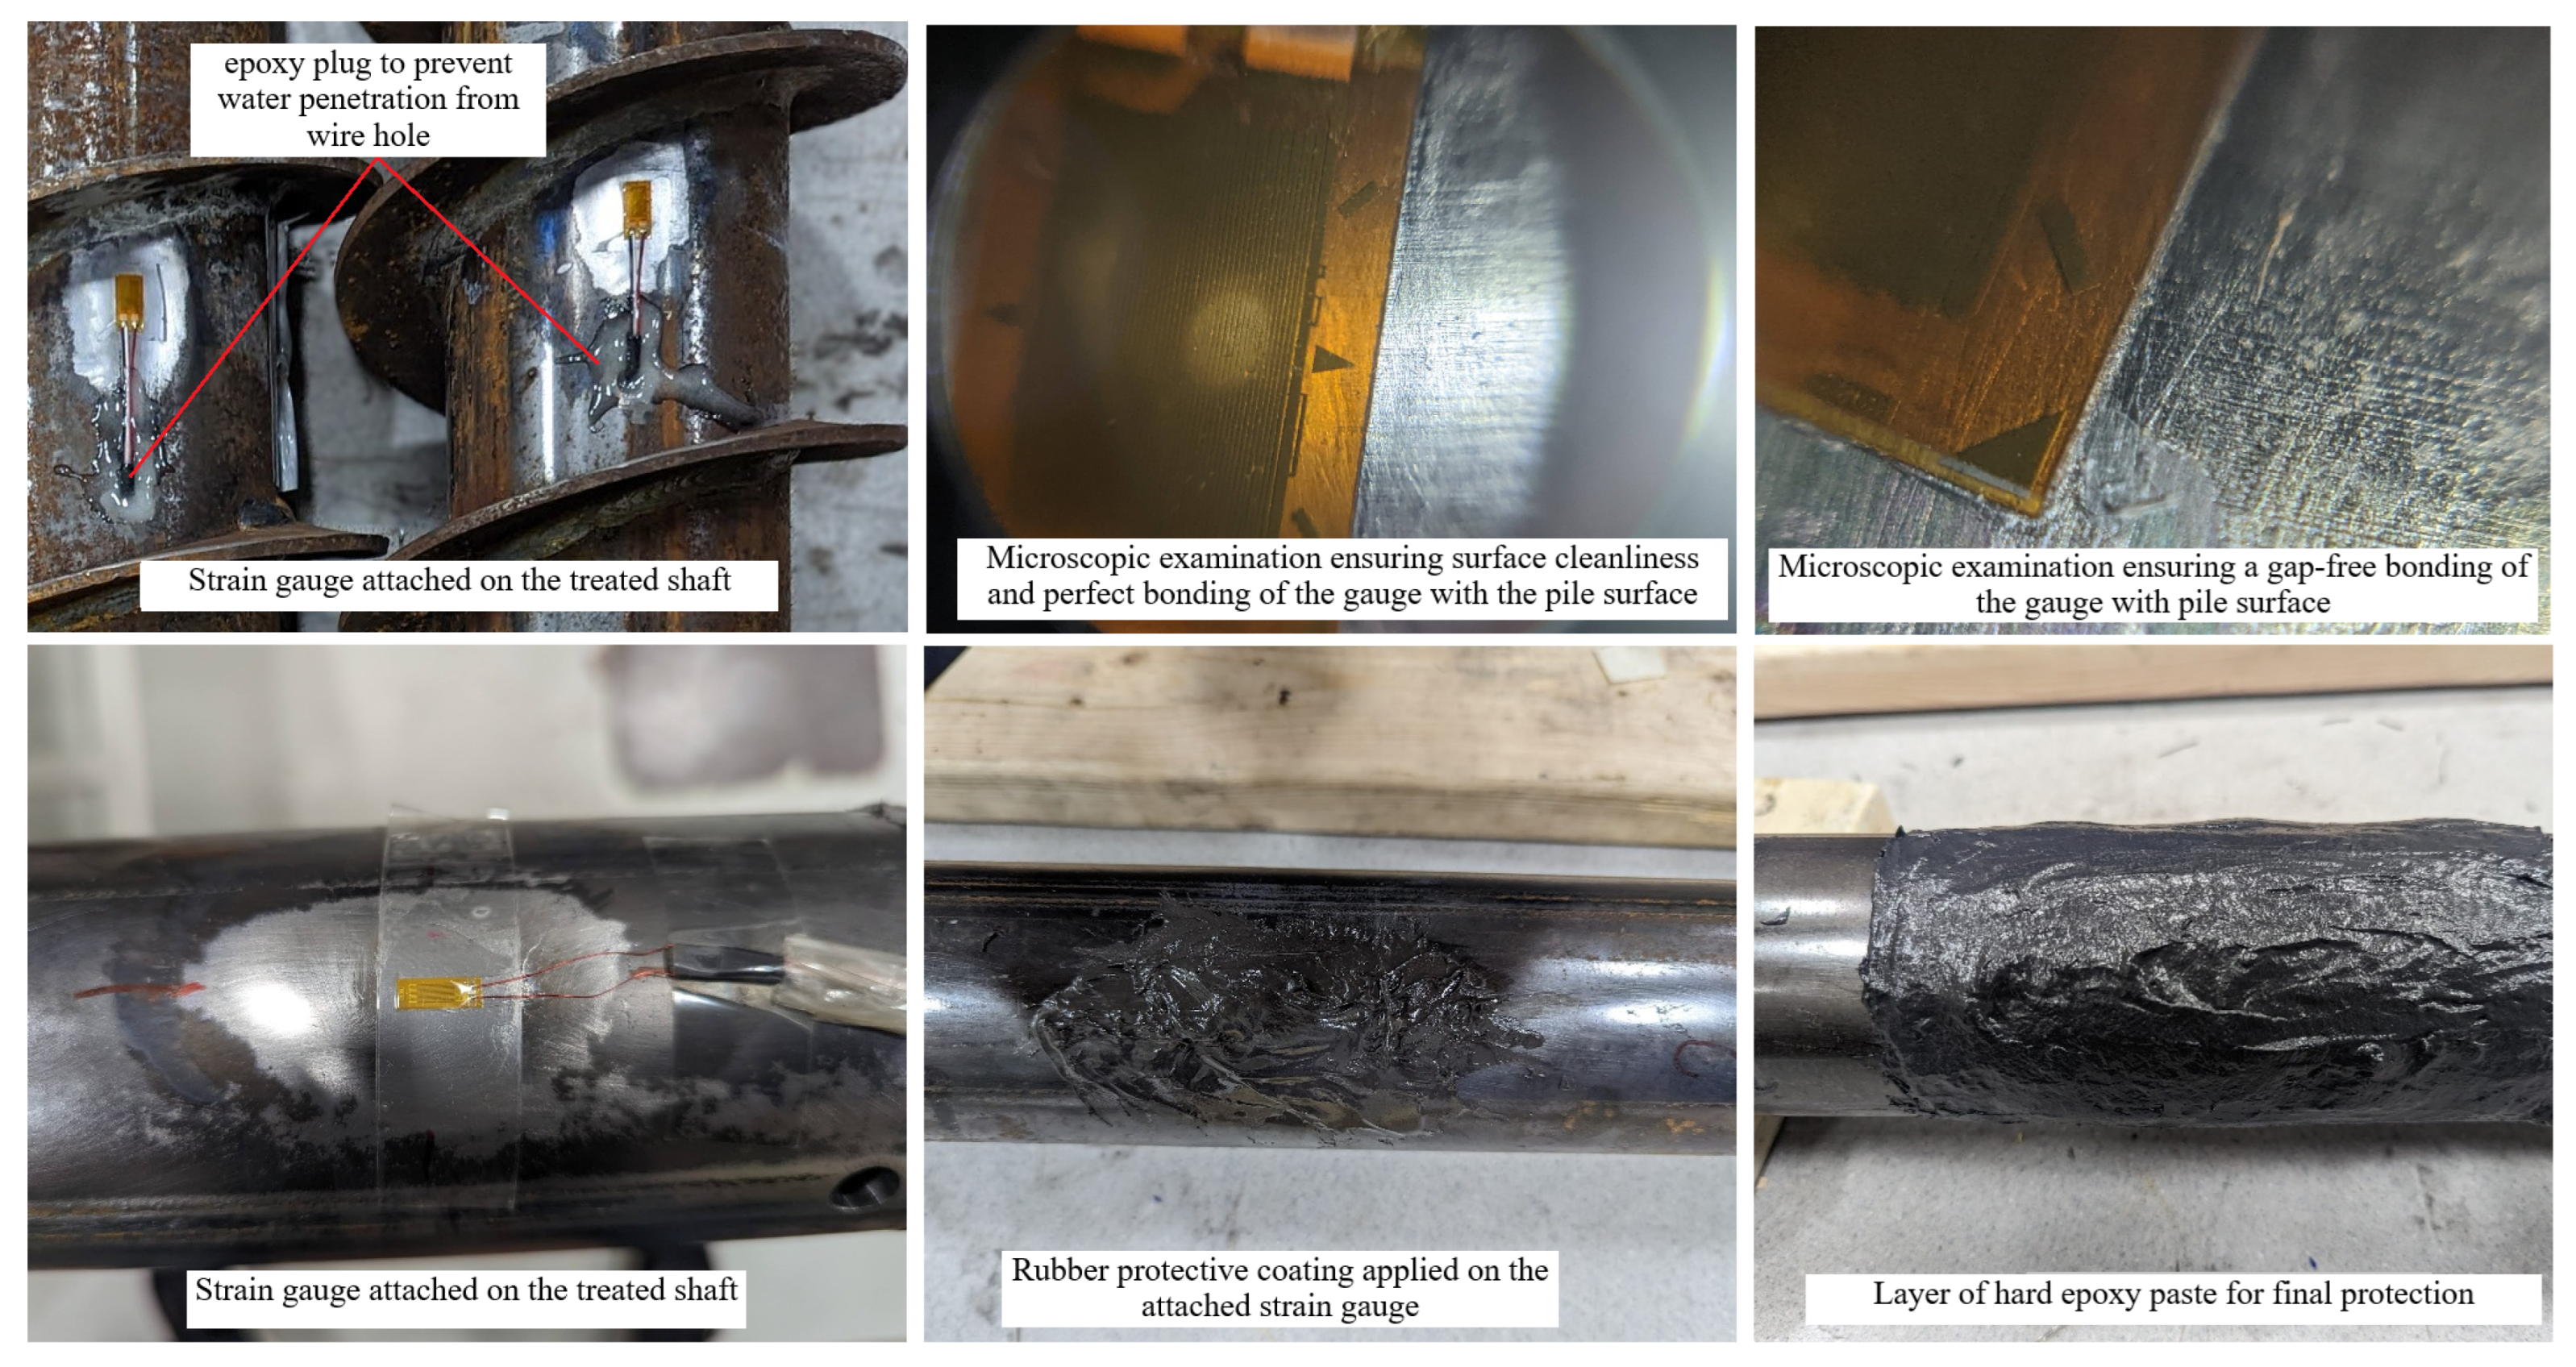
Seven screw piles were instrumented using Micro Measurement electric foil strain gauge model C2A-06-250LW-120 and CEA-06-250UWA-350/P2 (Micro Measurements, Wendell, NC, USA) to measure the internal load distribution along the pile length. The strain gauges were placed in pairs opposite of each other at five levels; the first pair is placed at the ground surface, the second pair at the midpoint of the smooth shaft, the third pair at the beginning of the threaded shaft, the fourth pair at the midpoint of the threaded shaft, and the fifth pair close to the pile toe. Attachment of strain gauges on the pile shaft was completed as per the following procedure, as recommended by the manufacturer:
First, the pile shaft surface where the strain gauge was to be attached was degreased with alcohol solution, then dry-abraded using 200-grit silicon carbide paper, followed by wet-abrading with 320-grit silicon carbide paper on a surface wetted with a mild phosphoric acid solution supplied by the strain gauge manufacturer. The acid action was then neutralized by rubbing the treated surface with an ammonia-based solution, also provided by the manufacturer. The strain gauge was attached to the treated surface using M-Bond 200 adhesive (Micro Measurements, Wendell, NC, USA). The secured strain gauge was carefully examined using a microscopic lens to ensure surface cleanliness and complete bonding between the strain gauge and pile shaft.
After 24 h of attaching the gauge, two layers of protective coatings were applied: the first layer was a rubber coating for moisture isolation and mechanical protection, and the second layer was a heavy-duty adhesive epoxy paste (PC-Products, Allentown, PA, USA), composed of two components mixed together and applied on top of the rubber coating. The epoxy paste was left to cure for 24 h, forming a hard protective layer that provided the final mechanical protection to the gauge. Figure 8 shows the strain gauge attachment on the treated shaft and the different protective layers.

6. Results and Discussion

6.1. Installation Torque

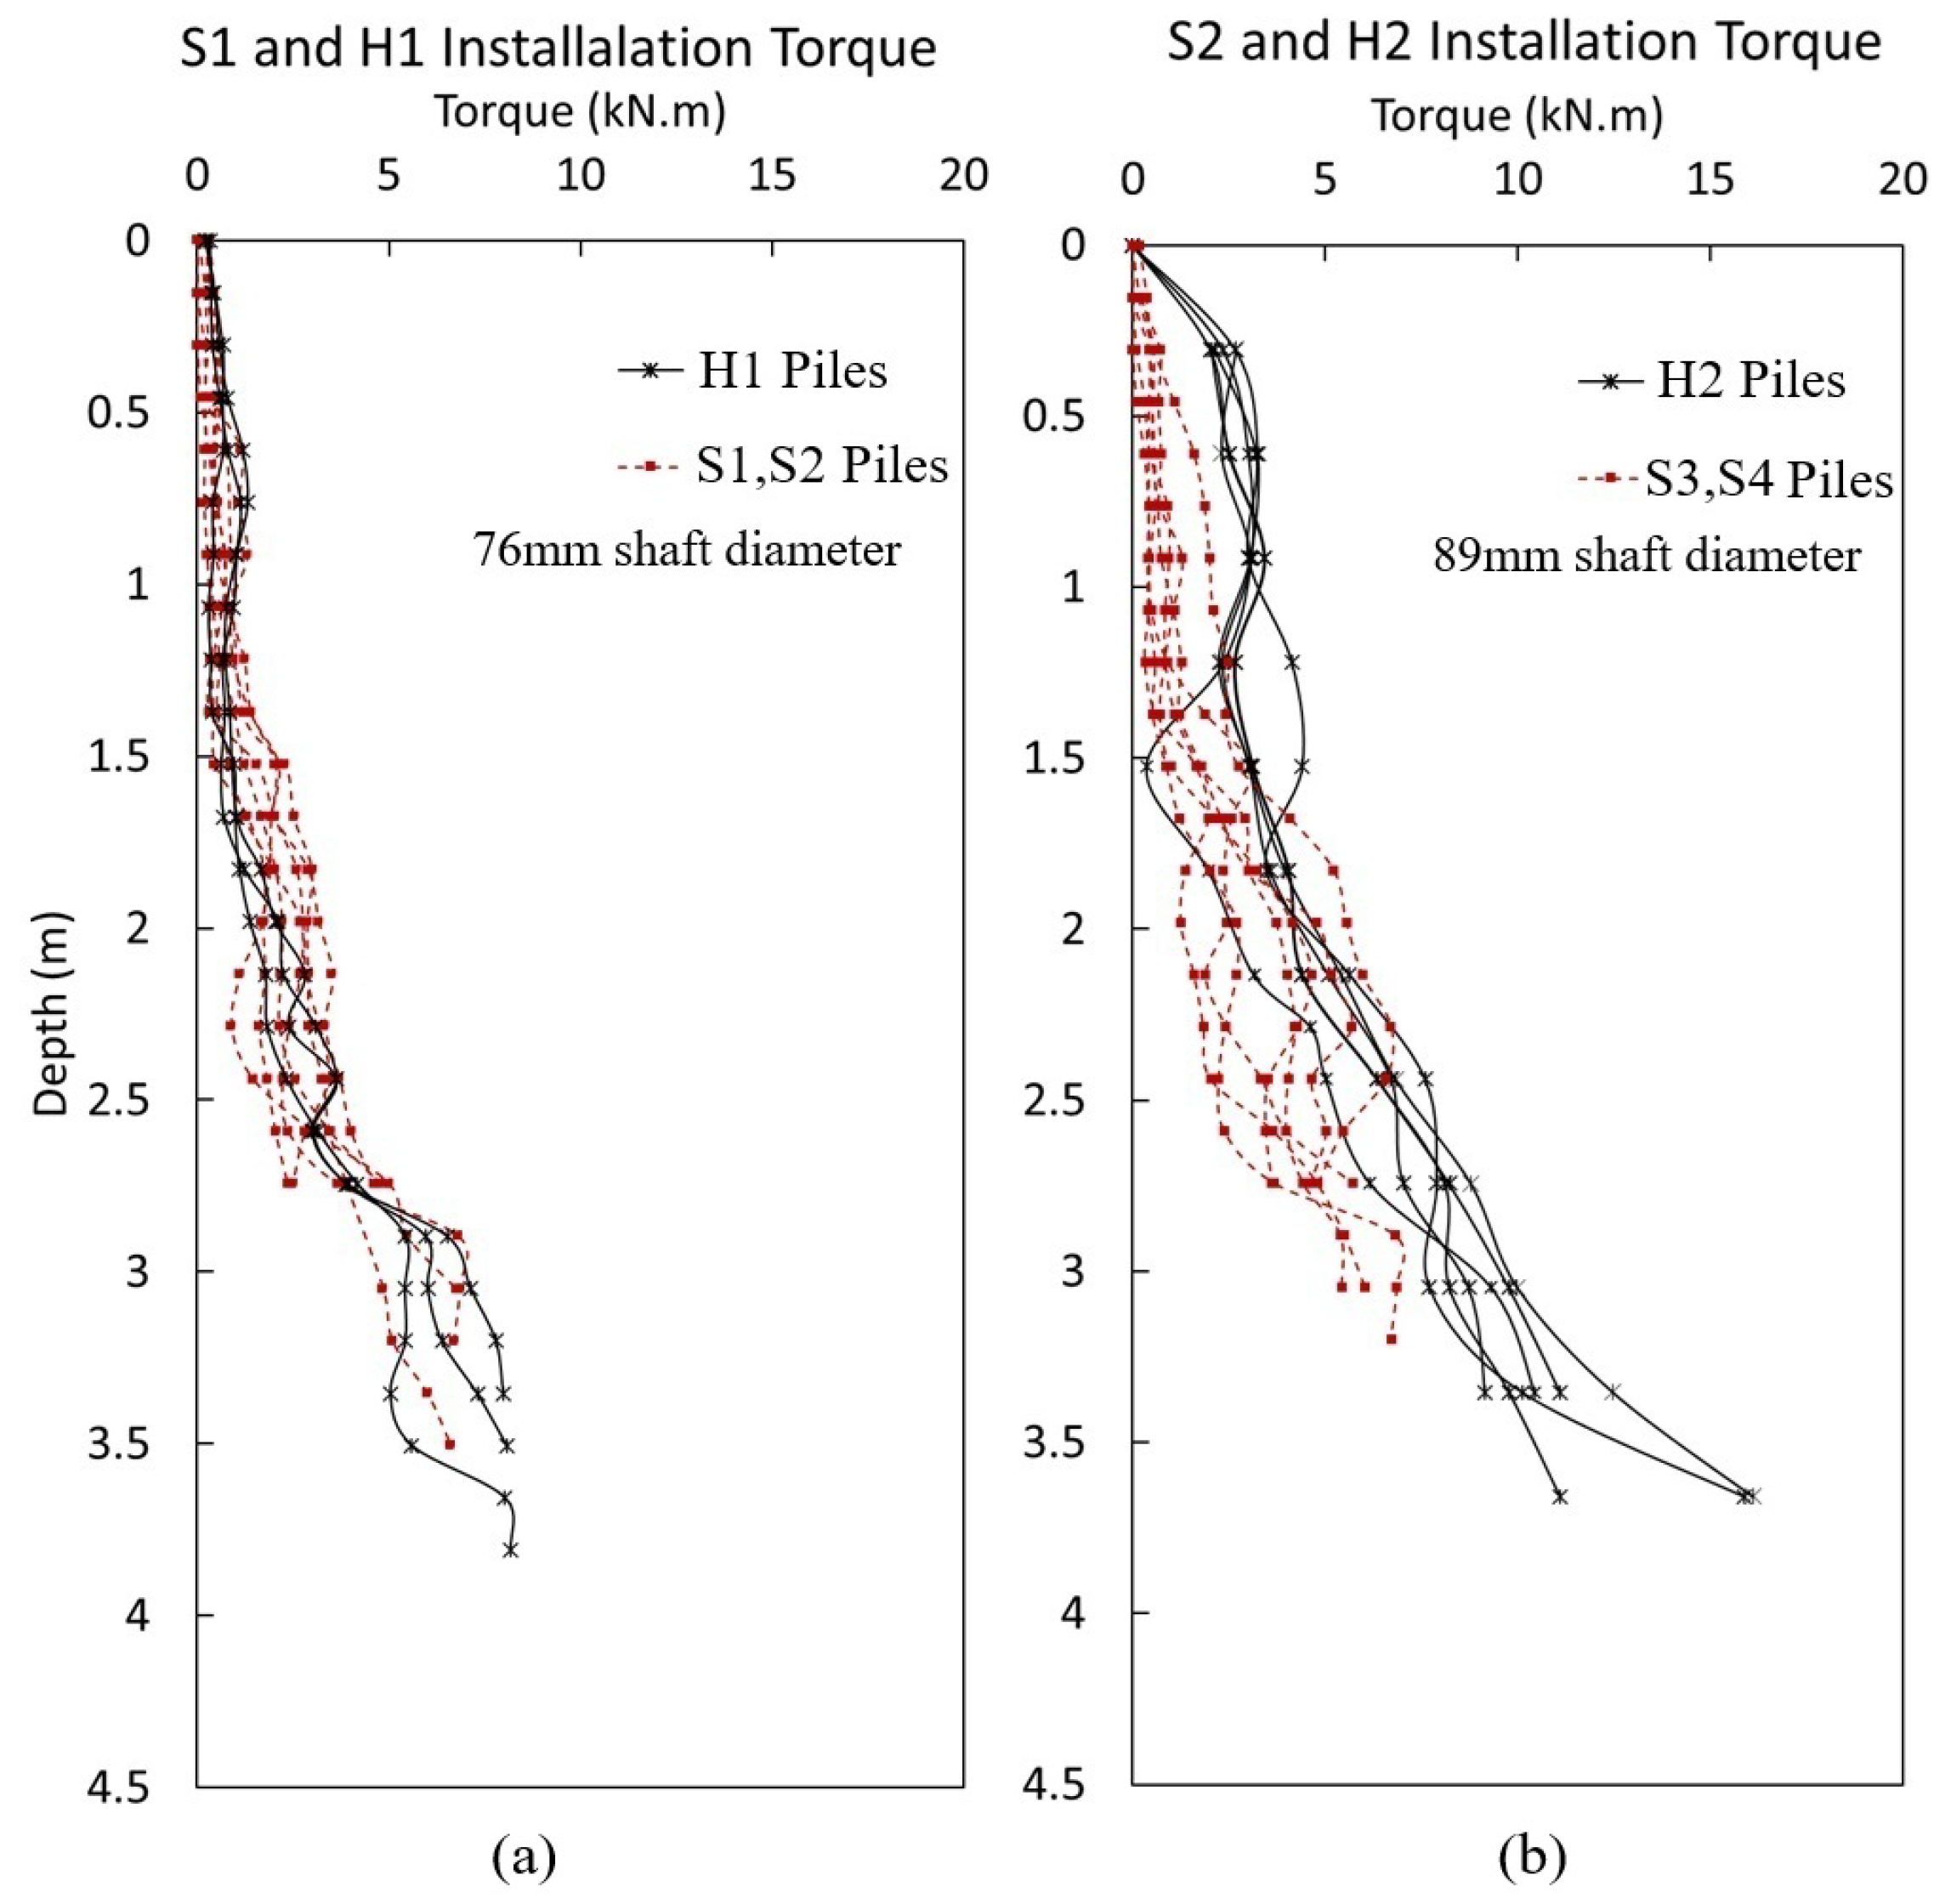
Installation torque was continuously monitored and logged with depth for all piles during installation. In screw piles, increasing the pile shaft diameter by 17% and helix diameter by 20% resulted in a 12% increase in installation torque required to reach 2.74 m. In helical piles, the same increase in shaft diameter with an increase of 40% in helix diameter led to a 93% increase in torque required to reach 2.74 m. This observation shows that helix diameter affects installation torque, particularly in stiff soils. Figure 9 compares the torque profiles for the helical and screw piles. For piles with a 76 mm shaft diameter, where helical piles had 100% bigger helix than screw piles, no significant difference in torque was observed between the two pile types. However, for the larger 89 mm diameter shafts, helical piles required, on average, approximately 68% more torque than screw piles to reach a depth of 2.74 m, and this is due to the size of the helix in the helical pile which was 133% more compared to screw the pile.

6.2. Pile Load Test

Due to the absence of a distinct failure point in many load tests, the pile capacity is determined from the load–displacement response curve employing a specified “failure” criterion. In some pile load tests, the load–displacement curve did not exhibit a well-defined failure point, and the pile continued to sustain increasing loads even at relatively large displacements. This behavior is particularly pronounced in sandy soils, where progressive densification and strain hardening around the pile and under the pile toe result in a continuous increase in resistance with displacement [21]. In other cases, the failure load could be defined easily when the pile displacement increases without any increase in the applied load, which is denoted as “plunging failure” and is influenced by the soil strength regardless of the amount of settlement [22]. Since the capacity is governed by soil strength and structural serviceability requirements, several methods were proposed in the literature to estimate the pile capacity from load-displacement curves by limiting the pile head movement and considering the stiffness of the pile system.
Several methods have been proposed to estimate pile capacity based on limiting the pile head displacement [21]. However, the application of these methods to the test piles in this study appears to underestimate the capacity of screw piles. Hirany & Kulhawy [23] introduced a graphical approach to estimate pile capacity from load-displacement curves. In this method, the curve is divided into three regions: an initial linear-elastic zone, a transitional nonlinear zone, and a final linear zone with a lower slope. A line (L1) is extended from the initial elastic portion, and another line (L2) is drawn from the final linear portion. The intersection point of L1 and L2 represents the estimated pile capacity. This method is commonly referred to as the L1–L2 method. Mansour & El Naggar [21] recommended the L1–L2 method for estimating the capacity of helical and pressure-grouted helical piles, citing its independence from pile geometry. Accordingly, this method is adopted in the present study to estimate the compression and tension capacities of screw and helical piles.
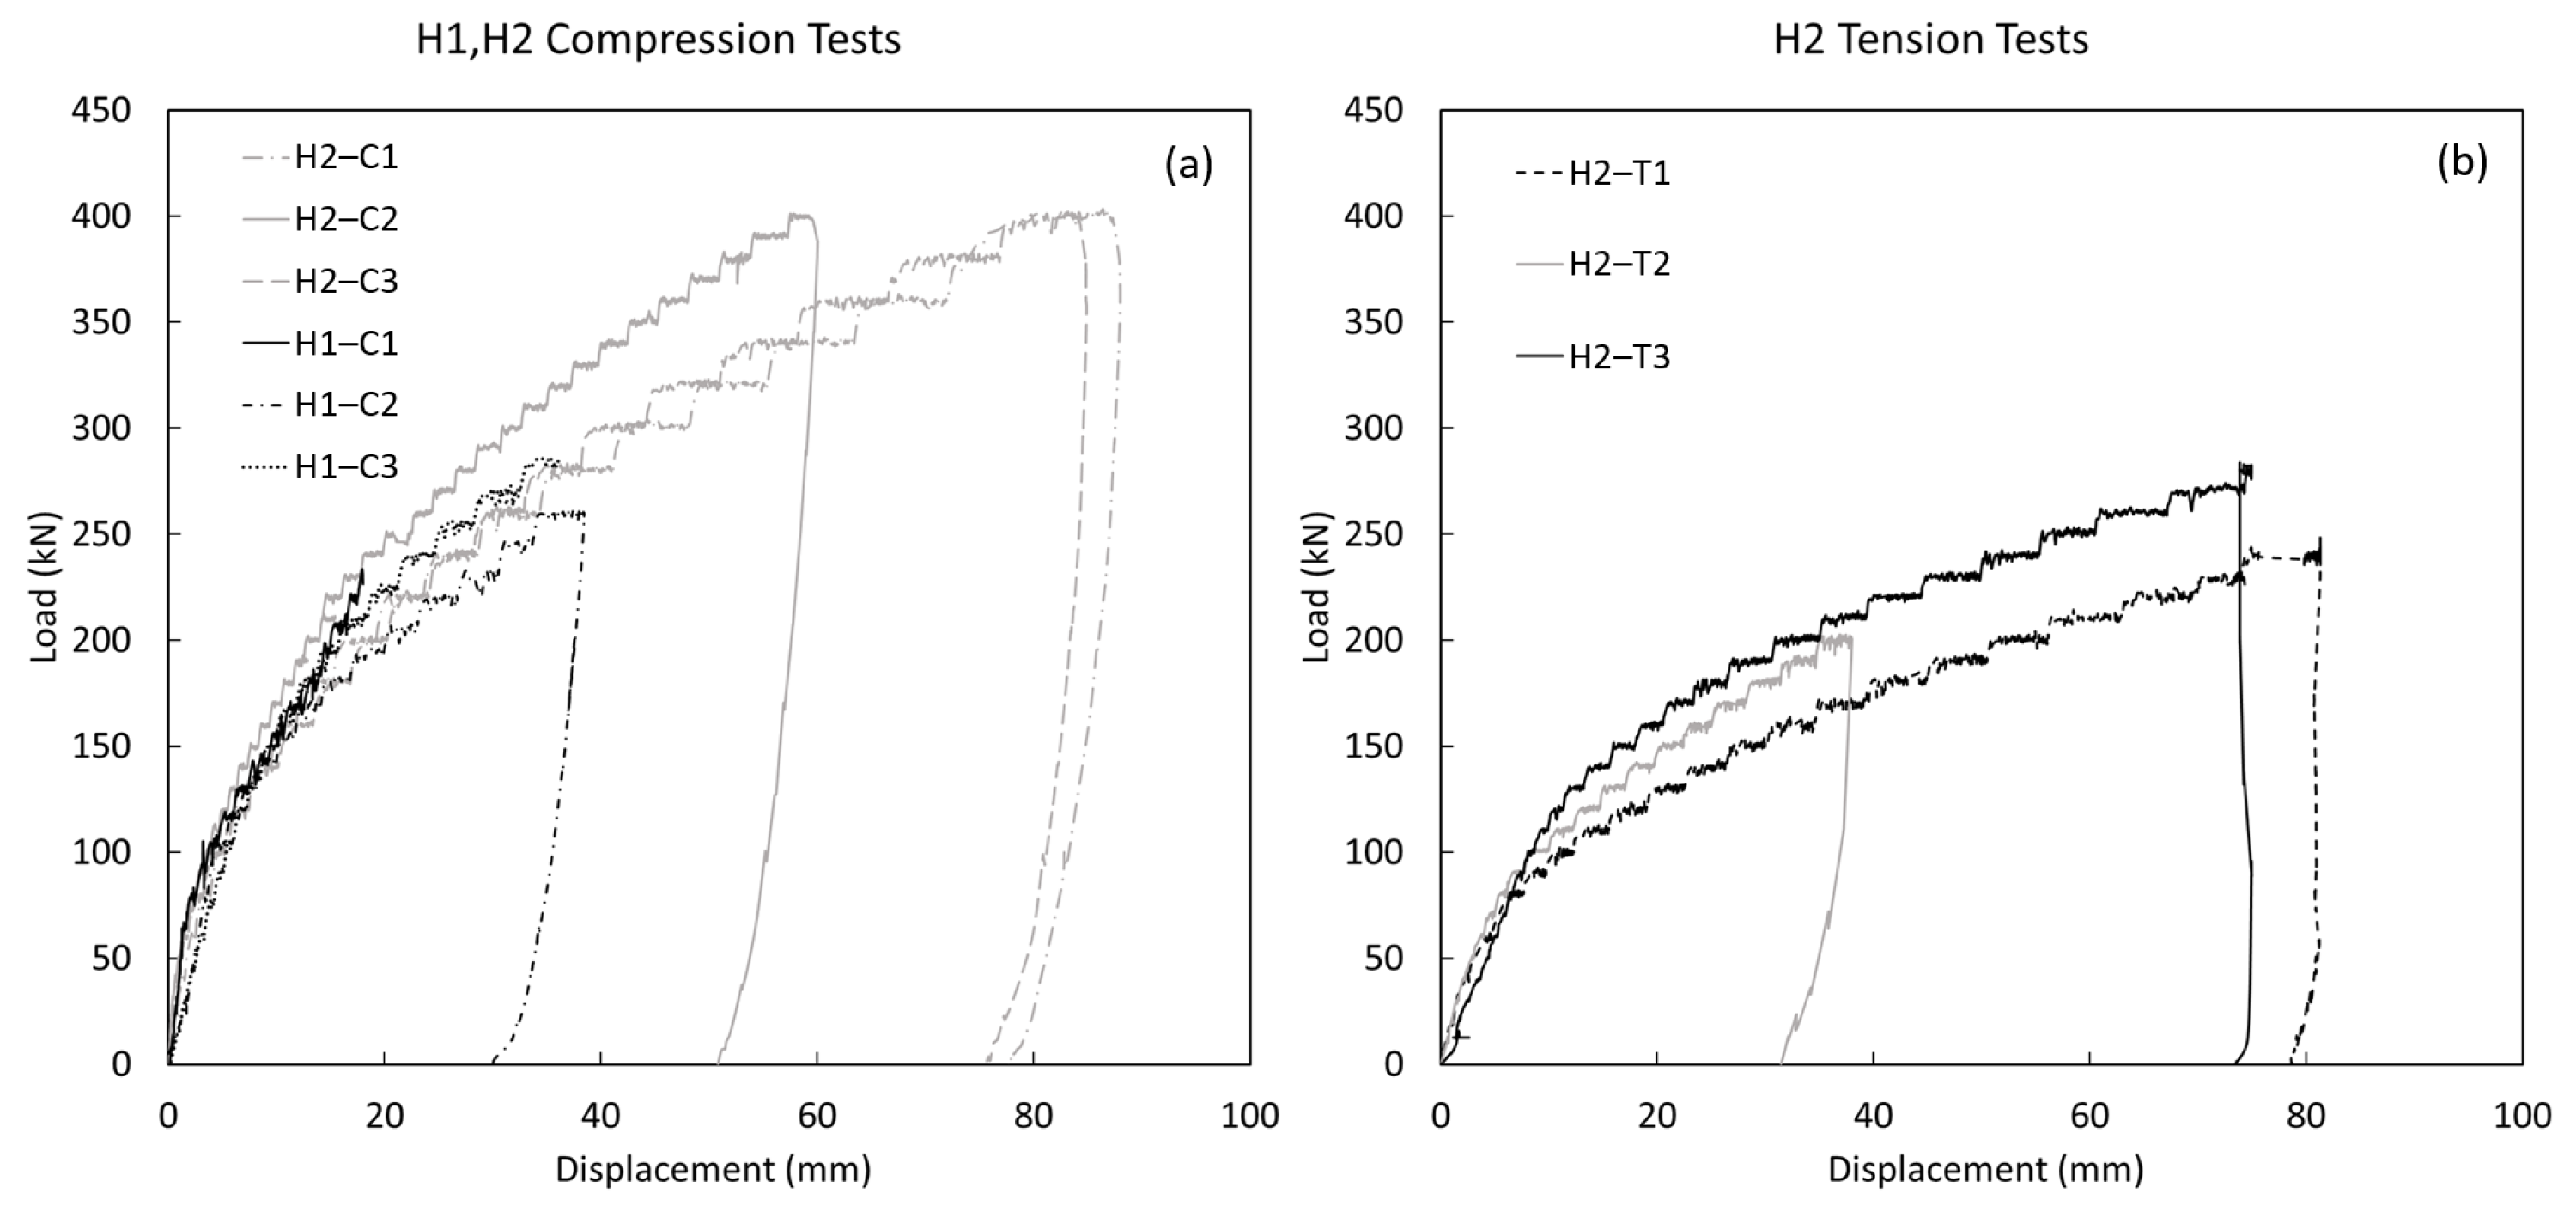
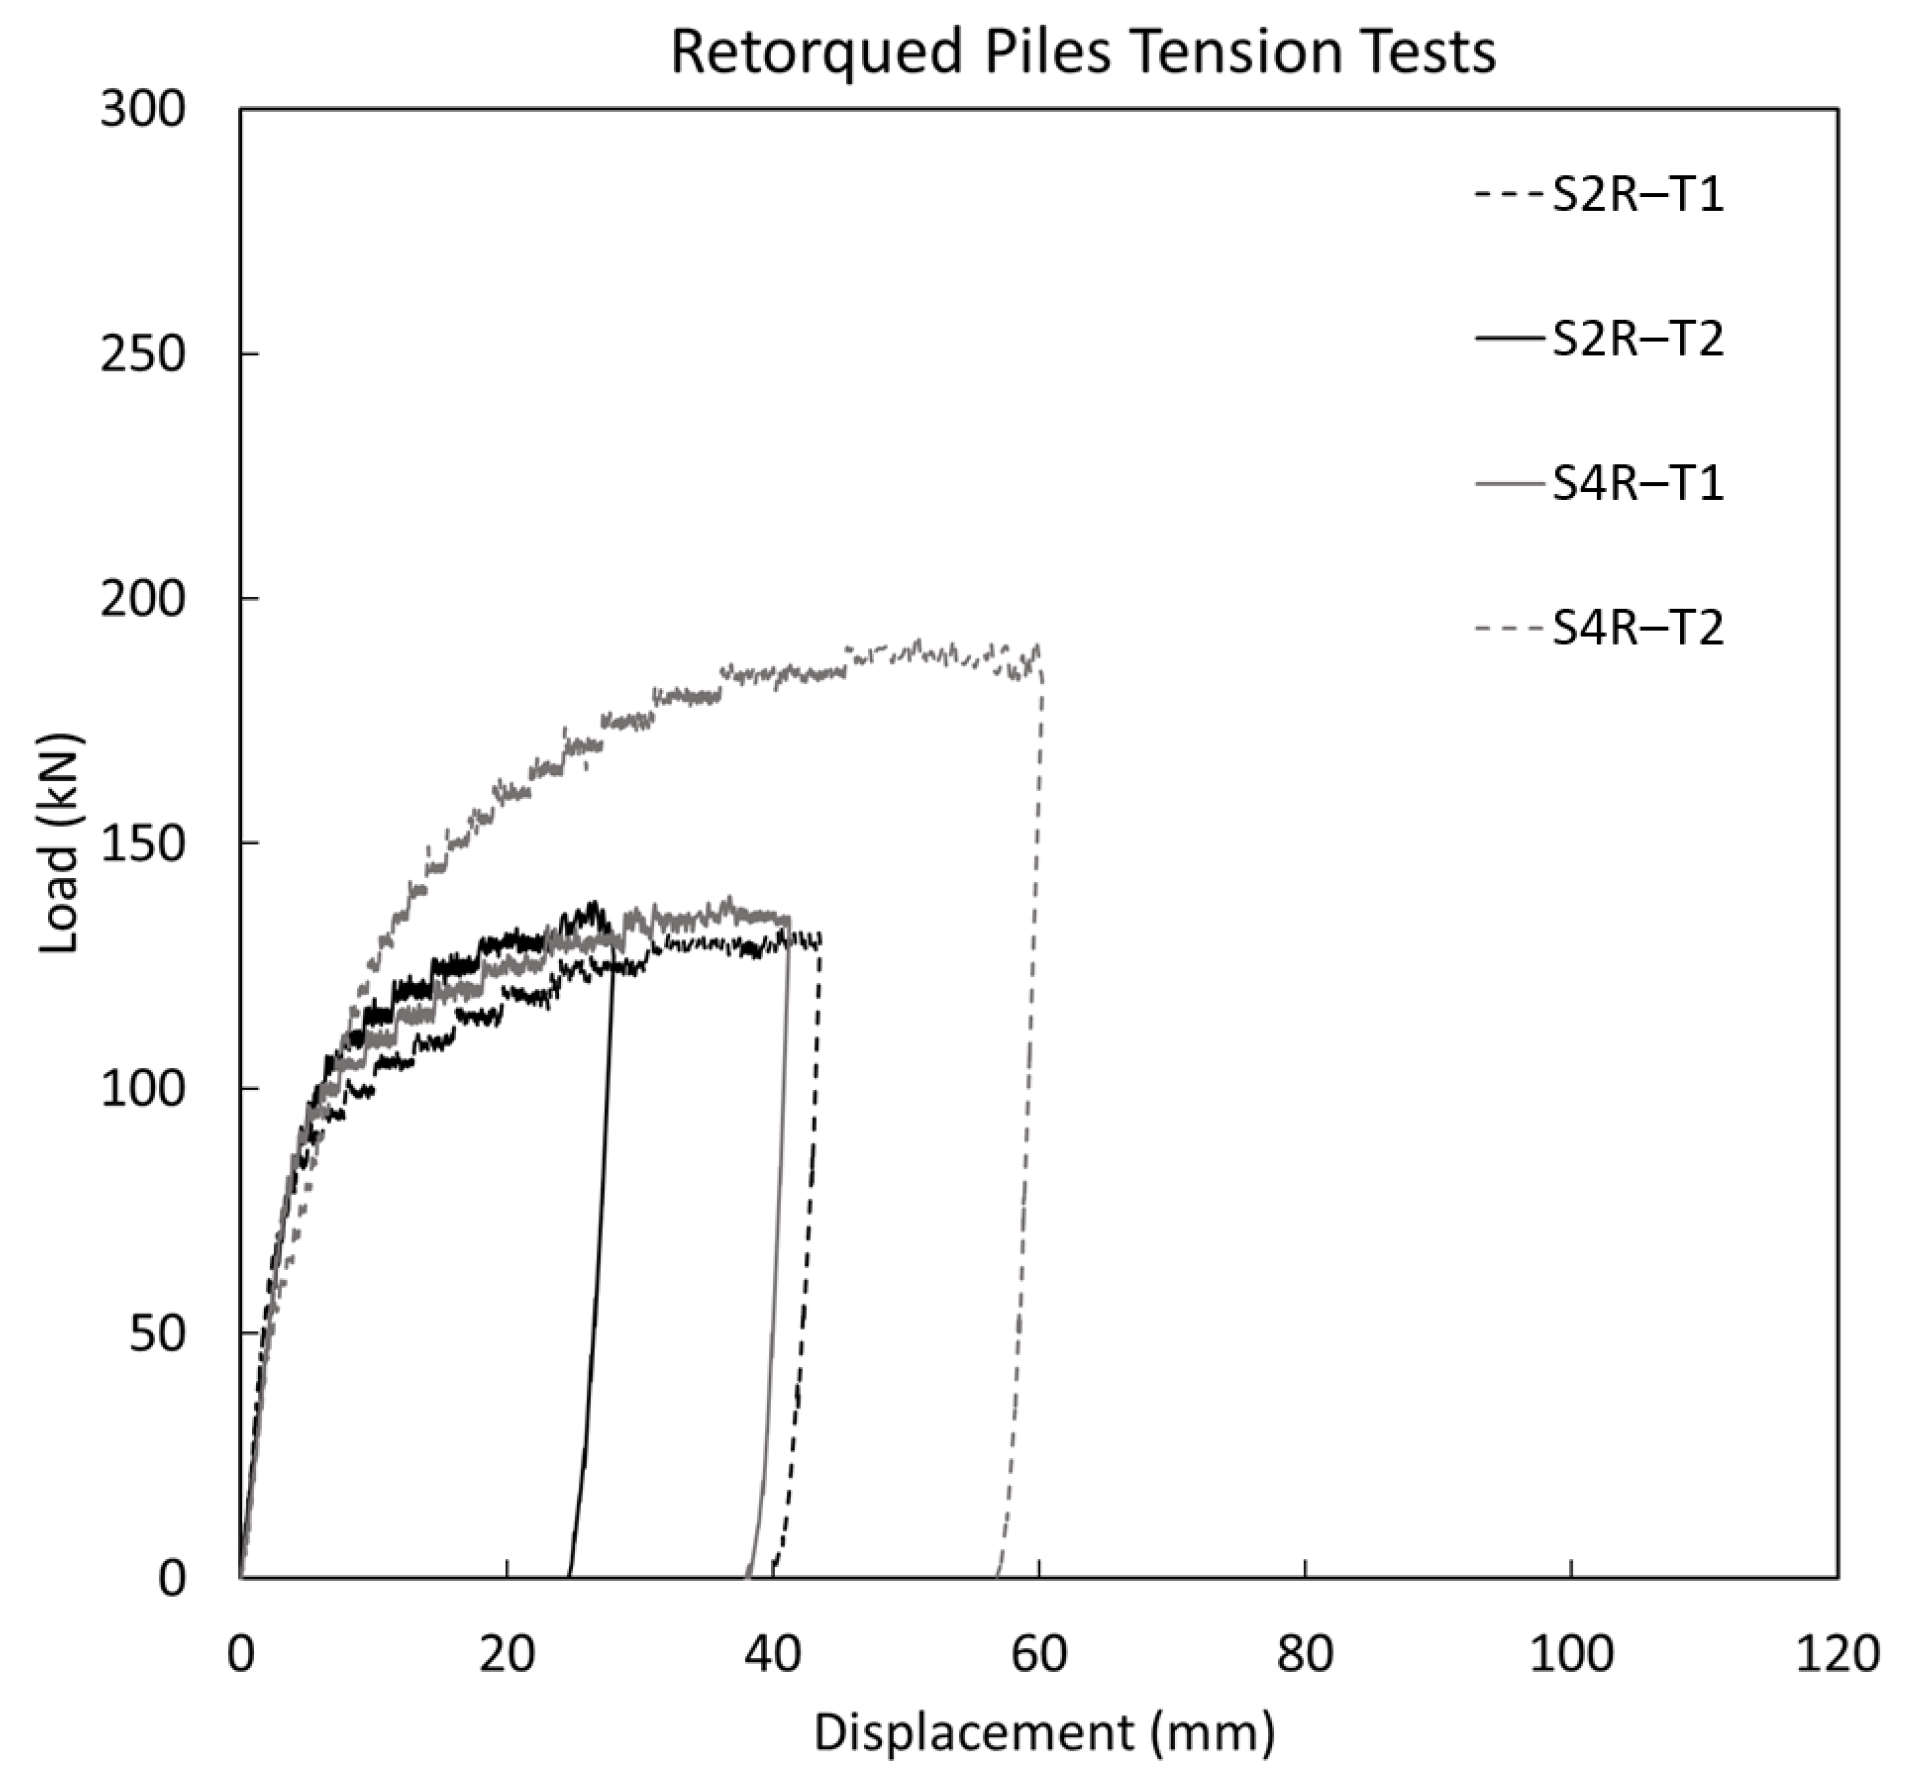
Compression and tension load-displacement curves for screw and helical piles are shown in Figure 10 and Figure 11, respectively, and tension tests for re-torqued piles are shown in Figure 12. By examining the curves, shorter screw piles (S1 and S3) exhibited more prominent plunging failure than longer screw and helical piles (S2, S4, H1, and H2). Also, the re-torqued piles with an increase of 0.3 m in embedded depth had higher capacities; for 76 mm screw piles, the capacity is higher by 79% in compression and 13% in tension, and for 89 mm screw piles, the capacity is higher by 85% in compression and 9% in tension. The large increase in compression compared to tension capacity is attributed to a significant increase in tip resistance due to bearing on the harder clay layer at a depth greater than than 2.7 m. The interpreted capacity using the L1–L2 method is presented in Table 3 along with installation torque and the corresponding torque factor K t calculated using Equation (2).

6.3. Capacity-Torque Correlation

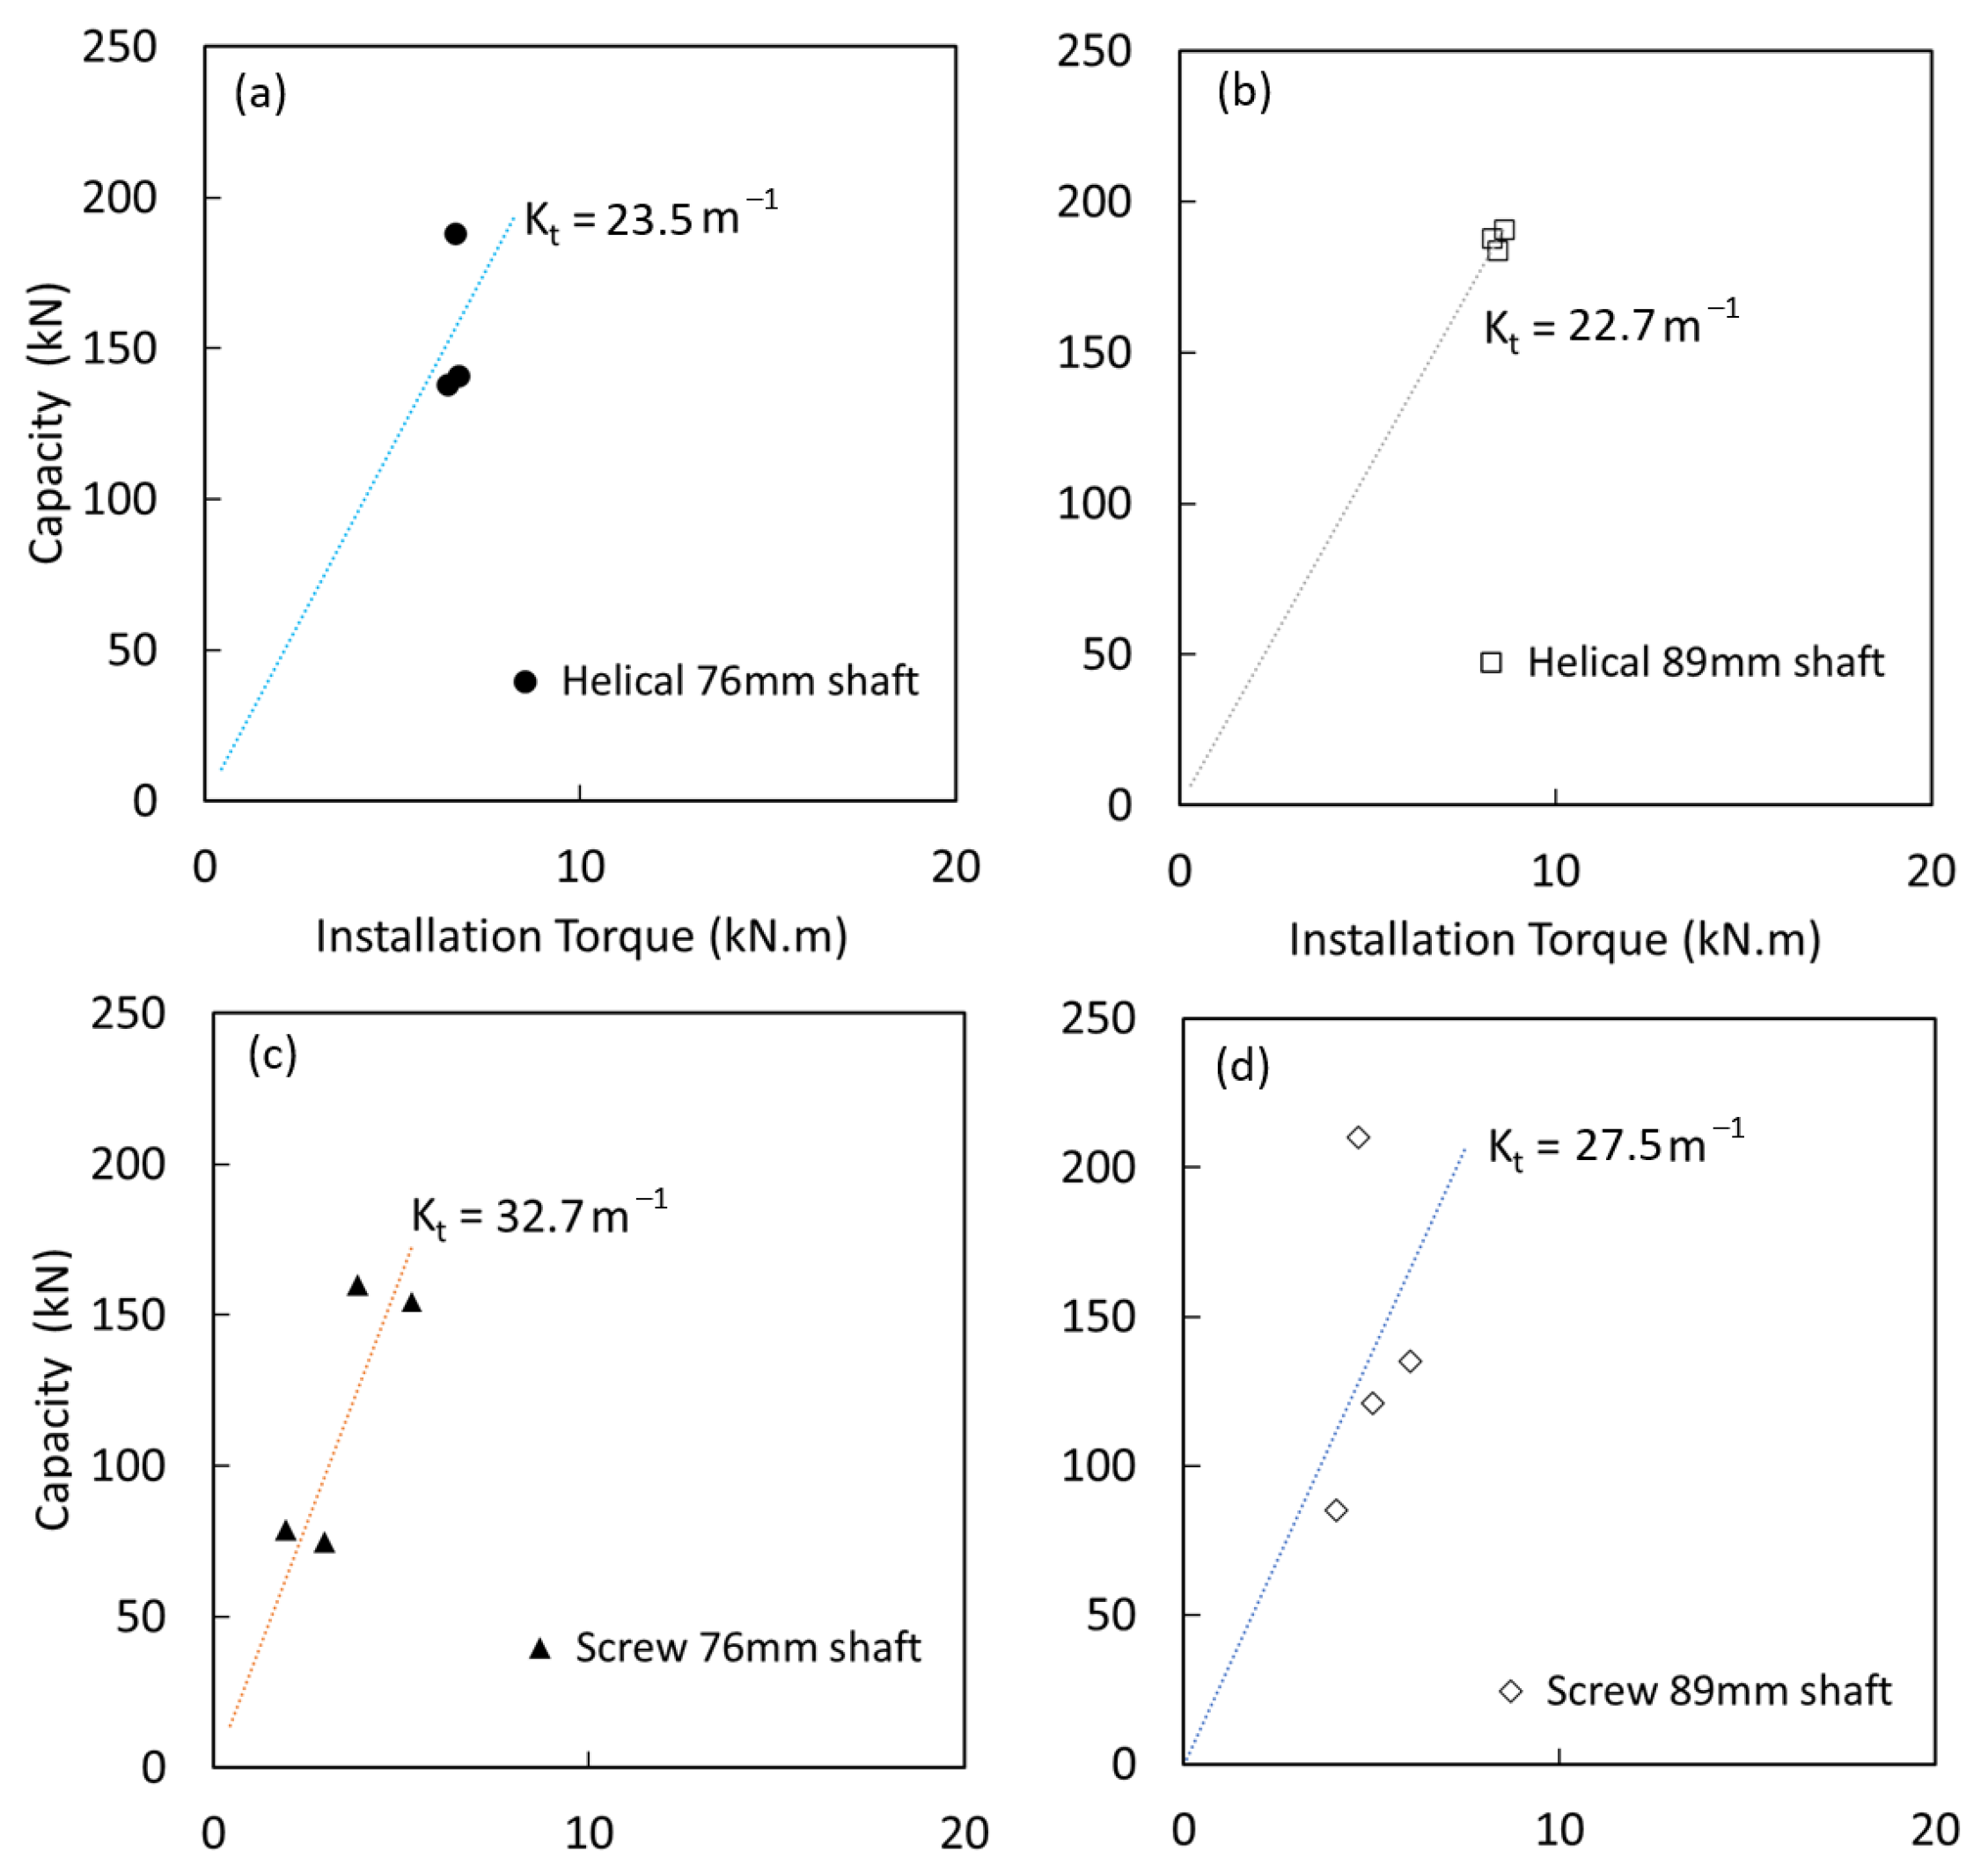
The installation torque and estimated pile capacities are plotted in Figure 13a,b for compression and tension. A linear regression of the capacity–torque correlation and an estimate of K t for all pile types in compression are illustrated in Figure 14. The plots show similar trends between helical and screw piles in compression, where an increase in torque caused an almost linear increase in capacity. In tension, however, there was a clear difference between helical and screw piles’ performance. Screw piles showed a slightly higher linear trend than in compression, while a clear drop was noticed in helical piles’ capacity vs. torque correlation. The average drop of the K t factor was approximately 53% for helical piles with a 89 mm shaft. In contrast, for screw piles, the K t factor was 7% higher in tension than in compression for piles with 76 mm shafts, and 6% higher for those with 89 mm shafts.
This difference in performance in tension between helical and screw pile could be attributed to the difference in soil disturbance that occurred during pile installation. The smaller helix diameter in screw piles obviously induces less soil disturbance compared to the larger helix of helical piles. Therefore, the difference between uplift and compression capacities is less prominent in screw piles. Installing the screw piles 0.3 m deeper into the stiffer clay layer was more effective in compression than in tension. The improvement was more pronounced in larger-diameter piles compared to smaller ones. An increase of 101% was noticed in K t for 89 mm shaft screw piles, and an increase of 7% for 76 mm shaft screw piles.
The values of K t obtained from re-torqued, re-tested piles were excluded in calculating the average K t of screw piles. The four re-torqued piles were re-tested in tension and the interpreted capacity is compared with the capacity obtained from the original load tests. The comparison indicated that re-torquing and subsequent re-testing led to a reduction in the K t value of approximately 6% for 76 mm shaft piles and 27% for 89 mm shaft piles.

6.4. Theoretical Capacity of Screw Piles

The theoretical capacity of the screw piles was calculated using different failure mode scenarios for each of the two soil layers present in the profile. The different case scenarios are indicated in Table 4. For helical piles, since only a single helix is involved, the individual bearing mode was adopted. The calculated capacities were compared with the average estimated field capacity for each pile type.
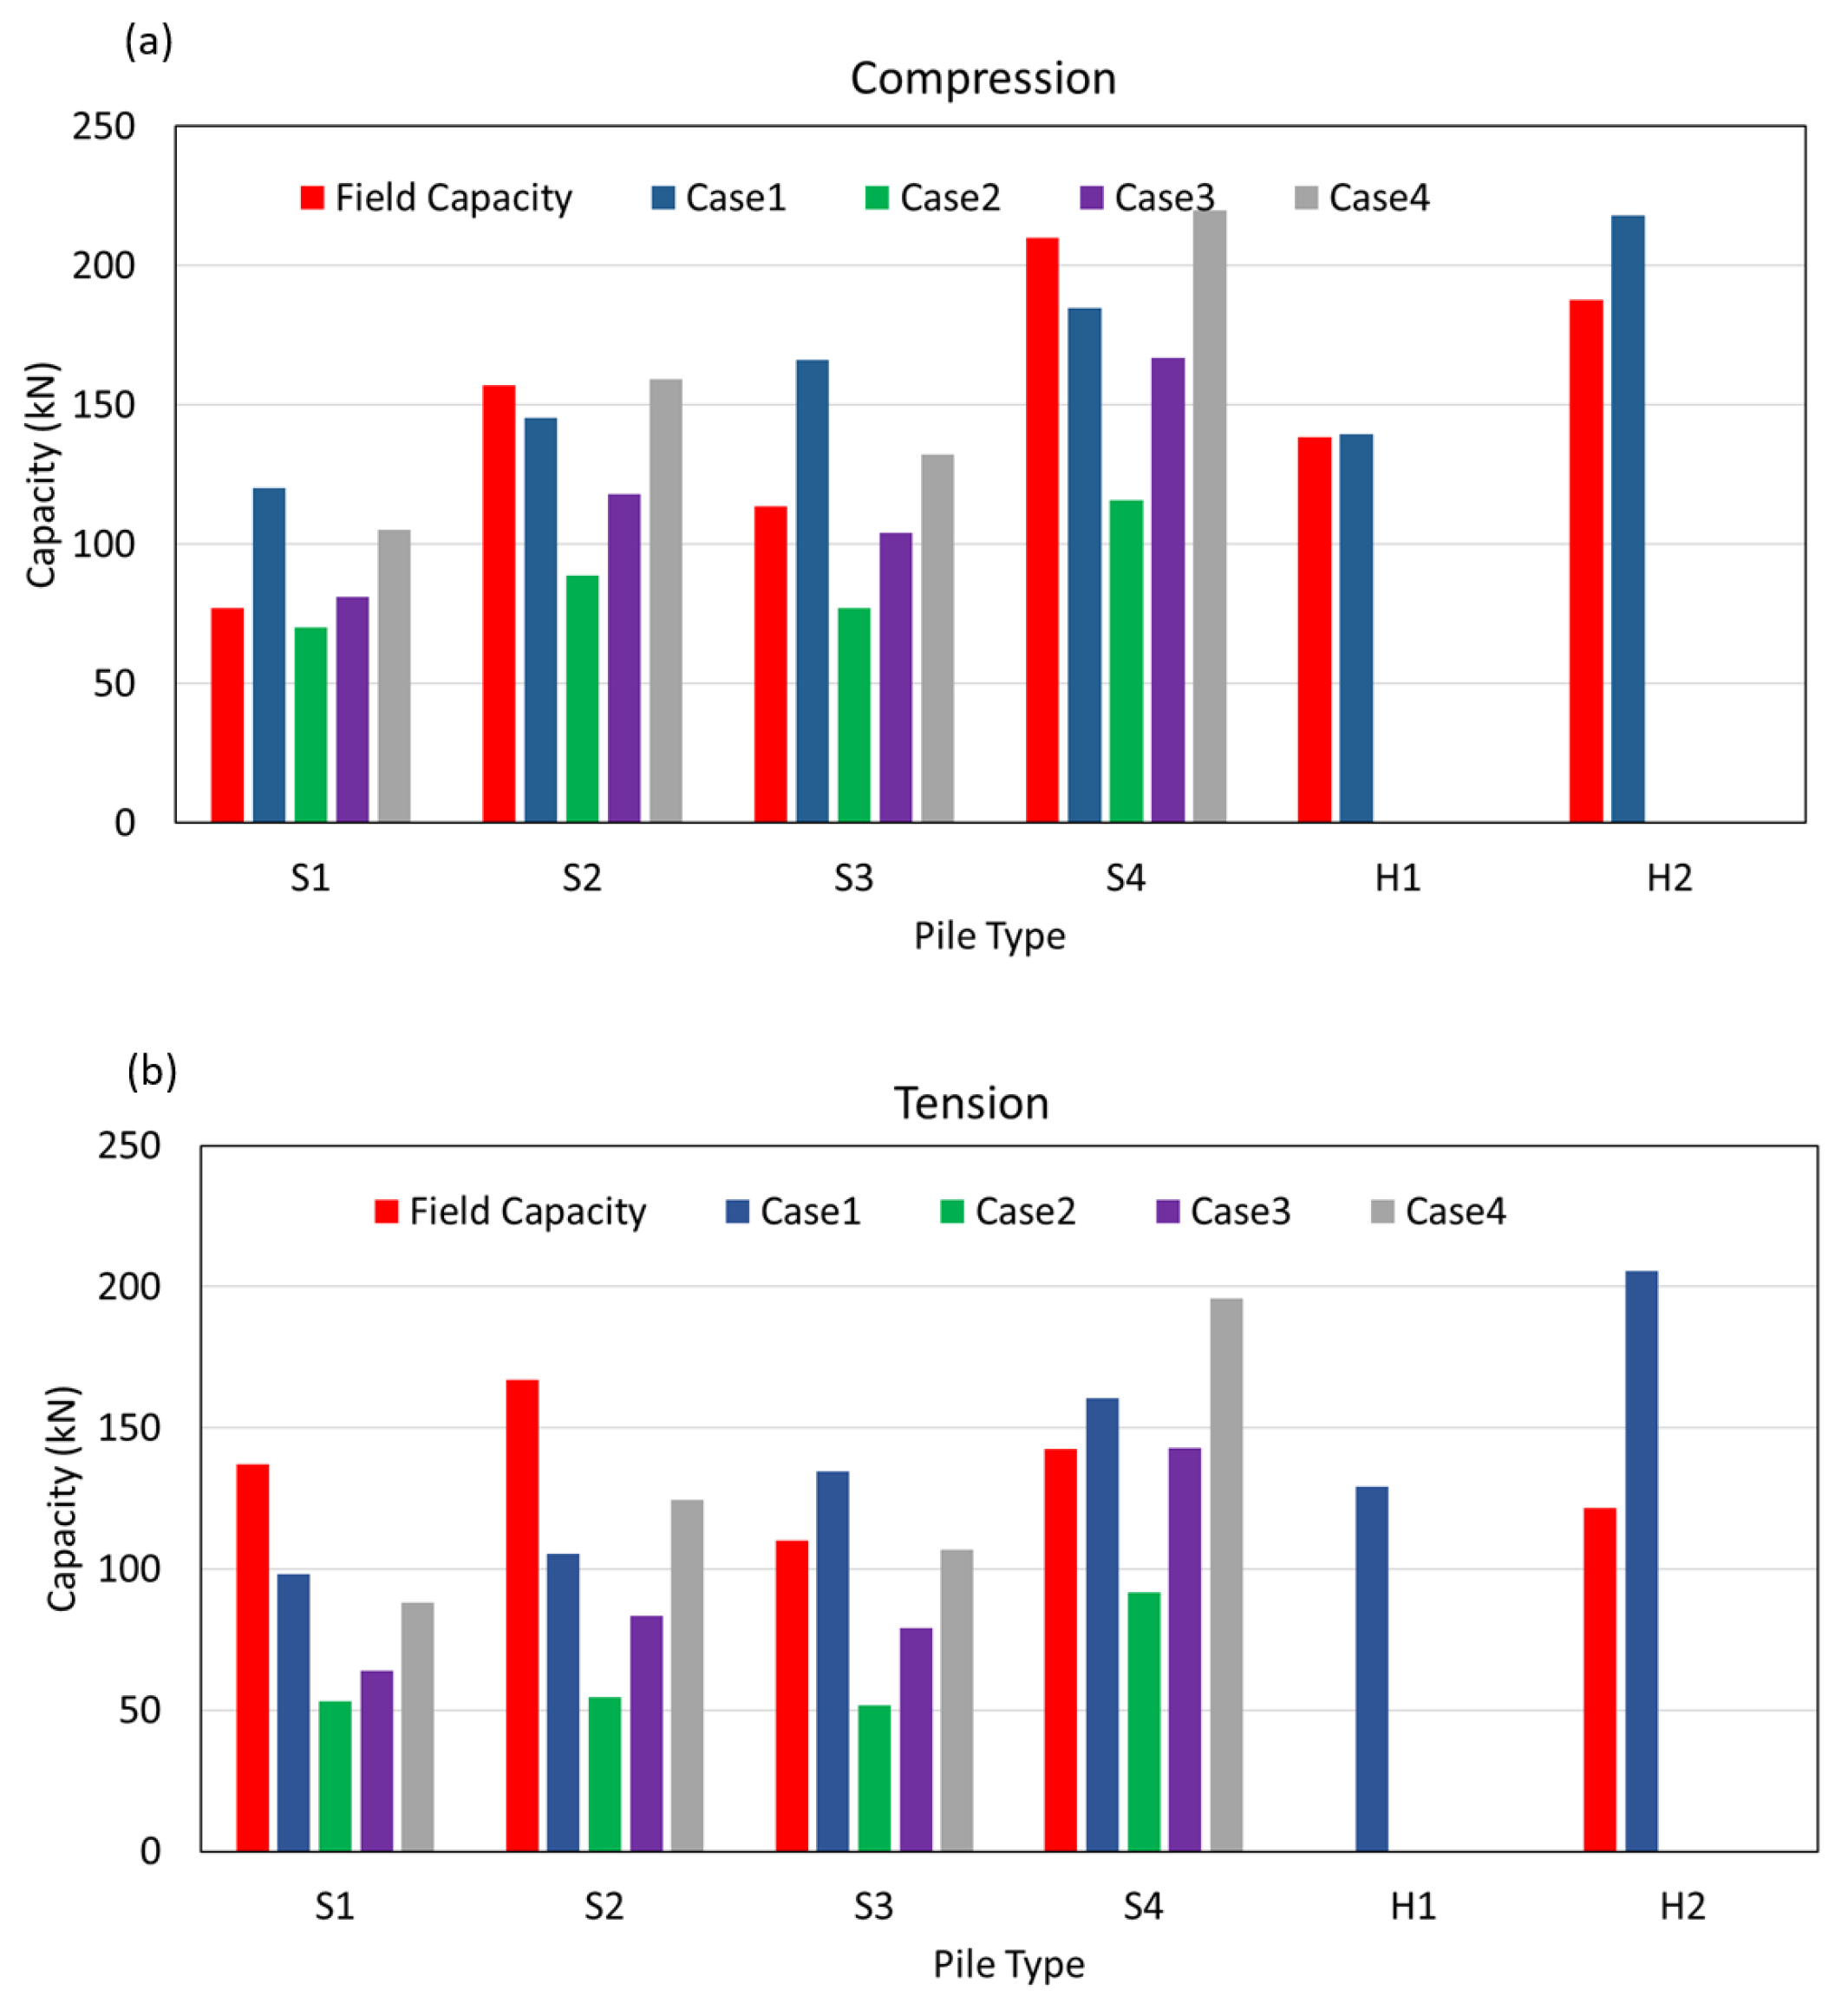
Table 5 presents a comparison matrix between pile types and the percentage error of theoretical capacity cases with respect to the average field capacity to identify the closest failure mode to the measured field capacity. The helical piles IBM failure mode provided reasonable to excellent estimates of compression capacity with 1% error for H1 and 16% error for H2. However, in tension, the error was as high as 69%, possibly due to the soil disturbance [24]. For screw piles installed at 2.8 m depth, the analysis shows that case 3 is closest to the field compression capacity with error values of 5% and −8% for S1 and S3, respectively. Case 4 was more representative of the compression capacity of piles installed at 3 m, with errors 1% and 5% for S2 and S4, respectively. This observation suggests that a hybrid (IBM + CSM) mode was developed for screw threads embedded deeper in the strong clay layer.
In tension tests, however, there was no definitive pattern in the mode of failure with respect to pile type and depth. That could be due to the disturbance in the soil that contributes to tension resistance. Further analysis of the mode of failure using strain gauge results and load distribution data is presented in the next section. Figure 15 illustrates a graphical comparison of the average field capacities and the theoretical predictions for various failure mode scenarios in compression and tension.

6.4.1. Load Distribution Along the Pile

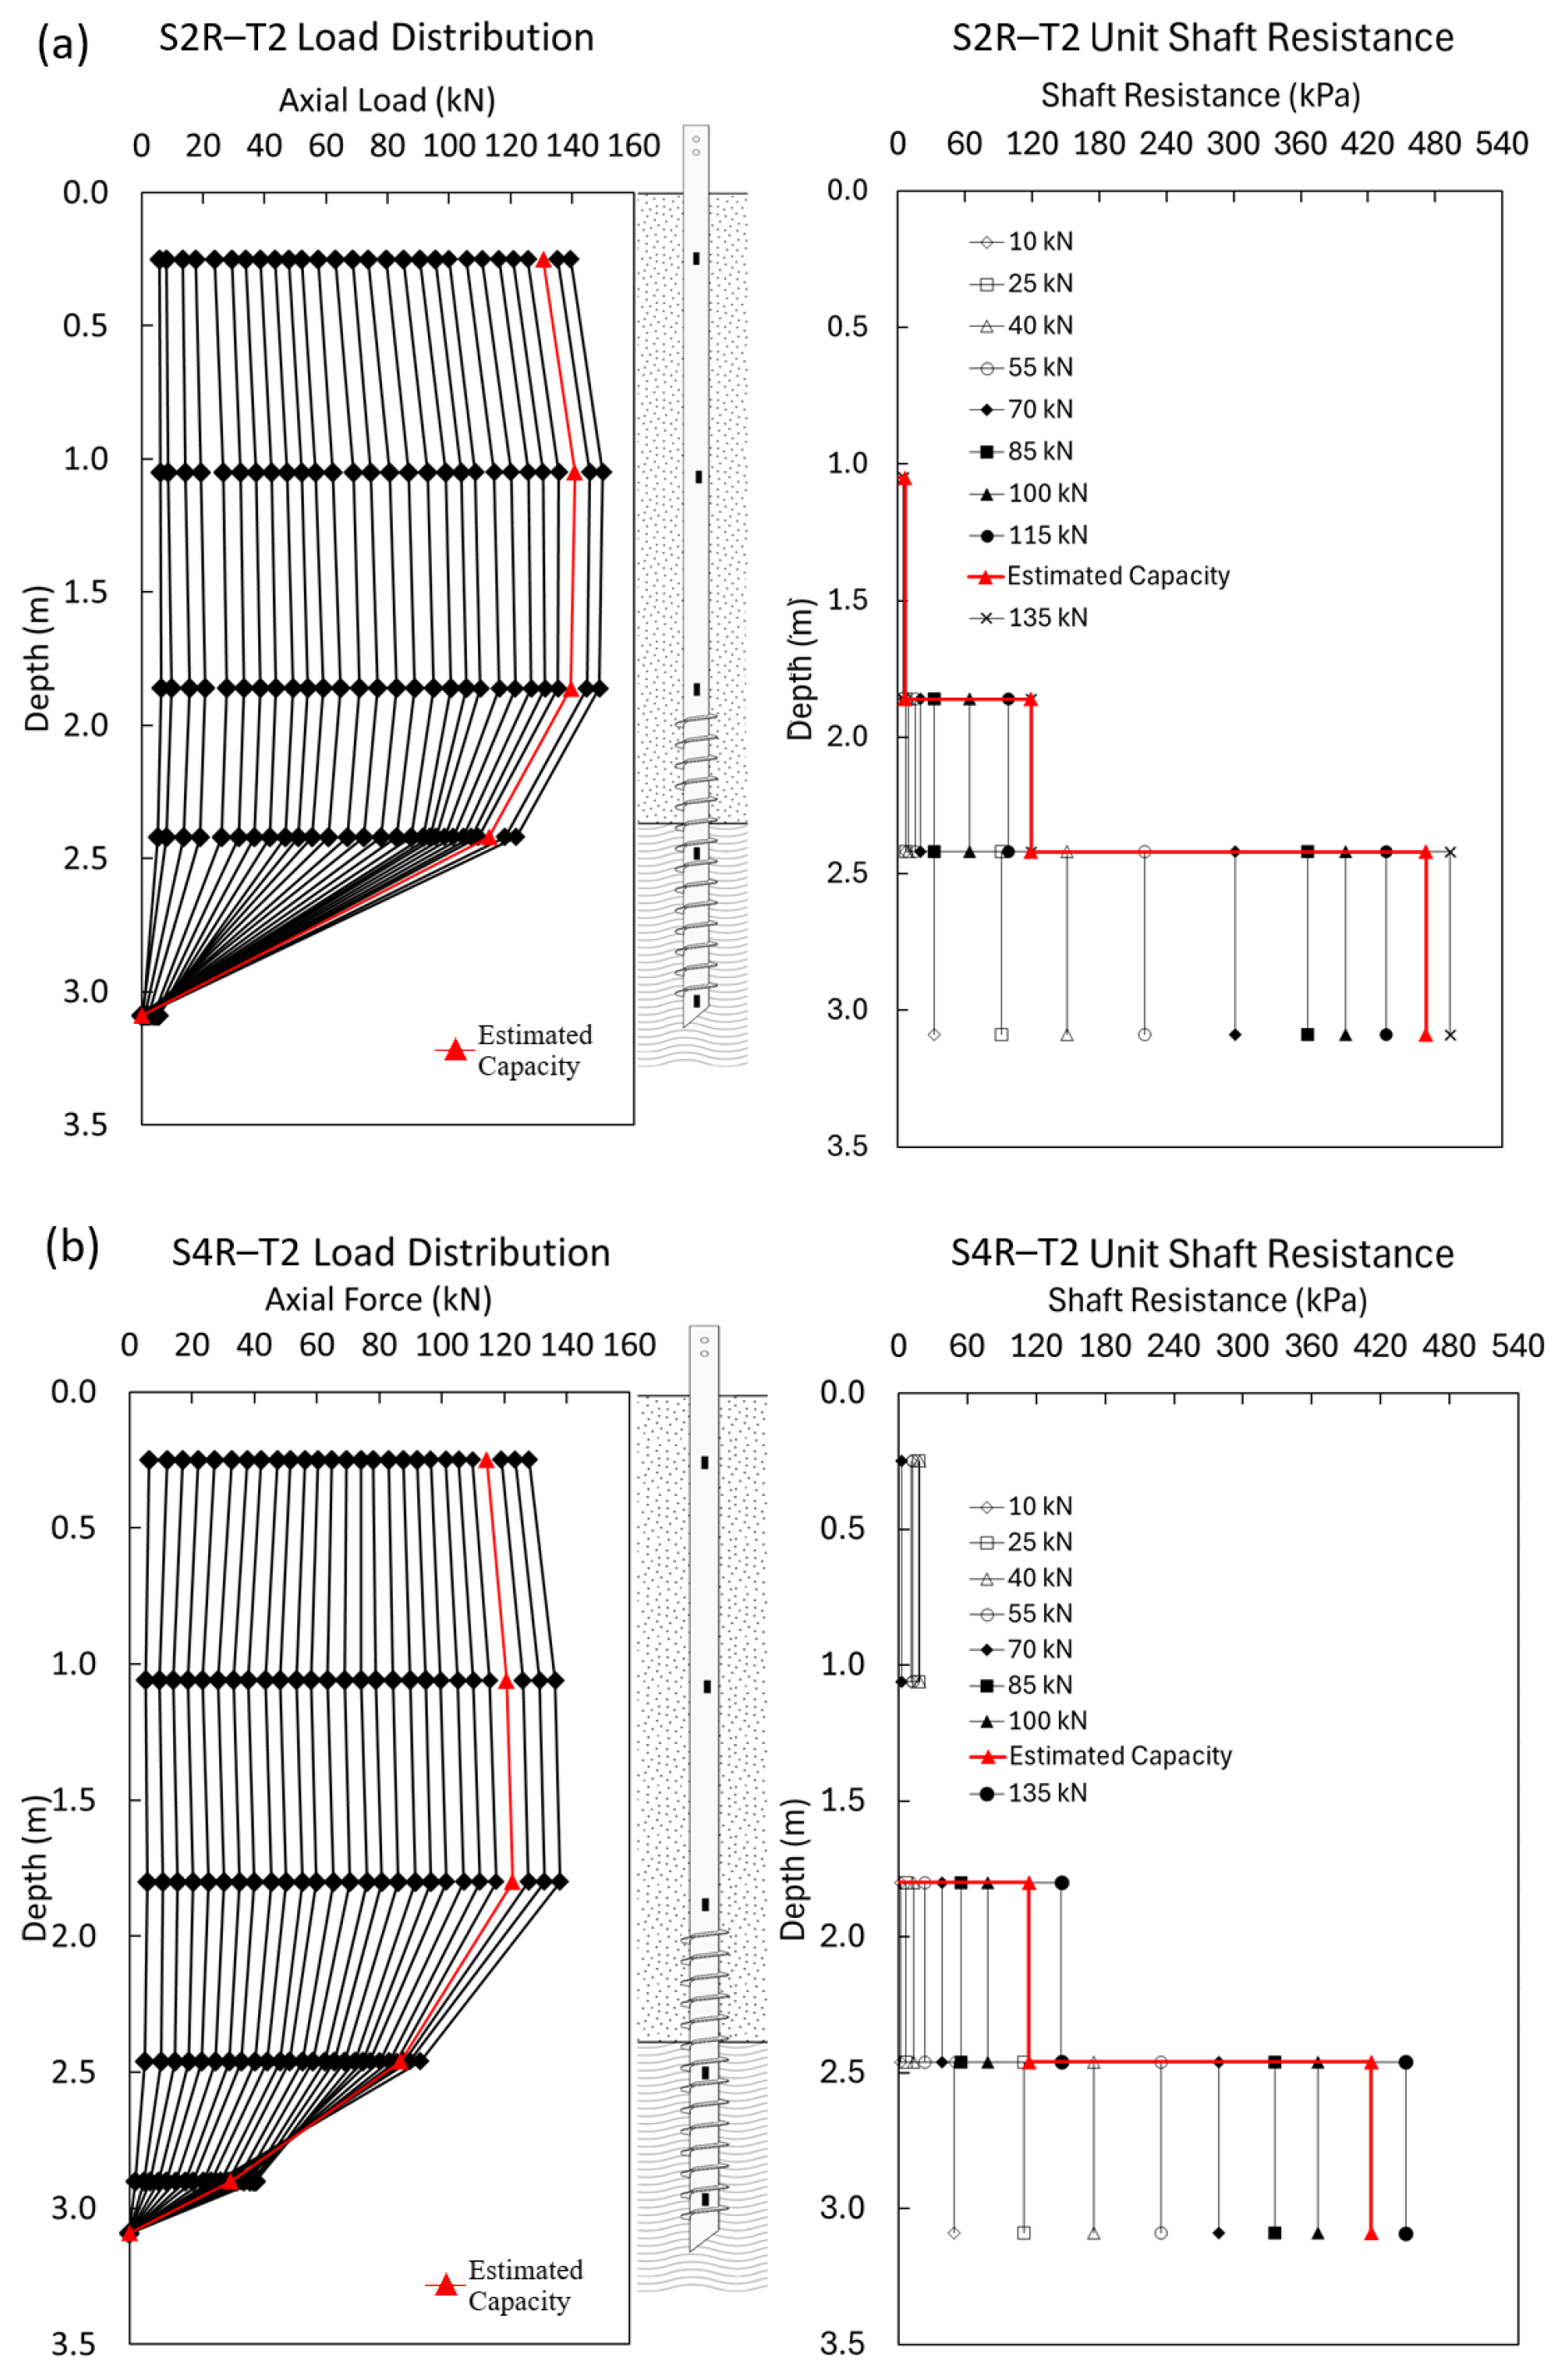
The load distribution along the pile was calculated using the measured strains from 10 strain gauges distributed in pairs at 5 different depths. The first strain gauge pair was placed at the ground surface to evaluate the pile stiffness, which was subsequently used to calculate the axial force distribution from the other strain gauge measurements. Most of the strain gauges at the two lowest levels were damaged during installation due to the high torque near the pile toe, and only two piles (S1–C2 and S3–C2) of the eight instrumented piles have a complete set of working strain gauges. These piles were among the piles that were re-torqued with an additional embedment of 0.3 m and retested in tension two months after the initial compression test. The strain gauge results of the re-torqued piles were then used to analyze the performance of screw piles in tension. The axial load (Q) transferred to each section of the pile was calculated using Equation (10).
Q = ε E A
where ε is the measured strain, E is the steel modulus of elasticity and A is the pile cross-sectional area. The pile shaft resistance ( f s ) along the pile segment between any two strain gauge pairs (pair i and pair j) is calculated as:
f s = Q i Q j π D h L i j
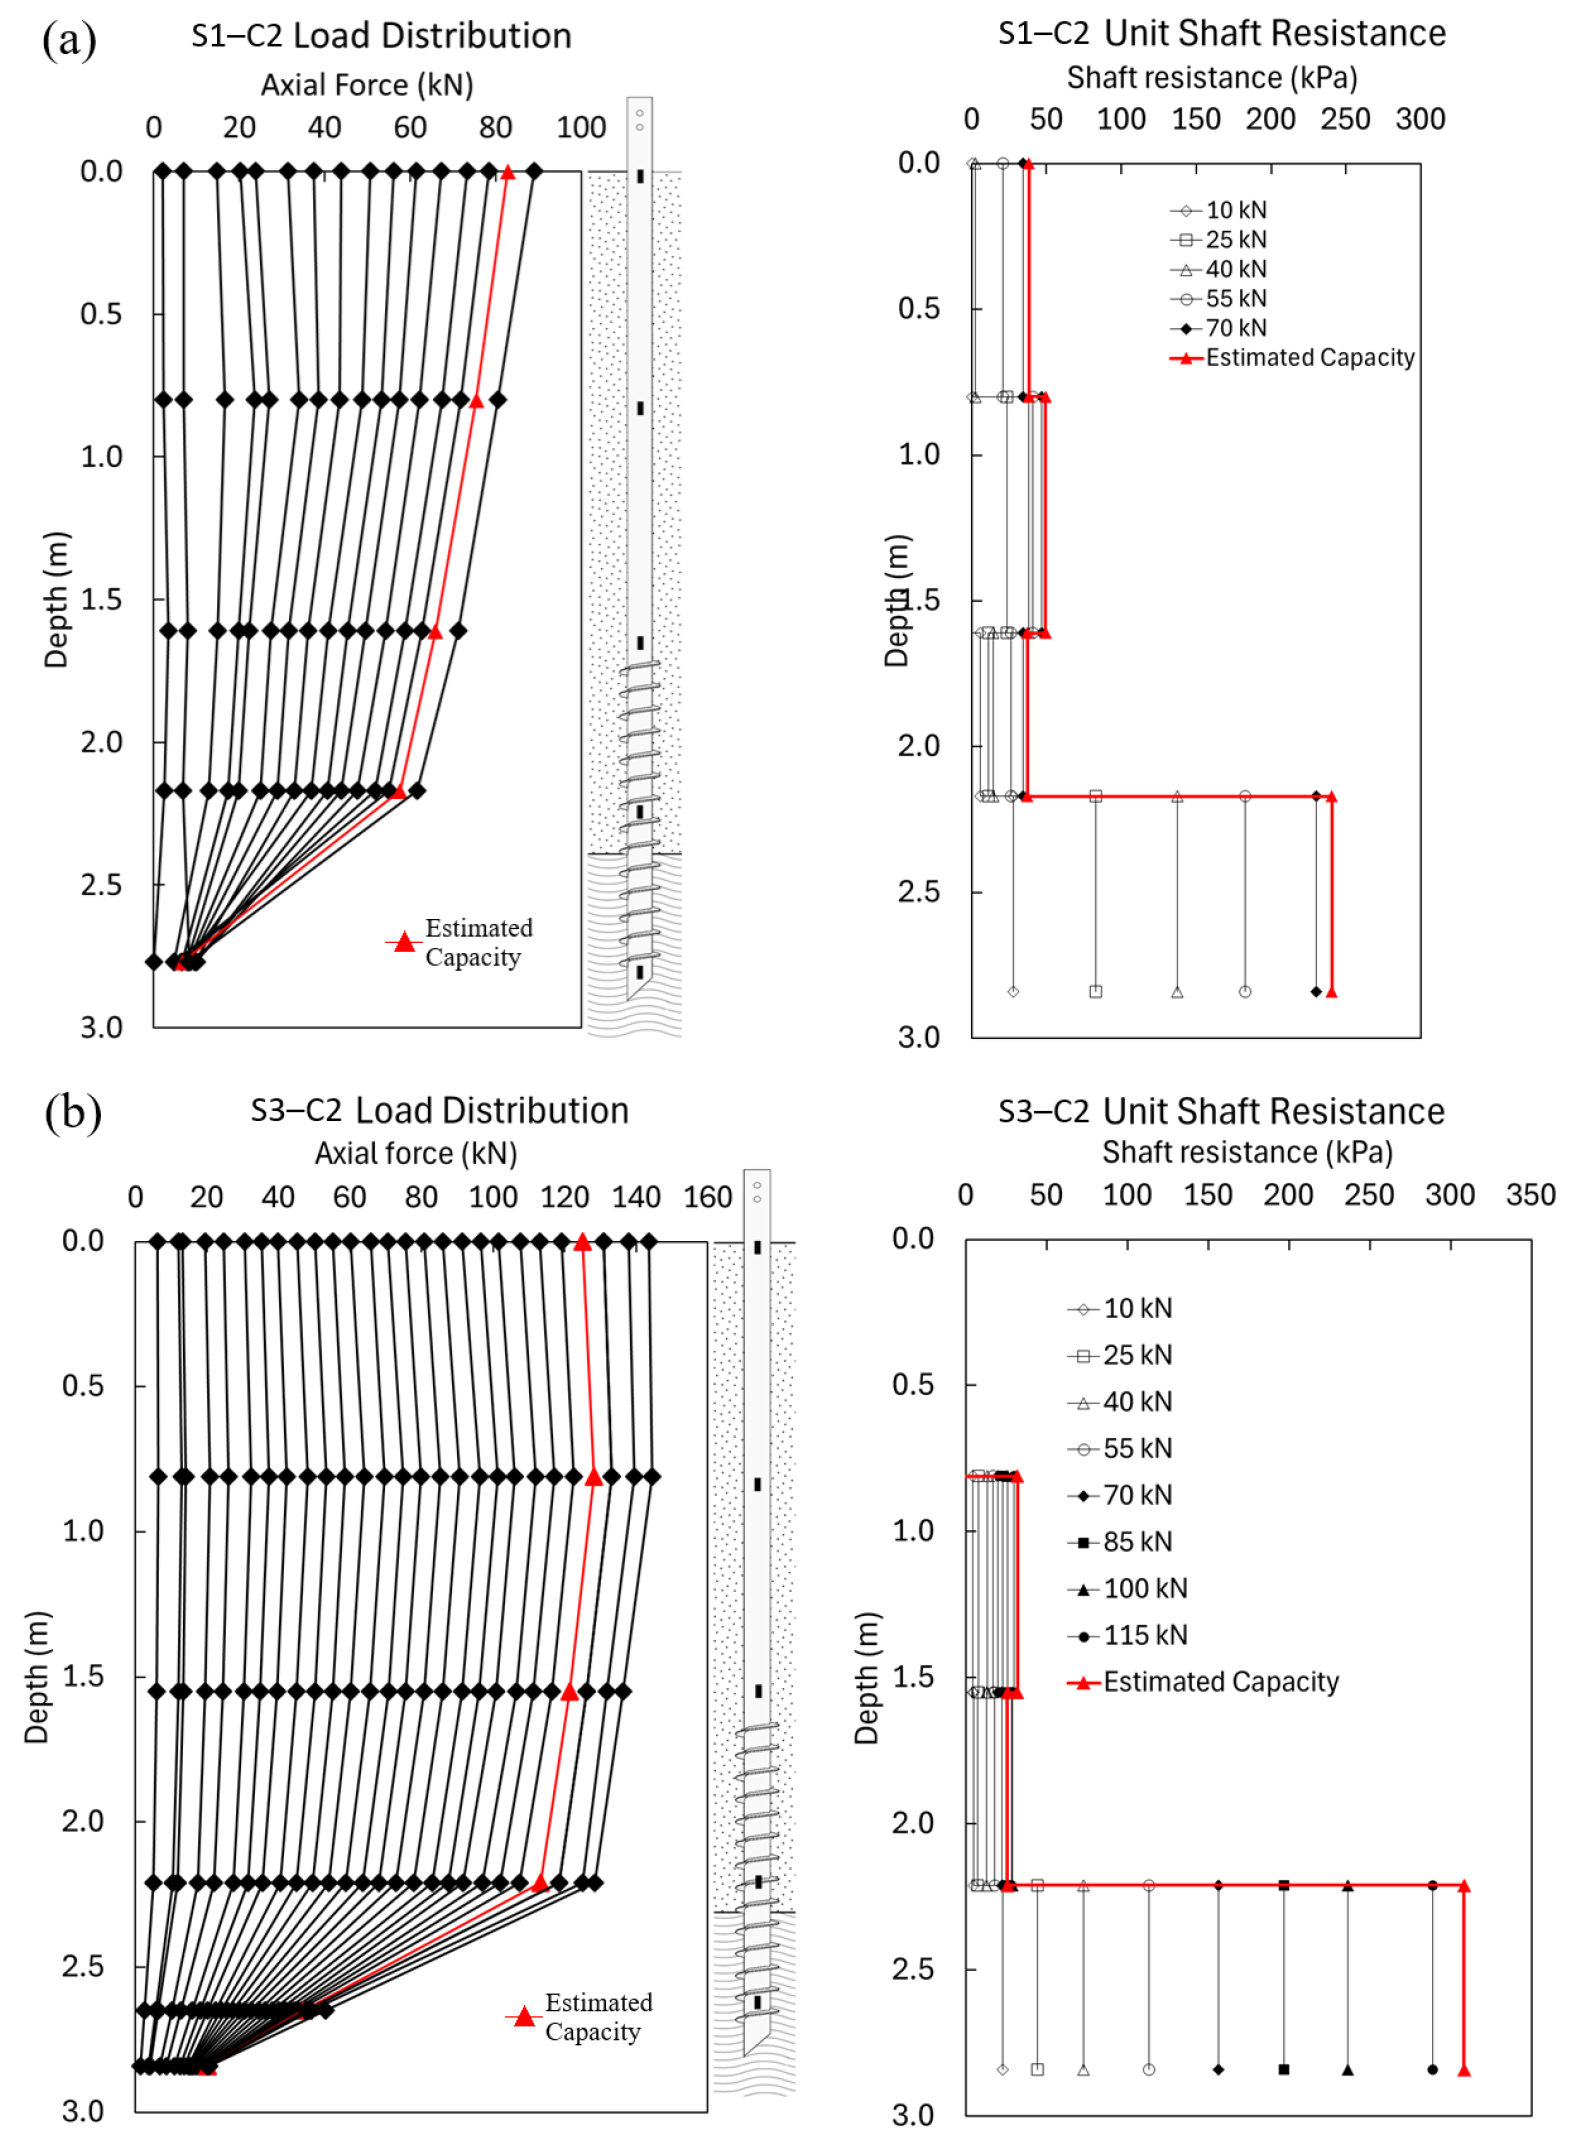
where Q i and Q j are the axial forces calculated at strain gauge pair i and j, respectively, L i j is the length of the segment between the strain gauge pairs i and j. It is important to note that in the threaded shaft section, the shaft resistance calculated from Equation (11) is not only the result of the resistance on the skin of the soil column formed around the threads; it may also include partial bearing on the continuous helix between the two strain gauge levels in question. Therefore, it may be called the “apparent” shaft resistance as we are calculating its value assuming a shaft diameter equal to the helix diameter (i.e., assuming it is mobilized around a soil column formed by the continuous helix or CSM). This assumption would be close to reality if the mode of failure is pure CSM. Figure 16 displays the load distribution and unit shaft resistance of piles S1–C2 and S3–C2 tested in compression, and Figure 17 presents the load distribution and shaft resistance for re-torqued piles S2–T2 and S4–T2 tested in tension. The load distribution indicates a friction pile behavior with 91% of the load carried by the shaft for S1 piles and 83% for S3 piles. The shaft resistance curves in Figure 16 and Figure 17 show that most of the load was carried by the bottom portion of the shaft, which was embedded in the strong clay layer.
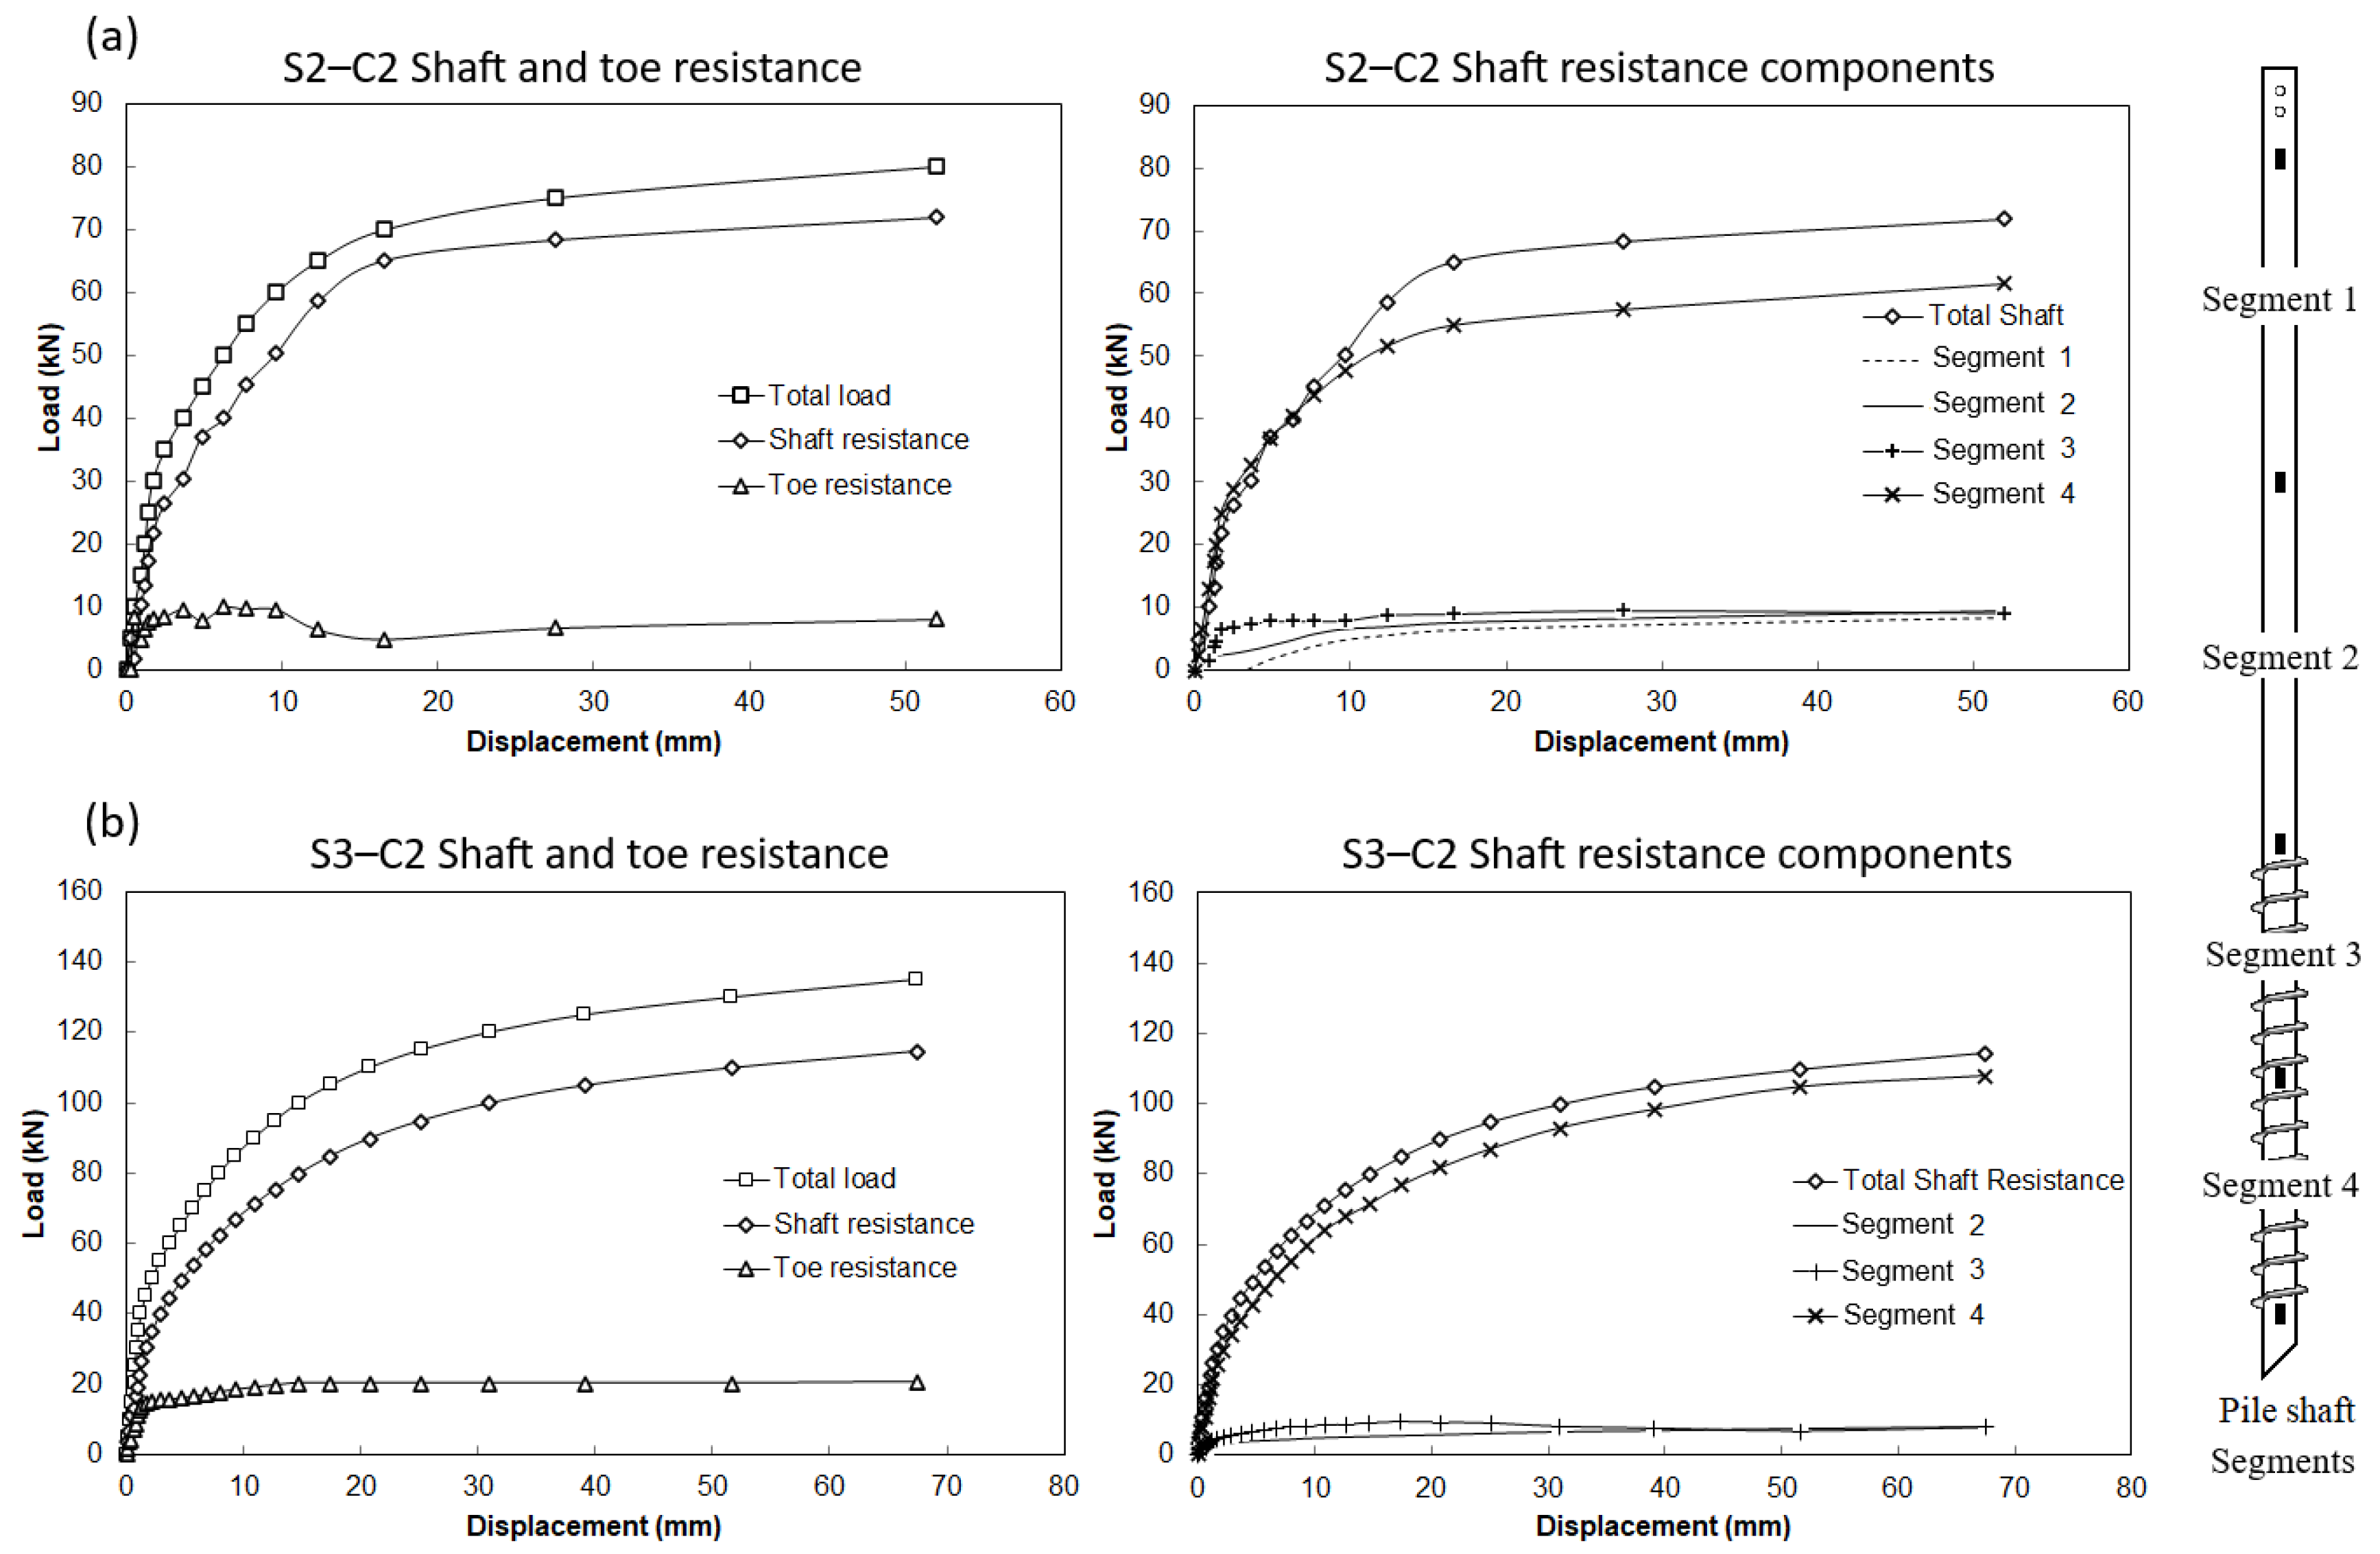
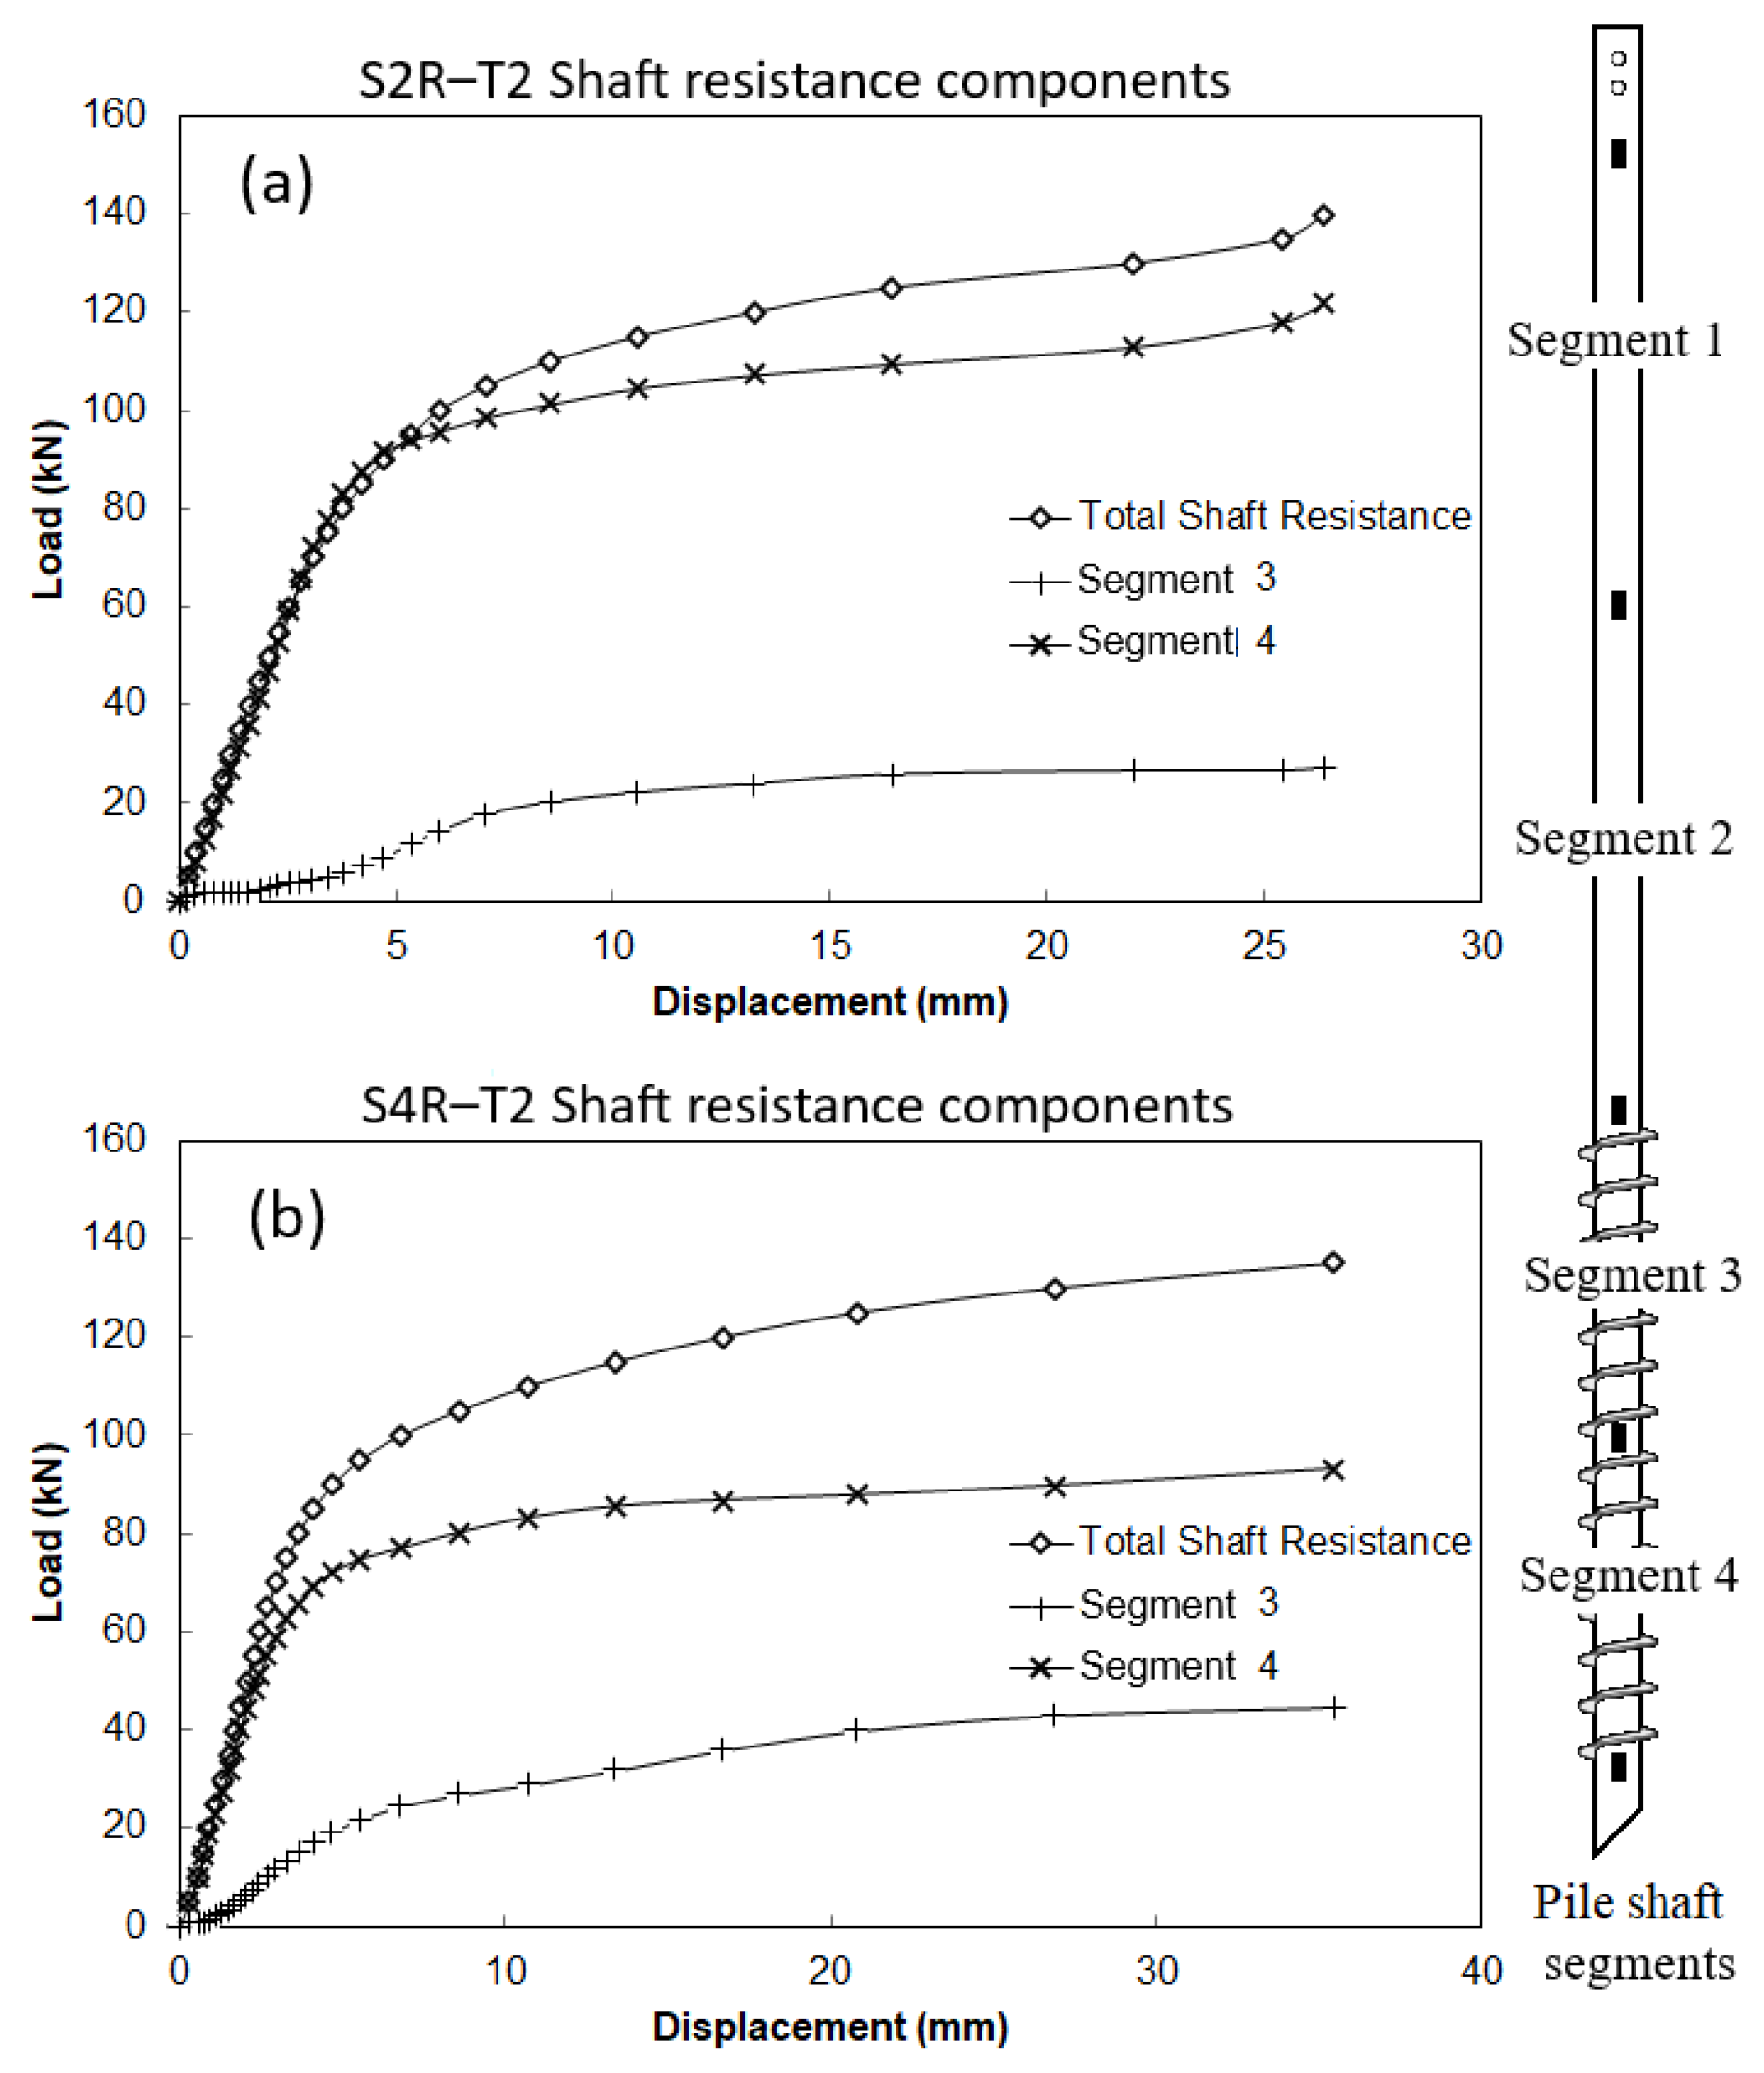
The shaft resistance of each pile segment between two sets of strain gauges was plotted separately in Figure 18 and Figure 19 for compression and tension tests, respectively. Segment 4 of the pile, as indicated in the mentioned figures, represents the threaded shaft portion embedded in strong clay. This segment contributes 84% of the total shaft resistance in S1 piles and 93% in S3 piles tested in compression, even though this segment represents only 20% of the pile length. In tension tests, segment 4 contributions were 87% and 72% for S2 and S4 piles, respectively. Because S2 and S4 piles were 0.3 m deeper than S1 and S3, a portion of segment 3 (about 0.2 m) penetrated the clay layer, and its share of shaft resistance increased from 12% to 20% for S2 piles, and from 8% to 30% for S4 piles. The resistance of the smooth portion of the pile shaft was only observed in piles tested under compression loading, carrying 20% and 5.5% of the total load of S1 and S3 piles, respectively. For tension piles, there was no apparent resistance in the smooth section of the pile shaft. Therefore, as recommended in the literature for helical piles, the smooth shaft resistance should not be considered in the design of screw piles.
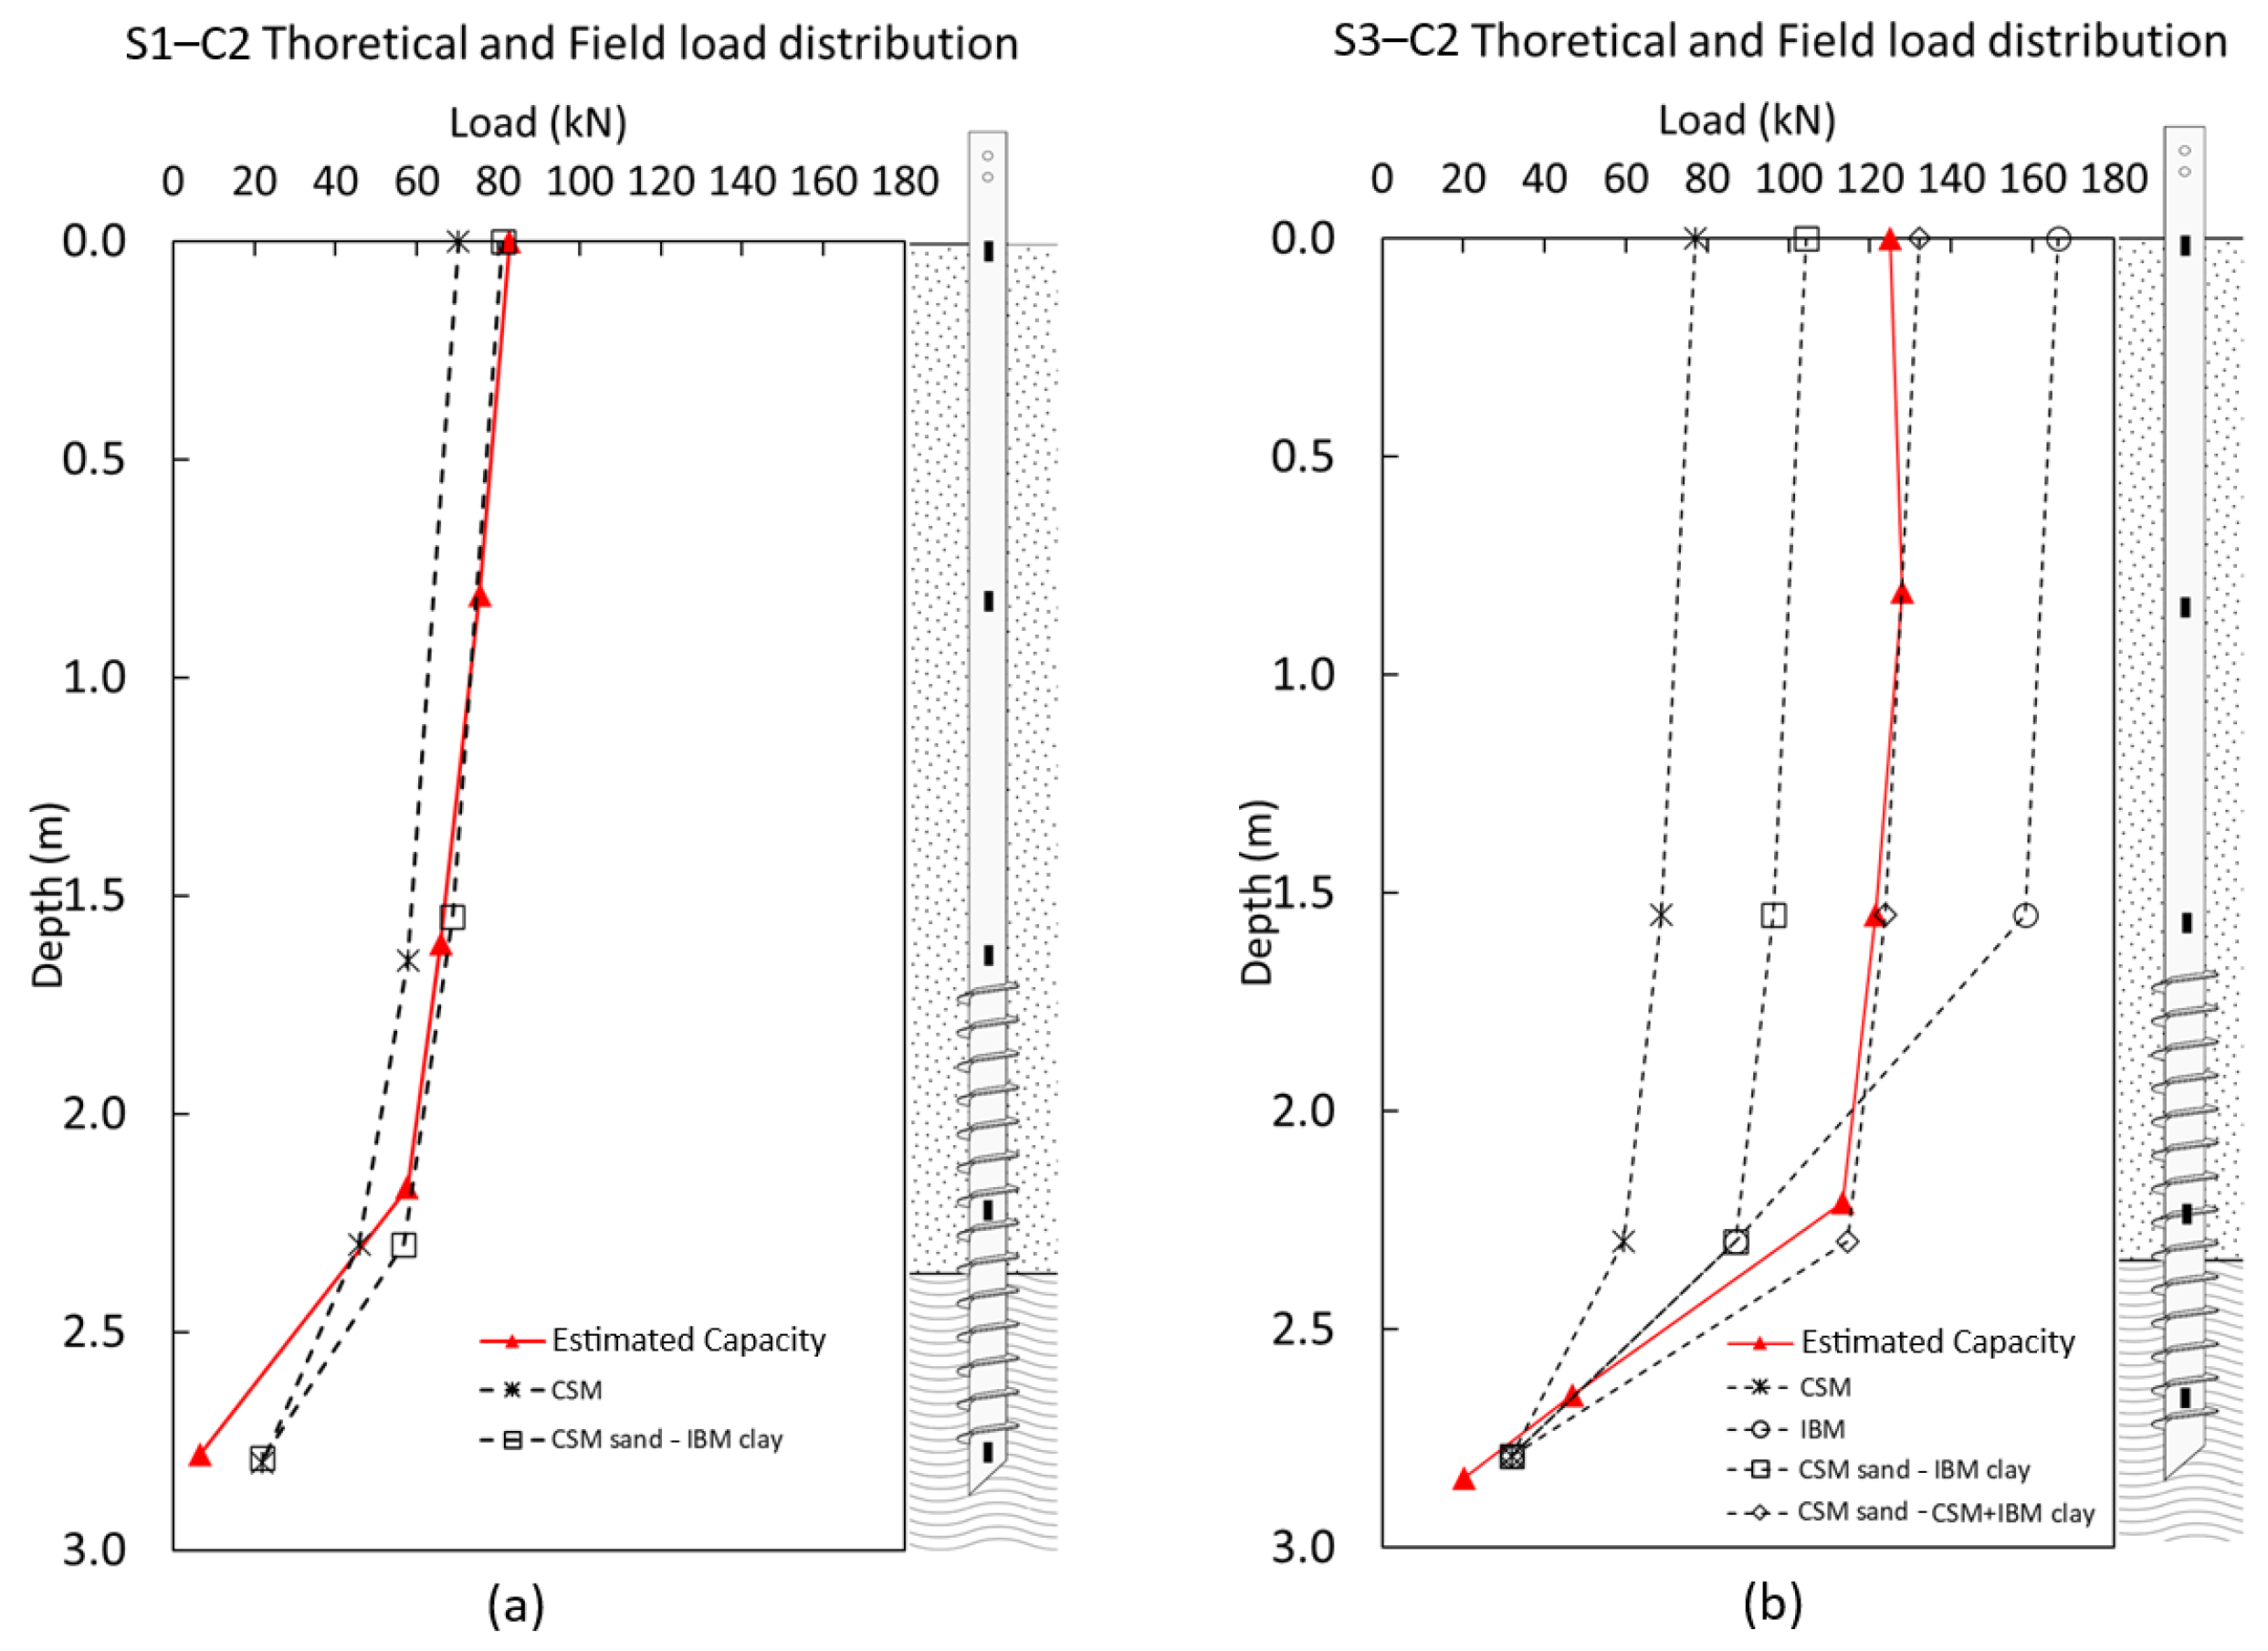
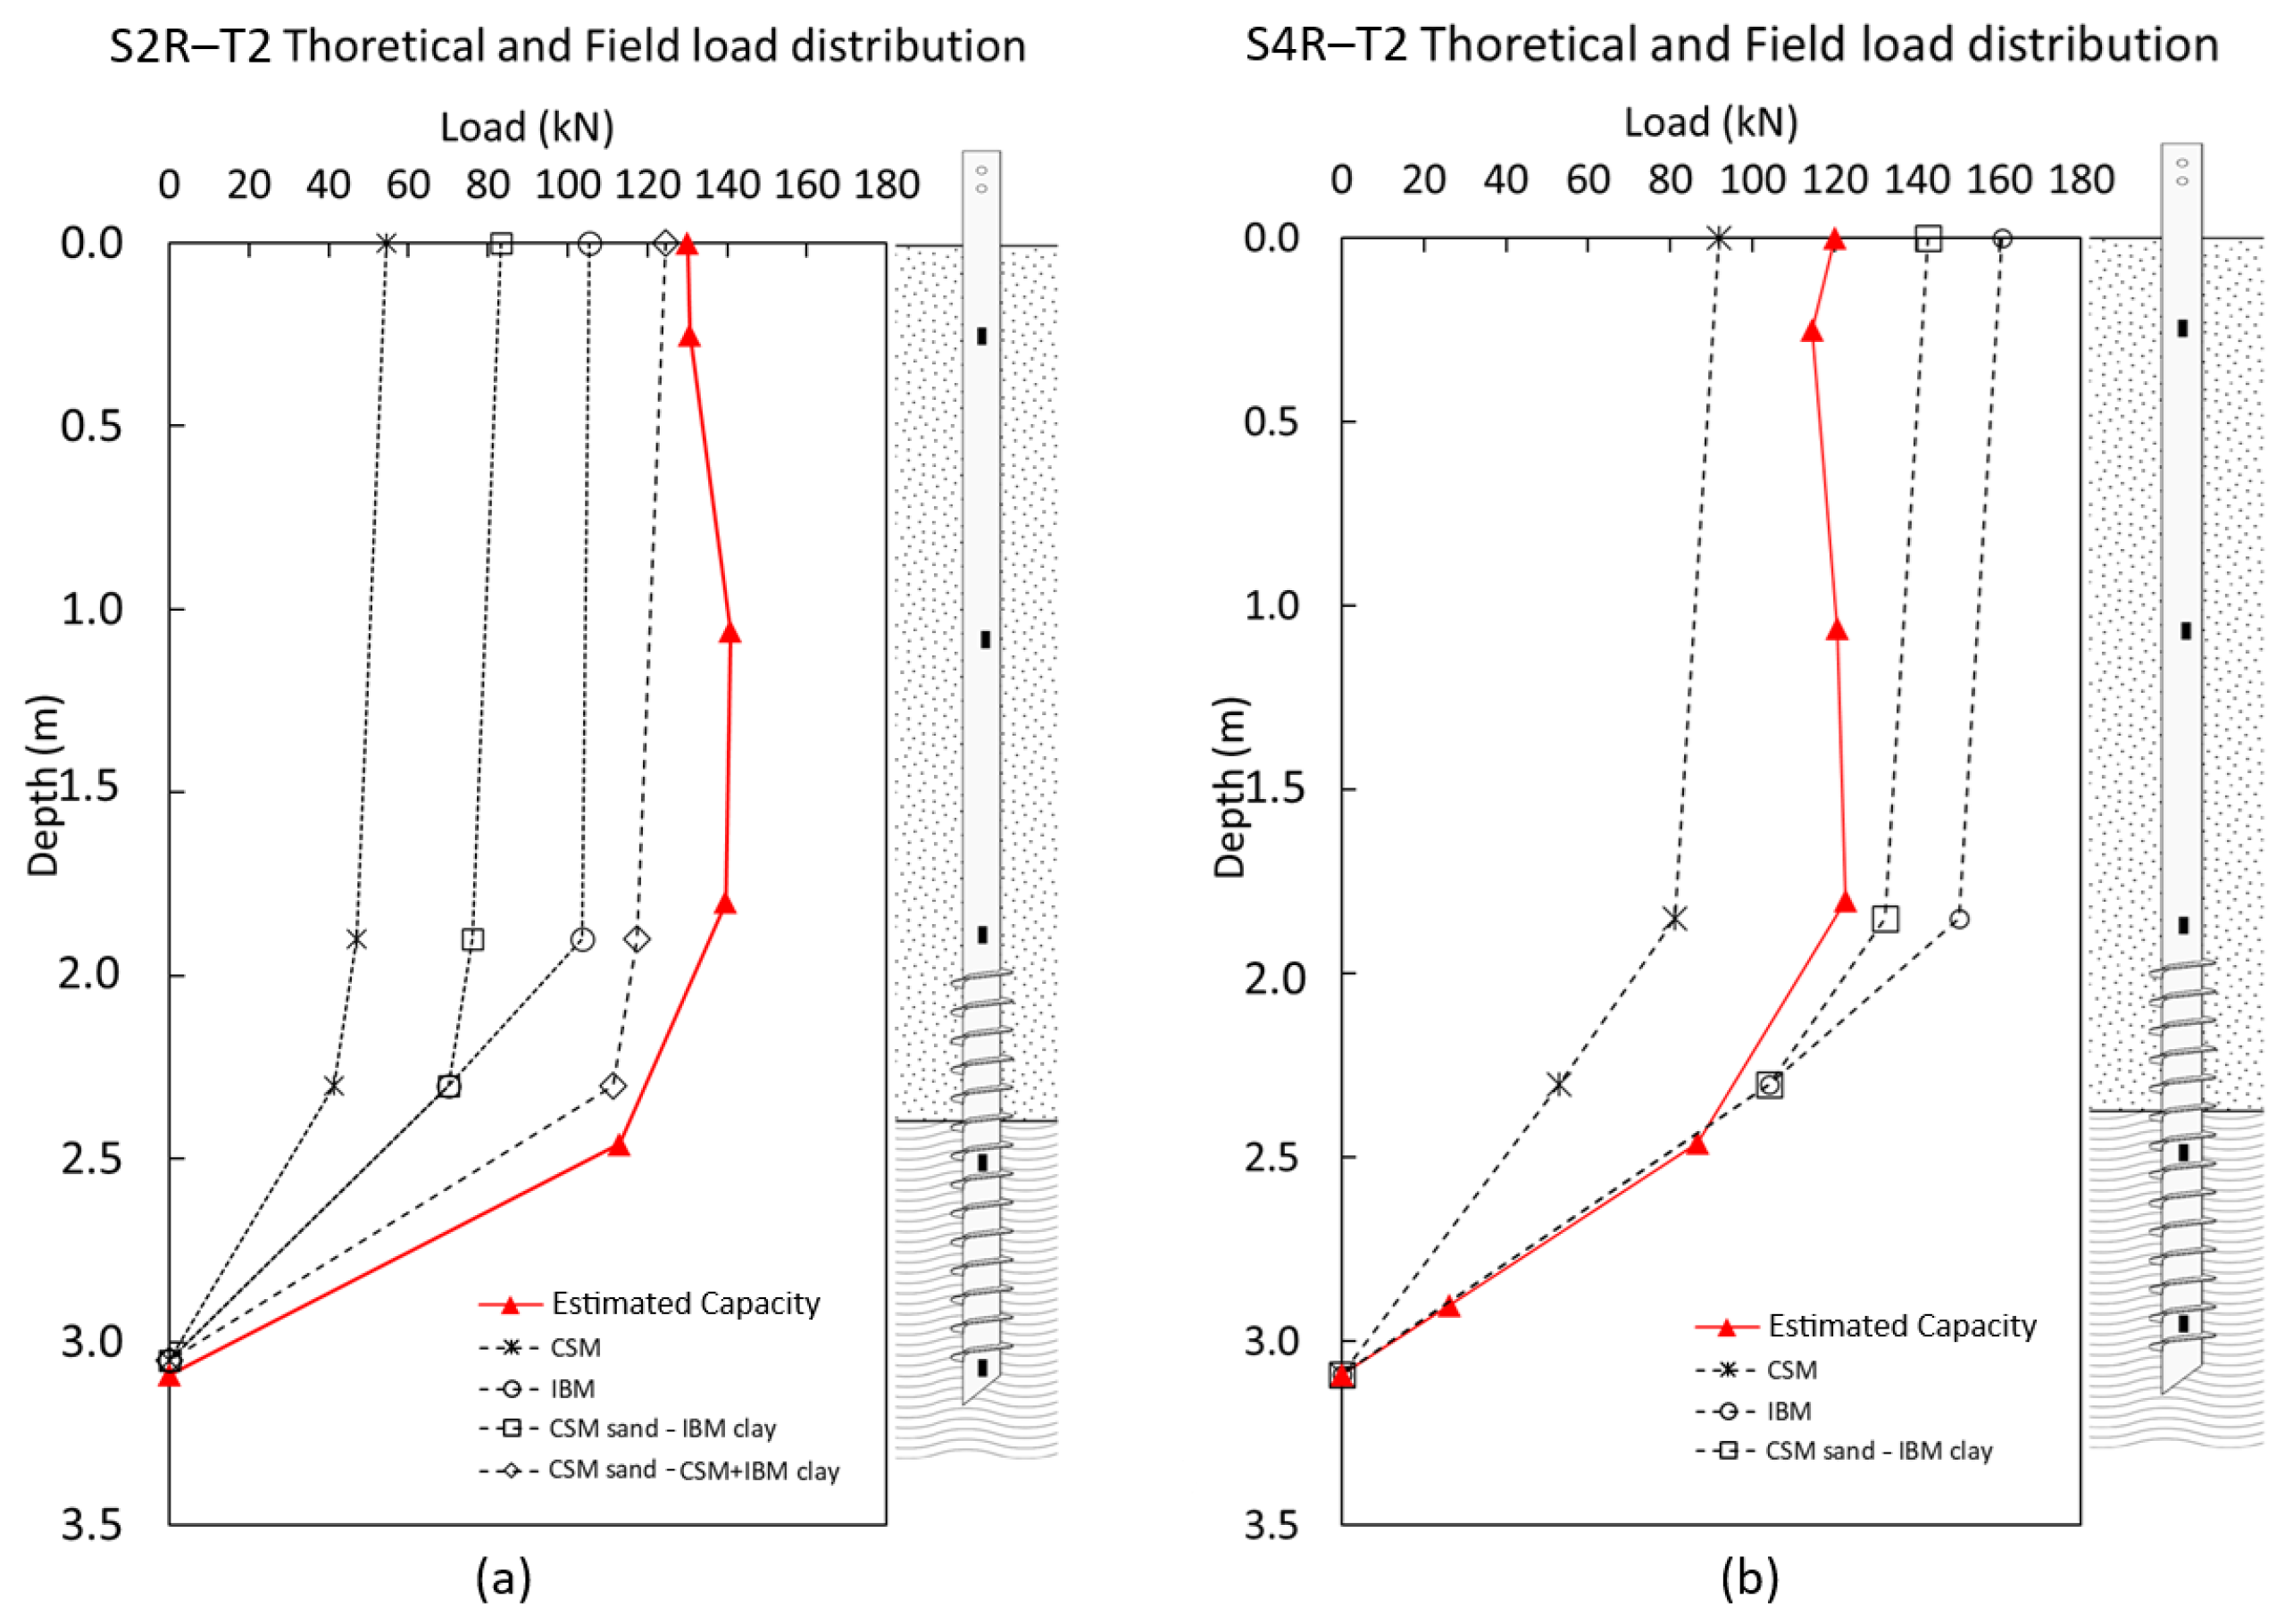
To better understand the shear failure mode of the tested piles, the theoretical load distribution using the four different case scenarios listed in Table 4 was plotted with the measured load distribution from field results in Figure 20 for compression tests and Figure 21 for tension tests of re-torqued piles. While the behavior of the threaded shaft in sand was closer to CSM, the shaft resistance of the bottom segment in the clay layer was higher than the theoretical CSM curves in all piles, as indicated by the slope of the load distribution lines. In piles S1–C2 and S4R–T2, the slope of the bottom segment was closer to IBM, and for piles S2R–T2 and S3–C2 the slope was closer to the combination of CSM and IBM.

6.4.2. Back Calculation of Pile Resistance Parameters

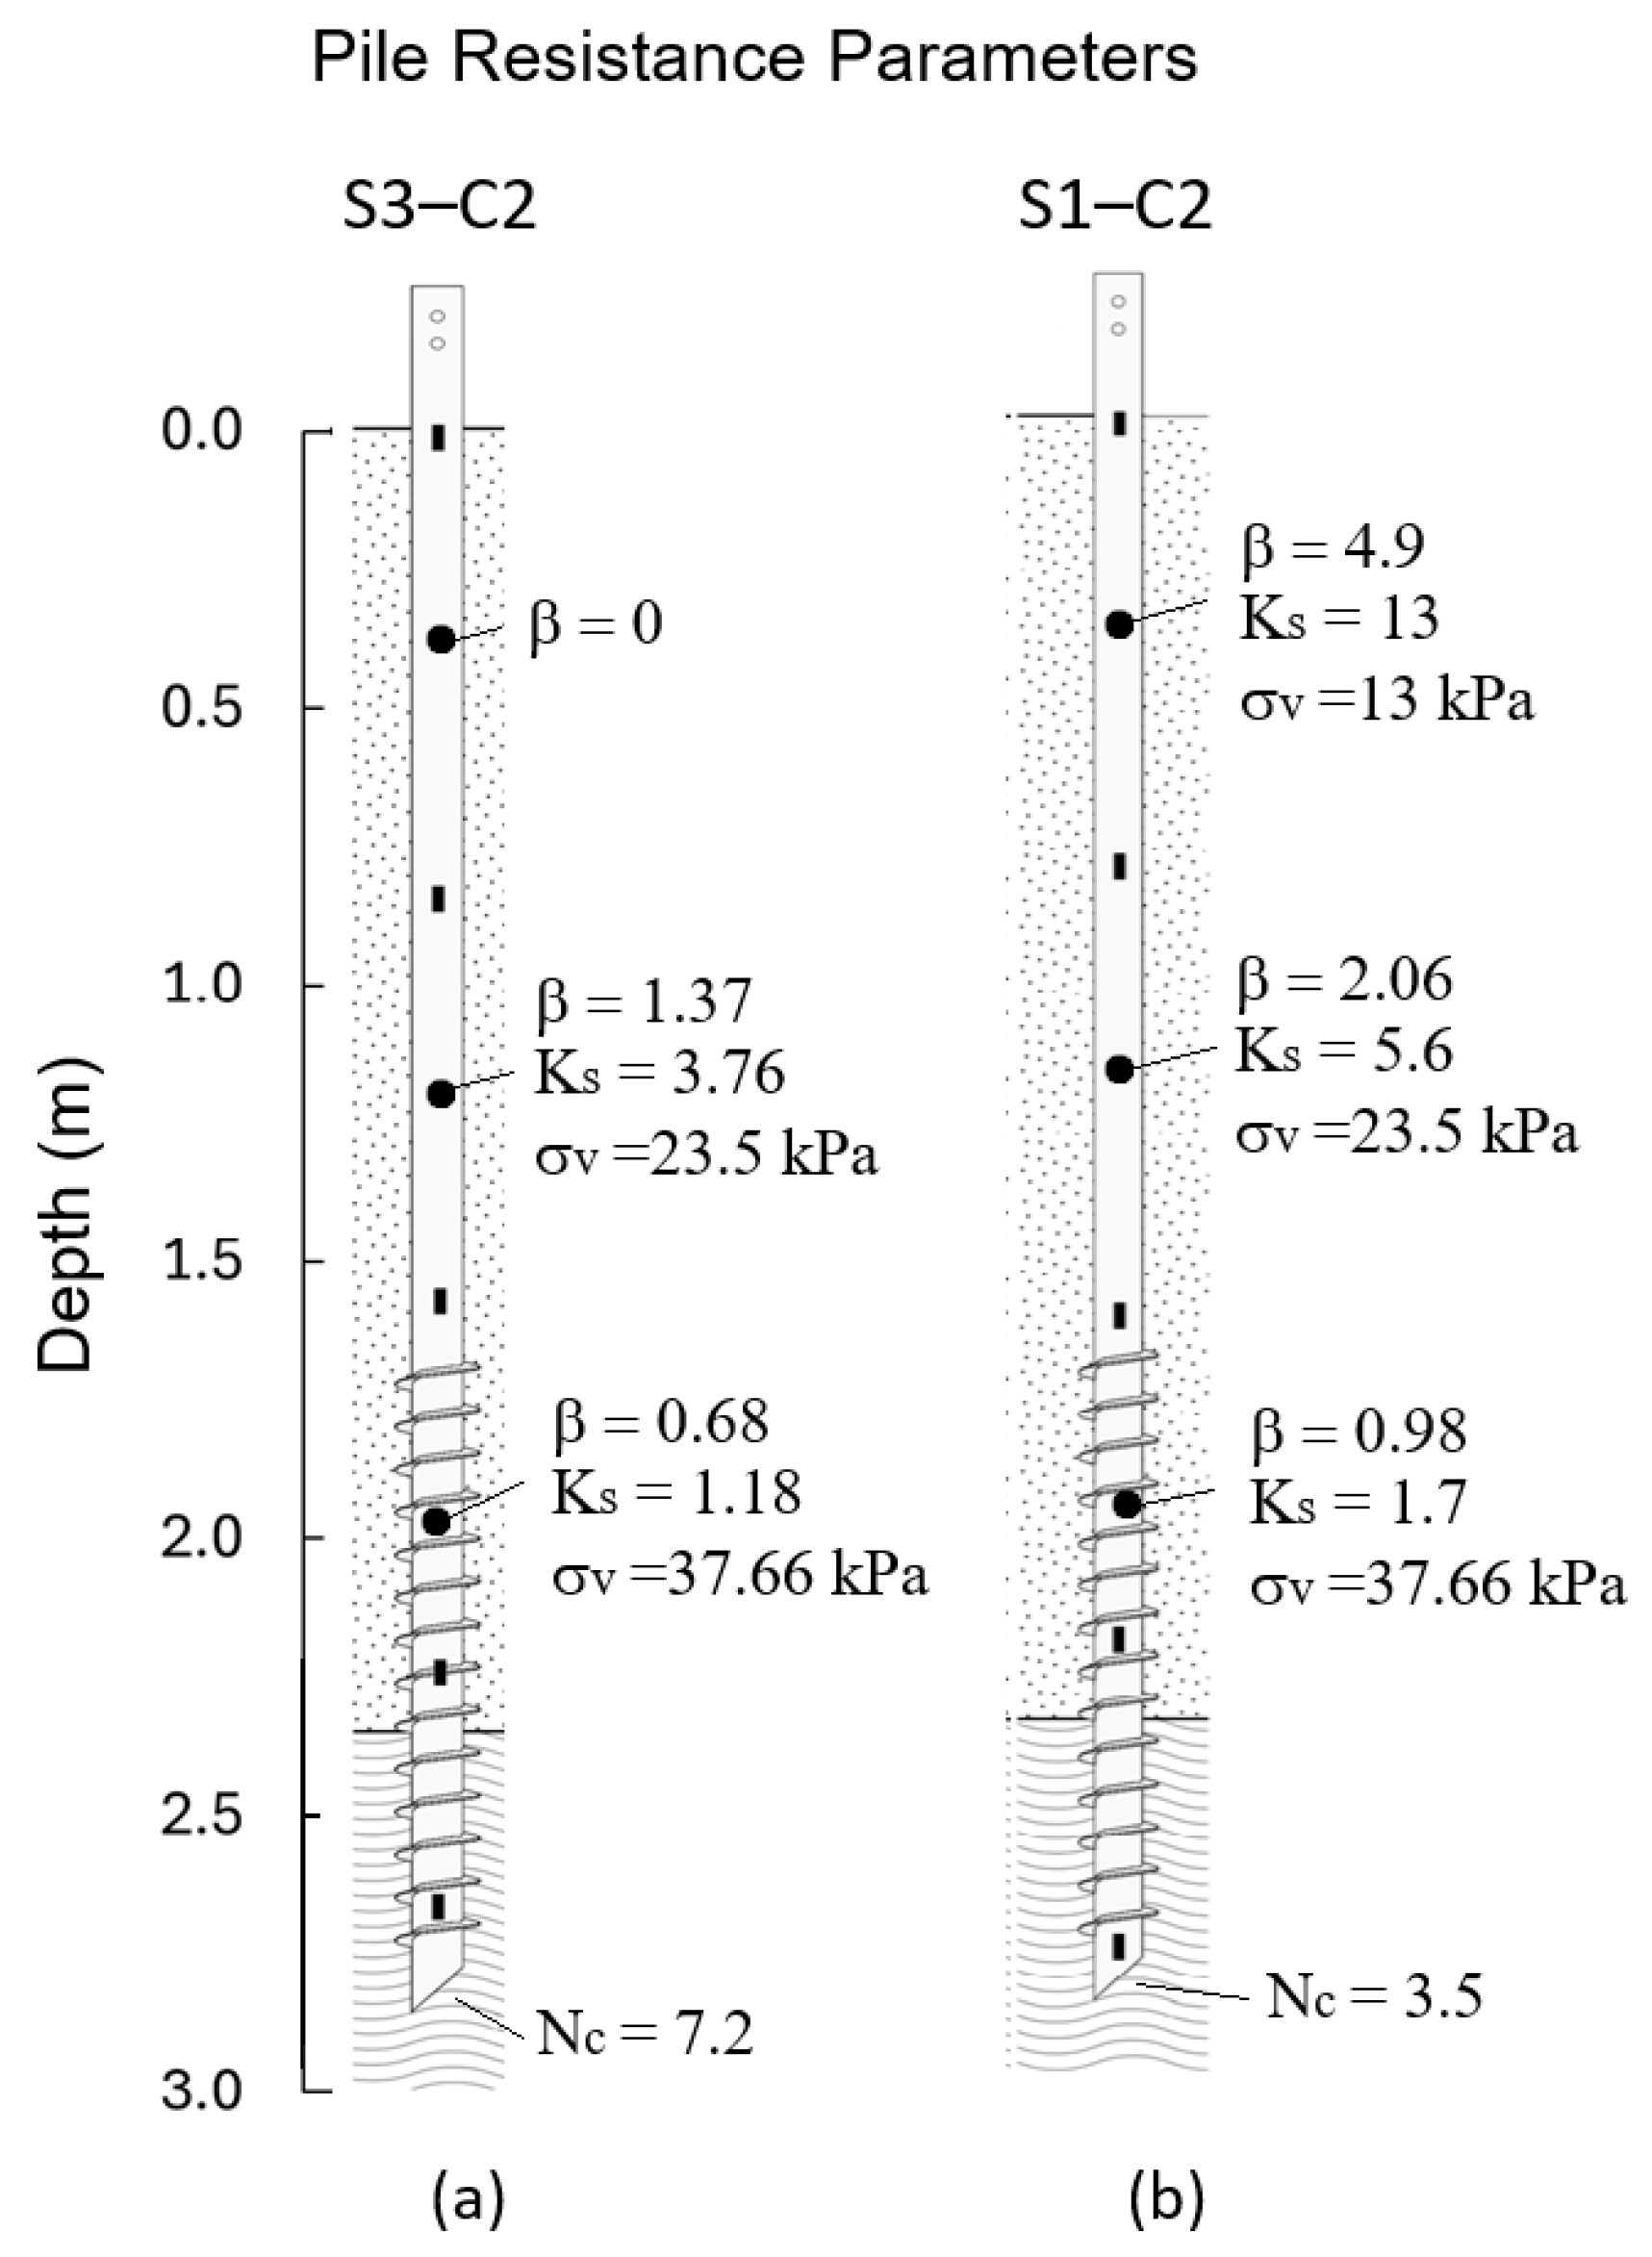
In the absence of sufficient in-situ properties of the soil, the resistance of different pile components could be estimated using Equations (3)–(9), knowing the parameters β and K s for shaft friction in sand and N c for bearing in clay. The shaft resistance obtained from strain gauge data at the estimated capacity load was used to back-calculate these parameters using the mentioned equations for piles S1–C2 and S2–C2. The interface friction angle δ was assumed to be equal to 2 3 ϕ at the smooth part of the shaft in sand [15], while the friction angle ϕ was used for the interface within the threaded part in sand. The capacity is best estimated using Case 4, as indicated in Table 4. The calculated values of β , K s , and N c are shown in Figure 22. The β values in Figure 22 ranged from 0.68 to 4.9; the largest values were at the pile segments nearest the ground surface. The Canadian Foundation Manual (CFM) [18] lists a β range of 0.3 to 0.8 for loose sand and 0.8 to 1.2 for dense sand; however, these values apply to long driven piles (longer than the piles in this study), and the values of β theoretically decrease with an increase in overburden pressure. Khidri & Deng [5] tested screw piles of the same depth as in this study and reported β values of 12.8 and 3.9 for the upper and lower smooth shaft segments, 2.6 and 0.5 for the threaded shaft segment, and 3.4 for a tapered threaded shaft segment at the very bottom of the pile. The higher value in their top segment was attributed to the very low overburden pressure and the presence of dense well-graded sand and gravel at the top 2 m of soil profile, while their β values of the other segments were close to values calculated in this study. While screw piles gain their capacity mainly through threaded shaft resistance, toe bearing was observed, especially in larger diameter piles S3 and S4. The bearing capacity factor for clay N c was back-calculated from test measurements to be 7.5 and 3.5 for 89 mm and 76 mm diameter piles, respectively. The value of N c is typically taken as 9 for pile diameters smaller than 0.5 m [18] for piles embedded at least four times the diameter in the bearing stratum. The N c values mentioned above corresponded to piles embedded 3D and 4D in the strong clay layer. Higher N c values are expected if the piles were embedded deeper.

7. Conclusions

The performance of screw piles was evaluated and compared to traditional helical piles through full-scale axial compression and tension tests. A total of 23 screw and helical piles were installed and tested under full-scale axial compression and tension loading in layered soil. Four screw piles were re-torqued and re-tested in tension to assess uplift behavior. The following are the conclusions drawn:
  • The screw piles can offer significant axial capacity over torque ratio, especially in tension, as they required lower installation torque than helical piles. In compression, the torque factors ( K t ) for screw piles were 32.7 m 1 and 27.5 m 1 for shaft diameters of 76 mm and 89 mm, respectively, compared to 23.5 m 1 and 22.7 m 1 for helical piles of the same diameters. In tension, K t values for screw piles were 35.35 m 1 (76 mm shaft) and 30.05 m 1 (89 mm shaft), whereas the helical pile with an 89 mm shaft exhibited a much lower K t of 10.56 m 1 .
  • The capacity—torque correlation for screw piles was more consistent in both compression and tension compared to helical piles, which could be due to reduced soil disturbance caused by the smaller helix projection. For instance, for screw piles with a shaft diameter of 89 mm, K t was 27.5 m 1 in compression and 22.7 m 1 in tension, whereas for helical piles, K t decreased from 22.7 m 1 in compression to 10.56 m 1 in tension.
  • The interpretation of strain gauge results indicated that screw piles behave predominantly as friction piles, with the majority of axial load resisted by the threaded shaft, particularly in the stiffer clay layer.
  • For helical piles, the theoretical failure modes provided reliable estimates for compression capacity, using IBM method. For screw piles, the theoretical failure modes provided reliable estimates of compression capacity, using CSM for sand and IBM for clay for piles with a length of 2.8 m, and CSM for sand and IBM + CSM for clay for piles with a length of 3.0 m. However, tension capacity predictions showed high variability, likely due to soil disturbance, with no clear failure pattern linked to pile type or depth.
  • The commonly used spacing ratio (S/D) to predict the mode of failure may not be utilized in screw piles directly, as the ratio does not consider the comparatively small difference between helix and shaft diameters in their design. Such a criterion, specifically developed for traditional helical piles, may not be an accurate reflection of failure mechanisms in screw piles.
  • The contribution of the smooth shaft section to overall pile resistance was observed only in compression tests, where it accounted for 20% and 5.5% of the total load in piles S1 and S3, respectively. In tension, the smooth shaft provided no measurable resistance. These findings align with existing literature on helical piles and suggest that the smooth shaft contribution should not be considered in the design of screw piles [25,26].

Author Contributions

A.M.: Conceptualization, field testing, data curation, analysis, investigation, methodology, writing original draft, writing review and editing. M.H.E.N.: Conceptualization, funding, project administration, resources, methodology, supervision, writing review and editing. O.D.: Conceptualization, investigation, writing review and editing. All authors have read and agreed to the published version of the manuscript.

Funding

This research received no external funding.

Institutional Review Board Statement

Not applicable.

Informed Consent Statement

Not applicable.

Data Availability Statement

The datasets presented in this article are not readily available because the data are part of an ongoing study. Requests to access the data should be directed to the authors.

Acknowledgments

The authors would like to thank Mascore Inc. for providing helical and screw piles and field support during the experimental phase of this study.

Conflicts of Interest

The authors declare no conflicts of interest.

References

  1. Lutenegger, A.J. Historical Development of Iron Screw-Pile Foundations: 1836–1900. Int. J. Hist. Eng. Technol. 2011, 81, 108–128. [Google Scholar] [CrossRef]
  2. Lutenegger, A.J. Screw piles and helical anchors—What we know and what we don’t know: An academic perspective—2019. In Proceedings of the 1st International Symosuym on Screw Piles for Energy Applications—University of Dundee, Dundee, UK, 27–28 May 2019; pp. 15–28. [Google Scholar]
  3. Mneina, A.; El Naggar, M.H. Capacity-torque correlation of continuous helix screw piles in cohesive soil. In Proceedings of the 77th Canadian Geotechnical Conference and the 16th Joint CGS/IAH-CNC Groundwater Conference, Montreal, QC, Canada, 15–18 September 2024. [Google Scholar]
  4. Guo, Z.; Deng, L. Field behaviour of screw micropiles subjected to axial loading in cohesive soils. Can. Geotech. J. 2018, 55, 34–44. [Google Scholar] [CrossRef]
  5. Khidri, M.; Deng, L. Field axial loading tests of screw micropiles in sand. Can. Geotech. J. 2022, 59, 458–472. [Google Scholar] [CrossRef]
  6. Sanzeni, A.; Danesi, E.G. Behaviour of screw micropiles subjected to axial tensile and compressive loading. Int. J. Geotech. Eng. 2022, 16, 450–461. [Google Scholar] [CrossRef]
  7. Chen, Y.; Deng, A.; Lu, F.; Sun, H. Failure mechanism and bearing capacity of vertically loaded pile with partially-screwed shaft: Experiment and simulations. Comput. Geotech. 2020, 118, 103337. [Google Scholar] [CrossRef]
  8. Elsherbiny, Z.H.; El Naggar, M.H. Axial compressive capacity of helical piles from field tests and numerical study. Can. Geotech. J. 2013, 50, 1191–1203. [Google Scholar] [CrossRef]
  9. Lutenegger, A.J. Cylindrical Shear or Plate Bearing?—Uplift Behavior of Multi-Helix Screw Anchors in Clay. In Contemporary Topics in Deep Foundations, Proceedings of the International Foundation Congress and Equipment Expo, Orlando, FL, USA, 15–19 March 2009; American Society of Civil Engineers: Reston, VA, USA, 2009; pp. 456–463. [Google Scholar] [CrossRef]
  10. Lanyi-Bennett, S.A.; Deng, L. Effects of inter-helix spacing and short-term soil setup on the behaviour of axially loaded helical piles in cohesive soil. Soils Found. 2019, 59, 337–350. [Google Scholar] [CrossRef]
  11. ASTM-D7928-17; Standard Test Method for Particle-Size Distribution (Gradation) of Fine-Grained Soils Using the Sedimentation (Hydrometer) Analysis. ASTM International: West Conshohocken, PA, USA, 2017.
  12. ASTM-D2487-00; Standard Practice for Classification of Soils for Engineering Purposes (Unified Soil Classification System). Anual Book of ASTM. Committee D18.07 on Identification and Classification of Soils. ASTM International: West Conshohocken, PA, USA, 2000; Volume 4.
  13. Sivrikaya, O.; Toğrol, E. Determination of undrained strength of fine-grained soils by means of SPT and its application in Turkey. Eng. Geol. 2006, 86, 52–69. [Google Scholar] [CrossRef]
  14. Hoyt, R.; Clemence, S. Uplift capacity of helical anchors in soil. In Proceedings of the 12th International Conference on Soil Mechanics and Foundation Engineering, Rio de Janeiro, Brazil, 13–18 August 1989. [Google Scholar]
  15. Bowles, J.E.; Guo, Y. Foundation Analysis and Design; McGraw-Hill: New York, NY, USA, 1996; Volume 5. [Google Scholar]
  16. Sharnouby, M.E.; El Naggar, M.H. Field investigation of axial monotonic and cyclic performance of reinforced helical pulldown micropiles. Can. Geotech. J. 2012, 49, 560–573. [Google Scholar] [CrossRef]
  17. Livneh, B.; El Naggar, M.H. Axial testing and numerical modeling of square shaft helical piles under compressive and tensile loading. Can. Geotech. J. 2008, 45, 1142–1155. [Google Scholar] [CrossRef]
  18. Society, C.G. Canadian Foundation Engineering Manual, 4th ed.; BiTech Publishers Ltd.: Richmond, BC, Canada, 2006. [Google Scholar]
  19. ASTM-D1143; Standard Test Methods for Deep Foundations Under Static Axial Compressive Load. Technical Report. ASTM International: West Conshohocken, PA, USA, 2007.
  20. ASTM-D3689; Standard Test Methods for Deep Foundations Under Static Axial Tensile Load. Technical Report. ASTM International: West Conshohocken, PA, USA, 2007.
  21. Mansour, M.A.; El Naggar, M.H. Optimization of grouting method and axial performance of pressure-grouted helical piles. Can. Geotech. J. 2022, 59, 702–714. [Google Scholar] [CrossRef]
  22. Perko, H.A. Helical Piles: A Practical Guide to Design and Installation; John Wiley & Sons: Hoboken, NJ, USA, 2009; p. 512. [Google Scholar]
  23. Hirany, A.; Kulhawy, F.H. Conduct and Interpretation of Load Tests on Drilled Shaft Foundations: Volume 1, Detailed Guidelines: Final Report; Technical Report, Electric Power Research Institute, Palo Alto, CA (USA); Cornell University, Ithaca, NY (USA); Geotechnical Engineering Group: Grand Junction, CO, USA, 1988. [Google Scholar]
  24. Lutenegger, A.J.; Tsuha, C.D.H. Evaluating Installation Disturbance from Helical Piles and Anchors Using Compression and Tension Tests. In Proceedings of the 15th American Conference on Soil Mechanics and Geotechnical Engineering (XV PCSMGE), Buenos Aires, Argentina, 15–19 November 2015; pp. 373–381. [Google Scholar]
  25. George, B.E.; Banerjee, S.; Gandhi, S.R. Numerical analysis of helical piles in cohesionless soil. Int. J. Geotech. Eng. 2020, 14, 361–375. [Google Scholar] [CrossRef]
  26. Nazir, R.; Chuan, H.S.; Niroumand, H.; Kassim, K.A. Performance of single vertical helical anchor embedded in dry sand. Measurement 2014, 49, 42–51. [Google Scholar] [CrossRef]
Figure 1. Schematic diagram for tested piles: (a) Screw piles and helical piles dimensions and (b) soil profile showing installation depths for all pile types.
Buildings 15 03620 g001
Figure 2. Variation of SPT blow count with depth.
Buildings 15 03620 g002
Figure 3. Atterberg limit results: (a) Variation of plastic limit (PL), liquid limit (LL) and natural moisture content with depths. (b) Plasticity chart of fine grain soil samples.
Buildings 15 03620 g003
Figure 4. Possible soil failure modes: (a) Cylindrical shear failure, (b) Individual bearing failure.
Buildings 15 03620 g004
Figure 5. Test site layout and borehole locations.
Buildings 15 03620 g005
Figure 6. Test setup: (a) Compression test setup and (b) Uplift test setup.
Buildings 15 03620 g006
Figure 7. (a) Pile head instrumentation, (b) A screw pile during installation.
Buildings 15 03620 g007
Figure 8. Strain gauge placement and protective coatings.
Buildings 15 03620 g008
Figure 9. Installation torque logs with depth for: (a) 76 mm-shaft piles and (b) 89 mm-shaft piles.
Buildings 15 03620 g009
Figure 10. Load vs. pile displacement curves for screw piles: (a) Compression tests for piles S1, S2. (b) Tension tests for piles S1, S2. (c) Compression tests for piles S3, S4. (d) Tension tests for piles S3, S4.
Buildings 15 03620 g010
Figure 11. Load vs. pile head displacement curves for helical piles: (a) Compression tests for helical pile type H1 and H2. (b) Tension tests for helical pile type H2.
Buildings 15 03620 g011
Figure 12. Load vs. pile head displacement curves for piles re-torqued piles under Tension.
Buildings 15 03620 g012
Figure 13. Capacity vs. Torque determined using L1–L2 method for (a) compression tests and (b) tension tests.
Buildings 15 03620 g013
Figure 14. Capacity-Torque K t factor correlation for different pile types in compression: (a) Helical piles with 76 mm shaft diameter, (b) Helical piles with 89 mm shaft diameter, (c) Screw piles with 76 mm shaft diameter, (d) screw piles with 89 mm shaft diameter.
Buildings 15 03620 g014
Figure 15. Comparison between the average field capacities and theoretical capacities determined based on different case scenarios of failure modes for: (a) Compression tests and (b) Tension tests.
Buildings 15 03620 g015
Figure 16. Load distribution and shaft resistance along the pile shaft for compression tests: (a) pile S1–C2, (b) pile S3–C2.
Buildings 15 03620 g016
Figure 17. Load distribution and shaft resistance along the pile shaft for uplift tests of re-torqued piles: (a) pile S2R–T2 and (b) pile S4R–T2.
Buildings 15 03620 g017
Figure 18. Shaft and Toe resistance, and shaft resistance components vs. pile head displacement of piles tested in compression: (a) S2–C2 and (b) S3–C2.
Buildings 15 03620 g018
Figure 19. Shaft resistance components vs. pile head displacement of re-torqued piles tested in tension: (a) S2R–T2 and (b) S4R–T2.
Buildings 15 03620 g019
Figure 20. Theoretical and field load distribution with depth on different failure mode scenarios: (a) Pile S1–C2, (b) Pile S3–C2.
Buildings 15 03620 g020
Figure 21. Theoretical and field load distribution with depth on different failure mode scenarios: (a) Pile S2R–T2, (b) Pile S4R–T2.
Buildings 15 03620 g021
Figure 22. Estimated Pile resistance parameters from back-calculation using strain gauge results at the pile capacity load. (a) Pile S3–C2, (b) Pile S1–C2.
Buildings 15 03620 g022
Table 1. The geometric parameters of the tested screw and helical piles.
PileTypeL1 (mm)L2 (mm)d (mm)Dh (mm)Pitch (mm)
S1Screw pile165011507612776
S2Screw pile190011507612776
S3Screw pile155012408915289
S4Screw pile185012408915289
H1Helical pile3650-7625476
H2Helical pile3350-8935689
Table 2. Soil properties based on average SPT and laboratory tests.
Depth (m)Soil LayerSPT Nγ (kN/m3)ϕSu (kPa)
0–0.8Fill819.0--
0.8–1.5Clayey Sand SC621.325–29-
1.5–2.3Silty Sand SM, Sandy Lean Clay CL1020.025–30-
2.3–4.6Sandy Lean Clay CL, Sandy Silty Clay CL-ML18 to 10023.5-88 to 270
Table 3. Summary of pile load capacity and installation torque correlation from field tests.
PileL1–L2 Capacity (kN)Test TypePile TypeDepth (m)Installation Torque (kN.m)Kt (m−1)
H1–C1138CompressionHelical3.66.521
H1–C2141CompressionHelical3.66.821
H1–C3188CompressionHelical3.66.728
H2–C1191CompressionHelical3.38.622
H2–C2188CompressionHelical3.38.323
H2–C3184CompressionHelical3.38.522
S1–C179CompressionScrew2.81.941
S1–C275CompressionScrew2.83.025
S2–C1160CompressionScrew3.03.842
S2–C2154CompressionScrew3.05.329
S3–C185CompressionScrew2.84.121
S3–C2121CompressionScrew2.85.024
S3–C3135CompressionScrew2.86.022
S4–C3210CompressionScrew3.04.745
H2–T1115TensionHelical3.39.712
H2–T288TensionHelical3.612.97
H2–T3162TensionHelical3.611.214
S1–T1137TensionScrew2.83.440
S2–T1179TensionScrew3.05.433
S2–T2155TensionScrew3.04.336
S3–T1110TensionScrew2.83.532
S4–T1165TensionScrew3.05.331
S4–T2120TensionScrew3.04.427
S2R–T1125Tension (Retorqued)Screw3.03.535
S2R–T2130Tension (Retorqued)Screw3.04.429
S4R–T1119Tension (Retorqued)Screw3.06.020
S4R–T2125Tension (Retorqued)Screw3.05.523
Table 4. Theoretical case scenarios for failure modes of different soil layers along the screw pile profile.
Soil Layer/Failure ModeCase 1Case 2Case 3Case 4
Sand (0–2.3 m)IBMCSMCSMCSM
Clay (>2.3 m)IBMCSMIBMIBM + CSM
Table 5. Theoretical capacity estimation percentage of error for different cases based on field capacity. The lowest error values are marked in bold.
CASE1 Error%CASE2 Error%CASE3 Error%CASE4 Error%
Pile TypeComp. *Ten. *Comp.Ten.Comp.Ten.Comp.Ten.
S156%−28%−9%−61%5%−53%36%−36%
S2−7%−37%−43%−67%−25%−50%1%−25%
S346%22%−32%−53%−8%−28%16%−3%
S4−12%13%−45%−36%−21%0%5%37%
H11%No data------
H216%69%------
* Comp. = Compression test and Ten. = Tension test.
Disclaimer/Publisher’s Note: The statements, opinions and data contained in all publications are solely those of the individual author(s) and contributor(s) and not of MDPI and/or the editor(s). MDPI and/or the editor(s) disclaim responsibility for any injury to people or property resulting from any ideas, methods, instructions or products referred to in the content.