Article

Application and Mechanism Study on Optimal Design of Cement-Based Building Materials Based on Polymer Binder

1
School of Architectural Engineering, Qingdao Agricultural University, Qingdao 266109, China
2
School of Civil Engineering, Sun Yat-Sen University, Zhuhai 519082, China
3
College of Architecture and Environment, Sichuan University, Chengdu 610041, China
*
Author to whom correspondence should be addressed.
Buildings 2025, 15(17), 3192; https://doi.org/10.3390/buildings15173192
Submission received: 1 August 2025 / Revised: 31 August 2025 / Accepted: 3 September 2025 / Published: 4 September 2025
(This article belongs to the Section Building Materials, and Repair & Renovation)

Abstract

This study examines the effects of three polymer binders—polyvinyl alcohol (PVA), polyethylene glycol (PEG), and polyacrylic acid (PAA) on the mechanical properties and dry–wet cycle corrosion resistance of cement mortar at different dosages (1–4%). Mechanical testing combined with scanning electron microscopy (SEM) and molecular dynamics (MD) simulations was conducted to validate the experimental findings and reveal the underlying mechanisms. Results show that polymers reduce early-age strength but improve flexural performance, and at low dosage, enhance compressive strength. PVA and PAA exhibited a pronounced improvement in mechanical strength while PVA and PEG showed a significant improvement in wet cycle corrosion resistance. SEM observations indicated that polymers encapsulate cement particles, enhancing interfacial bonding while partially inhibiting hydration. MD simulations revealed that PVA and PAA interact with Ca2+ via Ca-O coordination, while PEG primarily forms hydrogen bonds, resulting in distinct water-binding capacities (PEG > PVA > PAA). These interactions explain the enhanced mechanism of mechanical and dry–wet cycle resistance properties. This work combined experimental and molecular-level validation to clarify how polymer–matrix and polymer–water interactions govern mechanical and durability, respectively. The findings provide theoretical and practical guidance for designing advanced polymer binders with tailored interfacial adhesion and water absorption properties to improve cementitious materials.

1. Introduction

As one of the most widely used construction materials globally, optimizing the performance of cement-based materials is of critical importance. During the hydration process, calcium silicate hydrate (CSHCSH) gradually becomes the dominant phase, ultimately accounting for approximately 60–80% of the total mass of the hardened cement matrix. However, the presence of nanoscale pores within the CSH structure leads to inherent microstructural brittleness. When exposed to external environmental stresses such as mechanical loading or impact, these materials are prone to the initiation and propagation of microcracks, which in turn compromise structural integrity and result in typical brittle failure behavior. Consequently, extensive monitoring and maintenance efforts are often required in practical engineering applications to ensure long-term structural safety and durability [1].
To enhance the crack resistance, mechanical strength, and durability of concrete materials, extensive research has been devoted to the system design and performance control mechanisms of cement-based composites. One widely adopted strategy involves the incorporation of nanomaterials, such as graphene oxide, nanocellulose, nano-silica, and carbon nanotubes to regulate cement hydration kinetics, refine the pore structure, and improve ionic transport characteristics. These modifications effectively enhance the degree of hydration, mechanical performance, and corrosion resistance of cementitious materials [2,3,4,5,6,7,8,9,10]. Despite the demonstrated reinforcing effects of these nanomaterials, their widespread application is limited by high costs and challenges associated with uniform dispersion within the cement matrix. Another prevalent approach is the addition of fibers, such as polyethylene, polypropylene, and polyvinyl alcohol, to improve the crack resistance of concrete [11,12,13,14]. Fibers act as bridges across microcracks, redistributing localized stresses and significantly enhancing the toughness of the composite. However, excessive fiber content can increase the water demand of the system, reduce slurry workability, and potentially compromise compressive strength. In addition, the use of supplementary cementitious materials, such as rice husk ash, peanut shell ash, fly ash, slag, and ground granulated blast furnace slag has proven effective in promoting secondary hydration reactions with cement [15,16,17,18,19,20]. The above materials enhance various properties of concrete materials by regulating the hydration of cement. However, polymer materials not only have relatively low production costs, excellent elastic deformability, high flexibility, and strong corrosion resistance, but also possess unique bonding characteristics [21,22]. Owing to these desirable properties, researchers have increasingly explored the incorporation of polymers into concrete systems to enhance their overall performance. Polyvinyl alcohol (PVA), a representative water-soluble polymer binder, has demonstrated outstanding performance in modifying cement-based materials. The hydroxyl groups abundant in PVA chains enable strong adsorption onto the cement matrix, thereby promoting effective interfacial bonding and significantly improving crack resistance [23,24]. In addition to PVA, other polymers such as polyethylene glycol (PEG) and polyacrylic acid (PAA) have also been employed in the formulation of polymer-modified mortars. Studies have shown that these polymers exhibit considerable potential in enhancing the toughness and durability of cementitious materials [25,26]. However, the current research on polymer mortars focuses on the influence of polymer types and content, but does not deeply explore the regulation mechanism of polymer adhesion to the cement matrix and the water absorption characteristics on mortar properties. The bonding behavior of polymers is strongly influenced by their surface functional groups [27,28]; therefore, it is important to study the interaction mechanism of the polymer with the cement matrix and water molecules, to guide the development of high-performance polymer cement-based composites. However, the characteristics of the interface are very complex, and it is difficult to conduct quantitative analysis through experiments and microscopic tests. Molecular dynamics (MD) simulation, as an atomistic-scale computational technique, offers a powerful tool for investigating the microscopic mechanisms of atomic interactions and hydrogen bond formation [29,30,31,32,33]. This method has been employed to analyze the mechanical response of polymer CSH gel structures under tensile and compressive loading, elucidating the toughening mechanisms imparted by polymers in cement-based materials [34].
In this study, the effects of three representative water-soluble polymer binders, PVA, PEG, and PAA on the mechanical properties and dry–wet cycle resistance of cement-based materials were systematically investigated. Scanning electron microscopy (SEM) was employed to examine the influence of these binders on the microstructure and pore morphology of the hydration products. Additionally, molecular dynamics simulations were conducted to elucidate the interfacial adsorption behavior of the polymers on the CSH surface, thereby revealing the underlying strengthening mechanisms contributing to improved mechanical performance. Key parameters, including hydrogen bond density and the dynamic stability of interactions between polymers and water molecules, were quantitatively analyzed to uncover the molecular-scale mechanisms by which these water-soluble binders enhance dry–wet cycle resistance. By correlating the interfacial characteristics and water adsorption behavior with the specific functional groups of each polymer, this study provides a theoretical foundation and molecular-level design strategy for the development of high-performance water-soluble polymer binders in cement-based materials.

2. Materials and Methods

2.1. Raw Materials and Sample Preparation

In this study, mortar specimens were prepared using cement, water, and standard sand at a mass ratio of 1:0.5:3. The cementitious material employed was ordinary Portland cement (P.O 42.5), sourced from Shandong Shanshui Group, and its composites are listed in Table 1. Three types of water-soluble polymer binders: PVA, PEG, and PAA were obtained from Shanghai Chenqi Chemical Technology Co., Ltd., Shanghai, China. The PVA, PAA, and PEG powder shown in Figure 1a–c indicates that all polymers were in white crystalline form and were incorporated into the mortar at dosages of 1%, 2%, 3%, and 4% by mass of cement.

2.2. Direct Mixed with CNC

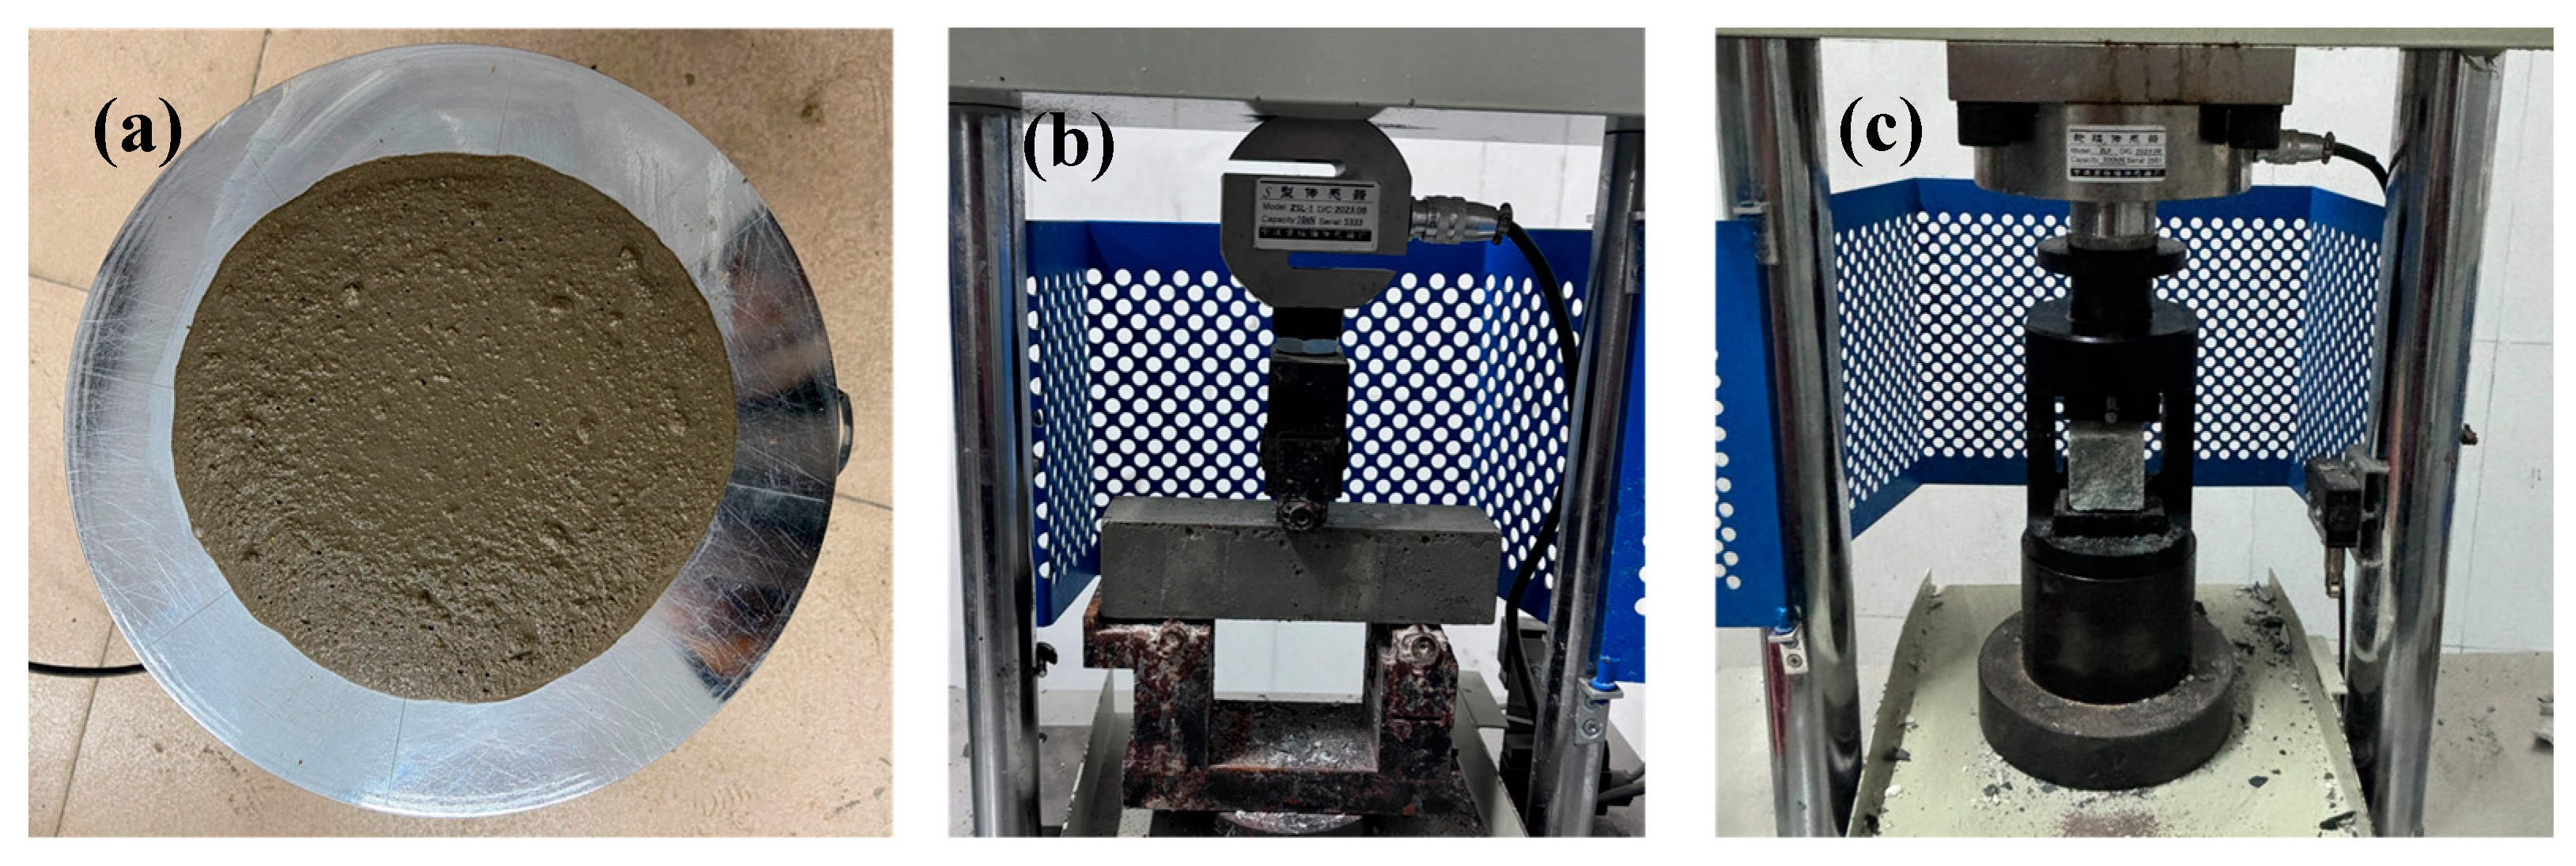
The preparation process of the polymer-modified mortar was as follows: First, the designated amount of polymer was added to the mixing water and stirred using a magnetic stirrer for 3 min to ensure complete dissolution, forming a homogeneous polymer solution (Figure 1d). This solution was then thoroughly mixed with cement and standard sand using an automatic mortar mixer to produce the polymer-modified mortar slurry. The workability of the fresh mortar was evaluated according to the GB/T 2419-2005 standard [35]. The slurry was subsequently cast into 40 mm × 40 mm × 160 mm molds, compacted via vibration, surface-leveled, and cured under standard curing conditions (relative humidity 95 ± 5%, temperature of 23 ± 2 °C) until the designated testing age. Following curing, the compressive and flexural strengths were measured in accordance with the GB/T 17671-2021 standard [36]. The samples for the fluidity, flexural, and compressive tests are shown in Figure 2a–c, respectively.
Given that all selected polymers are hydrophilic and water-soluble, their molecular adsorption onto the surfaces of cement hydration products can significantly alter the surface hydrophilicity of the matrix. This effect is expected to enhance mortar durability, particularly in terms of permeability resistance and resistance to ion ingress. To evaluate the impact of polymer incorporation on durability, a dry–wet cycle erosion test was designed. After curing for 28 days, the polymer-modified mortar specimens were subjected to cyclic exposure conditions. Each dry–wet cycle lasted 20 days, consisting of full immersion in water for the first 10 days, followed by natural air-drying at ambient temperature for the remaining 10 days. At intervals of 20, 40, 60, 80, and 100 days, specimens were extracted to measure residual compressive and flexural strengths in order to assess the degradation behavior and durability performance over time.

3. Test Results and Discussions

3.1. Fluidity

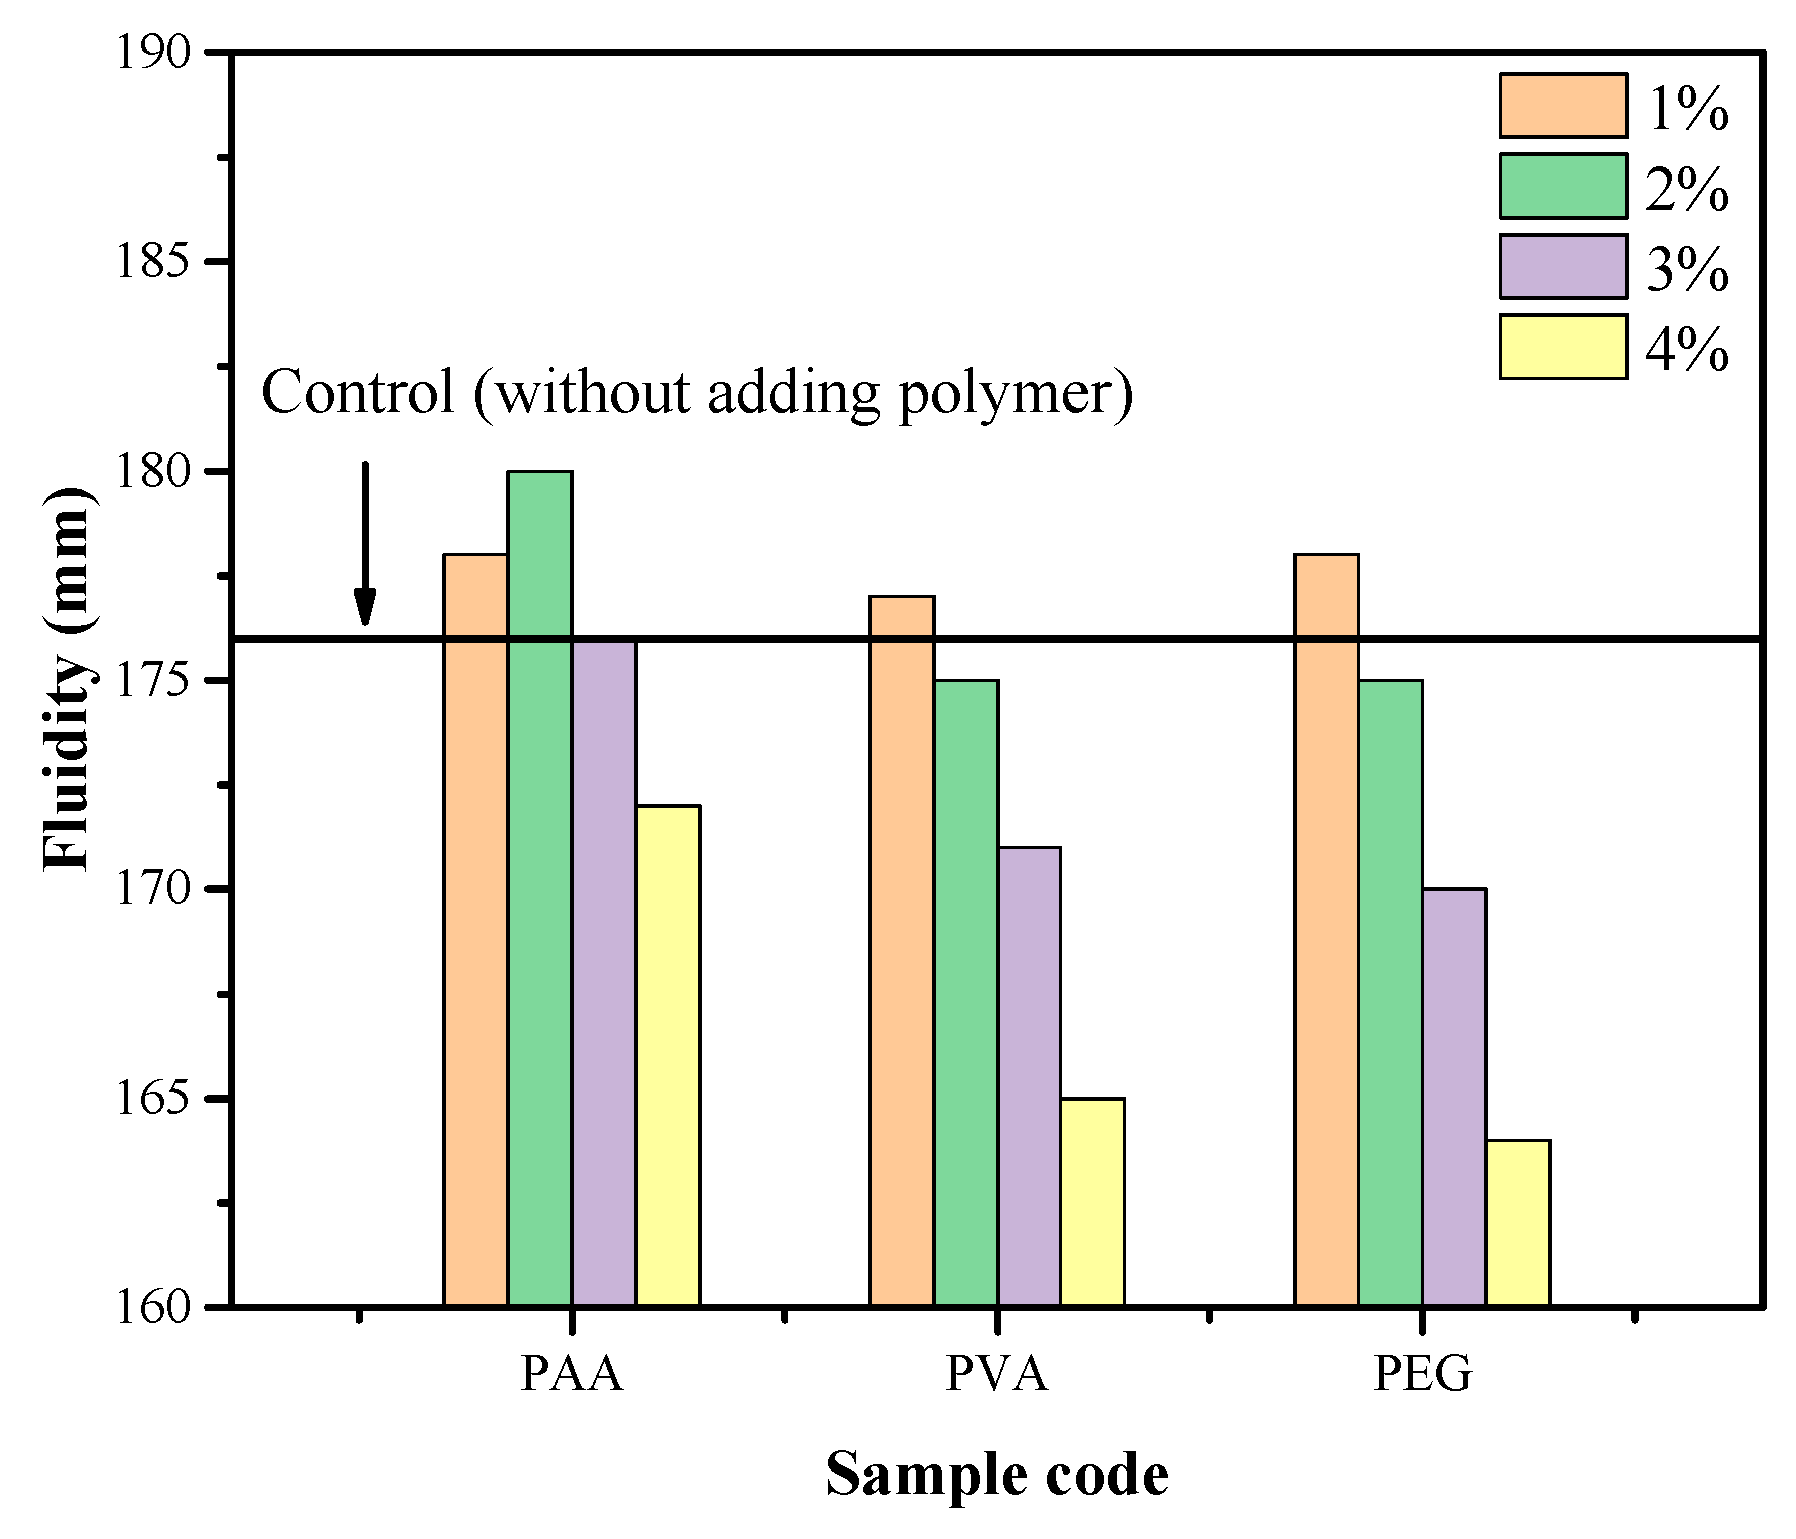
After the incorporation of polymers into the mortar, their inherent moisture-adsorption characteristics altered the number of water molecules adsorbed on the surface of the cement particles, thereby influencing the fluidity of the fresh slurry. As shown in Figure 3, the control group (without polymer) exhibited a flow diameter of 176 mm. With the addition of 1% polymer, a slight increase in fluidity was observed. This enhancement is primarily attributed to the formation of an adsorbed water film by the polymers, which provides a lubricating effect, promotes homogeneous dispersion of particles, and improves the overall flowability of the slurry [24]. However, as the polymer dosage increases beyond 1%, a gradual decline in fluidity is observed. At a dosage of 4%, the flow diameters of mortars modified with PEG, PVA, and PAA decreased to 164 mm, 165 mm, and 174 mm, respectively. Among the three, PEG exhibits the most pronounced reduction in workability. This may be attributed to the higher oxygen content in the PEG molecular structure, which enhances its water-binding capacity and reduces the availability of free water within the mix. In contrast, PVA and PAA contain fewer oxygen-containing functional groups, resulting in a less significant impact on fluidity. These findings indicate that higher polymer dosages do not necessarily lead to improved performance. Since fluidity directly affects the workability and application quality of mortar, it is essential to conduct a systematic evaluation to determine the optimal dosage range for each polymer type to balance fluidity and mechanical or durability enhancements effectively.

3.2. Effect of Different Curing Ages on Flexural Strength

The flexural strength results are presented in Figure 4. As shown in Figure 4a, the 3-day flexural strength of the control group was 3.6 MPa. Upon the incorporation of polymers, the early flexural strength of the polymer-modified mortars exhibited a declining trend. This reduction is primarily attributed to the formation of a polymer film on the surface of the cement particles, which impedes the ingress of water molecules and subsequently inhibits the early hydration process, thereby limiting early-age strength development. Moreover, the negative impact becomes more pronounced with increasing polymer dosage. At a 4% dosage, the flexural strengths of mortars modified with PAA, PVA, and PEG decreased to 3.0 MPa, 2.9 MPa, and 3.2 MPa, respectively. Among them, PVA exhibited the most significant strength reduction at early age. This can be attributed to the strong interfacial adhesion between PVA molecules and the cement matrix, which restricts moisture transport into the particles and intensifies the inhibition of early hydration reactions [24].
In contrast, as shown in Figure 4b, the flexural strength of the control group increased to 4.5 MPa at 7 days. At this stage, the presence of polymers begins to enhance the strength of the mortar, and the improvement becomes more evident with increasing polymer content. As hydration progresses and the matrix begins to harden, polymers can effectively bind the hydrated products and improve interparticle cohesion, thereby enhancing flexural strength. At a 4% dosage, the flexural strengths of mortars modified with PAA, PVA, and PEG reached 5.0 MPa, 5.2 MPa, and 4.8 MPa, respectively. Among the three, PVA showed the most significant improvement, yielding a 15.56% increase compared to the control group, followed by PAA and PEG. These differences in enhancement are primarily attributed to the varying interfacial bonding capabilities of the polymers with the cement hydration products, which influence the extent of mechanical reinforcement.
The results presented in Figure 4c indicate that the 28-day flexural strength of the control group increased to 6.2 MPa. At this curing age, the polymers continue to contribute to strength enhancement. However, the improvement in flexural strength does not increase monotonically with polymer dosage. Specifically, at a 1% addition level, the strengthening effect is minimal, while at 4%, the enhancement is lower than that observed at 3%. This behavior may be attributed to the depletion of free water in the cement matrix during the later stages of hydration. The water films adsorbed onto the surfaces of hydrophilic polymers reduce the availability of free water necessary for ongoing hydration, thereby limiting the hydration degree. Consequently, a polymer content of 3% yields the most favorable strengthening effect. At this dosage, the 28-day flexural strengths of mortars modified with PAA, PVA, and PEG were 6.8 MPa, 6.9 MPa, and 6.5 MPa, respectively. PVA continued to demonstrate the greatest enhancement, with a 9.68% increase compared to the control. The superior performance of PVA may be attributed to its ability to improve the interfacial transition zone between the cement matrix and aggregates through an anchoring effect. This interaction effectively refines porosity within the interfacial region, enhances matrix toughness, and consequently leads to improved mechanical strength.

3.3. Effect of Different Curing Ages on Compressive Strength

Compared to flexural strength, which primarily reflects the ductility of the matrix and interparticle interactions, compressive strength is more strongly influenced by the matrix porosity and the degree of cement hydration, thereby serving as an indicator of matrix compactness. The compressive strength results at different curing ages (3, 7, and 28 days) are presented in Figure 5. As shown in Figure 5a, the 3-day compressive strength of the control group was 27.1 MPa. The incorporation of polymers significantly reduced the early compressive strength, with the extent of strength loss increasing proportionally to polymer content. This observation, together with the fluidity test results (Figure 3), suggests that polymer molecules competitively adsorb water from the surface of the cement particles, impeding their interaction with water and thereby inhibiting the early hydration reaction. This finding aligns with the early-age strength reduction observed in flexural strength measurements, confirming the inhibitory effect of polymers on cement hydration at early stages. At a 4% polymer dosage, the compressive strengths of mortars modified with PAA, PVA, and PEG decreased to 24.7 MPa, 23.2 MPa, and 22.7 MPa, respectively. Among these, PEG caused the most pronounced strength reduction, which is attributed to its stronger affinity for water molecules. This higher water adsorption capacity substantially diminishes the effective hydration degree of the matrix, consistent with the notable negative impact of PEG on slurry fluidity.
The results presented in Figure 5b show that the 7-day compressive strength of the control group increased to 34.4 MPa. At this stage, low polymer dosages begin to exhibit a reinforcing effect. However, when the polymer content exceeds 2%, the compressive strength declines. Specifically, at 1% dosage, the compressive strengths of mortars modified with PAA and PVA increased to 34.8 MPa and 35.1 MPa, respectively, while PEG demonstrated its most pronounced enhancement at a 2% dosage. The strengthening mechanism at low polymer content is attributed to effective pore filling within the matrix, which improves the density and microstructural compactness [23]. Conversely, at higher dosages, the persistent inhibitory effect on hydration reduces the formation of high-strength hydration products such as CSH and ettringite, ultimately leading to diminished compressive strength.
The 28-day compressive strength results in Figure 5c reveal that the control group attained a strength of 43.8 MPa. The strength variation pattern for polymer-modified mortars at 28 days is consistent with that observed at 7 days. At a 1% polymer dosage, the compressive strengths of mortars containing PAA, PVA, and PEG increased to 44.2 MPa, 44.6 MPa, and 43.9 MPa, respectively, with PVA exhibiting the most significant enhancement. When the polymer content exceeds 2%, the compressive strength decreases across all groups, with values at 4% dosage of 41.8 MPa (PAA), 42.2 MPa (PVA), and 41.7 MPa (PEG). PEG demonstrates the most pronounced strength reduction, which may be attributed to its relatively weak bonding with the cement matrix and the tendency of PEG molecules to agglomerate at high dosages. Such agglomeration not only exacerbates competitive water adsorption, thereby further restricting hydration, but also introduces macro-scale defects at interfaces, significantly reducing the matrix density. In contrast, PVA forms a stronger bond with the matrix and effectively fills the larger pores, refining the pore structure. However, it is important to note that the polymer film formed by PVA has a lower intrinsic strength compared to the CSH gel. Under mechanical loading, excessive polymer film is susceptible to damage, which compromises the matrix structure and contributes to the observed decrease in overall compressive strength at higher polymer contents.

3.4. Compression and Flexural Ratio and Toughness Analysis

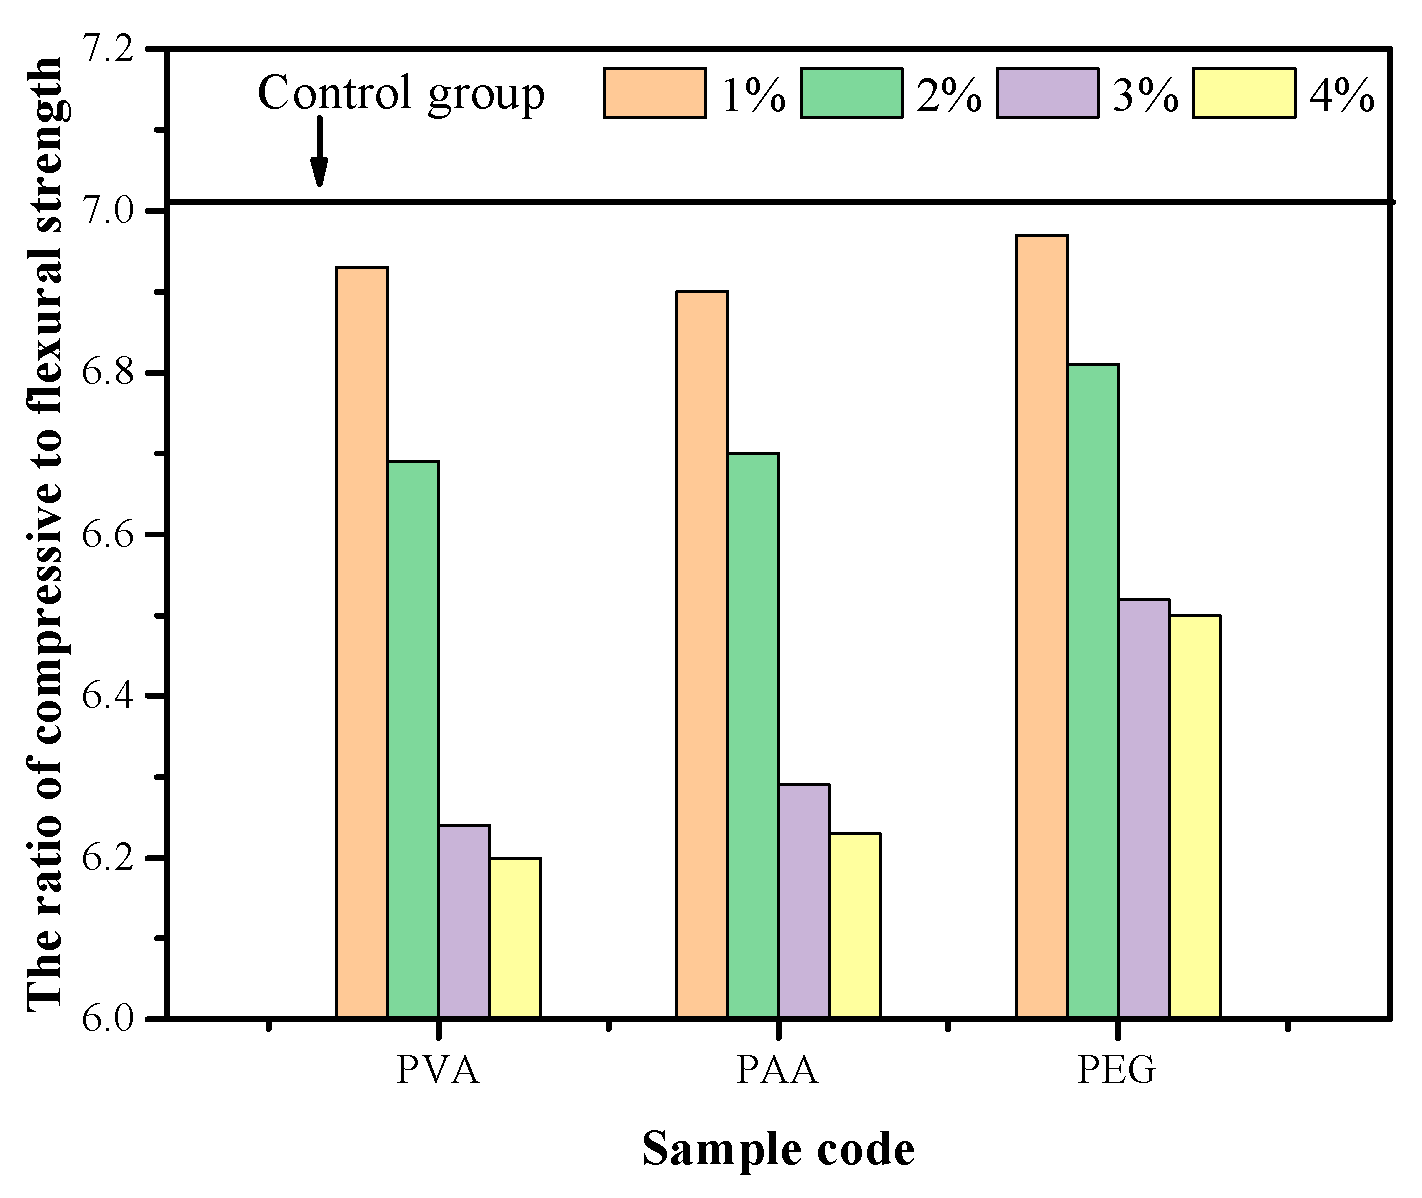
The ratio of compressive strength to flexural strength serves as an effective indicator of material toughness, with a lower ratio corresponding to improved toughness. The compressive-to-flexural strength ratios of all samples at 28 days are presented in Figure 6. The control group exhibited a ratio of 7.065. Notably, the polymer-modified mortars demonstrated a consistent decrease in this ratio with increasing polymer content. At a 4% polymer dosage, the compressive-to-flexural strength ratios for mortars modified with PAA, PVA, and PEG decreased to 6.23, 6.20, and 6.50, respectively. Among these, the PVA-modified mortar exhibited the lowest ratio, further corroborating the superior toughening effect of PVA through its effective “riveting” mechanism within the cement matrix.

3.5. Dry–Wet Cycling Resistance

Based on the flexural and compressive strength results, it is evident that a polymer dosage of 1% produces negligible enhancement in flexural strength, while a 4% dosage causes a notable reduction in compressive strength. Dosages of 2% and 3%, however, effectively improve compressive strength without inducing significant adverse effects. Therefore, polymer incorporation at 2% and 3% is considered optimal, and samples with these dosages were subsequently prepared to evaluate their resistance to dry–wet cycle corrosion.
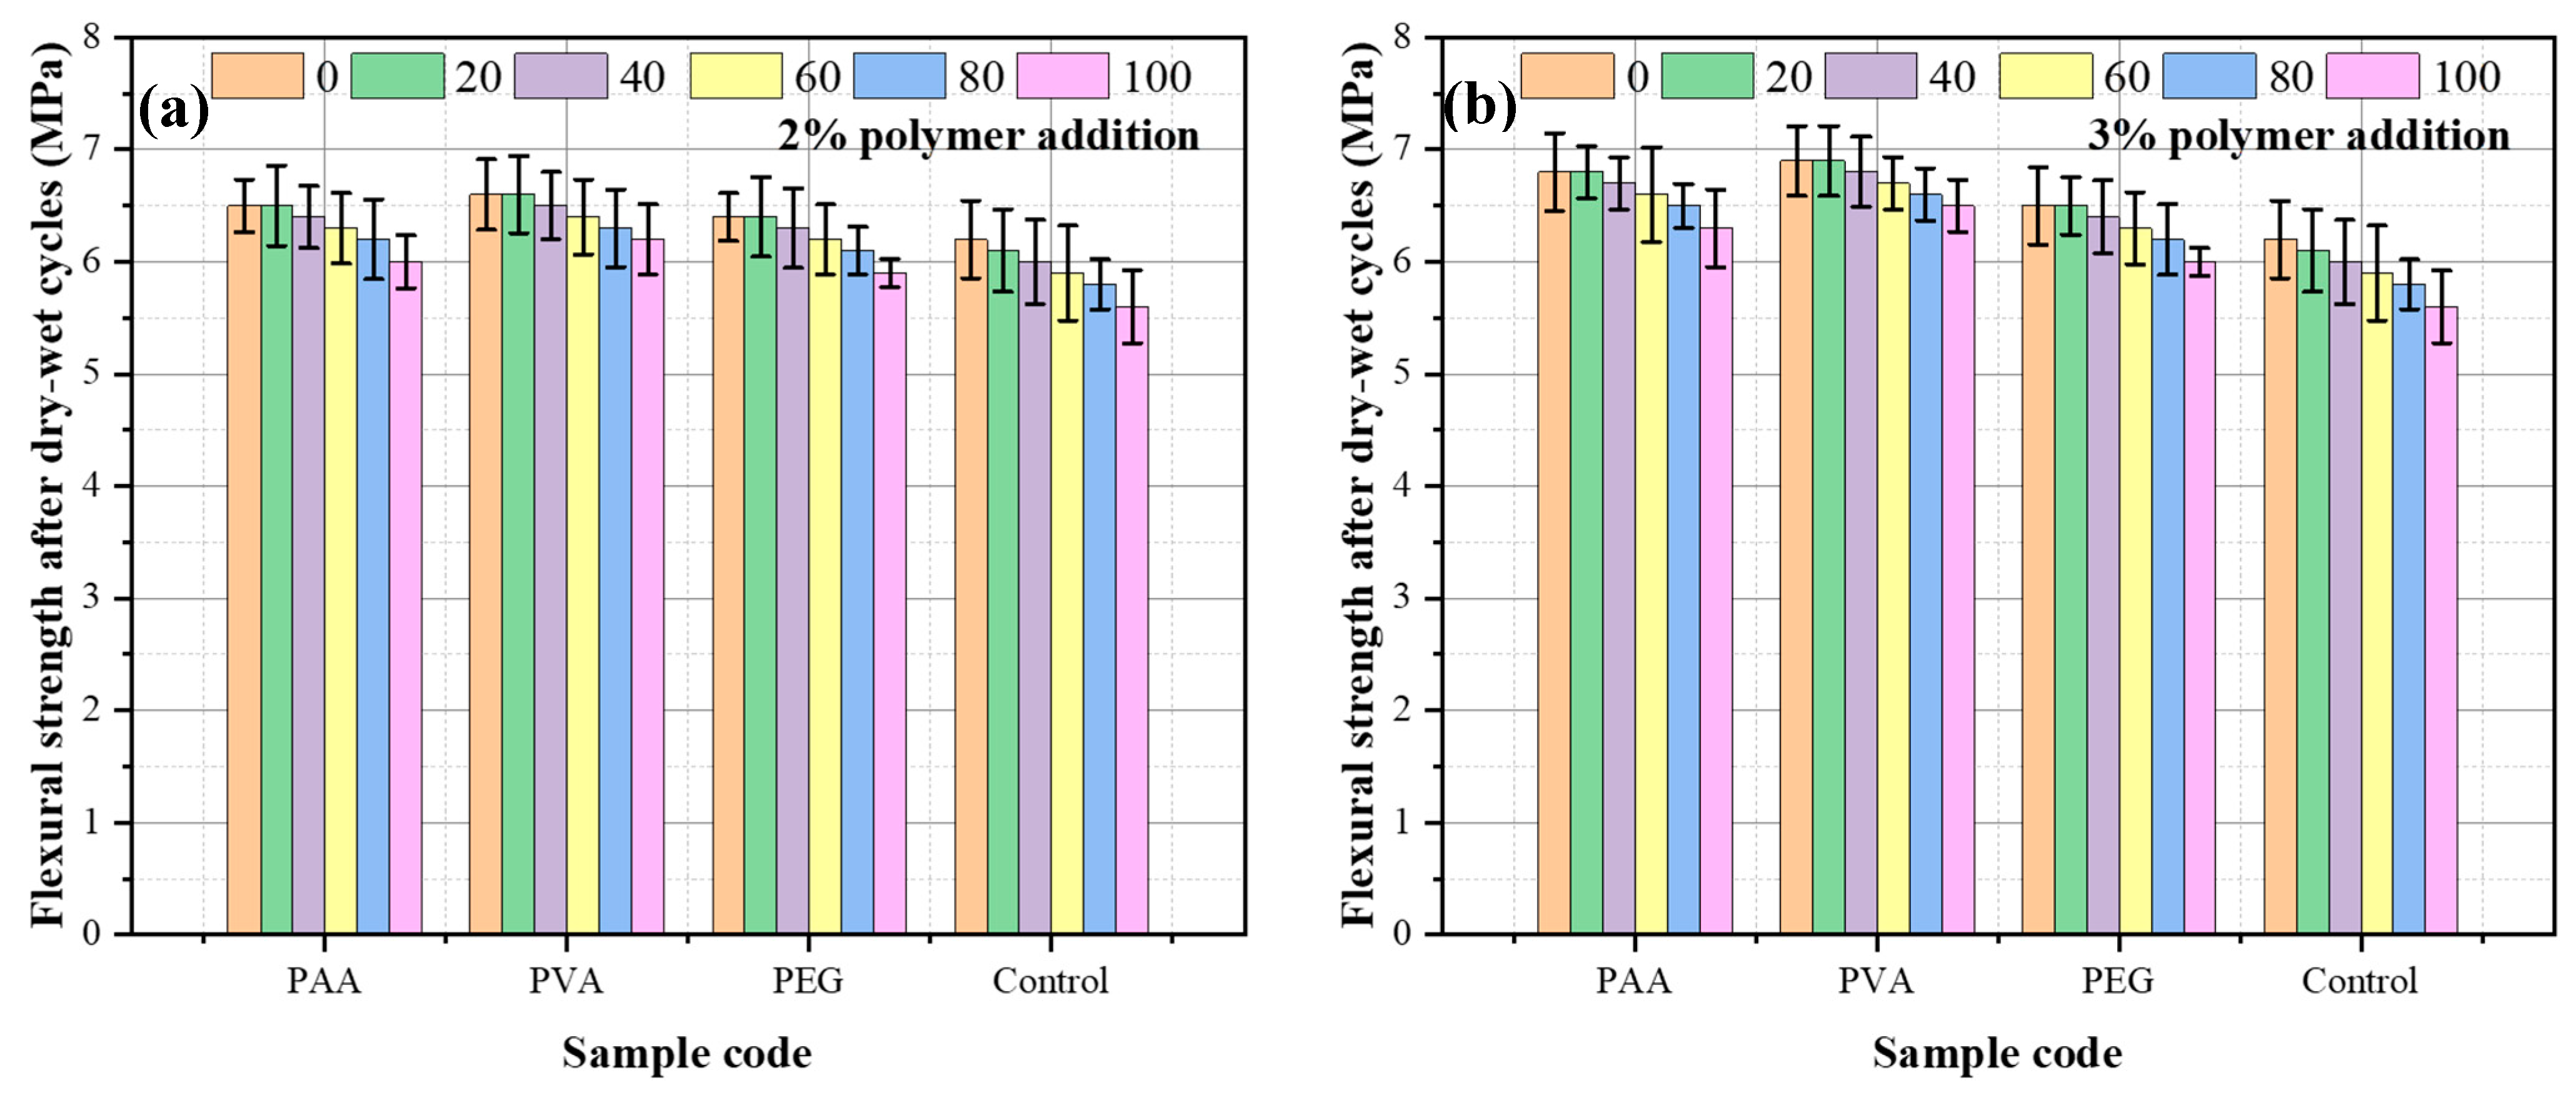
The flexural strength of samples subjected to 0–100 days of dry–wet cycling is presented in Figure 7. The control group exhibited a gradual decrease in flexural strength, declining to 6.1, 6.0, 5.9, 5.8, and 5.6 MPa after 20, 40, 60, 80, and 100 days of corrosion, corresponding to an overall reduction of 9.68%. In contrast, the flexural strength of polymer-modified mortars remained stable during the initial 20-day corrosion period, after which a gradual decline was observed with prolonged exposure. After 100 days, the flexural strength of PAA, PVA, and PEG modified mortars decreased from 6.5 MPa to 6.0 MPa, 6.6 MPa to 6.2 MPa, and 6.4 MPa to 5.9 MPa, respectively, representing reductions of 7.69%, 6.06%, and 7.81%. These results indicate that PVA exhibits the most pronounced enhancement effect on flexural strength under dry–wet cycling conditions.
The results of the sample with 3% polymer doping are shown in Figure 7b. At this time, the flexural strength of the PAA, PVA, and PEG samples fell from 6.8 MPA to 6.3 MPa, 6.9 MPa to 6.5 MPa, and 6.5 MPa to 6.0 MPa after 100 days corrosion, respectively, with a decrease of 7.35%, 5.80%, and 7.69%, respectively. Similarly, PVA samples have the strongest corrosion resistance, with the sample strength damage rate being less than 2% at 3% dosage, which shows that the bonding characteristics between the cement matrixes under high polymer dosage are better, and the substrate can more easily resist the erosion of water molecules, thereby reducing the loss of strength.
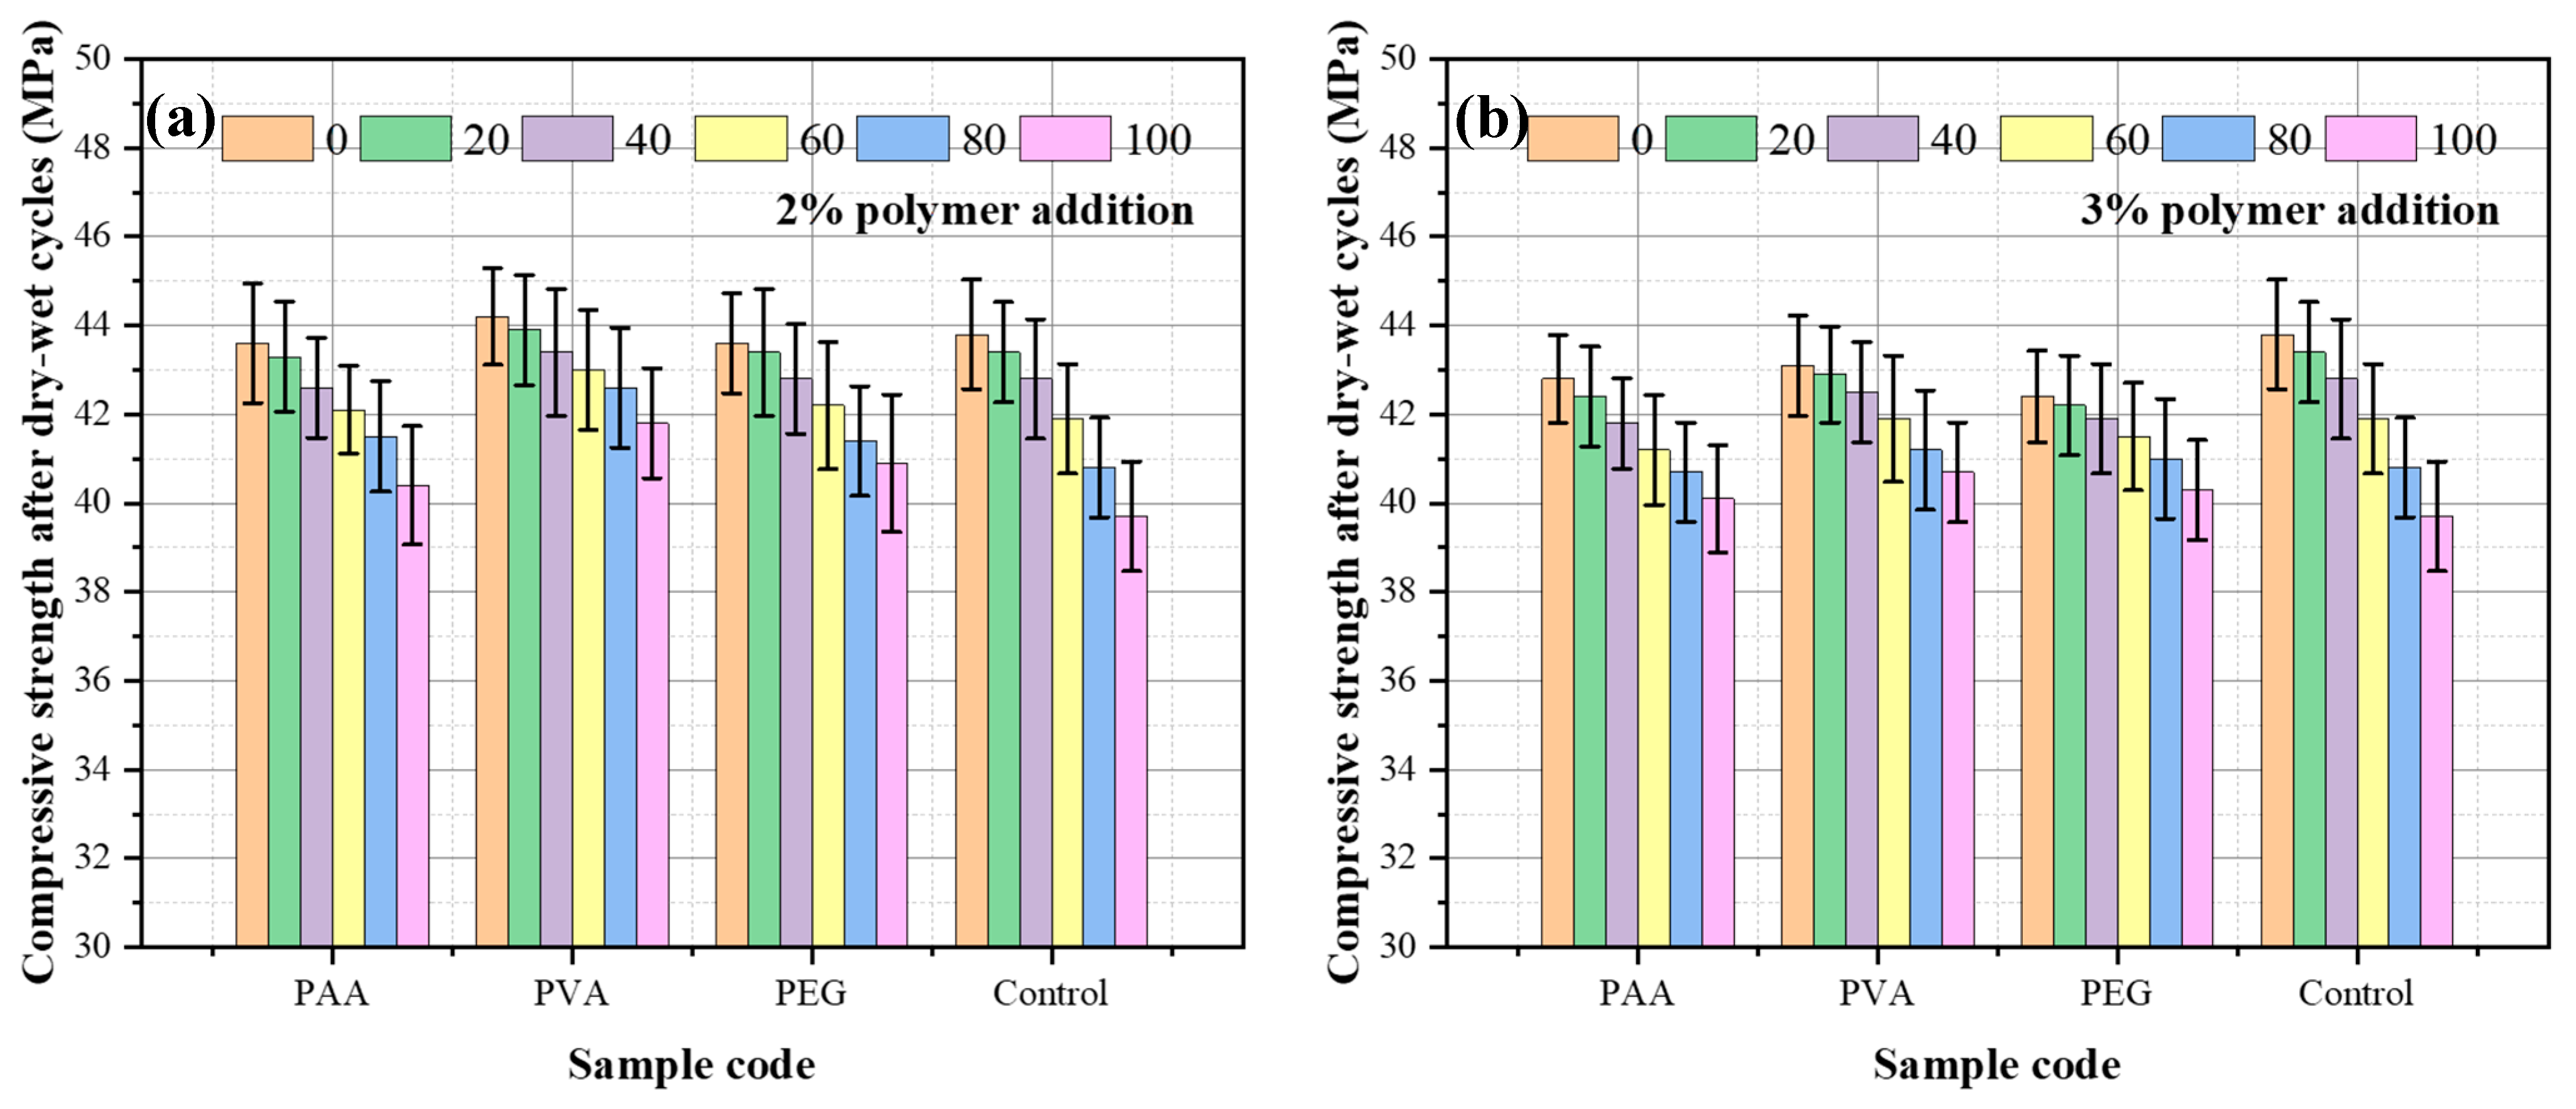
Figure 8a presents the compressive strength results of mortar specimens containing 2% polymer after exposure to dry–wet corrosion. It is evident that the compressive strength of all samples decreases progressively with increasing corrosion duration. The compressive strength of the uncorroded control sample was 43.8 MPa, which declined to 39.7 MPa after 100 days of corrosion, corresponding to a strength reduction of 9.36%. For polymer-modified samples, the compressive strength of the PAA modified mortar decreased from 43.6 MPa to 40.4 MPa, the PVA modified mortar from 44.2 MPa to 41.8 MPa, and the PEG modified mortar from 43.6 MPa to 40.9 MPa, resulting in strength reductions of 7.34%, 5.42%, and 6.16%, respectively. The compressive strength is closely related to the internal pore structure of the mortar. During corrosion, ingressing water molecules cause the dissolution of calcium from the hydrated matrix, compromising the compactness and integrity of the internal structure. The incorporation of polymers enhances the corrosion resistance through two primary mechanisms. First, polymers improve the matrix cohesion and fill larger pores, thereby restricting water ingress into the matrix interior. Second, polymers adsorb water molecules, reducing their availability to erode the hydration products. Among the polymers studied, PVA exhibits the strongest adhesive interaction with the matrix, resulting in a relatively denser microstructure. PEG demonstrates the most significant effect on fluidity and has a higher water adsorption capacity than PAA, enabling it to bind more water molecules at its surface, thereby mitigating the water matrix interactions and enhancing the corrosion resistance relative to PAA.
Figure 8 illustrates the compressive strength of mortars containing 3% polymer after corrosion. After 100 days of dry–wet cycling, the compressive strengths of mortars modified with PAA, PVA, and PEG decreased by 6.31%, 5.57%, and 5.90%, respectively. This trend is consistent with that observed for 2% polymer-modified mortars, confirming the performance ranking: PVA > PEG > PAA.

3.6. Microstructure of Hydration Products

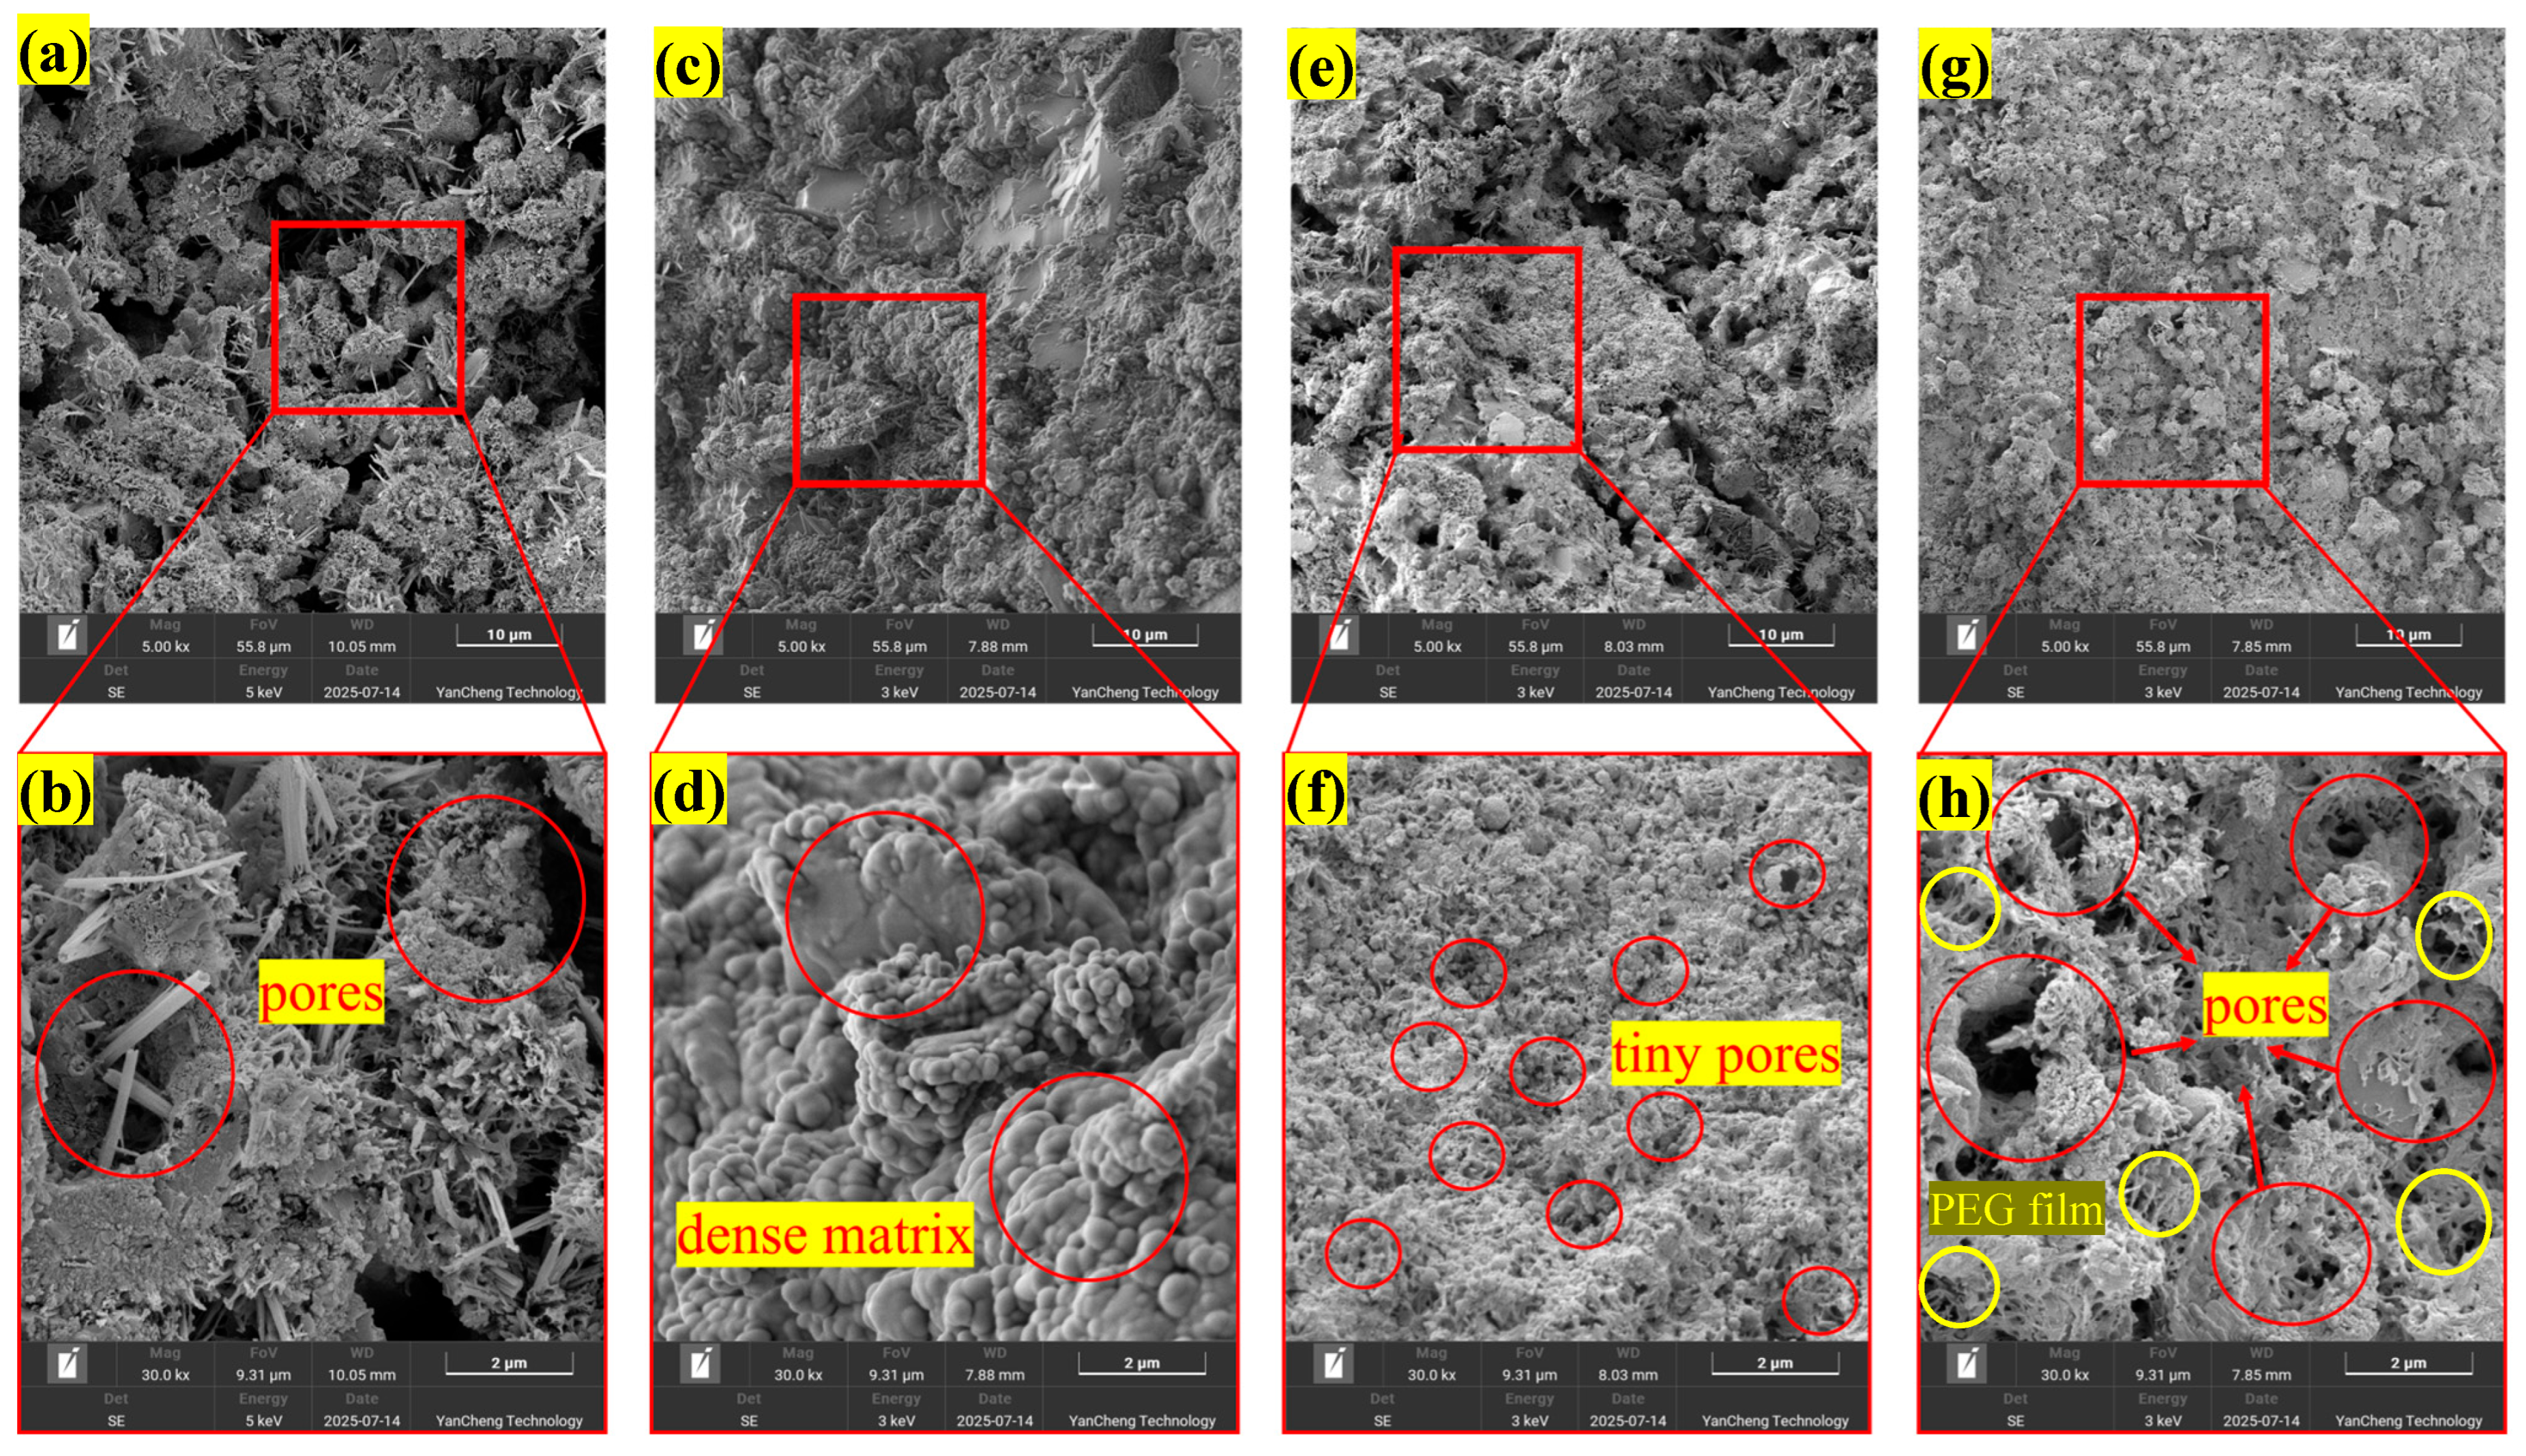
The incorporation of polymers into cementitious materials leads to the formation of polymer films on the surface of the hydration matrix, influencing both the hydration process and the evolution of the cement’s pore structure. The microstructural characteristics of the matrix are depicted in Figure 9.
Figure 9a,b illustrate the morphology of the control sample without polymer addition, revealing numerous pores within the matrix, along with distinct ettringite and reticular CSH distributions. In contrast, Figure 9c,d demonstrate that mortar samples incorporating PVA exhibit a significant reduction in macropores, a more compact structure of hydration products, and an absence of ettringite. This phenomenon is attributed to the coating effect of the PVA film on hydrated particles, which inhibits the formation of certain hydration products while effectively filling the pore structure [24].
For PAA (Figure 9e,f) and PEG (Figure 9g,h), the micro-morphology indicates that both polymers can bind with the hydration products. However, the degree of cementation and densification in matrices modified with PAA and PEG is lower than that observed with PVA. Notably, in PEG samples, ettringite and reticular CSH structures similar to those in the control group are present, suggesting that PEG exhibits the weakest bonding performance with hydrated particles and the least overall influence on the hydration reaction. Nevertheless, reticular polymer films distributed within the pores of the PEG matrix enhance the interactions between the matrix particles, thereby improving the flexural strength and toughness of the matrix.
In summary, the micro-morphology results confirm the role of polymers in cementing the matrix, regulating the hydration process, and refining the pore structure. These findings align with the observed influence of polymers on macro-mechanical properties, indicating that the bonding effects of the three polymers follow the order of PVA > PAA > PEG.

4. Molecular Dynamics Simulations

In this paper, three kinds of polymers were used as binders to enhance the properties of cement-based materials. The interfacial bonding behavior between the polymers and the cement matrix has a significant effect on their enhancement effect. Meanwhile, the interaction between these hydrophilic polymers and water molecules will also affect the durability of the cement-based materials. Therefore, it is very important to analyze the adsorption behavior of polymers in the cement matrix and water environment to clarify the mechanism of their reinforcement. This study explored the interface properties at nanometer scale by the molecular dynamics simulation method.

4.1. Simulation Details

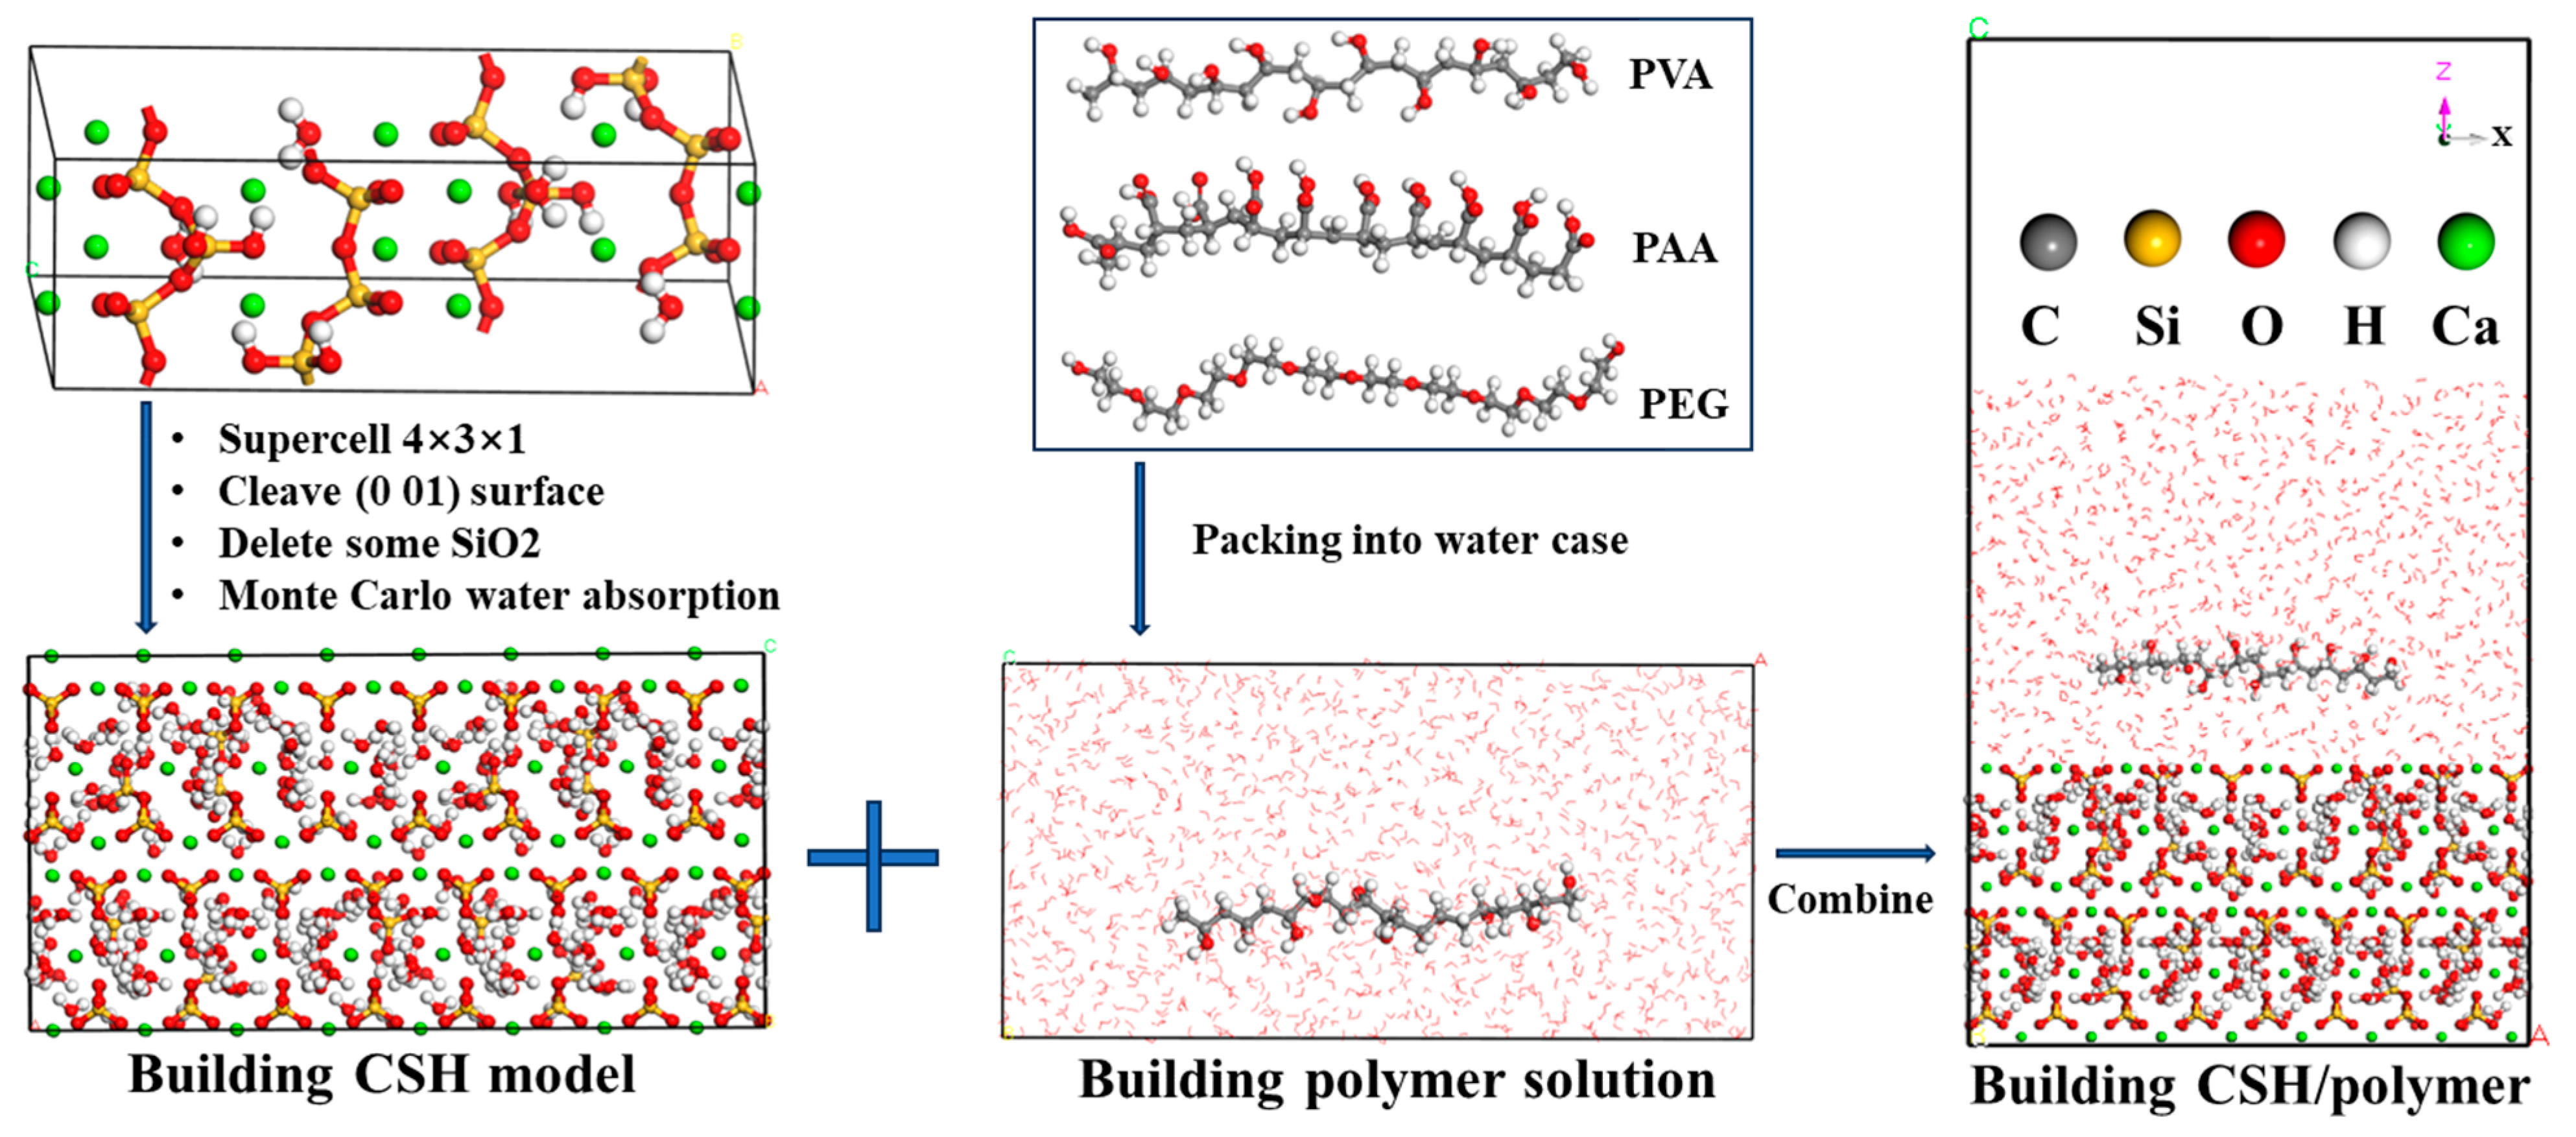
The 11 Å tobermorite crystal was used as the calculation model of CSH. The modeling process was based on the method of Wang et al. [37] and the Ca/Si ratio of the CSH model was 1.67, and its unit cell parameters were a = 44.634 Å, b = 22.170 Å, c = 22.779 Å. Three polymers with a degree of polymerization of 10 were selected for simulation. At this time, the polymer chain length was about 30 Å, and a relatively flat spread distribution could be achieved on the surface of the CSH. The detailed modeling process of the CSH, polymer chain, and aqueous solution are shown in Figure 10. After the model was constructed, the system was minimized using LAMMPS-2020 to eliminate unreasonable conformations and local stresses. Subsequently, the relaxed model was simulated in the NVT ensemble at 298 K temperature with a time step of 1 fs and a total time of 3000 ps under the ClayFF force field [37], which is used to obtain a balanced configuration and perform subsequent analysis.

4.2. Interfacial Properties of CSH/Polymers

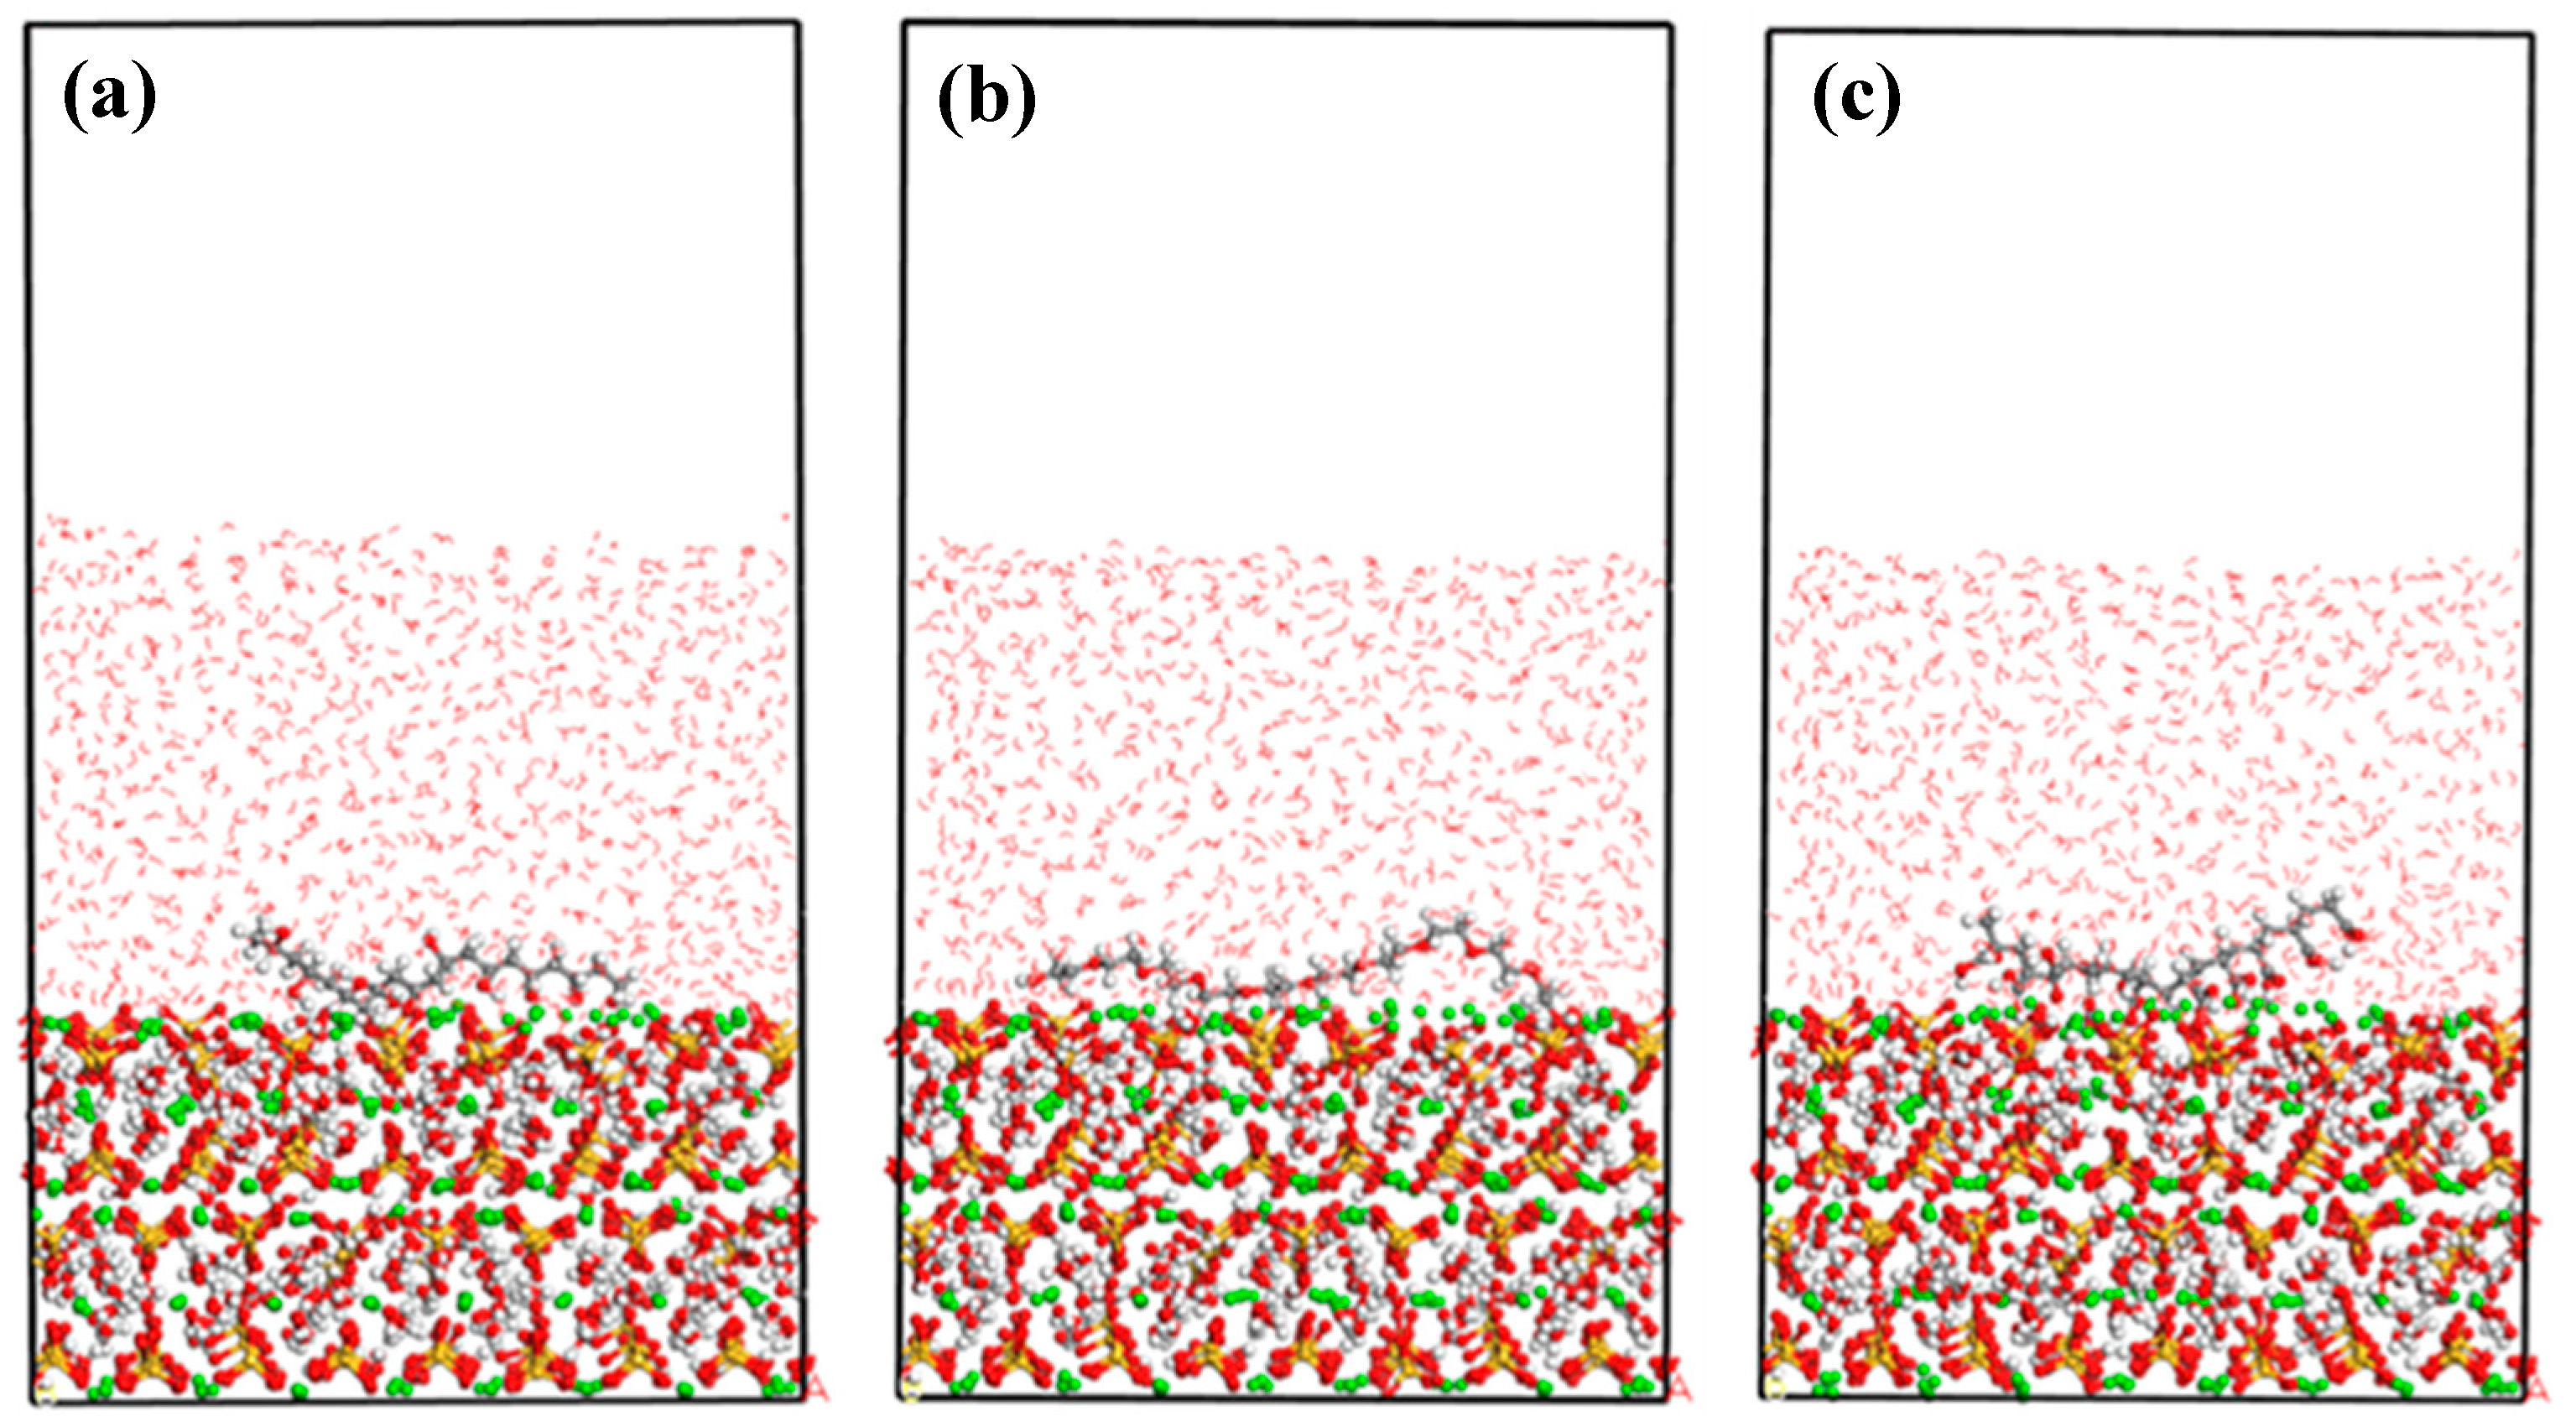
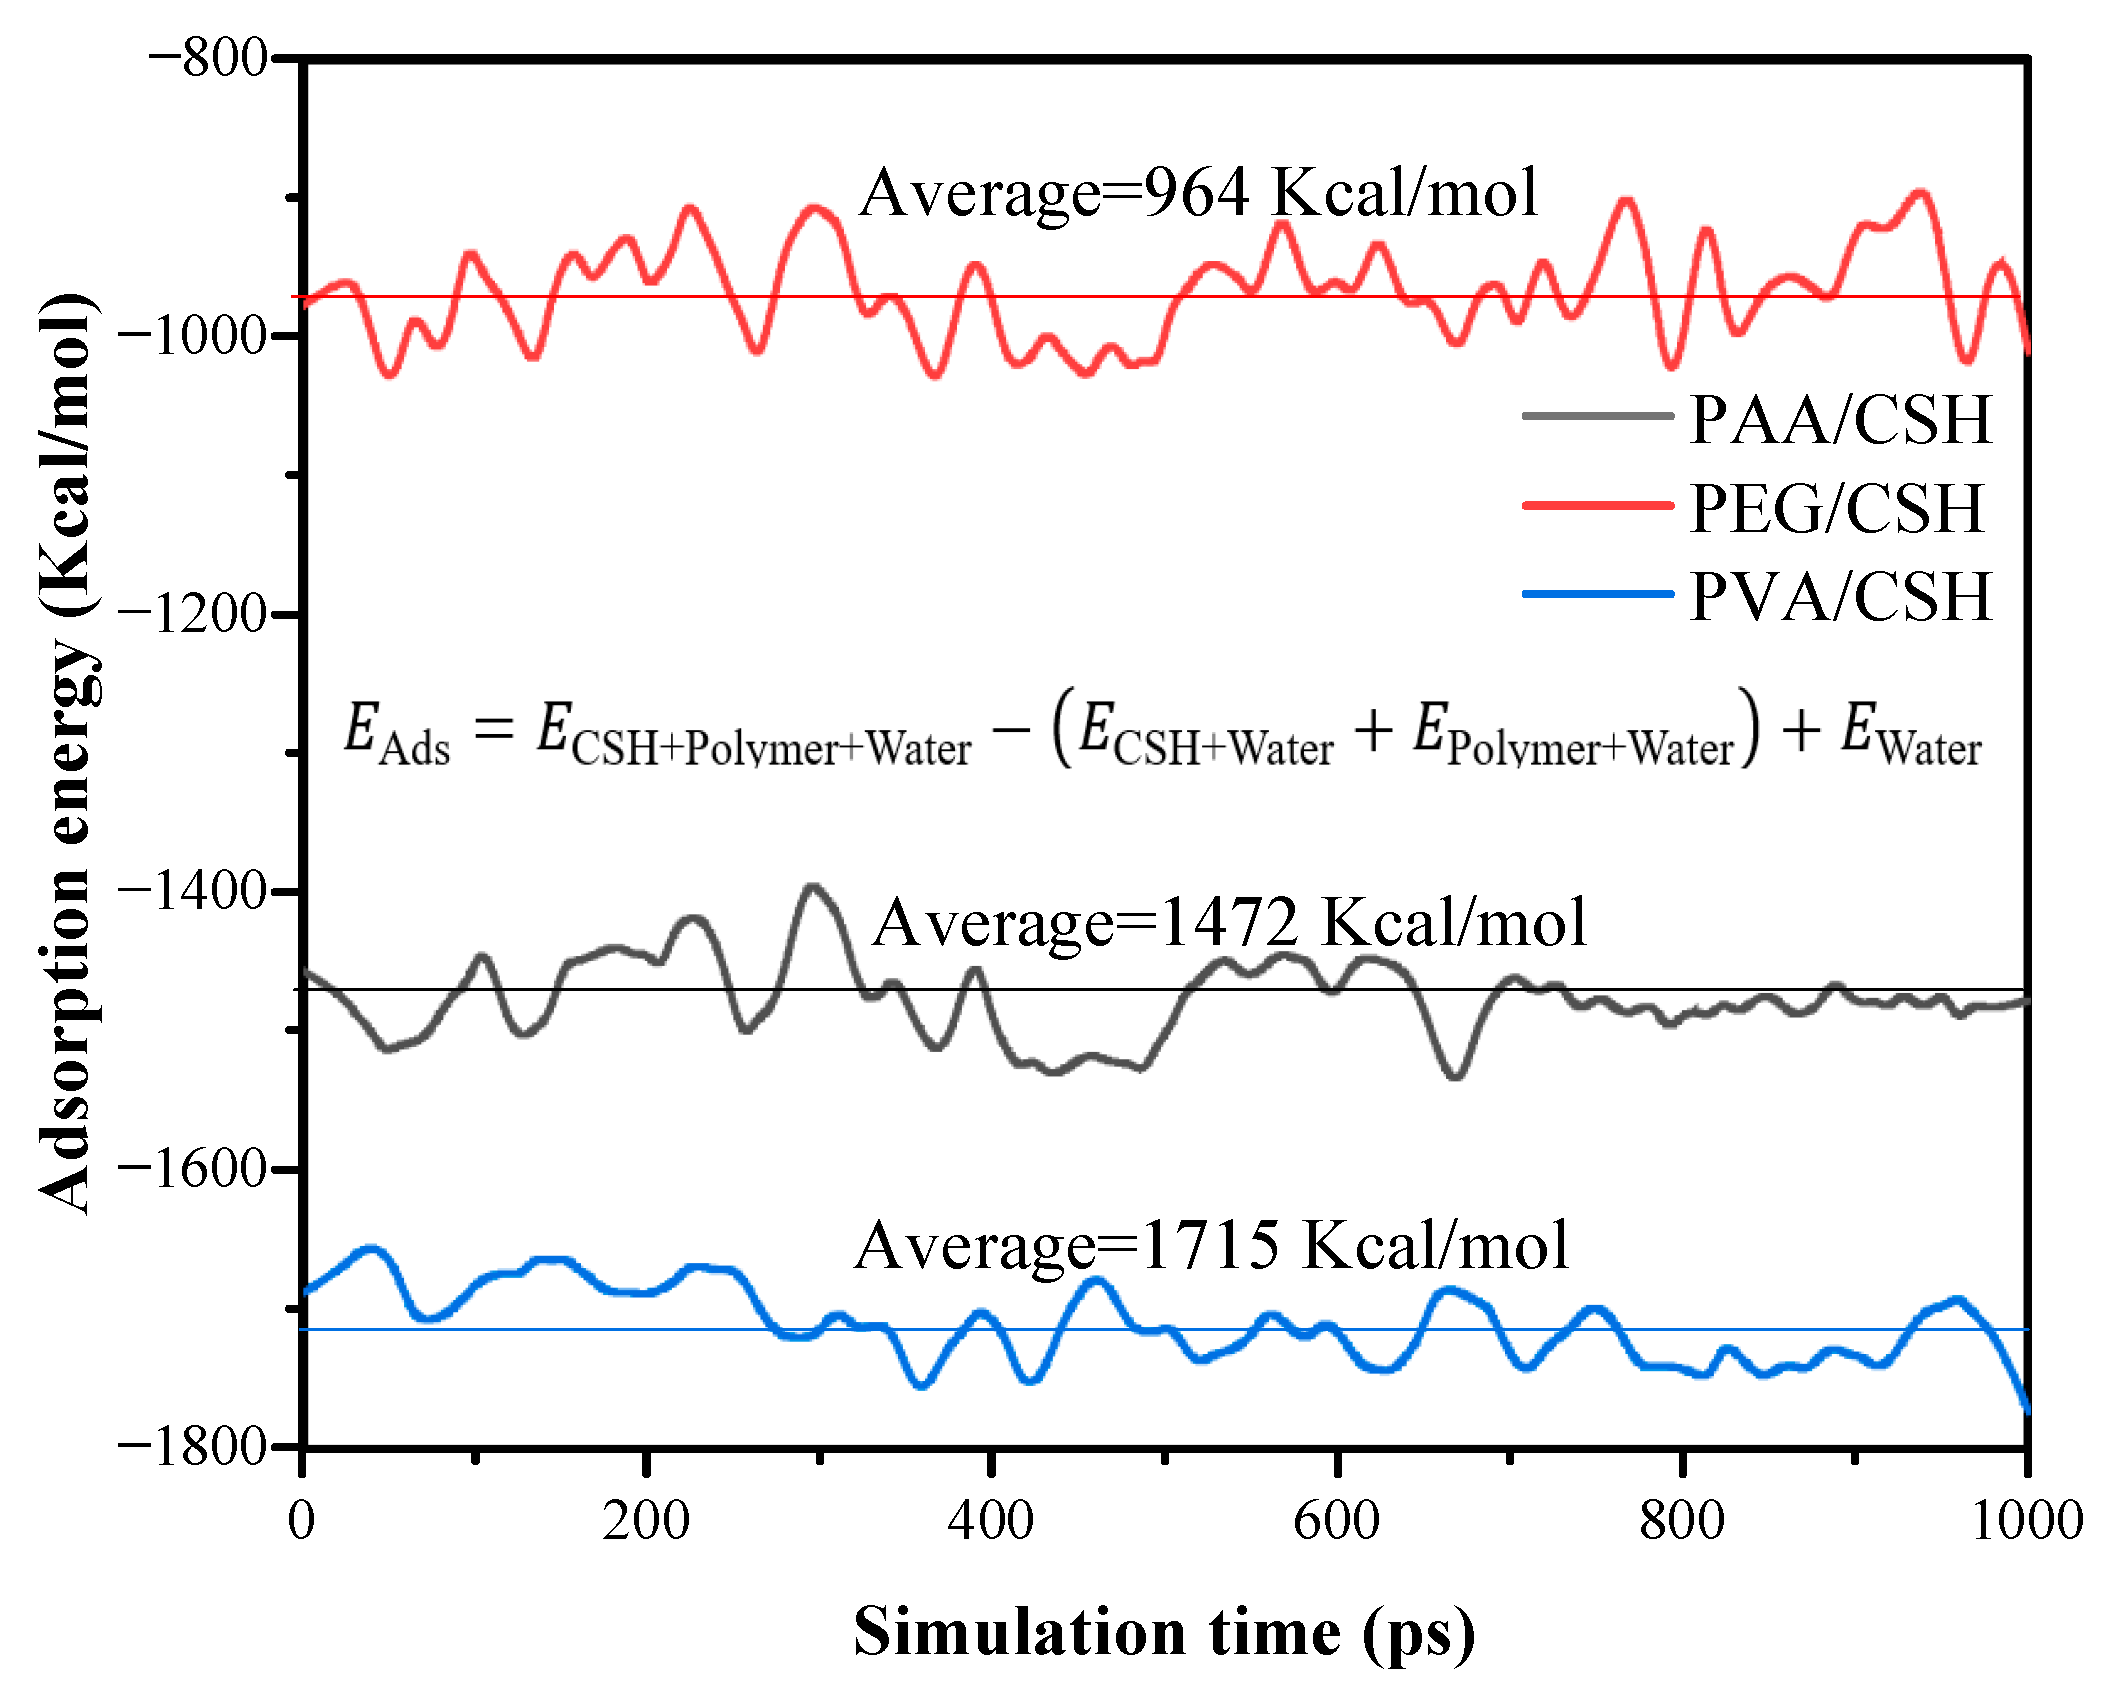
The conformations of the three polymers after adsorption with CSH are shown in Figure 11. All three polymers are close to the interface of CSH, indicating that they have good adsorption properties. Adsorption energy is a direct parameter to characterize the interfacial strength. The results of adsorption energy between polymer and CSH are shown in Figure 12. The adsorption energies of PAA, PVA, and PEG with CSH are −1472, −1715, and −964 kcal/mol, respectively. This means that PVA/CSH has the strongest adsorption, followed by PAA and PEG. The test results of the flexural strength are consistent with this, showing that the order of flexural strength enhancement effect of the three polymers is PVA > PAA > PEG. The strongest bonding and riveting effect of the PVA binder increases the interaction between the matrixes and benefits the flexural strength.
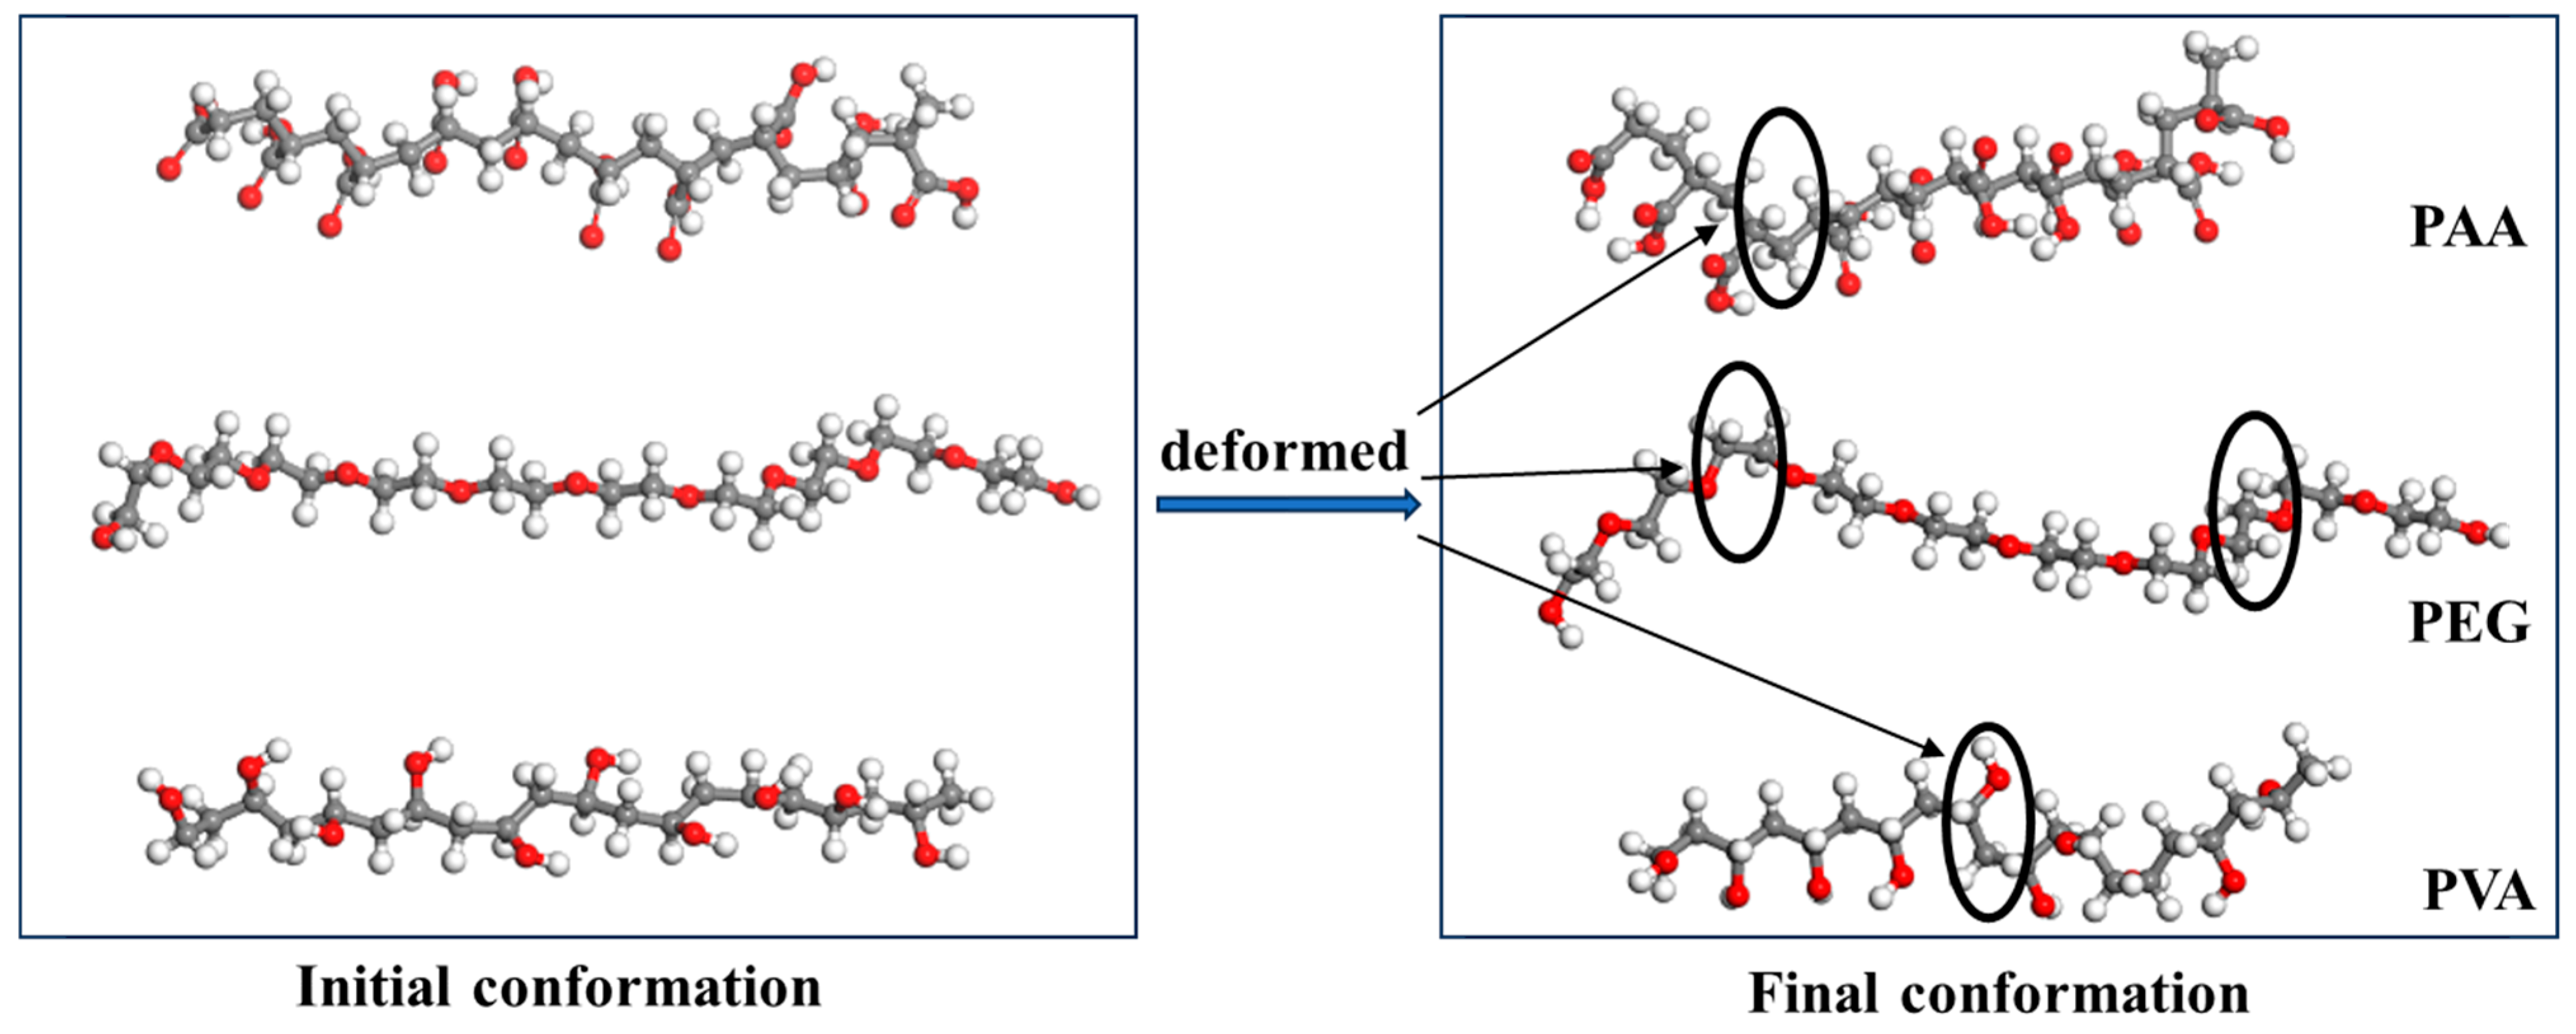
Interactions between the hydrophilic groups on the polymer surfaces lead to conformation of the chains when the polymers are adsorbed onto the CSH surfaces. The stronger the adsorption between the substrate and polymer, the weaker the interaction within the polymer chains. Therefore, the contact area between polymer and substrate can also reflect the interfacial strength [38]. Figure 13 shows the morphology of the three polymers before and after adsorption. It can be seen from the figure that all three polymers undergo different degrees of curling after adsorption. There is one conformation transition site for PAA and PVA, and two deformation sites for the PEG chain. Obviously, the PEG chain has the largest deformation, which further confirms that the adsorption between the PEG/CSH interface is not as strong as that for PVA and PAA.
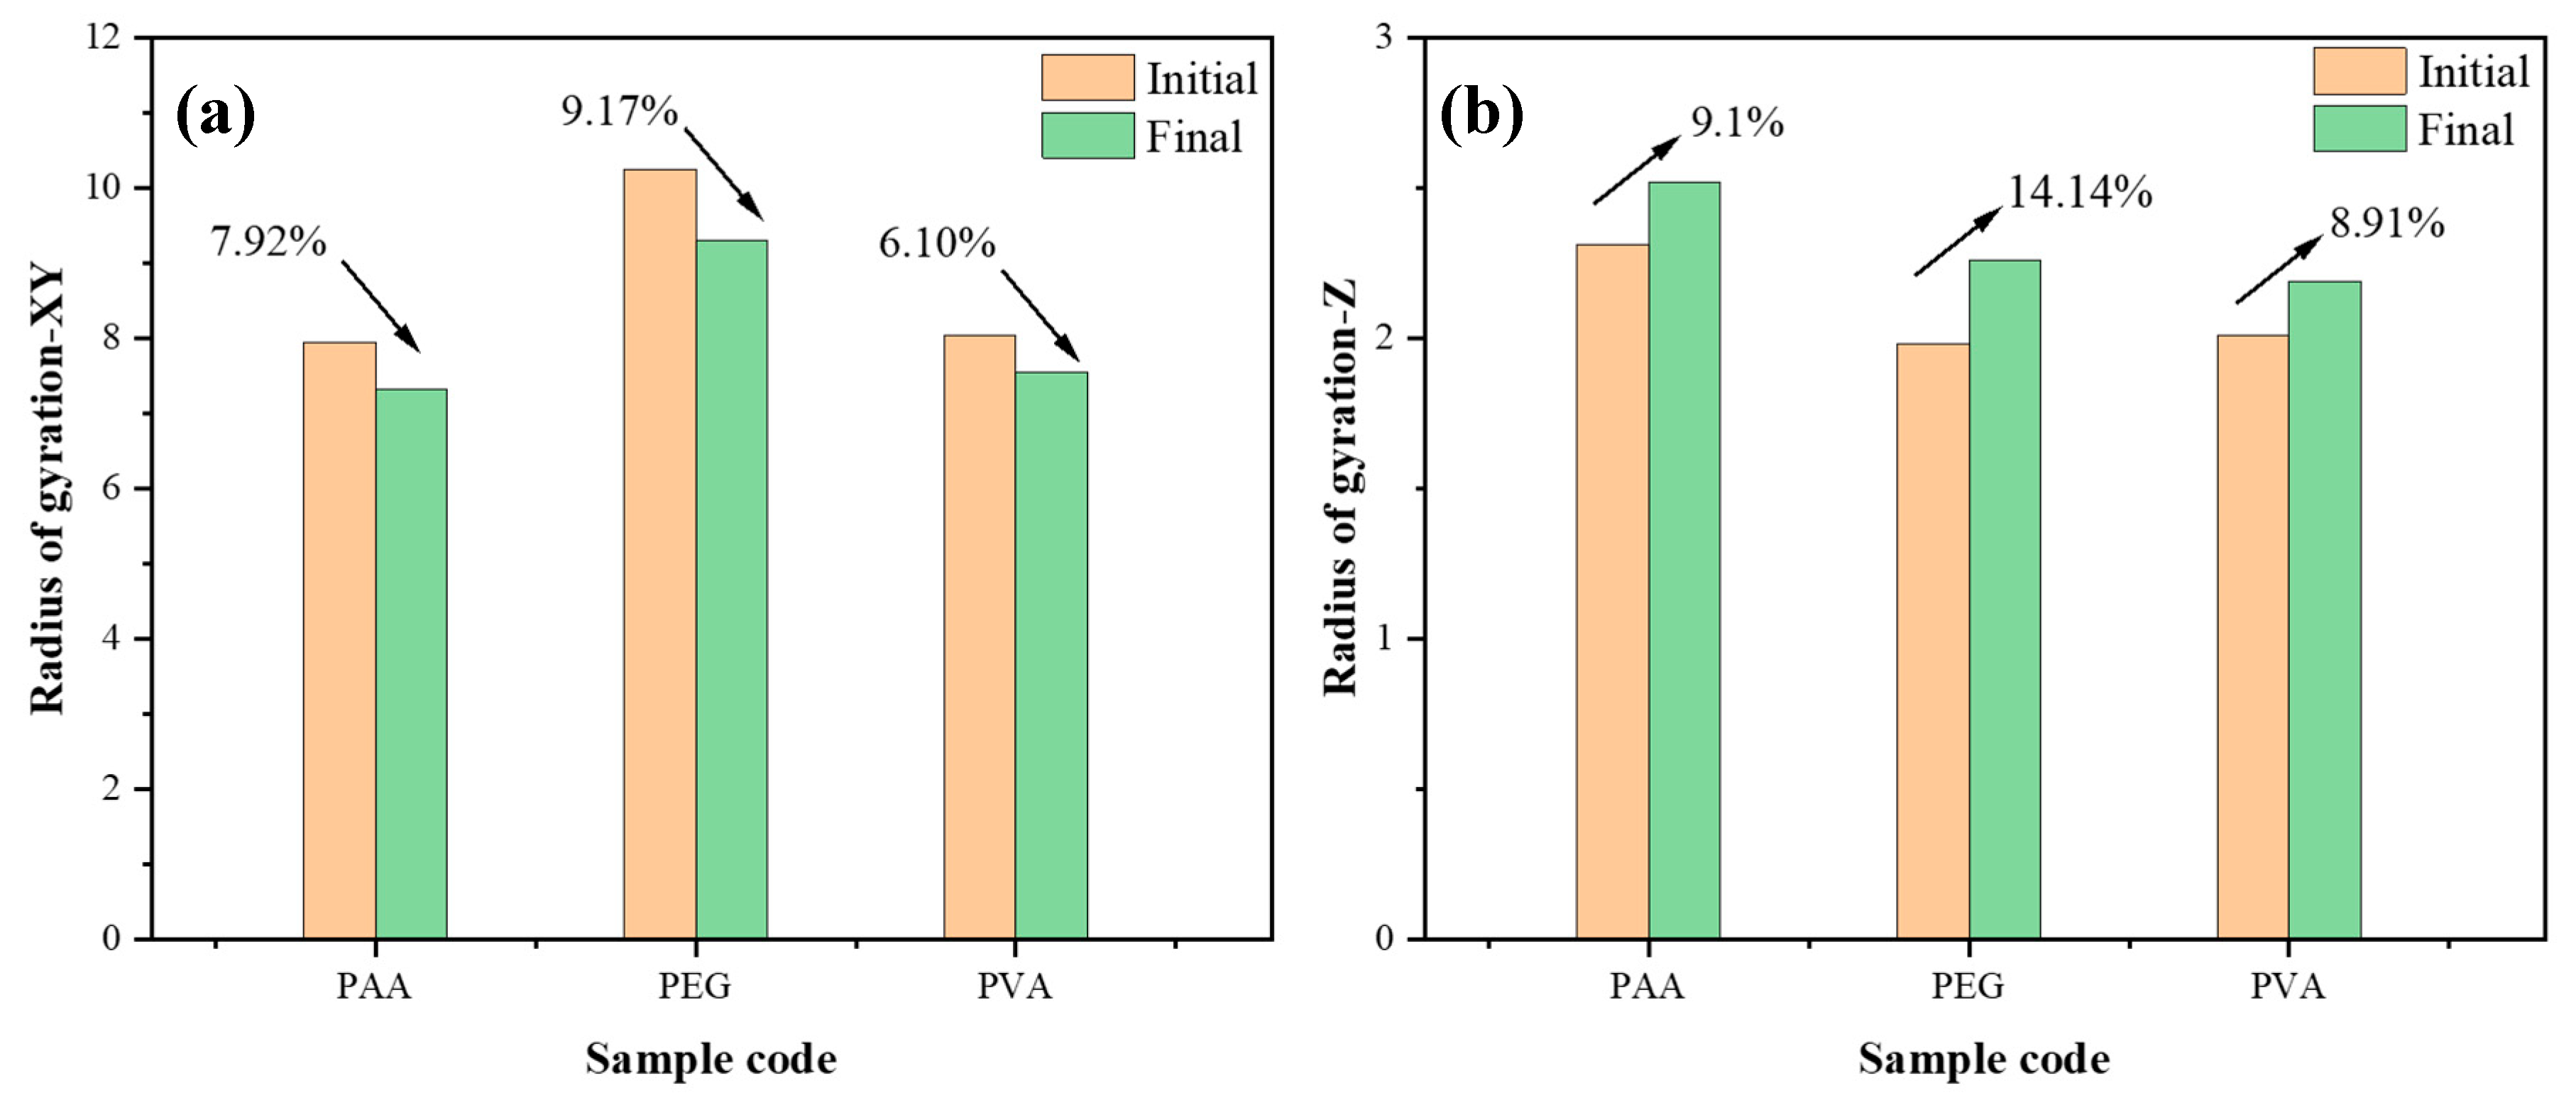
The size of the molecular chain can be characterized by the radius of gyration [39,40]. In view of the differences in the initial lengths of the three polymer chains, it is not relevant to directly compare the radius of gyration. In this study, the degree of conformational bending of polymer was characterized by analyzing the change rate of the radius of gyration before and after adsorption, and the results are shown in Figure 14. Among them, Figure 14a shows the XY-dimensional changes of polymers in the direction parallel to the adsorption surface, indicating that the sizes of the three polymers all decrease in this direction. Figure 14b shows that the Z-dimensional size of the polymer increases in the direction perpendicular to the adsorption surface. This phenomenon stems from the curled-up behavior of the polymer chains, which leads them to occupy more space in the vertical direction and reduce the ductility in the horizontal direction. PVA has the smallest size change, followed by PAA, and PEG has the most significant. The change rate of polymer size in the vertical direction is generally greater than that in the horizontal direction, which is due to the fact that the vertical size represents the thickness of the molecular chain. Compared with the chain length, the molecular chain thickness is smaller, so the vertical dimension is more sensitive to conformational changes.
The dynamic behavior of the polymers during adsorption to the CSH surface can be characterized by the mean square displacement (MSD), and the results are shown in Figure 15. As shown in the figure, the MSD values of the polymer in the X and Y directions are lower than those in the Z direction. This is because the Z direction is the adsorption direction, the motion of the molecular chain along the Z direction is more active, and the deformation of the polymer in this plane is more significant. This result further verifies the phenomenon that the polymer deformation in the vertical direction is more important than the horizontal direction. In addition, the MSD value of the PVA molecules is lower than that of PAA and PEG, indicating that CSH has the strongest adsorption effect on PVA, limiting the amplitude of motion of its atoms during adsorption. On the contrary, the adsorption of the PEG/CSH interface is weakest, resulting in greater atomic motion during the adsorption process.
The radial distribution function (RDF) can analyze the coordination between the three polymers and the CSH interface. As shown in the Figure 16, all three polymers can be bound to the CSH interface through Ca-O and the hydrogen bond. Interface hydrogen bonds mainly appear in three forms: the oxygen atoms of the silicon oxygen tetrahedron in CSH (Os) and the oxygen atoms of Monte Carlo adsorbing water molecules in CSH (Ow) can form hydrogen bonds with hydrogen atoms in the polymer; at the same time, the hydrogen atoms of Monte Carlo adsorbing water molecules in CSH (Hw) can also form hydrogen bonds with oxygen atoms in the polymer. Figure 16a presents the RDF results at the PVA/CSH interface; a Ca-O coordination peak with a peak of 13.1 was observed at 2.2 Å of X-axis. The RDF curve of PAA/CSH in Figure 16b also shows a Ca-O coordination peak with a peak of 10.9 at 2.2 Å. Moreover, the intensity of Ca-O is larger than the H-O interaction. This indicates that for PVA and PAA, the interfacial adsorption intensity mainly stems from the Ca-O bonding. However, the RDF results of the PEG/CSH interface in Figure 16c show that there is only a weaker Ca-O coordination peak at the value of 3.9, indicating that adsorption at this interface is dominated by hydrogen bonds. Since the stability of the hydrogen bonding is lower than the Ca-O bond, the resulting adsorption energy of PEG/CSH is significantly lower than that of the PVA and PAA systems. RDF analysis revealed that oxygen atoms in PEG molecules have weak adsorption capacity to calcium ions and tend to form hydrogen bonds, while oxygen atoms in the hydroxyl group (-OH) of PVA and the carboxyl group (-COOH) of PAA show strong calcium ion adsorption ability, thus forming a bridge between CSH and polymer [41]. This prompts tight adsorption of the PVA/CSH and PAA/CSH interfaces, which gives PVA and PAA a better bonding effect on the cement matrix and a more significant improvement in mechanical properties.

4.3. The Simulation of Polymers/Water

Hydrophilic polymers can not only be used as binders, but also bind water molecules to the surface of molecular chains through hydrogen bonding, thus inhibiting the infiltration of water into the hydration matrix. Since the diffusion of water molecules is the key process to drive ion migration [42], weakening the interaction between matrix and water molecules can effectively improve the impermeability and ion erosion resistance of mortar.
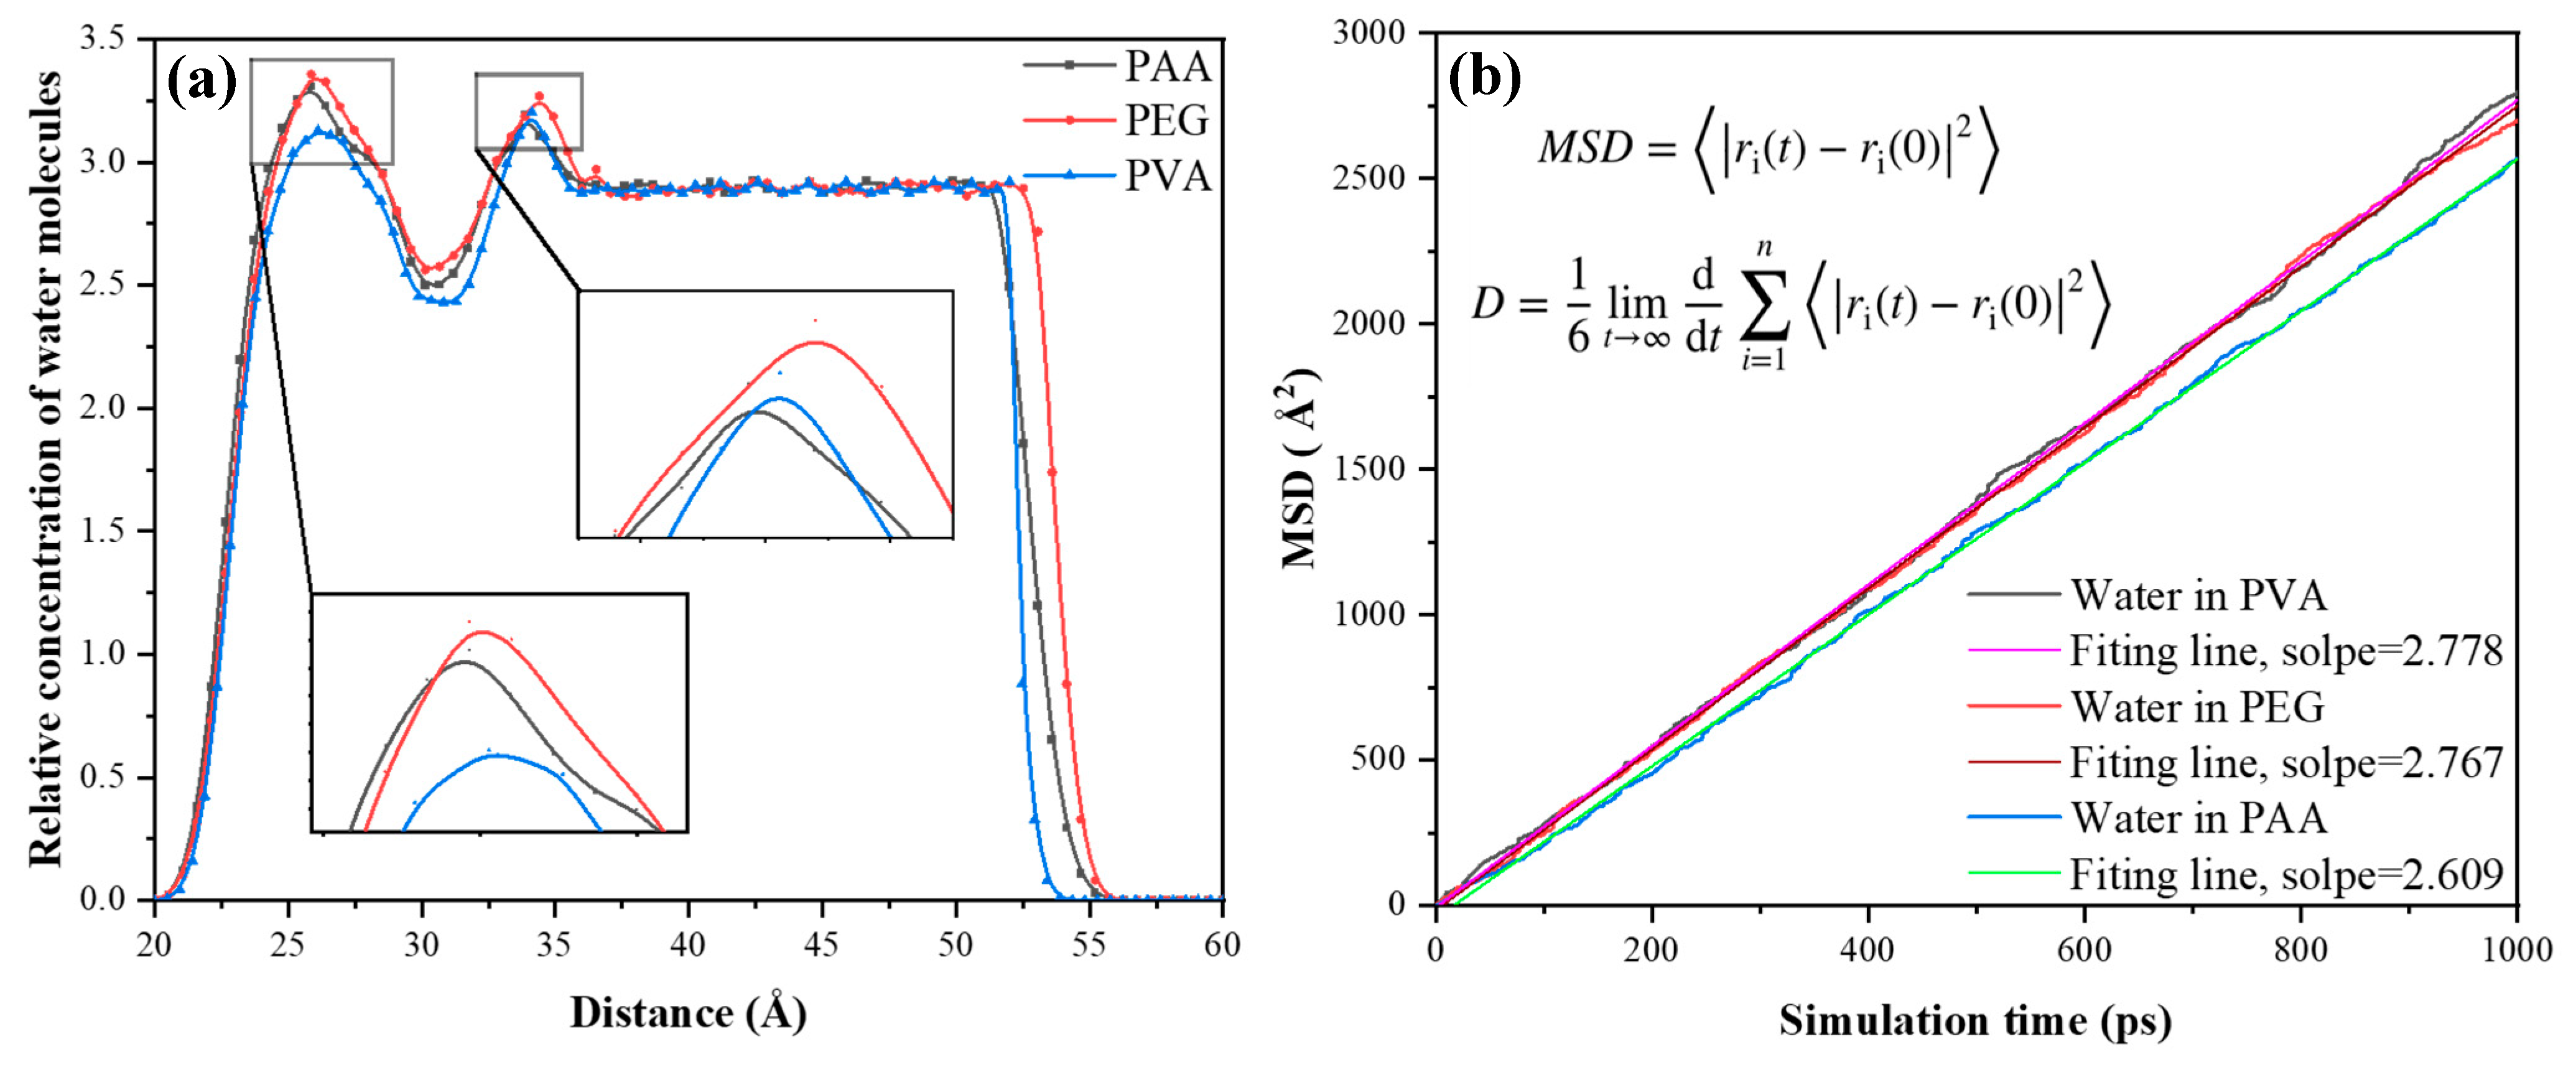
Figure 17a shows the atomic distribution of water molecules along the Z-axis of the CSH. Its distribution curve presents two main peaks. The first main peak comes from the strong hydrophilicity of the CSH surface to adsorb water molecules. The formation of the second main peak is attributed to the water molecules adsorbed by the polymer. It is worth noting that PVA has the lowest water molecule intensity at the first main peak, which indicates that its coating has an excellent isolation effect on the matrix. The results further confirm that the PVA/CSH interface has the strongest adsorption and the densest surface coverage. In contrast, the adhesion between PEG and CSH is the weakest, and its flexible molecular chain is easily deformed during adsorption, which makes the water molecules more inclined to adsorb to the surface of the CSH. The intensity of the second main peak can reflect the water absorption capacity of the polymer. The second main peak of the PEG curve is the most significant, indicating that PEG has a strong capacity for water adsorption. This is consistent with the previous RDF analysis results in that the oxygen atoms in PEG have a weak adsorption capacity for calcium ions and are more likely to form hydrogen bonds. However, the PAA surface adsorbs the least water, which indicates that PAA has the weakest water absorption capacity.
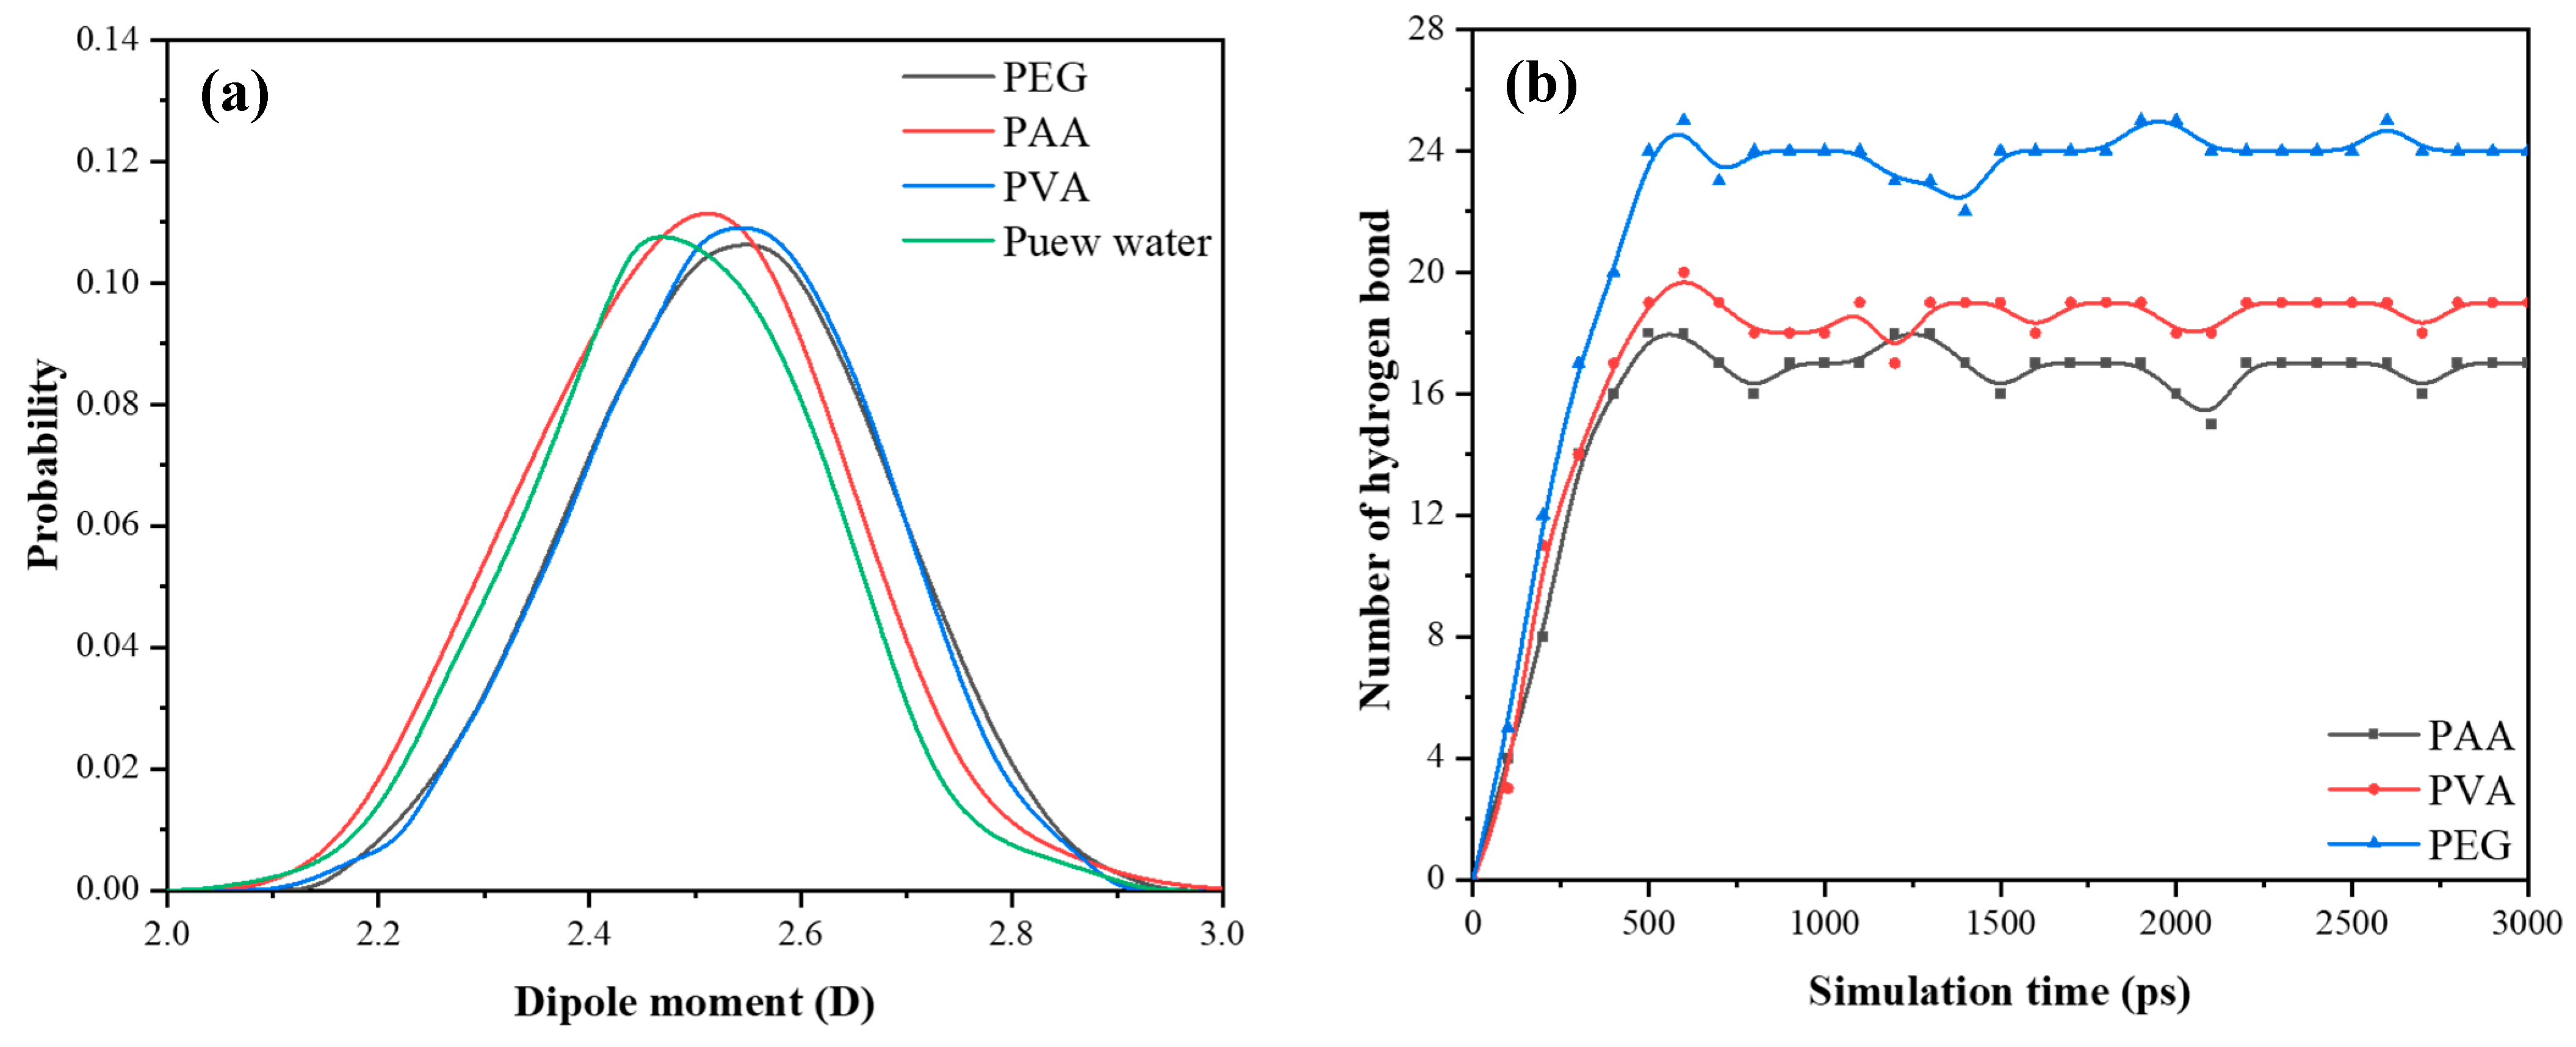
The movement behavior of water molecules during the adsorption process is shown in Figure 17b. Among them, the MSD value of water molecules in the PEG system is the smallest, while being the largest in the PAA system. The migration of water molecules is significantly affected by the adsorption characteristics of the matrix and polymer. MSD results show that PEG has the strongest restriction effect on water molecules, while PAA has the weakest effect. The hydrophilicity of the polymer directly affects its ion exchange efficiency with water molecules, thereby changing the polarity of the aqueous solution. The polarity of water molecules can be characterized by the dipole moments [43]. The dipole moment distribution of water molecules in different systems is shown in Figure 18a. The dipole moment of free water solution (without polymer) was 2.47 D, after the polymer was added, and the dipole moments in the PAA, PVA, and PEG systems were 2.50 D, 2.54 D, and 2.55 D, respectively. The larger the dipole moment the higher the polarity of the water molecule, and the stronger the hydrophilicity of the polymer. Therefore, the hydrophilicity of the three polymers is as follows: PEG > PVA > PAA.
The hydrophilicity of polymers determines the number of hydrogen bonds formed between them and water molecules. The results of the hydrogen bonds are shown in Figure 18b. It is known that PEG chains can form 24 hydrogen bonds with water molecules on average, while PVA and PAA form 19 and 17 hydrogen bonds, respectively. This indicates that PEG has a better water adsorption capacity than PVA and PAA. Although PEG has poor adhesion to the matrix, it has strong water absorption, which can enrich more water molecules on its surface and reduce the driving force of water transmission to the matrix, this makes PEG mortar better than PAA in the dry–wet cyclic corrosion resistance.
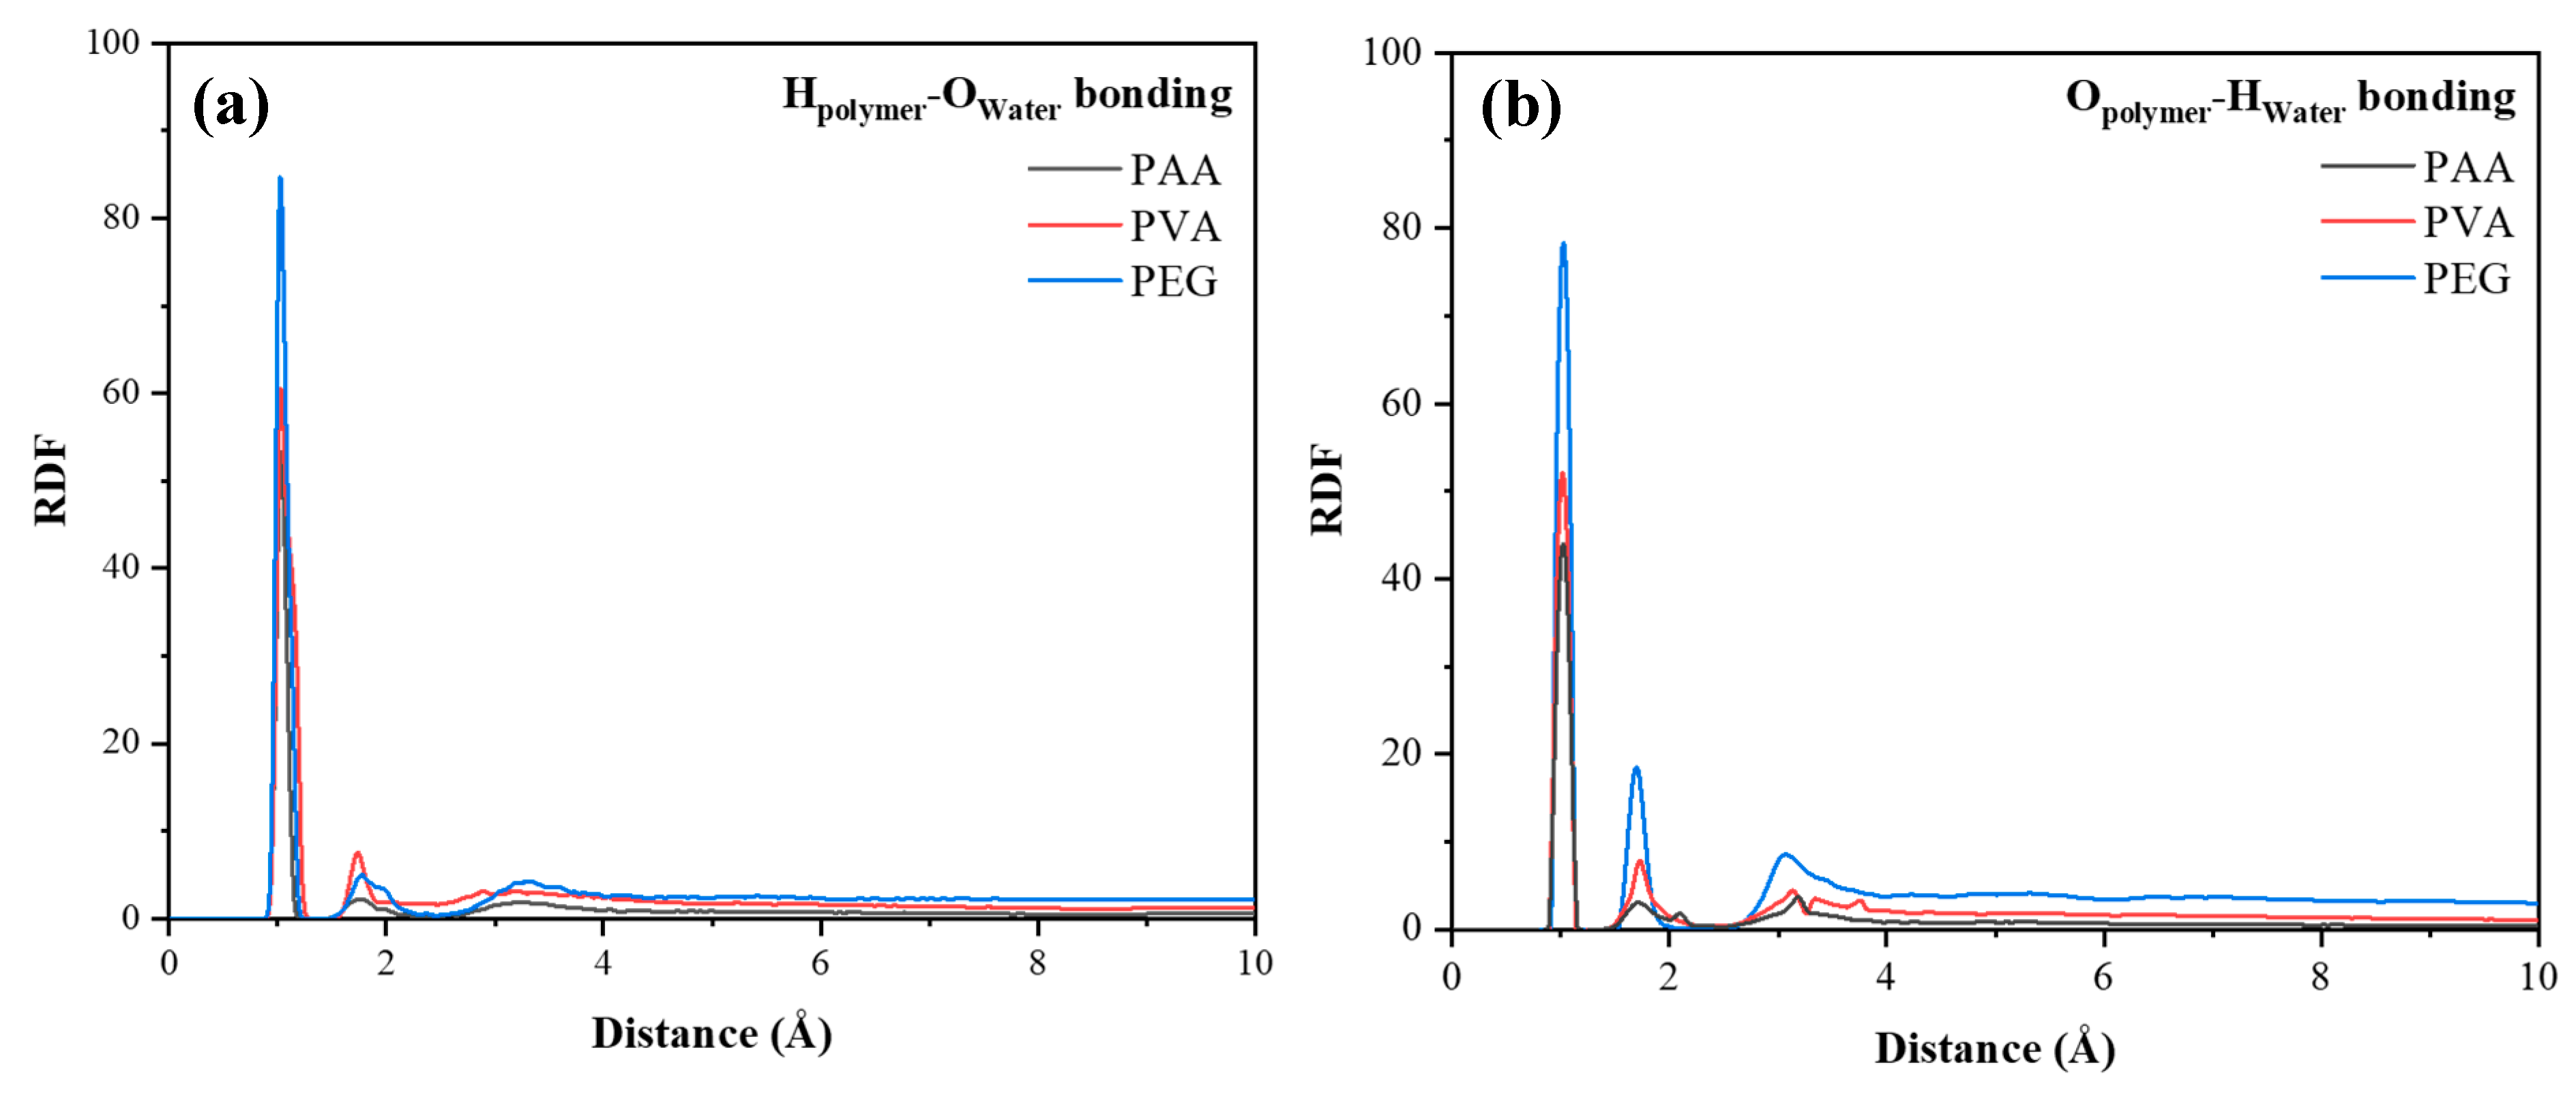
The number of hydrogen bonds is affected by the H-O interaction between the polymer and water molecules. The specific results are shown in Figure 19. It can be seen from the figure that both hydrogen atoms and oxygen atoms in the polymer molecules can form hydrogen bonds with water molecules. The intensity of Hpolymer-Owater is larger than Opolymer-Hwater, which may be due to the larger number of hydrogen atoms in the polymers, making the number of hydrogen bonds formed as hydrogen donor being dominant. However, whether as hydrogen donors or acceptors, the number of hydrogen bonds formed by the three polymers follows the order PEG > PVA > PAA. The results of this part further verify the number of hydrogen bonds in Figure 18b, indicating that PEG has the strongest interaction with water molecules, and its interface is more likely to form hydrogen bonds.
Figure 20 shows the bond length and bond angle distribution of hydrogen bonds for the three polymer–water systems. It can be seen that the hydrogen bond length of the PAA and PVA systems is mainly distributed in the range of 3.0–3.4 Å, while hydrogen bonds formed by PEG and water are more widely distributed in the range of 2.6–3.0 Å. Shorter bond lengths indicate stronger atomic interactions and higher hydrogen bond stability in PEG systems [44], which may help maintain the durability of polymer reinforcement.
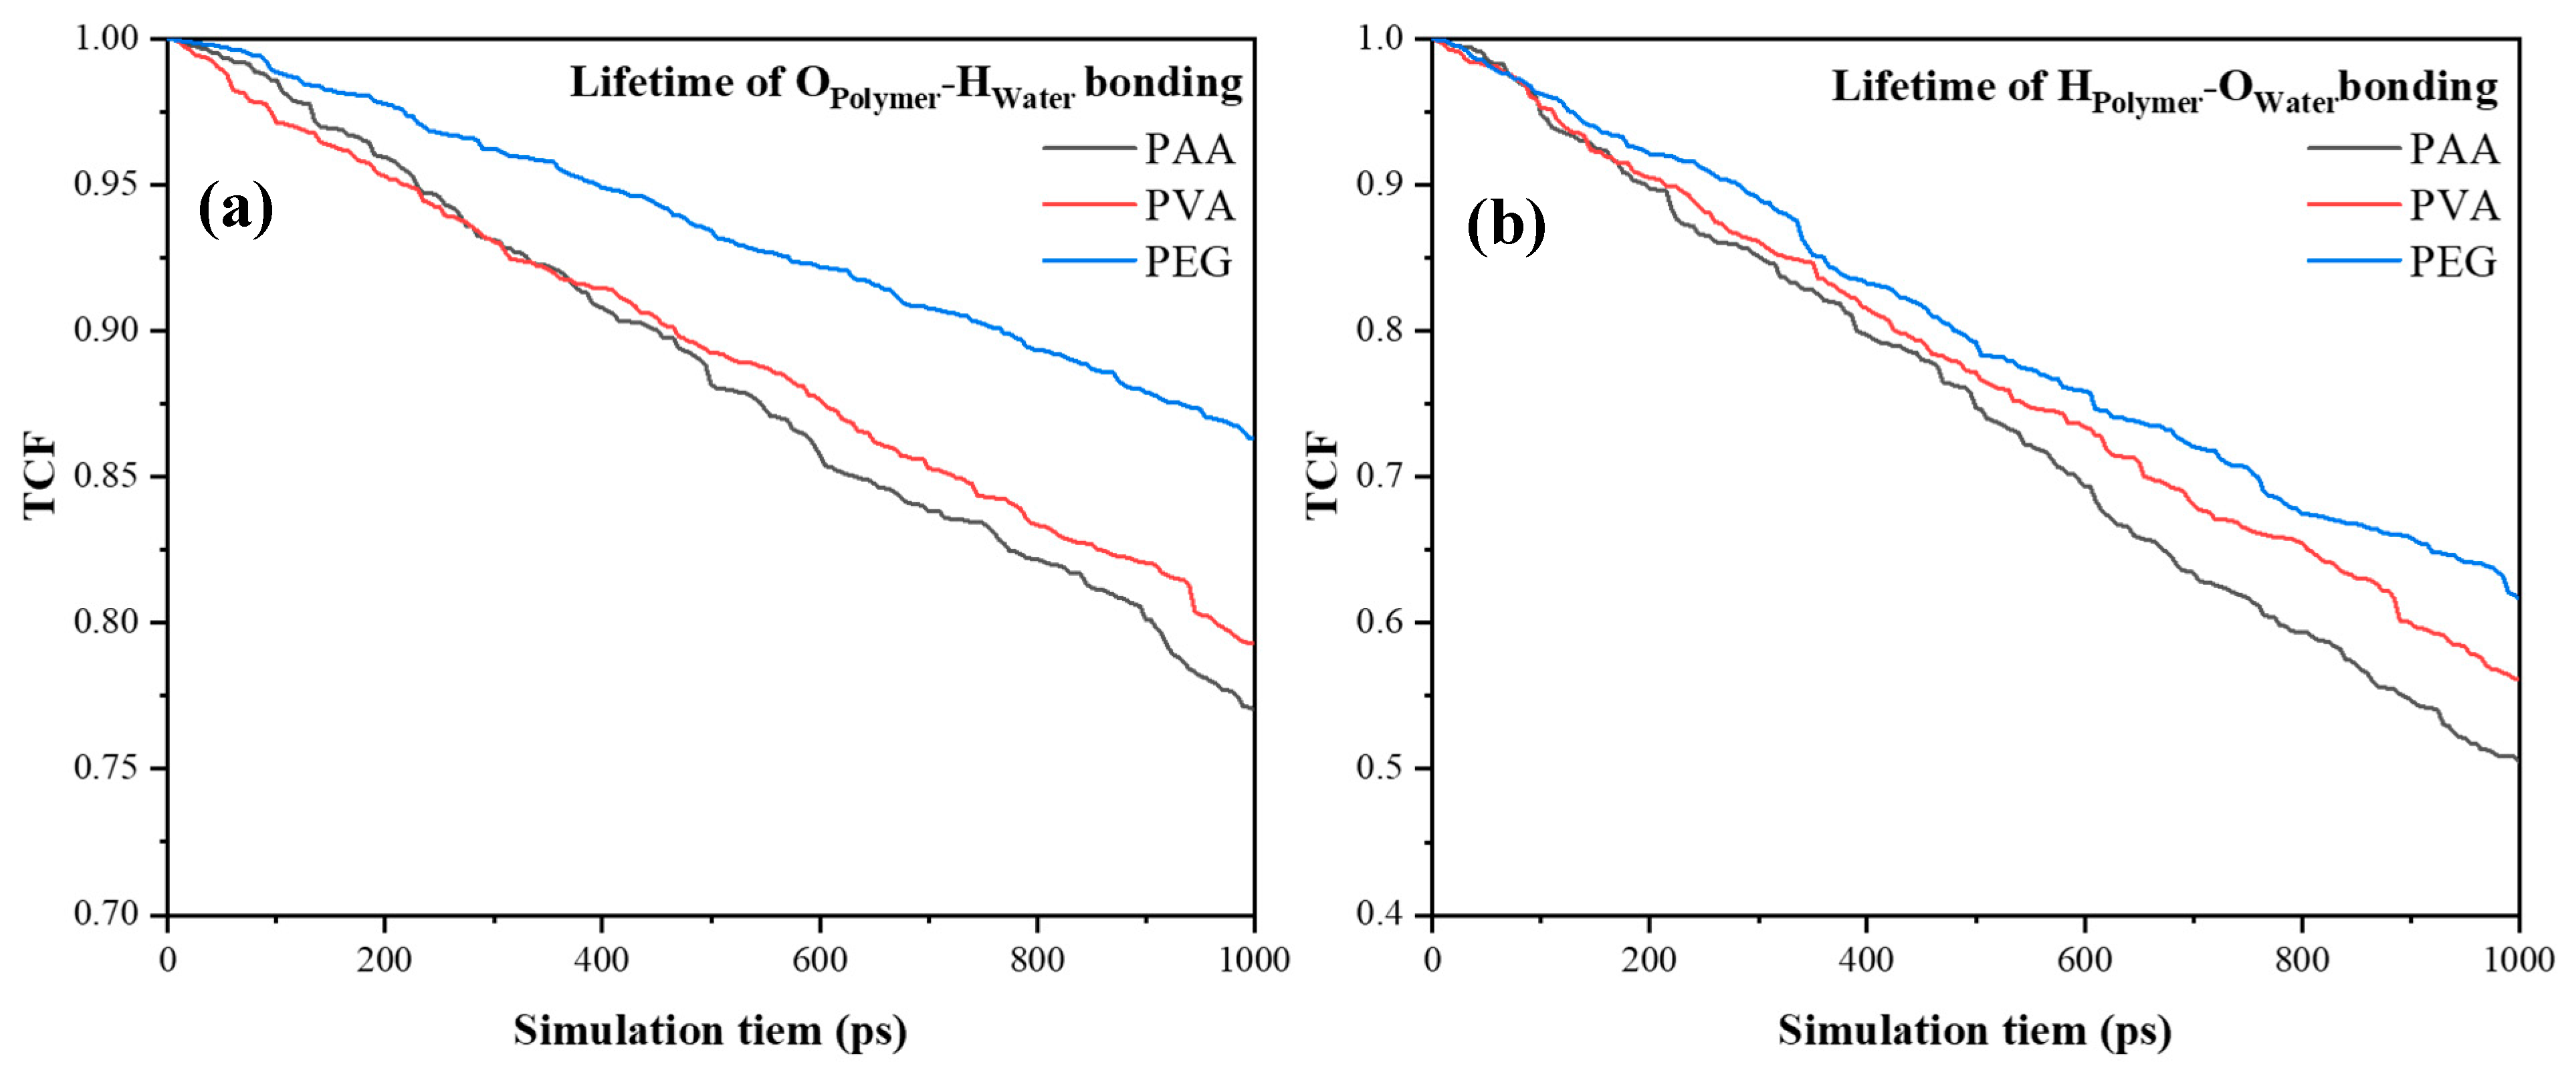
The stability of hydrogen bonds can also be characterized by the time correlation function (TCF) [45]. Figure 21a,b show the TCF of hydrogen bonds formed by oxygen atoms in polymers and hydrogen atoms in water atoms, hydrogen in polymers, and oxygen in water, respectively. As shown in the figure, the TCF decreases with the simulation time, which indicates that the hydrogen bond will break due to the atomic thermal motion. In comparison, the hydrogen bonds formed by polymers as oxygen donors with water molecules have higher stability, which is attributed to the stronger polarity of oxygen atoms and their stronger interaction with hydrogen atoms. Among the three polymers, the stability of the hydrogen bond TCF follows the order of PEG > PVA > PAA. This shows that PEG has the best hydrophilic properties and can stably bind water molecules on its surface for a long time, thereby effectively improving the corrosion resistance of cement-based materials.

5. Conclusions

In this study, the enhancement effects and underlying mechanisms of polymer on the mechanical performance and the wet–dry cycle corrosion resistance were systematically investigated. The key findings are summarized as follows:
(1)
Polymers enhance the flexural strength of mortar by improving interfacial bonding, with PVA showing the greatest effect. Low dosages (1%) improve compressive strength, while higher dosages (2–3%) balance strength and hydration inhibition, identifying 2–3% as the optimal range.
(2)
Incorporation of polymers markedly improves resistance to wet–dry cycles, reducing strength loss through better cohesion and water-binding capacity. The effectiveness follows the order PVA > PEG > PAA.
(3)
MD simulations reveal that PVA and PAA strengthen the CSH interface via Ca-O coordination, while PEG interacts primarily with CSH through hydrogen bonding. PVA and PAA exhibit good adsorption energy, confirming superior reinforcement in mechanical performance.
(4)
PEG forms the most stable hydrogen bonding network with water molecules, effectively anchoring them and reducing ingress, which underpins its contribution to improved durability under cyclic exposure.

Author Contributions

Conceptualization, L.Y. and B.X.; Methodology, L.Y., Q.F., D.M. and X.M.; Software, L.Y. and Q.F.; Validation, L.Y., Q.F. and X.M.; Formal analysis, L.Y., Q.F., X.M. and B.X.; Investigation, L.Y.; Resources, D.M. and B.X.; Data curation, L.Y. and Q.F.; Writing—original draft, L.Y.; Writing—review & editing, B.X.; Visualization, L.Y. and D.M.; Supervision, B.X.; Project administration, B.X.; Funding acquisition, B.X. All authors have read and agreed to the published version of the manuscript.

Funding

Financial support by the Natural Science Foundation of Shandong Province (Grant number: ZR2021QE197) and the industry–academia cooperation project “The research and development of the key technologies for the optimization design of the indoor thermal environment of rural buildings and the improvement of the artistry and durability of decoration materials” (Grant number: 2025370203000711) funded by Linyi Taisheng Decoration Engineering Co., Ltd., Shandong, China, Qingdao Natural Science Foundation Original Exploration Project (25-1-1-220-zyyd-jch), and the China Scholarship Council (CSC) for providing the CSC Scholarship (202506380151).

Data Availability Statement

The data that support the findings of this study are available from the corresponding author upon reasonable request. The data are not publicly available due to privacy.

Conflicts of Interest

The authors declare no conflicts of interest.

References

  1. Tang, S.W.; Yao, Y.; Andrade, C.; Li, Z.J. Recent durability studies on concrete structure. Cem. Concr. Res. 2025, 78, 143–154. [Google Scholar] [CrossRef]
  2. Salifu, N.; Bassuoni, M.T.; Guven, G. Performance Evaluation of Limestone-Blended Cement and Cellulose Nanomaterials in 3D Concrete Printing. Case Stud. Constr. Mater. 2025, 22, e04758. [Google Scholar] [CrossRef]
  3. Bai, J.; Li, M.; Yuan, Y.; Zhao, T.; Yang, Y.; Xu, Z.; Zhou, Y. Surface modified cellulose nanofibrils with γ-Aminopropyltriethoxysilane (KH550) for the performance enhancement of Portland cement systems. Constr. Build. Mater. 2025, 486, 141956. [Google Scholar] [CrossRef]
  4. Claramunt, J.; Ventura, H.; Toledo Filho, R.D.; Ardanuy, M. Effect of nanocelluloses on the microstructure and mechanical performance of CAC cementitious matrices. Cem. Concr. Res. 2019, 119, 64–76. [Google Scholar] [CrossRef]
  5. Du, X.; Li, Y.; Huangfu, B.; Si, Z.; Huang, L.; Wen, L.; Ke, M. Modification mechanism of combined nanomaterials on high performance concrete and optimization of nanomaterial content. J. Build. Eng. 2023, 64, 105648. [Google Scholar] [CrossRef]
  6. Monteiro, H.; Moura, B.; Soares, N. Advancements in nano-enabled cement and concrete: Innovative properties and environmental implications. J. Build. Eng 2022, 56, 104736. [Google Scholar] [CrossRef]
  7. Yue, Y.; Zhou, Y.; Xing, F.; Gong, G.; Hu, B.; Guo, M. An industrial applicable method to improve the properties of recycled aggregate concrete by incorporating nano-silica and micro-CaCO3. J. Clean. Prod. 2020, 259, 120920. [Google Scholar] [CrossRef]
  8. Zhou, Y.; Zheng, S.; Huang, X.; Xi, B.; Huang, Z.; Guo, M. Performance enhancement of green high-ductility engineered cementitious composites by nano-silica incorporation. Constr. Build. Mater. 2021, 281, 122618. [Google Scholar] [CrossRef]
  9. Pezeshkian, M.; Delnavaz, A.; Delnavaz, M. Effect of natural zeolite on mechanical properties and autogenous shrinkage of ultrahigh-performance concrete. J. Mater. Civ. Eng. 2020, 32, 04020093. [Google Scholar] [CrossRef]
  10. Chin, K.M.; Sung Ting, S.; Ong, H.L.; Omar, M. Surface functionalized nanocellulose as a veritable inclusionary material in contemporary bioinspired applications: A review. J. Appl. Polym. Sci. 2018, 135, 46065. [Google Scholar] [CrossRef]
  11. Wang, L.; Rehman, N.U.; Curosu, I.; Zhu, Z.; Beigh, M.A.B.; Liebscher, M.; Mechtcherine, V. On the use of limestone calcined clay cement (LC3) in high-strength strain-hardening cement-based composites (HS-SHCC). Cem. Concr. Res. 2021, 144, 106421. [Google Scholar] [CrossRef]
  12. Lepech, M.D.; Li, V.C. Application of ECC for bridge deck link slabs. Mater. Struct. 2009, 42, 1185–1195. [Google Scholar] [CrossRef]
  13. Chun, B.; Lee, S.W.; Piao, R.; Kim, S.; Yoo, D.Y. Enhanced impact resistance of RC beams using various types of high-performance fiber-reinforced cementitious composites. Eng. Struct. 2024, 319, 118790. [Google Scholar] [CrossRef]
  14. Song, Z.; Chen, R.; Wang, T.; Wu, H. Synergistic effects of CO2 sequestration on mechanical, microstructural, and environmental performance in carbonated MgO-based ECC. J. CO2 Util. 2025, 91, 103010. [Google Scholar] [CrossRef]
  15. Wu, J.D.; Guo, L.P.; Qin, Y.Y. Preparation and characterization of ultra-high-strength and ultra-high-ductility cementitious composites incorporating waste clay brick powder. J. Clean. Prod. 2021, 312, 127813. [Google Scholar] [CrossRef]
  16. Zhu, Y.; Zhang, Z.; Yang, Y.; Yao, Y. Measurement and correlation of ductility and compressive strength for engineered cementitious composites (ECC) produced by binary and ternary systems of binder materials: Fly ash, slag, silica fume and cement. Constr. Build. Mater. 2014, 68, 192–198. [Google Scholar] [CrossRef]
  17. Zhang, Z.; Yu, J.; Qin, F.; Huang, Y.; Sun, F. Mechanical and self-healing properties of calcium-sulfoaluminate-cement-based engineered cementitious composites (ECC). J. Build. Eng. 2023, 77, 107512. [Google Scholar] [CrossRef]
  18. Mostafaei, H.; Bahmani, H. Sustainable high-performance concrete using zeolite powder: Mechanical and carbon footprint analyses. Buildings 2024, 14, 3660. [Google Scholar] [CrossRef]
  19. Fan, Q.; Zheng, Y.; Meng, D.; Guo, Q.; Liu, Y.; Wu, H. Study on improving the performance of engineered cement-based composites by modifying binder system and polyethylene fiber/matrix interface. Colloids Surf. A 2025, 707, 135862. [Google Scholar] [CrossRef]
  20. Fan, Q.; Wu, H.; Meng, D.; Zheng, Y.; Tan, T. Hydration, Microstructure, and Strength Properties of Eco-ECC Incorporating Agricultural Waste: Peanut Shell Ash. Colloids Surf. A 2025, 137396. [Google Scholar] [CrossRef]
  21. Heidarnezhad, F.; Jafari, K.; Ozbakkaloglu, T. Effect of polymer content and temperature on mechanical properties of lightweight polymer concrete. Constr. Build. Mater. 2020, 260, 119853. [Google Scholar] [CrossRef]
  22. Khan, R.M.A.; Shafighfard, T.; Ali, H.Q.; Mieloszyk, M.; Yildiz, M. Strength prediction and experimental damage investigations of plain woven CFRPs with interacting holes using multi-instrument measurements. Polym. Compos. 2023, 44, 3594–3609. [Google Scholar] [CrossRef]
  23. Knapen, E.; Van Gemert, D. Polymer film formation in cement mortars modified with water-soluble polymers. Cem. Concr. Comp. 2015, 58, 23–28. [Google Scholar] [CrossRef]
  24. Fan, J.; Li, G.; Deng, S.; Wang, Z. Mechanical properties and microstructure of polyvinyl alcohol (PVA) modified cement mortar. Appl. Sci. 2019, 9, 2178. [Google Scholar] [CrossRef]
  25. Bentz, D.P.; Snyder, K.A.; Cass, L.C.; Peltz, M.A. Doubling the service life of concrete structures. I: Reducing ion mobility using nanoscale viscosity modifiers. Cem. Concr. Comp. 2008, 30, 674–678. [Google Scholar] [CrossRef]
  26. Zhao, L.; Feng, P.; Shao, L.; Ye, S.; Liu, X. Using viscosity modifying admixture to reduce diffusion in cement-based materials: Effect of molecular mass. Constr. Build. Mater. 2021, 290, 123207. [Google Scholar] [CrossRef]
  27. Fan, Q.; Zheng, Y.; Liu, Y.; Meng, X.; Quan, G.; Guo, Q.; Meng, D. Effect of modified cellulose nanocrystals on the structure of calcium silicate hydrate studied by molecular dynamics simulation and experiment. Langmuir 2023, 39, 16244–16260. [Google Scholar] [CrossRef]
  28. Fan, Q.; Meng, X.; Li, Z.; Ma, G.; Wang, Z.; Zhang, K.; Meng, D. Experiment and molecular dynamics simulation of functionalized cellulose nanocrystals as reinforcement in cement composites. Constr. Build. Mater. 2022, 341, 127879. [Google Scholar] [CrossRef]
  29. Fan, Q.; Liu, Y.; Zheng, Y.; Meng, D.; Guo, Q.; Hu, Z.; Liao, W. The microscopic reinforcement mechanism of Zhuhai soft soil by cement-based stabilizer: From microscopic characterization to molecular dynamics simulation. Appl. Surf. Sci. 2025, 681, 161574. [Google Scholar] [CrossRef]
  30. Lu, Z.; Yu, J.; Yao, J.; Hou, D. Experimental and molecular modeling of polyethylene fiber/cement interface strengthened by graphene oxide. Cem. Concr. Comp. 2020, 112, 103676. [Google Scholar] [CrossRef]
  31. Lu, M.; Zheng, Y.Y.; Yin, Z.Y. From sedimentation to consolidation of kaolinite: A molecular dynamic study. Comput. Geotech. 2024, 170, 106285. [Google Scholar] [CrossRef]
  32. Lu, M.; Zheng, Y.Y.; Yin, Z.Y. A molecular dynamics study on the softening of kaolinite in water: Weakening of tensile property during stretching and disintegration of structure during soaking. Comput. Geotech. 2024, 173, 106562. [Google Scholar] [CrossRef]
  33. Wei, P.; Zhou, S.; Zheng, Y.Y.; Yin, Z.Y.; Xu, W. Nanoscale stick-slip behavior and hydration of hydrated illite clay. Comput. Geotech. 2024, 166, 105976. [Google Scholar] [CrossRef]
  34. Hou, D.; Yu, J.; Wang, P. Molecular dynamics modeling of the structure, dynamics, energetics and mechanical properties of cement-polymer nanocomposite. Compos. Part B-Eng. 2019, 162, 433–444. [Google Scholar] [CrossRef]
  35. GB/T 2419-2005; Test Method for Fluidity of Cement Mortar. Standardization Administration of the People’s Republic of China: Beijing, China, 2005.
  36. GB/T 17671-2021; Test Method of Cement Mortar Strength (ISO Method). Standardization Administration of the People’s Republic of China: Beijing, China, 2021.
  37. Wang, P.; Duan, Y.; Zheng, H.; Chen, Z.; Wang, M.; Wang, X.; Hou, D. Molecular structure and dynamics of water on the surface of cement hydration products: Wetting behavior at nanoscale. Appl. Surf. Sci. 2023, 611, 155713. [Google Scholar] [CrossRef]
  38. Lv, C.; Xue, Q.; Xia, D.; Ma, M. Effect of chemisorption structure on the interfacial bonding characteristics of graphene-polymer composites. Appl. Surf. Sci 2012, 258, 2077–2082. [Google Scholar] [CrossRef]
  39. Zhao, H.; Wang, Y.; Yang, Y.; Shu, X.; Yan, H.; Ran, Q. Effect of hydrophobic groups on the adsorption conformation of modified polycarboxylate superplasticizer investigated by molecular dynamics simulation. Appl. Surf. Sci. 2017, 407, 8–15. [Google Scholar] [CrossRef]
  40. Fan, Q.; Zheng, Y.; Yang, Y.; Liu, S.C.; Meng, D.; Guo, Q.; Liu, Y. Effect of interface properties between functionalized cellulose nanocrystals and tricalcium silicate on the early hydration mechanism of cement. Colloids Surf. A 2024, 698, 134552. [Google Scholar] [CrossRef]
  41. Sanchez, F.; Zhang, L. Molecular dynamics modeling of the interface between surface-functionalized graphitic structures and calcium-silicate-hydrate: Interaction energies, structure, and dynamics. Colloid Interface Sci. 2008, 323, 349–358. [Google Scholar] [CrossRef]
  42. Joos, M.; Kang, X.; Merkle, R.; Maier, J. Water uptake of solids and its impact on ion transport. Nat. Mater. 2025, 24, 821–834. [Google Scholar] [CrossRef]
  43. Liu, Y.M.; Zheng, Y.Y.; Lin, H.J.; Wei, P.C.; Fan, Q.C.; Huang, G.G.; Meng, D. Calculation of contact angle via Young-Dupré equation with molecular dynamic simulation: Kaolinite as an example. Colloids Surf. A 2024, 697, 134469. [Google Scholar] [CrossRef]
  44. Liu, Y.; Zheng, Y.; Lin, H.; Fan, Q.; Tan, T. Effect of temperature on structure and mechanical properties of kaolinite via experiments and reactive molecular dynamics simulations. Appl. Clay Sci. 2025, 276, 107918. [Google Scholar] [CrossRef]
  45. Fan, Q.; Wang, Z.; Meng, X.; Zhang, K.; Ma, G.; Li, Z.; Meng, D. Multi-scale analysis of the strengthening mechanism of functionalized graphene as reinforcement in cement composites. Colloids Surf. A 2022, 651, 129729. [Google Scholar] [CrossRef]
Figure 1. The morphology of polymer powder and solution. (a) PVA powder; (b) PAA powder; (c) PEG powder; (d) PVA solution.
Buildings 15 03192 g001
Figure 2. The sample for fluidity and strength tests: (a) Fluidity; (b) flexural; (c) compressive.
Buildings 15 03192 g002
Figure 3. The fluidity of polymer mortars.
Buildings 15 03192 g003
Figure 4. The flexural strength at different ages: (a) 3 days; (b) 7 days; (c) 28 days.
Buildings 15 03192 g004
Figure 5. The compressive strength at different ages: (a) 3 days; (b) 7 days; (c) 28 days.
Buildings 15 03192 g005
Figure 6. The ratio of compressive strength to flexural strength of samples at 28 days.
Buildings 15 03192 g006
Figure 7. The flexural strength after dry–wet cycles: (a) 2% polymer addition; (b) 3% polymer addition.
Buildings 15 03192 g007
Figure 8. The compressive strength after dry–wet cycles: (a) 2% polymer addition; (b) 3% polymer addition.
Buildings 15 03192 g008
Figure 9. Microstructure of hydration products: (a,b)—control; (c,d)—PVA; (e,f)—PAA; (g,h)—PEG.
Buildings 15 03192 g009
Figure 10. The modelling process.
Buildings 15 03192 g010
Figure 11. The conformations of the three polymers after adsorption with CSH: (a) PVA; (b) PEG; (c) PAA.
Buildings 15 03192 g011
Figure 12. The adsorption energy between polymers and CSH.
Buildings 15 03192 g012
Figure 13. The conformational morphology of polymer molecular chains before and after adsorption.
Buildings 15 03192 g013
Figure 14. The radius of gyration results of polymer: (a) along the X-Y direction; (b) along the Z direction.
Buildings 15 03192 g014
Figure 15. The MSD results of polymers: (a) PVA; (b) PAA; (c) PEG.
Buildings 15 03192 g015
Figure 16. The RDF results of polymers/CSH: (a) PVA; (b) PAA; (c) PEG.
Buildings 15 03192 g016
Figure 17. The atomic density and MSD results of water molecules: (a) Atomic density; (b) MSD.
Buildings 15 03192 g017
Figure 18. The dipole moment and hydrogen bond results: (a) dipole moment; (b) hydrogen bond.
Buildings 15 03192 g018
Figure 19. The RDF results of polymers and water molecules: (a) H-O; (b) O-H.
Buildings 15 03192 g019
Figure 20. The distribution of hydrogen bonding: (a) PAA; (b) PVA; (c) PEG.
Buildings 15 03192 g020
Figure 21. The TCF results: (a) oxygen in polymer and hydrogen in water; (b) hydrogen in polymer and oxygen in water.
Buildings 15 03192 g021
Table 1. The composition of the cement.
CompositionCaOAl2O3Fe2O3SiO2SO3MgOLoss
Ratio63.12%5.14%3.21%20.13%3.11%3.02%2.27%
Disclaimer/Publisher’s Note: The statements, opinions and data contained in all publications are solely those of the individual author(s) and contributor(s) and not of MDPI and/or the editor(s). MDPI and/or the editor(s) disclaim responsibility for any injury to people or property resulting from any ideas, methods, instructions or products referred to in the content.