Article

Based-Performance Evaluation of Partial Staggered-Story RC Frame Building Considering Confinement Coefficients of Steel Tube-Reinforced Concrete Columns

1
Shaanxi Modern Architectural Design and Research Institute Co., Ltd., Xi’an 710021, China
2
School of Architecture and Civil Engineering, Xi’an University of Science and Technology, Xi’an 710054, China
*
Author to whom correspondence should be addressed.
Buildings 2025, 15(17), 3193; https://doi.org/10.3390/buildings15173193
Submission received: 22 July 2025 / Revised: 28 August 2025 / Accepted: 2 September 2025 / Published: 4 September 2025
(This article belongs to the Section Building Structures)

Abstract

Compared with conventional RC frame buildings, staggered-story frame buildings are prone to the formation of short columns due to the vertical staggering of beam members, which exerts an adverse impact on the seismic performance of the building. Therefore, steel tube-reinforced concrete (ST-RC) columns are usually adopted to address the issue of the insufficient ductility of short columns. For this purpose, to investigate the seismic performance of partial staggered-story RC frame buildings, an elastic–plastic model is established based on a specific practical building, with ST-RC columns installed in the staggered-story area. By varying the confinement coefficients of the ST-RC columns (1.087, 1.152, 1.224, and 1.307) and classifying the member-level performance states, the seismic performance of ST-RC columns in staggered-story buildings under different confinement coefficients is evaluated. The research results indicate the following: in the statistical analysis of the performance states of the positive sections of the ST-RC columns, the degree of damage of the ST-RC columns first decreases and then increases sharply with an increase in the confinement coefficient, and the member damage is minimized when the confinement coefficient is 1.224. In the statistical analysis of the performance states of the inclined sections of the ST-RC columns, the damage state of the ST-RC columns shows a decreasing trend as the confinement coefficient increases; when the confinement coefficients are 1.224 and 1.307, the ST-RC columns are completely in the elastic state. With an increase in the confinement coefficient, the shear force borne by the ST-RC columns first increases and then decreases, while the tensile strain and compressive strain generally show a decreasing trend. When the confinement coefficient is 1.224, the tensile strain and compressive strain of the ST-RC columns are the smallest. Therefore, when arranging ST-RC columns in staggered-story buildings, it is necessary to select an appropriate confinement coefficient according to the actual project conditions to maximize the ductility of the short columns.

1. Introduction

Due to the more flexible spatial layout of staggered-story frame buildings, which allows for the full utilization of the indoor space with more functional partitions and a stronger sense of hierarchy, an increasing number of users and developers are considering the adoption of staggered-story buildings. However, because the floor slabs of staggered-story buildings are interleaved with each other, short members that are unfavorable for earthquake resistance are prone to form, which reduces the structure’s ability to coordinate deformation. In view of the advantages of such structures in terms of variable spatial layout, it has become a key issue for structural engineers and researchers to find ways to avoid or overcome the adverse effects caused by staggered stories, improve the seismic performance of the structure, and maximize its advantages [1].
In China, a growing number of landmark buildings have adopted staggered-story designs. Due to complex issues such as staggered stories and sloped roofs in the Press Center of the Shanghai Cooperation Organization (SCO) Qingdao Summit, Liu et al. [2] designed staggered inclined columns as ST-RC columns and controlled their axial compression ratio within 0.4 to enhance their ductility and seismic performance. A certain opera house in Shanghai adopted a staggered-story design due to its functional characteristics, leading to issues such as structural torsional irregularity, local discontinuity of floor slabs, and discontinuity of vertical lateral force-resisting members. To ensure that the theater would not collapse during strong earthquakes, Jia [3] conducted a static elastic–plastic seismic analysis on it. The research results showed that the maximum inter-story drift ratios of the structure after a rare earthquake all met the code [4] requirement of not exceeding 1/50; at the performance check after a rare earthquake, the plastic hinges were mainly distributed on frame beams and individual frame columns, with an overall low degree of damage, and no obvious plastic hinges were found on the staggered-story columns, which satisfied the design concept of “no collapse under strong earthquakes”. Due to the existence of a cinema in Joy City in Yinchuan, three staggered-floor slabs were formed at the top of the structure, resulting in a staggered-story frame building. Liu et al. [5] conducted an elastic time–history analysis and a pushover analysis on it. The research results indicated that under the elastic time–history analysis, the base shear of the structure met the code [4] requirements; under the static elastic–plastic analysis, the inter-story drift ratios did not exceed the code requirement of 1/100. Local bending of the plastic hinges appeared at the beam ends, while the columns remained elastic, and the yield mechanism conformed to the seismic concept of structural design. The elevation setback from the second floor to the roof of the terminal building of Longnan Chengzhou Airport caused staggered stories. Wang et al. [6] used YJK, PM-SAP, and SAP2000 24 software to conduct a seismic analysis during frequent earthquakes, fortification earthquakes, and rare earthquakes, and they carried out a performance-based design for the frame columns at the staggered-story positions of the terminal building. The research results showed that the staggered-story positions met the design requirements for moderate earthquakes; under different structural seismic performance levels, the staggered-story frame columns met the elastic design requirements during frequent and fortification earthquakes, and during rare earthquakes, the flexural part of the staggered-floor columns yielded while the shear part did not yield. In a school library in Qingpu District, Shanghai, the floor of the reading area on the second floor and the floor of the multi-functional hall forms a staggered story, resulting in floor slab discontinuity. Wang et al. [7] conducted elastic and elastic–plastic analyses on it. The research results showed that under the elastic analysis, the relevant parameters such as the building’s period ratio, base shear, and maximum inter-story drift ratios all met the requirements of the code [4]; designed according to the moderate earthquake elastic seismic performance target, the shear and flexural bearing capacities of they key members met the moderate earthquake elastic design requirements, and the ordinary frame columns met the moderate earthquake design requirements of elastic shear and no yielding flexure. In the elastic–plastic analysis, the inter-story drift ratios of the building were all less than the code [4] requirement of 1/50; most of the members were slightly damaged, a few were moderately damaged, and individual short columns were severely damaged. Overall, the building could meet the requirement of no collapse during rare earthquakes. A bookstore in Wangfujing, Beijing, has the problem of bidirectional staggered floors. Zhou et al. [8] carried out an elastic–plastic analysis during strong earthquakes. The research results showed that the maximum inter-story drift ratios of the building were all less than the limit of 1/50; the preset key members were in an undamaged state, and only part of the bottom frame columns entered the plastic stage, with no damage exceeding slight damage.
It is worth mentioning that conducting a performance-based seismic evaluation on buildings helps us understand their damage status. Zameeruddin [9], Giannakouras [10], and Yalçın et al. [11] explored the state of plastic hinges to evaluate the damage of frame buildings through a finite element analysis. Radman et al. [12], via a finite element analysis, classified members’ damage into three levels—Immediate Occupancy (IO), Life Safety (LS), and Collapse Prevention (CP)—for evaluation, while Chourasia et al. [13] did it through experiments. Etli et al. [14] evaluated the seismic performance of frame buildings from multiple perspectives such as inter-story drift, ductility coefficient, and the elastic–plastic relationship of the load-displacement curve. Chong et al. [15] clarified the damage levels of concrete members in accordance with the ASCE/SEI 41–17 [16] specification. When different codes are adopted as the basis for an analysis, attention should be paid to the differences between the codes. Chinese codes focus more on local engineering experience and safety thresholds, while international codes emphasize universality to a greater extent. In practical engineering, it is necessary to select the design method according to the code requirements of the project location, combined with material properties and structural needs; when necessary, the feasibility of a cross-code application should be verified through tests. Therefore, this paper refers to Chinese codes.
Most researchers utilize the “three-level, two-stage” seismic design concept, whose primary focus is safeguarding human life when structures are exposed to seismic events. Nevertheless, as society advances, there has been a growing demand for the enhanced seismic performance of buildings.
In addition, due to the unfavorable impact of short columns on seismic resistance in staggered-story buildings, the damage to the columns between the staggered stories is significantly greater than that of other columns [17]. Some scholars have adjusted the relevant parameters of staggered-story buildings to improve their seismic performance. Chen et al. [18] explored the seismic performance of staggered-story frame buildings by changing the floor and the thickness of the floor slab where the staggered story is located. The findings of the study indicated that a lower floor position for the staggered-story building had more favorable outcomes; notably, the seismic performance of the staggered-story building does not diminish as the thickness of the staggered-story floor slab increases, and the optimal slab thickness ought to be identified via a finite element simulation analysis. Cheng et al. [19] established three staggered-story buildings with different heights and used the time–history analysis method to study the torsional effect on the building during one-dimensional, two-dimensional, and three-dimensional earthquakes. The research results indicated that due to the asymmetric characteristics of staggered-story buildings, the stiffness center deviated from the mass center, which not only caused horizontal vibration but also produced obvious torsion. Yao et al. [20] studied the influence of parameters, such as the steel ratio in staggered-story buildings, on the axial compression capacity of frame columns and concluded that the steel ratio has a significant impact on the axial compression of frame columns. Li et al. [21] studied the influence of changes in column section size on staggered-story buildings during earthquakes. The research results showed that appropriately reducing the section size of the middle column was beneficial to controlling the structural shear force and displacement.
From these engineering examples, it can be seen that buildings with staggered stories are more prone to torsion due to discontinuous floor slabs, which greatly increases the probability of member damage. However, the traditional design method based on the members’ bearing capacity cannot fully explain the structural performance. Moreover, the existence of short columns makes the building more prone to brittle failure. Therefore, based on an engineering example, this paper establishes an elastic–plastic analysis model. Setting ST-RC columns has become a relatively ideal choice, as they can develop the ductility of short columns. On this basis, by changing the confinement coefficient, defining the damage mode of the members, and using specific quantitative indicators to evaluate the seismic performance of ST-RC short columns during strong earthquakes, the damage status of short columns can be understood, providing a reference for the selection of the confinement coefficient of ST-RC columns.

2. Elastic–Plastic Modeling of the Building

2.1. Engineering Overview

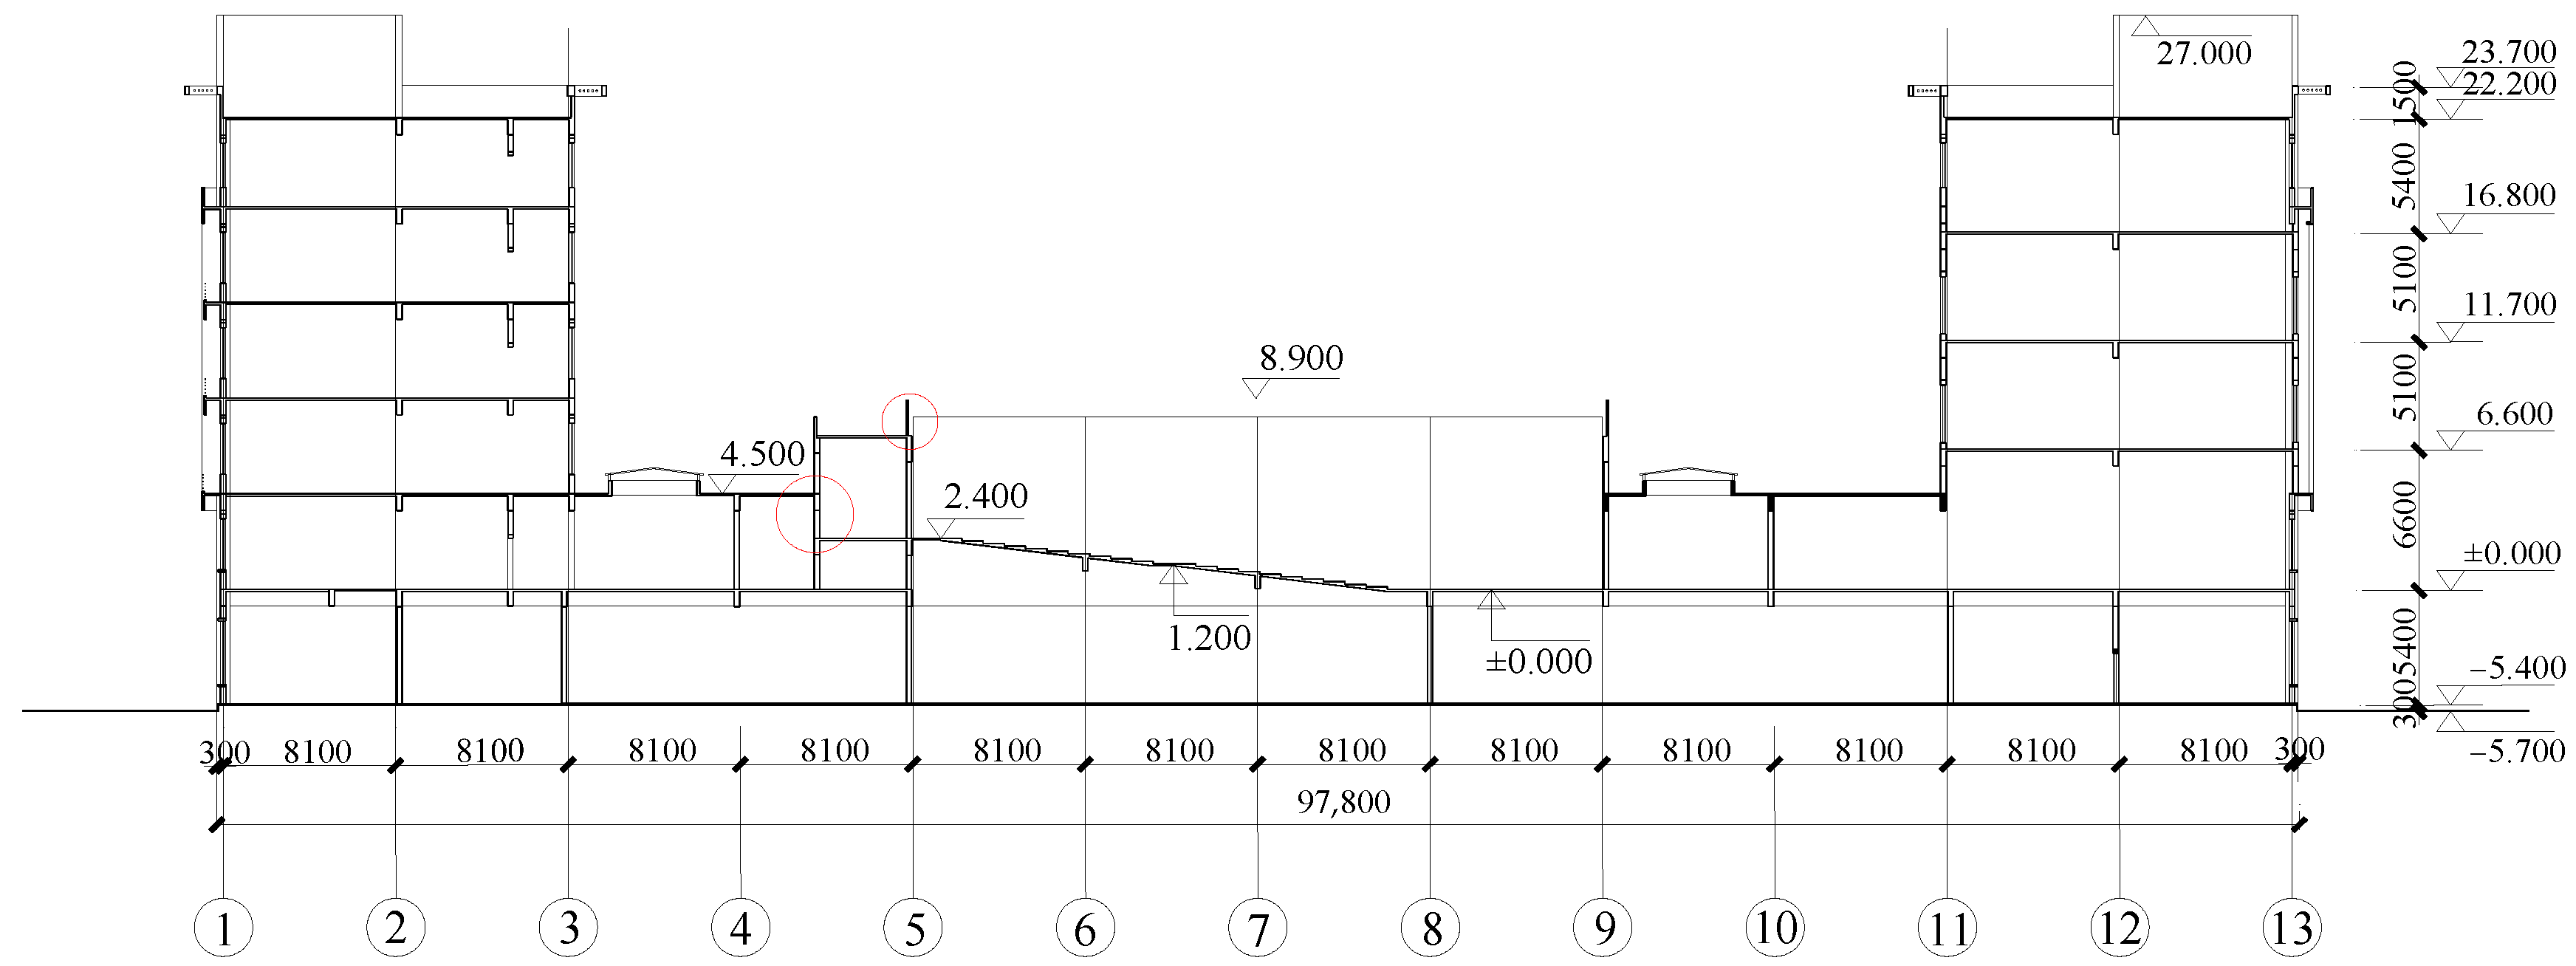
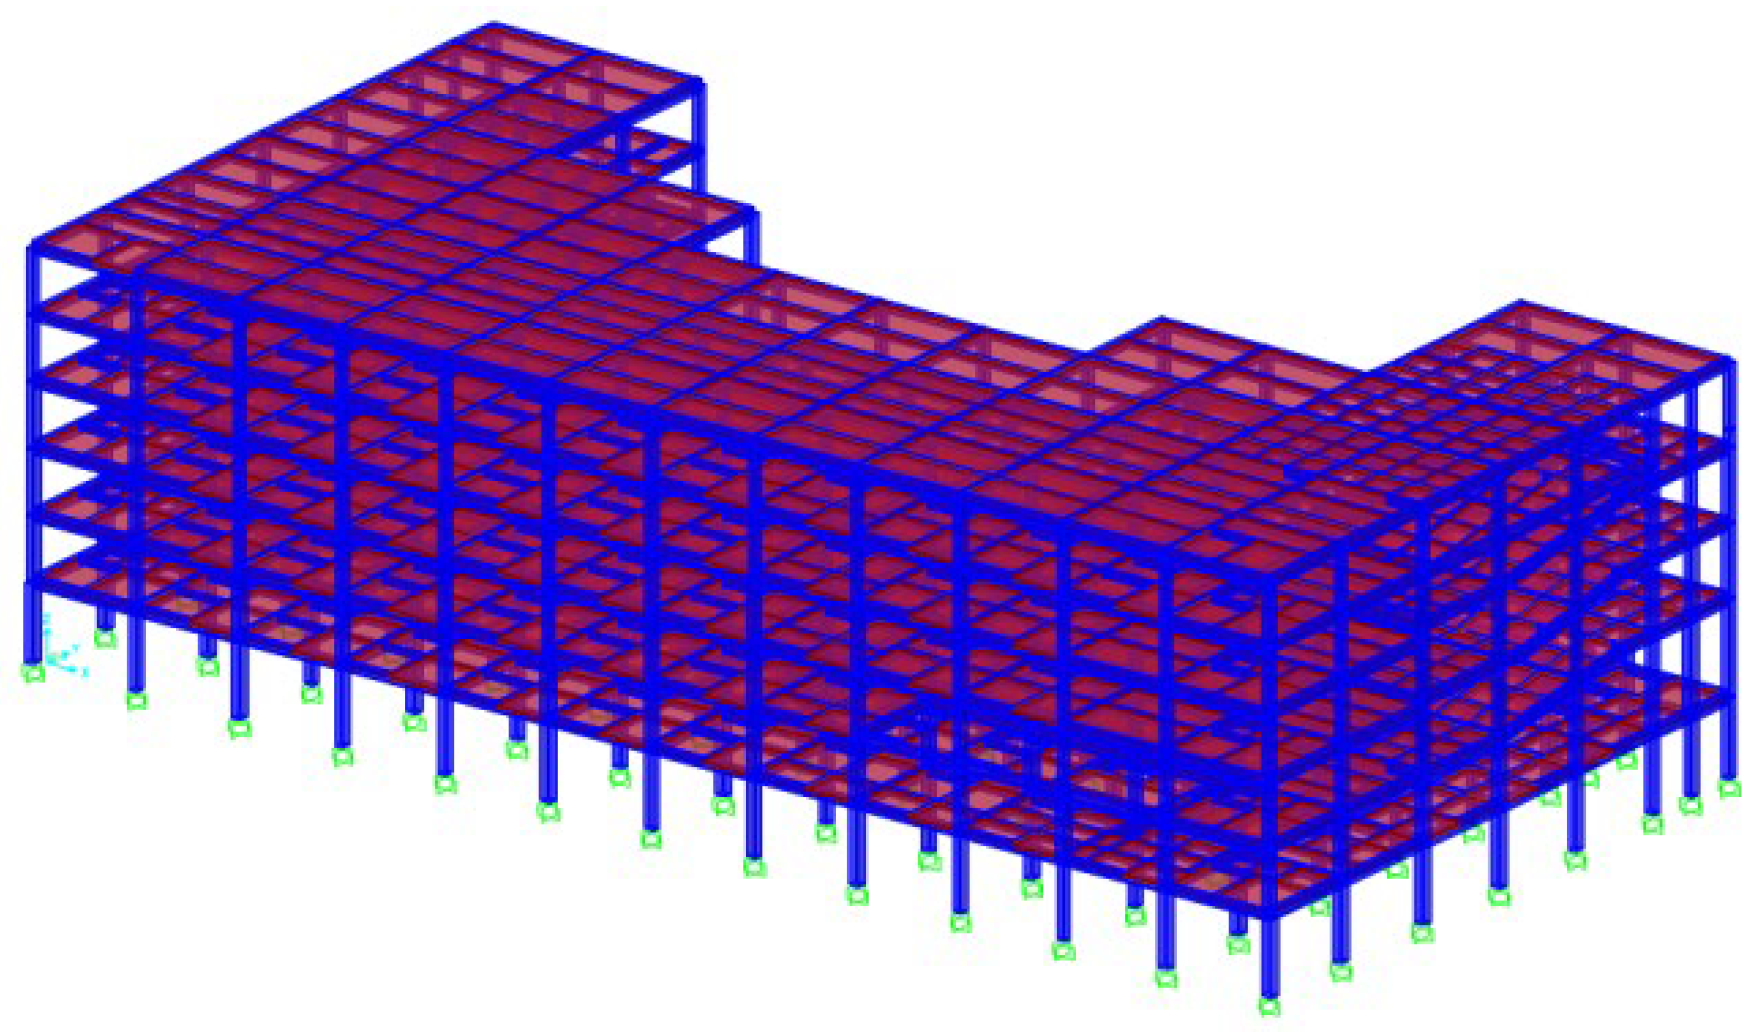
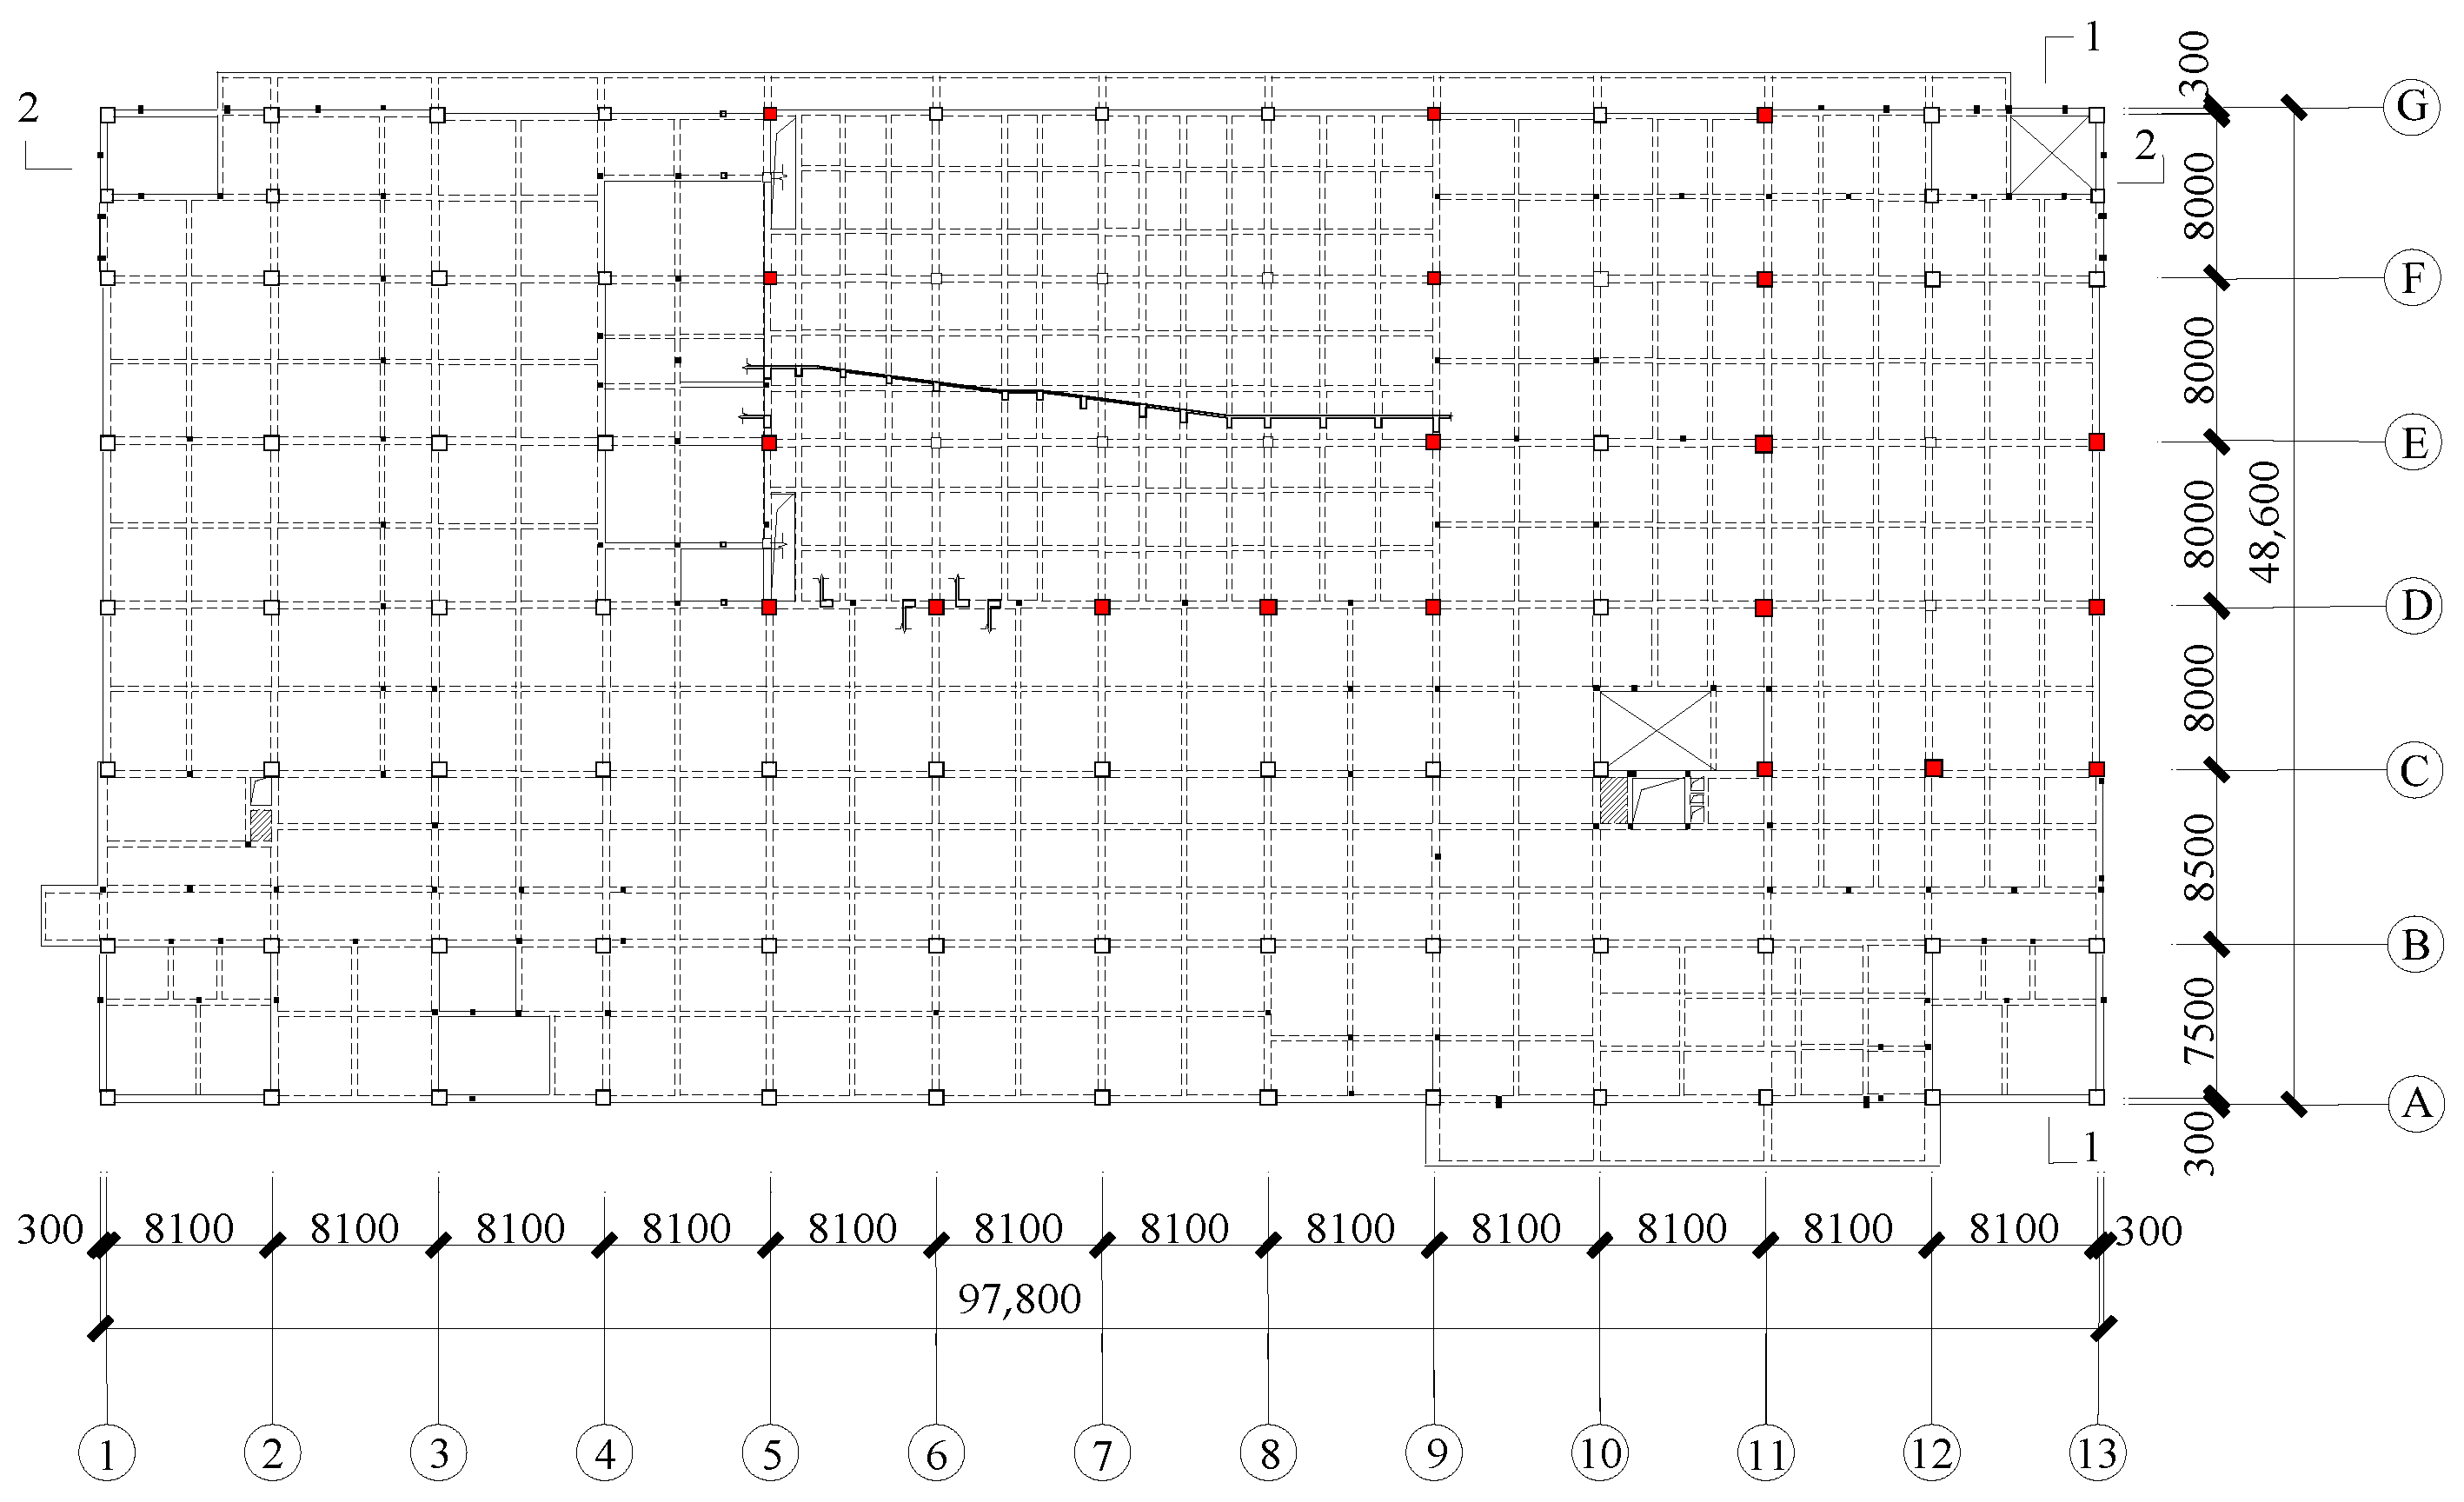
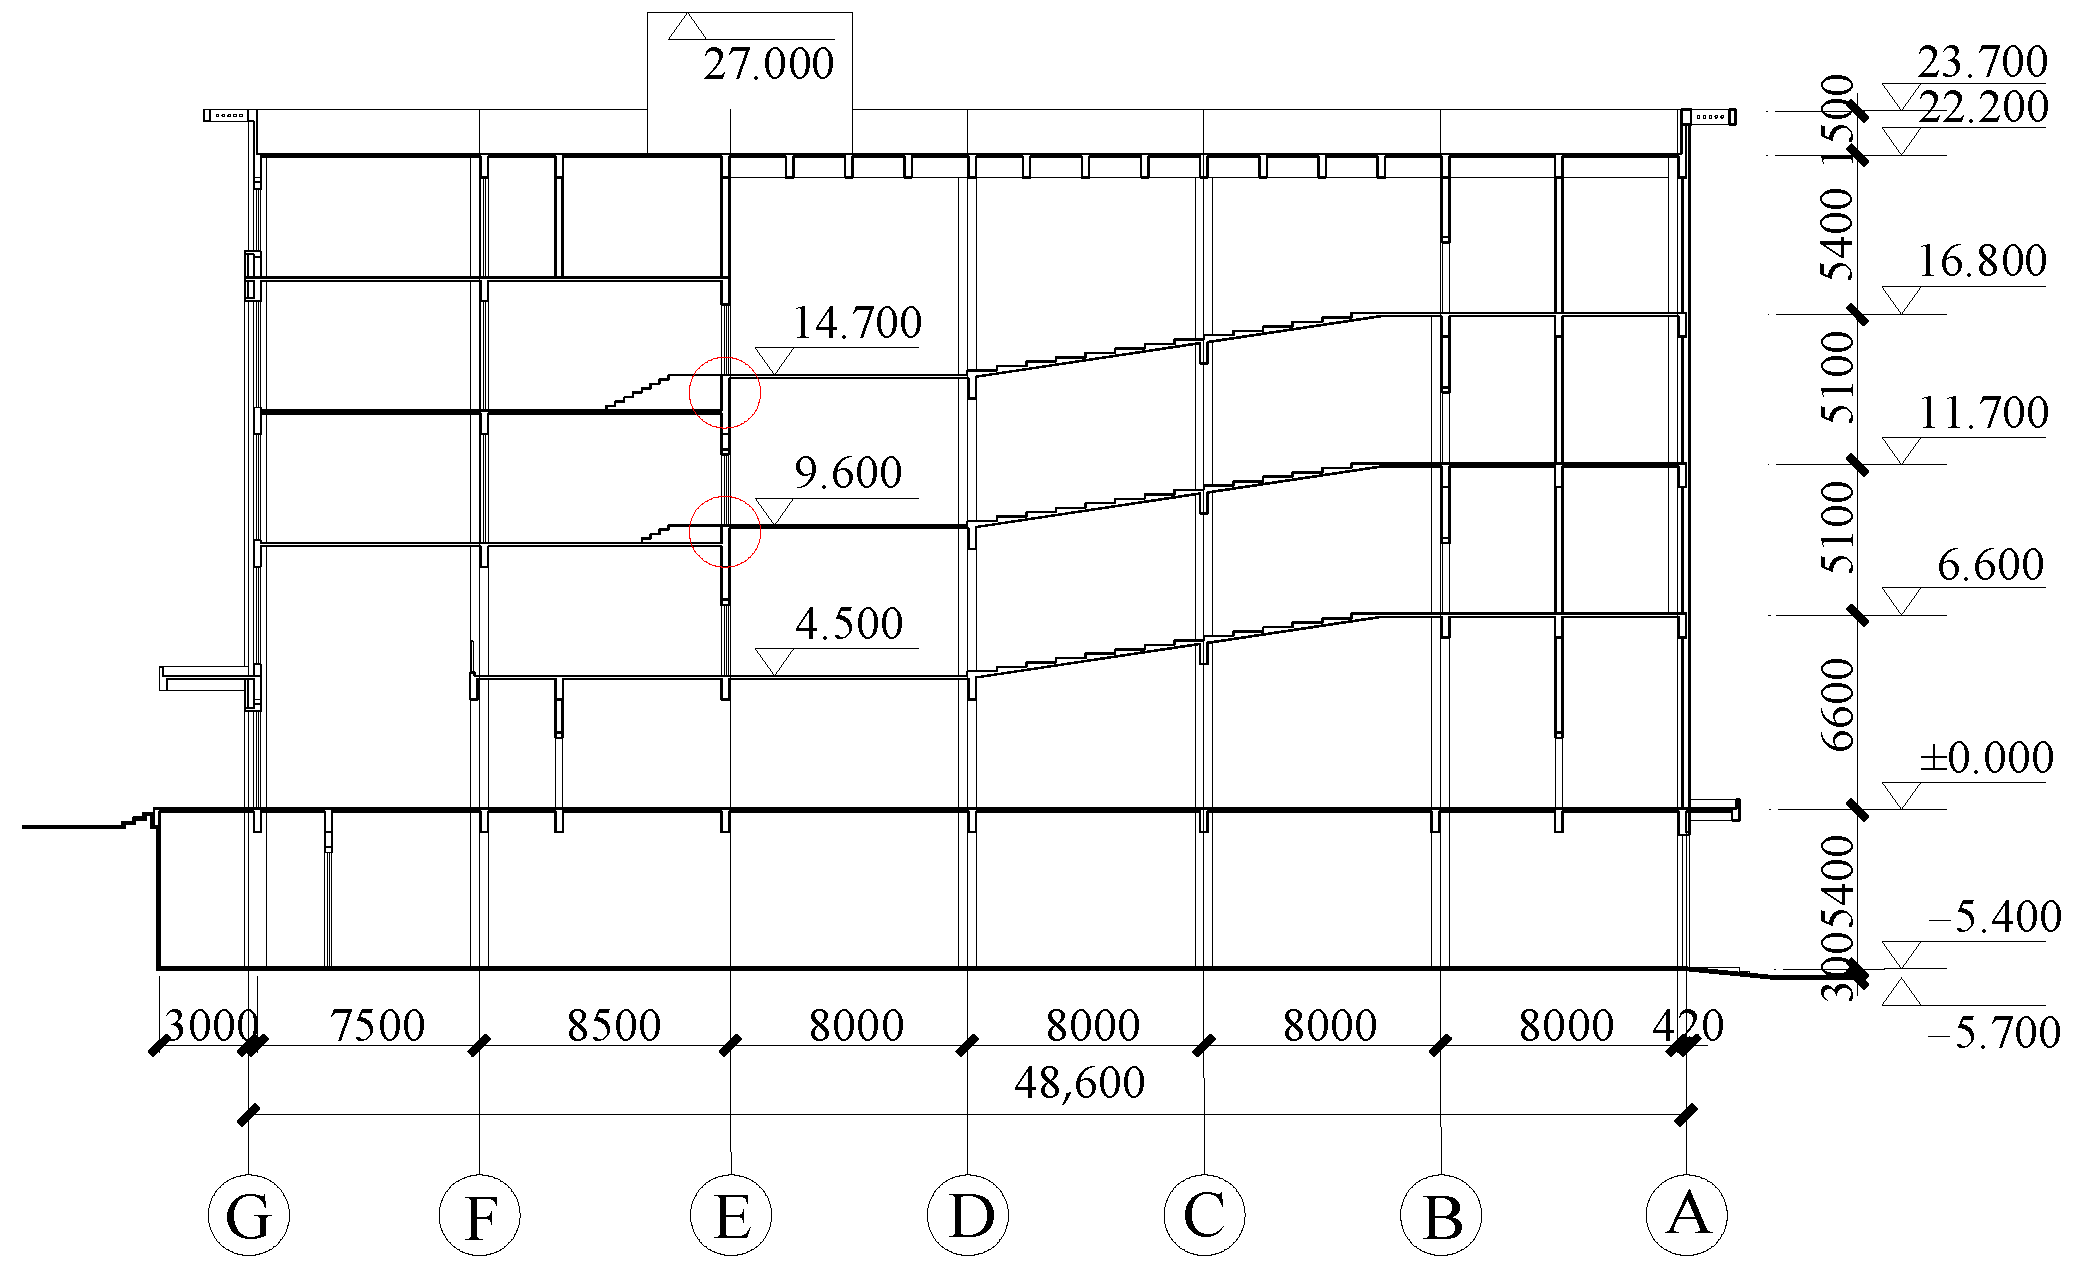
An experimental center at Xi’an University of Science and Technology in Shaanxi is chosen as the research location of this paper. This experimental center is characterized by an RC frame building, while a staggered-story building is designed for multiple science and technology lecture halls. Figure 1 presents the first floor plan of the building, where the positions of Sections 1-1 and 2-2 are marked. The staggered-story positions are labeled in Figure 2 and Figure 3. To avoid the stress concentration caused by the staggered story, in which short columns cause shear damage and part of the column ductility is insufficient, the column positions highlighted in red in Figure 1 are designed as ST-RC columns. Figure 4 is the finite element analysis model of the building.
The total length, width, and height of the building are 97.8, 48.6, and 29.4 m, respectively. Moreover, the building has six floors and a total area of 23018 m2. The building is categorized as Class 2, with a seismic intensity of 8 degrees (0.20 g). Its frame seismic grade is Class I, the structural safety grade is Class II, the design grouping is first group, the site category is Class 2, and the seismic defense is Class C. The setting criteria and meanings of the Class parameters are detailed in Reference [4].
Table 1 presents the concrete strength grade. Table 2, Table 3 and Table 4 summarize the building of the beam and the column member section design parameters, and the ground main floor and the roof mean live loads are in accordance with the standard values of civil building floor mean live loads for the arrangement [22].

2.2. Beam—Column Fiber Element Model

2.2.1. Principle of the Fiber Element

The principle of the fiber model method [23] is to divide the cross-section of the plastic zone part of the member into meshes. Each mesh is the face of the fiber section. The strain of each fiber can be calculated using the independent constitutive model, and then the center of the mesh is set as the integration point; through the calculation of the mechanical parameters, the member’s cross-section can be obtained.
The compressive bending stiffness matrix of the cross-section is shown in Equation (1).
[ k ( x ) ] s = i = 1 n E i A i i = 1 n E i A i z i i = 1 n E i A i y i s y m i = 1 n E i A i z i 2 i = 1 n E i A i y i z i s y m s y m i = 1 n E i A i y i 2
where n is number of fibers in the cross-section; yi and zi are the coordinates of the ith fiber; and Ei is material stiffness of the ith fiber.
When applying fiber elements, the following assumptions are considered, which can also be regarded as the limitations of modeling using Perform-3D 9 software:
(1)
Based on the assumption of geometrically linear small deformation;
(2)
Satisfies the plane section assumption;
(3)
A beam element is divided into several integration segments, and within each segment, the cross-sectional form and the constitutive relationship of each fiber on the cross-section remain consistent;
(4)
Neglects the effects of bond slip and shear slip;
(5)
Assumes that torsion is elastic and uncoupled from bending moment and axial force.

2.2.2. Beam–Column Fiber Element Setting

The calculation iteration of Perform-3D is easy to converge, and its algorithm has been verified through extensive engineering practices, resulting in the high reliability of outcomes. It has been widely recognized in the analysis of complex structures such as super high-rise buildings and out-of-code high-rise buildings [24,25,26,27,28,29,30,31,32,33,34]. In contrast, the OpenSees software is more commonly used in member-level analysis or the analysis of small-scale structures [35,36,37,38,39,40,41]. In this paper, PERFORM-3D 9 is selected for the elastic–plastic analysis of the building during the modeling process. Meanwhile, the PBSD 1 software is adopted to assist in relevant modeling and post-processing tasks.
The fiber element model usually integrates the elements to obtain the force–displacement relation of the whole cross-section, which better takes into account the compressionbuckling coupling nonlinearity of the cross-section than the plastic hinge model. Compared with solid elements, fiber elements adopt fewer degrees of freedom, can better reflect the elastic–plastic changes of buildings, and have higher accuracy [42,43,44]. The concrete fiber area is determined according to the member size and the number of concrete fibers, while the reinforcement fiber area is obtained by calculating the total area of the actual reinforcement and dividing it by the number of reinforcement fibers. After determining the area of each fiber, a mathematical method is used to find the fiber coordinates.
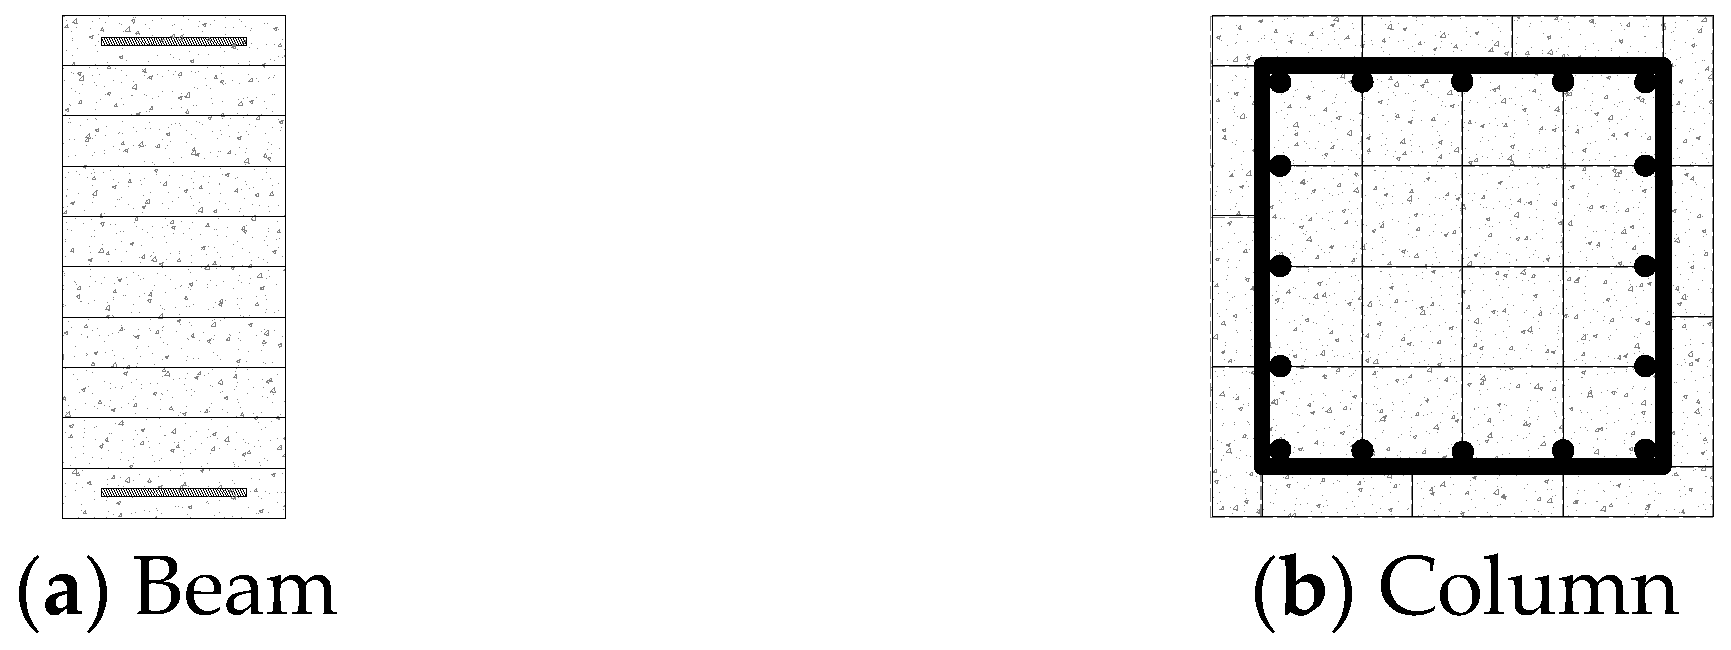
Beam members are divided along the longitudinal direction of the cross-section, considering only unidirectional PM action. Ordinary column members are divided considering two-directional, i.e., P–M–M, action. Figure 5 presents a schematic of the beams–columns fiber element division.
For the cross-section of the ST-RC column, the fiber division details are as follows: 8 fibers are assigned to unconfined concrete, 16 to confined concrete, 4 to the concrete inside the steel tube, 16 to the steel reinforcement, and 14 to the steel tube. The schematic of how fiber elements are divided is presented in Figure 6.
When applying fiber models in this paper, the axial elongation effect of beams and columns is considered to ensure the accuracy of this study [23,45]. Setting a rigid spacer constraint can limit the axial elongation effect of the element; however, the constraint will give an infinite constraint limit when the member produces axial deformation, which is clearly unrealistic. To solve this problem, this paper adopts the addition of an axial release hinge at the end of the element to release the axial stiffness and ensure the scientific nature of this study.

2.3. Definition and Fitting of Material Constitutive

2.3.1. Definition and Fitting of Concrete Constitutive

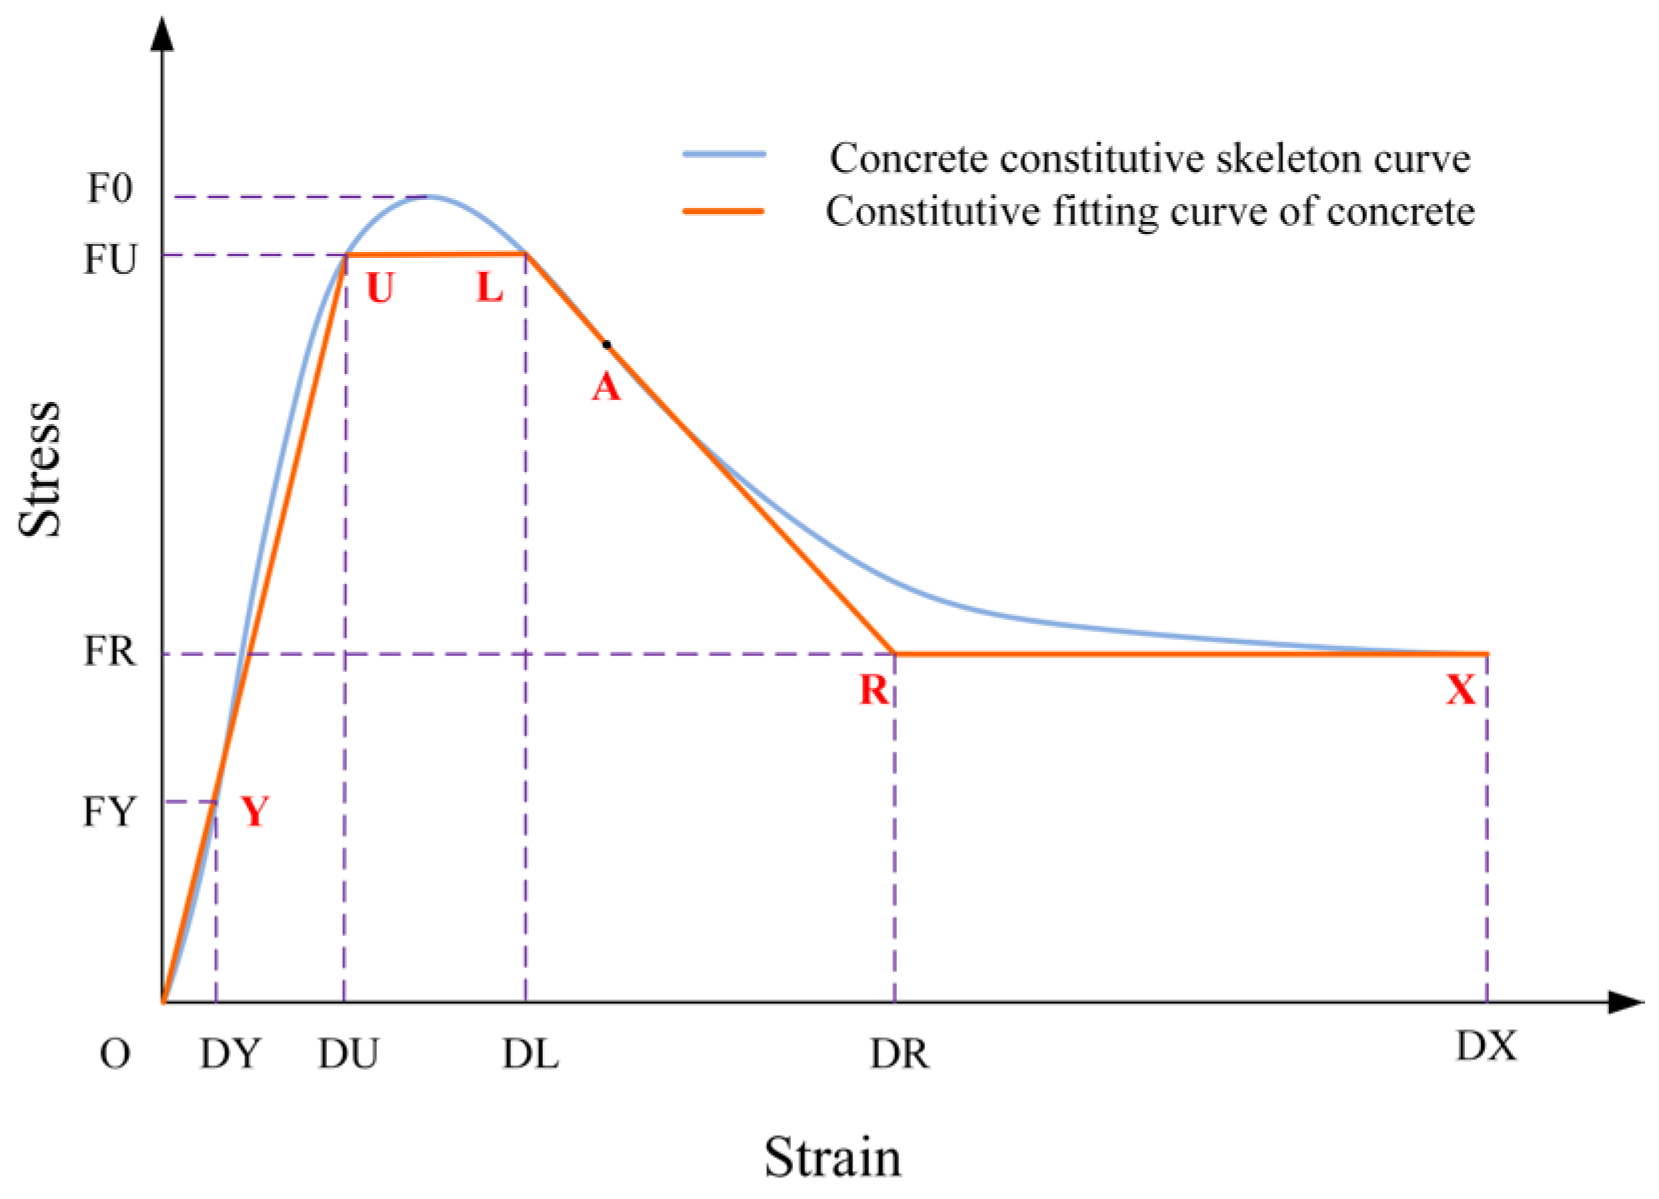
PERFORM-3D only provides generalized material constitutive skeleton curves. In this paper, the concrete constitutive skeleton curve is chosen considering the strength loss and not considering the tension strength. Figure 7 shows the skeleton curve. It is necessary to fit the constitutive relation of different compressive strength grades of concrete to the skeleton curve that can be used by the software. Therefore, Figure 7 shows the fitting of the concrete constitutive model, where point Y is the linear proportional limit point of concrete; the slope of the OY segment is the elastic modulus of the concrete, E, the YU segment is the stable crack development segment of the concrete, point U is the yield point of the concrete, the UL segment is the platform segment where the concrete stress remains unchanged while the strain increases, point L serves as the terminal point of the platform segment, the LR segment is where the bearing capacity of the concrete materials begins to decrease, point R is the starting point of the residual bearing capacity of the concrete, and X is the failure point of the concrete materials.
According to the provisions of the Chinese Standard, GB 50010-2010, the code for the design of concrete structures [46], the average value of the relevant material parameters is selected for the structural elastic–plastic analysis.
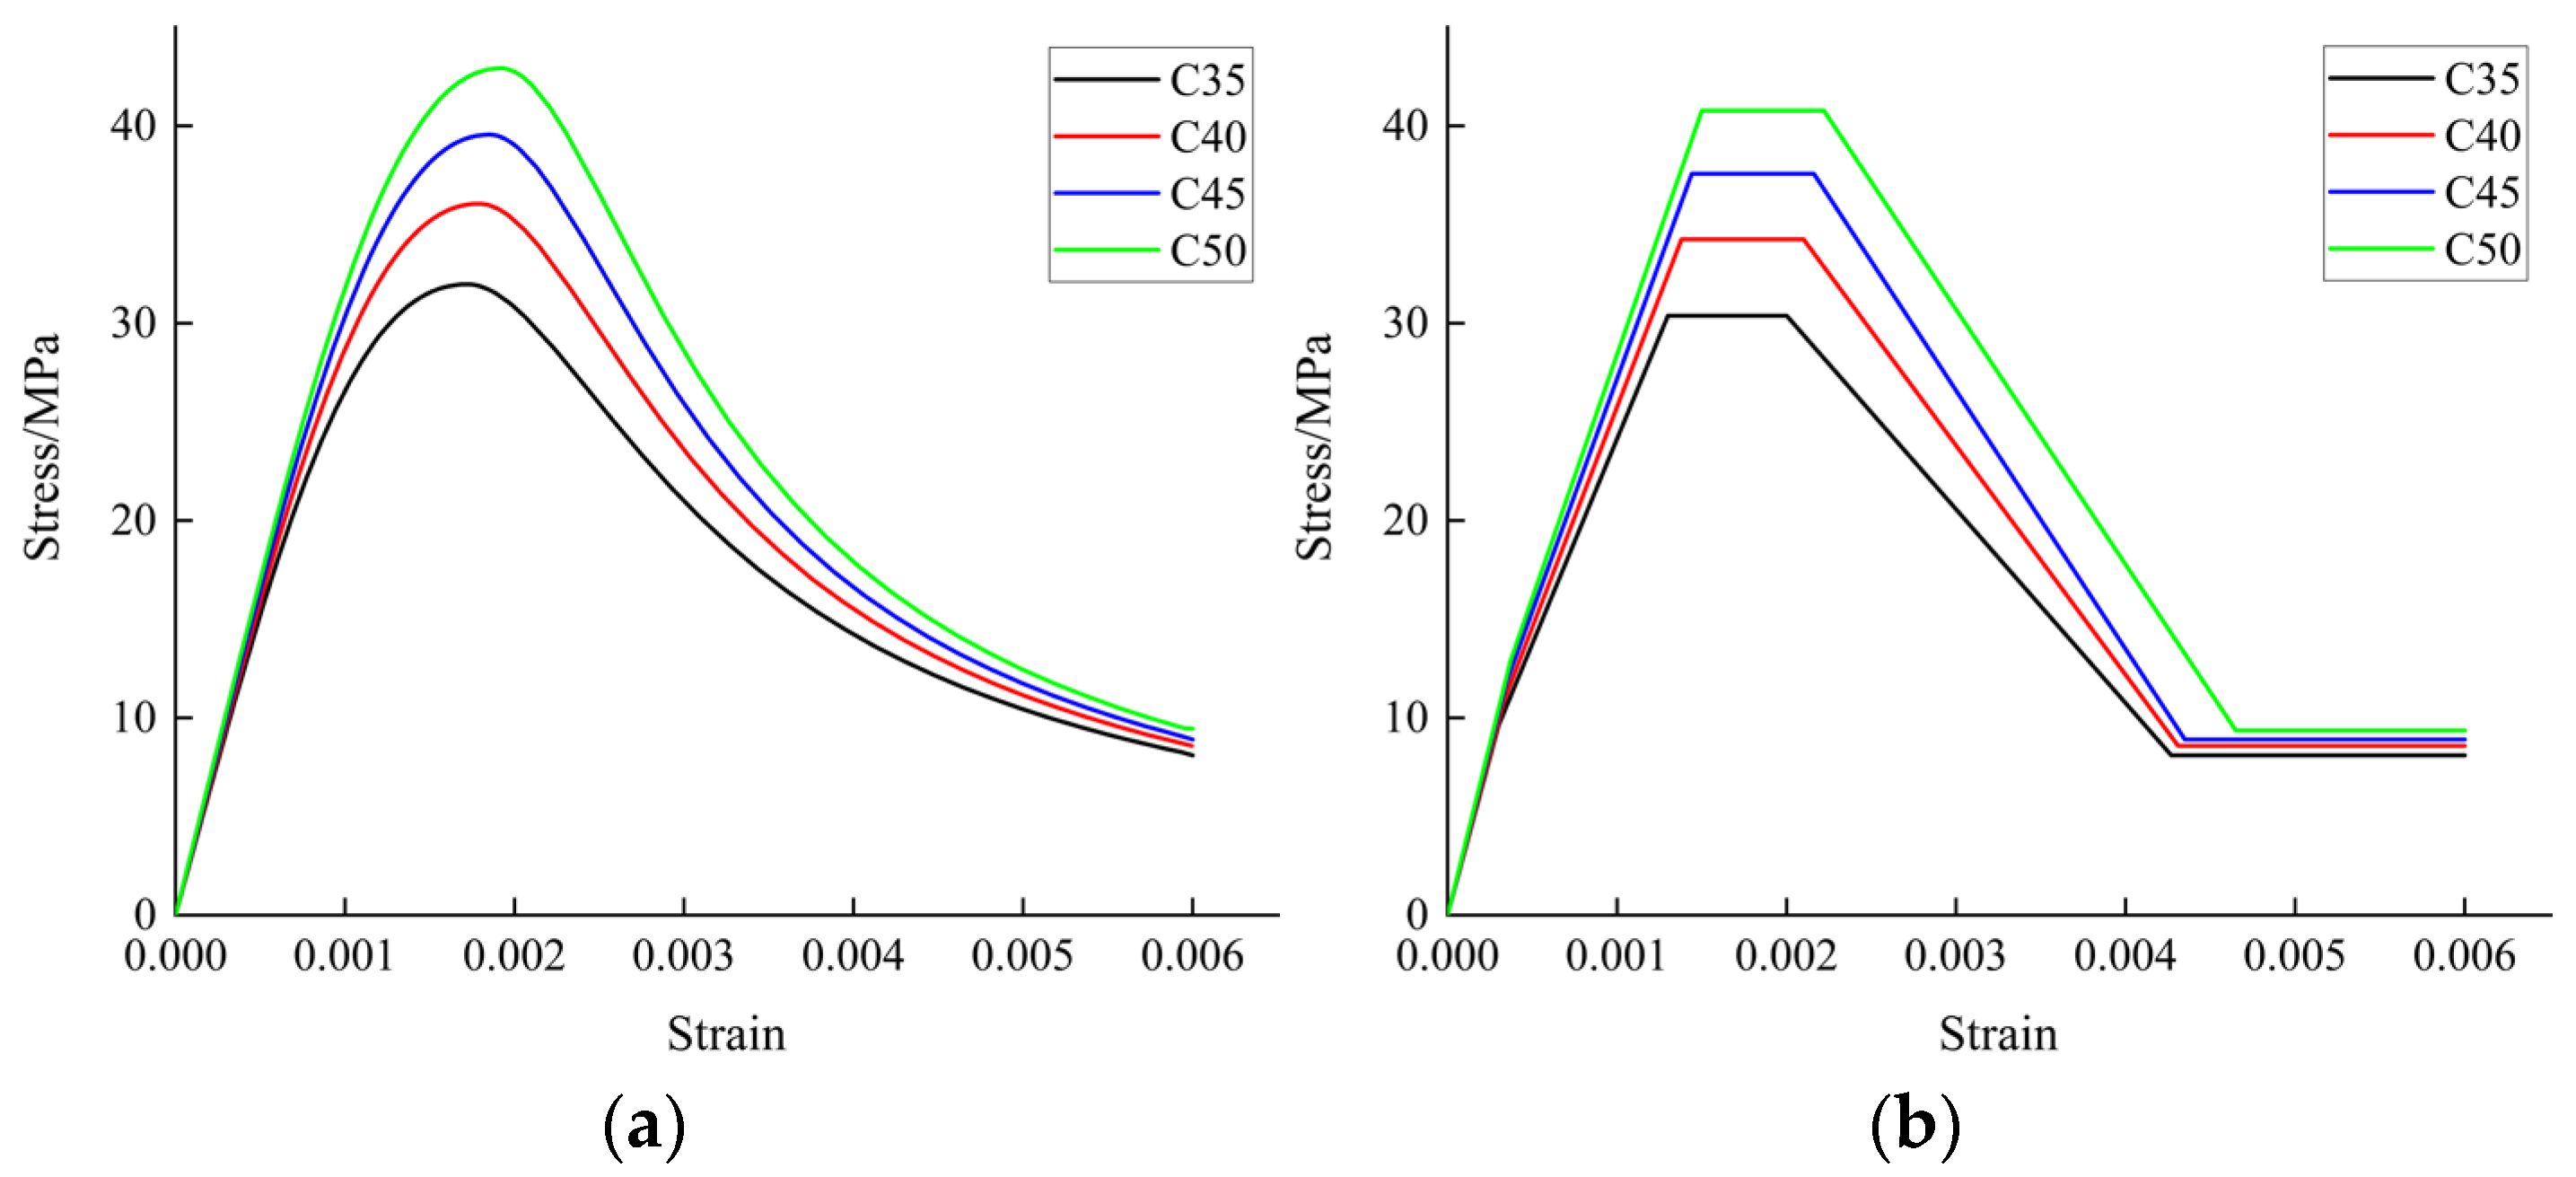
The Simple model [46] is used for the selection of the fitting of the unconfined concrete constitutive model. It should be added that GB 50010 specifies that the average values of the material-related parameters shall be selected for the elastic–plastic calculation of buildings, as shown in Equation (2), and the average compressive strength of each concrete calculated is shown in Table 5. Based on the Simple model and the average concrete compressive strength values derived from Table 5, the unconfined concrete compressive strength curve was obtained and is shown in Figure 8a. Based on the fitting relation shown in Figure 7, the fitting of the unconfined concrete constitutive curve is obtained and is shown in Figure 8b.
f cm = f cuk / ( 1 1.645 δ c )
where f cm —average value,
  • f cuk —standard value,
  • δ c —coefficient of variation.
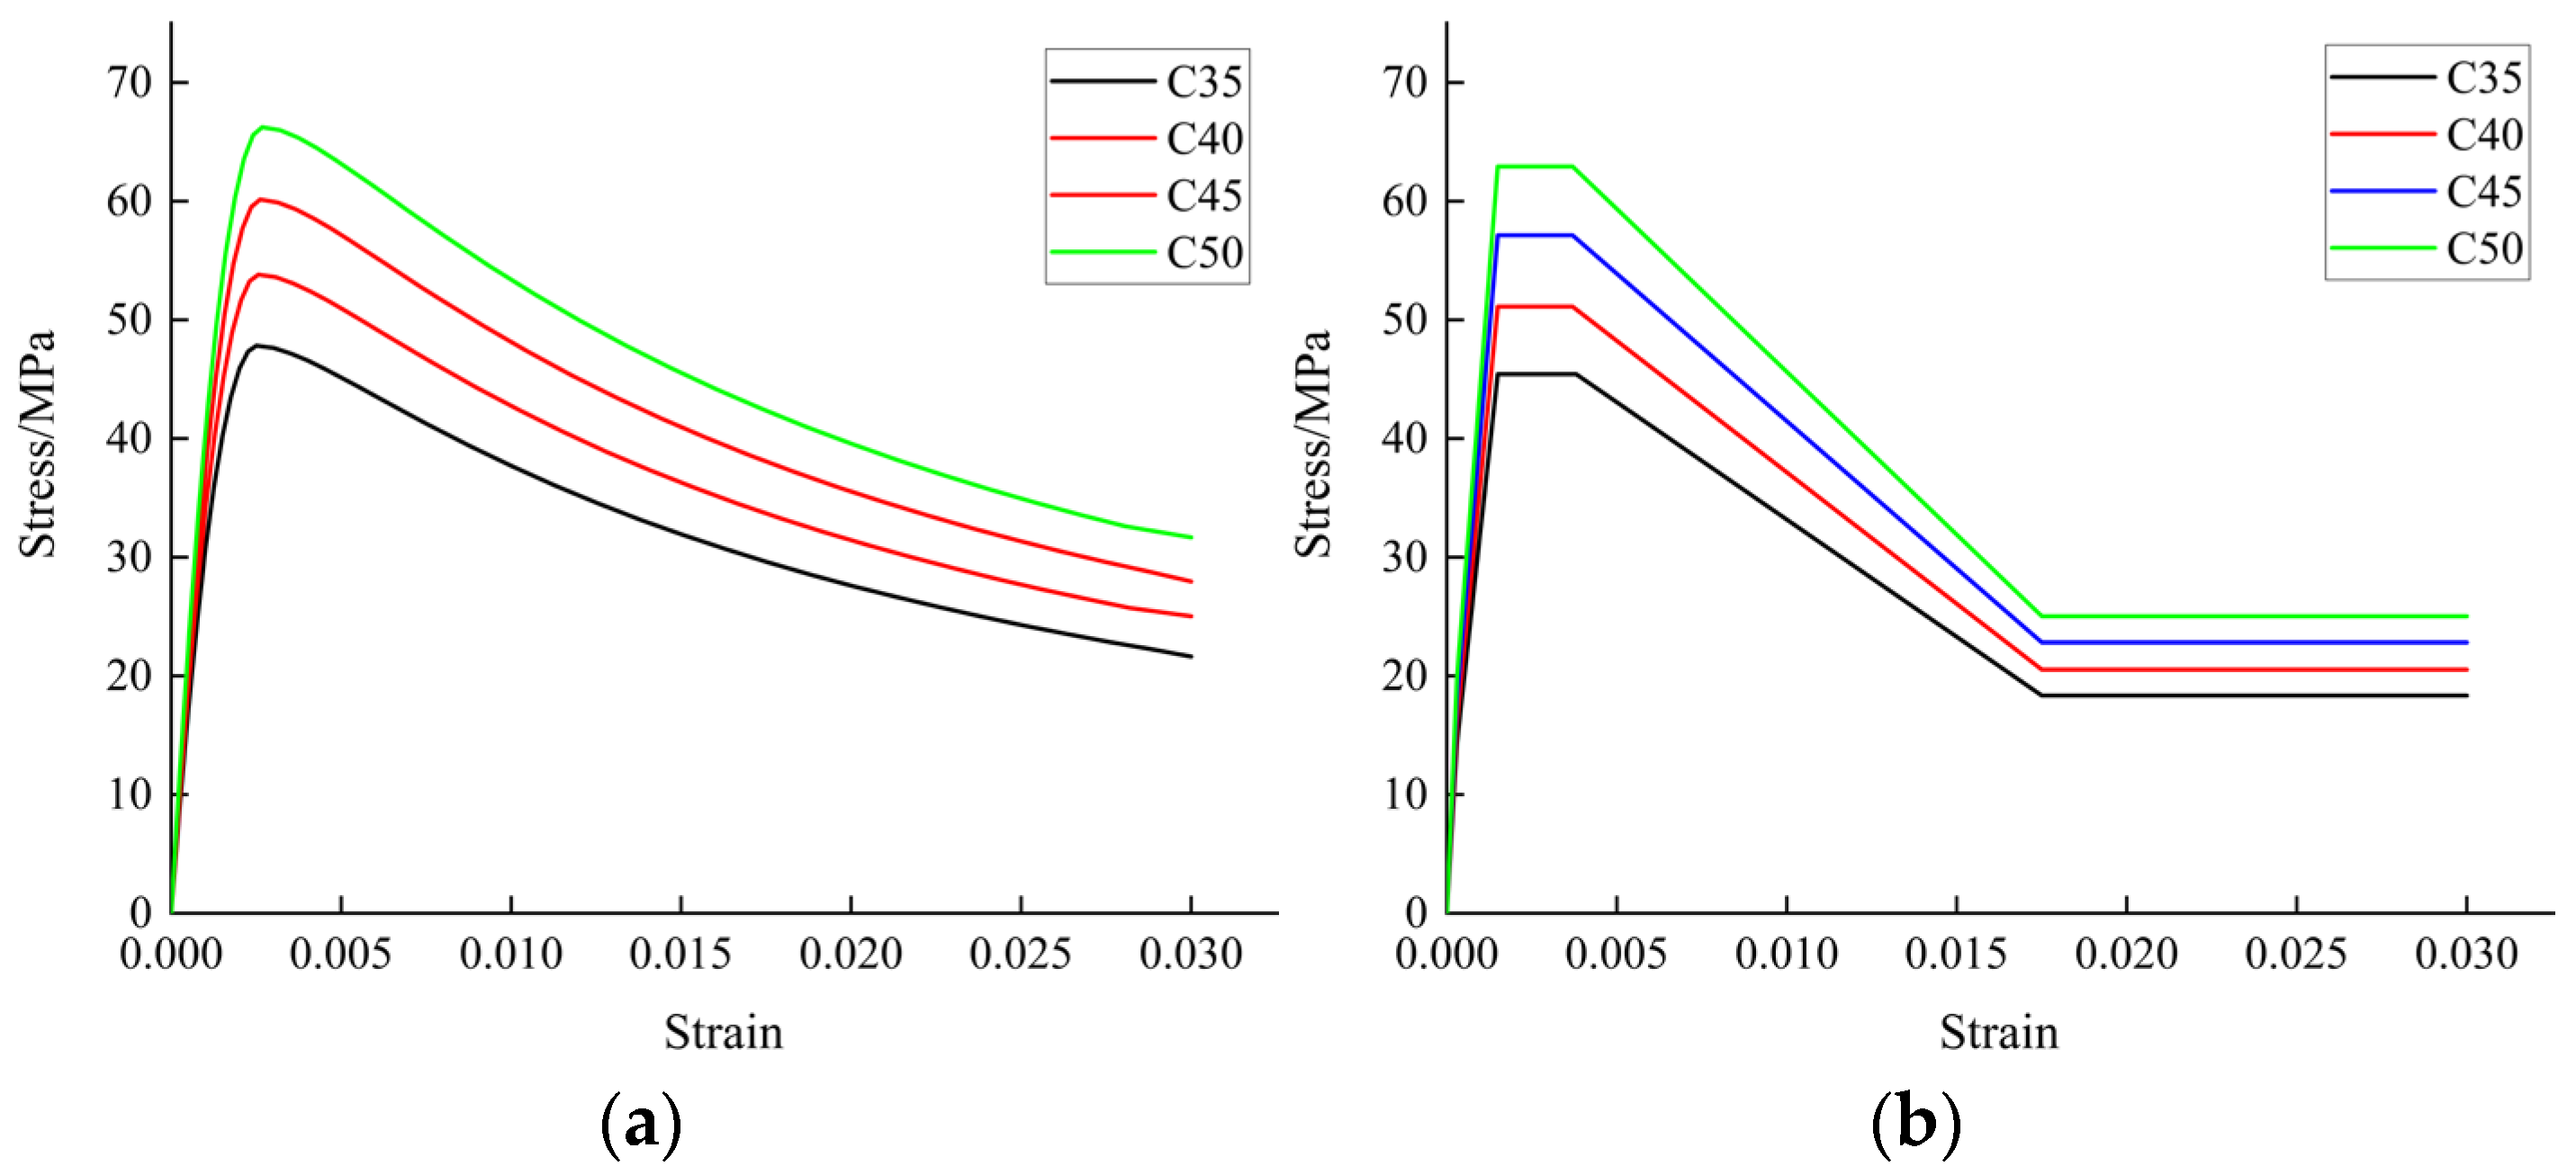
The confined concrete constitutive model is selected from the Mander model [47], which considers the constraining effect of the stirrup on the concrete. The Mander model uses the compressive strength of concrete cylinders as the characteristic value of axial compressive strength. Reference [48] provides the formula, which is shown in Equation (3). After obtaining the characteristic value of concrete cylinder compressive strength, the average value is calculated according to Equation (2). The average value of the compressive strength of each concrete is calculated and is shown in Table 6. Based on the Mander model and the average value of the compressive strength of the concrete derived from Table 6, the compressive strength curve of the constrained concrete is obtained and is shown in Figure 9a. From the fitting relation shown in Figure 7, the fitting of confined concrete constitutive curve is obtained and is shown in Figure 9b.
f ck = 0.79 f cuk
where f ck —concrete cylinder compressive strength standard value,
  • f cuk —concrete cube compressive strength standard value.
The uniaxial compression model was chosen from the literature for the concrete constitutive inside the steel tube [49]. The model considers the magnitude of the constraints to which the concrete in the core can be subjected by the steel tube, and the compressive strength curve of the concrete in the steel tube is obtained and is shown in Figure 10a. According to the fitting relation shown in Figure 7, the concrete fitting in the steel tube can be obtained after fitting the constitutive skeleton curve as shown in Figure 10b.
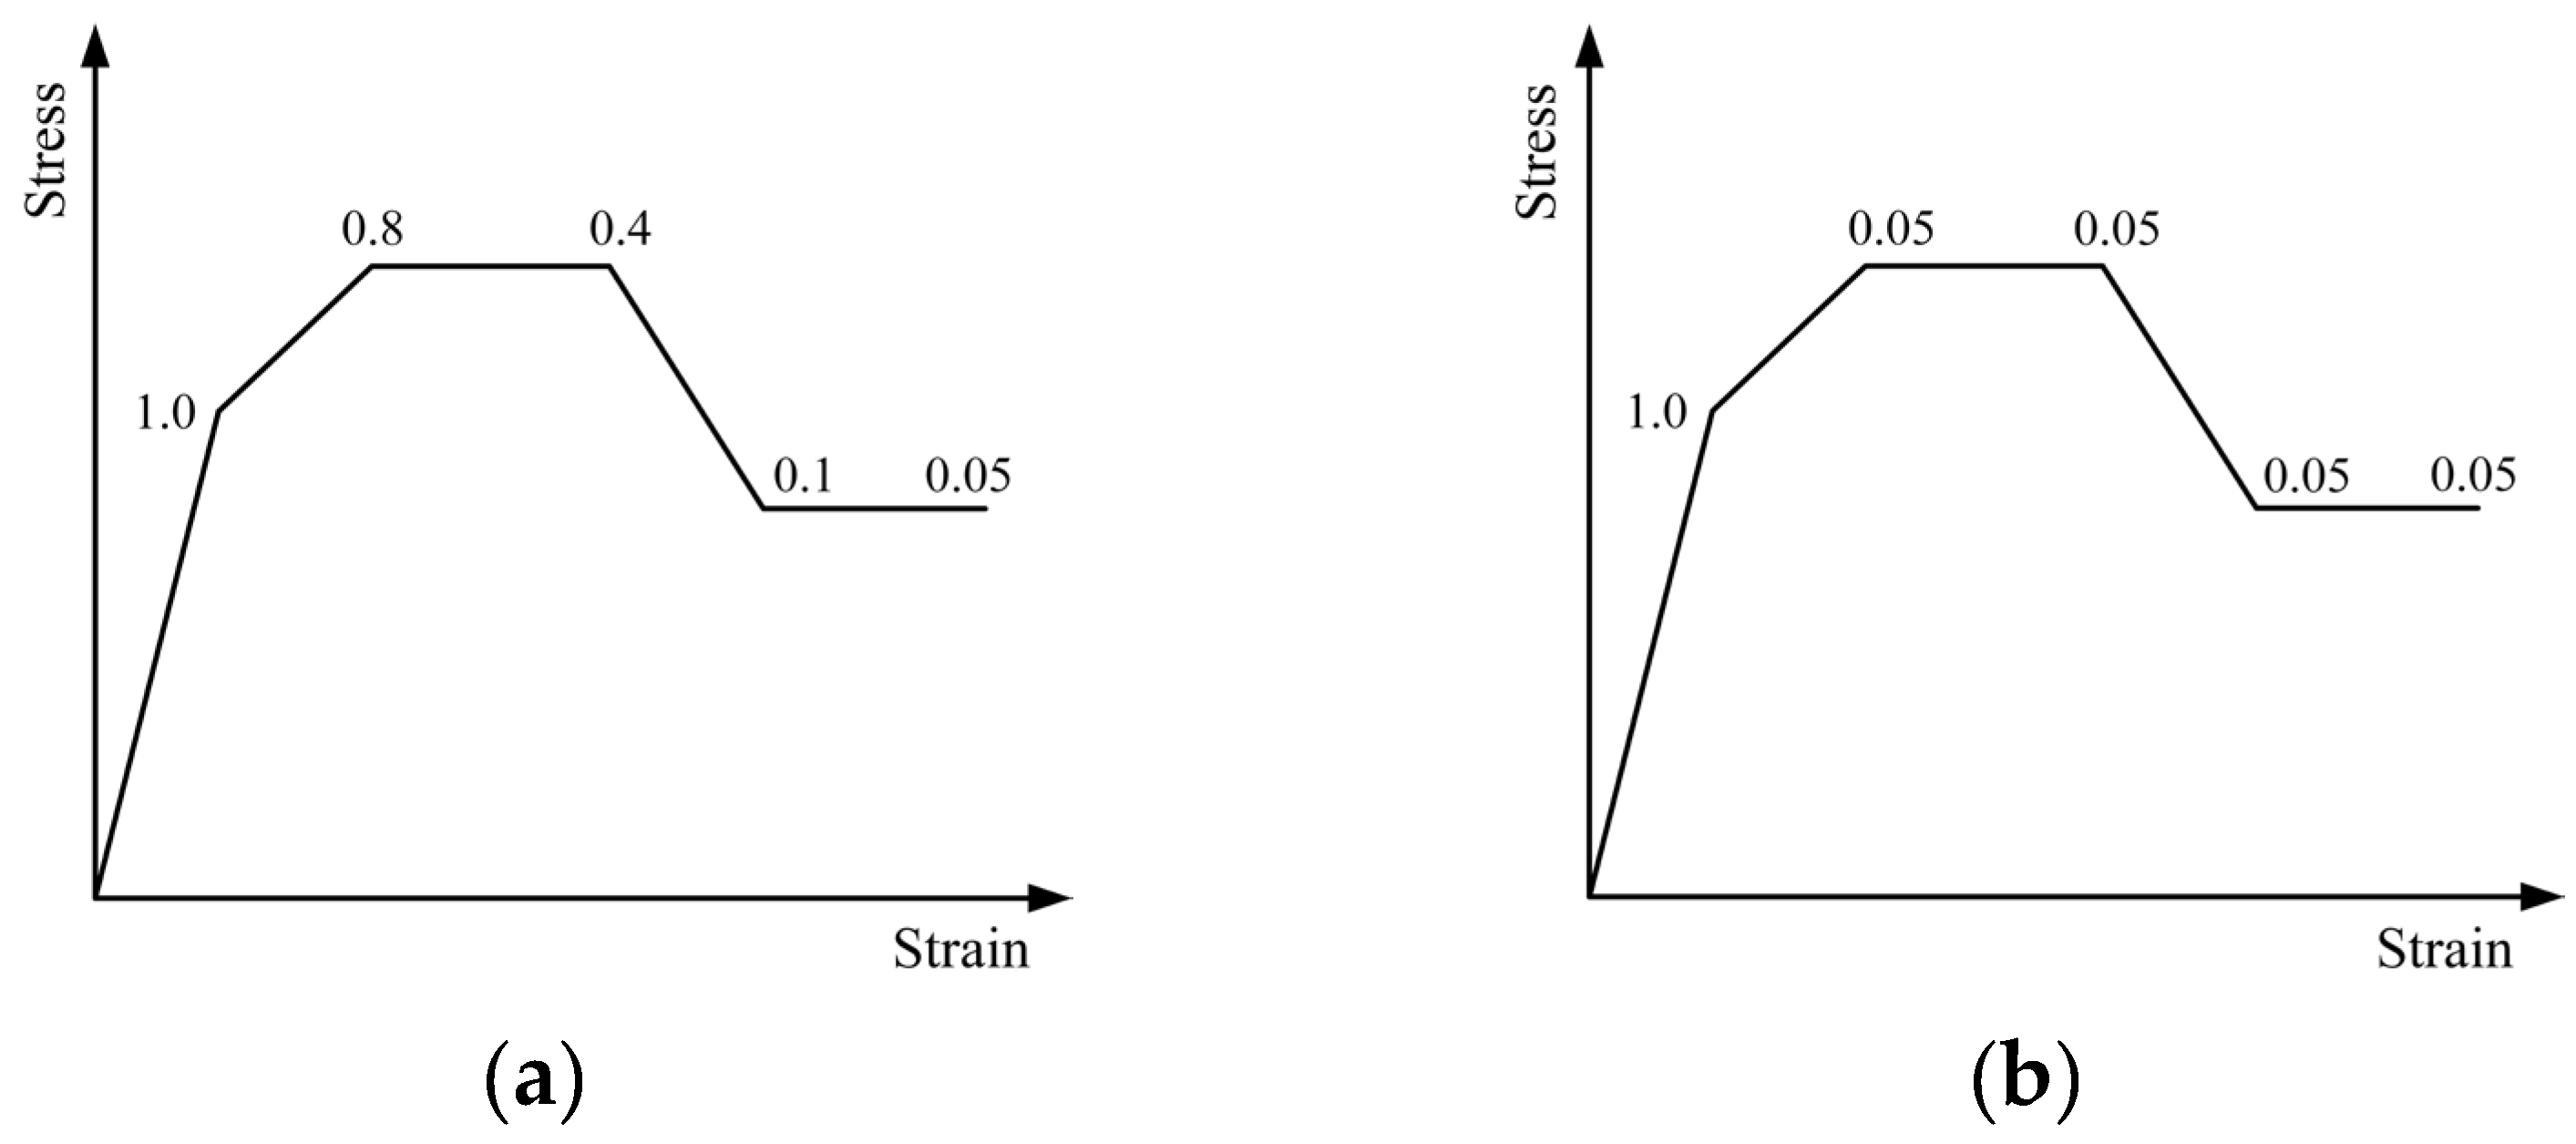
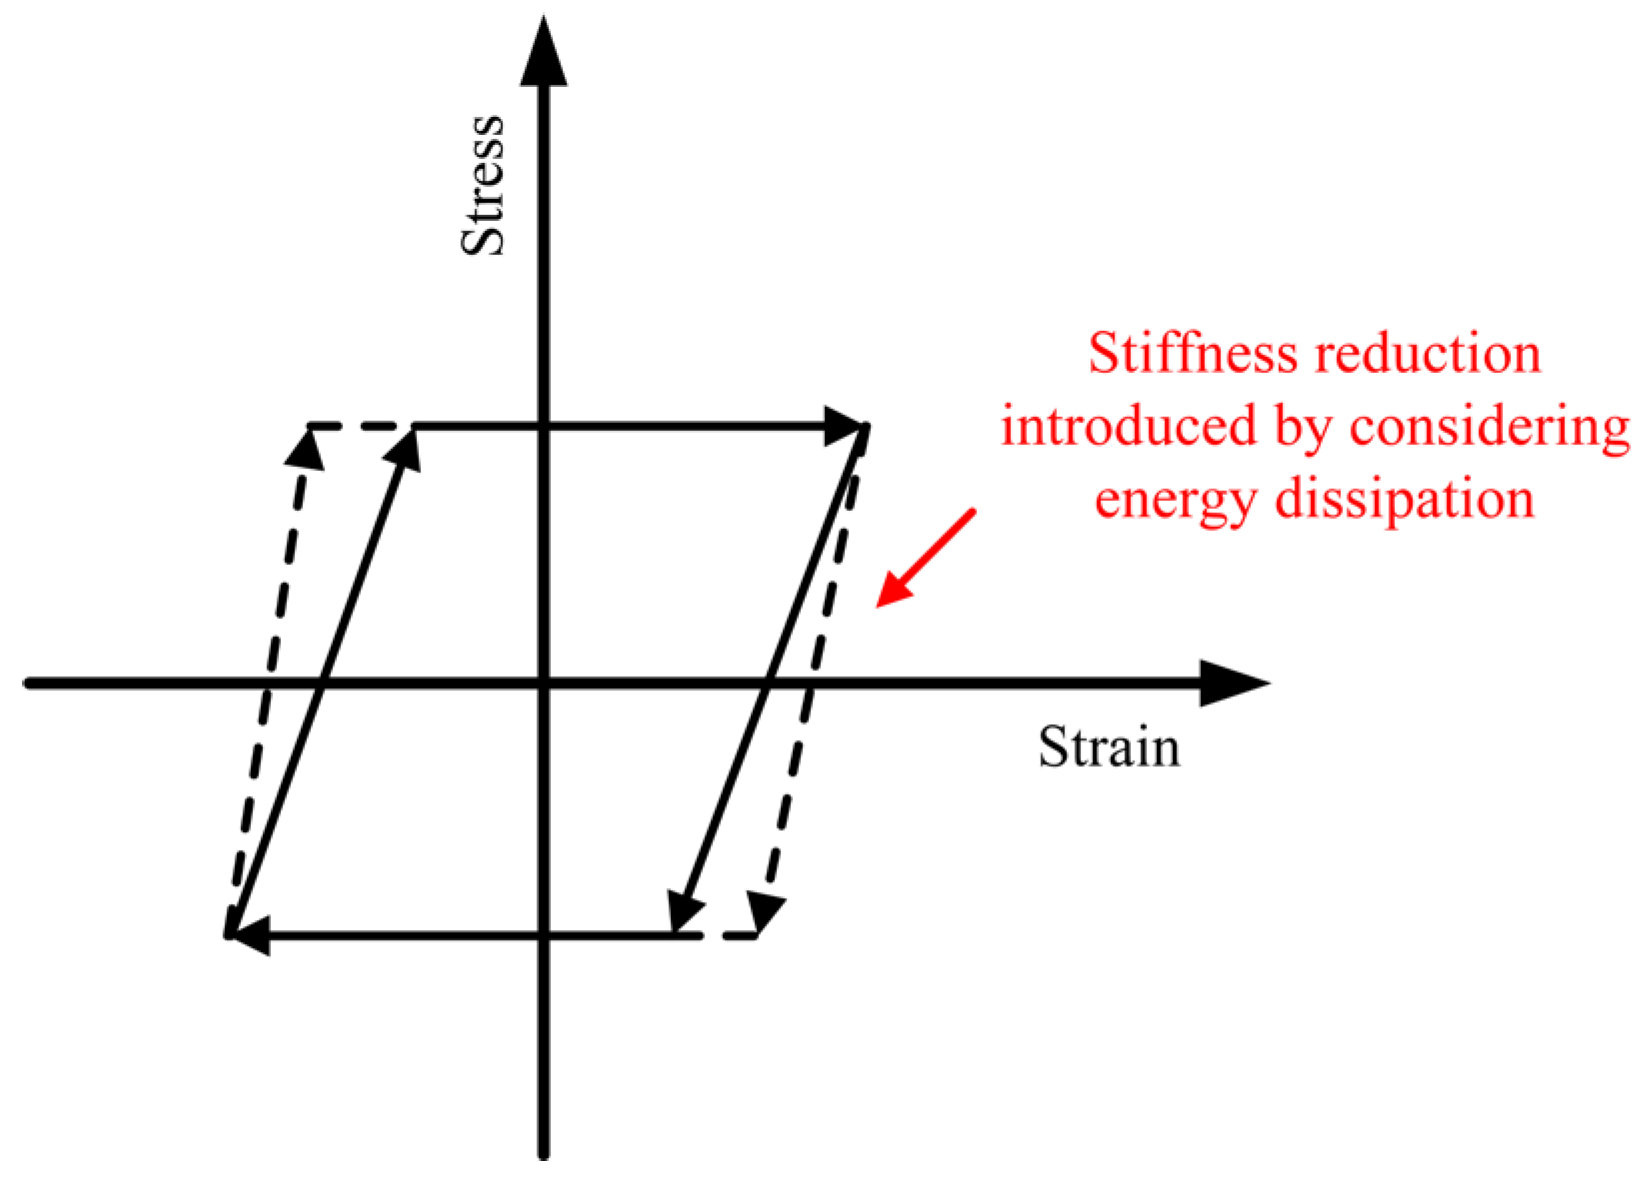
The hysteretic behavior of stress–strain is considered by defining the cyclic energy degradation coefficient e. With reference to [49], Figure 11 shows the energy dissipation coefficients of concrete at different stages.

2.3.2. Definition of Steel Constitutive Model and Hysteresis Loop

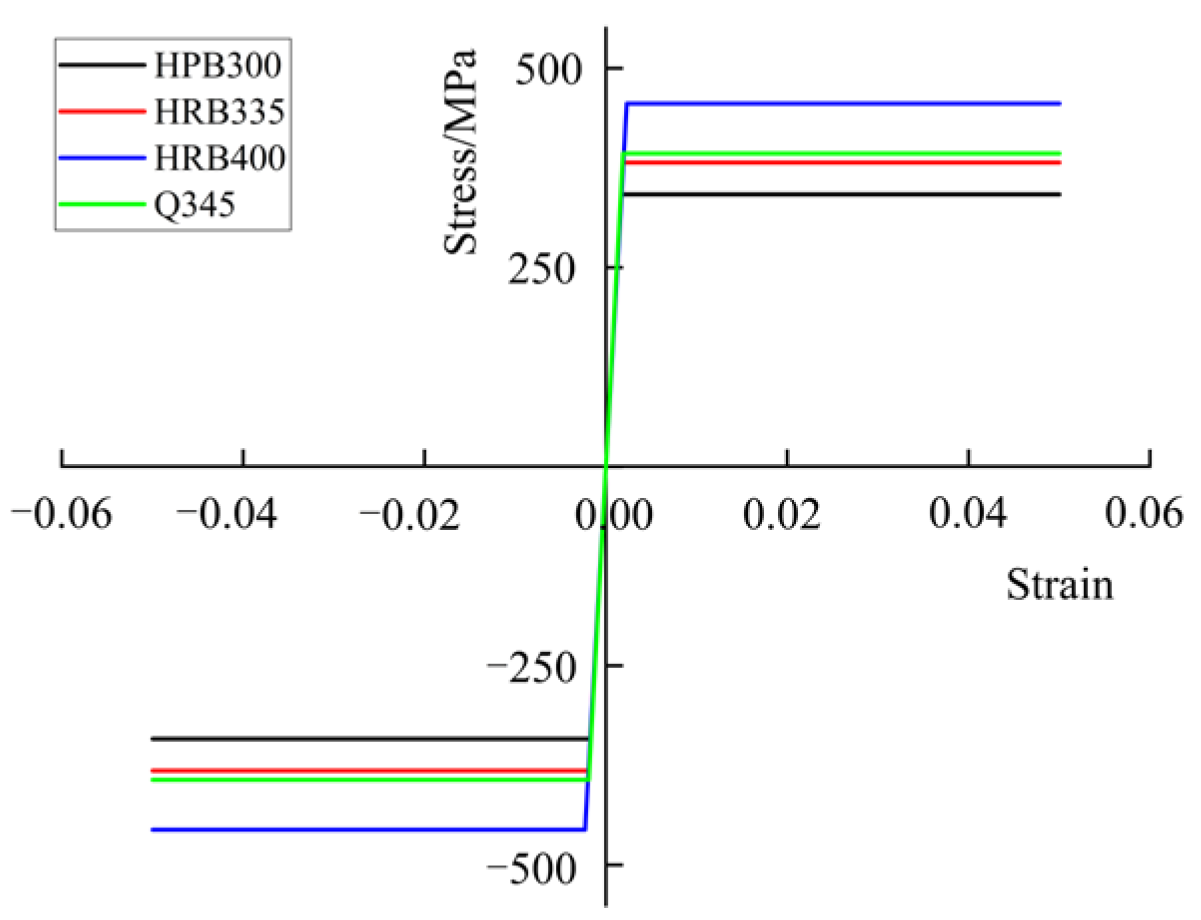
The “EPP” model, which does not consider the loss of strength, was chosen for the constitutive skeleton curve of the steel. The average value of steel strength, fm, is chosen for the calculation, and the variation coefficient δs is taken as 7.43%. The steel tube is a Q345 type, with a thickness and yield strength of 14 mm and 345 MPa, respectively. Table 7 summarizes the calculation results.
The determination of the constitutive skeleton curve of steel requires the modulus of elasticity Es, the yield stress DY, the yield strain DU, and the maximum strain DX. The maximum strain, DX, of the steel is taken as 0.05. Table 8 summarizes the specific values of the steel principal parameters, and Figure 12 shows the skeleton curve of this steel.
Figure 13 shows the ideal elastic–plastic hysteretic “EPP” model for steel stiffness degradation. According to [50], the values assigned to the e for steel are 1.0, 0.85, 1.0, 0.95, and 0.9, in that order.

2.4. Selection of Seismic Waves

The number of actual seismic records available at the proposed project site is relatively limited; therefore, this study adopts a combined approach using natural waves and artificial waves. The number of actual waves shall not be less than 2/3 of the total number.
The selection of appropriate seismic waves requires consideration of relevant parameters, namely the spectral characteristics, the duration, and the amplitude of the seismic waves.
The spectral characteristics of seismic waves are mostly described by the shape of the acceleration response spectrum. The selected set of seismic waves is input into the building, and through an elastic analysis during minor earthquakes, the seismic waves that match the structural characteristics are selected.
The effective duration shall not be less than five times the first natural vibration period of the structure.
It is necessary to adjust the maximum acceleration of natural waves to meet the peak value corresponding to the fortification intensity. All the above requirements for seismic waves selection comply with the code [4].
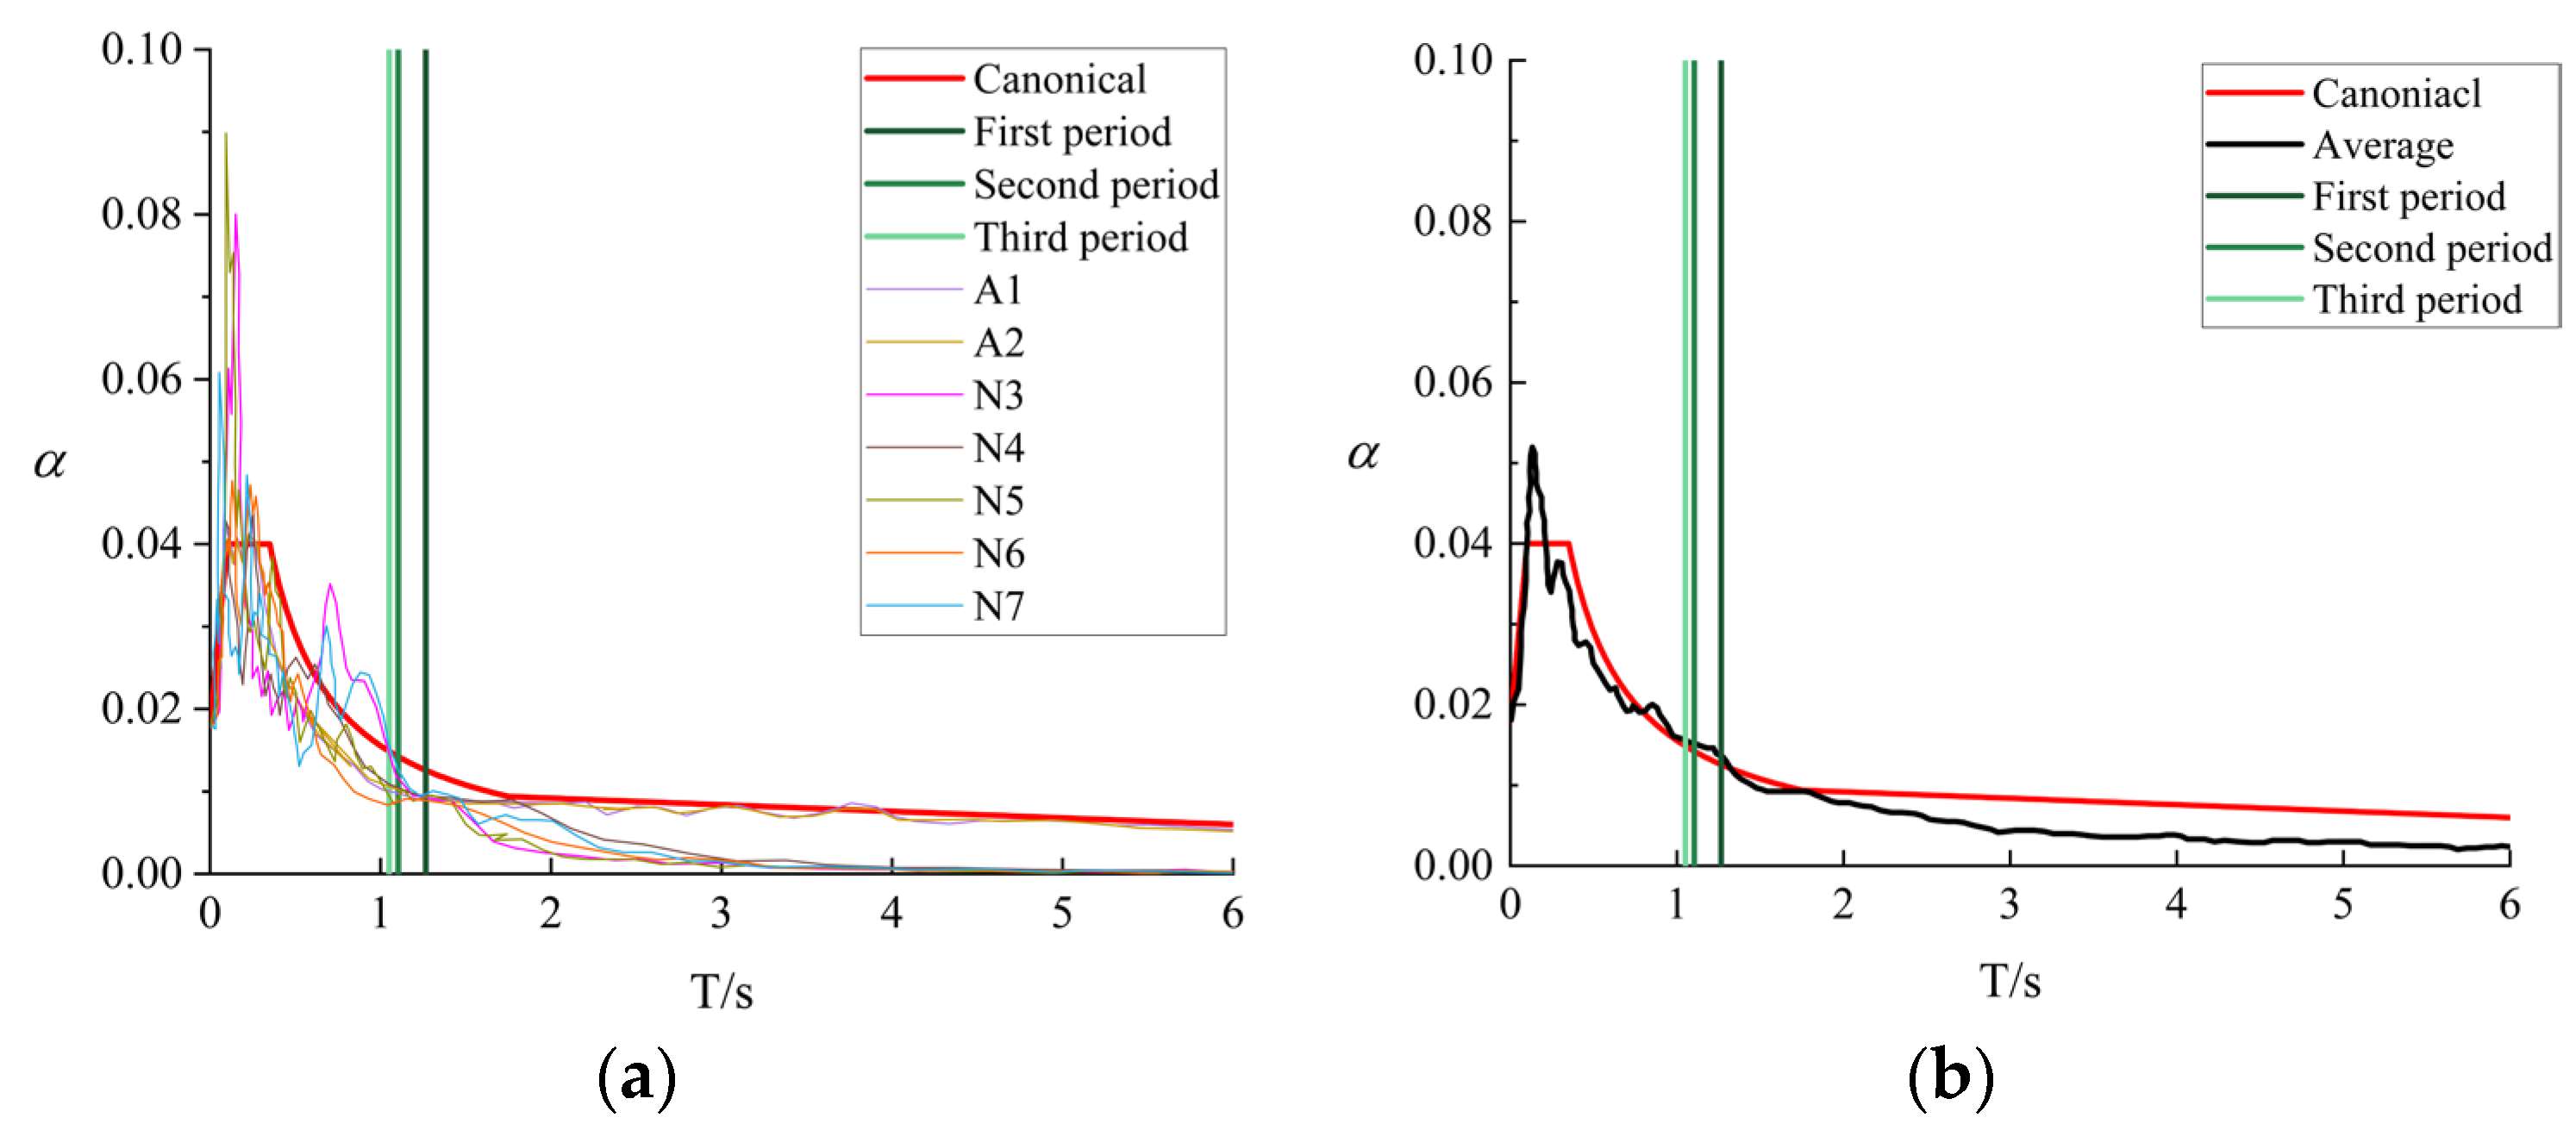
Table 9 presents two artificial waves and five natural waves. Table 10 presents the deviation statistics of the ground vibration response spectra from the canonical response spectra, where a small error can be observed between the two.
Figure 14a,b show the comparison between the multi-wave response spectra and the canonical response spectra and the comparison between the average response spectra and canonical response spectra, respectively. As shown in the figure, it can be seen that the curves match well, indicating that the selected seismic waves are more appropriate.
The seismic fortification intensity of the building is 8 degrees, and the peak value of the seismic wave needs to be adjusted to 400 cm/s2 during rare earthquakes. Considering the bidirectional seismic action, the seismic intensities in the two directions are input at a ratio of 1:0.85. Then, seismic waves in the horizontal directions of 0°, 30°, 60°, and 90° are input into the building, and the bidirectional seismic waves at each angle shall be applied simultaneously [4], with seven seismic working conditions included in each direction. Elastic–plastic time-history analysis is conducted on the structure to study the influence of ST-RC columns with different confinement coefficients on the seismic performance of the building, and the performance states of the ST-RC columns are evaluated.

2.5. Model Validation

The practical project is an RC frame building with a damping ratio of 0.05. ST-RC columns are adopted for the staggered-story columns in the layout; however, since the staggered story only exists locally, the effect of the steel damping ratio is not considered. According to the previously described constitutive design of concrete and steel, as well as the division principles of fiber elements, finite element modeling is carried out, and the validity of the model is verified through minor earthquake analysis. The seven seismic waves selected above are used to perform the time–history analysis method on the building during an 8 degree frequency earthquake with a computational step size of 0.02 s, a length of 35 s, and a peak acceleration of 70 cm/s2.

2.5.1. Structural Base Shear Force

Table 11 shows the structural base shear force calculated by the time–history analysis and the mode analysis method during frequent earthquakes. It can be seen that the base shear force and the average value of the base shear force during seven seismic waves are 84–106% of the base shear obtained by the mode analysis method, which meets the requirements of the code [4]. The coefficients of variation for base shear are 11.37% in the X-direction and 6.32% in the Y-direction, complying with the 15% variability threshold specified in FEMA P-695 for time–history analysis acceptability [51].

2.5.2. Structural Inter-Story Drift Ratios

Figure 15 shows the inter-story drift ratios of the structure in the X- and Y-directions. The inter-story drift ratios in both of the horizontal directions are far less than 1/550 of the limit value [4], which meets the requirements of the specifications. At the same time, it can also be seen that there are inflection points in the displacement of the structure in the second, third, and fourth layers.
Based on Figure 15, Table 12 presents the statistical indicators of the inter-story drift ratios during the seven seismic waves, with coefficients of variation below the 15% threshold for all stories in both the X- and Y-directions [51], confirming a statistically reliable overall structural performance.

3. Seismic Performance Evaluation on Confinement Coefficients of Staggered Columns

In practical engineering, the staggered-floor frame structure exhibits prominent shear force values due to the presence of short columns, which are prone to damage during seismic action. However, the utilization of ST-RC columns helps overcome the problem of inadequate ductility associated with short members. The high ductility is the result of the combined effect of three factors: “constraint enhancement”, “material synergy”, and “energy dissipation optimization”. The confinement effect of the inner steel tube on the concrete lays the foundation for the plastic deformation; the outer composite layer supplements ductility through steel bar energy dissipation and secondary constraint; and the reasonable design of the composite section and interface synergy ensure stability during the deformation process. Ultimately, the members can withstand a large plastic deformation without sudden failure during seismic action, thus guaranteeing structural stability. Therefore, whether the confinement coefficient design is reasonable determines whether the ST-RC columns can function effectively.

3.1. Definition of Confinement Coefficients for ST-RC Columns

The confinement coefficient θ is defined as the ratio of the product of the area of the steel tube and the design value of the strength of the steel to the product of the area of the concrete and the design value of the strength of the concrete in the cross-section of the member [52], and the formulas are shown in Equations (4) and (5). The proposed ST-RC columns to be studied have an internal and external concrete strength class of C50. Q345 steel is selected and the steel tube dimensions are a diameter D and wall thickness t of 377 mm and 14 mm, respectively. For compressed ST-RC columns, the steel tube diameter D and thickness t should meet the provisions of the “technical code for concrete filled steel tubular structures” [52].
α sc = A s A c
θ = α f f c
where αsc is the steel content of the steel tube concrete elements, As is the cross-sectional area of the steel tube, θ is θ, Ac is the cross-sectional area of the concrete in the steel tube, and f is the yield strength of the steel tube.
For the purpose of studying how θ influences the columns in a staggered-story building, the t of the columns is kept constant and the D is adjusted; it is divided into four groups, where the third group is the original θ of the columns, as shown in Table 13.
As presented in Table 13, the D/t ratio of the five ST-RC columns is not greater than 91.96, meeting the code [52] requirements. The θ values of the four groups of ST-RC columns are between 1.087 and 1.307, which is more reasonable.

3.2. Determination of Key Column Members

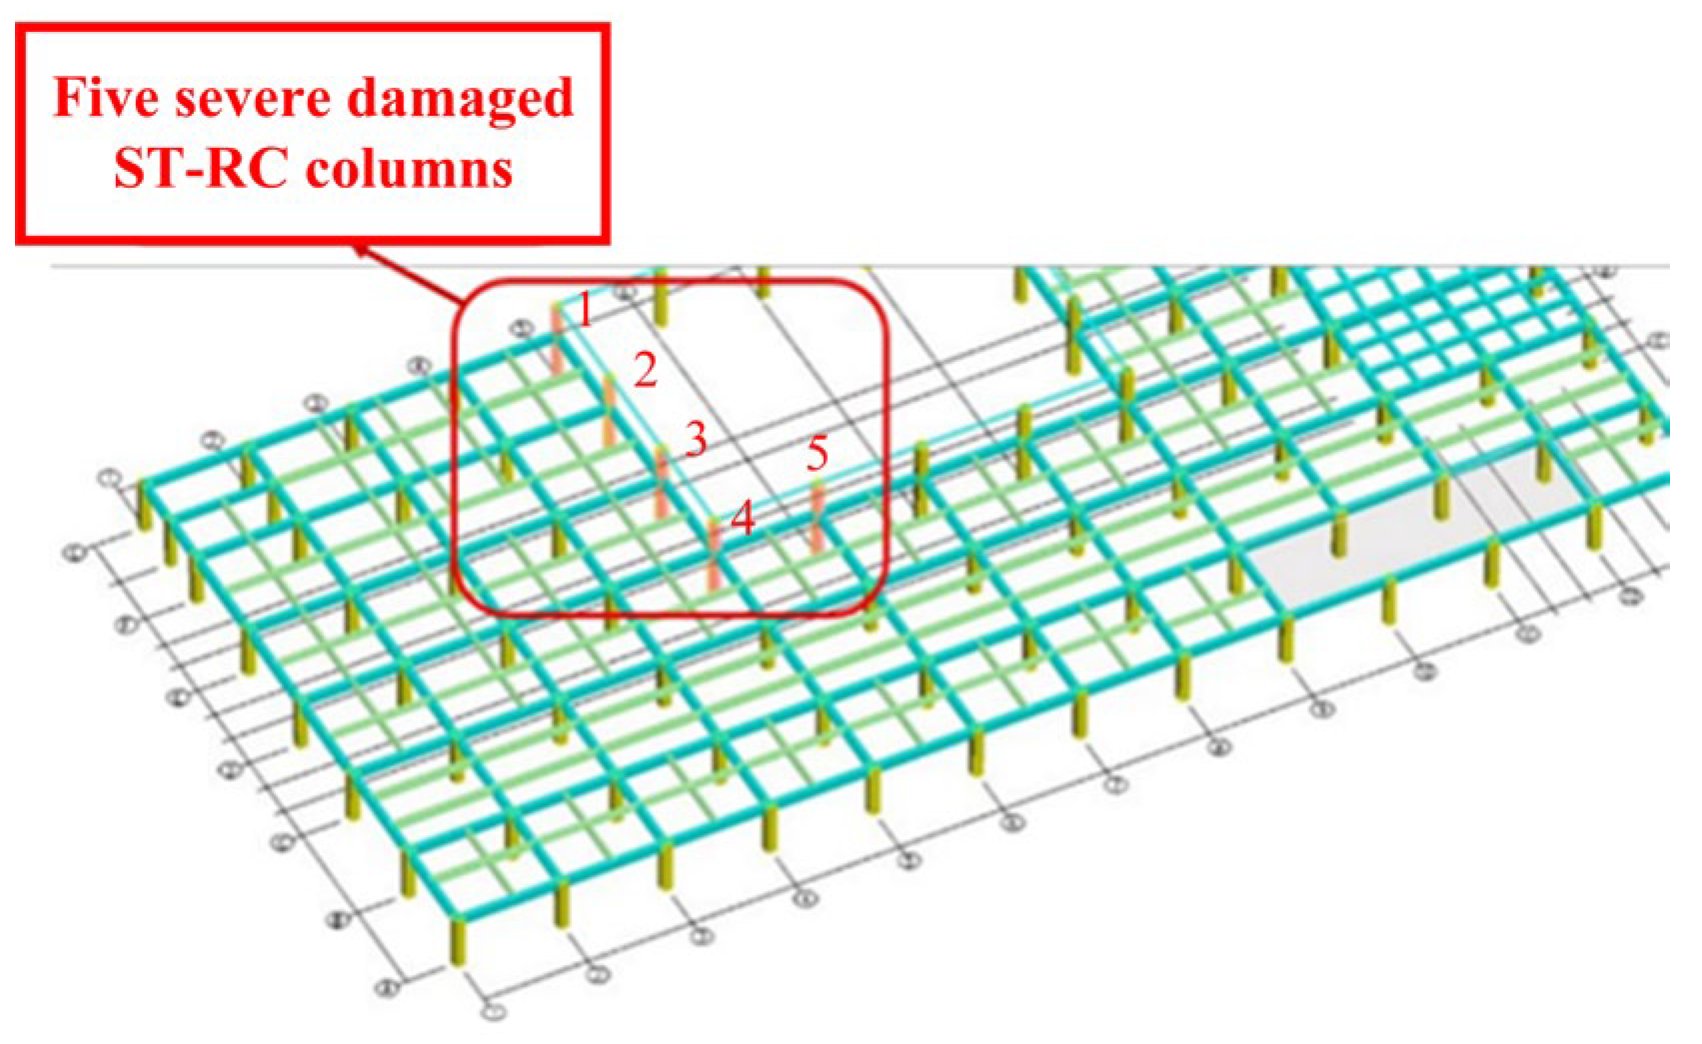
Based on the elastic–plastic analysis results [53], Figure 16 presents the five most severely damaged ST-RC columns. By varying the steel tube diameter of these five columns, the influence of θ on the seismic performance of the columns is studied, thereby evaluating the damage status of the columns.

3.3. Classification of Performance Evaluation for ST-RC Column Members

The seismic evaluation is conducted using a performance-based evaluation method, combined with multi-level performance objectives formulated based on the building’s functional classification and service requirements. The minimum seismic performance level of the structure during rare earthquakes is Level 4. At this Level, key components suffer mild damage, ordinary vertical components and important horizontal components experience partial moderate damage, and energy-dissipating components sustain moderate or partial severe damage [54].
In accordance with “Specification for performance-based seismic design of reinforced concrete building structure” [54], which is based on ASCE 41, column damage mechanisms are classified into three distinct modes based on the shear-to-span ratio and the bending–shear ratio parameters, namely the bending-controlled, bending–shear-controlled, and shear-controlled failure modes. Table 14 presents the division principles for the failure modes of column members.
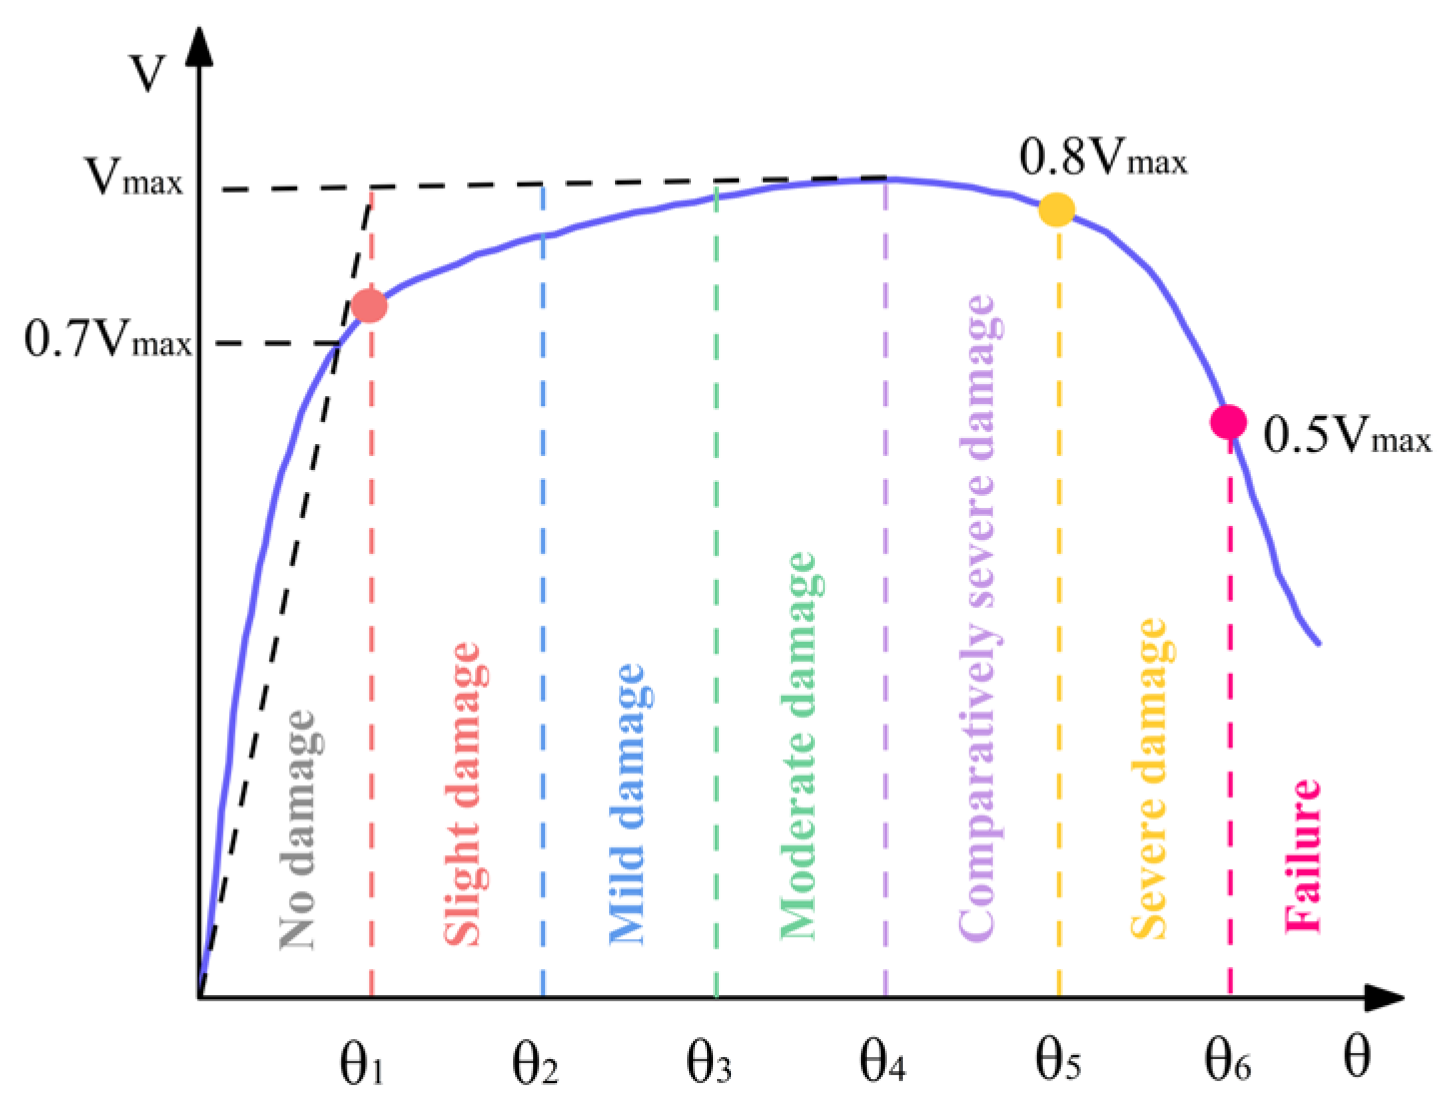
Bending-controlled and bending–shear-controlled failures exhibit ductile behavior, where the plastic displacement angle effectively characterizes both the variation in load-carrying capacity and the degree of damage. The seismic performance of reinforcement concrete members is evaluated through force–inter-story drift ratios (V–θ) skeleton curves, with Figure 17 illustrating the corresponding performance states and the limit of the plastic inter-story drift ratios. The explanation for each limit value in the Figure is as follows; for details, please refer to Reference [55], a book that has referenced codes and standards such as ASCE 41 and Eurocode 8.
“No damage” corresponds to the member being in an elastic state, which aligns with the “no damage under minor earthquakes” requirement in the “three-level seismic fortification criteria”.
“Slight damage” can be considered to correspond to “IO” as defined in FEMA 273. In this state, the structural damage is deemed very limited, and the strength of the main vertical and lateral load-resisting members remains the same as before the earthquake.
“Mild damage” can be regarded as equivalent to the “Damage Control Range” between IO and LS in the U.S. performance level system; however, the value defined herein is a single level limit rather than a range.
“Moderate damage” is considered to occur before reaching the LS level in the U.S. system. In this state, the concrete cover on the member surface peels off over a large area, while the core concrete is not severely crushed. Timely repair is required for the structure to continue safe use.
“Comparatively severe damage” can be considered equivalent to the “Limited Safety Range” in the U.S. performance levels, but the value herein represents a specific performance level point rather than a range.
“Severe damage” can be regarded as equivalent to the “CP” level. In this state, the structure suffers severe damage: the stiffness and strength of the lateral load-resisting system decrease significantly, and the structure has large residual deformation. However, the degradation of the vertical load-bearing capacity is slight, and the main system for resisting gravity continues to function.
“Failure” means that the load-bearing capacity, stiffness, or stability of a member decreases to a critical state where it can no longer meet the design functional requirements.
The curve in Figure 17 allows for the derivation of the columns’ deformation limits, and Table 15 sets out the elastic–plastic drift angle limits for the columns.
In contrast, shear-controlled failures demonstrate brittle characteristics and must satisfy both shear capacity requirements and minimum shear section criteria. The performance checking method for the shear-controlled members is shown in Table 16.
The formulas for the no yielding check and minimum cross-section check are shown in Equations (6)–(8).
No yielding check:
S GE + S EK R k
Minimum cross-section check:
V GE + V EK 0.15 f ck b h 0
V GE + V EK 0.5 ( f ak A a + f spk A sp ) 0.15 f ck b h 0
For the meanings of the parameters in these Equations, refer to Reference [54].

3.4. Review of Positive Sections of ST-RC Columns

Presented in Table 17 are the statistics regarding the performance states of the ST-RC columns’ positive sections on the building’s second floor, based on the average value of the seismic load cases. All four groups of columns exhibit a positive section deformation that does not surpass moderate damage. With an increase in θ, the damage level of the columns reduces progressively; among these cases, when θ is 1.307 and 1.224, 100% of the columns remain undamaged, reaching the ideal state. From Table 17, it is evident that no column failure has occurred, indicating the absence of collapse in the weak regions of the building.
Table 18 provides statistical data on the performance states of all the ST-RC columns under the average value of the seismic conditions. All the columns meet the criterion that their positive section deformation remains within the range of no moderate damage. A decrease in θ is accompanied by a gradual increase in the damage degree of the columns; this finding indicates that an increase in the steel tube diameter of the columns leads to a reduction in their confinement capacity on the concrete. As shown in Table 18, the second group of columns achieves the optimal performance state. Furthermore, continuing to reduce the diameter will conversely impair the load-bearing capacity of the columns. Therefore, it is recommended that for a staggered-story building, the θ value of the columns should be increased to 1.224 to further minimize the damage state of the members. In the average seismic condition, the columns with four groups of θ values all do not suffer collapse failure.

3.5. Review of Inclined Sections of ST-RC Columns

Table 19 presents the performance status statistics of the inclined sections of the ST-RC columns on the second floor of the structure for the average values of the seismic conditions. The extent of the damage to the columns gradually increases as θ decreases, i.e., the fourth group is the most severely damaged; however, no collapse occurred.
Table 20 presents the performance status statistics of all the ST-RC columns for the average seismic conditions. The capacity of the inclined section that meets the requirements of performance Level 4 does not exceed “minimum cross-section check.” As θ decreases, the degree of the shear damage in the inclined section of the columns gradually increases.

3.6. Shear Analysis of ST-RC Columns

The ST-RC columns circled in Figure 16 are numbered. That is, from the top to the bottom, the columns are ST-RC1, ST-RC2, ST-RC3, and ST-RC4, and the column on the right is ST-RC5.
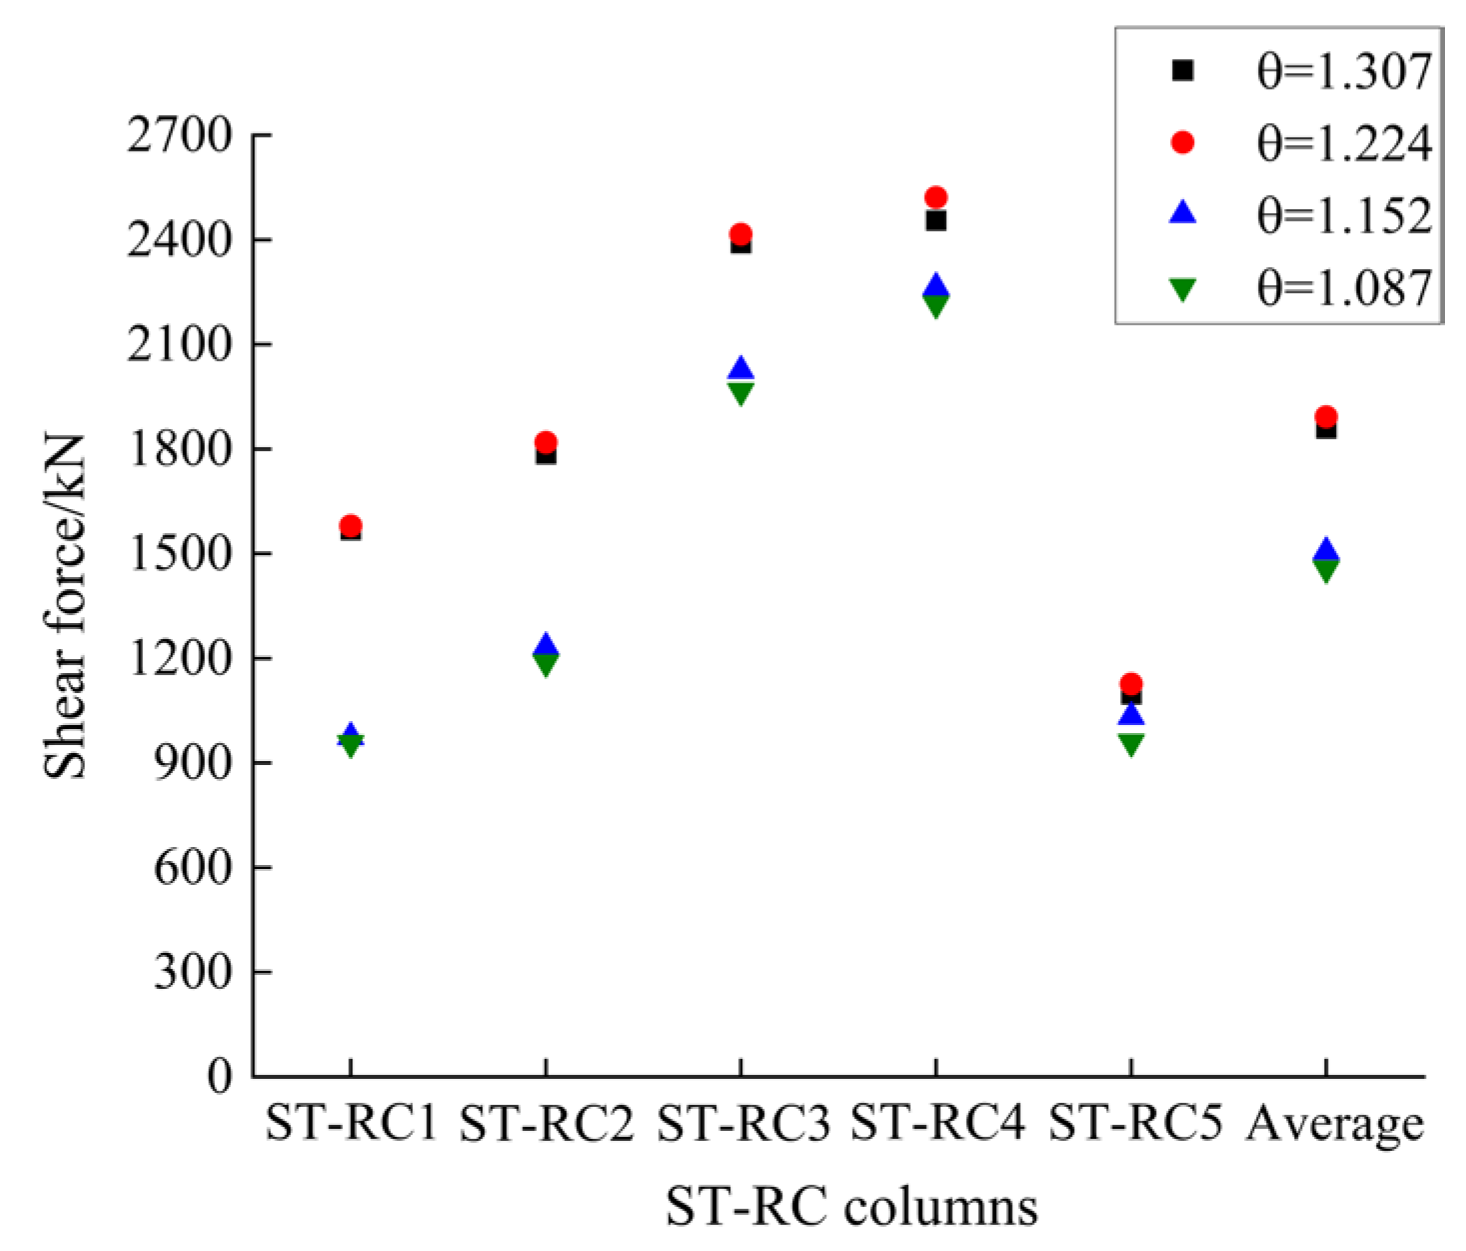
As shown in Figure 18, the shear forces of these five columns at four sets of θ are θ = 1.224, 1.307, 1.152, and 1.087, from the largest to the smallest. When θ is 1.224, the shear force of the ST-RC columns is greater than that when θ is 1.307, which indicates that the columns with a θ of 1.224 have the maximum stiffness. Therefore, under the same shear force, the damage is the smallest. The shear forces borne by the ST-RC columns are close when the θ values are 1.224 and 1.307, and they are also close when the θ values are 1.152 and 1.087.
Θ increases by approximately 7% for every 20 mm reduction in the diameter of the steel tube in the column. When θ increases from 1.087 to 1.152, the shear force borne by the columns increases by 3%; when θ increases from 1.152 to 1.224, the shear force borne by the columns increases by 20%; when θ increases from 1.224 to 1.307, the shear force borne by the columns decreases by 1%. It can be seen that as θ increases, the shear force borne by the columns does not show a linear increase, and when θ reaches 1.224, the shear force reaches a peak.
The main reason for this is that when the steel tube D/t exceeds the critical value, the steel tube is prone to local outward bulging during the stress process, resulting in the failure of the constraint effect. The Chinese code [52] also clearly states that D/t must meet the limit requirements to avoid the risk of local buckling. Based on their experimental results, Ou et al. [56] also indicated that as θ increases, the bearing capacity first increases and then decreases. The experimental research by Zhou et al. [57] also showed that an increase in θ may lead to stress concentration due to the radial deformation of the steel tube, which instead reduces the bearing capacity of the component. The research by Li et al. [58] showed that when θ increases to a certain range, the growth of the bearing capacity of the ST-RC column tends to be gradual.
All the above conclusions prove that a larger θ does not necessarily lead to a more obvious improvement in the bearing capacity of the ST-RC column; instead, when it exceeds a certain limit, it will reduce the bearing capacity of the member, causing equally serious damage to the structure. In practical construction, it is necessary to optimize the fabrication accuracy of the stirrups, improve the construction technology of the joint zones (such as adopting prefabricated reinforcement cages and positioning fixtures), and strengthen worker training and process monitoring. Only by doing so can the challenges be minimized to the greatest extent, θ be ensured to meet the design requirements, and the structural mechanical performance be guaranteed.

3.7. Deformation Analysis of ST-RC Columns

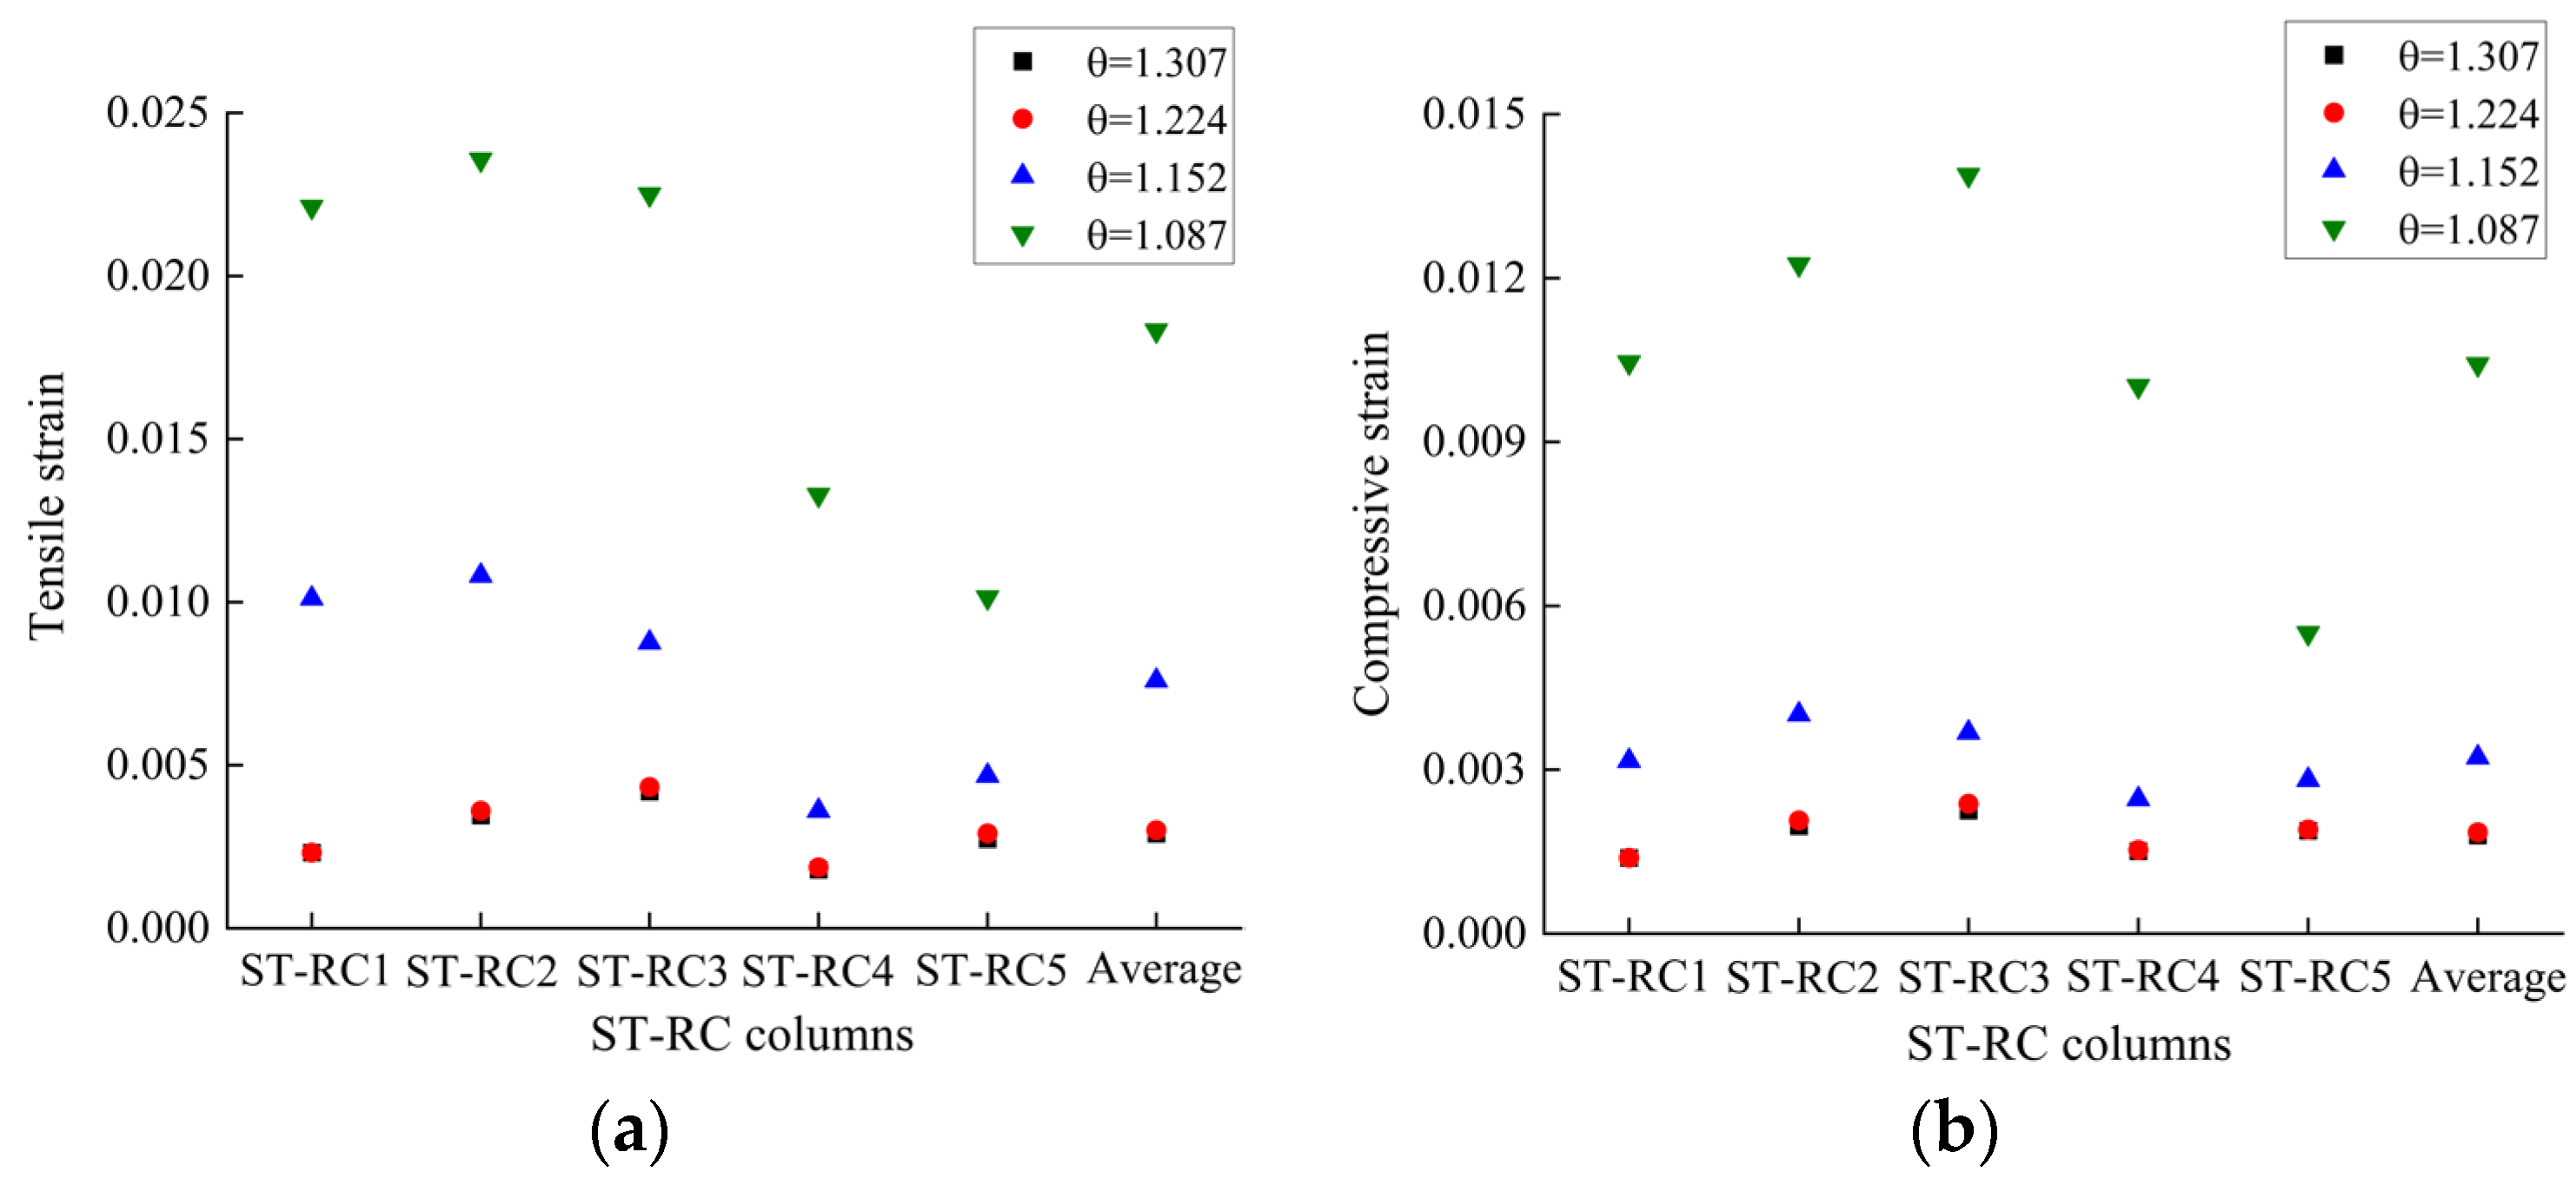
Figure 19 shows the tensile and compressive strains of the ST-RC columns with different θ values. With an increase in θ, the tensile and compressive strains of the columns decrease. When θ is 1.224, the tensile and compressive strains of the columns are minimized. This indicates that the column shear force increases with an increase in θ, but the speed of the shear increase is not as fast as the speed of increase of the column section bearing capacity. As shown in Figure 19, when θ increases from 1.087 to 1.152, the tensile and compressive strains of the columns decrease by 2.4–3 times. When θ increases from 1.152 to 1.224, the tensile and compressive strains of the columns decrease by 1.8–2.6 times. Furthermore, when θ increases from 1.224 to 1.307, the tensile and compressive strains of the columns increase by approximately 2%. It can be seen from this that after θ reaches 1.224, the improvements in the tensile and compressive strains of the columns are not significant. If θ continues to increase, it will instead result in a waste of steel and an increase in construction costs, which is not an economical choice.
4. Discussion

The research results presented in this paper confirm that ST-RC columns can improve the seismic performance of staggered-story buildings. Meanwhile, it should be noted that through the member-level evaluation method, it is found that the ductility of ST-RC columns does not have a completely linear increasing relationship with the selection of their θ values; an excessively large θ tends to reduce the structural ductility. For practical engineering, the θ that is truly suitable for the building should be analyzed in detail to ensure the maximum performance of the materials and the members.
Although this study has conducted relevant research on local staggered-floor frame structures through a finite element numerical analysis, it has not supplemented the experimental research with calibration to enhance the credibility of the finite element analysis. It should be noted that this study focuses on a single type of structure and fails to extend the evaluation method to other forms of structures.

5. Conclusions

This paper establishes an elastic–plastic model, which is derived from a partial staggered-story RC frame building in a practical engineering project. By changing the θ of the ST-RC columns with severe damage, the influence of θ on the seismic performance of the staggered-story building is studied and evaluated according to the division of performance states. The main research findings are summarized as follows:
(1)
Through the inspection of the positive and inclined sections of the ST-RC columns, it is found that for columns under four different θ values, their damage degree complies with the specification that the positive section deformation is within the range of no moderate damage, while the inclined section bearing capacity stays within the limits of the “minimum cross-section check”.
(2)
As the θ increases, the shear force borne by the column first increases and then decreases, but an excessively high θ will cause stress concentration in the steel, weakening the bearing capacity of the members.
(3)
With an increase in θ, the tensile and compressive strains of the columns generally show a decreasing trend. When θ is 1.224, the tensile and compressive strains of the ST-RC columns are the smallest; if θ is further increased, the tensile and compressive strains of the ST-RC columns will increase by 2% due to stress concentration in the steel tube.
(4)
To achieve the optimal seismic performance of ST-RC columns, the selection of a suitable θ is essential in practical engineering projects. This reminds engineers that they should propose reasonable solutions based on actual engineering conditions and combined with effective analysis.
(5)
The use of ST-RC columns incurs high costs and a substantial consumption of material resources. In future research, focus can be placed on cost-performance optimization design, or on linking the sustainability and the carbon footprint of the materials to conduct a life cycle analysis. From structural analysis to human development, this will be a pivotal step.

Author Contributions

Conceptualization, J.T., S.Z., and E.W.; data curation, L.G. and J.L.; formal analysis, L.G., E.W. and J.L.; funding acquisition, J.T. and S.Z.; investigation, L.G. and S.Z.; methodology, J.T., S.Z. and Q.Q.; project administration, J.T. and S.Z.; resources, J.T. and J.L.; software, J.T. and Q.Q.; supervision, J.T., S.Z. and Q.Q.; validation, L.G. and E.W.; visualization, L.G., E.W. and J.L.; writing—original draft, E.W.; writing—review and editing, L.G. and Q.Q. All authors have read and agreed to the published version of the manuscript.

Funding

This research was supported by the Open Fund of School–Enterprise Joint Research Center of Underground Structure Earthquake Resistance, Shaanxi Province “Four Main Bodies and One Joint” (Grant No. KY2024-ZD01).

Data Availability Statement

The data presented in this study are available on request from the corresponding author. The data are not publicly available due to privacy.

Conflicts of Interest

Author Junfu Tong was employed by the company Shaanxi Modern Architectural Design and Research Institute Co., Ltd. The remaining authors declare that the research was conducted in the absence of any commercial or financial relationships that could be construed as a potential conflict of interest.

References

  1. Kim, J.; Jun, Y.; Kang, H. Seismic behavior factors of RC staggered wall buildings. Int. J. Concr. Struct. Mater. 2016, 10, 355–371. [Google Scholar] [CrossRef]
  2. Liu, Y.L.; Yang, S.Z.; Sun, S.D. Structural design of Media Center of Shanghai Cooperation Organization Qingdao Summit. Build. Struct. 2021, 51, 38–42. [Google Scholar] [CrossRef]
  3. Jia, L.Y. Structural design of a special irregular theatre on a constructed basement. Build. Struct. 2021, 51, 160–165. [Google Scholar]
  4. GB 50011-2010; Code for Seismic Design of Buildings. China Architecture & Building Press: Beijing, China, 2016.
  5. Liu, H.J.; Duan, Y.F. Structure design of cinema in south region in Yinchuan Dayuecheng project phase One. Build. Struct. 2021, 51, 232–236. [Google Scholar]
  6. Wang, D.J.; Jia, X.L.; Zhang, M.B. Structural design and analysis of Longnan Chengzhou Airport Terminal Build. Build. Struct. 2022, 52, 566–572. [Google Scholar] [CrossRef]
  7. Wang, X.H.; Zhang, W.P.; Kong, Y. Seismic design on out-of-code complex structure of library theatre of Pinghe Bilingual School Qingpu. Build. Struct. 2023, 53, 62–70,78. [Google Scholar] [CrossRef]
  8. Zhou, B.; Ma, J.Y.; Liang, Z.F. Complex staggered floor structure design and analysis of Wangfujing Foreign Language Bookstore. Build. Struct. 2024, 54, 30–35+69. [Google Scholar] [CrossRef]
  9. Zameeruddin, M.; Sangle, K.K. Performance-based seismic assessment of reinforced concrete moment resisting frame. King Saud. Univ. Eng. Sci. 2021, 33, 153–165. [Google Scholar] [CrossRef]
  10. Giannakouras, P.; Zeris, C. Seismic performance of irregular RC frames designed according to the DDBD approach. Eng. Struct. 2019, 182, 427–445. [Google Scholar] [CrossRef]
  11. Yalçın, C.; Dindar, A.A.; Yüksel, E. Seismic design of RC frame structures based on energy-balance method. Eng. Struct. 2021, 237, 112220. [Google Scholar] [CrossRef]
  12. Radman Ahmed, A.A.; Lu, L.; Li, B.; Bi, W.; Al-Dhubai, F.M.A. Seismic Vulnerability Assessment of Residential RC Buildings in Yemen Using Incremental Dynamic Analysis (IDA). Buildings 2025, 15, 1336. [Google Scholar] [CrossRef]
  13. Chourasia, A.; Kajale, Y.; Singhal, S. Seismic performance assessment of two-story precast reinforced concrete building. Struct. Concr. 2020, 21, 2011–2027. [Google Scholar] [CrossRef]
  14. Etli, S.; Güneyisi, E.M. Seismic performance evaluation of regular and irregular composite moment resisting frames. Lat. Am. J. Solids. Struct. 2020, 17, e301. [Google Scholar] [CrossRef]
  15. Chong, C.; Chen, M.; Wang, M.; Wei, L. A Fast Fragility Analysis Method for Seismically Isolated RC Structures. Buildings 2025, 15, 2449. [Google Scholar] [CrossRef]
  16. ASCE/SEI 41-17; Seismic Evaluation and Retrofit of Existing Buildings. American Society of Civil Engineers: Reston, VA, USA, 2017.
  17. Yang, J.; Liang, S.T.; Zhu, X.J. Shaking table testing of the reinforced concrete staggered slab-column structure. Adv. Struct. Eng. 2022, 25, 1943–1958. [Google Scholar] [CrossRef]
  18. Chen, H. Study on behavior of staggered floor structure by ABAQUS software. Build. Struct. 2013, 43, 610–613. [Google Scholar] [CrossRef]
  19. Cheng, S.; Yang, J.; Liu, D. Study on the Response of Staggered Floor Isolated Structures in Mountainous Areas under Three-Dimensional Earthquakes. Geofluids 2022, 1, 8424055. [Google Scholar] [CrossRef]
  20. Yao, G.H.; Li, Y.J.; Liao, F.Y. Behavior of concrete-filled steel tube reinforced concrete columns subjected to axial compression. J. Build. Struct. 2013, 34, 114–121. [Google Scholar] [CrossRef]
  21. Li, Y.F.; Liu, Y.J.; Zhu, J. The influence of column section size on the seismic performance of mislayer structure. China Concr. Cement Prods. 2016, 8, 37–41. [Google Scholar] [CrossRef]
  22. GB 50011-2012; Load Code for the Design of Building Structures. China Architecture & Building Press: Beijing, China, 2012.
  23. Cui, J.D.; Shen, X.L. PERFORM-3D Principle and Examples; China Architecture & Building Press: Beijing, China, 2017; pp. 103–104. [Google Scholar]
  24. Wang, H.C.; Lu, J.; Wu, H.J.; Zhou, W.B. Structural design of theater of Xi’an Consulate District Silk Road International Culture and Art Center. Build. Struct. 2024, 54, 64–71. Available online: https://link.cnki.net/doi/10.19701/j.jzjg.20231954 (accessed on 21 July 2025).
  25. Rong, X.; Hao, J.L.; Zhang, J.X. Research on Performance-based Seismic Design of New Prefabricated Steel Joint Concrete Frame Structure. J. Shenyang Jianzhu Univ. (Nat. Sci.) 2023, 39, 979–988. [Google Scholar]
  26. Qin, C.; Zhao, Y.; Zhu, R.J.; Ge, X.Y.; Li, T. Dynamic elastic-plastic analysis on Gui Yang department store building. Build. Struct. 2023, 53, 581–587. Available online: https://link.cnki.net/doi/10.19701/j.jzjg.23S1127 (accessed on 21 July 2025).
  27. Yu, Z.J.; Wang, J.F.; Duan, L. Elastic-plastic time-history analysis in the construction drawing design phase of the China International Silk Road Center. Build. Struct. 2021, 51, 624–631. Available online: https://kns.cnki.net/kcms2/article/abstract?v=7qDgw1F_0HXKa3qqmp2Al3KZfaDYMcNSF4HxBWVVZGZnxiu6cCvR2daKgPC-79Wvw_RAyrn6QaH31X1suufPxfSd2mjk5q8bSvkwGnVKSPBBcwN8LtVm1c76rlYZXSI856nI-5ar96KkmLJ9PGFq9XWGQir2TCW9ir-Ey0xvyXUZ5jkBqylMGuUz94U4E4jx&uniplatform=NZKPT&language=CHS (accessed on 21 July 2025).
  28. Han, M.M.; Fu, Y.Q.; Wang, Y. Research on seismic performance of multi-storey frame structure with multi-storey unbraced columns. Ind. Constr. 2021, 51, 63–69. Available online: https://link.cnki.net/doi/10.13204/j.gyjzg20011903 (accessed on 21 July 2025).
  29. Guo, Z.M.; Fang, Y.P.; Yu, L.G.; Li, C.Y.; Guo, M. Dynamic elastic-plastic comparative analysis of high-rise structure based on PERFORM-3D and STRAT. Build. Struct. 2020, 50, 257–265. Available online: https://kns.cnki.net/kcms2/article/abstract?v=bugI047JRxjqY1Ab5Knlps-qxzKoonTm0g_xBea_4wI0y7G5FachEEK_VEMpJvMtMWXz8VXMymaGQLMHvSyZdtomylpRQFne3JmQVI9JReaHxPe99-sVbMrwskdaqUqvH_ohM4JwFpbkLGGzwsg3fBOmcHQGhhaIlrpZVWkcSAu0B6Vb70cNw2AkeLP8CKsG&uniplatform=NZKPT&language=CHS (accessed on 21 July 2025).
  30. Liu, H.X.; Li, Y.M.; Wei, P.Z. Applied research of buckling constraint support used in the Pudong urban planning and public art center. Build. Struct. 2020, 50, 383–390. Available online: https://link.cnki.net/doi/10.19701/j.jzjg.2020.s1.075 (accessed on 21 July 2025).
  31. Liu, W.Y.; Li, M.; Ma, H.W. The secondary development and application of PERFORM 3D in structural elastic-plastic post-processing. Build. Struct. 2019, 49, 340–343. Available online: https://link.cnki.net/doi/10.19701/j.jzjg.2019.S2.062 (accessed on 21 July 2025).
  32. Hou, S.J. Study on the seismic performance of Chinese Table Tennis Museum. Build. Struct. 2019, 49, 383–387. Available online: https://link.cnki.net/doi/10.19701/j.jzjg.2019.S1.080 (accessed on 21 July 2025).
  33. Li, D.M. Preliminary evaluation of seismic performance of engineering structures with perform 3D. Arch. Civ. Eng. 2019, 65, 4. [Google Scholar] [CrossRef]
  34. Mamun, A.A.; Saatcioglu, M. Seismic performance evaluation of moderately ductile RC frame structures using Perform-3D. In Proceedings of the 16th World Conference on Earthquake Engineering, Santiago, Chile, 9–13 January 2017. [Google Scholar]
  35. Dong, Y.R.; Xu, Z.D.; Guo, Y.Q.; Zeng, L.H.; Li, L.L.; Xu, Y.S.; Yan, X. Controller-extensible hybrid simulation platform for viscoelastically damped frame structures based on Matlab-Opensees frameworks. Eng. Struct. 2022, 267, 114678. [Google Scholar] [CrossRef]
  36. Vaiana, N.; Capuano, R.; Sessa, S.; Marmo, F.; Rosati, L. Nonlinear Dynamic Analysis of Seismically Base-Isolated Structures by a Novel OpenSees Hysteretic Material Model. Appl. Sci. 2021, 11, 900. [Google Scholar] [CrossRef]
  37. Chen, P.; Xu, L.; Li, Z. Modeling methods of self-centering energy dissipation braces using OpenSees. J. Constr. Steel. Res. 2022, 193, 107267. [Google Scholar] [CrossRef]
  38. Guan, M.S.; Hang, X.R.; Wang, M.S.; Zhao, H.Y.; Liang, Q.Q.; Wang, Y. Development and implementation of shear wall finite element in OpenSees. Eng. Struct. 2024, 304, 117639. [Google Scholar] [CrossRef]
  39. Wang, Z.; Li, T.F.; Su, M.Z. Static performance of high-strength steel composite Y-shaped eccentrically braced steel frames. Earthq. Eng. Struct. Dyn. 2024, 44, 93–101. Available online: https://link.cnki.net/doi/10.13197/j.eeed.2024.0609 (accessed on 21 July 2025).
  40. Zhang, L.L.; Han, J.P. Fragility analysis of passive energy dissipation structures based on performance spectra design. Chin. Earthq. Eng. J. 2025, 47, 104–112. Available online: https://link.cnki.net/doi/10.20000/j.1000-0844.20230426002 (accessed on 21 July 2025). [CrossRef]
  41. Wu, F.Y.; Chen, H.; Chen, W.H. Finite element calculation method for CFRP⁃retrofitted earthquake⁃damaged non⁃ductile concrete frames. Earthq. Resist. Eng. Retrofit. 2024, 46, 130–136. Available online: https://link.cnki.net/doi/10.16226/j.issn.1002-8412.2024.06.015 (accessed on 21 July 2025).
  42. Han, X.L.; Chen, X.W.; Lin, S.Y. Nonlinear structure analysis methods, examples and engineering applications based on macroscopic elements. In Proceedings of the 18th National Academic Conference on Structural Engineering, Guangzhou, China, 28 November 2009; Volume II. [Google Scholar]
  43. Han, X.L.; Chen, X.W.; Lin, S.Y.; He, W.Q.; Zheng, Y.; Wu, P.F.; Mao, G.M. Elasto-plastic time-history analysis of super high-rise RC structure based on fiber model. Build. Struct. 2010, 40, 13–16. Available online: https://link.cnki.net/doi/10.19701/j.jzjg.2010.02.003 (accessed on 21 July 2025).
  44. Guo, K.S. Damage assessment method of structure with fiber element and program implementation. Master’s Thesis, Harbin Institute of Technology, Harbin, China, 2021. Available online: https://link.cnki.net/doi/10.27061/d.cnki.ghgdu.2021.001140 (accessed on 21 July 2025).
  45. Wang, L.P.; Zhang, W.; Luo, W.W. Study on axial elongation effect of RC frame beams due to bending damage under earthquake. Build. Struct. 2019, 49, 98–105. [Google Scholar] [CrossRef]
  46. GB 50010-2010; Code for Design of Concrete Structures. China Architecture & Building Press: Beijing, China, 2015.
  47. Zhao, J.G.; Du, B.; Zhan, Y.L. Applicability of Mander model in OpenSees for simulation of hysteretic of reinforced concrete column. J. Lanzhou Univ. Technol. 2017, 43, 127–133. [Google Scholar] [CrossRef]
  48. Wu, D.Y. Study on the influences of different adjustment schemes of bearing capacity and stiffness on the seismic performance of frame structures. Master’s Thesis, Chongqing University, Chongqing, China, 2016. [Google Scholar]
  49. Han, L.H. Concrete Filled Steel Tubular Structures, Theory and Practice, 2nd ed.; Science Press: Beijing, China, 2007; pp. 101–110. [Google Scholar]
  50. Jia, L.P.; Guo, Z.X.; Liu, Y. Study on axial compression mechanism and design method of core steel tubular reinforced concrete short columns. Earthq. Eng. Eng. Dyn. 2015, 35, 79–85. [Google Scholar] [CrossRef]
  51. Federal Emergency Management Agency (FEMA). FEMA P-695; Quantification of Building Seismic Performance Factors; FEMA: Washington, DC, USA, 2009. [Google Scholar]
  52. GB 50936-2014; Technical Code for Concrete Filled Steel Tubular Structures. China Architecture & Building Press: Beijing, China, 2014.
  53. Zhang, S.Y.; Guo, L.; Ge, L.H.; Wang, E.; Tong, J.F. Performance-based seismic evaluation of local staggered RC frames with steel tube-reinforced concrete columns under multi-angle earthquakes. Appl. Sci. 2025, 15, 9092. [Google Scholar] [CrossRef]
  54. DBJ/T15-151-2019; Specification for Performance-Based Seismic Design of Reinforced Concrete Building Structure. Guangdong Provincial Department of Housing and Urban-Rural Development: Guangzhou, China, 2019.
  55. Han, X.L.; Ji, J. Performance-Based Seismic Design of Reinforced Concrete Structure; China Architecture & Building Press: Beijing, China, 2019; pp. 1–16. [Google Scholar]
  56. Ou, Z.Q.; Yan, J.H.; Yu, J. Pseudo-static testing of concrete piers with steel tube hoops. J. Lanzhou Univ. (Nat. Sci.) 2023, 59, 112–120. [Google Scholar] [CrossRef]
  57. Zhou, Z.H.; Liu, J.P. Seismic performance and design method of steel tube confined steel reinforced concrete frame short columns. J. Disaster. Prev. Mitig. Eng. 2010, 30, 1–5. [Google Scholar] [CrossRef]
  58. Li, P.; Zhang, T.; Wang, C. Behavior of concrete-filled steel tube columns subjected to axial compression. Adv. Mater. Sci. Eng. 2018, 1, 4059675. [Google Scholar] [CrossRef]
Figure 1. First floor structural layout plan.
Buildings 15 03193 g001
Figure 2. The 1-1 cross-section.
Buildings 15 03193 g002
Figure 3. The 2-2 cross-section.
Buildings 15 03193 g003
Figure 4. The finite element analysis model of the staggered-story frame building.
Buildings 15 03193 g004
Figure 5. Schematic of the beam–column fiber element division.
Buildings 15 03193 g005
Figure 6. The ST-RC column fiber element division.
Buildings 15 03193 g006
Figure 7. Skeleton curve and fitting of concrete.
Buildings 15 03193 g007
Figure 8. Unconfined concrete. (a) Constitutive relation curve of unconfined concrete. (b) Fitting diagram of the unconfined concrete constitutive model.
Buildings 15 03193 g008
Figure 9. Confined concrete. (a) Concrete constitutive relation curve of confined concrete. (b) Fitting diagram of the confined concrete constitutive model.
Buildings 15 03193 g009
Figure 10. Concrete in the steel tube. (a) Constitutive relation curve of concrete in the steel tube. (b) Fitting diagram of the concrete constitutive model in the steel tube.
Buildings 15 03193 g010
Figure 11. Concrete energy degradation coefficient. (a) Energy degradation diagram of concrete in steel tubes and confined concrete. (b) Energy degradation diagram of unconfined concrete.
Buildings 15 03193 g011
Figure 12. Fitting diagram of the steel constitutive model.
Buildings 15 03193 g012
Figure 13. Energy dissipation of steel.
Buildings 15 03193 g013
Figure 14. Comparison of seismic response spectra. (a) Multi-wave response spectra. (b) Average value response spectra.
Buildings 15 03193 g014
Figure 15. Structural inter-story drift ratios. (a) X-direction. (b) Y-direction.
Buildings 15 03193 g015
Figure 16. Schematic of severely damaged ST-RC columns.
Buildings 15 03193 g016
Figure 17. Performance states and limits for inter-story drift ratios of column members.
Buildings 15 03193 g017
Figure 18. Maximum shear force of ST-RC columns with different θ values.
Buildings 15 03193 g018
Figure 19. Strain in ST-RC columns with different θ values. (a) Tensile strain. (b) Compressive strain.
Buildings 15 03193 g019
Table 1. Strength grade of concrete.
MembersColumnsBeams, Floor Slabs
Floor1st2nd–4th4th–6th1st–2nd3rd–6th
GradeC50C45C40C40C35
Table 2. The 1st floor beam members.
BeamsSection (mm)TopBottomStirrup
Horizontal beam350 × 700 2   C   25 + ( 2   C   12) 2   C   22 / 4   C   25 C 10@100/200 (4)
Longitudinal beam350 × 800 2   C   25 + ( 2   C   12) 2   C   25 + 3   C   22 C 10@100/200 (4)
Secondary beam250 × 500 2   C   22 2   C   20 C   8@200 (2)
Table 3. The column members.
FloorSection (mm)Width-SideLength-SideCornerStirrup
1st–2nd700 × 700 5   C   25 4   C   25 4   C   28 C 10@100/200
3rd–4th650 × 650 3   C   25 3   C   25 4   C   25 C 10@100/200
5th–6th600 × 600 3   C   25 3   C   25 4   C   25 C 10@100/200
Table 4. The ST-RC columns.
Section (mm)Steel Tube (mm)Width-SideLength-SideCornerStirrup
700 × 700325 × 14 3   C   28 3   C   25 4   C   28 C 12@100
377 × 14 5   C   28 3   C   28 4   C   28 C 12@100
800 × 800377 × 14 5   C   32 3   C   28 4   C   28 C 12@100
Table 5. The average compressive strength of Simple concrete.
GradeC50C45C40C35
δc (%)0.1490.1530.1560.163
fcuk (N/mm2)50.045.040.035.0
fcm (N/mm2)66.260.153.847.8
Table 6. The average compressive strength of Mander model concrete (N/mm2).
GradeC50C45C40C35
fcuk50.045.040.035.0
fck39.535.631.627.7
fcm52.347.842.537.9
Table 7. Average values of steel strength and modulus of elasticity (N/mm2).
MaterialHPB300HRB335HRB400Q345
Standard value300.00335.00400.00345.00
Average value341.77381.65455.70393.04
Es2.10 × 1052.00 × 1052.00 × 1052.06 × 105
Table 8. Steel principal parameters.
MaterialEs (N/mm2)DY (MPa)DUDX
HPB3002.01 × 105341.770.00170.0500
HRB3352.00 × 105381.650.00190.0500
HRB4002.00 × 105455.700.00230.0500
Q3452.06 × 105393.040.00190.0500
Table 9. Basic information on seismic waves.
EventsArticle NameTypologyCardinal Time (s)Validity Period (s)
AR5_2019_2A1Artificial wave3027
AR5_2019_5A2Artificial wave3028
NOCH516212N3Natural wave3432
NOFK401230N4Natural wave1615
NOIW725035N5Natural wave4948
NOSI180758N6Natural wave1817
NOTC319185N7Natural wave2626
Table 10. The deviation statistics of the ground vibration response spectra from the canonical response spectra.
PeriodA1A2N3N4N5N6N7Average
1st−4.34%10.09%1.27%2.79%−1.20%−3.98%9.23%2.46%
2nd−2.67%−2.39%−3.15%0.15%1.45%−2.72%3.84%−0.30%
3rd1.37%−6.95%−2.26%2.26%2.46%−5.96%12.38%0.66%
Table 11. Comparison of structural base shear force.
DirectionSeismic WavesStandard
Deviation
Coefficient of VariationAverageCQC
A1A2N3N4N5N6N7
X (kN)220326251814236720732453206725311.37%22292270
Rate0.971.160.81.040.911.080.91--0.981
Y (kN)23082223202225772365225623201546.72%22962421
Rate0.950.920.841.060.980.930.96--0.951
Table 12. Statistical indicators for inter-story drift ratios during 7 seismic waves.
FloorX-DirectionY-Direction
Standard
Deviation
Coefficient of VariationAverageCQCStandard
Deviation
Coefficient of VariationAverageCQC
12.13 × 10−510.25%2.08 × 10−42.19 × 10−41.52 × 10−58.49%1.79 × 10−41.90 × 10−4
22.32 × 10−58.72%2.66 × 10−43.25 × 10−41.19 × 10−55.38%2.21 × 10−42.51 × 10−4
32.78 × 10−58.63%3.22 × 10−43.14 × 10−41.68 × 10−56.77%2.48 × 10−42.52 × 10−4
42.58 × 10−58.60%3.00 × 10−42.94 × 10−49.64 × 10−53.93%2.45 × 10−42.49 × 10−4
53.70 × 10−514.07%2.63 × 10−42.50 × 10−41.52 × 10−58.49%1.79 × 10−41.90 × 10−4
64.13 × 10−514.45%2.86 × 10−42.50 × 10−41.19 × 10−55.38%2.21 × 10−42.51 × 10−4
Table 13. Main parameters of ST-RC columns.
Groupst (mm)D (mm)αscθD/t
I143370.1891.30724.07
II143570.1771.22425.50
III143770.1671.15226.93
IV143970.1581.08728.36
Table 14. Division of column component damage modes.
Damage Mode λ m
Bending controlled λ 2.0 m 0.6
λ 2.0 0.6 < m 1.0
Bending–shear controlled 2.0 > λ 1.4 m 1.0
Shear controlledOther
In the table, λ is the shear–span ratio; m is the bending–shear ratio.
Table 15. Limits for ST-RC column components.
Member ParametersPerformance Level
No DamageSlight DamageMild DamageModerate DamageComparatively Severe DamageSevere Damage
Flexure controlled
n ¯ ≤ 0.1 ρ v ≥ 0.0210.0040.0180.0270.0370.0460.056
n ¯ = 0.6 ρ v ≥ 0.0210.0040.0130.0180.0220.0270.03
n ¯ ≤ 0.1 ρ v ≤ 0.0010.0040.0150.0220.0290.0360.042
n ¯ = 0.6 ρ v ≤ 0.0010.0040.0090.0110.0120.0130.014
Flexure–shear controlled
n ¯ ≤ 0.1m ≤ 0.60.0030.0130.020.0260.0330.040
n ¯ = 0.6m ≤ 0.60.0030.0090.0110.0140.0160.018
n ¯ ≤ 0.1m ≥ 1.00.0030.0110.0160.0210.0260.028
n ¯ = 0.6m ≥ 1.00.0030.0080.0090.0110.0120.014
n ¯ is the axial compression ratio, m is the flexure–shear ratio, and ρ v is the volume–stirrup ratio.
Table 16. Performance review method for shear-controlled components.
Level 4Key ComponentsOrdinary Vertical ComponentsEnergy-Dissipating Components
Positive sectionNo yielding check or deformation not exceeding mild damageNo yielding check or deformation not exceeding moderate damageDeformation not exceeding severe damage
Inclined sectionNo yielding checkMinimum cross-section checkMinimum cross-section check
Table 17. Statistics on the performance states of positive sections of the 2nd floor ST-RC columns.
θNo DamageSlight DamageMild DamageModerate DamageComparatively Severe DamageSevere DamageFailure
1.307100.00%0.00%0.00%0.00%0.00%0.00%0.00%
1.224100.00%0.00%0.00%0.00%0.00%0.00%0.00%
1.15295.00%5.00%0.00%0.00%0.00%0.00%0.00%
1.08783.55%3.62%12.83%0.00%0.00%0.00%0.00%
Table 18. Statistics on the performance states of positive sections of all ST-RC columns.
θNo DamageSlight DamageMild DamageModerate DamageComparatively Severe DamageSevere DamageFailure
1.3070.00%95.93%4.07%0.00%0.00%0.00%0.00%
1.2240.00%96.51%3.49%0.00%0.00%0.00%0.00%
1.1520.00%90.70%9.30%0.00%0.00%0.00%0.00%
1.0870.00%88.13%6.12%5.76%0.00%0.00%0.00%
Table 19. Statistics on the performance states of inclined sections of the 2nd floor ST-RC columns.
θElasticUnyieldingExtreme BoundarySatisfying the Minimum Cross-SectionExceedance of the Cross-Section
1.307100.00%0.00%0.00%0.00%0.00%
1.224100.00%0.00%0.00%0.00%0.00%
1.15296.67%3.34%0.00%0.00%0.00%
1.08792.78%7.22%0.00%0.00%0.00%
Table 20. Statistics on the performance states of inclined sections of all ST-RC columns.
θElasticUnyieldingExtreme BoundarySatisfying the Minimum Cross-SectionExceedance of the Cross-Section
1.307100.00%0.00%0.00%0.00%0.00%
1.224100.00%0.00%0.00%0.00%0.00%
1.15298.84%1.16%0.00%0.00%0.00%
1.08796.12%2.47%1.41%0.00%0.00%
Disclaimer/Publisher’s Note: The statements, opinions and data contained in all publications are solely those of the individual author(s) and contributor(s) and not of MDPI and/or the editor(s). MDPI and/or the editor(s) disclaim responsibility for any injury to people or property resulting from any ideas, methods, instructions or products referred to in the content.