Abstract
Prefabricated cut-and-cover construction offers rapid assembly, tighter quality control, and lower environmental impact than conventional cast-in-place methods, yet its seismic performance in shallow, asymmetric, large-span urban underpasses remains insufficiently studied. This study quantifies the response of an asymmetric prefabricated underpass using a 3D finite-element model with viscoelastic boundaries and benchmarks it against a cast-in-place counterpart under three representative ground motions (Wolong, Kobe, and Northridge). Prefabrication reduces ground-surface acceleration amplification by up to 32%, evidencing superior damping capacity; however, deformation demand increases, with a maximum inter-storey drift ratio of 1/489 at the three-lane sidewall under 0.4 g, 36% higher than the cast-in-place case yet below the plastic limit of 1/250. Joint actions satisfy waterproofing and safety requirements (peak opening 1.582 mm, slip 0.403 mm; allowance 2 mm). Taken together, these results clarify a performance that prefabrication mitigates seismic accelerations but heightens inter-storey drift ratios and offer practical guidance to designers and practitioners on scheme selection and admissible drift ratio targets to enhance seismic resilience.
1. Introduction
Rapid urbanization has significantly intensified traffic congestion in many large cities worldwide, necessitating the development of efficient, sustainable, and resilient underground transportation infrastructure. Urban underpasses are one of the most effective strategies to divert surface traffic underground, thereby increasing capacity and improving mobility. Conventional cast-in-place (CIP) cut-and-cover construction methods, however, are hindered by long construction durations, high labor demands, and adverse environmental impacts, such as noise, dust, and disruption to existing traffic networks [,,]. In response, prefabricated cut-and-cover methods have received increasing attention. By enabling off-site production and on-site assembly, prefabricated systems substantially reduce construction time, improve quality control, and decrease life-cycle carbon emissions and resource consumption [,,,,,,,]. These advantages align with the global shift toward sustainable infrastructure and resilient urban development.
Recent research has highlighted the advantages and unique challenges of prefabricated underground structures. For shield tunnels, several studies demonstrated that segmental lining joints play a crucial role in controlling deformation and energy dissipation. For example, Liu et al. [] showed that joint flexibility significantly reduces bending moments and helps localize plastic deformation under seismic excitation. Similarly, Zhuang et al. [] found that segmental linings with properly designed gaskets can maintain waterproofing efficiency under cyclic loading. Studies on prefabricated metro stations have emphasized that connection stiffness and assembly detailing strongly influence global response mechanisms. Tao et al. [], using numerical simulations, reported that weak shear transfer in assembly joints can accelerate localized cracking, while Ding et al. [] demonstrated experimentally that enhancing joint stiffness reduces relative displacements and delays damage initiation. Collectively, these works establish that joints and connections govern the seismic resilience of prefabricated underground structures.
In contrast to shield tunnels and metro stations, urban underpasses possess distinctive features—large spans, shallow burial depths, and asymmetric geometries—that significantly modify their seismic response. The frequency, intensity, and duration of seismic motion directly affect the stability of shallow foundations. Shallow embedment amplifies the influence of soil–structure interaction (SSI), often leading to larger ground-surface acceleration amplification and concentrated deformation demands [,,,]. Numerical analyses by Xu et al. [] confirmed that shallow cut-and-cover structures exhibit stronger soil–structure coupling, resulting in higher drift ratios in wide-span sections. Wu [], in the case study of the Xianyue Road prefabricated underpass in Xiamen, observed asymmetric settlement and cracking near vertical joints, underscoring the sensitivity of such structures to asymmetric geometrical layouts and joint detailing. More recently, Jin et al. [] noted that in asymmetric box-shaped structures, seismic drift demands tend to localize at the wider sidewall, which can compromise structural safety and waterproofing performance. Despite these insights, comprehensive documentation of the seismic behavior of prefabricated underpasses remains limited, particularly concerning acceleration amplification, inter-storey drift concentration, and force transmission through vertical joints.
The seismic vulnerability of underground structures, though generally lower than above-ground buildings due to confinement and reduced inertial effects, has been clearly demonstrated in adverse conditions. The collapse of Daikai Station during the 1995 Kobe earthquake revealed the devastating consequences of insufficient seismic detailing, unfavorable geotechnical conditions, and neglect of SSI effects [,,,,]. Subsequent research has emphasized the necessity of advanced modeling approaches to capture complex seismic responses. For example, Lu et al. [] demonstrated that nonlinear soil behavior and stratigraphy can significantly alter underground structural responses under earthquake loading. Researchers have extensively explored the seismic performance of these prefabricated metro stations using methods such as shaking table tests and numerical simulations with some proposing novel seismic mitigation strategies, for example, installing friction pendulums between the central columns and the top slabs [,,,,,,,,,,,]. More recent studies have employed three-dimensional finite-element and finite-difference models with absorbing or viscoelastic boundaries to minimize artificial boundary effects and realistically approximate infinite soil domains [,]. These methods have been shown to improve accuracy in simulating acceleration amplification, deformation localization, and stress redistribution.
However, despite these methodological advances, knowledge remains limited regarding how asymmetric geometry and joint details influence the seismic performance of prefabricated underpasses compared with monolithic CIP systems.
Therefore, this study aims to address these research gaps by conducting a comparative seismic performance evaluation of a shallow, asymmetric prefabricated underpass against its CIP counterpart. A detailed three-dimensional finite-element model was developed, incorporating viscoelastic boundaries to approximate the semi-infinite soil medium. The assessment focuses on four critical response parameters: ground-surface acceleration amplification, inter-storey drift ratios, joint deformations, and overall seismic behavior under representative earthquake records. By systematically quantifying performance trade-offs between energy dissipation, deformation demands, and joint reliability, the findings of this study are expected to provide valuable guidance for the seismic design, detailing, and practical application of prefabricated underpasses in dense urban settings.
2. Engineering Background
To alleviate the intensified traffic congestion along Kehua North Road in the central urban area of Chengdu, Sichuan Province, China, the local government rolled out plans for underpass construction in 2018. Such projects typically adopt open-cut and cast-in-place techniques, which are characterized by prolonged construction durations, labor-intensive operation, and large environmental impacts such as noise and dust pollution. Moreover, it is challenging to maintain uninterrupted traffic flow during construction processes. These limitations present a pressing need to explore more efficient and environmentally sustainable construction alternatives. Prefabricated tunnel construction methods have been developed for the peak congestion tunnel section.
The underpass has a total length of 960 m. Specifically, a 120 m segment is planned to be constructed using prefabricated and assembled construction techniques, with the remaining sections built by employing the traditional cast-in-place method. The location of the underpass of interest and its surrounding urban context are depicted in Figure 1.
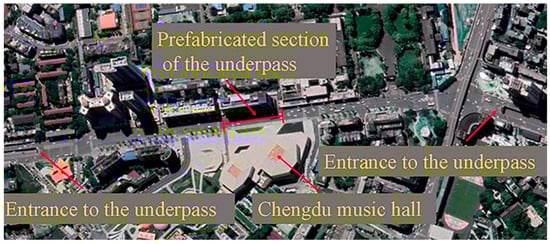
Figure 1.
The underpass location and surroundings.
The underpass is designed with 22.3 m in width and 8 m in height. The top and bottom slabs are consistently 1 m thick. In contrast, the side walls are 0.75 m in thickness, and the central wall is 0.6 m thick. To meet the lifting and transportation constraints, each ring is designed with a width of 1.5 m, a weight of approximately 120 tons. The structure is segmented along the height direction to enhance transportation and installation efficiency, dividing the cross-section into two parts. Its geometric configuration is illustrated in Figure 2 [].
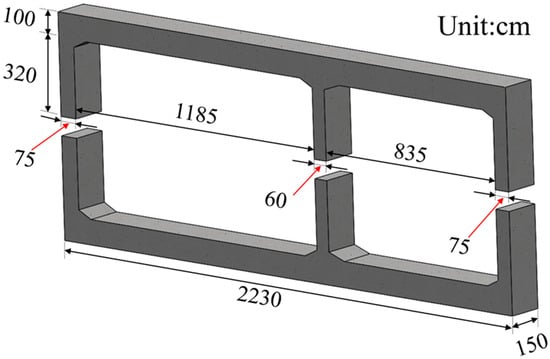
Figure 2.
The geometry of the underpass (single ring).
The underpass is engineered to accommodate five lanes of traffic in two directions. The southern portion consists of a three-lane span, a ramp that connects to the underground parking lot of the Chengdu City Concert Hall. In other words, the underpass is an asymmetric structure with a large cross-sectional area. The flat joints connect the segments with pre-embedded bolts. To prevent leakage through the bolt holes, the exterior of the joints is sealed by steel plates that connect the upper and lower sub-segments. Additionally, vertical pre-stressing is applied to generate a compressive pressure of 0.5 MPa within the joint area. The connecting bolts are 3 cm in diameter. Shear keys comprising Q345 mild steel are employed to resist shear forces between the top and bottom segments. These shear keys are hollow square sections, each measuring 28 cm, with a steel plate thickness of 2 cm. The prefabricated underpass structure and its connection designs are illustrated in Figure 3.
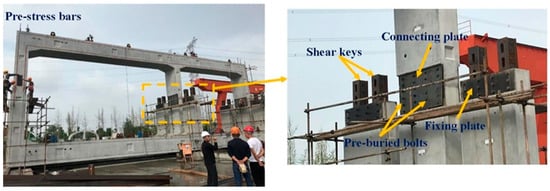
Figure 3.
The prefabricated underpass structure and connecting details.
The underpass segments are constructed at a prefabrication plant, including pouring and curing processes. The site is concurrently excavated. The prefabricated parts are transferred to the excavated site and assembled into rings. These ring segments are lifted and positioned to complete the final assembly of the structure under vertical pre-stressing with fine-rolled rebars. The basic construction process is outlined in Figure 4.
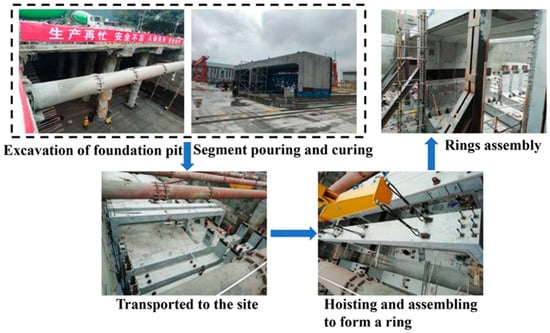
Figure 4.
The construction process of the prefabricated underpass.
3. Finite-Element Numerical Model
The entire prefabricated underpass structure is assembled through the expansion of individual rings, each of which serves as the fundamental unit. This study primarily investigated the lateral seismic response of the single-ring prefabricated underpass structures.
3.1. Numerical Modeling
The seismic performance of prefabricated and cast-in-place underpass structures was evaluated using the general finite-element software ABAQUS 2019. The model dimensions were determined according to the specifications outlined in Chinese Standard GB/T 51336-2018 []. The modeled structure length was defined as 156.1 m in length (22.3 m × (3 + 3 + 1)). Each individual ring in this structure was designed with a width of 1.5 m. The height was adjusted to accommodate the structure’s 8 m (×3) + 3 m dimensions, resulting in a model height of 35 m. According to the standard, the length of a computational domain should be at least three times that of the structure to ensure appropriate boundary effects. The computational model is depicted in Figure 5. In addition, the soil is simplified into five uniform layers, and the physical and mechanical parameters of the soil are shown in Table 1.
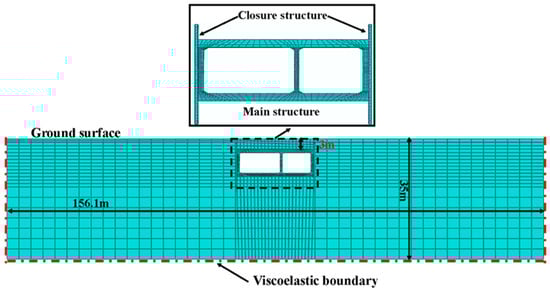
Figure 5.
The geometry of the numerical model.

Table 1.
Physical and mechanical parameters of the site soil.
Boundary conditions are crucial for accurately modeling the structure’s response to dynamic seismic loading, given their influence on the absorption and reflection of dynamic force. This study modeled these effects using viscoelastic boundary conditions were employed to model these effects. The corresponding loads were applied as equivalent nodal forces derived from velocity and displacement load conversions. The computational process was divided into three phases (Figure 6):
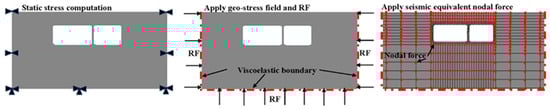
Figure 6.
The computation process.
- 1.
- Static boundary condition: In this step, the four lateral boundaries of the model are constrained in the horizontal and longitudinal directions, while the vertical direction is free. The bottom boundary is constrained in all three directions. As shown in Figure 6, the two black triangles on the four horizontal boundaries represent constraints in the horizontal and vertical directions, while the three black triangles at the bottom represent constraints in all three directions, with black arrows indicating the constraint reaction force RF. This stage focuses on the self-weight stress field and solves the initial stress state and constraint reaction forces of the model using the following finite-element static equilibrium equations:where [K] is the overall stiffness matrix of the model, {u} is the node displacement vector, and {F} is the equivalent node force vector containing self-weight loads and boundary constraint reaction forces. {F} is the equivalent node force vector; {FA} is the equivalent node force caused by all external loads applied in the static calculation; {FR} is the vector of all constraint reaction forces, which must be obtained by introducing boundary conditions through this equation after {u} is calculated.
- 2.
- Viscoelastic Boundary Calculation: To minimize artificial wave reflections at the model truncation, viscoelastic (transmitting) boundaries were applied. These boundaries consist of normal and tangential dashpots that match the soil’s impedance, supplemented by linear springs to stabilize low-frequency drift. The dashpot coefficients were defined as:where kN and kT are the normal and tangential spring coefficients, and cN and cT are the normal and tangential damping coefficients. αN and αT are the normal and tangent parameters, whose values are recommended as 0.67 and 1.33, respectively. cS and cP are velocities of the shear and compression waves. G and ρ are the shear modulus and density of soils. R is the maximum distance from the center of structures to the artificial boundary.
- 3.
- Seismic Load Applied: The dynamic interaction between the free-field motion and the model boundary is transmitted into the numerical model in the form of equivalent nodal forces []. These are expressed aswhere , and , are the boundary displacements and velocities in the normal and tangential directions, while , and , are the corresponding free-field values. In this way, the applied free-field motion drives the boundary, while the spring–dashpot system ensures proper energy absorption. The equivalent nodal force is applied at each boundary node, balancing the difference between the free-field and model responses. This formulation guarantees stable wave transmission across the boundary and accurate simulation of soil–structure interaction under seismic loading.
A three-dimensional eight-node hexahedral finite element (C3D8R) is used to mesh the structure and soil. The mesh size should meet the following requirements:
Among them, ΔXmax is the maximum size of the grid, λmin is the minimum wavelength, cmin is the minimum shear wave velocity, and fmax is the maximum frequency amplitude of the input seismic motion. In order to balance computational efficiency and accuracy, the structural grid size was set to 0.25 m, the closure structure grid size was set to 0.4 m, and the soil grid size was set to 0.5–2.5 m.
To accurately simulate the mechanical behavior and damage evolution of concrete under seismic loads, this study employs the Concrete Damage Plasticity (CDP) [,,] model to define the concrete materials of the main structure and retaining walls of the underground passage. Figure 7 shows the stress-strain curves and damage-strain curves for C30 and C50 concrete of different strength grades. Additionally, the material properties of the C30 and C50 concrete grades are shown in Table 2 and Table 3.
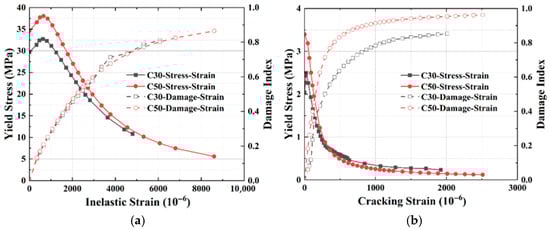
Figure 7.
CPD model of the retaining wall and the underpass: (a) compressive damage; (b) tensile damage.
Table 2.
Material parameters of the CDP model for concrete No. C30.
Table 3.
Material parameters of the CDP model for concrete No. C50.
3.2. Contact Relationships and Input Loads
The contact interactions between the main underpass structure and the retaining wall were modeled using a surface-to-surface contact. The contact relationship of the model is shown in Figure 8. The normal behavior was defined as hard contact, while the tangential behavior was governed by a friction factor of 0.4 and implemented with the penalty function approach.
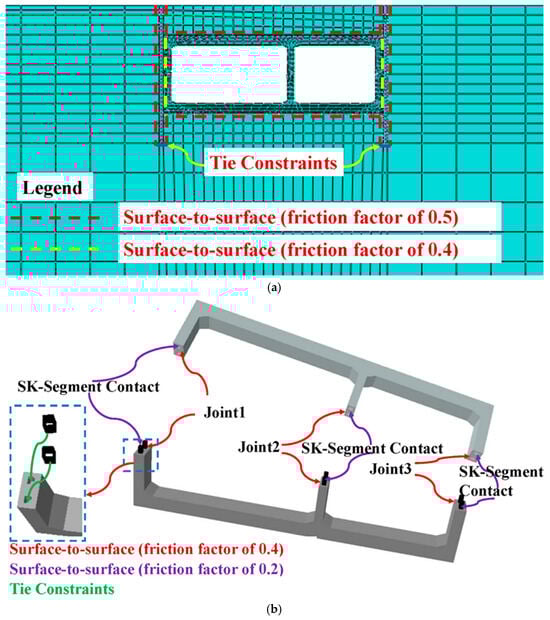
Figure 8.
The contact relationships of the model: (a) main structure, closure structure and the strata; (b) parts of the main structure.
The interface between the retaining wall and the surrounding soil was also modeled using a surface-to-surface contact. Similarly, hard contact was considered the normal behavior, with a friction factor of 0.5 applied to the lateral surfaces. The contact between the bottom of the retaining wall and the ground was specified as a “Tie” contact, which ensures that the two surfaces remain bonded during the analysis.
A surface-to-surface contact was applied to define the interaction between the main underpass structure and the ground. The normal behavior was hard contact, and the friction factor was set to 0.5.
In the prefabricated model, the joint contact between adjacent segments was also modeled as surface-to-surface type, with a friction factor of 0.4. The shear keys that serve to resist the shearing force between segments were simulated using a surface-to-surface contact with a friction factor of 0.2.
The top and bottom areas of joints were prestressed using the “pressure” command. The connecting bolts were not explicitly modeled in the prefabricated structure, given the complex contact relationships, thereby enhancing the computational efficiency.
To ensure the robustness of nonlinear dynamic analysis, three representative earthquake records were selected: the Wolong wave (2008 Wenchuan Earthquake, far-field), Kobe wave (1995 Great Hanshin Earthquake, near-fault), and Northridge wave (1994 Northridge Earthquake, pulse-like motion). All records were scaled to peak ground accelerations (PGA) of 0.1 g, 0.2 g, and 0.4 g to evaluate structural performance under varying seismic intensities. The acceleration time histories and Fourier spectra are presented in Figure 9 and Figure 10, highlighting their distinct frequency content and duration characteristics.
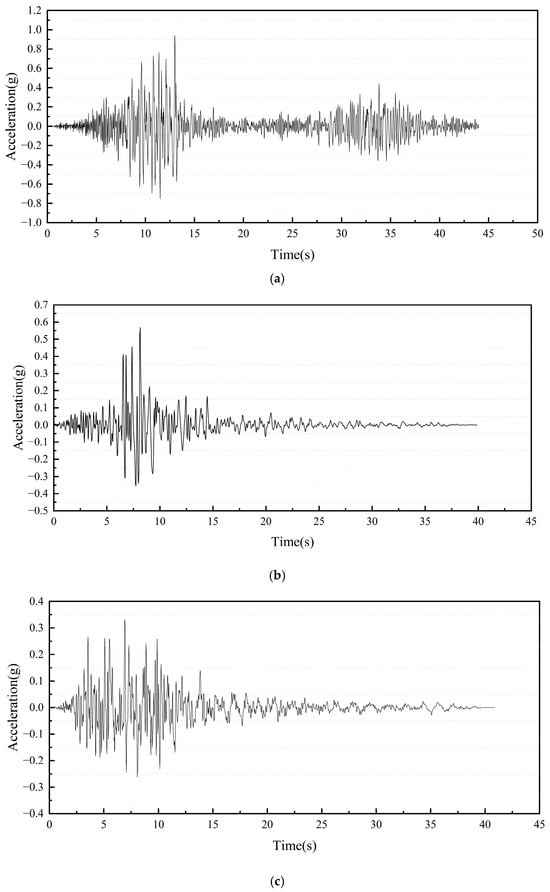
Figure 9.
Acceleration time histories of seismic wave inputs: (a) Wolong wave; (b) Kobe wave; (c) Northridge wave.
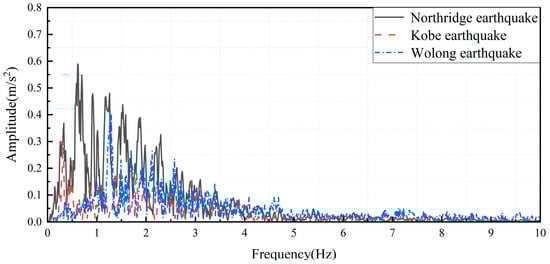
Figure 10.
Fourier amplitude spectrum of the accelerations.
The monitoring points were positioned at the central face of the single ring. The observation point on the ground surface (Point 1) was located at the center of the numerical model’s top surface. Structural response acceleration was monitored at the top, middle, and bottom positions on the left side of the central pillar (Points 2–4), as shown in Figure 10.
4. Evaluation of the Seismic Performance of Prefabricated and Cast-in-Place Underpass
4.1. Response Acceleration of the Ground Surface and Structure
Figure 10 presents the ground-surface response acceleration for both the prefabricated and cast-in-place models under seismic loads of 0.1 g, 0.2 g, and 0.4 g.
The time history curves for the ground response acceleration exhibit a consistent trend across both models. Specifically, the peak response acceleration increases with the rising input seismic load. Under consistent load, the peak value in the prefabricated model is slightly smaller than that in the cast-in-place model. The corresponding amplification factors are illustrated in Figure 11. It can be seen that the difference can be attributed to the higher damping capacity of the prefabricated underpass, which absorbs more seismic energy than the cast-in-place structure.
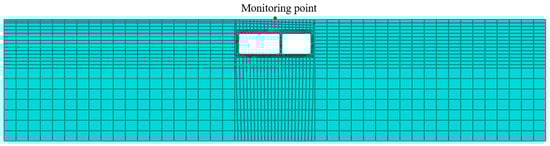
Figure 11.
Monitoring point of the ground surface.
The time history curves of structural response acceleration are shown in Figure 11. It can be concluded that the peak acceleration value increases with the increasing height of the central pillar (Point 2 > Point 3 > Point 4). Despite the growth, the peak values remain considerably lower than those of the ground surface, primarily due to the greater stiffness of the underpass. Additionally, the peak response acceleration elevates when the input seismic load increases. The time history curves for both models closely coincide, suggesting that the prefabricated structure maintains a certain degree of structural integrity. However, the peak acceleration values at the same monitoring points are consistently lower in the prefabricated model than in the cast-in-place model under identical input loads.
The acceleration amplification factor (AAF) derived from Figure 12 shows a consistent, monotonic decline with increasing PGA from 0.1 g to 0.4 g for all three records. This indicates that as shaking intensifies, the near-surface system transmits progressively less of the input peak acceleration to the ground surface. Across motions, a clear ordering is evident: Kobe yields the largest AAFs, Wolong is intermediate, and Northridge is the smallest. Construction method effects are motion-dependent: under Northridge, the prefabricated system tends to produce lower AAFs than the cast-in-place one; under Wolong, differences are modest; and under Kobe, a reversal appears in which the prefabricated system exhibits higher AAF.
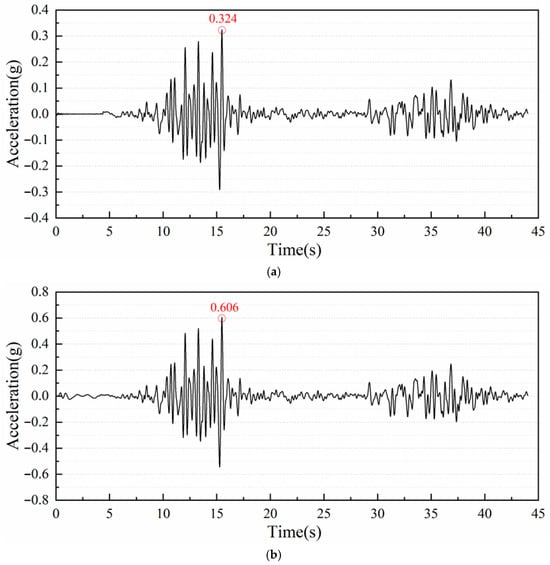
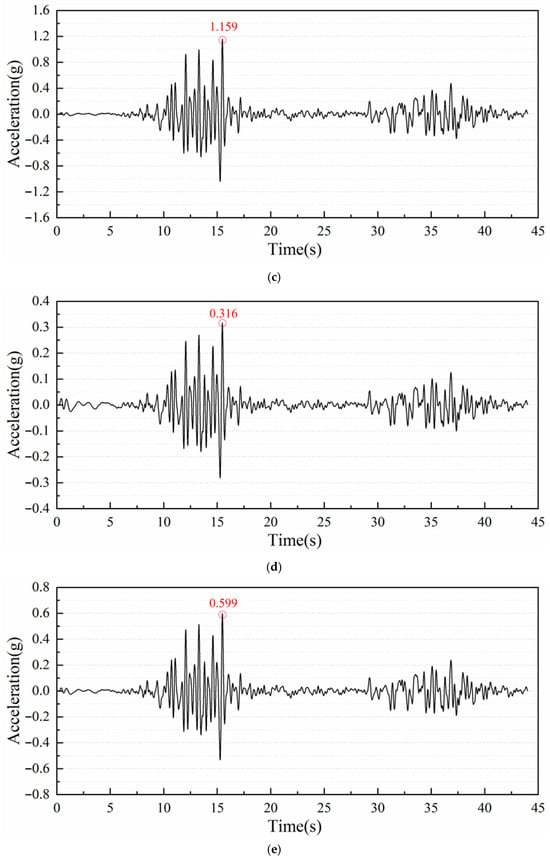
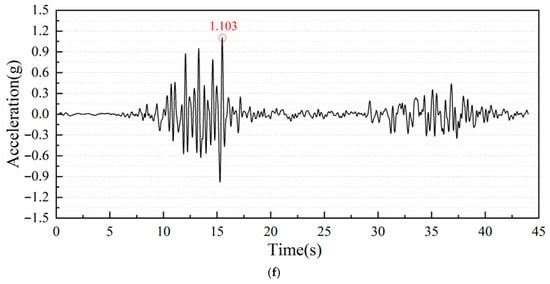
Figure 12.
The ground-surface acceleration response (Wolong wave): (a) prefabricated underpass (0.1 g), (b) prefabricated underpass (0.2 g), (c) prefabricated underpass (0.4 g), (d) cast-in-place underpass (0.1 g), (e) cast-in-place underpass (0.2 g), (f) cast-in-place underpass (0.4 g).
These patterns follow established mechanisms in site response and soil–structure interaction. With increasing PGA, shear strains in the shallow deposits grow, leading to shear-modulus degradation and higher equivalent damping. The combined effects shift and lower transfer-function peaks, thereby suppressing high-frequency transmission and reducing AAF at stronger shaking. Differences among motions reflect frequency-content sensitivity: Kobe, richer in short-to-mid-period energy, aligns with the shallow system’s short periods and more effectively excites amplification; Northridge, dominated by long-period pulses, is comparatively inefficient at amplifying peak accelerations.
The construction-method contrast reflects a stiffness–damping trade-off. Segmental joints in prefabricated systems introduce rotational/sliding compliance and frictional energy dissipation that can increase effective damping and attenuate surface accelerations—consistent with the lower AAF observed for Northridge. However, the same compliance lengthens the system’s effective period. When this period shift moves the system closer to the dominant frequencies of the input—illustrated by the Kobe record—the amplification benefit from frequency matching can offset or exceed the damping benefit, yielding higher AAF.
4.2. Relative Horizontal Displacement
The relative horizontal displacements (RHD) of the three-lane sidewall, the two-lane sidewall, and the middle wall were evaluated for the prefabricated and cast-in-place underpass models under lateral seismic loads of 0.1 g, 0.2 g, and 0.4 g, as shown in Figure 13. Monitoring lines were established along the height of the three-lane and two-lane sidewalls and along the left side of the middle wall. The results indicate that the RHD at the three-lane sidewall is the largest under all seismic loads, followed by the two-lane sidewall, with the smallest displacement occurring at the middle wall. Additionally, the RHD in the prefabricated model is consistently greater than that in the cast-in-place model at the same position and under consistent seismic load.
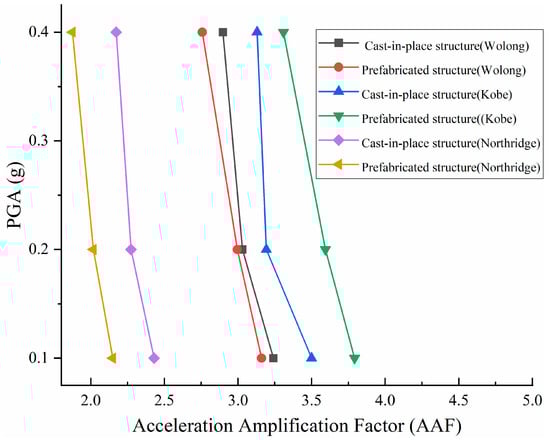
Figure 13.
Surface acceleration amplification factors under different seismic inputs.
The maximum RHD occurs at the junction of the three-lane sidewall and the bottom slab, specifically at a height of 1.35 m for all computed models. This behavior can primarily be attributed to the soil’s enhanced restraining effect on the structure from the bottom to the top. The RHD at the same monitoring line increases with the elevating seismic load amplitude. The maximum RHD for the prefabricated model occurs at the three-lane sidewall under a 0.4 g seismic load, reaching 23.7 mm. In comparison, the cast-in-place model subjected to the same seismic load exhibits a maximum RHD of 19.4 mm, representing a reduction of 4.6 mm (approximately 19.4%) compared to the prefabricated model.
For both models, the RHD at the three-lane and two-lane sidewalls changes greatly at their junction with the top and bottom slabs, with a pronounced variation in stiffness also occurring in this area. Notably, the magnitude of these changes varies considerably. The joint between the two sidewalls and the bottom slab experiences a much larger change than between the sidewalls and the top slab, primarily due to the increased soil stiffness with depth.
The middle wall RHD in all computed cases tends to shift toward the left side of the structure across different underpass spans. Despite such alignment, some variations in this regard are observed across the different cases. For the prefabricated model under a 0.1 g load, the RHD is similar to that in the cast-in-place model for all load inputs. When the seismic load amplitude further increases, the middle wall RHD exhibits noticeable changes at joints, as depicted in Figure 14b,c. The RHD at the uppermost part of the middle wall increases with growing height and closer distance toward the three-lane span. This is mainly attributed to the structural asymmetry of the system.
Figure 14.
Horizontal displacement along the height of the sidewalls and middle wall under Wolong wave: (a) prefabricated underpass (0.1 g), (b) prefabricated underpass (0.2 g), (c) prefabricated underpass (0.4 g), (d) cast-in-place underpass (0.1 g), (e) cast-in-place underpass (0.2 g), (f) cast-in-place underpass (0.4 g).
According to Chinese seismic design codes, the interlayer displacement angle (also referred to as the drift ratio) is a crucial index for assessing the seismic performance of above-ground structures. This parameter has been extended to the evaluation of underground structures for the same purpose. Accordingly, the present study measured the largest interlayer displacement angle at the three-lane sidewall, as discussed in the previous analysis. The interlayer displacement angle is defined as the ratio of RHD to the structure height. It can be observed that the maximum interlayer displacement angle occurs consistently at the three-lane sidewall for models under all seismic load inputs. The elastic flexibility limit and the plasticity limit were specified as 1/550 and 1/250, respectively.
Table 4 presents the inter-storey drift ratios of cast-in-place and prefabricated underpasses subjected to Wolong, Kobe, and Northridge motions at PGA levels of 0.1 g, 0.2 g, and 0.4 g. The inter-storey drift ratios were further assessed against code-based limits of 1/550 (≈0.00182), representing a strict deformation requirement, and 1/250 (≈0.004), representing an upper bound of acceptable drift in seismic design.
Table 4.
Inter-storey drift ratio for CIP and prefabricated underpass under different seismic loads.
For the cast-in-place underpass, all values are comfortably below the 1/550 threshold across all seismic inputs and PGA levels. Even under the most critical condition (Northridge motion at 0.4 g), the maximum drift ratio is 1/1875 (≈0.00053), which is only 29% of the 1/550 limit. This confirms that the monolithic configuration provides excellent stiffness and deformation control, ensuring a substantial safety margin.
For the prefabricated underpass, performance is more variable. At low intensity (0.1 g), all drift ratios remain below 1/550, suggesting adequate serviceability. At moderate intensity (0.2 g), several values fall between 1/550 and 1/250. For example, under Northridge motion, the 3-lane wall reaches 1/842 (≈0.00119), which exceeds the strict limit but remains below the ultimate one. This indicates that the structure may experience serviceability concerns under moderate shaking. At high intensity (0.4 g), several cases exceed the 1/250 threshold, particularly for outer walls. The Northridge 3-lane wall shows the most critical value, 1/489 (≈0.00204), which surpasses both deformation limits, indicating a potential seismic safety deficiency.
Wall position exerts a significant influence. The middle wall remains within 1/550 under all conditions, even at 0.4 g, while the outer 3-lane wall consistently controls the safety margin, being the first to exceed 1/550 and, under strong shaking, 1/250. This is explained by the asymmetric boundary restraint, with middle walls benefiting from bilateral confinement and outer walls subjected to unilateral soil–structure interaction.
Taken together, these results highlight a clear contrast: cast-in-place underpasses satisfy the most stringent drift requirements with a wide safety margin, whereas prefabricated underpasses may fail to meet even the 1/250 limit under strong motions, particularly at outer walls.
4.3. Joint Deformation of the Prefabricated Underpass
The deformation of joints is one of the most critical aspects governing the seismic safety of prefabricated underground structures. The prefabricated model joints are denoted as J1, J2, and J3, corresponding to locations at the three-lane sidewall, the middle wall joint, and the two-lane sidewall joint, respectively. The joint deformation is shown in Figure 15 (Wolong wave).
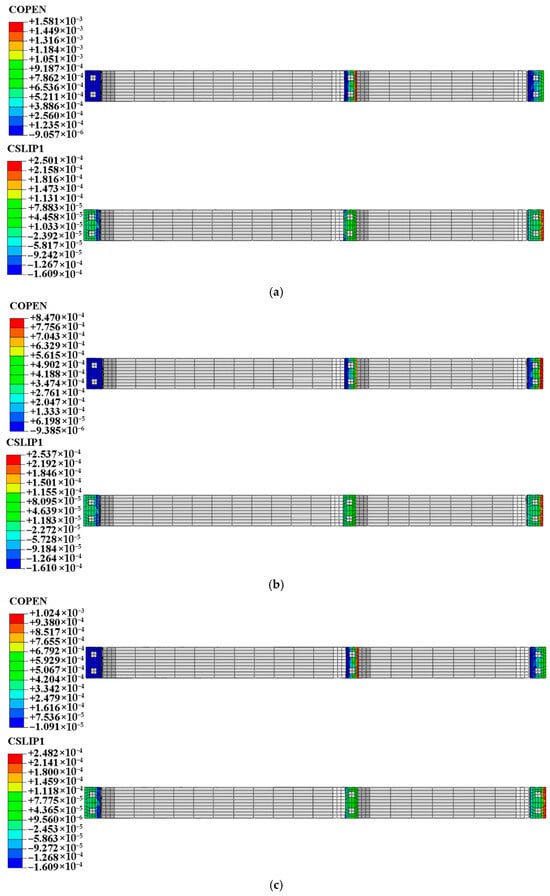
Figure 15.
Joint deformation of prefabricated underpass (Wolong wave): (a) 0.1 g, (b) 0.2 g, (c) 0.4 g.
The slip dominates the deformation mode at J1, with negligible opening displacement. In contrast, J3 is characterized by the most noticeable opening deformation among the three joints. J2 experiences a combination of opening on the right side (toward the two-lane span) and closing on the left side (toward the three-lane span), accompanied by sliding deformation towards the right.
Table 5 summarizes the joint opening and slipping responses under three representative seismic excitations—Wolong, Kobe, and Northridge—at multiple peak ground accelerations (PGAs). The results reveal a complex interplay between seismic intensity, wave frequency content, and joint position, which collectively determine the mechanical response of the discontinuities.
Table 5.
Joint deformation for prefabricated underpass under different seismic loads.
First, seismic intensity plays a dominant role in dictating the magnitude of joint deformation. In all three ground motions, joint openings and slips increased as PGA rose from 0.1 g to 0.4 g, though the growth trends differed between opening and slipping. For example, under Northridge excitation, Joint 1 opening increased from 0.096 mm at 0.1 g to 0.202 mm at 0.4 g, while slipping rose more steeply from 0.011 mm to 0.278 mm. This indicates that sliding deformation is more sensitive to incremental seismic loading, while joint opening tends to exhibit a saturation effect once tensile capacity is mobilized. To quantify this, the slip-to-opening ratio of Joint 1 under Northridge motion rose from 0.11 at 0.1 g to 1.38 at 0.4 g, highlighting a transition from tensile-dominated to shear-dominated deformation as shaking intensity increased.
Second, the characteristics of the seismic input significantly influenced joint responses. The Wolong motion, rich in mid-to-high frequency content, produced the most severe openings in central joints, with Joint 2 opening reaching 1.582 mm at 0.4 g. Conversely, the Kobe wave, dominated by lower frequencies, induced smaller and smoother joint responses, with openings remaining below 1 mm even at 0.4 g. The Northridge wave, which contains strong velocity pulses, triggered both large openings and significant slipping, particularly at Joint 3. At a PGA of 0.4 g, Joint 3 slip reached 0.403 mm, nearly double that of Kobe excitation at the same intensity. This suggests that impulsive seismic motions tend to intensify shear dislocation, posing greater risks for waterproofing performance.
Third, joint position effects were evident across all scenarios. Midspan joints (Joint 2) generally exhibited the largest openings, whereas edge joints (Joint 3) experienced the greatest slipping. For example, under Wolong excitation at 0.4 g, the opening of Joint 2 (1.582 mm) was nearly 12.5 times greater than that of Joint 1 (0.126 mm). In contrast, the slipping of Joint 3 under Northridge excitation at 0.4 g (0.403 mm) was about 1.45 times larger than Joint 1 (0.278 mm). These disparities reflect structural mechanics: midspan regions are subjected to greater flexural demand, while edges experience intensified shear and rotation effects due to boundary constraints.
Finally, nonlinear and saturation phenomena were observed. For example, the opening of Joint 1 under Wolong motion increased from 0.062 mm at 0.1 g to 0.124 mm at 0.2 g but then plateaued at 0.126 mm when PGA rose to 0.4 g. This implies that once tensile deformation reaches a threshold, additional seismic energy is dissipated primarily through sliding friction rather than further widening. Such behavior underscores the dual role of joints as both structural vulnerabilities and energy dissipators.
In engineering practice, these findings emphasize the necessity of differentiated design strategies. Reinforcement of midspan joints should focus on enhancing tensile resistance to limit excessive opening, whereas edge joints require strengthening of shear transfer mechanisms and frictional resistance to mitigate sliding. Moreover, the contrasting responses under Wolong, Kobe, and Northridge waves demonstrate the importance of considering a broad spectrum of seismic input motions during design, rather than relying on a single representative record.
5. Conclusions
This study investigated the seismic response of prefabricated and cast-in-place underpass structures in urban areas, with particular emphasis on asymmetric prefabricated underpass tunnels. A comparative numerical analysis was performed against a conventional monolithic cast-in-place structure, focusing on ground response acceleration, inter-storey drift ratios, and joint deformations. The main conclusions can be summarized as follows:
- (1)
- Both structural systems exhibit increasing peak accelerations with stronger seismic input. Under equivalent ground motion, the prefabricated structure consistently demonstrates a slight reduction in acceleration compared with the monolithic cast-in-place structure, indicating a damping effect. The maximum reduction in amplification factor reaches approximately 32%, confirming the capacity of joint flexibility to dissipate energy.
- (2)
- The largest displacement concentration occurs at the three-lane sidewall, reflecting the influence of structural asymmetry. The center wall experiences the smallest displacement, while the two-lane sidewall falls in between. For the prefabricated structure, the maximum inter-storey drift ratio reaches 1/489, remaining below the plastic limit of 1/250 and thereby indicating that the structure largely retains its integrity under a peak input acceleration of 0.4 g.
- (3)
- The seismic-induced joint deformations of the prefabricated structure are characterized by maximum tensile opening at the two-lane sidewall joint and maximum slip at the three-lane sidewall joint. The recorded maximum opening is 1.6 mm, below the commonly accepted deformation threshold of 2 mm used in shield tunnel practice. These results suggest that both waterproofing and alignment requirements can be satisfied under the studied loading conditions.
Several limitations should be acknowledged in this paper. The soil–structure interaction was modeled using homogeneous parameters and viscoelastic boundaries, which may not fully capture the effects of stratification, nonlinearity, and groundwater. The seismic loading set was limited in number and variability, and construction imperfections such as joint tolerances and material inconsistencies were not considered. Furthermore, the analysis was confined to a single underpass geometry, limiting the generalizability of the findings.
Future work should incorporate site-specific, nonlinear soil models, a broader range of seismic excitations—including multi-directional and near-fault ground motions—and experimental validation through shake table tests. Additional research on connection detailing, life-cycle performance under deterioration, and multi-hazard scenarios will further advance understanding of the seismic resilience of both prefabricated and cast-in-place underpasses. Moreover, integrating carbon emission assessments and life-cycle cost analyses will enable a more holistic evaluation that considers not only seismic safety but also environmental and economic sustainability.
Author Contributions
Validation, J.W. and Z.J.; Investigation, Z.J.; Data Curation, N.X., K.Z. and J.W.; Writing—Original Draft Preparation, Z.J. and N.X.; Writing—Review and Editing, Z.J. and J.W. All authors have read and agreed to the published version of the manuscript.
Funding
This research received no funding.
Data Availability Statement
The original contributions presented in the study are included in the article, and further inquiries can be directed to the corresponding author.
Acknowledgments
We would like to express our gratitude to XinJiang Key Lab of Building Structure and Earthquake Resistance, Xinjiang University, and Tianchi Talent Plan of Xinjiang Uygur Autonomous Region. The authors would like to acknowledge the Editor and two anonymous referees for their evaluation of the paper.
Conflicts of Interest
The authors declare no conflicts of interest.
References
- Wang, L.; Chen, X.; Su, D.; Liu, S.; Liu, X.; Jiang, S.; Gao, H.; Yang, W. Mechanical performance of a prefabricated subway station structure constructed by twin closely-spaced rectangular pipe-jacking boxes. Tunn. Undergr. Space Technol. 2023, 135, 105062. [Google Scholar] [CrossRef]
- Wang, L.; Chen, K.; Chen, X.; Su, D.; Liu, S.; Sun, B.; Li, W.; Yang, W.; Zhou, S. Low-carbon effects of constructing a prefabricated subway station using a trenchless method: A case study in Shenzhen, China. Tunn. Undergr. Space Technol. 2024, 144, 105557. [Google Scholar] [CrossRef]
- Yang, X.; Lin, F.; Huang, M. Experimental Research on Bending Bearing Capability of Grouted Double Mortise-Tenon Joint for Prefabricated Metro Station Structure. Adv. Civ. Eng. 2021, 2021, 6635409. [Google Scholar] [CrossRef]
- Yang, X.; Lin, F. Prefabrication technology for underground metro station structure. Tunn. Undergr. Space Technol. 2021, 108, 103717. [Google Scholar] [CrossRef]
- Wu, J.; Ma, S.; Wang, R.; Ou, F.; Liang, Y.; Zhao, W.; Xie, K.; Wang, S. A novel technique for constructing prefabricated subway stations under open excavation. Proc. Inst. Civ. Eng.—Eng. Sustain. 2024, 177, 299–308. [Google Scholar] [CrossRef]
- Yang, X.; Lin, F. Research on prefabricated metro station structure and key assembly technologies. Tunn. Undergr. Space Technol. 2024, 153, 106029. [Google Scholar] [CrossRef]
- Jin, Z.; Qi, T.; Liang, X. Evaluation of the Structural and Waterproof Performance of a Precast and Assembly Underpass under Long-Term Surface Dynamic Loads. Tunn. Undergr. Space Technol. 2021, 115, 104047. [Google Scholar] [CrossRef]
- Ma, C.; Zhao, Y.; Dong, H.; Du, X. Comparative Study on Seismic Performance of Subway Stations Using Reinforced Concrete Cast-in-Place Columns and Truncated Columns. Soil Dyn. Earthq. Eng. 2023, 169, 107862. [Google Scholar] [CrossRef]
- Shen, Y.; El Naggar, M.H.; Zhang, D.-M.; Li, L.; Du, X. Seismic Response Characteristics of Shield Tunnel Structures in Liquefiable Soils. Soil Dyn. Earthq. Eng. 2024, 182, 108701. [Google Scholar] [CrossRef]
- Pan, W.; Zhang, H.; Hei, S.; Huang, B.; He, R.; Chai, X.; Shao, Z. A Component-Design-Based Carbon Emission Calculation Method in the Life Cycle of a Prefabricated Building Structural Member System. Buildings 2024, 14, 3994. [Google Scholar] [CrossRef]
- Wang, G.; Lu, D.; Ji, G.; Liang, X.; Lin, Q.; Lv, J.; Du, X. A lifecycle carbon emission evaluation model for urban underground highway tunnel facilities. Undergr. Space 2025, 24, 352–370. [Google Scholar] [CrossRef]
- Liu, C.; Peng, Z.; Cui, J.; Huang, X.; Li, Y.; Chen, W. Development of Crack and Damage in Shield Tunnel Lining under Seismic Loading: Refined 3D FEM and Analyses. Thin-Walled Struct. 2023, 185, 110647. [Google Scholar] [CrossRef]
- Zhuang, H.; Zhao, C.; Chen, S.; Fu, J.; Zhao, K.; Chen, G. Seismic Performance of Underground Subway Station with Sliding between Column and Longitudinal Beam. Tunn. Undergr. Space Technol. 2020, 102, 103439. [Google Scholar] [CrossRef]
- Tao, L.; Ding, P.; Shi, C.; Wu, X.; Wu, S.; Li, S. Shaking Table Test on Seismic Response Characteristics of Prefabricated Subway Station Structure. Tunn. Undergr. Space Technol. 2019, 91, 102994. [Google Scholar] [CrossRef]
- Ding, P.; Tao, L.; Yang, X.; Zhao, J.; Shi, C. Three-Dimensional Dynamic Response Analysis of a Single-Ring Structure in a Prefabricated Subway Station. Sustain. Cities Soc. 2019, 45, 271–286. [Google Scholar] [CrossRef]
- Bazaios, K.; Gerolymos, N.; Bouckovalas, G.; Chaloulos, Y.K. SSI effects on seismic settlements of shallow foundations on sand. Soil Dyn. Earthq. Eng. 2022, 155, 107025. [Google Scholar] [CrossRef]
- Iida, H.; Hiroto, T.; Yoshida, N.; Iwafuji, M. Damage to Daikai Subway Station. Soils Found. 1996, 36, 283–300. [Google Scholar] [CrossRef]
- Lu, C.-C.; Hwang, J.-H. Nonlinear Collapse Simulation of Daikai Subway in the 1995 Kobe Earthquake. Tunn. Undergr. Space Technol. 2019, 87, 78–90. [Google Scholar] [CrossRef]
- Nguyen, V.-Q.; Nizamani, Z.A.; Park, D.; Kwon, O.-S. Numerical Simulation of Damage Evolution of Daikai Station during the 1995 Kobe Earthquake. Eng. Struct. 2020, 206, 110180. [Google Scholar] [CrossRef]
- Xu, Z.; Du, X.; Xu, C.; Hao, H.; Bi, K.; Jiang, J. Numerical Research on Seismic Response Characteristics of Shallow Buried Rectangular Underground Structure. Soil Dyn. Earthq. Eng. 2019, 116, 242–252. [Google Scholar] [CrossRef]
- Wu, W.; Ge, S.; Yuan, Y.; Ding, W.; Anastasopoulos, I. Seismic Response of Subway Station in Soft Soil: Shaking Table Testing versus Numerical Analysis. Tunn. Undergr. Space Technol. 2020, 100, 103389. [Google Scholar] [CrossRef]
- Zhang, Z.; Li, Y.; Xu, C.; Du, X.; Dou, P.; Yan, G. Study on Seismic Failure Mechanism of Shallow Buried Underground Frame Structures Based on Dynamic Centrifuge Tests. Soil Dyn. Earthq. Eng. 2021, 150, 106938. [Google Scholar] [CrossRef]
- Sharma, S.; Judd, W.R. Underground opening damage from earthquakes. Eng. Geol. 1991, 30, 263–276. [Google Scholar] [CrossRef]
- Kouroussis, G.; Verlinden, O.; Conti, C. Finite-Dynamic Model for Infinite Media: Corrected Solution of Viscous Boundary Efficiency. J. Eng. Mech. 2011, 137, 509–511. [Google Scholar] [CrossRef]
- St John, C.M.; Zahrah, T.F. Aseismic design of underground structures. Tunn. Undergr. Space Technol. 1987, 2, 165–197. [Google Scholar] [CrossRef]
- Wang, J.; Ma, G.; Zhuang, H.; Dou, Y.; Fu, J. Influence of Diaphragm Wall on Seismic Responses of Large Unequal-Span Subway Station in Liquefiable Soils. Tunn. Undergr. Space Technol. 2019, 91, 102988. [Google Scholar] [CrossRef]
- Lu, D.; Wu, C.; Ma, C.; Du, X.; El Naggar, M.H. A Novel Segmental Cored Column for Upgrading the Seismic Performance of Underground Frame Structures. Soil Dyn. Earthq. Eng. 2020, 131, 106011. [Google Scholar] [CrossRef]
- Jin, Z.; Qi, T.; Liang, X.; Lei, B. Optimized Partition Scheme for Prefabricated Underpass with Large Cross Section. Adv. Civ. Eng. 2021, 2021, 8820287. [Google Scholar] [CrossRef]
- Xu, C.; Zhang, Z.; Li, Y.; Du, X.; Dou, P.; Yan, G. Validation of a Numerical Model Based on Dynamic Centrifuge Tests and Studies on the Earthquake Damage Mechanism of Underground Frame Structures. Tunn. Undergr. Space Technol. 2020, 104, 103538. [Google Scholar] [CrossRef]
- Du, X.L.; Liu, H.T.; Lu, D.C.; Xu, C.S.; Luo, F.R.; Li, S.M. Study on seismic performance of sidewall joints in assembled monolithic subway station. China Civ. Eng. J. 2017, 50, 38–47. [Google Scholar] [CrossRef]
- Tsinidis, G.; Rovithis, E.; Pitilakis, K.; Chazelas, J.L. Seismic response of box-type tunnels in soft soil: Experimental and numerical investigation. Tunn. Undergr. Space Technol. 2016, 59, 199–214. [Google Scholar] [CrossRef]
- Tao, L.; Ding, P.; Yang, X.; Lin, P.; Shi, C.; Bao, Y.; Wei, P.; Zhao, J. Comparative study of the seismic performance of prefabricated and cast-in-place subway station structures by shaking table test. Tunn. Undergr. Space Technol. 2020, 105, 103583. [Google Scholar] [CrossRef]
- Mavroeidis, G.P.; Papageorgiou, A.S. A Mathematical Representation of Near-Fault Ground Motions. Bull. Seismol. Soc. Am. 2003, 93, 1099–1131. [Google Scholar] [CrossRef]
- Baker, J.W. Quantitative Classification of Near-Fault Ground Motions Using Wavelet Analysis. Bull. Seismol. Soc. Am. 2007, 97, 1486–1501. [Google Scholar] [CrossRef]
- Krauthammer, T.; Chen, Y. Free field earthquake ground motions: Effects of various numerical simulation approaches on soil-structure interaction results. Eng. Struct. 1988, 10, 85–94. [Google Scholar] [CrossRef]
- Sun, F.; Shi, L.; Wang, J.; Wang, G. Seismic response analysis of close-distance cross tunnels: Shaking table test and numerical parameter analysis. Structures 2023, 50, 1670–1685. [Google Scholar] [CrossRef]
- Duan, X.; Dong, Q.; Ye, W. Experimental study on seismic performance of prefabricated utility tunnel. Adv. Civ. Eng. 2019, 2019, 8968260. [Google Scholar] [CrossRef]
- Xie, J.; Xu, Q.; Lu, L.; Sun, J.; Wu, C.; Han, S. Experimental and simulation investigation on seismic performance and failure mechanism of a new-type middle slab joints in prefabricated assembled metro stations. Eng. Fail. Anal. 2025, 181, 109955. [Google Scholar] [CrossRef]
- Chen, J.; Xu, C.; El Naggar, H.M.; Du, X. Seismic response analysis of rectangular prefabricated subway station structure. Tunn. Undergr. Space Technol. 2023, 131, 104795. [Google Scholar] [CrossRef]
- Liu, J.; Du, Y.; Du, X.; Wang, Z.; Wu, J. 3D Viscous-Spring Artificial Boundary in Time Domain. Earthq. Eng. Eng. Vib. 2006, 5, 93–102. [Google Scholar] [CrossRef]
- Gao, Z.; Zhao, M.; Du, X.; Zhong, Z. A generalized response spectrum method for seismic response analysis of underground structure combined with viscous-spring artificial boundary. Soil Dyn Earthq Eng. 2021, 140, 106451. [Google Scholar] [CrossRef]
- Li, Y.; Wei, H. Methods of Assessing the Damage Capacity of Input Seismic Motions for Underground Structures. Buildings 2024, 14, 996. [Google Scholar] [CrossRef]
- Lubliner, J.; Oliver, J.; Oller, S.; Onate, E. A Plastic-Damage Model for Concrete. Int. J. Solids Struct. 1989, 25, 299–326. [Google Scholar] [CrossRef]
- Lee, J.; Fenves, G.L. Plastic-Damage Model for Cyclic Loading of Concrete Structures. J. Eng. Mech. 1998, 124, 892–900. [Google Scholar] [CrossRef]
- Zhao, L.; Zhang, L.; Mao, J.; Liu, Z. An elastoplastic damage model of concrete under cyclic loading and its numerical implementation. Eng Fract Mech. 2022, 273, 108714. [Google Scholar] [CrossRef]
Disclaimer/Publisher’s Note: The statements, opinions and data contained in all publications are solely those of the individual author(s) and contributor(s) and not of MDPI and/or the editor(s). MDPI and/or the editor(s) disclaim responsibility for any injury to people or property resulting from any ideas, methods, instructions or products referred to in the content. |
© 2025 by the authors. Licensee MDPI, Basel, Switzerland. This article is an open access article distributed under the terms and conditions of the Creative Commons Attribution (CC BY) license (https://creativecommons.org/licenses/by/4.0/).