Abstract
In geotechnical engineering, when the natural soil fails to meet the requirements of engineering projects, the soil is often treated by means of compaction and chemical stabilization. China is the world’s largest producer and consumer of cement, making the use of cement highly cost-effective. A large number of studies on cement-stabilized soil have proven that it has good engineering properties. When using cement stabilization to reinforce soil, compaction is often combined to achieve better results. This paper directly proposes that changes in compaction energy will affect the optimum moisture content (OMC) and maximum dry density (MDD) of cement-stabilized soil. From the perspective of changes in cement content and compaction energy, three levels of compaction energy and five levels of cement content are set to systematically analyze the variation trends of liquid limit, plastic limit, and compaction characteristics of stabilized soil under the combined action of cement stabilization and traditional compaction. The results show that with the increase in the cement content, the modified soil exhibits plasticity over a wide range of moisture content due to an increased liquid limit. When the cement content is high, and the compaction energies is low, the soil shows an uncompacted state. This state will decrease significantly with the increase in compaction energy. Both the OMC and the MDD change with the variation of the compaction energies and the cement content.
1. Introduction
In geotechnical engineering, the technique of improving soil properties and mechanical performance by incorporating stabilizing agents to meet technical and economic requirements has been widely employed []. Zhu et al. [] classified thousands of common modification materials for raw earth construction into five major categories: organic materials, inorganic materials, polymer materials, microbial techniques, and hybrid materials. As the world’s largest producer and consumer of cement [], China finds cement utilization more operationally convenient and cost-effective compared to other stabilizing materials.
Additionally, cement, a leading traditional soil stabilizer, is widely recognized for its effectiveness either as a sole agent or in composite stabilizers [,,]. Cement-modified soils demonstrate significantly enhanced engineering properties compared to untreated soils. Cao et al. [] classified cement-treated soils into two categories, including cement-stabilized soils and cement-reinforced soils, measuring their unconfined compressive strength (UCS) and revealing that the strength of cement-stabilized soils increases proportionally with cement content. Tao et al. [] investigated the permeability coefficient of cement–clay mixtures with varying cement dosages, finding that the permeability coefficient decreases with increasing cement content, though exhibiting distinct variation patterns across different dosage ranges. Tan et al. [] conducted direct shear tests on cement-stabilized soils under varying curing temperatures, cement contents, and curing ages, demonstrating that silty clays containing cement exhibit enhanced shear strength at different magnitudes compared to untreated soils.
Cement-stabilized soil (CSS), leveraging its superior strength and impermeability, has witnessed expanding applications in civil engineering, particularly demonstrating significant utility in projects such as temporary airfield pavement bases [], railway subgrade reinforcement [], dam slope stabilization [], composite foundation reinforcement [,], and underground liquefied natural gas storage []. Most of the aforementioned studies on the engineering application of cement-stabilized soil have limited the dry density of stabilized soil to a fixed value under different cement content conditions, rather than optimizing it to approach the optimal compaction conditions. They have not considered that the compaction characteristics of cement-stabilized soil will change with variations in cement content, and the maximum dry density (MDD) will also change accordingly. To maximize CSS’s engineering performance, compaction is critical to further enhance its compactness, load-bearing capacity, and stability, thereby ensuring the durability and safety of structural systems.
Internationally, numerous scholars have focused on cement-stabilized soils, conducting comprehensive investigations into their engineering properties under optimal compaction conditions. Roland et al. [] conducted an in-depth investigation on the effects of quarry fines (QFs) on the engineering behavior of cement-stabilized laterite, revealing that the stone powder admixture enhances the plasticity index and MDD of cement-stabilized soils through plastic limit reduction, with these parameters progressively increasing with higher percentages of stabilizing agent mixtures. T. Thyagaraj et al. [] systematically examined the impact of compaction delay time on the compaction characteristics of cement-treated expansive soils. During the delay period, particle agglomeration phenomena generate resistance to compaction energy, resulting in decreased dry density of compacted soil. Furthermore, MDD exhibits a gradual decreasing trend with extended delay durations. Nazari et al. [] investigated compaction characteristics under varying cement contents and analyzed the influence of different delay durations on the mechanical and consolidation properties of cement-stabilized soils under optimal compaction conditions. Baghini et al. [] performed large-mold light compaction tests on aggregates with different cement contents, demonstrating that both OMC and MDD increase proportionally with cement content. Kenai S et al. [] studied the influence of different compaction methods on the performance of cement-stabilized soil. The above studies indicate that even under the optimal compaction state, changes in the plasticity index, compaction delay time, cement content, and compaction method can all have an impact on the OMC and MDD of cement-stabilized soil. However, there are very few studies on the specific manner in which compaction energy affects the MDD and OMC of cement-stabilized soil. To explore the influence of compaction energy on the compaction characteristics of cement-stabilized soil, this study classifies different compaction methods into compaction energy, uses compaction energy as an experimental variable, and strictly controls the cement mixing time (i.e., the time interval from cement incorporation into the soil to the start of compaction) during the experiment to conduct compaction tests.
Compaction tests enable the determination of the OMC corresponding to the densest state of soil mixtures under specific compaction energy, while varying compaction energy levels leads to alterations in both OMC and MDD. Taking cement-stabilized soil as an example, this paper first measures the changes in liquid limit and plastic limit of cement-stabilized soil under different cement dosages by varying the cement content and calculates the variation trend of the plasticity index. Subsequently, multiple compaction tests with different compaction energies are carried out to study the compaction characteristics under different compaction energies and cement dosages, which is of great significance for the rational utilization of materials and reduction in project costs. Then, range analysis is used to analyze the test data to determine which influencing factor has a greater impact on the OMC and MDD.
2. Experimental Materials and Methodology
2.1. Experimental Materials
The experimental soil was collected from a construction site behind a university campus in Taiyuan City, Shanxi Province. The basic physical properties of the retrieved soil samples were determined in accordance with the Standard for Geotechnical Testing Methods (GB/T 50123-2019) []. The test results revealed a specific gravity of soil solids of 2.70, with liquid limit and plastic limit measured at 27.76% and 17.14%, respectively. The particle size distribution curve of the soil is presented in Figure 1.
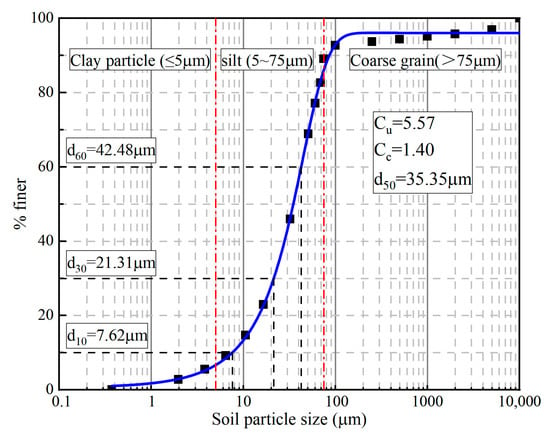
Figure 1.
Particle size distribution curve of the soil.
Based on the particle size distribution curve of the soil, it can be observed that the coarse-grained fraction content is less than 25%. According to the Standard for Engineering Classification of Soil (GB/T 50145-2007) [], the experimental soil is classified as fine-grained soil. With the measured plasticity index of 10.62 obtained from laboratory tests, the experimental soil is ultimately identified as low-liquid-limit clay.
The experimental cement employed was Taoyuan brand, Grade PO 42.5 ordinary Portland cement, complying with the current national standard Universal Portland Cement (GB 175-2023) []. The particle size distribution and specific surface area characteristics of the cement used in the tests are provided in Table 1.

Table 1.
Specific surface area and particle size distribution of cement.
Although cement particles are finer than soil particles, they possess a higher density and significantly larger specific surface area. When mixed with soil, cement particles achieve more extensive contact with soil particle surfaces, facilitating physicochemical interactions.
2.2. Variable Settings
This study explores the effects of compaction energy and cement content on the compaction characteristics of cement-stabilized soil. During cement incorporation, the internal mixing method was employed to determine cement mass. Building upon existing research on cement-modified soils in loess regions and considering mixing methodologies, the cement dosages were ultimately established as 2.5%, 5%, 7.5%, and 10%. Plain soil specimens were included as reference controls during testing. The cement dosage is defined as the ratio of dry cement mass to wet soil mass, a calculation approach adopted based on the three-phase material system characteristics of soil.
In the formula, denotes the cement content; and represent the masses of dry cement and wet soil, respectively.
Given the inherent characteristics of fine-grained and highly cohesive soil particles, a small mold was selected for the compaction test. This soil type demonstrates superior cohesive properties, enabling it to achieve adequate densification through light compaction. Concurrently, the cement particles, characterized by their fine granulometry, exhibit minimal particle breakage during compaction. Instead, they primarily migrate with pore water movement to fill interstitial voids within the soil matrix. These combined mechanisms substantiate the technical rationale for employing light compaction methodology in this procedure.
Building upon standard compaction protocols, a comparative analysis was implemented to elucidate the impact of compaction energy on densification characteristics. This investigation established the number of hammer blows per layer as the controlled variable, introducing contrasting scenarios with distinct compaction energy levels: one group was subjected to elevated energy inputs, and the other was subjected to reduced energy applications.
The experimental factors and their corresponding levels for various influencing parameters are systematically compiled in Table 2.

Table 2.
Parameters and units in the formula.
The factors and their corresponding levels of different influencing parameters are summarized to obtain the sample numbers for this experiment, as shown in Table 3.

Table 3.
Number of samples for cement-stabilized soil test.
2.3. Experimental Method
All tests involved in this study were conducted in accordance with the Standard for Geotechnical Testing Methods (GB/T 50123-2019) []. For the determination of liquid and plastic limits of plain soil and modified soil, the collected soil samples were air-dried, pulverized, and sieved through a 0.5 mm mesh. Three distinct moisture states were prepared by adding varying amounts of water. The mixtures were then sealed and cured for 18 h to ensure homogeneous moisture distribution. For plain soil, the cone penetration depth was measured directly. For cement-modified soil, predetermined cement contents (by mass) were thoroughly mixed into the soil until a uniform consistency was achieved (no visible cement streaks when smoothed with a spatula), followed by cone penetration testing. Each condition was tested in triplicate, with the final results reported as the mean values.
In this study, to ensure that the three data points align collinearly on a double logarithmic coordinate system, the cone penetration depths under the three moisture states were controlled within a predefined range. For cases with higher cement dosages, proportional water addition was implemented prior to the curing process to maintain hydration equilibrium.
The compaction test procedure involves first sieving air-dried soil in a disaggregated state through a 5 mm sieve and determining its moisture content. Five groups of soil with varying moisture content levels are prepared in advance. During preparation, it is essential to account for two factors: (1) the OMC of the soil may vary with changes in compaction energies, and (2) the water-absorbing characteristics of cement necessitate a 0.5% increase in the preset moisture content for every 2.5% increment in cement dosage. Pre-weighed soil samples at different preset moisture levels are mixed with cement corresponding to the specified dosage. The mixing duration must be strictly controlled until a uniform color and even distribution of moisture are achieved, after which compaction tests are conducted. If no distinct peak value is observed in the test results, supplementary tests should be performed. The main process of the compaction test is shown in Figure 2.
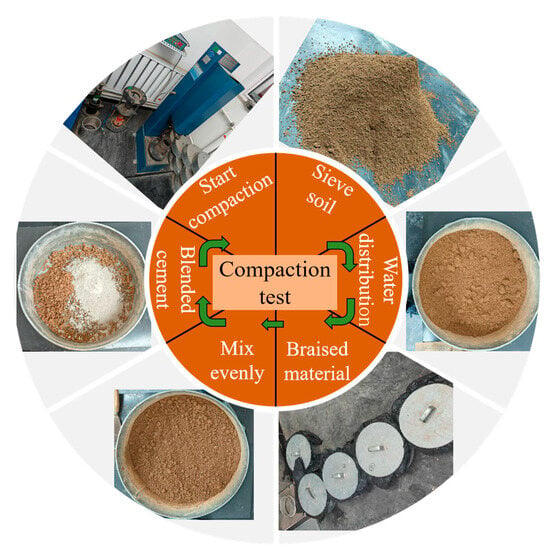
Figure 2.
The Compaction test procedure.
The determination of the liquid limit and plastic limit, as well as the compaction test, both require the measurement of soil moisture content. However, during moisture content determination, if the mixture is first placed in an oven and then heated, the cement will rapidly undergo hydration reactions with water as temperatures rise. This process generates products containing crystalline water, which is not removed during the drying process. As a result, the measured moisture content will be underestimated. Therefore, when determining the moisture content of the mixture, it is necessary to preheat the oven to minimize the test errors.
Figure 3 shows the main instruments used in the experiments in this paper, along with their nameplates. The brand names and manufacturers of the instruments are engraved on these nameplates.

Figure 3.
The main instruments used in the experiment and their nameplate information.
3. Atterberg Limits of Modified Soils
By determining the liquid limit and the plastic limit and by combining them with the actual moisture content in the soil, the state of the soil sample can be identified, thereby evaluating the engineering properties of the soil. The plasticity index is defined as the difference between the liquid limit and the plastic limit, which directly reflects the plastic range of the soil. The larger the plasticity index of the soil, the wider the range of moisture content changes in the plastic state of the soil, that is, the stronger the plasticity of the soil.
Figure 4 illustrates the variations in the liquid limit and plastic limit of soil after cement addition. As shown in the figure, the liquid limit and plastic limit exhibit distinct variation patterns with increasing cement dosage. The liquid limit demonstrates a significant increase of 25% at a 2.5% cement dosage compared with the untreated soil state. However, as the cement dosage continues to rise, the liquid limit declines and stabilizes at the 5% cement dosage. In contrast, the plastic limit remains relatively constant, without significant variation across the tested cement dosages. This indicates that the liquid limit of the soil is more sensitive to cement incorporation. Furthermore, the addition of cement increases the soil’s demand for water to generate free water and attain a flow state.
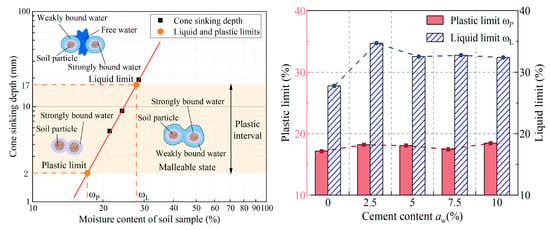
Figure 4.
Variations in the liquid limit and plastic limit of soil with varying cement dosages.
The plastic limit refers to the minimum moisture content at which soil remains in a plastic state. Variations in the plastic limit are primarily influenced by changes in soil structure and particle composition. The incorporation of cement predominantly affects the plasticity of soil under high-moisture conditions (i.e., the liquid limit, LL), while exerting minimal influence on the plastic limit. This discrepancy arises because cement contains a high proportion of amorphous silica, which exhibits elevated reactivity and a larger specific surface area. The increased specific surface area and active surface charges enhance interparticle interactions, thereby endowing the soil–cement mixture with a greater water absorption capacity.
Figure 5 illustrates the variations in the plasticity index of soil under different cement dosages compared to untreated soil. The stabilized soil exhibits an increase in the plasticity index across all tested cement dosages, with the most pronounced improvement observed at a 2.5% cement dosage, where the PI of the stabilized soil increases by 55.51% relative to the untreated soil. This alignment between the trends of plasticity index variation and liquid limit is jointly governed by the definition of the plasticity index and the minimal changes in the plastic limit. Furthermore, the elevated plasticity index indicates that cement-stabilized soil retains plasticity over a broader range of moisture content.
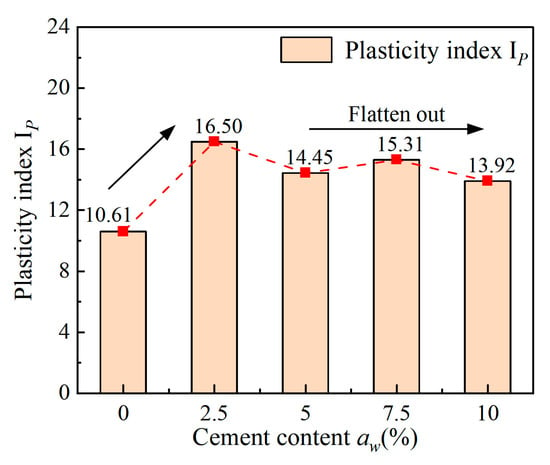
Figure 5.
Plasticity index of soil with varying cement dosages.
4. Compaction Test Results
The compaction process involves the application of external mechanical energy to displace soil particles, expel air, reduce interparticle void spaces, and achieve a denser particle arrangement. During this process, moisture acts as a lubricant, facilitating particle mobility. However, when cement is incorporated, water additionally participates in physical and chemical reactions with the cement. As a result, the process not only entails physical compaction, particle fragmentation, and rearrangement but also involves complex interactions between particles, including cement hydration-induced bonding and electrostatic forces.
4.1. Compaction Curve
A quartic function is employed to fit a curve to the moisture content and dry density data obtained under constant compaction energies and fixed cement dosage. Subsequently, the derivative of the quartic function is calculated, and within the experimentally determined moisture content range, the derivative is set equal to zero to identify critical points. The corresponding moisture content at the root of the derivative equation represents the OMC. Substituting this OMC value back into the quartic function yields the MDD, which corresponds to the peak point on the compaction curve.
Figure 6 presents the compaction curves for soils under varying compaction energies and cement dosages. Each compaction curve attains its peak dry density at a distinct moisture content. This phenomenon arises from variations in the thickness of adsorbed water films on particle surfaces at different moisture levels, which alters interparticle spacing and modifies the dominant electrochemical interactions between particles. At lower moisture contents, interparticle forces are governed by net attractive forces, whereas repulsive forces dominate at higher moisture contents. In the latter scenario, external compaction energy struggles to overcome these repulsive forces to induce particle rearrangement. Furthermore, as moisture content increases beyond a critical threshold, the emergence of free water and trapped air bubbles (forming occluded pores during compaction) absorbs a portion of the compaction energy, thereby reducing the effective energy transferred to soil particles for densification.
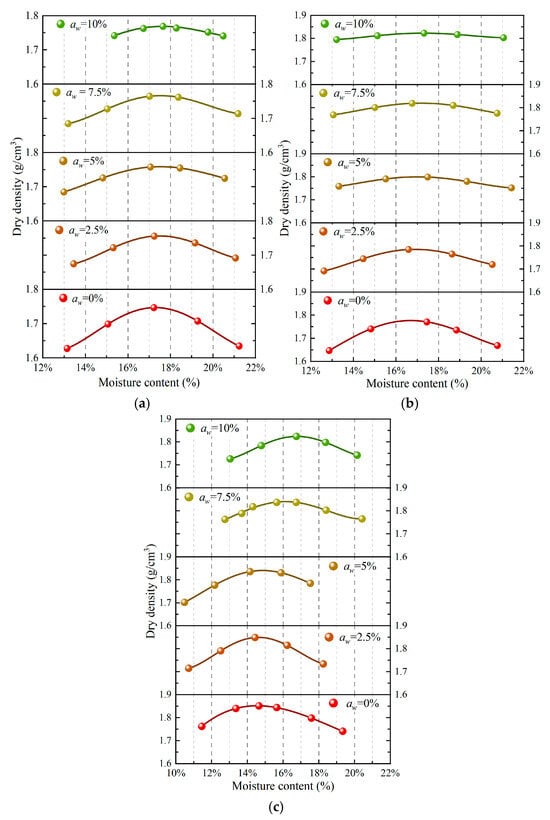
Figure 6.
Compaction curves for soils under varying compaction energies and cement dosages: (a) 355.3 ; (b) 592.2 ; (c) 829.1 .
The compaction curve of remolded soil is steeper compared to that of cement-stabilized soil, with the latter exhibiting a gradual flattening of the curve as cement dosage increases. At low moisture contents, the difficulty in expelling entrapped water and air from the soil matrix impedes effective compaction. However, cement-stabilized soil achieves a slightly higher dry density than remolded soil due to the inclusion of cement, which enhances particle packing. As moisture content rises, the hydration reactions of cement become more extensive, and the resultant hydration products induce a solidification effect, leading to a gradual reduction in dry density. Concurrently, increasing cement dosage further flattens the compaction curve, as excessive cement reduces soil plasticity and compactibility, thereby diminishing the sensitivity of density to moisture variations.
Under a compaction energy of 592.2 kJ/m3, the compaction curve is notably flatter compared to that under 829.1 kJ/m3. During the mixing of cement into the soil, cement and its hydration products adsorb onto the surfaces of soil particles, forming a film that restricts their free movement. In standard compaction tests, the lower compaction energy results in limited soil densification, as it may inadequately alter the structural arrangement of soil particles.
4.2. Soil Behavior Under Varying Compaction Energies
Figure 7 shows the soil state corresponding to the MDD of each point corresponding to the experiment when the compaction test is carried out under different influencing factors.
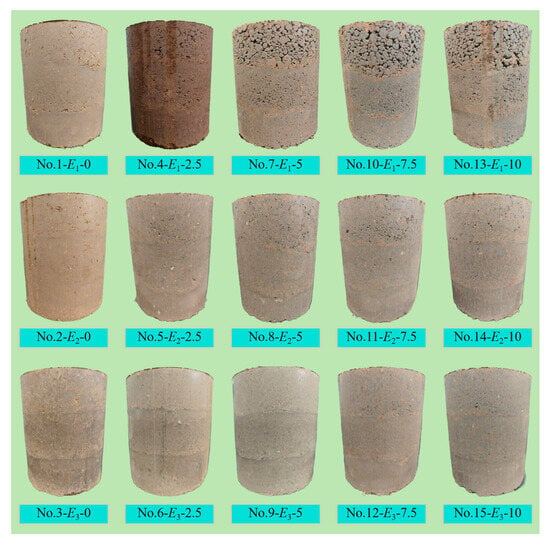
Figure 7.
Soil state under different influencing factors.
As the compaction energy increases, the OMC decreases. The absence of a lubricating water film between layers hinders adequate particle integration, leading to progressively more distinct stratification.
As indicated in Figure 7, when the content of unmixed and cement is 2.5%, the state of the soil is relatively compact. With increasing cement dosage, distinct aggregates form within the soil matrix. These aggregates result from cement–water reactions during mixing, where hydration products encapsulate soil particles. For soils stabilized with high cement dosages, compaction primarily achieves densification by disrupting these aggregates. However, under lower compaction energies, the energy is insufficient to disrupt these aggregates effectively, resulting in inadequate compaction—a phenomenon particularly pronounced at cement dosages exceeding 5%. Elevated compaction energies significantly enhance aggregate breakdown. Under standard compaction energies, aggregate distribution becomes less discernible, and with further increases in compaction energy, the soil demonstrates a well-compacted, homogeneous state.
4.3. Optimum Moisture Content and MDD
An optimization-based approach was employed to determine and summarize the OMC and MDD for soils under varying compaction energies and cement dosages.
As shown in Figure 8, incremental variations in compaction energies and cement dosage result in distinct values for the OMC and MDD of modified soils. The MDD exhibits a variation range of 6.01%, while the OMC demonstrates a more pronounced variation magnitude compared to the MDD.
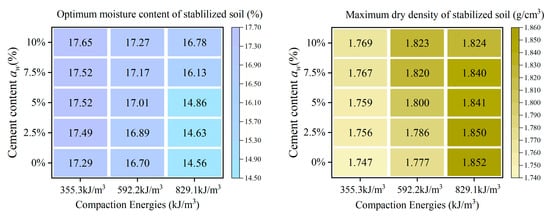
Figure 8.
OMC and MDD of modified soils.
The data points in Figure 9 represent the compiled OMC and MDD values obtained from the experimental tests. As evident from the figure, the MDD generally decreases as the OMC increases.
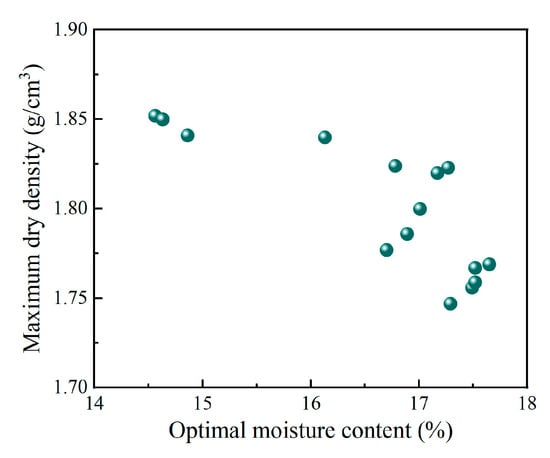
Figure 9.
Relationship between OMC and MDD.
4.4. Effects of Compaction Energy and Cement Content on OMC and MDD
For a given soil material, the greater the external mechanical energy applied to the soil, the more effectively it overcomes interparticle resistance. This enables a denser particle arrangement, allowing more solid particles to occupy the same volume while reducing pore volume, thereby increasing the MDD. Concurrently, the reduced pore volume hinders the expulsion of moisture from the soil matrix. Consequently, achieving equivalent compaction effectiveness requires lower moisture content under higher compaction energies.
With increasing cement dosage, the hydration reactions between cement and soil moisture consume a portion of the free water. As a result, under identical compaction conditions, achieving the MDD necessitates an increase in the preset moisture content. During compaction, the synergistic interaction between cement and soil particles enhances the compatibility of the soil matrix, thereby elevating the MDD.
4.4.1. Effects on Optimal Moisture Content
As observed in Figure 10, the OMC decreases with increasing compaction energies across all cement dosages. Under cement dosages ranging from 0% to 5%, the OMC reduction is more pronounced when the compaction energies increases from 592.2 kJ/m3 to 829.1 kJ/m3, compared to the reduction observed at higher cement dosages (7.5–10%). At lower cement dosages (0–5%), where soil particles dominate due to the limited presence of cement, interparticle void spaces are primarily governed by the soil’s moisture-dependent characteristics. However, as cement dosage increases, hydration reactions between cement and water generate cementation bonds. Under such conditions, compaction energy must overcome not only interparticle resistance among soil particles but also the cohesive forces induced by these hydration products. Consequently, thicker adsorbed water films are required to lubricate particle rearrangement during compaction.
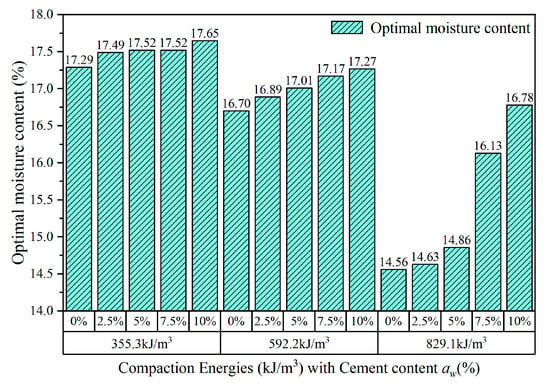
Figure 10.
Variation trends of OMC under different influencing factors.
When the compaction energy is at a low level, the OMC does not change significantly with variations in cement content. At low cement contents, weak hydration reactions meant that the OMC and MDD were primarily influenced by particle rearrangement and pore structure alterations. Under identical compaction energy conditions (except for the 829.1 kJ/m3 scenario with 7.5% and 10% cement contents), the OMC showed no substantial correlation with cement content. For homogenized cement-stabilized soil, aggregates formed after mixing; at low cement contents, soil properties dominated, whereas increasing cement content led to enhanced hydrophilicity of the soil particles encapsulated by cement and its hydration products. This improved water adsorption capacity required higher moisture content to achieve optimal inter-particle lubrication, thereby increasing the OMC.
4.4.2. Effects on Maximum Dry Density
As observed in Figure 11, under a constant cement dosage, the MDD exhibits an overall increasing trend with rising compaction energies. However, at higher cement dosages, the rate of MDD increase gradually diminishes.
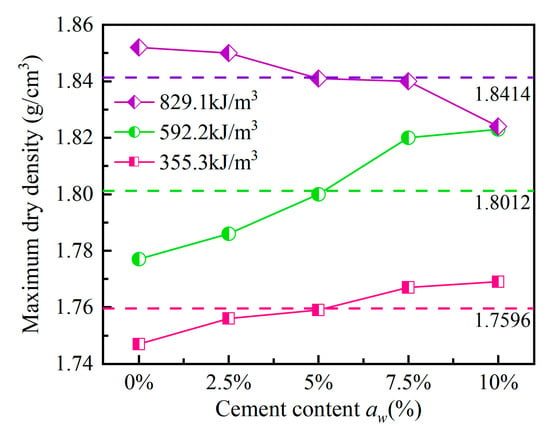
Figure 11.
Variation trends of MDD under different influencing factors.
During compaction, water carrying finer cement particles flows into the pores formed by soil particles. Under the applied compaction energies, the water continues to flow, while the cement particles are retained within the pores, filling the interstitial spaces between larger soil particles. This mechanism enhances the MDD of the soil mass. At higher cement dosages, cement hydration products partially fill the pores, resulting in a more intricate and relatively smaller pore structure. When compaction energy is increased, although pore compression occurs, the degree of compression is relatively limited due to the pre-existing smaller pore dimensions and partial structural support from cement hydration products.
It can be observed that, while MDD increased with compaction energies, the growth amplitude was significantly smaller than the energy increment. Under 355.3 kJ/m3 and 592.2 kJ/m3 compaction energies, the MDD increased with cement content, with a more pronounced rise under standard Proctor compaction (829.1 kJ/m3). Notably, at 829.1 kJ/m3, the MDD decreased with increasing cement content: the reduction was gradual at low cement contents, followed by a plateau phase, and reached its maximum when cement content exceeded 10%.
5. Range Analysis of Compaction Characteristics
5.1. Factors and Levels
Both compaction energies and cement dosage influence the OMC and MDD of soil. Range analysis can be employed to evaluate the magnitude of each factor’s impact on experimental metrics and visually determine the hierarchical influence (primary to secondary) of these factors on the results. Therefore, the test factors of this experiment are set as compaction energy and cement content. As described in the experimental variable settings, compaction energy and cement content correspond to different numbers of levels, respectively, and an analysis of the influence of these factors on the OMC and MDD is carried out.
5.2. Factor Influence Analysis on MDD Based on Range Analysis
For the factor of compaction energy, 15 control groups are divided into 3 groups according to three different levels. K1, K2, and K3 represent the sums of the research variables at the respective levels. Here, R denotes the range calculated as the difference between the maximum and minimum values among K1, K2, and K3.
Figure 12 shows the influence of different influencing factors on the MDD based on range analysis. For MDD, the R value for compaction energies was nearly an order of magnitude greater than that for cement content, highlighting that compaction energies exerted a more pronounced influence on MDD than cement content based on orthogonal range analysis.
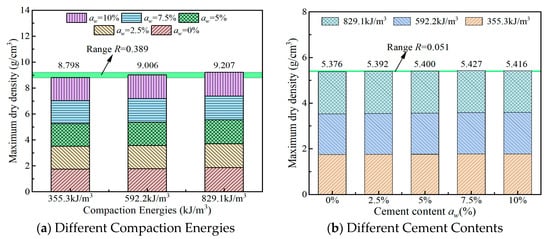
Figure 12.
Influence of test factors on MDD based on orthogonal range analysis.
5.3. Factor Influence Analysis on OMC Based on Range Analysis
Figure 13 shows the influence of different influencing factors on the OMC based on range analysis. For OMC, the R value of compaction energies across different levels was larger than that of cement content, indicating that compaction energies exerted a greater influence on OMC than cement content. However, unlike the order-of-magnitude difference observed in MDD, the OMC R-value discrepancy was less pronounced—this suggests that while compaction energies significantly affected OMC, its impact was less dominant compared to its effect on MDD.
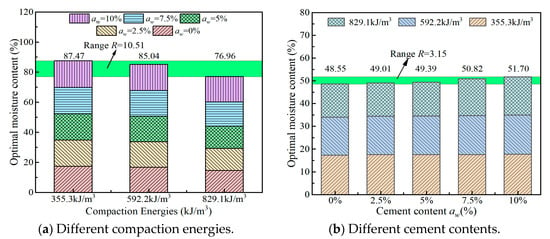
Figure 13.
Influence of test factors on OMC based on orthogonal range analysis.
The R value corresponding to the OMC is more significant than that corresponding to the MDD. As an indicator reflecting the “degree of compactness”, the MDD responds directly and significantly to external factors (such as compaction energy and gradation). In contrast, the OMC, as an indicator of “water balance”, is restricted by the inherent hydro-physical properties of the soil and responds more gently to external factors. When the influencing factors of the test more directly regulate the water adsorption capacity of the soil (rather than the compactness of particles), or the soil itself is sensitive to water, and the MDD is restricted by physical limits, the R value of the OMC is more significant than that of the MDD. Essentially, the influence of the factors on the “water balance” exceeds their influence on the “degree of compactness”. Therefore, in the range analysis, the R value corresponding to the MDD is less significant than that corresponding to the OMC.
6. Conclusions
In this study, the liquid limit, plastic limit, and compaction characteristics of cement-stabilized soil (using cement and Shanxi regional soil) were systematically investigated under varying cement contents and compaction energies. Fifteen compaction curves were generated from orthogonal test combinations of these factors. Through curve analysis, the OMC and MDD were determined for each condition, and a significance hierarchy of influencing factors was established based on orthogonal range analysis.
- The addition of cement significantly increased the plasticity index (PI) of the soil, allowing the stabilized soil to maintain plasticity over a wider moisture content range. While the plastic limit (PL) showed no notable change with increasing cement content, the liquid limit (LL) increased non-linearly due to cement inclusion, reaching its peak at a 2.5% cement content (by mass).
- The MDD of stabilized soil increased with compaction energies, but the growth rate gradually attenuated. Conversely, the OMC decreased with increasing compaction energies, a variation particularly pronounced at low cement contents. As cement content increased, the reduction trend of OMC slowed. At 2.5% cement content, the soil compaction state remained unaffected; however, further increases in cement content led to loose compaction under low compaction energies.
- The addition of cement significantly influenced both the OMC and MDD of the soil. Except under 829.1 kJ/m3 compaction energies, OMC and MDD of stabilized soil increased with cement content, and the growth rate accelerated with increasing compaction energies.
- The range analysis method was used to determine the primary and secondary degrees of influence of changes in cement content and compaction energy on the OMC and MDD. According to the results of range analysis, the order of influence of compaction energies and cement content on OMC and MDD was consistent.
Author Contributions
P.L.: investigation and conceptualization. Z.W.: validation and investigation. G.C.: supervision, methodology, and investigation. W.L.: writing—original draft, formal analysis, data curation, and conceptualization. X.L.: writing—review and editing, writing—original draft, project administration, methodology, funding acquisition, and conceptualization. All authors have read and agreed to the published version of the manuscript.
Funding
This research was supported by the National Natural Science Youth Foundation of China under Grant No. 51909204 and the Natural Science Research Programme of Shanxi Province under Grant No. 20220302121321.
Data Availability Statement
Data will be made available on request.
Conflicts of Interest
Author Ping Li was employed by the company Shanxi Water Conservancy Construction Engineering Bureau Central Laboratory Co., Ltd. The remaining authors declare that the research was conducted in the absence of any commercial or financial relationships that could be construed as a potential conflict of interest.
References
- Ferreira, J.W.D.S.; Casagrande, M.D.T.; Teixeira, R.S. Sample dimension effect on equations controlling tensile and compressive strength of cement-stabilized sandy soil under optimal compaction conditions. Case Stud. Constr. Mater. 2021, 15, e00763. [Google Scholar] [CrossRef]
- Zhu, C.; Qiu, S.; Shi, W.; Li, J. Experimental Study on the Durability and Microstructure of Several Traditional Modified Raw Soils. J. Nat. Disasters 2022, 31, 165–175. [Google Scholar]
- Ma, M.; Huang, Z.; Wang, J.; Niu, L.; Zhang, W.; Xu, X.; Xi, F.; Liu, Z. Cement Carbon Sink Accounting and Its Contribution to China’s Carbon Neutrality. Sci. China Earth Sci. 2024, 54, 2086–2097. [Google Scholar]
- Tang, Y.; Liu, H.; Zhu, W. Experimental Study on Engineering Properties of Cement-Stabilized Soil. Chin. J. Geotech. Eng. 2000, 5, 549–554. [Google Scholar]
- Shao, Y.; Xu, R.; Liu, Z.; Gong, X. Experimental Study on a Novel Cement-Stabilized Soil. J. Zhejiang Univ. (Eng. Sci.) 2006, 40, 1196–1200. [Google Scholar]
- Ye, G.; Chen, W.; Xu, C.; Li, S. Laboratory Tests on Additives for Cement-Stabilized Soil. China J. Highw. Transp. 2006, 19, 12–17. [Google Scholar]
- Cao, Z.; Zhang, D. Study on Characteristic Parameters of Unconfined Compressive Strength of Cement-Stabilized Soil. Chin. J. Rock Mech. Eng. 2015, 34 (Suppl. S1), 3446–3454. [Google Scholar]
- Tao, G.; Wu, X.; Yang, X.; Liu, W.; He, J.; Chen, Y. Pore Distribution of Cement-Stabilized Soil and Its Influence on Permeability. J. Eng. Geol. 2018, 26, 1243–1249. [Google Scholar]
- Tan, L.; Lu, J.; Wan, X.; Wang, Y.; Yan, Z. Shear Behavior of Cement-Stabilized Silty Clay Cured at Subzero Temperatures. Chin. J. Undergr. Space Eng. 2024, 20, 1564–1580. [Google Scholar]
- Xu, W.; Cen, G.; Dai, J. Fatigue Property Tests of Pavement Structures for Temporary Airports. J. Traffic Transp. Eng. 2008, 8, 40–43. [Google Scholar]
- Sun, J. Engineering Practice of Cement Stabilization for Railway Subgrade Soil. China Cem. 2024, 6, 90–93. [Google Scholar]
- Dai, D.; Peng, J.; Wei, R.; Li, L.; Lin, H. Improvement in dynamic behaviors of cement-stabilized soil by super-absorbent-polymer under cyclic loading. Soil Dyn. Earthq. Eng. 2022, 163, 107554. [Google Scholar] [CrossRef]
- Yi, Y.; Liu, S.; Puppala, A.J. Bearing capacity of composite foundation consisting of T-shaped soil-cement column and soft clay. Transp. Geotech. 2018, 15, 47–56. [Google Scholar] [CrossRef]
- Zhang, C.; Liu, S.; Zhang, D.; Lai, F.; Lu, T.; Liu, Y. A modified equal-strain solution for consolidation behavior of composite foundation reinforced by precast concrete piles improved with cement-treated soil. Comput. Geotech. 2022, 150, 104905. [Google Scholar] [CrossRef]
- Yu, H.; Yi, Y.; Romagnoli, A.; Tan, W.L. Cement soil stabilization for underground liquid natural gas storage. Cold Reg. Sci. Technol. 2022, 194, 103438. [Google Scholar] [CrossRef]
- Kufre Etim, R.; Ufot Ekpo, D.; Christopher Attah, I.; Onyelowe, K.C. Effect of micro sized quarry dust particle on the compaction and strength properties of cement stabilized lateritic soil. Clean. Mater. 2021, 2, 100023. [Google Scholar] [CrossRef]
- Sriram Karthick Raja, P.; Thyagaraj, T. Significance of compaction time delay on compaction and strength characteristics of sulfate resistant cement-treated expansive soil. J. Rock Mech. Geotech. Eng. 2021, 13, 1193–1202. [Google Scholar] [CrossRef]
- Nazari, Z.; Tabarsa, A.; Latifi, N. Effect of compaction delay on the strength and consolidation properties of cement-stabilized subgrade soil. Transp. Geotech. 2021, 27, 100495. [Google Scholar] [CrossRef]
- Baghini, M.S.; Ismail, A.; Naseralavi, S.S.; Firoozi, A.A. Performance evaluation of road base stabilized with styrene–butadiene copolymer latex and Portland cement. Int. J. Pavement Res. Technol. 2016, 9, 321–336. [Google Scholar] [CrossRef]
- Kenai, S.; Bahar, R.; Benazzoug, M. Experimental analysis of the effect of some compaction methods on mechanical properties and durability of cement stabilized soil. J. Mater. Sci. 2006, 41, 6956–6964. [Google Scholar] [CrossRef]
- GB/T 50123-2019; Geotechnical Testing Methods. China Architecture & Building Press: Beijing, China, 2019.
- GB/T 50145-2007; Standard for Engineering Classification of Soils. China Planning Press: Beijing, China, 2007.
- GB 175-2023; Common Portland Cement. China Standards Press: Beijing, China, 2023.
Disclaimer/Publisher’s Note: The statements, opinions and data contained in all publications are solely those of the individual author(s) and contributor(s) and not of MDPI and/or the editor(s). MDPI and/or the editor(s) disclaim responsibility for any injury to people or property resulting from any ideas, methods, instructions or products referred to in the content. |
© 2025 by the authors. Licensee MDPI, Basel, Switzerland. This article is an open access article distributed under the terms and conditions of the Creative Commons Attribution (CC BY) license (https://creativecommons.org/licenses/by/4.0/).