Abstract
With the widespread application of artificial intelligence in real estate price prediction, model explainability has become a critical factor influencing its acceptability and trustworthiness. The Shapley value, as a classic cooperative game theory method, quantifies the average marginal contribution of each feature, ensuring global fairness in the explanation allocation. However, its focus on average fairness lacks robustness under data perturbations, model changes, and adversarial attacks. To address this limitation, this paper proposes a hybrid explainability framework that integrates the Shapley value and Least Core attribution. The framework leverages the Least Core theory by formulating a linear programming problem to minimize the maximum dissatisfaction of feature subsets, providing bottom-line fairness. Furthermore, the attributions from the Shapley value and Least Core are combined through a weighted fusion approach, where the weight acts as a tunable hyperparameter to balance the global fairness and worst-case robustness. The proposed framework is seamlessly integrated into mainstream machine learning models such as XGBoost. Empirical evaluations on real-world real estate rental data demonstrate that this hybrid attribution method not only preserves the global fairness of the Shapley value but also significantly enhances the explanation consistency and trustworthiness under various data perturbations. This study provides a new perspective for robust explainable AI in high-risk decision-making scenarios and holds promising potential for practical applications.
1. Introduction
With the rapid advancement of urbanization and socio-economic development, the real estate market—recognized as a pillar industry of the national economy—has become closely tied to economic health [1,2]. Accurate real estate price forecasting is essential for government macro-regulation, credit evaluation by financial institutions, and informed investment decisions by real estate investors [3]. In recent years, the application of artificial intelligence (AI) in real estate price prediction has attracted considerable attention due to its powerful nonlinear modeling capabilities [4,5,6]. AI models can effectively capture complex interactions among multidimensional features such as the location, transportation, school district, floor level, and construction year [7]. Compared to traditional linear regression models, machine learning-based approaches (e.g., XGBoost, CatBoost) demonstrate higher predictive accuracy and stronger adaptability [8,9]. For instance, XGBoost, based on gradient boosting trees, has achieved an outstanding performance in both Kaggle competitions and practical real estate projects, making it widely used for property valuation and rental price forecasting [10,11].
AI-driven real estate price prediction has been extensively applied in scenarios such as property transactions, financial risk management, and government market supervision. In property transactions, AI models can provide reasonable price references for agents and buyers, reducing the transaction friction caused by information asymmetry [12]. In financial risk management, banks and financial institutions can leverage AI predictions for more scientific collateral evaluations, thereby reducing credit risks [13]. At the government level, AI prediction facilitates the monitoring of market cycles, supports policy-making regarding land supply and housing regulation, and promotes the healthy and stable development of the market [14,15].
However, the increasing complexity of AI models has resulted in a “black box” nature of decision-making processes [16,17,18]. Despite their strong predictive capabilities, the lack of interpretability has limited the trust and acceptance of AI models in real-world applications. In high-risk, high-stakes domains such as real estate, stakeholders—including investors, regulators, and homebuyers—have a heightened demand for model interpretability. Interpretability not only enhances transparency and acceptance but also enables stakeholders to better understand feature contributions, thereby supporting more rational policies and investment strategies. Consequently, improving model interpretability while preserving predictive performance has become a critical challenge for AI in real estate price forecasting [5,19].
Explainable artificial intelligence (XAI) has emerged as a vital bridge between model complexity and human trust, attracting growing attention from both academia and industry [20,21]. XAI research focuses not only on visualizing prediction results and feature contributions but also on the core issues of fairness, transparency, and robustness [22]. Fairness is especially crucial, requiring balanced and unbiased explanations across diverse feature contributions, thus aligning with ethical and legal expectations. Transparency emphasizes readability and intuitiveness, ensuring that models are not only numerically accurate but also understandable by non-technical users and stakeholders [23].
Robustness, as an emerging frontier in XAI, is gaining increasing attention. It requires that explanations remain stable under data perturbations, model parameter updates, or adversarial attacks, thereby avoiding large fluctuations in interpretability due to minor changes [24]. In real-world deployments, models often encounter distribution shifts and diverse data samples. Robust explanations enhance trustworthiness and operational reliability in such settings. In high-stakes domains such as real estate and finance, fairness, transparency, and robustness directly affect major decisions, making them core drivers of XAI research [19,25].
The Shapley value, derived from cooperative game theory, has gained widespread application in XAI due to its desirable theoretical properties [26,27]. By averaging marginal contributions across all possible feature subsets, the Shapley value ensures fair and symmetric attributions, earning its reputation as the “gold standard” for model explanations [28,29]. It provides both global and local feature importance scores and is applicable across a variety of machine learning models, including tree-based models and neural networks [30].
Nevertheless, the Shapley value also presents several limitations. Its computational complexity increases exponentially with the number of features, necessitating approximation techniques such as model-based simplifications or Monte Carlo sampling in practical applications [31]. Moreover, as an averaging method, the Shapley value does not account for worst-case robustness [32]. Under data shifts, input perturbations, or adversarial attacks, Shapley-based attributions may fluctuate significantly, affecting their stability and reliability [33]. Additionally, Shapley values focus solely on feature contributions without revealing intricate interactions among features, limiting their effectiveness in high-dimensional and highly interactive environments. These challenges have motivated both academic and industrial communities to explore more robust and stable explanatory methods that complement Shapley-based interpretations [34].
While Shapley values ensure fair and theoretically grounded feature attributions, they fall short in addressing robustness and worst-case fairness under practical high-risk scenarios such as distributional shifts or model uncertainty [35]. To address this gap, this study proposes the introduction of the Least Core concept from cooperative game theory as a novel complement to XAI [36]. The Least Core minimizes dissatisfaction among the most disadvantaged coalitions, focusing on stability and fairness in adverse conditions [37]. Furthermore, we propose a hybrid approach that combines Shapley values with Least Core allocations via a tunable weighting parameter. This allows a flexible trade-off between global fairness and worst-case robustness. We argue that this weighted explanatory framework not only provides fair and interpretable attributions under typical conditions but also significantly enhances the robustness and trustworthiness of explanations under data and model perturbations. Such a method better meets the demands for highly interpretable and trustworthy models in sensitive domains such as real estate price forecasting. This motivation underpins the present study, which aims to explore and validate the effectiveness and applicability of a Shapley–Least Core hybrid explanation method in the context of real estate price prediction.
2. Literature Review
2.1. Shapley Values and Explainable AI
XAI aims to uncover the decision-making logic of complex models, allowing outputs to be not only accurate but also interpretable and trustworthy for human users [38,39]. As AI models become increasingly complex—especially in high-stakes domains such as finance, healthcare, and real estate—the need for transparency and accountability has driven a surge of interest in post hoc interpretability techniques [40].
Among various approaches, the Shapley value, rooted in cooperative game theory, has emerged as one of the most theoretically grounded and widely adopted methods for feature importance attribution [26]. The core idea is to treat the model output as the “payoff” of a coalition of features and to determine each feature’s contribution by averaging its marginal effect across all possible subsets [41]. This approach satisfies several desirable axioms, efficiency, symmetry, dummy, and additivity, ensuring that the explanation is fair and uniquely defined under a cooperative framework.
Their generalizability and model-agnostic nature have made Shapley values suitable for a wide array of machine learning algorithms, including decision trees, ensemble methods, and neural networks [42]. Extensions like SHAP further improve scalability and usability by optimizing approximation algorithms tailored for specific model types, such as Tree SHAP for gradient boosting machines.
Shapley-based methods have been successfully deployed in real-world applications. In finance, they help interpret credit scoring systems by quantifying how individual borrower features influence risk assessments [43]. In medicine, they assist clinicians in diagnosing patients by revealing how symptoms and test results contribute to predictive outcomes [44]. In real estate, Shapley values have been employed to explain pricing models, offering valuable transparency for buyers, investors, and regulators [19].
Nevertheless, despite its theoretical elegance, the Shapley value has practical limitations. Its computation grows exponentially with the number of features, making exact calculations infeasible for high-dimensional data. Although approximate methods alleviate this burden, they may still struggle with scalability in real-time systems. More critically, the Shapley value provides average-case explanations, which are vulnerable to instability under perturbations [45]. Small changes in input data or model updates can lead to significant variation in attribution results, undermining reliability in dynamic environments [46].
Recent studies have raised concerns about Shapley’s robustness, consistency, and resilience to adversarial manipulation, prompting the development of complementary methods that emphasize stability and worst-case fairness [47]. These works lay the foundation for hybrid approaches that combine Shapley-based fairness with robust optimization principles.
2.2. Interpretability Challenges in Real Estate Price Prediction
The real estate sector presents unique challenges for predictive modeling and interpretability [48]. On one hand, the market is influenced by numerous interacting factors—including the geographic location, infrastructure, school districts, floor level, building quality, and economic conditions—which makes it well-suited for machine learning. On the other hand, these same factors create a highly complex and nonlinear data environment, where interpretability becomes both necessary and difficult [19,49].
Modern AI models, such as XGBoost, CatBoost, and deep neural networks, can capture sophisticated interactions among heterogeneous features. These models often outperform traditional hedonic pricing models or linear regressions in terms of accuracy. However, their internal mechanisms are typically opaque, making it difficult for stakeholders to understand why certain predictions are made [50].
Interpretability is not just an academic concern in real estate—it has tangible implications for policy, investment, and risk management [51]. For example, a bank’s decision to approve a mortgage may depend on how clearly a model explains the contribution of property characteristics and borrower profiles. Likewise, governments may need interpretable models to guide housing subsidies or land allocation. Without clear explanations, such decisions become harder to justify, audit, or defend [52].
Moreover, the real estate market is highly sensitive to macroeconomic dynamics, regulatory changes, and local policy interventions. These factors can lead to data distribution shifts over time, which in turn reduce the stability of model predictions and explanations. A model trained on one year’s housing data might fail to generalize when market conditions change, and worse, its explanations might become misleading—undermining stakeholder trust.
In addition, features in real estate are not always independent [53]. Strong inter-feature correlations (e.g., between location and school quality) introduce attribution ambiguity, where it becomes difficult to discern whether the price premium is due to one feature or its correlated counterpart. This further challenges Shapley-based methods, which assume additive and independent contributions.
Therefore, providing explanations that are not only accurate but also robust, fair, and context-aware is critical in this domain. Researchers have called for hybrid explanation models that incorporate worst-case guarantees and fairness constraints to ensure that interpretability tools remain reliable even when models or data evolve [54,55]. One such promising direction is the integration of Least Core principles from game theory, which address the limitations of average-case methods like the Shapley value and introduce robustness under adversarial or unstable environments.
3. Methodology
3.1. Shapley Value Explanation Allocation
The Shapley value originates from cooperative game theory, where it was initially used to determine each player’s fair contribution to a joint payoff [56]. In the field of explainable artificial intelligence, the Shapley value quantifies the average marginal contribution of each feature to a model’s output and is defined as follows:
where N denotes the set of all features, S is a subset of N, and v(S) represents the model output or “value” when only the features in S are considered. This formulation satisfies four axioms, efficiency, symmetry, dummy, and additivity, which ensure the uniqueness and fairness of the attribution.
However, the exact computation of Shapley values is computationally expensive, especially as the number of features increases exponentially. Reference [57] proposed Tree SHAP to address this, an efficient algorithm that leverages the structure of tree-based models to approximate Shapley values with a significantly reduced computational cost.
Despite this improvement, the Shapley value remains an “average-based” explanation method and does not guarantee robustness in worst-case scenarios. It may produce unstable attributions under data perturbations, feature-level noise, or adversarial inputs, limiting its reliability in sensitive applications.
3.2. Least Core Explanation Allocation
The Least Core is a relaxation of the core concept in cooperative game theory. While the core requires that every coalition S receives at least its value v(S), it may not exist or may be too restrictive in practical applications. The Least Core introduces a global tolerance margin ϵ and aims to minimize the dissatisfaction of the most disadvantaged coalition:
This formulation can be solved as a linear programming problem, yielding a set of feature attributions {} that maximize the fairness guarantee in the worst case. Compared to the mean-based nature of Shapley values, this method emphasizes robustness and bottom-line fairness under adversarial conditions.
In machine learning interpretability, the Least Core explanation allocation enhances robustness in model perturbations and feature distribution shifts. Its principal advantage lies in maintaining fairness even under adversarial samples or significant distributional drifts, thereby providing a safety guarantee for model interpretability in critical domains.
3.3. Least Core Explanation in Machine Learning
In real estate price prediction tasks, implementing the Least Core requires careful integration with machine learning models and their feature attribution mechanisms. The characteristic function v(S)—central to the Least Core formulation—captures the marginal contribution of the feature subset S to the model’s prediction.
In this study, v(S) is defined using conditional expectations: for a given instance x, the contribution of the feature subset S is computed as the difference in the model’s expected output with and without S:
where denotes the complementary set of features not in S, and is the baseline output (e.g., global average prediction). This formulation allows a faithful measurement of incremental feature contributions, ensuring interpretability and comparability [58].
Given the exponential growth of feature subsets, we leverage the Tree SHAP framework to efficiently approximate v(S) values. To reduce computational complexity, only subsets with significant contributions are sampled. We also employ modern linear programming solvers (e.g., Gurobi, CPLEX) with parallel computing capabilities to accelerate the solution process in large-scale feature spaces [59].
3.4. Hybrid Attribution via Weighted Fusion
To unify the advantages of both Shapley and Least Core methods, we propose a weighted fusion mechanism. The final attribution for each feature is computed as a convex combination of the Shapley value and the Least Core value , formulated as
where ∈ [0,1] is a hyperparameter that balances the influence of fairness versus robustness. A larger λ favors Shapley fairness, while a smaller λ emphasizes stability. In our experiments, we use λ = 0.85 to assign an equal weight to both sources of attribution. This hybrid attribution framework not only preserves the axiomatic foundation of the Shapley value but also inherits the Least Core’s resilience to perturbations and noise.
After computing the fused attribution scores, we conduct a comprehensive evaluation across multiple test samples. We generate visualizations to compare the model’s predicted values against actual targets and plot the total attribution scores under Shapley, Least Core, and fused methods. These comparisons allow us to assess the consistency, stability, and interpretive alignment of each method. Additionally, we calculate quantitative metrics such as the attribution variance and mean absolute deviation to validate the effectiveness of the Least Core in stabilizing explanation outputs and the hybrid method’s potential for cross-sample consistency.
This final hybrid explanation integrates both global fairness by using Shapley and worst-case robustness based on the Least Core. The weighting parameter can be flexibly tuned to meet the needs of different application contexts, enabling a dynamic balance between interpretability, stability, and fairness in high-stakes real estate decision-making.
4. Case Study: 2024 Urban Rental Housing Data from Beike/Lianjia Platform
4.1. Background
To evaluate the applicability and robustness of the proposed Shapley–Least Core hybrid explainability framework in real-world scenarios, this study conducts a case analysis based on 2024 rental housing data collected from the Beike/Lianjia platform, covering major Beijing districts. Urban rental prices are influenced not only by physical housing attributes but also by access to transportation, education, healthcare, and commercial resources. Applying explainable prediction models to real rental data provides valuable insights for market supervision, policy design, and platform optimization.
4.2. Data Source and Feature Description
The dataset used in this study was curated by the ZL Data Network and is based on rental listings publicly available on Beike (Lianjia) during the year 2024. The dataset covers all districts of Beijing, including Chaoyang District, Haidian District, Dongcheng District, Xicheng District, Fengtai District, Shijingshan District, Tongzhou District, Changping District, Daxing District, Shunyi District, Mentougou District, Fangshan District, Pinggu District, Huairou District, Miyun District, and Yanqing District. The data is provided in an Excel format and includes main structured fields. These fields capture various aspects of each listing, such as the housing type, total area, floor level, orientation, heating type, and elevator availability. It also contains transaction-related features, such as the rental term, payment method, deposit, service fee, and intermediary fee. To support the spatial analysis, the dataset includes both Baidu and WGS84 coordinate systems for the geographic location. Additionally, some records contain textual descriptions of nearby amenities and image URLs, which may be useful for future multimodal learning applications.
Table 1 presents descriptive statistics for 10 key numerical features: the area, elevator, rent price, agency fee, and other housing information. This summary helps to understand the overall distribution, central tendency, and variability of the primary variables used in the modeling.

Table 1.
Summary statistics of key numerical variables (n = 53,343).
Table 2 provides district-level rental statistics for all districts in the dataset. For each district, it reports the number of listings, mean rent, standard deviation, minimum, 25th percentile, median, 75th percentile, and maximum rent. These figures help illustrate the significant variation in rental prices across different urban areas and offer insight into spatial rental patterns.

Table 2.
District-wise rent statistics.
Figure 1 illustrates the distribution of monthly rental prices across major administrative districts in Beijing using a violin plot. The vertical spread of each distribution captures the variation in rental prices, while the width reflects the density of observations at different value ranges. Among the observed regions, Chaoyang District exhibits the most pronounced variability, with numerous high-end rental listings exceeding RMB 400,000 per month, indicating a strong presence of luxury and premium housing. Similarly, Haidian, Dongcheng, and Xicheng Districts also show relatively high median rents and a wide interquartile range, suggesting active markets with a mix of high-value properties.
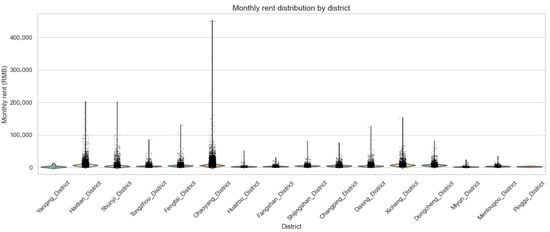
Figure 1.
Distribution of monthly rent across major Beijing districts.
In contrast, peripheral districts such as Yanqing, Pinggu, and Mentougou display more concentrated and lower-value distributions, reflecting more affordable and uniform rental structures. The spatial heterogeneity observed across districts underscores the importance of incorporating location-specific features into the predictive modeling framework. Furthermore, the presence of heavy-tailed distributions in core urban districts suggests that extreme rental values may exert substantial influence on learning algorithms and attribution mechanisms
4.3. Experimental Workflow
The workflow encompasses the stages of data preparation, model training, attribution calculation, robustness analysis, and evaluation through both quantitative metrics and visual analytics. As illustrated in Figure 2, the pipeline begins with structured data preprocessing, which involves removing incomplete records, imputing missing values using domain knowledge or statistical methods, and standardizing numerical features to enhance model stability and comparability.
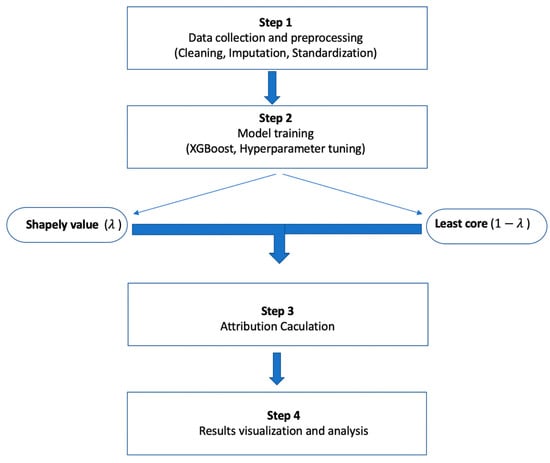
Figure 2.
Workflow of the hybrid attribution framework integrating Shapley value and Least Core.
Following data preprocessing, the dataset is split into training and testing subsets using a random 80–20% division strategy, ensuring that both sets retain a representative distribution of rental housing features. An XGBoost regression model is then trained on the training subset to capture the nonlinear relationships between property attributes and rental prices. A grid search combined with cross-validation is employed for hyperparameter tuning, yielding a robust and generalizable model.
After training, feature attribution is performed through two parallel paths. On one hand, the SHAP TreeExplainer is applied to compute Shapley values, which reflect each feature’s average marginal contribution across all possible coalitions. On the other hand, a Least Core attribution mechanism is formulated as a linear programming problem, wherein feature subset values are estimated through systematic perturbations, and the resultant predictions are evaluated. This linear program aims to minimize the maximum dissatisfaction among coalitions and is solved using the cvxpy optimization package.
The outputs from the Shapley and Least Core methods are then merged using a weighted fusion strategy controlled by a tunable hyperparameter λ. In this study, λ = 0.85 is chosen to prioritize global fairness while still incorporating the robustness advantages of the Least Core method.
To assess the interpretability and robustness of the resulting attributions, we conduct a series of sensitivity experiments under various perturbation settings, including random noise, adversarial alterations, and partial feature masking. Stability is quantified through statistical measures such as the attribution variance, mean absolute deviation (MAD), and Pearson correlation coefficients between original and perturbed attributions.
Finally, a series of visual analyses are conducted to illustrate the comparative behavior of the Shapley, Least Core, and fused attribution results across different test samples. These include the prediction versus actual plots, feature importance visualizations, and attribution stability profiles—all contributing to a comprehensive evaluation of the hybrid framework’s effectiveness.
4.4. Results and Visualization
Figure 3 displays the Pearson correlation matrix among key variables in the rental housing dataset, offering a statistical view of the linear relationships between structural features, spatial indicators, and rental prices. The color gradient represents the magnitude and direction of the correlation—red indicating stronger positive relationships, while blue denotes weak or negative associations.
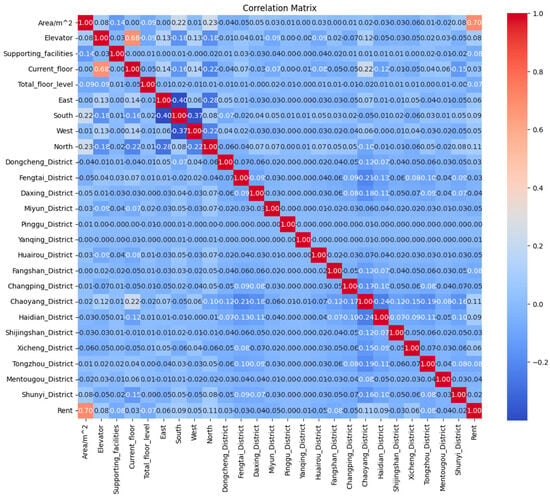
Figure 3.
Correlation matrix of rental attributes and district indicators.
Among all features, Area/m2 exhibits the strongest positive correlation with rent, with a coefficient of 0.70. This indicates that larger housing units are consistently associated with higher rental prices. The strength of this linear relationship confirms the central role of the area in driving rent values, echoing previous findings from SHAP and Least Core attributions where area consistently ranked as the most influential factor. This result aligns with common economic logic in urban housing markets, where space is a primary determinant of price.
The variable Chaoyang_District also shows a significant positive correlation with rent, 0.11, making it the most strongly associated district-level feature. This is expected, as Chaoyang is one of the most commercially developed and desirable residential areas in Beijing. Its elevated influence reflects the locational premium embedded in the rental market. Other districts such as Haidian and Dongcheng demonstrate moderate positive correlations, but all fall below the level observed for Chaoyang.
Most district indicators show very low pairwise correlations with each other, suggesting that their inclusion as independent binary variables is statistically appropriate. While the Pearson correlation captures only linear dependencies and cannot detect higher-order interactions, it reinforces the importance of the area and the Chaoyang location as fundamental predictors of rental value.
Figure 4 illustrates a pair plot depicting the bivariate relationships among key housing attributes and monthly rental prices. This visualization enables a comprehensive understanding of the interactions and distributional patterns across features, which is essential for both the predictive modeling and interpretability analysis. A strong positive association is evident between the property area and rent, indicating that larger units tend to command higher rental prices—a finding consistent with market expectations and economic rationale. The relationship between the current floor level and rent demonstrates a nonlinear trend, where units located on middle floors generally exhibit higher rental values compared to those on very low or very high floors. This pattern may reflect tenant preferences for an optimal floor height, balancing accessibility with ventilation and natural light.
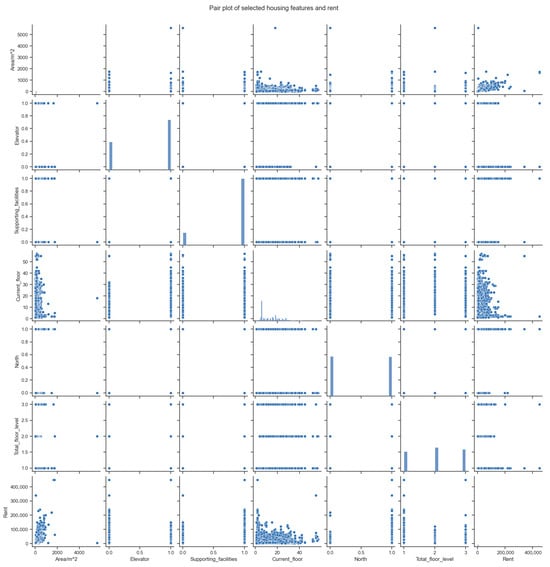
Figure 4.
Pairwise relationships between key rental features across districts.
Binary features such as elevator availability and supporting facilities display vertical clustering due to their discrete nature, yet their presence is clearly associated with elevated rent levels. This suggests that these amenities carry a positive price premium and are perceived as value-added features by tenants. In contrast, the total floor level and a north-facing orientation show weaker and less consistent associations with rent, implying that these characteristics may exert more context-dependent or indirect effects, potentially moderated by other factors such as the location, building age, or overall design.
Additionally, the plot highlights notable heterogeneity in feature distributions. Variables such as the area and rent exhibit positively skewed, long-tailed distributions, while binary variables are clustered at distinct values. These distributional patterns underline the complexity of rental datasets, where mixed data types and nonlinear interactions are prevalent. Consequently, they reinforce the necessity for robust machine learning models capable of handling such data structures and for attribution methods that can accommodate inter-feature dependencies and nonlinear behavior.
Figure 5 presents a SHAP summary plot that captures the marginal contributions of the most influential features in the rental price prediction model. Each dot represents a SHAP value corresponding to a single prediction instance, while the color gradient reflects the original feature value (with blue indicating low values and red indicating high values). The horizontal axis reflects the direction and magnitude of each feature’s impact: dots further to the right indicate a positive effect on the predicted rent, while those to the left suggest a negative effect.
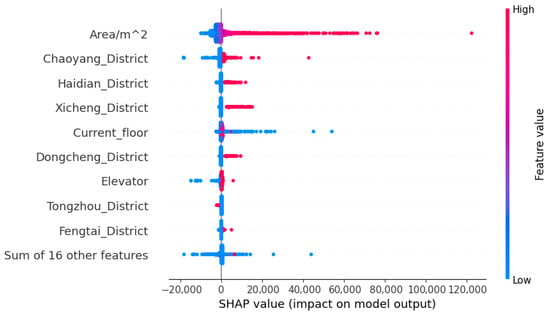
Figure 5.
SHAP value plot of feature impacts on rental price prediction.
Among all features, Area/m2 stands out as the most dominant, showing the widest distribution of SHAP values and a concentration of red points on the right side of the axis. This indicates that larger property sizes substantially increase the predicted rental price, which aligns with the conventional market understanding. Several district indicators—such as Chaoyang District, Haidian District, Xicheng District, and Dongcheng District—also exert significant influence. High values (i.e., listings located in these districts) are consistently associated with higher model outputs, reflecting the higher rental demand and property valuation in central Beijing. Features such as the current floor and elevator also exhibit a consistent positive contribution, though with a more moderate impact. Notably, the presence of an elevator correlates with higher predicted rents, underscoring its value in tenant preferences.
Figure 6 complements this by depicting the mean absolute SHAP value for each feature, which quantifies its average contribution to the model output across all samples. The results confirm that Area/m2 is by far the most important feature, with an average contribution exceeding 3200—significantly more than any other variable. District-level features follow in importance, with Chaoyang District leading the group. Features such as the current floor and elevator also demonstrate a notable influence, exceeding the combined contribution of the remaining sixteen features.
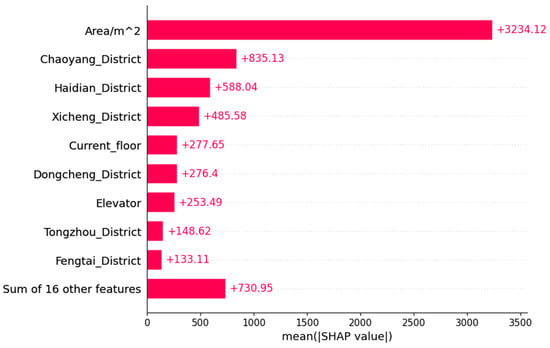
Figure 6.
Mean SHAP values indicating overall feature importance in rental price prediction.
Together, these two plots offer a comprehensive view of feature importance: Figure 3 reveals local variation and directional trends, while Figure 4 provides a global ranking of explanatory power. The consistency of results across both plots validates the reliability of the SHAP framework and demonstrates that the model captures key domain-relevant factors. In particular, the dominant roles of the property size and location reaffirm their status as the primary determinants of rent pricing in urban housing markets.
Figure 7 compares feature attributions generated by Shapley values (blue), Least Core allocations (orange), and the fused attribution method (green) for a selected test instance representing an edge case. This figure illustrates the distinct behaviors of the three attribution methods—Shapley, the Least Core, and the fused approach—in explaining local predictions, particularly under atypical or distributionally shifted input scenarios.
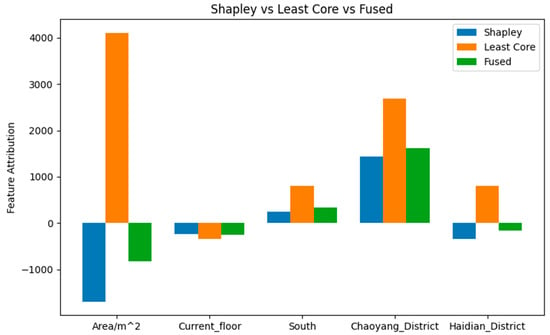
Figure 7.
Top 5 feature attributions for a single test using Shapley, Least Core, and fused methods.
A particularly notable observation arises in the attribution for the feature Area/m2. In this sample, the Shapley value assigns a large negative contribution to area, suggesting that larger units are associated with a lower predicted rent. This interpretation is clearly inconsistent with domain knowledge and empirical patterns observed throughout the dataset, where the property size is widely recognized as a key positive driver of rental price. The deviation reveals a critical shortcoming of the Shapley approach—its averaging nature can produce unstable or even misleading attributions under certain sample conditions, particularly when interactions or coalitions in the feature space behave irregularly.
In contrast, the Least Core method assigns a strong positive attribution to the area, in line with market expectations and global feature rankings. This reinforces the robustness of the Least Core approach, which seeks to minimize the dissatisfaction of the worst-performing feature subsets. By formulating the attribution as a stability-focused optimization problem, the Least Core offers explanations that remain consistent and contextually valid even under adversarial or extreme data configurations.
Other features such as the current floor, Chaoyang District, and Haidian District also display attribution differences across methods. While Shapley occasionally under- or overestimates their contributions, the fused method provides a more balanced view—integrating the fairness properties of Shapley with the robustness guarantees of the Least Core framework. For example, on the Chaoyang District feature, the fused attribution closely mirrors that of the Least Core, reflecting its ability to preserve reliable explanatory signals in high-impact urban locations.
Overall, this case highlights a fundamental limitation of Shapley values in localized explanations: under certain inputs, their reliance on marginal averaging can obscure the true feature importance. The Least Core, by emphasizing worst-case fairness, offers a more resilient alternative. The fused approach demonstrates that combining both perspectives can achieve more stable, interpretable, and trustworthy explanations—especially in high-stakes prediction settings such as real estate pricing.
Figure 8 provides a comprehensive overview of how each explanation method behaves across a broad set of instances, highlighting consistency, variance, and reliability.
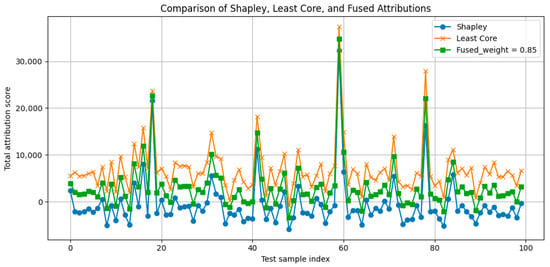
Figure 8.
Total attribution scores across 100 test samples using Shapley values, Least Core allocations, and the fused method (λ = 0.85).
The Shapley attribution curve exhibits significant volatility, with attribution scores fluctuating frequently between positive and negative values. In several cases, the total attribution score drops to markedly negative levels. Such instability suggests that Shapley values are highly sensitive to local feature interactions and input perturbations, making them less reliable when explanations need to be robust across diverse cases. In practical settings—particularly in high-stakes applications like real estate valuation—this lack of consistency may undermine user trust in model outputs.
In contrast, the Least Core method demonstrates a much more stable pattern. The orange curve remains consistently positive across nearly all samples, with smoother transitions and moderate variation. This behavior reflects the core advantage of the Least Core approach: by minimizing the maximum dissatisfaction across all possible feature subsets, it provides robust and worst-case-aware attributions. Even in cases where attribution spikes occur—such as around sample indices 20, 60, and 75—the Least Core method maintains coherent and reliable explanations that align with general expectations.
The fused method, shown in green, offers an intermediate solution. While it inherits some fluctuation from its Shapley component, it also benefits from the stabilizing effect of the Least Core, resulting in improved consistency overall. The hybrid curve demonstrates that a well-tuned fusion can preserve fairness and average-case interpretability while significantly enhancing stability.
5. Conclusions
This study proposed a novel hybrid explainability framework that integrates the Shapley value and Least Core attribution to address the dual challenges of fairness and robustness in real estate price prediction. By leveraging the global fairness properties of Shapley values and the worst-case resilience of Least Core allocations, the proposed approach offers a balanced solution to the interpretability gap in complex machine learning models.
Empirical results based on large-scale 2024 rental data from Beijing demonstrate that while Shapley-based attributions are effective in identifying globally important features, such as the property area and district location, they are prone to instability under data perturbations or edge-case inputs. In contrast, the Least Core approach provides more stable and contextually consistent explanations by minimizing the dissatisfaction of the most disadvantaged feature subsets. When integrated through a weighted fusion mechanism, the resulting hybrid attributions exhibit improved consistency, interpretability, and robustness across diverse scenarios.
Visualizations and quantitative metrics—including the attribution variance and mean absolute deviation—consistently show that the fused method mitigates the volatility of pure Shapley attributions while preserving key explanatory patterns aligned with market logic. Notably, in case-specific analyses, the hybrid model successfully corrected misleading attributions observed in the Shapley outputs, reinforcing its value in high-stakes decision-making environments such as real estate valuation and policy planning.
In sum, the Shapley–Least Core hybrid attribution framework advances the state of explainable AI by offering a practical and theoretically grounded method that is both fair and robust. It holds significant potential for enhancing trust, transparency, and accountability in AI-powered applications across the real estate sector and beyond.
6. Discussion
This study demonstrates that integrating the Shapley value and Least Core attribution provides a practical solution for achieving both fairness and robustness in rental price interpretations. However, several limitations and directions for future research remain.
First, the framework was tested on structured data from a single city. Its generalizability across different cities or countries with varying market structures should be further explored. Second, the fixed linear weighting between Shapley and the Least Core may not suit all cases. Adaptive or data-driven weighting strategies could enhance flexibility and responsiveness to the context. Third, while the current model focuses on local feature attribution, many stakeholders require broader insights such as global importance, counterfactuals, or scenario analysis. Integrating the method into richer interpretability tools would improve its practical value. Finally, computational efficiency remains a challenge, especially for high-dimensional data. More efficient solvers or approximation methods could help scale the approach.
In summary, the hybrid model offers a promising step toward more reliable and interpretable AI in real estate, with potential for broader applications in other high-stakes domains.
Author Contributions
Conceptualization, X.W. and T.K.; methodology, X.W.; software, X.W.; validation, X.W. and T.K.; formal analysis, X.W.; investigation, X.W.; resources, X.W.; data curation, X.W.; writing—original draft preparation, X.W.; writing—review and editing, X.W. and Tris Kee; visualization, X.W.; supervision, T.K.; project administration, T.K. All authors have read and agreed to the published version of the manuscript.
Funding
This research received no external funding.
Data Availability Statement
Dataset available on request from the authors: The raw data supporting the conclusions of this article will be made available by the authors on request.
Conflicts of Interest
The authors declare no conflict of interest.
Correction Statement
This article has been republished with a minor correction to the Data Availability Statement. This change does not affect the scientific content of the article.
References
- Ciaramella, A.; Dall’Orso, M. Urban Regeneration and Real Estate Development: Turning Real Estate Assets into Engines for Sustainable Socio-Economic Progress; Springer Nature: London, UK, 2021. [Google Scholar]
- González, M.; López-Espín, J.J.; Aparicio, J. A parallel algorithm for matheuristics: A comparison of optimization solvers. Electronics 2020, 9, 1541. [Google Scholar] [CrossRef]
- Lundberg, S.M.; Lee, S.-I. A unified approach to interpreting model predictions. Adv. Neural Inf. Process. Syst. 2017, 30, 4768–4777. [Google Scholar]
- Abidoye, R.B.; Chan, A.P.; Abidoye, F.A.; Oshodi, O.S. Predicting property price index using artificial intelligence techniques: Evidence from Hong Kong. Int. J. Hous. Mark. Anal. 2019, 12, 1072–1092. [Google Scholar] [CrossRef]
- Tekouabou, S.C.; Gherghina, Ş.C.; Kameni, E.D.; Filali, Y.; Idrissi Gartoumi, K. AI-based on machine learning methods for urban real estate prediction: A systematic survey. Arch. Comput. Methods Eng. 2024, 31, 1079–1095. [Google Scholar] [CrossRef]
- Zurada, J.; Levitan, A.; Guan, J. A comparison of regression and artificial intelligence methods in a mass appraisal context. J. Real Estate Res. 2011, 33, 349–388. [Google Scholar] [CrossRef]
- Dou, M.; Gu, Y.; Fan, H. Incorporating neighborhoods with explainable artificial intelligence for modeling fine-scale housing prices. Appl. Geogr. 2023, 158, 103032. [Google Scholar] [CrossRef]
- Alsulamy, S. Predicting construction delay risks in Saudi Arabian projects: A comparative analysis of CatBoost, XGBoost, and LGBM. Expert Syst. Appl. 2025, 268, 126268. [Google Scholar] [CrossRef]
- Ileri, K. Comparative analysis of CatBoost, LightGBM, XGBoost, RF, and DT methods optimised with PSO to estimate the number of k-barriers for intrusion detection in wireless sensor networks. Int. J. Mach. Learn. Cybern. 2025, 1–20. [Google Scholar] [CrossRef]
- Chen, W.; Farag, S.; Butt, U.; Al-Khateeb, H. Leveraging Machine Learning for Sophisticated Rental Value Predictions: A Case Study from Munich, Germany. Appl. Sci. 2024, 14, 9528. [Google Scholar] [CrossRef]
- Ho, W.K.; Tang, B.-S.; Wong, S.W. Predicting property prices with machine learning algorithms. J. Prop. Res. 2021, 38, 48–70. [Google Scholar] [CrossRef]
- Pu, G.; Zhang, Y.; Chou, L.-C. Estimating financial information asymmetry in real estate transactions in China-an application of two-tier Frontier model. Inf. Process. Manag. 2022, 59, 102860. [Google Scholar] [CrossRef]
- Sriram, H.K. Leveraging artificial intelligence and machine learning for next-generation credit risk assessment models. Eur. Adv. J. Sci. Eng. 2025, 1. [Google Scholar] [CrossRef]
- Dada, E.; Eyeregba, M.; Mokogwu, C.; Olorunyomi, T.D. AI-Driven policy optimization for strengthening economic resilience and inclusive growth in Nigeria. J. Artif. Intell. Policy Mak. 2024, 15, 23–37. [Google Scholar]
- Kothandapani, H.P. Advanced Artificial Intelligence models for Real-Time monitoring and prediction of macroprudential risks in the housing finance sector: Addressing interest rate shocks and housing price volatility to support proactive Decision-Making by federal agencies. J. Artif. Intell. Res. 2022, 2, 391–416. Available online: https://thesciencebrigade.com/JAIR/article/view/507 (accessed on 28 August 2025).
- Hassija, V.; Chamola, V.; Mahapatra, A.; Singal, A.; Goel, D.; Huang, K.; Scardapane, S.; Spinelli, I.; Mahmud, M.; Hussain, A. Interpreting black-box models: A review on explainable artificial intelligence. Cogn. Comput. 2024, 16, 45–74. [Google Scholar] [CrossRef]
- Pedreschi, D.; Giannotti, F.; Guidotti, R.; Monreale, A.; Ruggieri, S.; Turini, F. Meaningful explanations of black box AI decision systems. In Proceedings of the AAAI Conference on Artificial Intelligence, Madrid, Spain, 20–27 January 2019. [Google Scholar]
- Rudin, C. Stop explaining black box machine learning models for high stakes decisions and use interpretable models instead. Nat. Mach. Intell. 2019, 1, 206–215. [Google Scholar] [CrossRef]
- Acharya, D.B.; Divya, B.; Kuppan, K. Explainable and Fair AI: Balancing Performance in Financial and Real Estate Machine Learning Models. IEEE Access 2024, 12, 154022–154034. [Google Scholar] [CrossRef]
- Longo, L.; Brcic, M.; Cabitza, F.; Choi, J.; Confalonieri, R.; Del Ser, J.; Guidotti, R.; Hayashi, Y.; Herrera, F.; Holzinger, A. Explainable Artificial Intelligence (XAI) 2.0: A manifesto of open challenges and interdisciplinary research directions. Inf. Fusion 2024, 106, 102301. [Google Scholar] [CrossRef]
- Minh, D.; Wang, H.X.; Li, Y.F.; Nguyen, T.N. Explainable artificial intelligence: A comprehensive review. Artif. Intell. Rev. 2022, 55, 3503–3568. [Google Scholar] [CrossRef]
- Das, A.; Rad, P. Opportunities and challenges in explainable artificial intelligence (xai): A survey. arXiv 2020, arXiv:2006.11371. [Google Scholar] [CrossRef]
- Chinnaraju, A. Explainable AI (XAI) for trustworthy and transparent decision-making: A theoretical framework for AI interpretability. World J. Adv. Eng. Technol. Sci. 2025, 14, 170–207. [Google Scholar] [CrossRef]
- Chundru, S. Ensuring Data Integrity Through Robustness and Explainability in AI Models. Trans. Latest Trends Artif. Intell. 2020, 1, 1–19. [Google Scholar]
- Chander, B.; John, C.; Warrier, L.; Gopalakrishnan, K. Toward trustworthy artificial intelligence (TAI) in the context of explainability and robustness. ACM Comput. Surv. 2025, 57, 1–49. [Google Scholar] [CrossRef]
- Li, M.; Sun, H.; Huang, Y.; Chen, H. Shapley value: From cooperative game to explainable artificial intelligence. Auton. Intell. Syst. 2024, 4, 2. [Google Scholar] [CrossRef]
- Merrick, L.; Taly, A. The explanation game: Explaining machine learning models using shapley values. In Proceedings of the Machine Learning and Knowledge Extraction: 4th IFIP TC 5 2020, TC 12, WG 8.4, WG 8.9, WG 12.9 International Cross-Domain Conference, CD-MAKE 2020, Dublin, Ireland, 25–28 August 2020. [Google Scholar]
- Dwivedi, R.; Dave, D.; Naik, H.; Singhal, S.; Omer, R.; Patel, P.; Qian, B.; Wen, Z.; Shah, T.; Morgan, G. Explainable AI (XAI): Core ideas, techniques, and solutions. ACM Comput. Surv. 2023, 55, 1–33. [Google Scholar] [CrossRef]
- Ter-Minassian, L.; Clivio, O.; Diazordaz, K.; Evans, R.J.; Holmes, C.C. Pwshap: A path-wise explanation model for targeted variables. In Proceedings of the International Conference on Machine Learning, Osaka, Japan, 4–6 February 2023. [Google Scholar]
- Lundberg, S.M.; Erion, G.; Chen, H.; DeGrave, A.; Prutkin, J.M.; Nair, B.; Katz, R.; Himmelfarb, J.; Bansal, N.; Lee, S.-I. From local explanations to global understanding with explainable AI for trees. Nat. Mach. Intell. 2020, 2, 56–67. [Google Scholar] [CrossRef]
- Olsen, L.H.B.; Glad, I.K.; Jullum, M.; Aas, K. A comparative study of methods for estimating model-agnostic Shapley value explanations. Data Min. Knowl. Discov. 2024, 38, 1782–1829. [Google Scholar] [CrossRef]
- Sebastián, C.; González-Guillén, C.E. A feature selection method based on Shapley values robust for concept shift in regression. Neural Comput. Appl. 2024, 36, 14575–14597. [Google Scholar] [CrossRef]
- Ortigossa, E.S.; Gonçalves, T.; Nonato, L.G. EXplainable artificial intelligence (XAI)–From theory to methods and applications. IEEE Access 2024, 12, 80799–80846. [Google Scholar] [CrossRef]
- Wang, H.; Liang, Q.; Hancock, J.T.; Khoshgoftaar, T.M. Feature selection strategies: A comparative analysis of SHAP-value and importance-based methods. J. Big Data 2024, 11, 44. [Google Scholar] [CrossRef]
- Tan, X.; Qi, Z.; Tang, L.; Cohen, M.C. A General Framework for Robust Individualized Decision Learning with Sensitive Variables. SSRN Electron. J. 2024. [CrossRef]
- Kern, W.; Paulusma, D. Matching games: The least core and the nucleolus. Math. Oper. Res. 2003, 28, 294–308. [Google Scholar] [CrossRef]
- Finus, M.; Rundshagen, B. A micro foundation of core stability in positive-externality coalition games. J. Institutional Theor. Econ. 2006, 162, 329–346. [Google Scholar] [CrossRef]
- Chamola, V.; Hassija, V.; Sulthana, A.R.; Ghosh, D.; Dhingra, D.; Sikdar, B. A review of trustworthy and explainable artificial intelligence (xai). IEEE Access 2023, 11, 78994–79015. [Google Scholar] [CrossRef]
- Kalasampath, K.; Spoorthi, K.; Sajeev, S.; Kuppa, S.S.; Ajay, K.; Angulakshmi, M. A Literature review on applications of explainable artificial intelligence (XAI). IEEE Access 2025, 13, 41111–41140. [Google Scholar] [CrossRef]
- Carmichael, Z. Explainable AI for High-Stakes Decision-Making; University of Notre Dame: Notre Dame, IN, USA, 2024. [Google Scholar]
- Cohen, S.; Dror, G.; Ruppin, E. Feature selection via coalitional game theory. Neural Comput. 2007, 19, 1939–1961. [Google Scholar] [CrossRef] [PubMed]
- Parisineni, S.R.A.; Pal, M. Enhancing trust and interpretability of complex machine learning models using local interpretable model agnostic shap explanations. Int. J. Data Sci. Anal. 2024, 18, 457–466. [Google Scholar] [CrossRef]
- Nallakaruppan, M.; Chaturvedi, H.; Grover, V.; Balusamy, B.; Jaraut, P.; Bahadur, J.; Meena, V.; Hameed, I.A. Credit risk assessment and financial decision support using explainable artificial intelligence. Risks 2024, 12, 164. [Google Scholar] [CrossRef]
- Roder, J.; Maguire, L.; Georgantas, R.; Roder, H. Explaining multivariate molecular diagnostic tests via Shapley values. BMC Med. Inform. Decis. Mak. 2021, 21, 211. [Google Scholar] [CrossRef]
- Lei, D.; Ma, J.; Zhang, G.; Wang, Y.; Deng, X.; Liu, J. Bayesian ensemble learning and Shapley additive explanations for fast estimation of slope stability with a physics-informed database. Natural Hazards 2024, 121, 2941–29701. [Google Scholar] [CrossRef]
- Roughgarden, T. Beyond the Worst-Case Analysis of Algorithms; Cambridge University Press: Cambridge, UK, 2021. [Google Scholar]
- Chen, Y.; Ren, Q.; Yan, J. Rethinking and improving robustness of convolutional neural networks: A shapley value-based approach in frequency domain. Adv. Neural Inf. Process. Syst. 2022, 35, 324–337. [Google Scholar]
- Lorenz, F.; Willwersch, J.; Cajias, M.; Fuerst, F. Interpretable machine learning for real estate market analysis. Real Estate Econ. 2023, 51, 1178–1208. [Google Scholar] [CrossRef]
- Mathotaarachchi, K.V.; Hasan, R.; Mahmood, S. Advanced machine learning techniques for predictive modeling of property prices. Information 2024, 15, 295. [Google Scholar] [CrossRef]
- Abidoye, R.B. Towards Property Valuation Accuracy: A Comparison of Hedonic Pricing Model and Artifiical Neural Network. Ph.D. Thesis, Hong Kong Polytechnic University, Hong Kong, China, 2017. [Google Scholar]
- Kucklick, J.-P.; Müller, O. Tackling the accuracy-interpretability trade-off: Interpretable deep learning models for satellite image-based real estate appraisal. ACM Trans. Manag. Inf. Syst. 2023, 14, 1–24. [Google Scholar] [CrossRef]
- Bell, A.; Solano-Kamaiko, I.; Nov, O.; Stoyanovich, J. It’s just not that simple: An empirical study of the accuracy-explainability trade-off in machine learning for public policy. In Proceedings of the 2022 ACM Conference on Fairness, Accountability, and Transparency, New York, NY, USA, 21–24 June 2022. [Google Scholar]
- Liao, H.-F.; Chu, N.-Y.; Peng, C.-W. Awareness of Independence of Real Estate Appraisers: An Empirical Analysis. Int. Real Estate Rev. 2018, 21, 295–316. [Google Scholar] [CrossRef]
- Bordt, S. Explainable Machine Learning and Its Limitations. Ph.D. Thesis, Universität Tübingen, Tübingen, Germany, 2023. [Google Scholar]
- Ferry, J. Addressing Interpretability Fairness & Privacy in Machine Learning Through Combinatorial Optimization Methods. Ph.D. Thesis, Université Paul Sabatier-Toulouse III, Toulouse, France, 2023. [Google Scholar]
- Winter, E. The shapley value. Handb. Game Theory Econ. Appl. 2002, 3, 2025–2054. [Google Scholar]
- Louati, A.; Lahyani, R.; Aldaej, A.; Aldumaykhi, A.; Otai, S. Price forecasting for real estate using machine learning: A case study on Riyadh city. Concurr. Comput. Pract. Exp. 2022, 34, e6748. [Google Scholar] [CrossRef]
- Bennetot, A.; Donadello, I.; El Qadi El Haouari, A.; Dragoni, M.; Frossard, T.; Wagner, B.; Sarranti, A.; Tulli, S.; Trocan, M.; Chatila, R. A practical tutorial on explainable AI techniques. ACM Comput. Surv. 2024, 57, 1–44. [Google Scholar] [CrossRef]
- Geipele, I.; Kauskale, L.; Lepkova, N.; Liias, R. Interaction of socio-economic factors and real estate market in the context of sustainable urban development. Environmental Engineering. In Proceedings of the International Conference on Environmental Engineering, Vilnius, Lithuania, 22–23 May 2014. [Google Scholar]
Disclaimer/Publisher’s Note: The statements, opinions and data contained in all publications are solely those of the individual author(s) and contributor(s) and not of MDPI and/or the editor(s). MDPI and/or the editor(s) disclaim responsibility for any injury to people or property resulting from any ideas, methods, instructions or products referred to in the content. |
© 2025 by the authors. Licensee MDPI, Basel, Switzerland. This article is an open access article distributed under the terms and conditions of the Creative Commons Attribution (CC BY) license (https://creativecommons.org/licenses/by/4.0/).