Abstract
Vertical containment barriers—critical for intercepting contaminant transport in subsurface environments—demand materials that balance low permeability with adequate strength, particularly in stress-sensitive mountainous terrain. Plastic concrete, as a key barrier material, provides essential properties, including exceptional stress relaxation, to suppress fracture development under compressive loads, coupled with effective seepage control. This study examines its strength performance through experiments on varied mixing techniques (dry, wet, and 24 h hydration), unconfined compression under uncontaminated conditions (water–binder ratios: 1.3–2.1, bentonite content: 20–30%, ages: 14–90 days), barium ion immersion (1–5 g/L, pH 7–11), and dry–wet cycling (10 cycles). Key findings demonstrate that (1) the strength of samples prepared by dry mixing and wet mixing is lower than that of samples mixed for 24 h, and all specimens met the target design strength following 28 days of curing; (2) under pollution-free conditions, strength decreases with higher water–binder ratios and bentonite content, showing a linear relationship. Strength increases exponentially with age; (3) in the presence of Ba2+, strength gradually decreases as Ba2+ concentration and pH increase, particularly notably at 3 g/L Ba2+ and pH 11. Strength increases with age, following a power relationship; (4) under dry–wet cycles, ion concentration has minimal impact on sample quality and surface state but significantly affects strength, with higher ion concentrations leading to greater strength loss and susceptibility to cycles; (5) during solution immersion, higher ion concentrations and pHs result in greater strength loss and worse erosion resistance.
1. Introduction
In recent years, a range of activities in China, including oil extraction, chemical production, pharmaceutical manufacturing and mining, have resulted in a large number of historically or newly created contaminated sites. These environmental pollution problems have seriously affected the sustainable development of urbanization [,,]. Data from the 2022 release of China’s Ecological and Environmental Conditions Bulletin indicate that 10% of the country’s soil exceeds pollution standards []. Significant contamination affects cultivated land, forest land, grassland, and unused land, particularly in Southwest and South Central regions—a legacy of heavy metal exceedances from industrial bases established in earlier decades. These problems have resulted in a legacy of soil contamination issues. In 2019, China handled and stored around 700 million tons of general industrial solid waste and industrial hazardous waste. Over the past few years, a lot of research has been conducted on waste utilization and active measures have been taken to address this issue. While this represents an improvement compared to previous years, a substantial amount of waste continues to be stored, posing a heavy burden on the soil environment. Underground water and soil pollution are serious concerns, posing threats to the health of residents and the ecological environment [,]. Additionally, this pollution restricts the reuse of land, making engineering treatment for these waste materials an urgent necessity.
Vertical containment barriers represent a primary physical remediation approach for contaminated sites, functioning through utilization of naturally occurring low-permeability strata and hydrologically isolated subsurface units. Internationally, there are eight main types of vertical pollution barriers used in contaminated site remediation projects in the field of environmental protection: soil–bentonite vertical barriers, cement–bentonite vertical barriers, soil–cement–bentonite vertical barriers, geomembrane composite vertical barriers, plastic concrete vertical barriers, deep mixing grouting soil vertical barriers, jet grouting vertical barriers, and sheet pile vertical barriers. This technology installs impermeable vertical encasements around pollution zones to intercept leachate migration into groundwater systems, thereby containing contaminant transport. Plastic concrete serves as an optimal barrier material due to its congruence with foundation elasticity, exceptional deformation compatibility, minimal hydraulic conductivity, and inherent self-consolidating properties. These combined characteristics enable effective long-term performance in environmental containment applications.
Researchers globally have extensively investigated the effects of water–binder ratio, bentonite content, and curing age on the impermeability of plastic concrete, yet critical factors in formulation methods remain understudied. Based on the investigation, we list the current representative preparation methods: (1) Becker, Pisheh and Jafarzadeh et al. [,,] prepare plastic concrete as follows: Bentonite is poured into water and mixed well, sealed, and left for 24 h. After the bentonite is fully expanded, cement is added and mixed well, and finally coarse and fine aggregates are added for mixing and pulping. (2) Abbaslou et al. [] prepare plastic concrete as follows: First, one-fourth of the water is mixed with bentonite clay, then sealed for 24 h. After the bentonite clay is sufficiently expanded, half of the water is mixed with cement and added to the bentonite suspension. Finally, the remaining one-fourth of the water is mixed with coarse and fine aggregates and added to the cement–bentonite suspension for mixing and pulping.
In addition to the advantages of a low elastic modulus, small permeability coefficient, self-leveling and self-compacting, plastic concrete has a certain strength. In some mountainous and hilly areas, there will also be a large number of polluted sites [,,,]. If low-strength anti-seepage and anti-fouling materials are used, the anti-fouling barrier will easily be damaged under the action of earth pressure, resulting in the seepage of pollutants from cracks and the loss of the original excellent performance. In this case, plastic concrete with a certain strength is needed to build the wall. Therefore, there is an urgent need to study the strength characteristics of plastic concrete.
Kazemian et al. [] studied the change in compressive strength of plastic concrete after adding different kinds of bentonite and explained the internal reasons from the perspective of chemical reaction. The results show that the compressive strength of plastic concrete with high bentonite activity is higher, which is mainly due to the large amount of free water consumed by high bentonite activity. Wang et al. [] studied the influence of mix ratio and age of curing on the strength of plastic concrete through laboratory tests. The results show that the unconfined compressive strength of plastic concrete is positively correlated with cement content and age, and the increase in hydration products is the internal reason for the increase in strength. Amlashi et al. [] studied the effects of bentonite content, moisture content and curing age on the compressive strength of plastic concrete by collecting literature data and using a neural network model. The results indicate a negative correlation between moisture content and compressive strength. When the moisture content is held constant, compressive strength decreases with increasing bentonite content. Furthermore, the rate of compressive strength gain accelerates with prolonged age.
Vertical anti-fouling barriers used for contaminated site treatment are quite different from impermeable walls. It is necessary to account for the variation in strength of vertical barrier materials under hydraulic conditions and exposure to contaminants at polluted sites. The rapid development of Chinese industry makes heavy metal pollution a serious threat to people’s life and health. In light of this, a vertical anti-pollution barrier is an important means of pollution control, and more and more people are paying attention to its changing nature under the action of heavy metals. Cao et al. [] investigated the effect of lead and zinc ions on the compressive strength as well as the microstructure of magnesium phosphate soil–cement. The results show that lead and zinc ions will participate in the hydration and carbonization reactions of soil–cement, and further affect the later strength of soil–cement. Buj et al. [] studied the effects of various heavy metal nitrate solutions on the strength of magnesium phosphate soil–cement. Their research indicates that elevated heavy metal content reduces the compressive strength of magnesium phosphate cement under high-water conditions, whereas it increases strength under low-water scenarios. Song [] cured plastic concrete samples in potassium dichromate, lead nitrate, and copper nitrate solutions with ion concentrations of 0 mg/L, 1 mg/L and 100 mg/L, and determined the strength and permeability coefficient of the samples at the age of 28 days. After analysis, the compressive strength did not change much with the increase in ionic concentration, with a range of no more than 10%, and the permeability coefficient of 28 d samples was on the same order of magnitude.
Most scholars conducting research on plastic concrete use a specific preparation method to mix plastic concrete without considering the impact of the preparation method on the properties of plastic concrete. In terms of heavy metal specificity, research predominantly focuses on Pb2+/Zn2+ (Cao et al., 2019 []), neglecting Ba2+, which is prevalent in Southwest China’s industrial zones. To address these gaps, this work (1) systematically evaluates three mixing methods (dry/wet/24 h hydration) for influencing pore structure (SEM/porosity tests); (2) investigates the effect of Ba2+ on the unconfined compressive strength of plastic concrete (1, 3, 5 g/L, pH 7–11); (3) assesses durability through accelerated dry–wet cycling (10 cycles simulating 5-year field exposure). These experiments directly target barrier applicability in contaminated mountainous terrain, where stress corrosion and hydraulic fluctuations prevail.
In this paper, by using different preparation methods, an unconfined compressive strength test, a dry–wet cycle, and a solution immersion test, we explore the variation rule of unconfined compressive strength with water–binder ratio, bentonite content, and age, as well as the influence of Ba2+ and dry–wet cycle conditions on the unconfined compressive strength of plastic concrete.
2. Materials and Methods
2.1. Test Materials
The main components of plastic concrete used in this paper are (1) curing material; (2) calcium bentonite; and (3) Fujian standard sand, as shown in Figure 1.
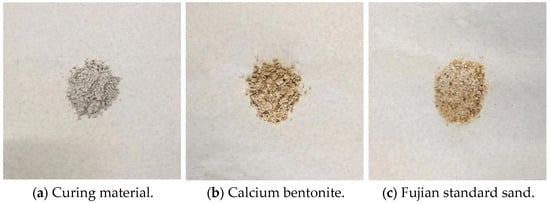
Figure 1.
Material composition diagram of plastic concrete.
(1) The curing agent blend consisted of 70% slag powder, 5% steel slag powder, 4% fly ash, 20% cement, and 1% desulphurization product. Table 1 below shows the main chemical composition and content of the curing materials.

Table 1.
Main chemical components and contents of curing materials.
(2) The bentonite used in this paper is a sodium-modified calcium bentonite from Inner Mongolia, which is yellowish-brown in color. According to the “Standard for Geotechnical Testing Methods” (GB/T 50123-2019) [], the liquid limit and plastic limit are determined using a liquid limit and plastic limit combined tester, and the moisture content is determined using the drying method. The results for Inner Mongolia bentonite are shown in Table 2, and the main chemical composition and content of Inner Mongolia bentonite are shown in Table 3.

Table 2.
Physical indexes of bentonite in Inner Mongolia.

Table 3.
Main chemical composition and content of bentonite in Inner Mongolia.
(3) Fujian standard sand. With the purpose of uniformity and reproducibility of raw materials in the test process, using Fujian standard sand instead of a coarse and fine aggregate selection program takes into account the conditions of uneven grading, continuous grading curve, good grading, and reliable and stable sources. The particle size d60 and effective particle size d10 of Fujian standard sand were 0.8967 mm and 0.1385 mm, d30 was 0.3566 mm, the inhomogeneity coefficient Cu was 6.47, and the curvature coefficient Cc was 1.02. The particle size distribution curve of Fujian standard sand is shown in Figure 2.
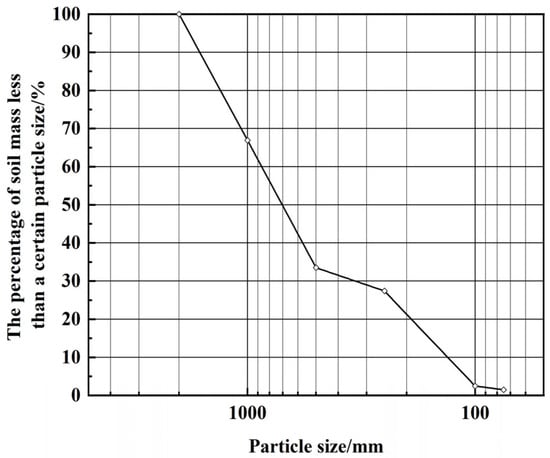
Figure 2.
Particle size distribution curve of Fujian standard sand.
(4) Heavy metal pollution liquid. BaCl2 solution was used as heavy metal-contaminated solution, as shown in Figure 3. BaCl2 crystals are more than 99.5% pure, in which the main impurities are nitrogen, sodium, potassium, calcium, iron, strontium, lead and water-insoluble matter.
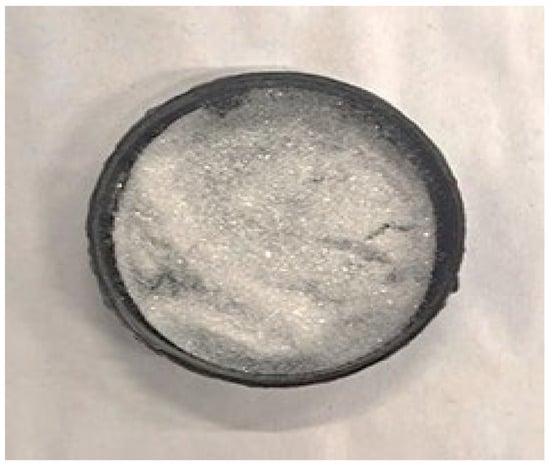
Figure 3.
BaCl2 crystal.
2.2. Preparation of Samples
2.2.1. Dry Mixing
First, Inner Mongolia bentonite is mixed with solidified material, Fujian standard sand and other dry materials. After mixing evenly, the mixed dry materials are poured into water, and then the plastic concrete is obtained by mixing and beating.
2.2.2. Wet Mixing
Firstly, Inner Mongolia bentonite is poured into water and stirred well, and then left to stand for 30 min. Then, the bentonite slurry is mixed with solidifying materials and Fujian standard sand, and finally stirred and vibrated to obtain plastic concrete.
The dry–wet cycle test conditions are consistent with the annual temperature fluctuations of groundwater in southwestern China []. According to the preparation method described in this section, a plastic concrete mixture is prepared with a water–binder ratio of 1.3, 1.5, 1.7, 1.9, 2.1 and a bentonite content of 20%, 25%, 30%. The water–binder ratio refers to the ratio of the mass of water to the total mass of GS curing material and bentonite, while the bentonite content refers to the ratio of the mass of bentonite to the total mass of GS curing material and bentonite.
2.2.3. Bentonite Is Hydrated for 24 h and Then Mixed
Inner Mongolia bentonite is poured into the water and mixed until homogeneous, after 24 h of sealing, the solidified material is mixed with Fujian standard sand to obtain mixed dry material, and the bentonite slurry is continuously stirred to prevent the slurry from sinking. Finally, the mixed dry material is poured into the bentonite slurry and stirred to beat, and plastic concrete is obtained.
2.2.4. Forming Steps
The ratio of the height of the sample h to the diameter D (h/D) should be in the range of 2.0~2.5, with a typical specimen diameter of 39.1 mm and height of 80 mm. Consider preparing samples directly using a mold with an inner diameter of 39.1 mm and a height of 80 mm. This is performed as follows: (1) Weigh the appropriate amount of Fujian standard sand before testing. The material is then weighed according to the incorporation ratio of water, bentonite, cement and slag. (2) Perform plastic concrete material mixing. (3) Pour the plastic concrete material into the mold in three batches. (4) The curing conditions for plastic concrete are as follows: temperature of 20 ± 2 °C and 98% humidity in a curing room.
2.3. Test Method
Unless otherwise specified, three parallel samples were tested under each experimental condition.
2.3.1. Porosity Test
Referring to the method for determining the porosity of porous materials mentioned by Li [], the imbibition method is used here to determine porosity. The working principle of the imbibition method is to fill all the pores inside the dried sample with water under vacuum conditions, and the volume of the pores filled with water is the pore volume of the sample. Vacuum saturation required a vacuum pump and vacuum cylinder, as shown in Figure 4.
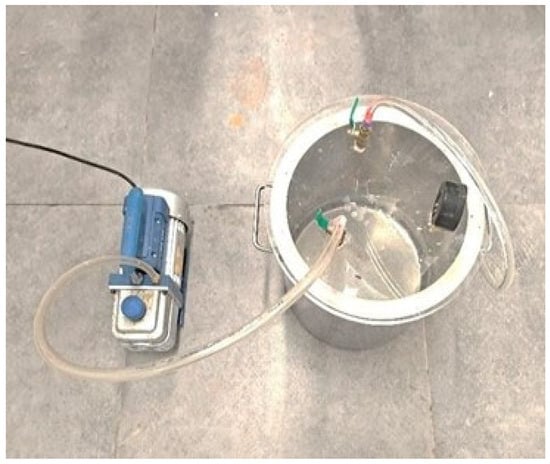
Figure 4.
Vacuum pump and vacuum-saturated cylinder.
2.3.2. Unconfined Compressive Strength Test
The unconfined compressive strength test is conducted in accordance with the standard “Standard Test Methods for Geotechnical Engineering” (GB/T 50123-2019) []. The specimens for the unconfined compressive strength test were prepared in three groups, each consisting of 9 mixed ratios × 4 age groups. The test instrument is a fully automatic data acquisition unconfined compression instrument produced by Nanjing Soil Instrument Factory Co., Ltd. (Nanjing, China) shown in Figure 5. The maximum axial force is 10 kN, and the shear rate is 0.0001~4.8 mm/min.
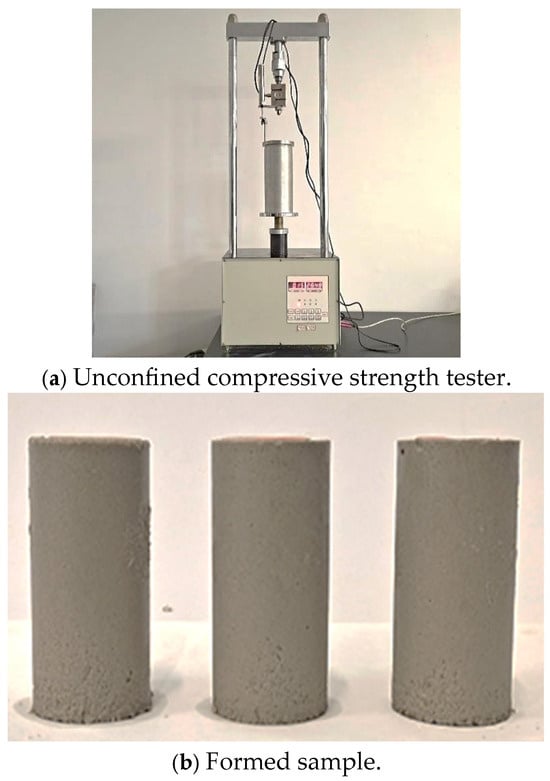
Figure 5.
Unconfined compressive strength tester and formed sample.
2.3.3. Dry–Wet Cycle Test
To evaluate dry–wet cycle impacts on plastic concrete barriers under simulated heavy metal contamination, specimens were prepared using BaCl2 solution (2 g/L or 4 g/L, pH = 11) instead of tap water. This meets the threshold for barium concentration in contaminated soil covering the mining area []. After 28-day curing, samples underwent 10 dry–wet cycles as follows:
- (i)
- Wet cycle: 24 h immersion in tap water;
- (ii)
- Dry cycle: 48 h oven-drying at 30 °C.
The implementation process is detailed in Figure 6.
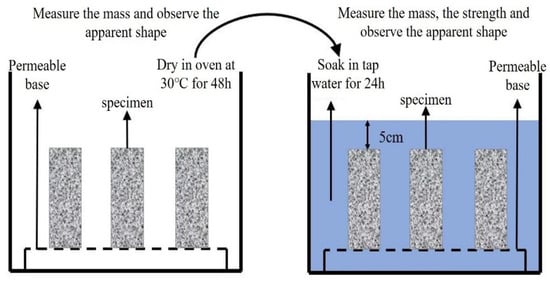
Figure 6.
Dry–wet cycle flow.
The quality of plasticized concrete samples was measured at the end of each phase cycle, and the apparent shape of the sample was photographed, and the plastic concrete anti-pollution barrier sample was evaluated based on two aspects: the quality change and the apparent shape of the sample. The change in mass of the sample is expressed as the rate of mass loss CML, and the calculation formula of the mass loss rate CML is as follows:
where mt is the mass value of plastic concrete specimen after the t dry–wet cycle, m0 is the mass value of plastic concrete specimen at the 0th dry–wet cycle, and Δmt is the mass loss value of plastic concrete sample after the t dry–wet cycle.
2.3.4. Solution Immersion Test
For the purpose of studying the degree of immersion of the plastic concrete anti-pollution barrier after heavy metal contamination by solution, BaCl2 solutions with ion concentrations of 1 g/L, 3 g/L and 5 g/L, a pH of 11, and ion concentrations of 5 g/L, pH 7, and 9 were used instead of tap water to prepare plastic concrete samples. The sample soaked in solution is the same as the sample with unconfined compressive strength, and the BaCl2 solution soaking test starts after 28 d of age, as shown in Figure 7. Soaking time: 4 stages, namely 3 days, 7 days, 14 days, and 28 days of curing. The solution needs to be changed once a week. An unconfined compressive strength test was carried out on the soaked sample to determine its strength and evaluate it based on the aspects of mass change and apparent shape. The evaluation criteria are shown in Table 4.
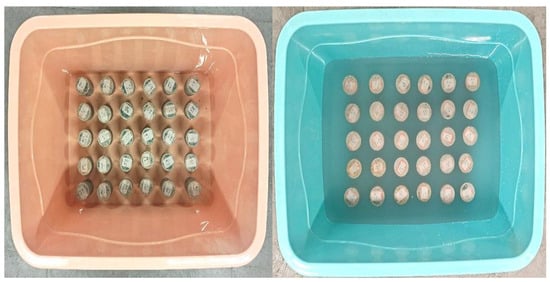
Figure 7.
Solution soaking test diagram.

Table 4.
Resistance of vertical barriers to heavy metal erosion.
2.3.5. Scanning Electron Microscope Test
The scanning electron microscope (SEM) is shown in Figure 8. This instrument can magnify plastic concrete specimens by a factor of 20 to 10,000. During the test, the voltage must be adjusted to obtain clear magnified photographs of the plastic concrete specimens.
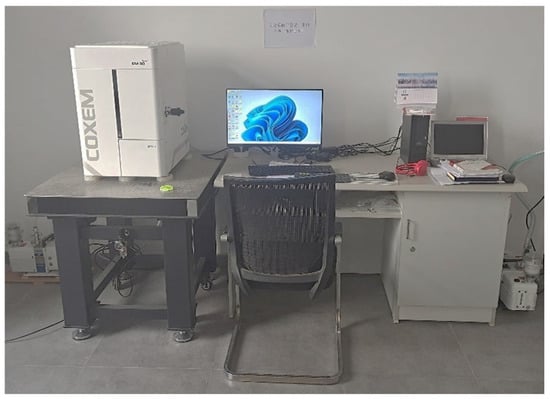
Figure 8.
SEM—scanning electron microscope.
The specific operational steps are as follows: (1) Select plastic concrete specimens from the improved flexible wall permeability test and unconfined compressive strength test. Break the specimens into pieces small enough to fit on the specimen holder, as shown in Figure 9 (right). (2) Place the broken specimens in an oven and ensure they are dried for more than 8 h. (3) Remove the dried specimens from the oven and place them on the specimen holder. To prevent the specimens from falling off during scanning electron microscope observation, special adhesive tape should be applied to the specimen holder to secure the specimens. (4) Place the specimen and specimen holder into the gold-sputtering instrument for gold sputtering. The gold-sputtering instrument is shown in Figure 9 (left). (5) Place the gold-sputtered specimen into the scanning electron microscope. Then, using computer control, evacuate the instrument’s interior. Once the computer software displays a vacuum level of 100%, the electron gun can be activated for observation and photography.
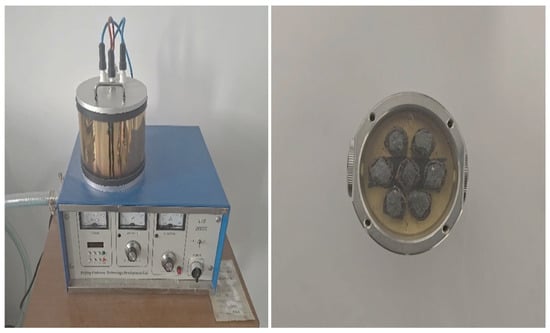
Figure 9.
Gold spraying instrument and sample.
3. Results
3.1. Influence of Preparation Methods and Mix Ratio on Strength
3.1.1. Influence of Different Preparation Methods
Under different preparation methods, Figure 10 shows the unconfined compressive strength of plastic concrete after 28 d of curing. It can be seen from Figure 10 that the 28 d unconfined compressive strength of plastic concrete meets the strength requirement of 2 MPa regardless of the preparation method. The 28 d compressive strength of plastic concrete mixed by dry and wet methods is smaller compared to the 28 d compressive strength of plastic concrete mixed by 24 h separation. The former is 4.1 MPa, while the latter is larger—about 5.4 MPa, which is 31.7% higher.
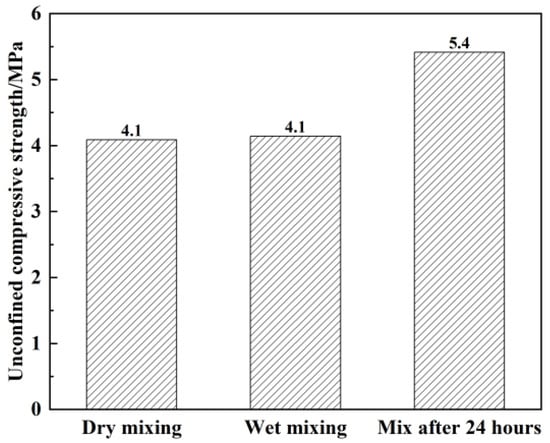
Figure 10.
Variation in the unconfined compressive strength of samples in response to the mixing method under the condition of curing for 28 d.
3.1.2. Influence of Different Mix Ratios
Under the premise that the workability requirements for construction are satisfied, the unconfined compressive strength decreases with the increase in the water–binder ratio regardless of the change in bentonite content, as shown in Figure 11 (the water–binder ratio is abbreviated as W/B in Figure 11). The sample with a water–binder ratio of 1.3 has higher strength, with an unconfined compressive strength of more than 2 MPa at 14 days of age, while the samples with a water–cement ratio of 2.1 had an unconfined compressive strength of more than 2 MPa at 60 days of age. At 20% bentonite content, the unconfined compressive strength decreases considerably as the water–cement ratio increases. When the bentonite content is 25% and 30%, the unconfined compressive strength decreases with the increase in the water–cement ratio. When the age is 60 d, the decreases are 20.1% and 29.1%, respectively.
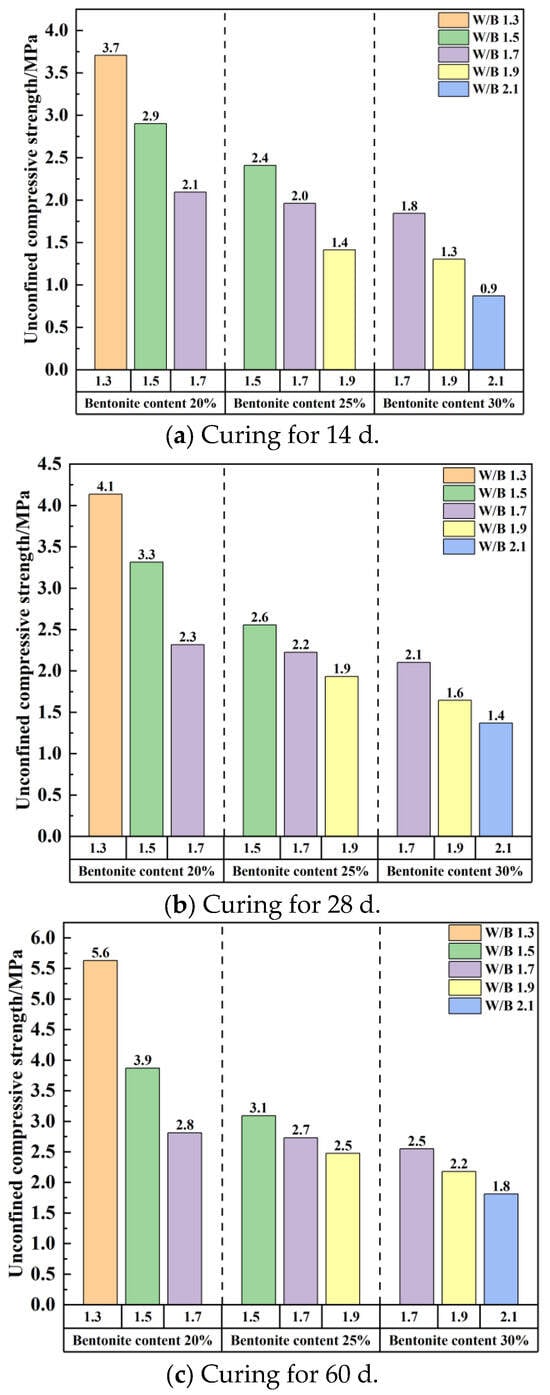
Figure 11.
Unconfined compressive strength changes with water–binder ratio.
As can be seen from Figure 12, based on the premise that the construction workability is satisfied and the water–binder ratio remains unchanged at 1.7, the unconfined compressive strength gradually decreases with the increase in bentonite content. Increasing the bentonite content from 20% to 30% resulted in samples still exceeding 2 MPa unconfined compressive strength at 28 days of age, thus meeting the strength design requirements []. At the age of 14 d, the bentonite content also changed by 10% and the unconfined compressive strength decreased by 11.9%. At the same age, the bentonite content was determined, the water–binder ratio increased from 1.3 to 1.7, and the unconfined compressive strength decreased by 43.7%. Upon comparison, it was concluded that an increase in the water–binder ratio had a more pronounced effect on the strength of plastic concrete compared to a large increase in bentonite content.
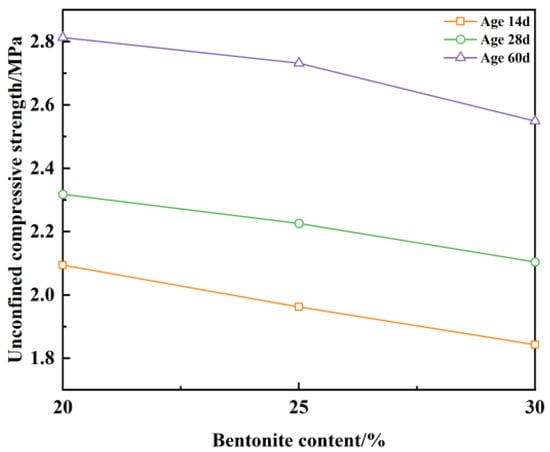
Figure 12.
Unconfined compressive strength with bentonite content.
The following can be derived by observing Figure 13 (the bentonite content is abbreviated as BC): The unconfined compressive strength ranges from 0.9 MPa to 3.7 MPa at age 14 d; from 1.4 MPa to 4.1 MPa at age 28 d; from 1.8 MPa to 5.6 MPa at age 60 d; and from 2.2 MPa to 6.3 MPa at age 90 d. Compared with the previous age, the results show that the unconfined compressive strength of each group of ratios increased to different degrees, indicating that the unconfined compressive strength of plastic concrete varies greatly under the influence of the curing age. The general rule is as follows: the longer the curing age of the same mix ratio, the greater the unconfined compressive strength.
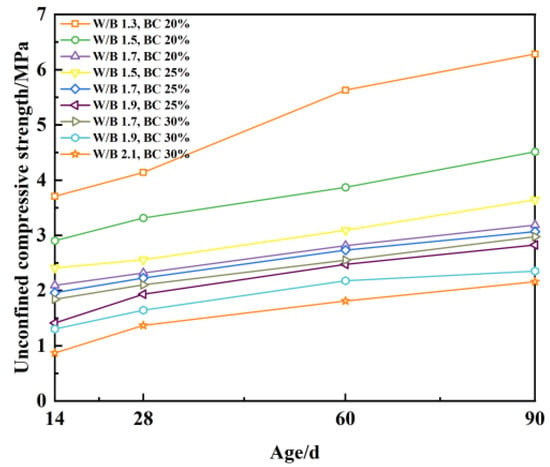
Figure 13.
Unconfined compressive strength with age.
3.2. Influence of Barium Ion on Unconfined Compressive Strength
In studying the strength properties under non-polluted conditions, it was found that both the water–binder ratio and bentonite content had an effect. Therefore, for the purpose of clarifying the strength characteristics of plastic concrete under Ba2+ action, the following studies on strength characteristics under Ba2+ action determined the mix ratios: a water–binder ratio of 1.3, and bentonite content of 20%.
3.2.1. Influence of Barium Ion Concentration on Strength
From Figure 14, it can be seen that the unconfined compressive strength decreases gradually with the increase in ion concentration when the pH value is constant at 11. Considering the changes in ionic concentration and unconfined compressive strength at the age of 14 d, when the ion concentration increases from 0 g/L to 2 g/L, the unconfined compressive strength decreases by 8.3%; the ion concentration increases from 2 g/L to 3 g/L; the unconfined compressive strength decreases by 17.4%; the ion concentration increases from 3 g/L to 4 g/L; and the unconfined compressive strength decreases by 7.2%. When the ion concentration reaches 3 g/L, the rate of strength reduction is obvious, and this law is also satisfied at the age of 28 d, but the decrease is linear at the age of 60 d and 90 d.
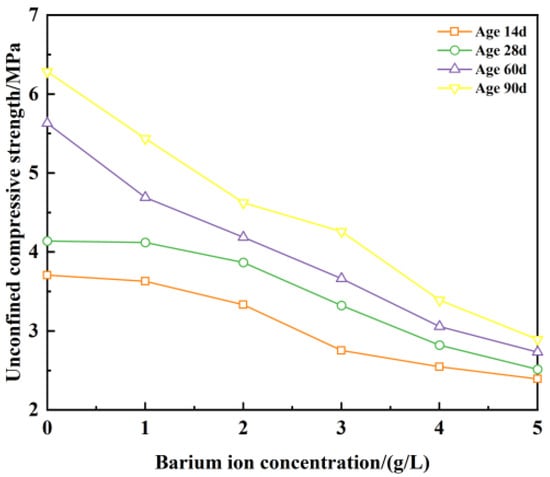
Figure 14.
Unconfined compressive strength with ion concentration and age at pH = 11.
3.2.2. Influence of pH in Barium Ion Solution on Strength
Figure 15 illustrates that under a fixed ion concentration of 5 g/L, the unconfined compressive strength progressively diminishes as the solution’s pH increases. For instance, at the 14-day curing age, elevating the solution’s pH from 7 to 9 results in a strength reduction of 4.1%, while a further increase to pH 11 causes a more substantial decline of 25.1%. This indicates that Ba2+ exerts minimal influence on strength when the solution pH remains below 9, whereas a pronounced strength reduction occurs at higher pH levels. This trend is consistently observed across all tested ages. Critically, even at pH 11, the unconfined compressive strength consistently surpassed the 2 MPa threshold specified for vertical barriers in GB/T 50123-2019 [], fulfilling essential engineering strength criteria.
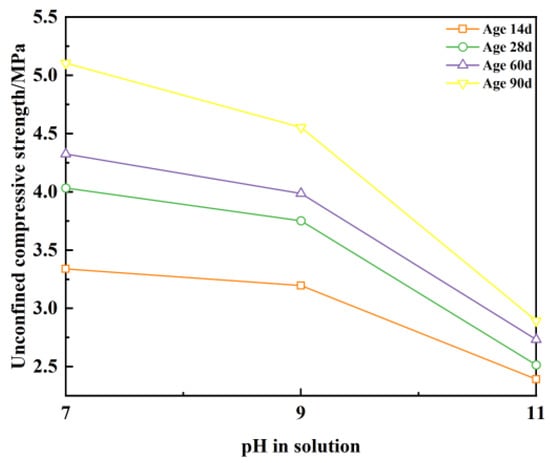
Figure 15.
Unconfined compressive strength with pH and age at ion concentration of 5 g/L.
3.2.3. Influence of Age on Unconfined Compressive Strength
Figure 16 (in which the ionic concentration is abbreviated as IC) shows that the increase in unconfined compressive strength ranges from 5.1% to 20.8% as the age increases from 14 d to 28 d, and from 6.3% to 13.8% as the age increases from 60 d to 90 d. The growth rate of unconfined compressive strength ranges from 5.9% to 17.9%. It was concluded that the growth rate of unconfined compressive strength was generally higher from 14 d to 28 d than from 60 d to 90 d, indicating that the growth rate of unconfined compressive strength slows down with increasing age. This indicates that the unconfined compressive strength of plastic concrete is strongly influenced by the ionic concentration and solution pH. The growth of strength with age is inhibited.
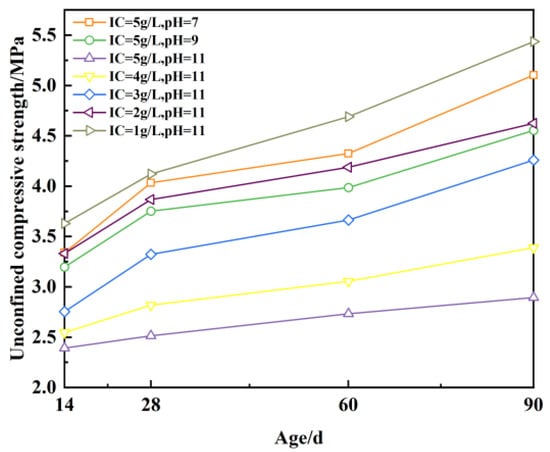
Figure 16.
Unconfined compressive strength with age.
3.3. Influence of Wet and Dry Cycles on Unconfined Compressive Strength
After the completion of each stage of the wet–dry cycle, the unconfined compressive strength of the sample was measured and compared with that of the sample which did not undergo a wet–dry cycle. Through the formula used to calculate the strength loss rate, the curve of strength loss rate changing with the progression of wet–dry cycle was obtained, as shown in Figure 17. The formula for calculating the strength loss rate SL is as follows:
wherein represents the strength of plastic concrete sample of the same age, and represents the strength of plastic concrete sample of the nth dry–wet cycle.
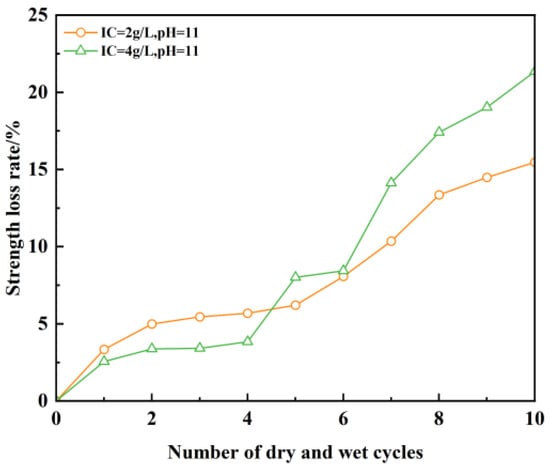
Figure 17.
Unconfined compressive strength loss of test material under dry–wet cycling.
As evidenced in Figure 17, the unconfined compressive strength of plastic concrete anti-fouling barrier specimens undergoes a stepwise decline under dry–wet cycling, with progressive accumulation of strength loss. Within the initial four cycles, strength loss increases moderately; beyond this stage, the deterioration rate escalates markedly. After 4 cycles, peak strength loss reaches 5.7%, whereas after 10 cycles, the loss magnitude climbs to 21.3%. This demonstrates that the detrimental impact of dry–wet cycling on strength loss intensifies progressively with cycle count. The ionic concentration exerts an equally significant influence on strength deterioration. For specimens at pH 11 after four cycles, the mass loss rates register as 5.7% at 2 g/L ionic concentration versus 3.8% at 4 g/L. After 10 cycles under identical pH conditions: specimens at 2 g/L ionic concentration exhibit 15.5% mass loss; in contrast, those at 4 g/L ionic concentration manifest a substantially higher mass loss of 21.3%. These findings confirm that plastic concrete formulations with elevated ionic concentrations exhibit heightened susceptibility to strength deterioration under dry–wet cycling exposure.
3.4. Influence of Solution Soaking on Sample Strength
As can be seen from Figure 18, the unconfined compressive strength of the plastic concrete anti-fouling barrier specimens gradually decreases with increasing cumulative strength loss as the solution soaking time increases. When the soaking time is 3 d, the strength loss is 1.4~13.1%; when the soaking time is 7 d, the strength loss is 4.9~17.9%; when the soaking time is 14 d, the strength loss is 7.1~22.9%; when the soaking time is 28 d, the strength loss is 10.5~26.6%. There is a greater unconfined compressive strength loss. Solution pH is constant at 11, the ion concentration increases from 1 g/L to 5 g/L, and the corresponding strength loss increases from 12.4% to 26.6%, while the ion concentration is constant, the solution pH increases from 7 to 11, and the corresponding strength loss increases from 10.5% to 26.6%, indicating that the higher the ion concentration and solution pH, the higher the ion concentration and solution pH. The greater the loss of strength of a plastic concrete fouling barrier sample, the less erosion resistance it will have.
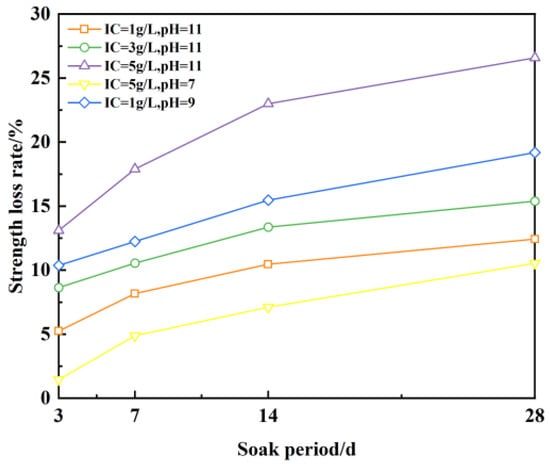
Figure 18.
Strength loss of sample under solution immersion.
4. Discussion
This section mainly addresses the change in sample structure and the quality loss caused by the external environment, and then the two phenomena are explained, respectively.
4.1. Influence of Structural Change on Sample Strength
4.1.1. Influence of Preparation Method, Mix Ratio and Age on Microstructure
In the above results, we found a relationship between the preparation method and the unconfined compressive strength. Similarly, in the experiment, we considered that the porosity would vary depending on the preparation method, so we attempted to fit the curve and explore the underlying principles. The discussion is as follows: Figure 19 presents the decrease in unconfined compressive strength of plastic concrete with the increase in porosity. The expression of the fitted curve of unconfined compressive strength and porosity is a quadratic function, and the combination of numbers and shapes indicates that the compactness of plastic concrete decreases with the increase in porosity, and the unconfined compressive strength gradually decreases. Due to the large hydrogel ratio, the free water content inside the plastic concrete samples is significant, and some of the free water forms channels to the outside world. The hydration reaction of the cementitious materials consumes the free water in the pores and forms pores inside the plastic concrete. In addition, the heat of hydration generated by the hydration reaction leads to high shrinkage and microstructural deterioration of plastic concrete. There are many microcracks on its surface and interior, and the combined effect of many factors leads to the existence of a large number of pores in plastic concrete, thus affecting its strength. This also explains why plastic concrete mixed using the dry method has a higher porosity, while concrete mixed using the wet method and mixed after 24 h has a lower porosity. The mixture ratio is 1.3 water–binder (W/B) and 20% bentonite content (BC).
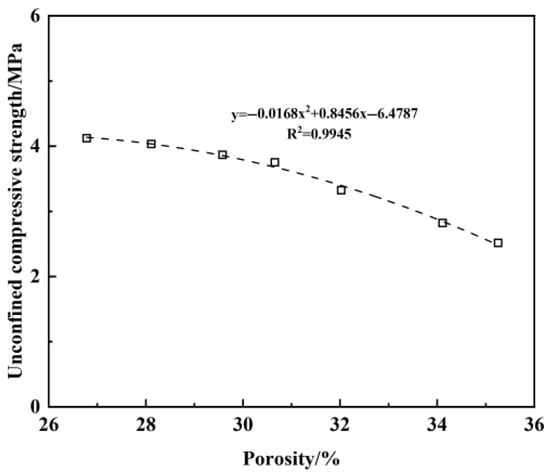
Figure 19.
Relationship between porosity and unconfined compressive strength.
In the design of barriers for contaminated mountainous areas, the bentonite content is limited to ≤25%, and the mass ratio of water to binder is limited to ≤1.7, ensuring that the strength exceeds 2 MPa after a certain period of use.
4.1.2. Influence of Solution Soaking on Apparent Structure Change
Figure 20a–d show the microscopic morphology of plastic concrete after compression failure under 1000 times magnification after sample preparation with a changing ion concentration and pH of solution, when an unconfined compressive strength test is performed after 28 d age. Figure 20a–c reveal that escalating ionic concentrations induce structural loosening post-compressive failure, characterized by compromised microstructural integrity and inadequate bonding between particle skeletons and cementitious matrices. This microstructural deterioration directly correlates with diminished macroscopic unconfined compressive strength. Conversely, comparative analysis of Figure 20c,d demonstrates that a reduced solution pH enhances packing density of hydration/carbonation products and unhydrated particles within plastic concrete, yielding a denser observable microstructure. As can be seen from the figure, when the pH is low (d), there are no obvious large cracks or holes throughout the sample, unlike when the pH is higher (c), in which case the sample exhibits greater overall integrity. After compression failure, hydration products still maintain a certain integrity, which is due to the integrity of dense structure and hydration products. The unconfined compressive strength is improved.
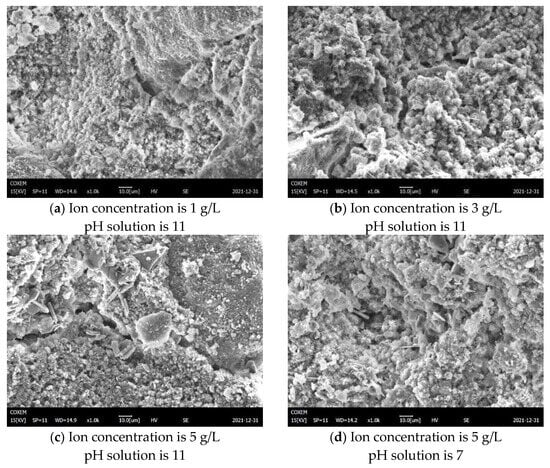
Figure 20.
SEM of plastic concrete sample after compression failure.
4.2. Influence of Mass Loss in Dry–Wet Cycle on Sample Strength
We measured the mass of the sample after each dry–wet cycle and compared it to the initial mass of the sample. The curve of the mass loss rate changing with the progression of the dry–wet cycle was obtained through the calculation formula of the mass loss rate CML, as shown in Figure 21.
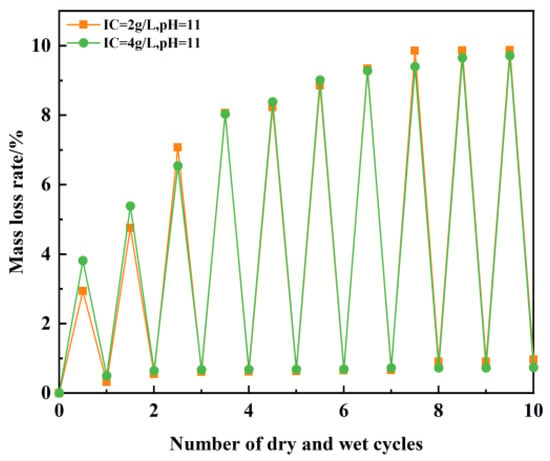
Figure 21.
Variation in the number of dry–wet cycles and the mass loss rate of test materials.
Figure 21 demonstrates progressive mass loss accumulation in plastic concrete with increasing dry–wet cycles. During dry phases, specimens dehydrate but reabsorb water in wet phases. This cyclic hydration–dehydration process induces characteristic fluctuations in the mass loss rate curve. For specimens prepared with BaCl2 solutions at pH 11, at a 2 g/L ion concentration, 9.8% mass loss occurs after 10 cycles. At 4 g/L ion concentration, 9.7% mass loss occurs after 10 cycles. Despite the doubled ion concentration, the mass loss rates remain statistically equivalent (9.8% and 9.7%). This indicates that ionic concentration variation exerts negligible influence on the mass stability of plastic concrete under dry–wet cycling conditions.
5. Conclusions
Under uncontaminated conditions, the influences of the water–binder ratio, bentonite content, and age on the unconfined compressive strength of plastic concrete were analyzed. Concurrently, Ba2+ exposure experiments examined the impacts of ionic concentration, solution pH, aging, dry–wet cycling, and solution immersion, and the following conclusions were drawn:
(1) Uncontaminated specimens exhibit linearly inverse correlations between unconfined compressive strength and both water–binder ratio and bentonite content. Concurrently, strength development follows an exponential function with curing age progression. The linear reduction in strength with higher water–binder ratios (W/B* > 1.7) and bentonite content (BC > 25%) provides a quantifiable basis for mix design. For mountain applications requiring >2 MPa strength, limiting W/B ≤ 1.5 and BC ≤ 20% is recommended to counteract Earth pressure.
(2) Under the action of Ba2+, the unconfined compressive strength gradually decreases with the increase in the Ba2+ concentration and pH, especially when the Ba2+ concentration reaches 3 g/L and the pH reaches 11, in which case the unconfined compressive strength shows an obvious decrease. With the increase in age, the unconfined compressive strength increases, and the relationship between strength and age is strong.
(3) Dry–wet cycling reveals minimal ionic concentration effects on specimen mass/surface morphology, yet significantly compromises compressive strength. The higher the ion concentration, the greater the strength loss and the higher the cycling-induced sensitivity.
(4) Solution immersion leaves the specimen mass unaffected by ionic concentration/pH, but induces progressive surface softening. The higher the ion concentration and pH of the solution, the higher the strength loss of the plastic concrete sample and the worse the resistance to erosion.
Author Contributions
Conceptualization, G.J. and S.W.; methodology, J.L.; software, L.Z.; validation, J.L. and H.X.; formal analysis, L.Z.; investigation, S.W.; resources, G.J.; data curation, L.Z.; writing—original draft preparation, J.L.; writing—review and editing, H.L.; visualization, J.L.; supervision, H.X.; project administration, G.J.; funding acquisition, H.X. All authors have read and agreed to the published version of the manuscript.
Funding
This research was funded by the Key Research and Development Program (Social Development) project of Zhenjiang, China (Grant No. SH2022017) and the APC was funded by the Key Research and Development Program (Social Development) project of Zhenjiang, China (Grant No. SH2022017).
Data Availability Statement
The original contributions presented in the study are included in the article, further inquiries can be directed to the corresponding author.
Acknowledgments
The authors would like to thank their colleagues for supporting this research.
Conflicts of Interest
Author Guolong Jin was employed by the company China Shipbuilding NDRI Engineering Co., Ltd. Author Lei Zhang was employed by the company China National Petroleum Corporation Research Institute of Safety and Environmental Technology Co., Ltd. The remaining authors declare that the research was conducted in the absence of any commercial or financial relationships that could be construed as a potential conflict of interest.
References
- Xue, Q.; Zhan, L.T.; Hu, L.M.; Du, Y.J. Research progress of environmental geotechnical engineering. Chin. J. Civ. Eng. 2020, 53, 80–94. [Google Scholar]
- Liao, X.Y.; Chong, Z.Y.; Yan, X.L.; Zhao, D. Urban industrial contaminated sites: A new topic in the field of environmental remediation in China. Environ. Sci. 2011, 32, 784–794. [Google Scholar]
- Du, Y.J.; Jin, F.; Liu, S.Y.; Chen, L.; Zhang, F. Research progress on solidification/stabilization treatment of heavy metal industrial contaminated sites. Rock Soil Mech. 2011, 32, 116–124. [Google Scholar]
- Bulletin of National Soil Pollution Survey; China Environmental Protection Industry: Beijing, China, 2014; pp. 10–11.
- Xie, J.; Li, O. Analysis of remediation and redevelopment of contaminated sites in China. World Environ. 2011, 3, 56–59. [Google Scholar]
- Zhang, X.F.; Lin, Y.S.; Yu, F.; Li, B. Research on soil heavy metal pollution in typical urban industrial zones. Resour. Environ. Yangtze Basin 2005, 4, 512–515. [Google Scholar]
- Becker, A.; Vrettos, C. Laboruntersuchungen zum Materialverhalten von Tonbeton. Bautechnik 2015, 92, 152–160. [Google Scholar] [CrossRef]
- Pisheh, Y.P.; Hosseini, S. Stress-strain behavior of plastic concrete using monotonic triaxial compression tests. J. Cent. South Univ. 2012, 19, 1125–1131. [Google Scholar] [CrossRef]
- Jafarzadeh, F.; Mousavi, S.H. Effect of specimen’s age on mechanical properties of plastic concrete walls in dam foundations. Electron. J. Geotech. Eng. 2012, 17, 473–482. [Google Scholar]
- Abbaslou, H.; Ghanizadeh, A.R.; Amlashi, A.T. The compatibility of bentonite/sepiolite plastic concrete cut-off wall material. Constr. Build. Mater. 2016, 124, 1165–1173. [Google Scholar] [CrossRef]
- Liu, H.Y.; Yang, P.J.; Peng, Y.; Li, L.; Liu, G.T.; Wang, X.M.; Peng, Y.X. Study on potential pollution of soil flow in simple landfill in mountainous and hilly areas of southwest China. In Proceedings of the 2021 Annual Science and Technology Conference of the Chinese Society of Environmental Sciences, Chongqing, China, 9–11 October 2021; pp. 2021–2525. [Google Scholar]
- Wang, X.F.; Cao, R.S.; Wu, X.L.; Zhang, Z.M.; Huang, X.F. Evaluation of soil heavy metal pollution in abandoned mining areas in karst mountains. J. Guizhou Norm. Univ. (Nat. Sci. Ed.) 2021, 39, 29–35. [Google Scholar]
- Wang, X.F.; Huang, X.F.; Hu, J.W.; Wu, X.L.; Yao, S.M. Cadmium pollution and crop enrichment characteristics around Ni-Mo abandoned mining area in karst mountains. Environ. Chem. 2019, 39, 1872–1882. [Google Scholar]
- Zhang, D.G.; Liu, Y.H.; Quan, S.Z. Analysis of heavy metal pollution in soil and crops of Gejiu Tin mine in Yunnan Province. Southwest Agric. J. 2014, 27, 2045–2049. [Google Scholar]
- Kazemian, S.; Ghareh, S.; Torkanloo, L. To investigation of plastic concrete bentonite changes on it’s physical properties. Procedia Eng. 2016, 145, 1080–1087. [Google Scholar] [CrossRef]
- Wang, S.; Wen, Y.; Hong, X.; Zhang, X. Effect of mix ratio and age on strength, pH value and electrical conductivity of plastic concrete. J. Build. Mater. 2019, 25, 97–101. [Google Scholar]
- Amlashi, A.T.; Abdollahi, S.M.; Goodarzi, S.; Ghanizadeh, A.R. Soft computing based formulations for slump, compressive strength, and elastic modulus of bentonite plastic concrete. J. Clean. Prod. 2019, 230, 1197–1216. [Google Scholar] [CrossRef]
- Cao, X.; Wang, W.; Ma, R.; Sun, S.; Lin, J. Solidification/stabilization of Pb2+ and Zn2+ in the sludge incineration residue-based magnesium potassium phosphate cement: Physical and chemical mechanisms and competition between coexisting ions. Environ. Pollut. 2019, 253, 171–180. [Google Scholar] [CrossRef] [PubMed]
- Buj, I.; Torras, J.; Casellas, D.; Rovira, M.; de Pablo, J. Effect of heavy metals and water content on the strength of magnesium phosphate cements. J. Hazard. Mater. 2009, 170, 345–350. [Google Scholar] [CrossRef] [PubMed]
- Song, B. Experimental Research on Plastic Concrete Cutoff Wall Materials. Master’s Thesis, China University of Geosciences, Beijing, China, 2010. [Google Scholar]
- GB/T 50123-2019; Standard for Geotechnical Testing Methods. China Planning Press: Beijing, China.
- Li, X.Q. Research on Thermal Conductivity of Wall Insulation Materials. Master’s Thesis, Xi’an University of Architecture and Technology, Xi’an, China, 2015. [Google Scholar]
Disclaimer/Publisher’s Note: The statements, opinions and data contained in all publications are solely those of the individual author(s) and contributor(s) and not of MDPI and/or the editor(s). MDPI and/or the editor(s) disclaim responsibility for any injury to people or property resulting from any ideas, methods, instructions or products referred to in the content. |
© 2025 by the authors. Licensee MDPI, Basel, Switzerland. This article is an open access article distributed under the terms and conditions of the Creative Commons Attribution (CC BY) license (https://creativecommons.org/licenses/by/4.0/).