Abstract
The vulnerability of older adults in rural mountainous regions presents a critical challenge for sustainable development, particularly in the context of smart city and digital town construction. In this study, we develop a comprehensive analytical framework and evaluation index to assess Vulnerability to Elderly Poverty (VEP) and adaptive capacity, with a focus on its integration with smart infrastructure and age-friendly rural built environment strategies. Using Shizhu County in Chongqing, China, as a case study, we explore spatial disparities in VEP and apply quantile regression to identify the driving factors of adaptability. Our findings indicate that subsidy-dependent, middle-aged, and empty-nest older adults are the most vulnerable groups, with limited capacity to adapt to changing environments. A geographically alternating “high–low–high–low” VEP pattern reflects uneven development in infrastructure, accessibility, and public service construction. These disparities highlight the need for targeted planning and building interventions in rural settings. The key factors influencing adaptability include individual attributes, intergenerational support, and macro-level conditions such as policy design and digital infrastructure deployment. The integration of aging-friendly building strategies, smart infrastructure, and digital tools significantly enhances older adults’ resilience and social inclusion. Based on our results, we propose four adaptation models for aging populations in rural areas, emphasizing the construction of inclusive digital infrastructure, aging-sensitive building design, and community-based support systems. Strategic recommendations include promoting digital literacy through built environment interventions, enhancing intergenerational living arrangements, and embedding elderly-responsive features into smart construction planning. This research offers new insights into construction management practices that support aging in place and poverty alleviation through inclusive and resilient built environments.
1. Introduction
Eradicating poverty is a global goal pursued jointly by nations and international organizations. In 2015, the United Nations set “ending poverty in all its forms everywhere” as the main goal of the 2030 Sustainable Development Agenda. Through joint efforts, the share of people living in extreme poverty fell from 29.3% in 2000 to 8.8% in 2019 []. However, recent crises—such as the COVID-19 pandemic, international conflicts, and extreme weather—have strained the global economy. These shocks have deepened economic downturns and increased income inequality. As a result, poverty has risen [], challenging sustainable reduction efforts.
Population aging is accelerating faster than previously projected []. Older adults form a vulnerable group with growing needs for healthcare, daily assistance, and social engagement. However, they face challenges—including reduced work capacity, lower social status, weakened family support, and a lack of kinship networks—that diminish income and quality of life []. Studies indicate that 80% of older adults in developing countries lack a regular income and are therefore highly vulnerable to poverty []. Likewise, in developed nations with advanced population aging, the incidence of poverty among older adults may be even higher. In 2019, the average poverty rate for older adults in OECD countries reached 16.2% []. Consequently, older adults are recognized as a high-risk group for poverty. China has the world’s largest older adult population, which features a rapidly aging demographic and a comparatively weak social economy. In 2020, roughly 13.39 million older adults in rural China received subsistence allowances, and approximately 3.66 million lived in extreme poverty []. The 2020 Poverty Monitoring Report on Rural China indicates poverty rates of 0.8% for those aged 61–80 and 15% for those over 80. The incidence of consumption-based poverty among older adults reached 13.1% []. Compared with urban peers, rural older adults endure poorer living conditions, greater labor intensity, and heavier family support burdens [], with an increased risk of falling into poverty []. Additionally, rural aging reduces agricultural labor supply [], alters cropping patterns [], lowers production efficiency [], and threatens the sustainability of farmers’ livelihoods. “Silver-haired poverty” refers to the situation in which older adults face difficulties in increasing income, possess insufficient assets to support old age, and lack adequate consumption and purchasing power []. Thus, “rural silver-haired poverty” constitutes an urgent social issue warranting attention amid global trends.
The concept of vulnerability originated in research on natural disasters and poverty, leading to varied definitions across disciplines. However, all definitions include one’s ability to respond to disturbances []. Poverty vulnerability refers to the probability of future welfare decline due to shocks, highlighting exposure risk rather than poverty outcomes []. Researchers use this concept to quantify the likelihood that individuals or households will fall into poverty. Recognized as a particularly vulnerable group, older adults’ poverty vulnerability has attracted extensive scholarly attention and generated a substantial body of research. First, researchers have established analytical frameworks, such as health–participation–security [] and vulnerability–social capital [], which serve as valuable references for later studies. Second, most VEP research has focused on developing countries such as India [] and China [], where low per capita income and weak social security systems prevail. Third, studies have investigated factors influencing VEP. Rissanen finds that older women face a higher risk of poverty than older men, attributable to lower educational attainment, poorer labor market status, and weaker social safety nets and capital []. Similarly, Jones highlights that reduced family support disproportionately endangers older adults living alone []. Beyond household factors, macro-level socioeconomic growth has been identified as a primary driver of old-age poverty alleviation as it raises the incomes of impoverished older adults []. At the institutional level, government-funded pension schemes play a pivotal role in reducing VEP [].
While these studies have enhanced our understanding of older adult poverty and its vulnerability mechanisms, several aspects remain underexplored. Older adults vary in age, livelihood, and residence, leading to significant differences in vulnerability levels []. Meanwhile, prior research has largely overlooked these distinctions, which results in gaps in the design and targeting of social security and poverty reduction policies. Moreover, although VEP variations have been analyzed at provincial and county levels [,,], the improvement of assistance and social security for older adults in recent years has placed greater demands on the effectiveness and targeting of public policies at the grassroots level of government departments, and research at the township-level remains scarce, leading to suboptimal spatial targeting of support and social protection resources.
More notably, few studies have integrated analyses of rural older adults’ VEP with smart city development and age-friendly rural built environments. International Business Machines Corporation (IBM) announced the construction of the first “smart city” in September 2009. The fundamental principle was to leverage new technologies to connect physical resources and public services within the city, thereby enabling intelligent operation and management []. A digital town refers to an area utilizing information and digital technologies to implement targeted transformations based on its specific needs and characteristics, with the ultimate goal of transforming its development model []. However, the vulnerability of older adults in rural mountainous areas in the digital age is distinctive in that it concerns not only individual survival but also reflects the broader exclusionary nature of certain development models []. If smart cities and digital towns fail to move beyond technocentrism and neglect to incorporate the needs of rural elderly populations into their design frameworks, their claims of sustainability will be fundamentally undermined by their disregard for the most vulnerable groups. This oversight will ultimately exacerbate regional development disparities, widen social divides, and impede the achievement of broader sustainable development goals []. Therefore, addressing the aging population in mountainous rural areas requires careful consideration of the unique characteristics of the local built environment and the multifaceted needs of older adults, encompassing productive, leisure, and social activities. To bridge this gap, an approach centered on “context-adaptive intelligence, inclusive spatial design, and precision-tailored services” is crucial. This extends the concept of age-friendliness beyond mere “physical space retrofitting” to incorporate “embedded intelligent services”. Through the bidirectional integration of “intelligence empowering age-friendliness” and “aging needs driving intelligent implementation”, this strategy holds significant potential not only to enhance the quality of life and social participation capacity of older adults in mountainous regions but also to catalyze the transformation of rural built environments towards “multifunctionality, inclusivity, and sustainability”, thereby mitigating the constraints of poverty vulnerability on rural development.
Additionally, scholars emphasize that risk shocks and adaptability are two fundamental dimensions of vulnerability []. External poverty risks inherently involve potential and uncertain shocks. Therefore, strengthening older adults’ adaptability is an essential strategy for reducing VEP. Adaptability refers to a farmer’s internal self-regulating adaptive capacity and resilience to external interventions in the face of risky coercion. The degree of vulnerability is inversely related to the existence and effectiveness of adaptive strategies—greater vulnerability reflects weaker adaptive capacity []. It can be observed that older adults also follow specific adaptation pathways to reduce poverty and improve their well-being [,]. However, a key limitation of existing studies is their failure to account for how regional physical and socioeconomic conditions, as well as support from their adult children, influence the adaptive capacity of older adults. In addition, limited attention has been given to the specific adaptation patterns adopted by older adults, despite the fact that these patterns can offer valuable insights for mitigating their vulnerability to poverty.
Chongqing, lies in China’s central and western regions, features towering mountains and deep valleys interlaced with numerous ravines, where mountains cover 76% of the area, hills 22%, and river valleys only 2%. Chongqing is a unique city that integrates an urban center, the Three Gorges Reservoir area, and a contiguous poverty-stricken region. Before the poverty alleviation campaign concluded, 18 districts and counties were designated poverty-stricken, accounting for 47.37% of Chongqing’s total districts and counties. Recently, the outmigration of young laborers has significantly increased the remaining older adult population, placing greater strain on poverty alleviation efforts. This trend makes the region a quintessential case for studying older adult poverty. Using Shizhu County, Chongqing as a case study, the main objectives of this study are to (1) develop an analytical framework with evaluation indices for VEP, revealing its characteristics and spatial disparities; (2) analyze VEP variations across livelihood types, age groups, and residential patterns; (3) determine factors influencing older adults’ adaptability at the macro (i.e., environmental) and micro (i.e., individual) levels, and explore their adaptive choices; and (4) synthesize the findings to explore implications for rural built environments, propose four adaptation patterns for older adults in mountainous areas with the aim of enhancing their adaptability and reducing poverty vulnerability, compare these findings with those of previous studies, and offer policy recommendations while acknowledging this study’s limitations.
2. An Analytical Framework and Index System for the VEP
Older adults are highly vulnerable to poverty—a risk closely linked to their living environment. In rural China, older adults rely heavily on agricultural production, making them vulnerable to natural disasters and market fluctuations. Moreover, older adults face age-related limitations, skill shortages, and digital divides [,], exposing their agricultural products, by-product activities, and casual employment to market volatility. In fact, older adults face growing demands for care and assistance in China. Due to the migration of family members for work, both familial elder care and the social status of older adults have declined, which further marginalizes their living conditions [,]. In general, physical decline reduces older adults’ labor capacity and income [], increasing their poverty risk. Additionally, older adults often suffer chronic and acute illnesses, leading to high medical expenses and expenditure-induced poverty in China []. Therefore, these varied risks and shocks significantly undermine older adults’ well-being.
Our poverty vulnerability assessment builds on Polsky’s Vulnerability Scoping Diagram (VSD) framework in this study. The framework adopts a comprehensive approach by integrating risk shocks, responses, and resulting “shock–response” outcomes, elucidating vulnerability’s internal mechanisms. It has been applied to study poverty risks and heterogeneous characteristics, especially in farming communities [,]. This study developed an analytical framework for VEP by integrating this framework with the Sustainable Livelihoods Approach (SLA) (Figure 1).
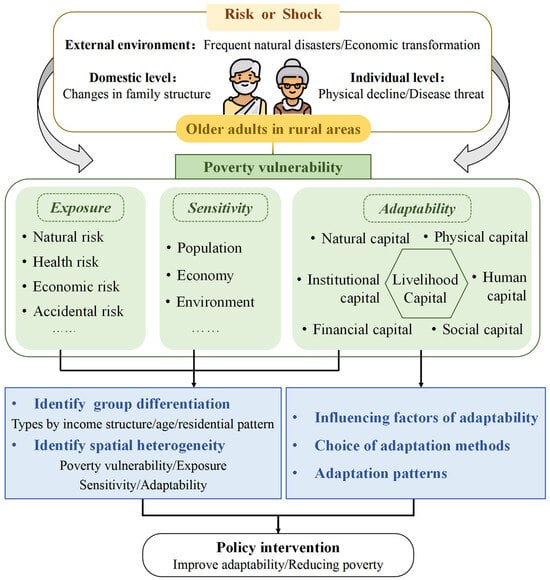
Figure 1.
Framework for analyzing the vulnerability of older adults to poverty.
In this framework, exposure denotes the degree to which a system can withstand external and internal pressures or risks []. Older adults’ poverty exposure was classified into four categories: natural risk, health risk, economic risk, and accidental risk. Natural risk is indicated by the types and frequencies of natural disasters []. Health risk is assessed indirectly via self-reported health status and disease types []. Economic risk is evaluated by market risk indicators []. Accidental risk is quantified using specific indicators [] (Table 1). Sensitivity denotes how easily a system is affected by risk disturbances. Key sensitivity indicators include elderly support ratio, extreme aging, and residential patterns for demographic sensitivity [,]; economic dependence for economic sensitivity []; and environmental sensitivity measured by disaster-affected areas [] (Table 1). Adaptability denotes a system’s capacity to recover from or mitigate losses due to disturbances. Livelihood capital protects and strengthens resilience against risks, sustaining older adults’ well-being. Building on previous research [,], we evaluated adaptability through livelihood capital, encompassing natural, physical, human, financial, and social components. Natural capital is measured by bio-production area []. Physical capital includes housing conditions, family fixed assets, and living facilities [,]. Human capital is assessed indirectly by education level and labor capacity [,]. Financial capital is represented by per capita income, while social capital is assessed via children’s support and social networks [,]. Additionally, given the role of social systems and government support as safety nets for rural older adults, this study integrated institutional capital into the framework using indicators such as social security, medical security, and government assistance [,] (Table 1). The weights of all indicators in Table 1 were established using the Fuzzy Analytic Hierarchy Process (FAHP), with detailed calculation procedures presented in Section 3.3 and Appendix A.

Table 1.
Evaluation indicator system for poverty vulnerability of the rural older adults.
By assessing the vulnerability of older adults to poverty, we identify which groups or regions are more susceptible to poverty-related risks and examine the key factors that influence their adaptability. This assessment also provides insights into potential future adaptation patterns that could more effectively mitigate their vulnerability to poverty.
3. Materials and Methods
3.1. Study Area
Shizhu County (107°59′–108°34′ E, 29°39′–30°32′ N), located in southeastern Chongqing (Figure 2), is predominantly mountainous, with such terrain covering 93.26% of its total area. The county’s topography features higher elevations in the southeast and lower elevations in the northwest. The ecological environment of Shizhu County has a limited carrying capacity, marked by fragmented farmland and complex interactions between human activity and nature. Although the county was officially lifted out of poverty at the end of 2019, rural development remains uneven and insufficient, as evidenced by a weak industrial base and a high risk of poverty recurrence among some farming households. In 2019, the poverty relapse rate in Shizhu was 4.92%, highlighting the challenges of sustaining poverty alleviation achievements. At the same time, the population in Shizhu has become more pronounced, further exacerbating rural poverty among older adults. By the end of 2022, the county’s total population reached 544,126, with individuals aged 60 and above accounting for 18.60%, a 5.76% increase since 2010. Additionally, 13,581 rural residents were recipients of the minimum living allowance []. Preventing aging-driven poverty among older adults is an especially pressing issue in Shizhu, making it a representative case for in-depth investigation.
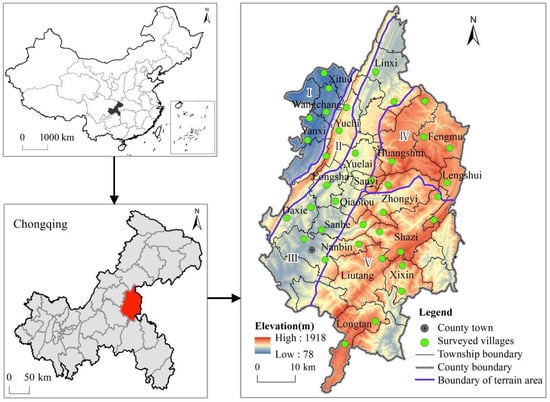
Figure 2.
Location of the study area. Note: I, II, III, IV, and V in the figure represent the plain area along the river, the low mountainous area of Fangdou Mountain, the valley area between Fangdou Mountain and Qiyao Mountain, the high mountainous area north of Qiyao Mountain, and the middle mountainous area south of Qiyao Mountain, respectively.
3.2. Data Source
This study is based on data collected through questionnaire surveys and key informant interviews conducted in Shizhu County from June to August 2024. A preliminary survey conducted in June 2024 offered initial insights into rural conditions, informing the design and refinement of the formal questionnaire. The formal survey was administered between July and August 2024 using a combination of stratified and random sampling methods. Specifically, a multi-stage stratified sampling strategy was employed. In the first stage, 20 townships were selected from a total of 32 townships, prioritizing economic development levels while also considering the geographical divisions of Shizhu County. In the second stage, 37 villages were chosen according to the size of their elderly populations and their locations. Finally, within each village, older adults aged 60 and above were randomly sampled. This approach ensured coverage of a broad range of terrain types, infrastructure conditions, and livelihood settings, thereby enhancing the representativeness of the data. The questionnaire covered a broad range of topics, including personal and household characteristics, livelihood capital, living conditions, infrastructure, family support, and external assistance. In total, 563 valid responses were collected, yielding a response rate of 95.6%. To supplement the survey data, in-depth interviews were conducted with 45 participants, including township-level officials (e.g., mayors and poverty alleviation officers) and village-level administrators (e.g., party secretaries and village directors). Each interview lasted at least 30 min and was intended to capture qualitative insights and contextual details not fully covered by the questionnaire.
3.3. Data Standardization and Weight Calculation
To account for differences in variable scales, all indicators were normalized to a 0–1 range. Details of the normalization equations are provided in Appendix A.
The Fuzzy Analytic Hierarchy Process (FAHP) is an extension of the Analytic Hierarchy Process (AHP) under fuzzy conditions. It possesses advantages such as quantitative nature, objectivity, and inclusiveness, enabling it to address fuzzy decision-making problems. The results obtained through FAHP are expressed with greater accuracy and clarity. In this paper, FAHP was used to determine the weights of indicators across the three dimensions listed in Table 1. The complete calculation steps and formulas are presented in Appendix A.
3.4. Calculation of Poverty Vulnerability Index
Building on established frameworks for assessing vulnerability, such as social–ecological and social vulnerability, we defined vulnerability as a function of exposure, sensitivity, and adaptability [,]. Based on this framework, we constructed a Poverty Vulnerability Index, calculated as follows:
In the formula, represents the vulnerability of older adults to poverty; represents the exposure index; represents the sensitivity index; and represents the adaptability index. The specific formulae for each index are described in Appendix B.
3.5. Quantile Regression Model and Variable Selection
The quantile regression model is a statistical approach for estimating the conditional relationship between dependent and independent variables at specified quantiles. It not only offers a comprehensive characterization of the dependent variable’s conditional distribution but also uncovers how predictor effects vary across the outcome spectrum. Unlike OLS (Ordinary Least Squares), which focuses solely on mean effects and may obscure heterogeneity, and other robust regression techniques that prioritize resistance to outliers, quantile regression precisely captures these differential associations at each level of adaptation, thereby providing a more realistic and detailed framework for adaptive analysis. Therefore, we construct a quantile regression model to reveal the factors influencing the adaptability of older adults. Detailed mathematical expressions and the objective function are provided in Appendix C.
This analysis examines the factors influencing the adaptability of rural older adults from both micro-level (individual attributes and intergenerational support) and macro-level (policies and systems, external environmental) perspectives (Table 2). Micro-level factors include gender, marital status, work experience, and psychological status of older adults []. In terms of intergenerational support, economic support from children enhances the quality of life of older adults, while caregiving support improves daily care and emotional well-being, both of which strengthen their ability to cope with uncertain risks []. At the macro level, three policy and system factors are considered: the allocation of elderly care resources, the number of health institutions, and access to medical insurance [,]. Environmental factors include transportation accessibility, which reflects how easily older adults can access nearby townships and markets. Along with the village’s level of economic development, this reflects the broader socioeconomic context. Altitude is used as a proxy for terrain complexity and natural environmental conditions [].
Table 2.
Description of variables in quantile regression.
3.6. Classification Criteria for Older Adults
Based on the contextual characteristics of the study area and survey data, we identified differences among older adults in terms of livelihood sources, age, and residential patterns. First, the rural older adults in Shizhu County rely on multiple income sources: (1) they engage in agricultural activities, including the cultivation of staple grains (e.g., rice and corn), cash crops (e.g., chili peppers, medicinal herbs, Brasenia schlegelii, and tea), and livestock farming (e.g., pigs and cattle); (2) some older adults supplement their income through part-time employment in local enterprises, such as black fungus farms, handicraft workshops, agricultural processing facilities, modern plantations (e.g., grape farms), and construction sites; and (3) they receive transfer income from government subsidies and remittances or pensions provided by their children. Additionally, income is also generated through land transfers, classified as property income. Based on the relative proportions of income sources, we classified older adults into four livelihood types: temporary work, agriculture-dominated, diversified, and subsidy-dependent. Second, following established classifications in the literature [], we divided older adults into three age groups: young-old, middle-old, and old-old. Third, we classified residential arrangements into four types for older adults: living alone, living as a couple, two-generation households, and multigenerational households (Table 3). The first two types are collectively referred to as “empty-nest” older adults.
Table 3.
Classification criteria of older adults by income structure, age and residential pattern.
4. Results
4.1. Characteristics and Trends of Older Adults at Sample Scale
The surveyed older adults exhibited advanced aging, with those aged ≥80 years comprising 30.72% of the sample (Table 4). Educational attainment was low: only 34.43% had completed junior high school or higher. Approximately 18.92% of older adults lived alone, and most had two to three children. Health risks were high, with a disease prevalence rate of 76.72%. Of these, 58.61% suffered from at least two chronic conditions, mainly hypertension, hyperlipidemia, heart disease, and joint disorders. Medical insurance coverage was insufficient, and out-of-pocket expenses were high. Only 62.82% of older adults had medical insurance. Average annual out-of-pocket costs were CNY 6346.89, significantly exceeding their average income. Older adults remained engaged in labor throughout life, relying primarily on land and manual work for their livelihood. The mean level of livelihood diversification was 0.461, with income mainly derived from farming, casual labor, and government pensions. Most older adults continued to own cultivated land (mean 0.086 ha), growing staples (rice, corn, potatoes), and cash crops (chili peppers, polygonatum, coptis). Some also undertook part-time construction or agricultural work in nearby towns. The mean transfer payment per person was CNY 643.08, lower than farming income (CNY 764.44) and labor income (CNY 1549.31), but it remained the main source for disabled or semi-disabled older adults. In addition, a few received property income from land transfers (mean CNY 352.88 per person).
Table 4.
Descriptive statistics of characteristics of older adults.
4.2. Group Differences in Older Adults’ Poverty Vulnerability
As shown in Figure 3, Figure 4 and Figure 5, VEP, Exposure, Sensitivity, and Adaptability were calculated across different livelihood types, age groups, and residential patterns.
4.2.1. Difference in Poverty Vulnerability Among Older Adults with Different Income Structures
Figure 3a shows that the Is group has the highest poverty vulnerability, followed by the Ia group, whereas the Iw and Id groups have lower vulnerability. Figure 3c illustrates that the Is group is characterized by high sensitivity. The Is group primarily comprises highly vulnerable older adults, including widowed individuals and those with disabilities or chronic conditions. Declining physical capacity not only increases health risks but also reduces income due to limited labor capacity and low participation rates, thus amplifying economic risk and sensitivity. Moreover, impaired labor capacity severely limits this cohort’s access to land cultivation. Collectively, insufficient livelihood capital—especially natural and human capital—depresses adaptability. Therefore, the Is group exhibits systemic vulnerabilities that should be prioritized in strategies addressing “rural silver-haired poverty”.


Figure 3.
Heterogeneity among groups with different income structures: (a) vulnerability; (b) exposure; (c) sensitivity; (d) adaptability.
The Ia group faces elevated exposure due to the combined threats of natural disasters and market fluctuations. The Ia group predominantly relies on crop cultivation in mountainous and hilly areas, where farming remains poorly mechanized. In recent years, frequent natural disasters, such as extreme heatwaves, droughts, and pest infestations, have substantially reduced cash crop yields and livestock production []. Although China’s Rural Revitalization Strategy has stimulated rapid rural industrial development [] and increased market participation among older adults, deficiencies in technical expertise and management have left them vulnerable to financial losses. Approximately 78.26% of older adults in this group experienced crop losses from natural disasters, and 29.73% reported that disasters and market instability caused price drops and sales difficulties.
In contrast, the Iw and Id groups benefit from greater livelihood capital, enhancing their adaptability to external shocks. According to the data, 45.40% of Iw older adults have significant migrant work experience, possess specialized skills, and show a strong willingness to remain economically active. Some interviewees stated, “My health is still good, and I have no problem working. I know construction and often take on odd jobs”. Others added, “While we can still work, we seek to earn money to improve our lives and prepare for potential challenges in old age”. Thus, they embody the concept of being “retired but not idle”, working locally to accumulate physical and financial capital and enhance risk management capabilities. The Id group retains partial labor capacity and engages in diverse production and commercial activities. During agricultural downtime, 50.54% engage in informal work, such as greenhouse vegetable picking, farm labor assistance, or temporary work in fruit plantations, to earn daily income. Additionally, 9.10% of older adults in this group are self-employed, operating grocery stores or fruit stands. The engagement of older adults in diversified livelihoods and off-farm employment increases household income and expands social networks. Over time, these activities facilitate the accumulation of livelihood capital in the Iw and Id groups.
4.2.2. Difference in Poverty Vulnerability Among Older Adults of Different Ages
As shown in Figure 4a, the Am group has slightly higher poverty vulnerability than the Ay and Ao groups, primarily due to enhanced adaptability (Figure 4d). Data show that 50.19% of younger older adults engage in labor, such as poverty alleviation and handicraft workshops, vegetable and fruit picking bases, and public welfare positions, to obtain non-agricultural income. One older adult in Lengshui Township shared, “I work eight hours a day for 80 yuan picking Brasenia schlegelii for an employer at a nearby pond”. This group benefits from favorable age structure and health status, thereby enabling stronger labor participation. Their robust endowments in physical assets (e.g., fixed assets, housing), financial assets (e.g., income), and human capital (e.g., labor capacity) collectively buffer against external poverty shocks. In contrast, the Ao group faces higher exposure (Figure 4b), exceeding the sample mean by 12.69%. Since aging involves health deterioration and functional decline [], advanced age is associated with increased health risks. We found that 87.88% of the Ao group suffer from chronic conditions, indicating heightened exposure. In comparison, it falls to 85.60% for the Am group and 82.93% for the Ay group. These findings align with previous research on older adults’ health status [].

Figure 4.
Heterogeneity among groups with different ages: (a) vulnerability; (b) exposure; (c) sensitivity; (d) adaptability.
Notably, the Ao group has the lowest sensitivity (Figure 4c). Generally, the Ao group is more likely to receive care from their children due to advanced age. Many older adults report that “children offer to give money, buy food and clothes on festivals” and “whenever they come back to visit me, they don’t come empty-handed”. In other words, they benefit from stronger familial support networks and are more likely to receive both financial assistance and emotional support. Furthermore, national super-elderly subsidies have modestly enhanced their adaptability to poverty-related risks. Meanwhile, the Am group shows significant sensitivity (Figure 4c). This results from a higher old-age dependency ratio and prevalent solitary living arrangements, which together heighten demographic sensitivity. At the same time, economic fragility is exacerbated by limited capacity for agricultural or off-farm labor. In contrast, the Ay group benefits from strong labor participation and physical robustness, enabling diversified income through farming and migrant work.
4.2.3. Difference in Poverty Vulnerability Among Older Adults with Different Residential Patterns
As shown in Figure 5a, poverty vulnerability is higher among empty-nest older adults (Ra and Rc groups) than among non-empty-nest older adults (Rt and Rm groups). Compared with non-empty-nest older adults (Rt and Rm groups), empty-nest older adults (Ra and Rc groups) show higher sensitivity and lower adaptability (Figure 5c,d). The Rt and Rm groups have relatively lower poverty vulnerability (Figure 5a). This lower vulnerability stems from co-residence with children or grandchildren, which provides familial companionship that alleviates psychological issues, such as loneliness and depression []; facilitates sharing of social networks; and ensures better housing conditions. Collectively, these mechanisms mitigate risks and reduce poverty vulnerability. The Ra and Rc groups, who live apart from their children, have a high dependency ratio, rely heavily on government pensions, and have lower personal incomes. Their per capita income is CNY 1127.69, which is 31.55% lower than that of non-empty-nest older adults. This indicates a lower level of financial capital. Meanwhile, empty-nest older adults exhibit poorer health conditions []. Furthermore, empty-nest older adults may experience reduced familial social capital due to lack of companionship and mental health issues, such as depression or anxiety, which further impair their health []. Our survey found that 67.90% of empty-nest older adults reported comments such as, “My children are all busy and rarely visit; I don’t want to disturb them”, or “Few people come by, and I rarely go out unless necessary—I usually only interact with nearby neighbors”.

Figure 5.
Heterogeneity among groups with different residential patterns: (a) vulnerability; (b) exposure; (c) sensitivity; (d) adaptability.
Although both the Ra and Rc groups are empty-nest older adults, the Rc group exhibits higher poverty vulnerability than the Ra group. Most individuals in the Ra group benefit from the government’s minimum living allowance policy, covering 92.86% of them. Their vulnerability is primarily driven by health-related risks. Social isolation can exacerbate these risks through stress accumulation and delayed risk recognition [], which are linked to impaired cardiovascular function [], and cognitive decline []. In contrast, the Rc group is affected by both natural disasters and health issues, resulting in higher economic and environmental sensitivity. The survey shows that 86.49% of older couples are compelled to farm to support themselves financially. However, their agricultural activities are highly susceptible to natural disasters, with a reported incidence rate of 6.58%. Moreover, the intensity of agricultural labor adversely affects their health, increasing both medical risks and expenses. Data show that medical expenses for Rc older adults account for 77.21% of total expenditures—22.35% higher than those of the Ra group.
4.3. Spatial Differences in Older Adults’ Poverty Vulnerability
Based on the VEP results, we used the natural breaks method in ArcGIS to classify the poverty vulnerability index, exposure, sensitivity, and adaptability into five levels from high to low. We then generated a spatial distribution map of rural poverty vulnerability in Shizhu County, Chongqing (Figure 6). Figure 6a overlays the poverty vulnerability index on terrain features for visualization.
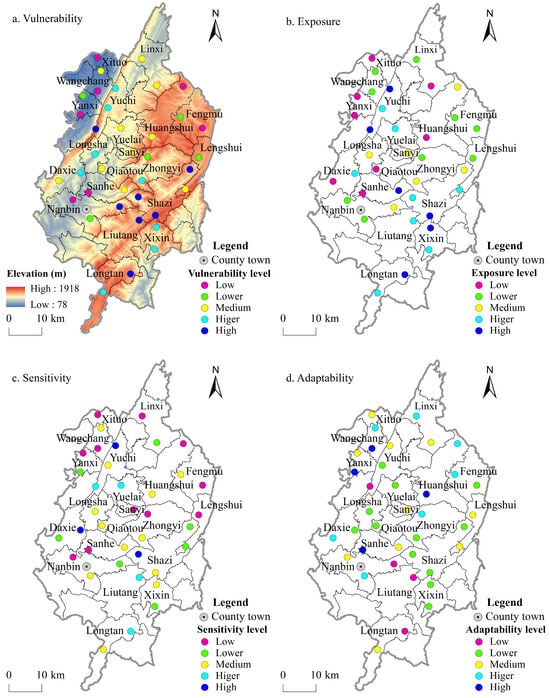
Figure 6.
Spatial distribution of poverty vulnerability, exposure, sensitivity, and adaptability of older adults in Shizhu County.
4.3.1. Poverty Vulnerability Exhibits Significant Spatial Heterogeneity and Links to Terrain Features
As shown in Figure 6a, poverty vulnerability in Shizhu County is generally moderate, with clear gradation and spatial differentiation. The county’s mean poverty vulnerability index is 0.305. Villages at low, lower, medium, higher, and high vulnerability levels represent 18.92%, 13.51%, 27.03%, 21.62%, and 18.92% of the sample, respectively. This distribution forms a “spindle-shaped” pattern, marked by low proportions at both extremes and high concentration in the middle. Spatially, poverty vulnerability follows a “high–low–high–low” pattern from southeast to northwest. Combined with Figure 2 and Figure 6, the spatial distribution of poverty vulnerability closely aligns with terrain features, highlighting significant regional disparities. Among the five zones, Zone V has the highest vulnerability, and Zone II ranks second. In contrast, Zones I, III, and IV show relatively low vulnerability, predominantly in the medium and below-medium categories. At the township level, Longtan, Liutang, Xixin, etc., have exclusively high and higher vulnerability levels. Townships such as Fengmu, Xituo, and Yanxi exhibit low or lower levels, while Linxi, Yuelai, Sanyi, etc., exhibit medium levels. Additionally, Zhongyi includes both lower and higher vulnerability levels, while Nanbin spans multiple levels.
4.3.2. Spatial Heterogeneity of Exposure Levels with High Exposure Concentrated in Low and Middle Mountain Areas
Figure 6b reveals substantial variation in exposure levels across Shizhu County’s townships. High and relatively high exposure levels are concentrated in Zones II and V (Figure 2 and Figure 5b). Zone II comprises Yuchi, while Zone V comprises Shazi and Liutang (Figure 2). These areas’ risks stem from natural environmental conditions. Yuchi lies on the southeastern slope of Fangdou Mountain, with an average elevation of 1121.97 m and an average slope of 15.00°. The complex geomorphology and frequent geological (e.g., landslides) and meteorological (e.g., flash floods) disasters substantially increase natural risk levels. Furthermore, southeastern mountain townships—such as Shazi and Liutang (Figure 6b)—feature steep terrain, limited arable land, insufficient irrigation, and frequent disasters (e.g., droughts, soil erosion) []. Infrastructure in these regions remains underdeveloped. The lack of public transportation hinders older adults from accessing daily necessities [], leading to nutritional deficiencies.
Moreover, the mountainous terrain creates excessively large service areas for healthcare facilities, forcing older adults to walk an average of 0.8 h to the nearest medical center. This geographic barrier significantly disrupts continuity of care for chronic patients []. They also face limited medical resources [] and inadequate healthcare services []. These factors impose major health burdens on older adults and increase their risk of illness-induced poverty. In contrast, stronger economic development in northwestern (e.g., Xituo, Yanxi), northeastern (e.g., Fengmu, Huangshui), and southwestern (e.g., Nanbin, Qiaotou) Shizhu has yielded higher per capita incomes. Additionally, improved transportation infrastructure and better access to healthcare facilities have reduced health risks, resulting in generally moderate or low exposure levels in these areas.
4.3.3. Significant Spatial Differentiation in Sensitivity and Localized High Sensitivity in Central and Western Regions
Figure 6c shows that most towns in Shizhu County have sensitivity levels at or below medium. Spatially, high sensitivity is concentrated in select areas of the central and western regions, especially in towns like Yuchi and Yuelai. Several southeastern towns, including Zhongyi, Shazi, and Longtan, have sensitivity at or above medium (Figure 6c). High-sensitivity towns are predominantly located in core and peripheral mountainous areas. These areas have limited arable land and rely on rainfed farming, making agriculture highly vulnerable to droughts and other natural disasters []. Limited disaster preparedness and weak emergency response exacerbate disaster impacts, underscoring environmental sensitivity. Meanwhile, economically underdeveloped villages lack employment opportunities [], driving young labor outmigration and significantly increasing the proportion of older adults left behind. In summary, these regions demonstrate heightened demographic and environmental sensitivity.
4.3.4. Adaptability Shows a Distinct “High–Low” Distribution Pattern Along the Northeast-Southwest Axis
Figure 6d illustrates a “three lows and three highs” spatial pattern in adaptability levels across Shizhu County. The “three highs” occur in the northwest, northeast, and southwest regions, where adaptability is predominantly medium or higher. The “three lows” refer to the county’s peripheral areas, southeastern region, and central-western region, where adaptability is mainly low or below average (Figure 6d). The reasons for this pattern are as follows: (1) Relatively flat terrain in the northwest facilitates mechanized agriculture and medium-scale farming. Consequently, agricultural commercialization and farm development are more advanced in this region. Additionally, towns such as Xituo and Yanci (Figure 6d) have developed thriving township industries. (2) In Huangshui Town in the northeast (Figure 2 and Figure 5d), the government’s promotion of forest tourism has revitalized communities and improved residents’ quality of life [,]. For example, younger older adults earn non-agricultural income by running farmhouse restaurants, selling goods, and taking temporary jobs in scenic areas. By engaging in tourism operations, older adults enhance social interactions, broaden their networks, and strengthen social capital. Furthermore, rural tourism revitalizes idle land, housing, and other resources through house renovation and landscape improvements. This not only improves living conditions and material capital but also increases household income through property rentals. (3) Nanbin, the county seat in the southwest (Figure 2), has a relatively active economy with abundant temporary job opportunities. This has attracted younger older adults from nearby towns such as Sanhe and Daxie to seek employment, promoting agricultural commercialization. These activities contribute to household livelihood capital accumulation and enhance overall adaptability.
4.4. Analysis of Influencing Factors of Adaptability of Older Adults
Table 5 presents the quantile regression results. We estimated models at the 0.25, 0.50, and 0.75 quantiles to examine trends in how selected variables affect older adults’ adaptability.
Table 5.
Regression results based on the quantile regression model.
4.4.1. Individual Attributes Influence the Accumulation of Material and Social Capital by Shaping Access to and Acquisition of Resources
Gender coefficients are positive and significant across all quantiles (p < 0.01). The MS coefficient is negative at the 0.25 quantile (p < 0.05). WE has positive coefficients at the 0.25 and 0.50 quantiles (p < 0.05; p < 0.01), while PS is significant only at the 0.25 quantile (p < 0.01) (Table 5). Potential explanations include the following:
(1) Compared with older men, rural older women more often perform agricultural or unpaid household labor. Their limited work experience reduces access to wage income. They thus have limited livelihood capital and remain self-reliant in production. Additionally, older women—especially those living alone—often have smaller social networks and lower family status [], hindering access to external support []. This situation increases life challenges and diminishes adaptability. (2) Married older adults exhibit higher adaptability than unmarried, divorced, or widowed counterparts []. This may reflect mutual care and companionship, which enhance subjective well-being among older adults. MS is not significant at the 0.50 and 0.75 quantiles, possibly because married individuals with higher adaptability dominate the sample. (3) Older adults with external work experience often accumulate substantial family assets [], maintain broader social networks, and leverage physical and social capital, thus enhancing adaptability compared to lifelong rural residents []. WE is not significant at the 0.75 quantile, possibly because highly adaptive older adults have diversified livelihoods, reducing reliance on external work. (4) Persistent negative psychological conditions may reduce adaptability among older adults. Such conditions may suppress economic initiative, hinder social network expansion, and impede social integration []. They may also weaken physical adaptability and increase illness risk. Notably, PS affects the 0.50 and 0.75 quantiles, though not significantly. This may be because older adults with moderate-to-high adaptability are more socially active and economically engaged, experiencing less loneliness and minimal impact on adaptability.
Considerable individual heterogeneity exists in rural older adults’ adaptability. Women, unmarried or inexperienced older adults, and those with poor psychological health exhibit lower adaptability and should be prioritized in future poverty alleviation efforts.
4.4.2. Intergenerational Support Network Plays an Active Role in Supporting Older Adults’ Well-Being
The ESFC coefficient is positive at the 0.25 and 0.50 quantiles (p < 0.01; p < 0.10) (Table 5). Possible explanations are as follows: Economic support from children provides essential sustenance for rural older adults and compensates for inadequate government subsidies. It also strengthens intergenerational ties and communication []. Survey respondents reported that their children supply food, clothing, healthcare items, and living expenses, especially during holidays such as the Spring Festival and birthdays. This support meets daily material needs [] and fosters feelings of being valued and loved, which are crucial for psychological well-being []. Consequently, older adults participate more in social and recreational activities [], enhancing their confidence in managing risks and fostering a positive outlook.
However, ESFC is not significant at the 0.75 quantile, possibly because highly adaptive older adults are more self-sufficient and economically independent, relying on stable incomes from re-employment or higher pensions.
4.4.3. Policy and System Building a Healthy Defense Line
NHI coefficients are positive across all quantiles (p < 0.01; p < 0.05) (Table 5), indicating that a greater number of health institutions enhances older adults’ adaptability. Our survey reveals that rural older adults generally exhibit a weak health consciousness and limited capacity to proactively manage illness. Many respondents reported that they “don’t go to the hospital unless the illness affects daily life”, or that they “visit village clinics for minor ailments and have never been to the county hospital due to the travel cost and fear of unnecessary medical expenses”. Such behaviors exacerbate health risks and contribute to a vicious cycle of illness and poverty. Township and village health centers improve the accessibility of medical services, reduce health-related risks, and play a vital role in alleviating poverty caused by illness []. A greater number of medical and health institutions in a region correlates with better healthcare accessibility, lower out-of-pocket expenses, and improved convenience, supporting timely treatment for minor illnesses and addressing the persistent issue of “difficulty accessing medical care” in rural areas []. Therefore, strengthening rural healthcare infrastructure and health security systems should be prioritized in future poverty alleviation efforts for older adults.
4.4.4. External Environment Has the Effects of “Historical Accumulation” and “Subsequent Development”
First, the LED coefficient is positive at the 0.50 and 0.75 quantiles (p < 0.01) (Table 5). This suggests that in economically developed areas, flexible job opportunities enable younger older adults to secure temporary work, boosting their income and well-being. Moreover, a stronger economy allows local governments to increase material support (e.g., grain, oil) and financial subsidies [] and to upgrade infrastructure, including clinics, community centers, and nursing homes. These measures improve older adults’ access to healthcare, exercise, and social activities, thereby enhancing their health.
Second, TA coefficients are positive across all quantiles (p < 0.05; p < 0.01) (Table 5), indicating that better transportation universally enhances older adults’ adaptability. Improved transportation enables older adults to travel for shopping, agricultural sales, social visits, and medical appointments []. It also enhances the flow of goods, labor, and information, helping younger older adults obtain employment.
Third, altitude coefficients are negative across all quantiles (p < 0.01) (Table 5), indicating that high-altitude areas challenge older adults’ adaptability. In these regions, limited arable land and low agricultural productivity hinder livelihood asset accumulation []. Additionally, land scarcity forced older men into labor-intensive, low-paid jobs during their prime, increasing their risk of chronic illness in later life. An older adult recalled: “In the 1990s, I went out to find work and ended up in a mine in Inner Mongolia. Every day, the dust would choke me, but I paid it no mind. Eventually, I developed emphysema, and now I can hardly work at all. All the hard labor in my youth has worn me out”. Moreover, public infrastructure in high-altitude areas remains underdeveloped, with poor connectivity and isolated socioeconomic conditions, further reducing older adults’ adaptability to risks.
4.5. Analysis of Older Adults’ Adaptation Choices
Faced with the onslaught of risk, and under dual pressures from aging and economic needs, older adults in rural China develop various adaptive methods—considering their labor capacity and livelihood assets—to alleviate economic hardship and mitigate poverty risk. This paper analyzed these adaptive strategies and identified the choices made by older adults. As shown in Figure 7, such strategies include optimizing agricultural planting structures, downscaling agricultural production, and engaging in informal or temporary employment, among others.
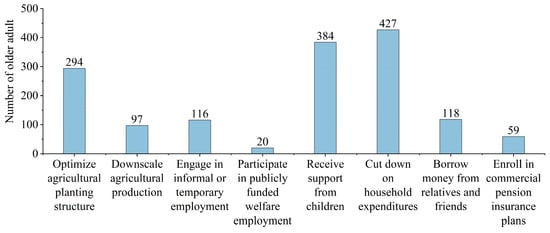
Figure 7.
The older adults’ adaptation choices.
Specifically, (1) with rural revitalization and industrial development in mountainous areas, the returns from cash crops have significantly surpassed those of traditional crops. Consequently, switching to cash crop cultivation has become a key adaptation strategy among older adults. In this study, 294 households adjusted their cropping structure, and 20.07% of older adults received training in cash crop cultivation. (2) Due to declining physical capacity, rising costs of traditional crop farming, and the expanding radius of cultivation, some older adults have adapted by reducing the scale of their farming activities. This was achieved either through land transfer or land abandonment, with 97 households in the study having reduced their farming scale. (3) The return of older migrant workers and the deterioration of the elderly labor force have made engaging in informal or odd jobs a vital adaptation strategy for some elderly individuals. In total, 116 older adults in this study reported participation in such jobs. (4) In the context of rural revitalization, the government has introduced public welfare positions, such as village sanitation, waste management, and health center assistance, which have become another form of adaptation for some older adults. In this study, 20 older adults were involved in public welfare work. (5) For older adults remaining in the village, taking care of themselves and even their grandchildren, while receiving sustained financial or emotional support from their children, has served as a buffer against external risks. (6) Other important adaptation strategies adopted by older adults include cutting down on household expenditures, borrowing money from relatives and friends, and enrolling in commercial pension insurance plans. These strategies were utilized by 75.84%, 20.96%, and 10.48% of the research sample, respectively.
5. Discussion
5.1. The Impact of Older Adults’ VEP on Built Environment
The labor capacity and social participation of older adults play a crucial role in optimizing the rural built environment. Older adults with a greater labor capacity who engage in non-agricultural work—such as agricultural product processing and handicraft production in the secondary sector, and homestay services in the tertiary sector—require support from the built environment, including accessible community public spaces, age-friendly production facilities, and digital service stations. This model encourages older adults’ participation in economic activities, which, in turn, drives the upgrading and renovation of community public facilities. Built environment interventions, such as equipping activity centers with digital devices and training spaces, can enhance older adults’ digital literacy, enabling them to utilize material and financial capital to hedge against risks more efficiently. These interventions contribute to promoting the rural built environment’s transition toward multifunctionality and inclusivity.
The “bell curve” of older adults’ vulnerability to poverty across age groups highlights the phased demand for age-friendly renovations in rural built environments. Middle-aged older adults are in a transitional stage marked by declining physical function and increased susceptibility to illness [], resulting in greater dependence on living spaces, medical facilities, and transportation networks for daily activities. On one hand, physical decline creates urgent needs for accessible home modifications (such as non-slip floors and handrails) and community healthcare centers, yet existing infrastructure often lacks such considerations. On the other hand, individuals who do not meet policy-defined thresholds for “old age” cannot access subsidies for aging-friendly facilities. Coupled with diminished work capacity, they are often unable to contribute to the maintenance of public infrastructure (such as road repairs and public space management). This mismatch between demand and supply creates functional gaps in the rural built environment. As primary users and informal maintainers of village public spaces, the declining capabilities of middle-aged and older adults directly accelerate the deterioration of these facilities. Furthermore, housing insecurity caused by climate fluctuation further constrains the sustainable renewal of rural environments.
The diversity of household residential structures influences patterns of intergenerational interaction, shaping the spatial logic of the rural built environment. Support networks formed by children living together with or near older adults reduce reliance on distant public services and encourage residential design trends toward intergenerational cohabitation models (e.g., independent suites and shared spaces). In contrast, the “willing but unable” dilemma faced by empty-nest older adults underscores the inadequacies of the existing built environment: the lack of intergenerational labor support makes it difficult for them to manage household maintenance (such as roof repairs and courtyard cleaning), leading to deteriorating living conditions. Additionally, limited access to agricultural training and market information reflects the insufficient reach of digital infrastructure in villages (e.g., community information displays and online service terminals). In such circumstances, older adults living alone are often forced to restrict their range of activities, exacerbating the idleness and functional decline of village public spaces. Therefore, a coordinated strategy to optimize intergenerational housing arrangements and improve community service infrastructure is essential to alleviating the constraints that poverty vulnerability imposes on the sustainability of rural built environments.
5.2. The Adaptation Patterns of Older Adults in Mountainous Areas
Based on our analysis of the factors influencing adaptation among older adults in mountainous areas and the choice of adaptation methods, we proposed four adaptation patterns for them to adapt.
- (1)
- Adaptation pattern 1: based on land-based livelihoods and agricultural structure adjustment (Figure 8)
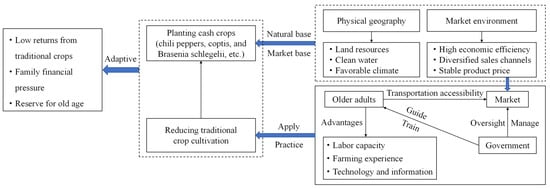 Figure 8. Adaptation pattern based on land-based livelihoods and agricultural structure adjustment.
Under government guidance, farmers have leveraged regional natural (e.g., land resources, water resources) and market advantages (e.g., high yields of cash crops, diversified sales channels) to adopt high-value cash crops as an adaptation pattern aimed at increasing income and strengthening their economic foundation. This pattern is suitable for the post-50s and 60s generations, who are among the most representative of Chinese farmers. They consider the countryside their permanent home, rely heavily on land for their livelihoods, and engage in traditional agriculture as their main occupation. They have abundant labor, rich planting experience, and channels for obtaining technology and information. Faced with limited returns from staple food crops (e.g., corn, sweet potatoes) and rising fixed expenditures (e.g., rising living expenses, increased medical costs), these older farmers and government agencies collaborate closely. The government guides farmers to leverage the abundant land resources and market opportunities in mountainous areas by organizing an average of eight cash-crop cultivation training sessions per township each year. With this support, over 50% of participating farmers have transformed their cropping systems, shifting from traditional staples (e.g., rice, corn, and sweet potatoes) to high-yield cash crops (e.g., chili peppers, coptis, and Brasenia schlegelii), thereby increasing the per-mu returns from approximately CNY 700 to over CNY 2000. This shift directly increases their agricultural income, improves their material capital, reduces the risk of falling into poverty [], alleviates the pressure of daily expenses, increases household savings, and provides an economic foundation for them to stabilize their rural roots and sustain agricultural production.
This model is illustrated by the example of a 68-year-old farmer we interviewed. He completed primary school and, together with his wife (both in good health), has engaged exclusively in village-based agriculture, never working outside. They possess extensive farming experience. During the interview, he was weeding his cornfield. Currently, 70% of his land is planted with citrus trees, with the remainder reserved for corn, following local government advice on citrus’s higher economic value. Citrus yields an output value of CNY 3000–4000 per mu, far exceeding corn’s approximate CNY 800 per mu. He also participates in government-provided free technical training on fertilization and pest management and has now mastered citrus cultivation techniques. A photograph captured during the interview with this farmer is presented in Appendix D, Figure A1.
- (2)
- Adaptation pattern 2: combining reduced farming scale and engagement in odd jobs (Figure 9)
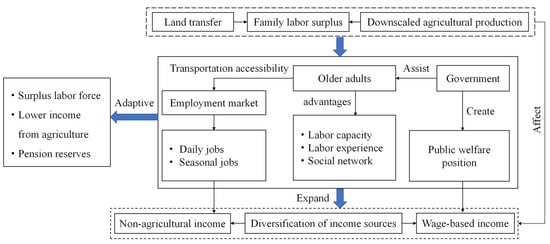 Figure 9. Adaptation pattern combining reduced farming scale and engagement in odd jobs.
This is an income-enhancing adaptation pattern in which farmers leverage their labor experience and social networks to undertake off-farm employment. This pattern is characterized by the transfer of labor, land, and government-supported employment opportunities and primarily applies to older adults who have given up the migrant work adaptation pattern due to physiological aging and decreased work capacity but who retain a certain degree of labor capacity and work experience. With the ongoing transfer of rural land and the decline in agricultural income, these older farmers have reduced their scale of cultivation or transferred their land entirely, gradually withdrawing from agricultural production [], receiving stable lease income of CNY 200–400 per mu during the transition. In rural areas, they still face some survival pressures (e.g., children’s education, housing construction, social interactions, etc.), but they have advantages such as good labor skills, rich social networks, and market information. Simultaneously, the government provides targeted job training and facilitates their placement in public service positions. Common employment includes village-based temporary positions (e.g., construction or catering) earning approximately CNY 100 per day, and part-time public service posts (e.g., rural cleaning) offering about CNY 6600 annually. These positions often offer relatively stable and higher remuneration, enabling older adults to enhance their financial and material resources, meet household expenses, and prepare for future retirement. Additionally, they form resilient social networks, based on kinship, geographic proximity, and shared occupations, to help buffer against external shocks and maintain or enhance sustainable adaptive capacity in the context of multiple security.
As a typical case, a 61-year-old male farmer who is in good health and has a junior high school education. His family owns 2.3 mu of land, which they have since leased to others. Three years ago, he and his wife sought work outside their hometown but lost their jobs due to age and returned home. Currently, he is employed at a township mushroom cultivation base, where he picks and harvests mushrooms. He earns CNY 3500 per month and works eight to nine months annually, using the remainder of the year for rest. His annual income is sufficient to cover his family’s living expenses. A photograph captured during the interview with this farmer is presented in Appendix D, Figure A1.
- (3)
- Adaptation pattern 3: livelihood diversification (Figure 10)
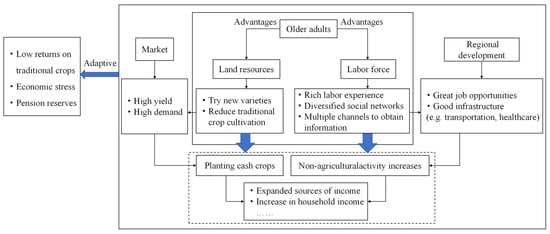 Figure 10. Livelihood diversification adaptation pattern.
Relying on their endowments and regional development opportunities, farmers have adopted a diversified income-generating adaptation pattern. This pattern emerged through precision poverty alleviation policies, rural industry modernization, and older adults’ proactive responses to environmental changes. It integrates traditional agricultural production with diversified non-farming activities and involves various actors, including older adults and the market. Building upon the use of land resources, older adults continue to engage in traditional crop cultivation while also adjusting their planting structure in pursuit of agricultural modernization. On the basis of securing their basic livelihood as the region develops, and drawing on their extensive labor and business experience, they participate in non-agricultural activities such as agricultural product processing, market sales, traditional construction work, and day labor. One farmer reported investing approximately 60% of his time in fieldwork and spending the remainder as a day laborer, boosting his annual income by at least CNY 4000. Through this dual engagement in farming and off-farm activities, older adults establish diversified income sources []. Under this adaptation pattern, older adults tend to exhibit higher levels of labor participation and maintain broader social networks, which support the accumulation of material and financial assets, reduce economic vulnerability through income diversification, improve household living standards, and provide a buffer against external risks.
A representative example is a 66-year-old woman who, at the time of our interview, had just finished picking strawberries at a local farm. She reported that each year from May to July, she works at the farm picking, managing, and cleaning strawberry greenhouses, earning CNY 80 per day. In addition, she and her husband cultivate three mu of land, primarily growing chili peppers. Her husband manages on-farm tasks (e.g., weeding, irrigation, and harvesting), while the production yields approximately CNY 5000 in annual income, which is sufficient to sustain their family’s basic needs. A photograph captured during the interview with this farmer is presented in Appendix D, Figure A1.
- (4)
- Adaptation pattern 4: based on reduced consumption and external support (Figure 11)
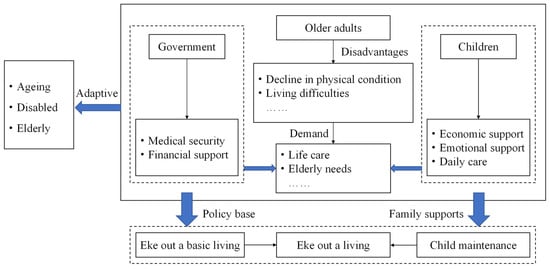 Figure 11. Adaptation pattern based on reduced consumption and external support.
This adaptation pattern is a safety-net strategy that upholds older adults’ basic livelihoods through coordinated government assistance and children’s support. This pattern relies primarily on external assistance from the government, children, and other sources and involves key actors such as social security institutions, older adults, and their children. It applies mainly to individuals who were formerly engaged in traditional agriculture but can no longer do so because of declining physical strength, diminished labor capacity and participation, or illness—particularly the very elderly as well as widowed older adults. Faced with pressures such as daily expenses, low savings levels, and rising medical costs, these older adults depend largely on government-provided social protection policies, including basic medical security, basic rural pension insurance and a monthly minimum subsistence allowance of CNY 610. In addition to institutional support, their children can provide economic and emotional support and daily care, forming a complementary system of family-based assistance. Over 90% of this group’s basic living expenses are covered by the combined contributions of government programs and family support. This dual support structure helps maintain a sustainable basic standard of living and mitigates the impact of external risks for this highly vulnerable group.
For instance, an 83-year-old man living alone is in poor health. Due to long-term illness, he has lost his ability to work and can no longer engage in manual labor or farming. His primary income now comes from government relief, totaling CNY 770 per month. The local government has also assisted him in obtaining medical aid and major illness subsidies to reduce healthcare expenses. He has only one child who works away from home, and he sends him approximately CNY 4000 per year to support his living expenses. A photograph captured during the interview with this farmer is presented in Appendix D, Figure A1.
In addition, adaptation is a long-term, dynamic process in which various strategies are not static or fixed. When the core advantages underpinning a given pattern gradually deteriorate, whether through external competition or internal weaknesses, transitions between patterns are driven (Figure 12).
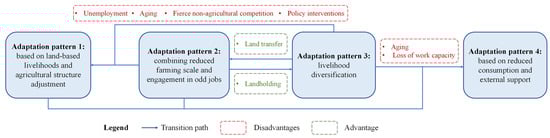
Figure 12.
Transition paths and evolutionary causes of adaptation patterns.
Specifically, (1) in patterns 2 and 3, if farmers lose non-agricultural employment advantages and, in combination with age-related declines in physical capacity or incentives from agricultural support policies, they revert to pattern 1 and return to field-based work. (2) The choice between pattern 2 and pattern 3 hinges on the comparative value of land transfer versus land cultivation: transferring land generates stable rental income as a livelihood base, whereas retaining land underpins a diversified livelihood safety net. (3) Regardless of whether elderly farmers operate under pattern 1, pattern 2, or pattern 3, the intensification of aging and the associated loss of labor capacity ultimately erode all livelihood advantages, unavoidably compelling a shift to pattern 4, characterized by expenditure compression and reliance on external assistance.
5.3. Comparative Analysis with Existing Research Results
Consistent with prior research, this study highlights differences in poverty vulnerability among older adult groups and confirms key factors influencing their adaptability. (1) Agricultural-dominated and subsidy-dependent older adults exhibit relatively high poverty vulnerability, consistent with earlier findings [,]. Due to fragile agricultural livelihoods and limited income-generating capacity, they exhibit heightened sensitivity and should be prioritized for dynamic monitoring and targeted assistance. (2) VEP is not strictly positively correlated with age. We found that middle-old older adults exhibit slightly higher poverty vulnerability than the old-old, contrasting with the Organization for Economic Co-operation and Development (OECD) [] and Pal et al. [] but aligning with Tomaszewski []. This discrepancy may arise because surveying by household obscures individual deprivation among older adults, masking poverty differences and introducing measurement bias. (3) Xin et al. [] found that older adults living alone are more vulnerable to poverty than couples, a finding that differs from our results. This discrepancy may reflect that older adults living alone often remain independent due to strong self-care abilities. They can perform daily tasks such as shopping, cooking, and cleaning independently and require less frequent assistance from children. Although older couples support each other, illness in one partner forces the other to allocate time and energy for care, reducing household income, increasing sensitivity, and potentially leading to poverty []. (4) Compared with financial support, living support from children does not significantly affect older adults’ adaptability. If children devote more time to caregiving, their income-earning opportunities may decrease, reducing financial support for older adults []. This may also lead to intergenerational conflicts, harming older adults’ psychological well-being, as Zhu’s study on life satisfaction indicates []. (5) While the adaptation patterns identified in this study share commonalities across countries, they also exhibit differences. In India, older farmers typically practice traditional mixed cropping and pursue off-farm employment during the April–May offseason to diversify income and mitigate poverty risk []. In contrast, older farmers in Thailand combine crop restructuring with labor-substitution technologies (e.g., small-scale harvesters) to address an aging workforce []. This difference is due to both the constraints on mechanization imposed by land fragmentation in Shizhu County and Thailand’s policy emphasis on providing older farmers with low-cost machinery rental services.
5.4. Policy and Practical Implication of Mountainous Rural Development
To address rural older adults’ vulnerability to poverty, we identified both group-level and spatial heterogeneity in their poverty risks. Accordingly, we propose establishing a precise poverty-identification system and a dynamic monitoring framework, coupled with differentiated, tiered, and targeted policy measures. In particular, support should prioritize vulnerable subgroups, such as those whose primary income derives from transfer payments or agricultural production, middle-aged and elderly cohorts, and individuals living alone. In addition, given the acute health challenges in mountainous rural areas, where aging populations are growing, disease incidence among older adults is high, and medical demand is unprecedented, medical and health resources must be further expanded. We recommend upgrading grassroots health service quality, building an integrated urban–rural healthcare system, and strengthening the training of frontline health personnel. Moreover, rural medical insurance schemes should be reinforced, with enhanced coverage and subsidies for elderly individuals living alone and those in remote locations, thereby consolidating gains in health-related poverty alleviation.
Additionally, our study examines the adaptive capacity of rural older adults by identifying key influencing factors and delineating their adaptation patterns. First, income diversification should be promoted to fully harness labor capacity: this includes expanding employment opportunities for temporary and part-time workers through the development of rural industries and enterprise investment, as well as implementing food-for-work and public welfare programs to support semi-vulnerable elderly laborers. Targeted skills training can further enhance their market competitiveness and diversify wage-earning sources. Second, older adults’ roles in local industry should be strengthened by improving rural industrial information systems and expanding access to agricultural technology, market forecasting, and planning services, thereby optimizing their livelihood capital and mitigating production risks. Last but not least, social and informal support networks must be reinforced, an informal security framework for younger-old cohorts should be established with active involvement from adult children, and grassroots community services should be enhanced to address mental-health needs and reduce social isolation among older adults.
Finally, to integrate smart infrastructure with age-friendly strategies in mountainous rural environments, we examined how farm household poverty vulnerability influences the built environment. We recommend that the government incorporate aging-friendly renovations into mandatory rural planning standards by implementing basic modifications such as non-slip flooring and handrail installations in rural residences, alongside providing targeted subsidies. Concurrently, barrier-free public service facilities can be developed in alignment with the “15 min living circle” concept to reduce the daily living and service access costs for older adults. At the intergenerational housing level, the government can promote “neighborhood co-living” spatial models by guiding homestead planning to ensure that the residences of children and elderly parents are located in close proximity. Additionally, idle farmhouses can be repurposed into mutual care centers to strengthen the spatial foundation of family-based support networks. Furthermore, “light-duty workshops” equipped with age-friendly facilities and digital service terminals can be established, incorporating adaptive designs such as field rest pavilions and residential-adjacent farmland to reduce the physical barriers and risks for older adults engaging in part-time work. In addition, environmental maintenance teams composed of younger elderly individuals can be formed, enabling them to earn labor income through participation in public space management. This approach not only activates social participation but also establishes a sustainable maintenance mechanism for village environments. Collectively, these policies aim to transform the rural built environment into a “capacity-enhancing” support platform, systematically optimizing the rural infrastructure to enhance older adults’ adaptability and alleviate their vulnerability to poverty.
6. Conclusions
This study develops an analytical framework and measurement index system for rural older adults’ poverty vulnerability—based on exposure, sensitivity, and adaptability—and employs quantile regression to identify factors affecting their adaptability.
- (1)
- The framework integrates the VSD vulnerability assessment with the SLA, accounting for older adults’ living environments and embedding policy and institutional factors into livelihood capital within China’s poverty reduction context. This approach enables quantitative assessment of older adult poverty—beyond static poverty lines—and helps identify at-risk populations and areas to guide targeted interventions.
- (2)
- Poverty vulnerability among older adults exhibits group and spatial heterogeneity. Group-wise, subsidy-dependent, middle-old, and empty-nest older adults have higher vulnerability due to elevated exposure, sensitivity, and limited adaptability, requiring focused efforts to combat “rural silver-haired poverty”. Spatially, mountainous regions, with poorer resource endowments, infrastructure, and services, limit livelihood capital and risk-coping ability, leading to higher vulnerability. Hence, these areas warrant priority resource allocation to alleviate older adult poverty.
- (3)
- Adaptability among older adults is shaped by micro- and macro-level factors. Endogenous factors include gender, marital status, and daily psychological health; exogenous factors comprise healthcare institution density, transport accessibility, and altitude. Work experience and children’s financial support significantly enhance adaptability at lower and median quantiles, while regional economic development boosts it at median and upper quantiles. These above factors provide an important perspective for the selection of adaptation choices for older adults, which include optimizing agricultural planting structure, downscaling agricultural production, and engaging in informal or temporary employment, etc.
- (4)
- The labor capacity, age, and family residential structures of older adults not only affect their vulnerability to poverty but also have implications for the rural built environment. In the future, older adults can adopt four adaptation patterns: land-based livelihood and agricultural structure adjustment, combining reduced farming scale and engagement in odd jobs, livelihood diversification adaptation, and reduced consumption and external support. These patterns leverage the personal strengths and environmental resources of older adults to enhance their resilience and reduce their vulnerability to poverty in a sustainable manner.
Although this study makes important contributions, it has several limitations. First, using village-level point data to represent township units and inputting missing values with township averages may have introduced bias. Collecting detailed data on older farmers at the village level to analyze VEP heterogeneity and its determinants would improve accuracy. Second, given China’s vast territory, poverty vulnerability among older adults may vary regionally and temporally; however, this study’s temporal and spatial scope is limited, relying on cross-sectional data from a single year. Consequently, the results may be influenced by contemporaneous social and systemic changes, highlighting the need for dynamic, longitudinal studies. Third, although gender was included as an independent variable, this study neither accounted for biological differences between sexes nor sufficiently analyzed gender disparities in poverty vulnerability trajectories. Additionally, income data may be under-reported or distorted due to multiple income sources, privacy concerns, and cognitive limitations. Similarly, psychological variables may deviate from actual conditions because of difficulties in quantifying subjective experiences, inconsistent understanding of terminology, and social desirability bias.
To address these limitations and enhance the study, future work will (1) develop a comprehensive, universal VEP evaluation index system integrating economic, health, social support, and environmental vulnerability dimensions using longitudinal village-level data and multi-source spatial datasets; and (2) examine interactive drivers of VEP evolution through dynamic modeling (e.g., system dynamics), machine learning (e.g., random forests), and spatiotemporal analysis to uncover nonlinear factor interactions and regional–temporal heterogeneity.
Author Contributions
Conceptualization, K.C. and Q.L.; methodology, Q.L. and X.Y.; software, K.C. and Y.L.; validation, K.C., Y.L. and Q.L.; formal analysis, Q.L. and X.Y.; investigation, K.C., Y.L. and Q.L.; resources, Q.L. and J.S.; data curation, K.C. and Y.L.; writing—original draft preparation, K.C.; writing—review and editing, K.C., Y.L., Q.L. and J.S.; visualization, K.C.; supervision, Q.L., J.S. and X.Y.; funding acquisition, Q.L. All authors have read and agreed to the published version of the manuscript.
Funding
This research was funded by National Natural Science Foundation of China, No. 42301243; Youth Foundation of Humanities and Social Sciences of Ministry of Education of China, No. 23YJCZH135; Education Commission Science and Technology Foundation of Chongqing, No. KJQN202300501; General Project of Chongqing Natural Science Foundation, No. CSTB2024NSCQ-MSX1272.
Data Availability Statement
The data presented in this study are available on request from the corresponding author.
Conflicts of Interest
The authors declare no conflicts of interest.
Appendix A
Data were normalized to a 0–1 range using Equations (A1) and (A2).
For positive vector,
and for negative vector,
where index is a standardized value of an indicator of older adults; is the actual value of the same indicator; and and are the maximum and minimum values of the same indicator, respectively.
FAHP was applied to determine indicator weights for exposure, sensitivity, and adaptability. Taking exposure as an example, the process consisted of four steps:
(1) Construct a fuzzy evaluation matrix: Experts (Table A1) evaluated the exposure indicators using a 1–9 scale, and a fuzzy judgment matrix was constructed accordingly. Consistency tests (consistency ratio < 0.1) were then performed on each judgment matrix:
In the formula, is a triangular fuzzy number that reflects the relative importance between any two indicators; and , , and , respectively, indicate the minimum, middle, and maximum possible relative importance between any two indicators.
Table A1.
List of expert group members.
Table A1.
List of expert group members.
| Expert Number | Title | Research Field |
|---|---|---|
| E1 | Professor | Rural socioecological systems |
| E2 | Associate professor | Mountainous environments and adaptive development |
| E3 | Research professor | Social work, social policy, and population |
| E4 | Professor | Rural ecology and resource economics |
| E5 | Research professor | Welfare economy, social security, and aging society issues |
| E6 | Government adviser | Poverty issues, development finance, and rural development |
| E7 | Associate professor | Elderly health and social security |
| E8 | Professor | Accessibility and age-friendly design planning |
| E9 | Associate professor | Regional sustainability and the sustainability of farmers’ livelihoods |
(2) Calculate the fuzzy weights: The matrix was normalized row by row to compute the fuzzy weight vector for each indicator . The calculation formula is as follows:
(3) Defuzzify the component-level weights: The possible degree calculation method was employed to convert the fuzzy weights from vectors to conventional numerical values. If and are triangular fuzzy numbers, the formula for calculating the possible degree of is as follows:
According to formula (A6), we can obtain the sorting vector and normalize it to obtain the component-level weights .
(4) Defuzzify the indicator-level weights: Repeat the aforementioned process for the indicators layer to obtain the normalized weights for the indicators and use formula (8) to obtain the final weights for the indicators layer (Table 1).
In the formula, and represent the number of indicators in the component layer and the indicators layer, respectively.
Appendix B
The formulas for calculating the exposure index, sensitivity index, and adaptability index are as follows:
In the formula, represents the exposure index; represents the sensitivity index; and represents the adaptability index.
Appendix C
Suppose the probability distribution of a random variable Y is as follows:
The quantile of is defined as the minimum value that satisfies , i.e.,
The quantile of is derived by minimizing the objective function with respect to , i.e.,
In the formula, represents the value of that minimizes the quadratic function.
Appendix D

Figure A1.
From left to right: farmers surveyed in adaptation patterns 1, 2, 3, and 4. The above pictures were all taken by members of the project team in Shizhu County in July 2024.
References
- World Bank Open Data. Available online: https://data.worldbank.org (accessed on 13 July 2025).
- Poverty and Shared Prosperity 2020. Available online: https://www.worldbank.org/en/publication/poverty-and-shared-prosperity-2020 (accessed on 13 July 2025).
- Guillemot, J.R.; Zhang, X.; Warner, M.E. Population Aging and Decline Will Happen Sooner Than We Think. Soc. Sci. 2024, 13, 190. [Google Scholar] [CrossRef]
- Muis, I.; Agustang, A.; Adam, A. Elderly Poverty: Social Demographic, Work Distribution, Problem Health & Social Protection. Asian J. Soc. Sci. Humanit. 2020, 9, 40–48. [Google Scholar]
- Dhemba, J.J. Dynamics of Poverty in Old Age: The Case of Older Persons in Zimbabwe. Int. Soc. Work 2014, 57, 714–722. [Google Scholar] [CrossRef]
- OECD. Pensions at a Glance 2019: OECD and G20 Indicators; OECD Pensions at a Glance; OECD: Paris, France, 2019; ISBN 978-92-64-78791-9. [Google Scholar]
- 2020 National Aging Development Bulletin. Available online: http://www.nhc.gov.cn/lljks/pqt/202110/c794a6b1a2084964a7ef45f69bef5423.shtml (accessed on 13 July 2025).
- Gong, J.; Wang, G.; Wang, Y.; Zhao, Y. Consumption and Poverty of Older Chinese: 2011–2020. J. Econ. Ageing 2022, 23, 100410. [Google Scholar] [CrossRef]
- Ma, Y.; Xiang, Q.; Yan, C.; Liao, H.; Wang, J. Poverty Vulnerability and Health Risk Action Path of Families of Rural Elderly with Chronic Diseases: Empirical Analysis of 1,852 Families in Central and Western China. Front. Public Health 2022, 10, 776901. [Google Scholar] [CrossRef]
- Vu, L.H.; Nguyen, T.A. Elderly Poverty in Vietnam: Trends and Determinants. J. Popul. Soc. Stud. 2021, 29, 526–543. [Google Scholar] [CrossRef]
- Zou, B.; Mishra, A.K.; Luo, B. Aging Population, Farm Succession, and Farmland Usage: Evidence from Rural China. Land Use Policy 2018, 77, 437–445. [Google Scholar] [CrossRef]
- Li, T.; Lu, H.; Luo, Q.; Li, G.; Gao, M. The Impact of Rural Population Aging on Agricultural Cropping Structure: Evidence from China’s Provinces. Agriculture 2024, 14, 586. [Google Scholar] [CrossRef]
- Ren, C.; Zhou, X.; Wang, C.; Guo, Y.; Diao, Y.; Shen, S.; Reis, S.; Li, W.; Xu, J.; Gu, B. Ageing Threatens Sustainability of Smallholder Farming in China. Nature 2023, 616, 96–103. [Google Scholar] [CrossRef]
- Liu, Q.; Zhou, J.; Lei, Y.; Chen, J.; Yu, Z.; Yang, X. Evaluation and Formation Mechanism of Elder Adults’ Development Resilience under the Disturbance of Relative Poverty Risk in Shizhu County, Chongqing. Acta Geogr. Sin. 2025, 80, 236–256. [Google Scholar] [CrossRef]
- Ye, W.; Wang, Y.; Yang, X.; Wu, K. Understanding Sustainable Livelihoods with a Framework Linking Livelihood Vulnerability and Resilience in the Semiarid Loess Plateau of China. Land 2022, 11, 1500. [Google Scholar] [CrossRef]
- Dercon, S. Assessing Vulnerability; Oxford University: Oxford, UK, 2001; Available online: https://www.researchgate.net/publication/228378379_Assessing_Vulnerability (accessed on 11 August 2025).
- Zeng, T.; Zhao, Y.; Yang, Y.; He, R. Spatial-Temporal Pattern of the Vulnerability and Gender Coordination Development Characteristics of the Elderly in China Based on the Policy Framework of Active Aging. Geogr. Sci. 2019, 39, 1910–1918. [Google Scholar] [CrossRef]
- Durant, T.J. The Utility of Vulnerability and Social Capital Theories in Studying the Impact of Hurricane Katrina on the Elderly. J. Fam. Issues 2011, 32, 1285–1302. [Google Scholar] [CrossRef]
- Key, W.; Culliney, M. The Oldest Old and the Risk of Social Exclusion. Soc. Policy Soc. 2018, 17, 47–63. [Google Scholar] [CrossRef]
- Wang, Z.; Yang, M.; Zhang, Z.; Li, Y.; Wen, C. The Impact of Land Transfer on Vulnerability as Expected Poverty in the Perspective of Farm Household Heterogeneity: An Empirical Study Based on 4608 Farm Households in China. Land 2022, 11, 1995. [Google Scholar] [CrossRef]
- Rissanen, S.; Ylinen, S. Elderly Poverty: Risks and Experiences—A Literarature Review. Nord. Soc. Work Res. 2014, 4, 144–157. [Google Scholar] [CrossRef]
- Jones, R.S.; Urasawa, S. Reducing the High Rate of Poverty Among the Elderly in Korea; OECD Economics Department Working Papers; OECD Publishing: Paris, France, 2014. [Google Scholar]
- Ravallion, M.; Chen, S. Measuring Pro-Poor Growth. Econ. Lett. 2003, 78, 93–99. [Google Scholar] [CrossRef]
- Ding, S. Vulnerability to Poverty in Chinese Households with Elderly Members: 2013–2018. Sustainability 2023, 15, 4947. [Google Scholar] [CrossRef]
- Chen, J.; Rong, S.; Song, M. Poverty Vulnerability and Poverty Causes in Rural China. Soc. Indic. Res. 2021, 153, 65–91. [Google Scholar] [CrossRef]
- Jing, Z.; Li, J.; Gao, T.; Wang, Y.; Chen, Z.; Zhou, C. Identifying Vulnerability to Poverty and Its Determinants among Older Adults in Empty-Nest Households: An Empirical Analysis from Rural Shandong Province, China. Health Policy Plan. 2022, 37, 849–857. [Google Scholar] [CrossRef]
- Yue, A.; Mao, C.; Chen, L.; Liu, Z.; Zhang, C.; Li, Z. Detecting Changes in Perceptions towards Smart City on Chinese Social Media: A Text Mining and Sentiment Analysis. Buildings 2022, 12, 1182. [Google Scholar] [CrossRef]
- Zhao, W.; Liang, Z.; Li, B. Realizing a Rural Sustainable Development through a Digital Village Construction: Experiences from China. Sustainability 2022, 14, 14199. [Google Scholar] [CrossRef]
- Ming, Y.; Li, Y.; Liu, Y. Digital Technologies as Solutions to China’s Aging Population: A Systematic Review of Their Opportunities and Challenges in Rural Development. Front. Public Health 2025, 12, 1416968. [Google Scholar] [CrossRef]
- Colding, J.; Nilsson, C.; Sjöberg, S. Smart Cities for All? Bridging Digital Divides for Socially Sustainable and Inclusive Cities. Smart Cities 2024, 7, 1044–1059. [Google Scholar] [CrossRef]
- Chambers, R. Vulnerability, Coping and Policy (Editorial Introduction). IDS Bull. 2006, 37, 33–40. [Google Scholar] [CrossRef]
- Malak, M.A.; Sajib, A.M.; Quader, M.A.; Anjum, H. “We Are Feeling Older than Our Age”: Vulnerability and Adaptive Strategies of Aging People to Cyclones in Coastal Bangladesh. Int. J. Disaster Risk Reduct. 2020, 48, 101595. [Google Scholar] [CrossRef]
- Lu, X.; Wang, Q.; Wang, Y. Can Farmland Transfer Reduce Vulnerability to Poverty among the Mid-Aged and Elderly in Rural China? Heliyon 2023, 9, e21970. [Google Scholar] [CrossRef]
- Yuan, S. Governance of Relative Poverty in Rural Elderly in the Post-Poverty Era: Theoretical Construction and Practical Exploration. Theory J. 2023, 306, 142–149. [Google Scholar] [CrossRef]
- Wang, W.; Luo, X.; Zhang, C.; Song, J.; Xu, D. Can Land Transfer Alleviate the Poverty of the Elderly? Evidence from Rural China. Int. J. Environ. Res. Public Health 2021, 18, 11288. [Google Scholar] [CrossRef]
- Khan, N.; Khan, S.; Tan, O.; Tan, B.C.; Vergara, R. Explore the Factors That Influence Elderly Poverty. J. Southeast Asian Res. 2017, 2017, 938459. [Google Scholar] [CrossRef][Green Version]
- Zhang, Y.; Chen, J. Anti-Poverty Strategies from Perspective of Farmers’ Livelihood Vulnerability. J. South China Agric. Univ. (Soc. Sci. Ed.) 2022, 21, 86–99. [Google Scholar] [CrossRef]
- Liu, Q.; Jiang, J.; Yang, X.; Zhang, J.; Yang, X. Poverty vulnerability measurement and its impact factors of farmers: Based on the empirical analysis in Qinba Mountains. Geogr. Res. 2022, 41, 307–324. [Google Scholar] [CrossRef]
- Angeon, V.; Bates, S. Reviewing Composite Vulnerability and Resilience Indexes: A Sustainable Approach and Application. World Dev. 2015, 72, 140–162. [Google Scholar] [CrossRef]
- Runge, M. Diagnosis of the Risk of Accidental Falls in the Elderly. Ther. Umsch. 2002, 59, 351–358. [Google Scholar] [CrossRef]
- Zhu, M. Living with Offspring Surely Brings Happiness to the Elderly?—The Heterogeneity in the Effect of Living Arrangements on the Life Satisfaction of the Chinese Elderly. Procedia Comput. Sci. 2022, 214, 359–366. [Google Scholar] [CrossRef]
- SHIZHU STATISTICALYEARBOOK 2022. Available online: http://cqszx.gov.cn/bm/xtjj/zwgk_66741/jczwgk_20230406p/tjlyjczwgk/tjsj_20230460po/tjxx/tjnj/202210/t20221024_11218872.html (accessed on 11 August 2025).
- Chen, J.; Yang, X.; Yin, S.; Wu, K.; Deng, M.; Wen, X. The Vulnerability Evolution and Simulation of Social-Ecological Systems in a Semi-Arid Area: A Case Study of Yulin City, China. J. Geogr. Sci. 2018, 28, 152–174. [Google Scholar] [CrossRef]
- Xiaojun, H.; Chen, W.; Kaili, H.U. Multi-Scale Assessment of Social Vulnerability to Rapid Urban Expansion in Urban Fringe: A Case Study of Xi’an. Acta Geogr. Sin. 2018, 73, 1002–1017. [Google Scholar] [CrossRef]
- Orlická, E. Impact of Population Ageing and Elderly Poverty on Macroeconomic Aggregates. Procedia Econ. Finance 2015, 30, 598–605. [Google Scholar] [CrossRef]
- Wang, L.; Chen, W.; Haung, G.; Wang, T.; Wang, Q.; Su, X.; Ren, Z.; Chotamonsak, C.; Limsakul, A.; Torsri, K. Characteristics of Super Drought in Southwest China and the Associated Compounding Effect of Multiscalar Anomalies. Sci. China Earth Sci. 2024, 67, 2084–2102. [Google Scholar] [CrossRef]
- You, L.; Zhou, H.; Zhu, J.; Chen, C.; Wang, J. Involution and Evolution of the Flower Industry and Their Implications for Rural Revitalization: A Case Study of Tonghai County, Yunnan Province, China. Habitat Int. 2025, 159, 103336. [Google Scholar] [CrossRef]
- Zhang, K.; Liu, Y.; Hu, H. Multidimensional Poverty and Disability of Older Adults in China: Will Long-Term Care Insurance Make a Difference? Appl. Res. Qual. Life 2024, 19, 3439–3462. [Google Scholar] [CrossRef]
- Song, Q. Facing “Double Jeopardy”? Depressive Symptoms in Left-Behind Elderly in Rural China. J. Aging Health 2017, 29, 1182–1213. [Google Scholar] [CrossRef]
- Zhu, H.; He, L.; Peng, J.; Li, X.; Gao, B.; Zhou, H.; Wan, Y. Community Social Capital and the Health-Related Quality of Life among Empty-Nest Elderly in Western China: Moderating Effect of Living Arrangements. BMC Psychiatry 2022, 22, 685. [Google Scholar] [CrossRef]
- He, W.; Jiang, L.; Ge, X.; Ye, J.; Yang, N.; Li, M.; Wang, M.; Han, X. Quality of Life of Empty-Nest Elderly in China: A Systematic Review and Meta-Analysis. Psychol. Health Med. 2020, 25, 131–147. [Google Scholar] [CrossRef] [PubMed]
- Bu, F.; Abell, J.; Zaninotto, P.; Fancourt, D. A Longitudinal Analysis of Loneliness, Social Isolation and Falls amongst Older People in England. Sci. Rep. 2020, 10, 20064. [Google Scholar] [CrossRef]
- Shankar, A.; McMunn, A.; Banks, J.; Steptoe, A. Loneliness, Social Isolation, and Behavioral and Biological Health Indicators in Older Adults. Health Psychol. 2011, 30, 377–385. [Google Scholar] [CrossRef]
- Shankar, A.; Hamer, M.; McMunn, A.; Steptoe, A. Social Isolation and Loneliness: Relationships with Cognitive Function During 4 Years of Follow-up in the English Longitudinal Study of Ageing. Psychosom. Med. 2013, 75, 161–170. [Google Scholar] [CrossRef]
- Gu, J. Determinants of Public Transportation Disability among Older Adults in China. Transp. Policy 2024, 150, 71–79. [Google Scholar] [CrossRef]
- Li, C.; Wang, P. Study on the Impact of Medical Service Accessibility on the Treatment of Chronic Diseases in the Elderly. Chin. Health Serv. Manag. 2020, 37, 592-595+610. Available online: https://kns.cnki.net/kcms2/article/abstract?v=rGdVK2OACddbNwnVQPwxkpB_d0qDc_SKmZtAZ7SmPQrVDKgrHRqayg-D1WgY4pBzoNR3UeR-KlxoL8jcV3s772hhbwGoe2cHxUeGEHf4ISA_YpOBAH_bBnlvEUDVlmsrEvV_tRJycEJEH3bCgnpWkeCBUyWVpPIBMHVDjv0xDI6eqULLrLtNbw==&uniplatform=NZKPT&language=CHS (accessed on 11 August 2025).
- Fe, E.; Powell-Jackson, T.; Yip, W. Doctor Competence and the Demand for Healthcare: Evidence from Rural China. Health Econ. 2017, 26, 1177–1190. [Google Scholar] [CrossRef]
- Shi, L.; Zhang, D. China’s New Rural Cooperative Medical Scheme and Underutilization of Medical Care Among Adults Over 45: Evidence from CHARLS Pilot Data. J. Rural Health 2013, 29, S51–S61. [Google Scholar] [CrossRef]
- Yang, Y.; Guo, H.; Chen, L.; Liu, X.; Gu, M.; Pan, W. Multiattribute Decision Making for the Assessment of Disaster Resilience in the Three Gorges Reservoir Area. Ecol. Soc. 2020, 25, 5. [Google Scholar] [CrossRef]
- Xu, D.; Peng, L.; Liu, S.; Su, C.; Wang, X.; Chen, T. Influences of Migrant Work Income on the Poverty Vulnerability Disaster Threatened Area: A Case Study of the Three Gorges Reservoir Area, China. Int. J. Disaster Risk Reduct. 2017, 22, 62–70. [Google Scholar] [CrossRef]
- Bi, G.; Yang, Q. The Spatial Production of Rural Settlements as Rural Homestays in the Context of Rural Revitalization: Evidence from a Rural Tourism Experiment in a Chinese Village. Land Use Policy 2023, 128, 106600. [Google Scholar] [CrossRef]
- Andereck, K.L.; Vogt, C.A. The Relationship between Residents’ Attitudes toward Tourism and Tourism Development Options. J. Travel Res. 2000, 39, 27–36. [Google Scholar] [CrossRef]
- He, J. Family Ties, Family Life-Cycle and Peasant Worker Return Migration Research. Ph.D. Thesis, Guizhou University, Guiyang, China, 2022. [Google Scholar]
- Lu, J.; Dai, M.; Li, F.; Qin, L.; Cheng, B.; Li, Z.; Yao, Z.; Wu, R.; Xu, D. The Impact of Urban Built Environments on Elderly People’s Sense of Safety and Adaptation to Aging: A Case Study of Three Major Urban Agglomerations in China. Land 2023, 12, 1486. [Google Scholar] [CrossRef]
- Benjamin, D.; Brandt, L.; Fan, J.-Z. Ceaseless Toil? Health and Labor Supply of the Elderly in Rural China; William Davidson Institute at the University of Michigan: Ann Arbor, MI, USA, 2003. [Google Scholar]
- Wang, Q.; Shu, L.; Lu, X. Dynamics of Multidimensional Poverty and Its Determinants among the Middle-Aged and Older Adults in China. Humanit. Soc. Sci. Commun. 2023, 10, 116. [Google Scholar] [CrossRef]
- Bai, Q.; Fu, D.; Chen, S.; Wang, F.; Gao, B.; Zhu, J.; Liu, G. Configurational Effects of Intergenerational Support on Older Adults’ Depression: An Empirical Study from CHARLS Data. BMC Public Health 2025, 25, 392. [Google Scholar] [CrossRef] [PubMed]
- Zhan, Y.; Zhan, X.; Wu, M. From Financial Assistance to Emotional Care: The Impact of Intergenerational Support on the Subjective Well-Being of China’s Elderly. J. Happiness Stud. 2025, 26, 17. [Google Scholar] [CrossRef]
- Xie, Q.; Zheng, B.; Qi, X. Spatio-Temporal Evolution and Obstacle Factors of Vulnerability to Poverty for the Elderly in China. Geogr. Geo-Inf. Sci. 2023, 39, 86–93. [Google Scholar] [CrossRef]
- Lin, Y.; Wang, T.; Zhu, T. Do Migration Characteristics Influence the Utilization of Basic Public Health Services in Internal Elderly Migrants in China? Front. Public Health 2021, 9, 514687. [Google Scholar] [CrossRef] [PubMed]
- Tian, Y.; Wang, Z.; Zhao, J.; Jiang, X.; Guo, R. A Geographical Analysis of the Poverty Causes in China’s Contiguous Destitute Areas. Sustainability 2018, 10, 1895. [Google Scholar] [CrossRef]
- Wu, K.; Liu, Q.; Zhang, J.; Yang, X. Farmers’ Livelihood Vulnerability and Adaptation Model in Minqin Oasis under the Arid Environment Stress. Econ. Geogr. 2019, 39, 157–167. [Google Scholar] [CrossRef]
- Li, S.; Li, X.; Sun, L.; Cao, G.; Fischer, G.; Tramberend, S. An Estimation of the Extent of Cropland Abandonment in Mountainous Regions of China. Land Degrad. Dev. 2018, 29, 1327–1342. [Google Scholar] [CrossRef]
- Wang, J.; Peng, L.; Chen, J.; Deng, X. Impact of Rural Industrial Integration on Farmers’ Income: Evidence from Agricultural Counties in China. J. Asian Econ. 2024, 93, 101761. [Google Scholar] [CrossRef]
- Kang, J.; Park, J.; Cho, J. Inclusive Aging in Korea: Eradicating Senior Poverty. Int. J. Environ. Res. Public Health 2022, 19, 2121. [Google Scholar] [CrossRef]
- Pal, S.; Palacios, R. Understanding Poverty among the Elderly in India: Implications for Social Pension Policy. J. Dev. Stud. 2011, 47, 1017–1037. [Google Scholar] [CrossRef]
- Tomaszewski, W.; Barnes, M. Investigating the Dynamics of Social Detachment in Older Age; Institute for Fiscal Studies: London, UK, 2008; pp. 150–185. ISBN 978-1-903274-54-5. [Google Scholar]
- He, X.; Huang, X.; Zhou, Y. The Living Arrangement, Income Structure and Poverty Vulnerability of the Rural Elderly. Chin. Rural Econ. 2020, 126–144. [Google Scholar]
- Zhang, Z.; Song, J.; Yan, C.; Xu, D.; Wang, W. Rural Household Differentiation and Poverty Vulnerability: An Empirical Analysis Based on the Field Survey in Hubei, China. Int. J. Environ. Res. Public Health 2022, 19, 4878. [Google Scholar] [CrossRef]
- Milovanovic, V.; Smutka, L. Populating Aging in Rural India: Implication for Agriculture and Smallholder Farmers. J. Popul. Ageing 2020, 13, 305–323. [Google Scholar] [CrossRef]
- Szabo, S.; Apipoonanon, C.; Pramanik, M.; Leeson, K.; Singh, D.R. Perceptions of an Ageing Agricultural Workforce and Farmers’ Productivity Strategies: Evidence from Prachinburi Province, Thailand. Outlook Agric. 2021, 50, 294–304. [Google Scholar] [CrossRef]
Disclaimer/Publisher’s Note: The statements, opinions and data contained in all publications are solely those of the individual author(s) and contributor(s) and not of MDPI and/or the editor(s). MDPI and/or the editor(s) disclaim responsibility for any injury to people or property resulting from any ideas, methods, instructions or products referred to in the content. |
© 2025 by the authors. Licensee MDPI, Basel, Switzerland. This article is an open access article distributed under the terms and conditions of the Creative Commons Attribution (CC BY) license (https://creativecommons.org/licenses/by/4.0/).