1. Introduction
Standards and practices associated with the illuminated built environment have evolved rapidly over the past decade with the onus of the design aiming to draw a balance between being occupant-centric and energy efficient. People spend 90% of their time indoors, encouraging architects, engineers, and designers to create systems and technology that focus on the well-being of the occupants [
1]. Additionally, evolving energy and sustainability programs have led to post-occupancy evaluations of illuminance values becoming more important. The traditional (manual) point-by-point measurement method for post-construction illuminance verification is dated and depending on the size of the space(s) being evaluated, can prove to be expensive due to the number of person-hours spent. Given the challenges associated with post-construction illuminance assessments, there is a clear need to explore alternative measurement methods. Our approach involves leveraging luminance maps created using HDR imaging to calculate illuminance values. The basic principles of HDR imaging are discussed as follows.
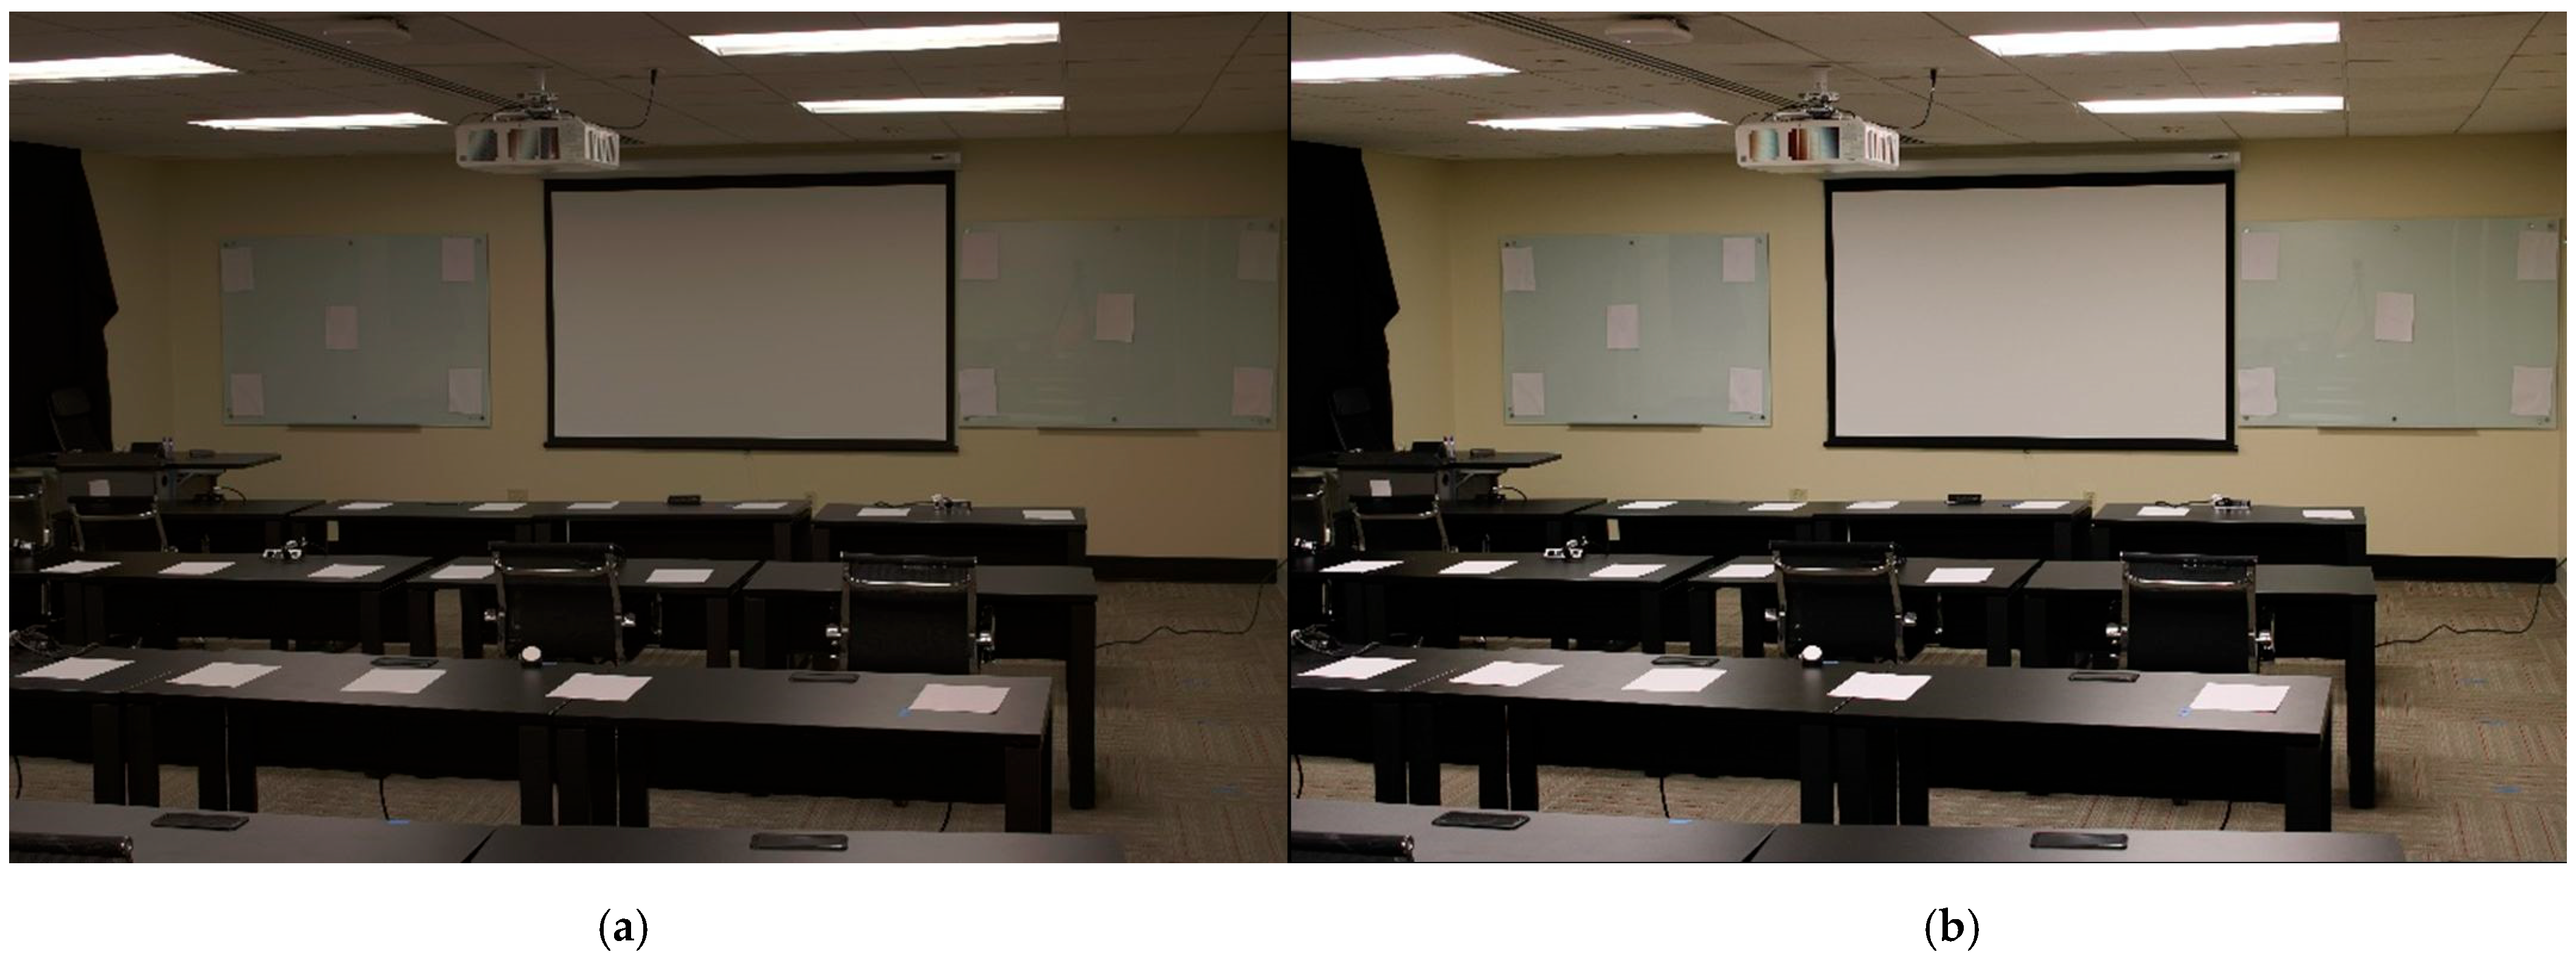
HDR imaging is traditionally a photographic technique developed to compensate for the limited dynamic range of cameras—i.e., the goal was to capture real-world pixel information, emulating what our eyes see. The dynamic range of conventional still cameras is ultimately dictated by three interdependent parameters developed by the International Organization for Standardization (ISO): aperture (f-stop), shutter speed or exposure value (EV), and sensor sensitivity. Adjusting any one of these settings affects the collected light, and without a precise balance, can result in under- or over-exposed images. Even high-end DSLR cameras, with roughly 14 usable stops, are limited to about 16,384:1 contrast [
2], whereas real-world environments routinely exceed 100,000:1 [
3]. HDR imaging aims to bypass this shortcoming and produce imagery that more closely mirrors human visual perception.
Figure 1 displays the difference between a low dynamic range (LDR) and an HDR image.
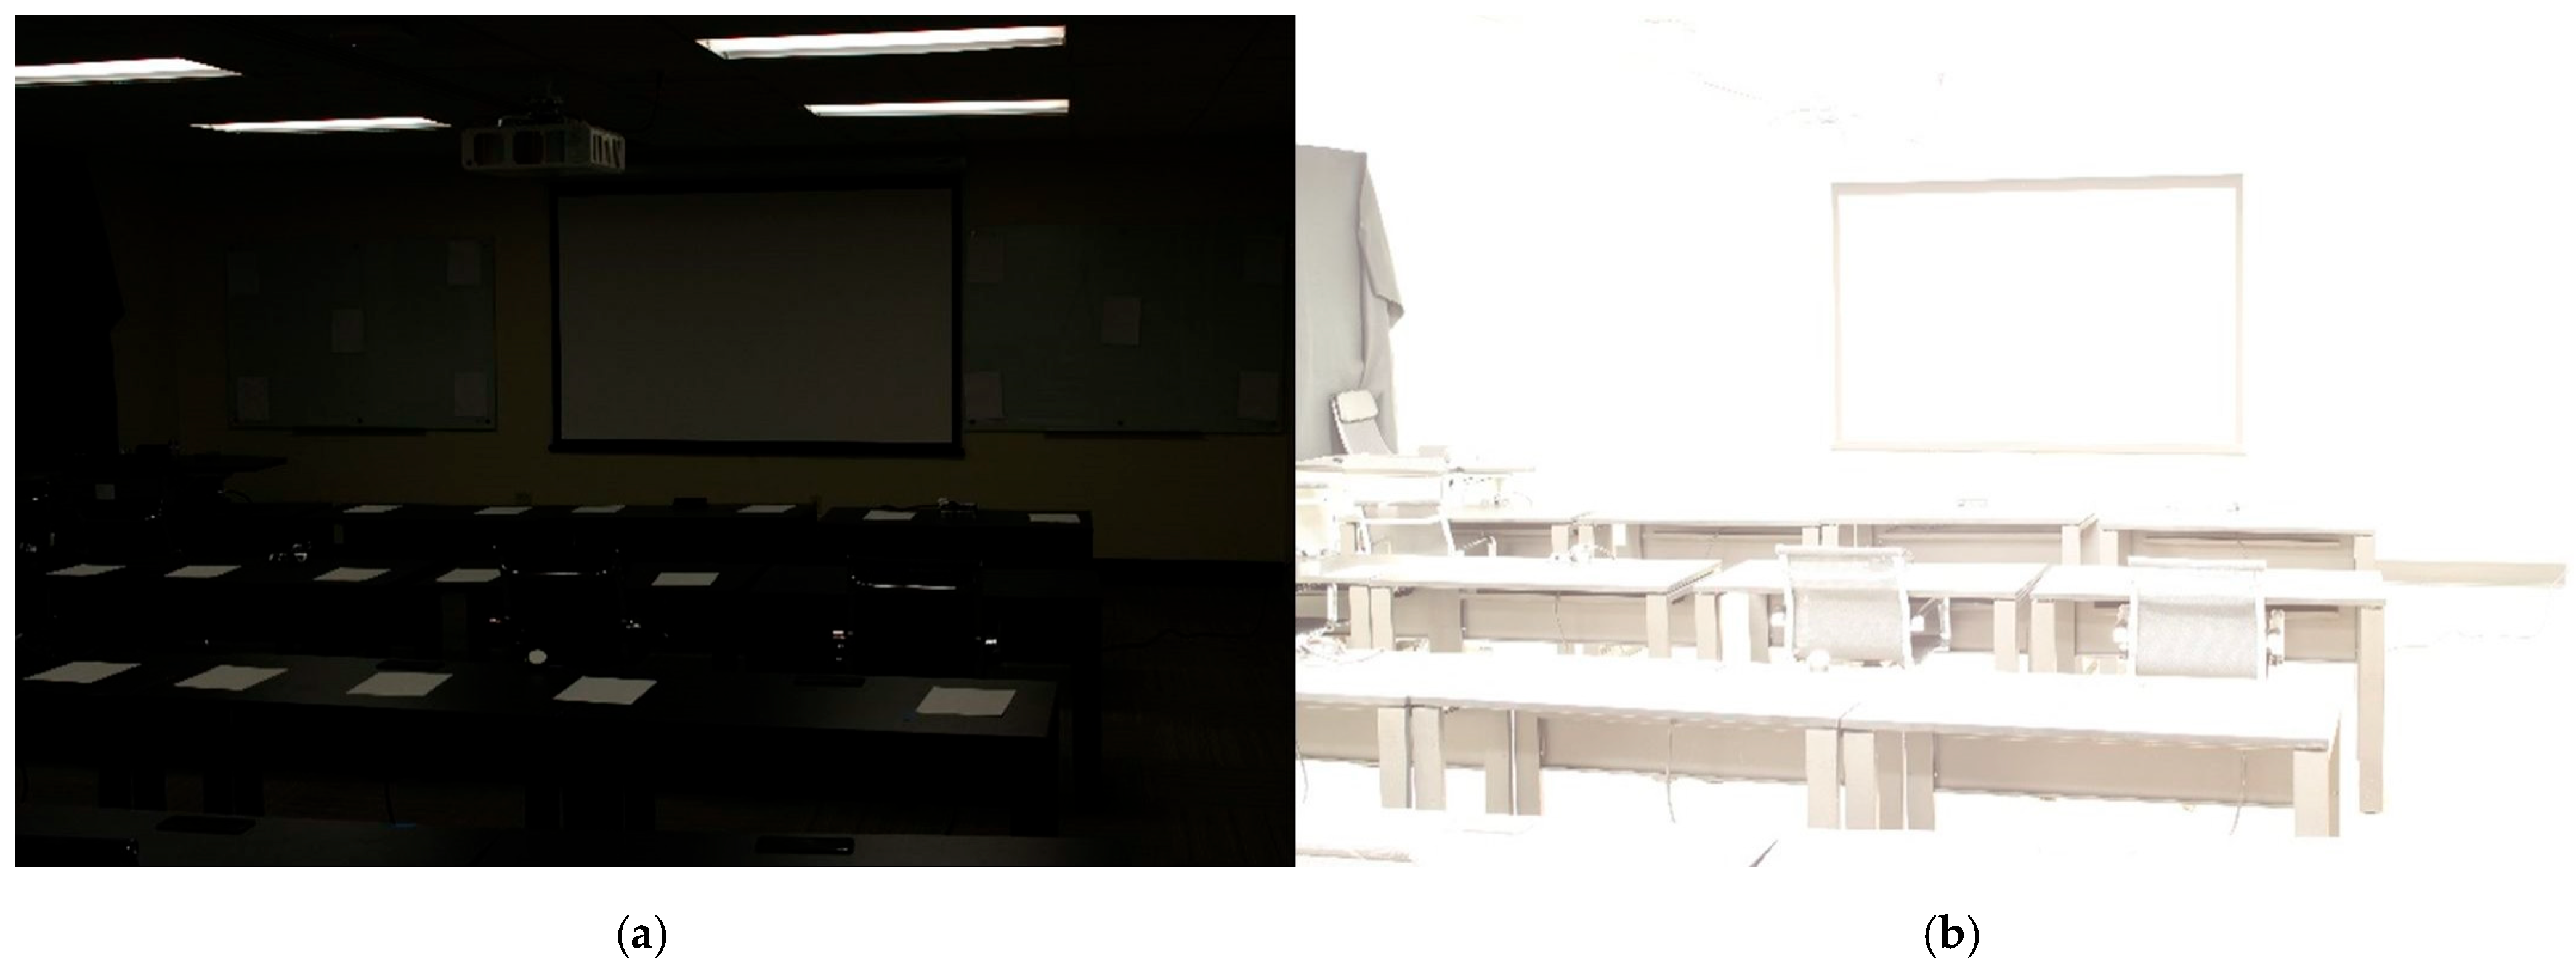
Currently, a popular method of creating HDR images involves combining an exposure bracketed stack of LDR images resulting in a single image with an enhanced tonal depth, allowing a better representation of dark and bright regions. This method is known as the sequential exposure change (SEC) technique [
4] and entails keeping two of the three light-dependent camera settings—ISO and f-stop—constant while capturing still images at varying shutter speeds.
Figure 2 emphasizes the differences in LDR images at two different shutter speeds.
Since HDR images essentially encode absolute luminance values, they have become valuable analytical tools for lighting researchers—predominantly being used to evaluate luminance and glare conditions for both interior and exterior environments after post-processing using software such as Photosphere [
5] or Radiance [
6], which were both developed by Greg Ward. Radiance (
https://radsite.lbl.gov/radiance/, accessed on 26 April 2025) is a rendering engine specifically designed to accurately simulate lighting scenarios using ray-tracing methods. Photosphere (
http://www.anyhere.com/, accessed on 26 April 2025) utilizes Radiance’s luminance calculation capabilities while functioning as a dedicated HDR imaging and analysis software. Photosphere applies a global tone-mapping algorithm that compresses the maximum and minimum luminance values via a logarithmic function while preserving the mid-range values. While HDR has been proven as a tool to successfully extract luminance maps from captured images, there has been limited research on how this method could be leveraged to compute illuminance. Illuminance is independent of surface materiality—which makes it much more difficult to model or compute from still images as what the camera sensor captures is essentially reflected light in a given direction.
Early explorations of HDR imaging applications in illuminance measurement, particularly within interior settings, include works by Moeck and Anaokar, who initially explored the normalization of HDR images using reference illuminance values [
7]. Further advances were made by Mardaljevic et al. and Bellia et al. by employing blank paper as a proxy-Lambertian surface to quantify luminous flux and daylight illuminance, respectively [
8,
9]. Subsequent refinements in technique and accuracy are evident in Mardaljevic et al.’s evaluation of various proxy-Lambertian surfaces, achieving errors as low as 5.10% [
10]. Duff et al., Cuttle, and Poling and Cai furthered HDR imaging applications using mean room surface exitance (MRSE) calculations and luminous flux, and in some cases achieved high accuracy [
11,
12,
13]. Novel methods from these studies improve accuracy and provide research-validated evidence of HDR’s capabilities in automating lighting metrics. However, these methods are complex and are yet to find acceptance in an applied setting. Jung and Inanici’s circadian lighting assessment achieved approximately 10% accuracy, showcasing HDR imaging’s broader applicability in varied lighting conditions [
14]. In contrast, Yun and Kim attained significant errors (15–70% root mean square error; RMSE) when predicting indoor illuminance from sky luminance distributions, emphasizing the challenges in mixed-exposure scenarios [
15]. Guha et al. similarly reported around a 10% mean absolute percentage error (MAPE) in exterior illuminance measurements on artificial turf, highlighting ongoing challenges with outdoor reflective surfaces [
2].
Table 1 contextualizes similar methods currently used by researchers.
Mardaljevic et al. [
10] measured the error of the AWMR and provided a method of determining the reflectance of a surface through HDR imaging. Additional steps and processes in Photosphere using the AWMR lead to illuminance calculations. Poling and Cai [
13] achieved a low error while measuring the luminous flux entering the camera lens. Guha et al. [
2] attempted to measure illuminance of a proxy-Lambertian surface utilizing artificial turf, and an appropriate accuracy was achieved. The work discussed in this document is sufficiently different from these studies either with respect to the methodology (utilizing printer paper vs. tissue paper and matte paint [
16] or artificial turf [
2]), or metrology (calculating illuminance via Lambertian approximation as opposed to AWMR [
10] or luminous flux [
13]).
These studies collectively highlight HDR imaging’s utility as an alternative and relatively simple illuminance measurement technique with the potential of reducing the labor, time, and complexity of the task. In contrast to the reviewed research, the work described in this document aims to study the integration of HDR imaging with a readily available proxy-Lambertian surface for the illuminance mapping of indoor conditions. A major focus of the work has been addressing limitations in accuracy and expanding the practical utility of HDR-derived illuminance calculations.
Table 2 highlights past HDR research and summarizes the methods and reported accuracies for each study. Building upon prior technological advancements and research, the study described in this document seeks to evaluate the accuracy of utilizing Lambertian approximation as an alternative method to extract illuminance values from HDR luminance maps.
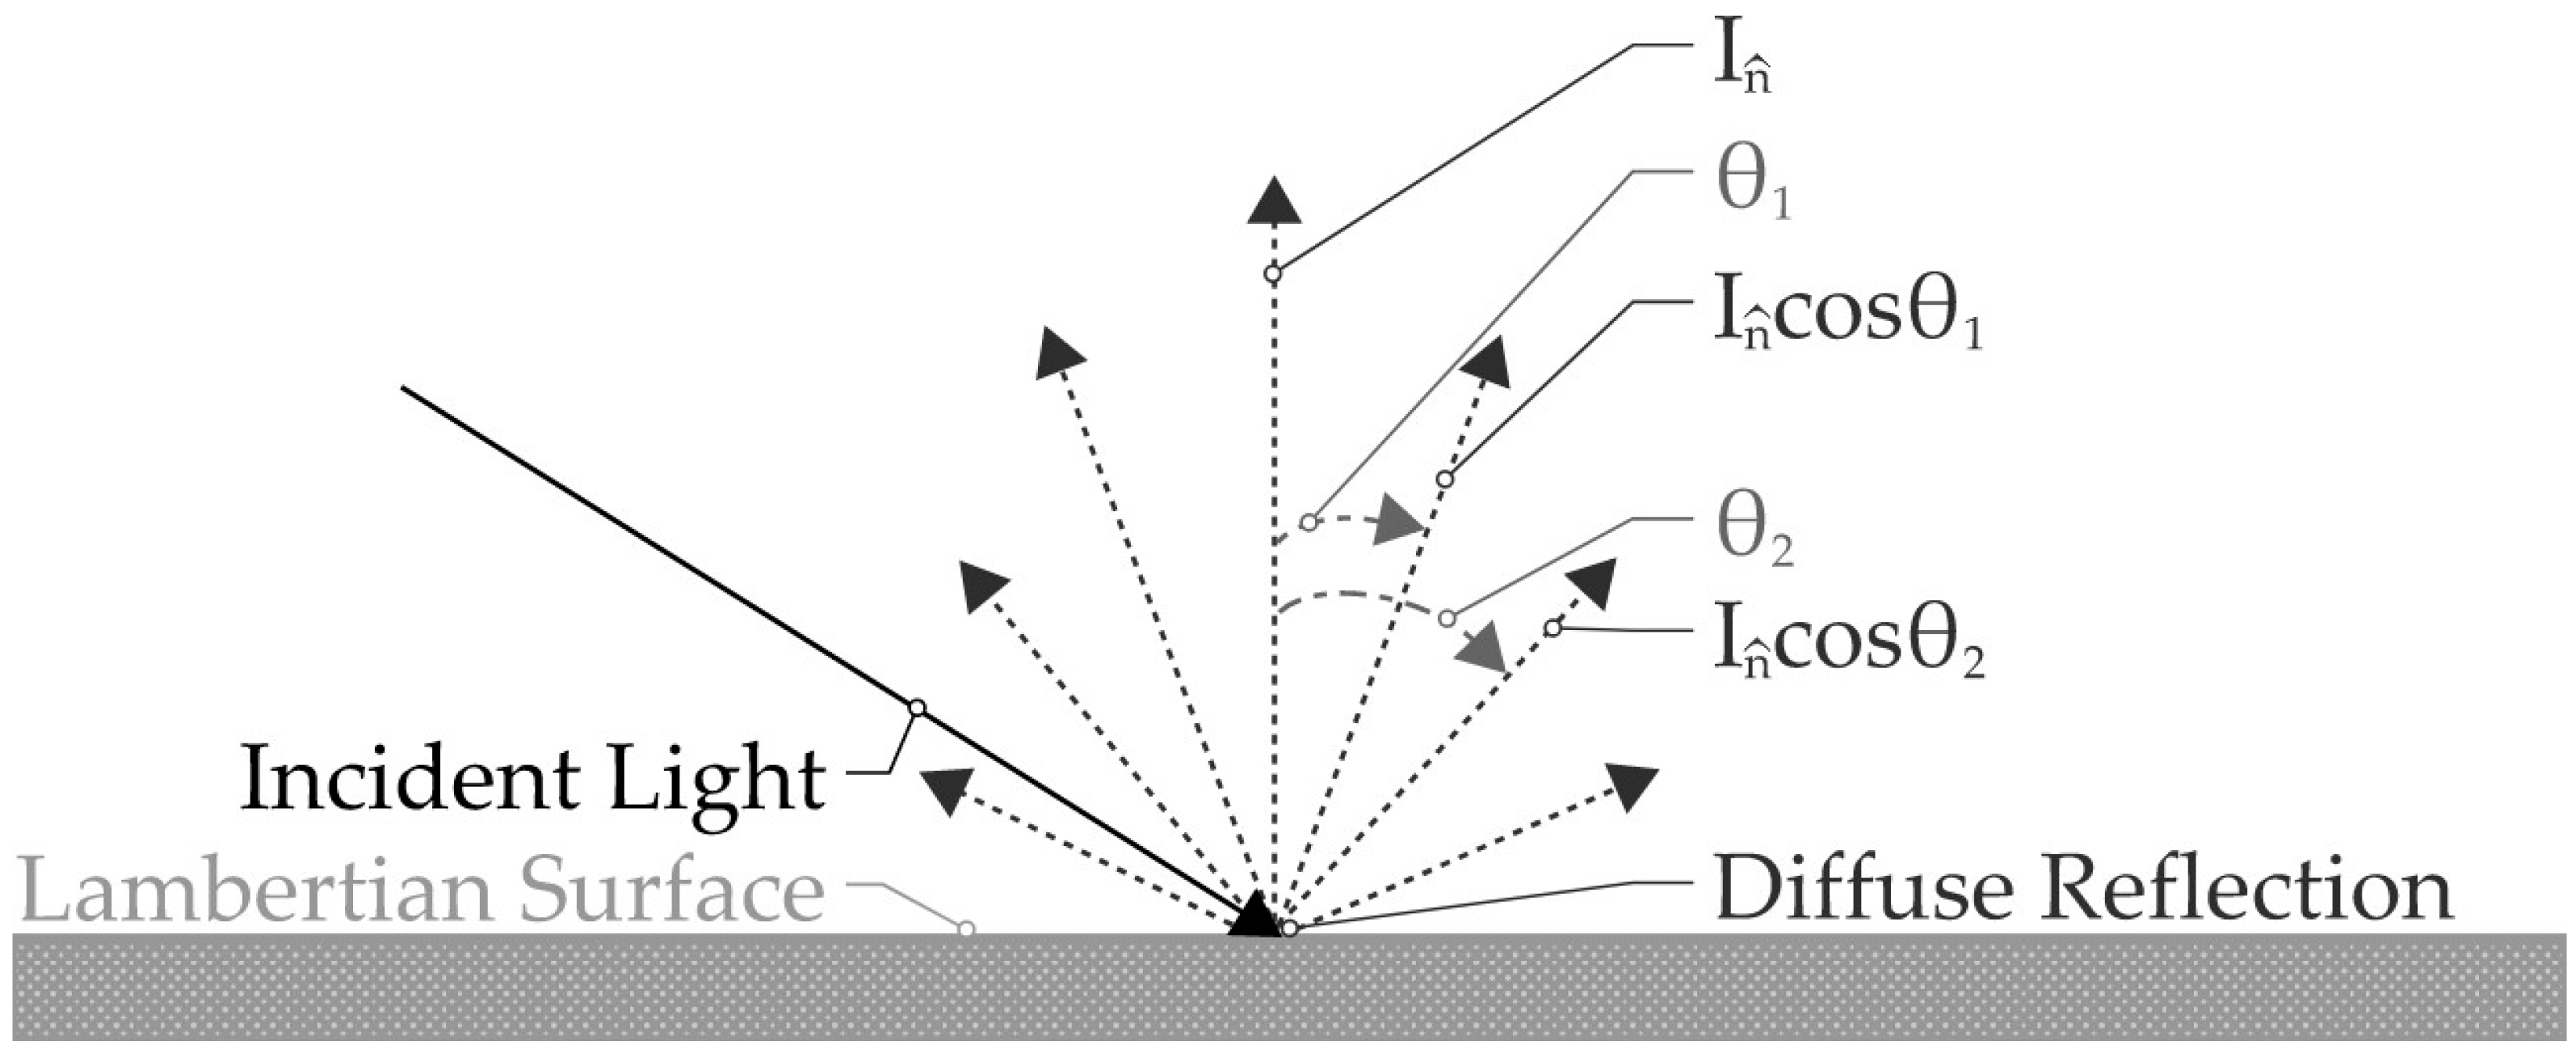
A Lambertian or perfectly diffuse surface is a theoretical concept and reflects or scatters incident light in a distinct manner—the intensity of the reflected light is a function of the cosine of the angle of reflection made with the surface normal—essentially making the surface appear uniformly bright.
Figure 3 illustrates a Lambertian reflection and Equation (1) displays the mathematical relationship.
where L is luminance [cd/m
2], I is the luminous intensity [candela], I
n is luminous intensity normal to the surface [candela], A is the area of the surface [m
2], and θ is angle of incidence [degrees].
While Lambertian surfaces are purely theoretical (as stated above), many practical surfaces display similar reflectance behavior and can hence be approximated to be proxy-Lambertian in nature. This has found an application in simplifying lighting calculations—specifically by being able form a mathematical relationship between luminance and illuminance. The relationship is described as follows:
where L is luminance [cd/m
2], M is luminous exitance [lumen/m
2], E is illuminance [lux], and ρ = reflectance.
This relationship also allows the computation of the reflectance of multiple surfaces lit by the same source at the same illuminance. This mathematical relationship plays an important part in determining surface reflectance values in the proposed work, and is derived as follows:
where L
1 and L
2 are the luminance values of the two Lambertian surfaces lit by the same source, ρ
1 and ρ
2 are respective reflectance values of the surfaces, and E
1 and E
2 are the illuminance values measured on the surfaces.
This study aims to evaluate the feasibility and accuracy of deriving indoor illuminance values from HDR imaging by combining a readily available proxy-Lambertian surface with luminance measurements. Specifically, the objectives include the following: (1) identifying a practical proxy-Lambertian surface suitable for illuminance calculations, (2) developing a streamlined HDR-based measurement workflow, and (3) validating the accuracy of the proposed method against standard illuminance meters.
2. Materials and Methods
To assess the feasibility of calculating illuminance values from HDR images, this study employs a combination of HDR image processing, reflectance measurements, and statistical validation of illuminance values calculated using Lambertian approximation. The methodology follows a structured approach involving the selection of a proxy-Lambertian surface, HDR image creation, luminance normalization, and subsequent illuminance calculation. Each step ensures reproducibility using widely available materials and cost-effective equipment.
A key aspect of this study is the identification of a suitable proxy-Lambertian surface that serves as the reference material for reflectance-based illuminance calculations. An ideal Lambertian surface would exhibit perfectly diffuse reflection, meaning it reflects light uniformly in all directions regardless of the angle of incidence. While this is a theoretical concept, many real-world materials approximate this behavior to a sufficient degree for practical applications. The choice of a material as a proxy-Lambertian surface depends on how closely it mimics perfectly diffuse reflection, as well as its availability, affordability, and practicality for real-world applications.
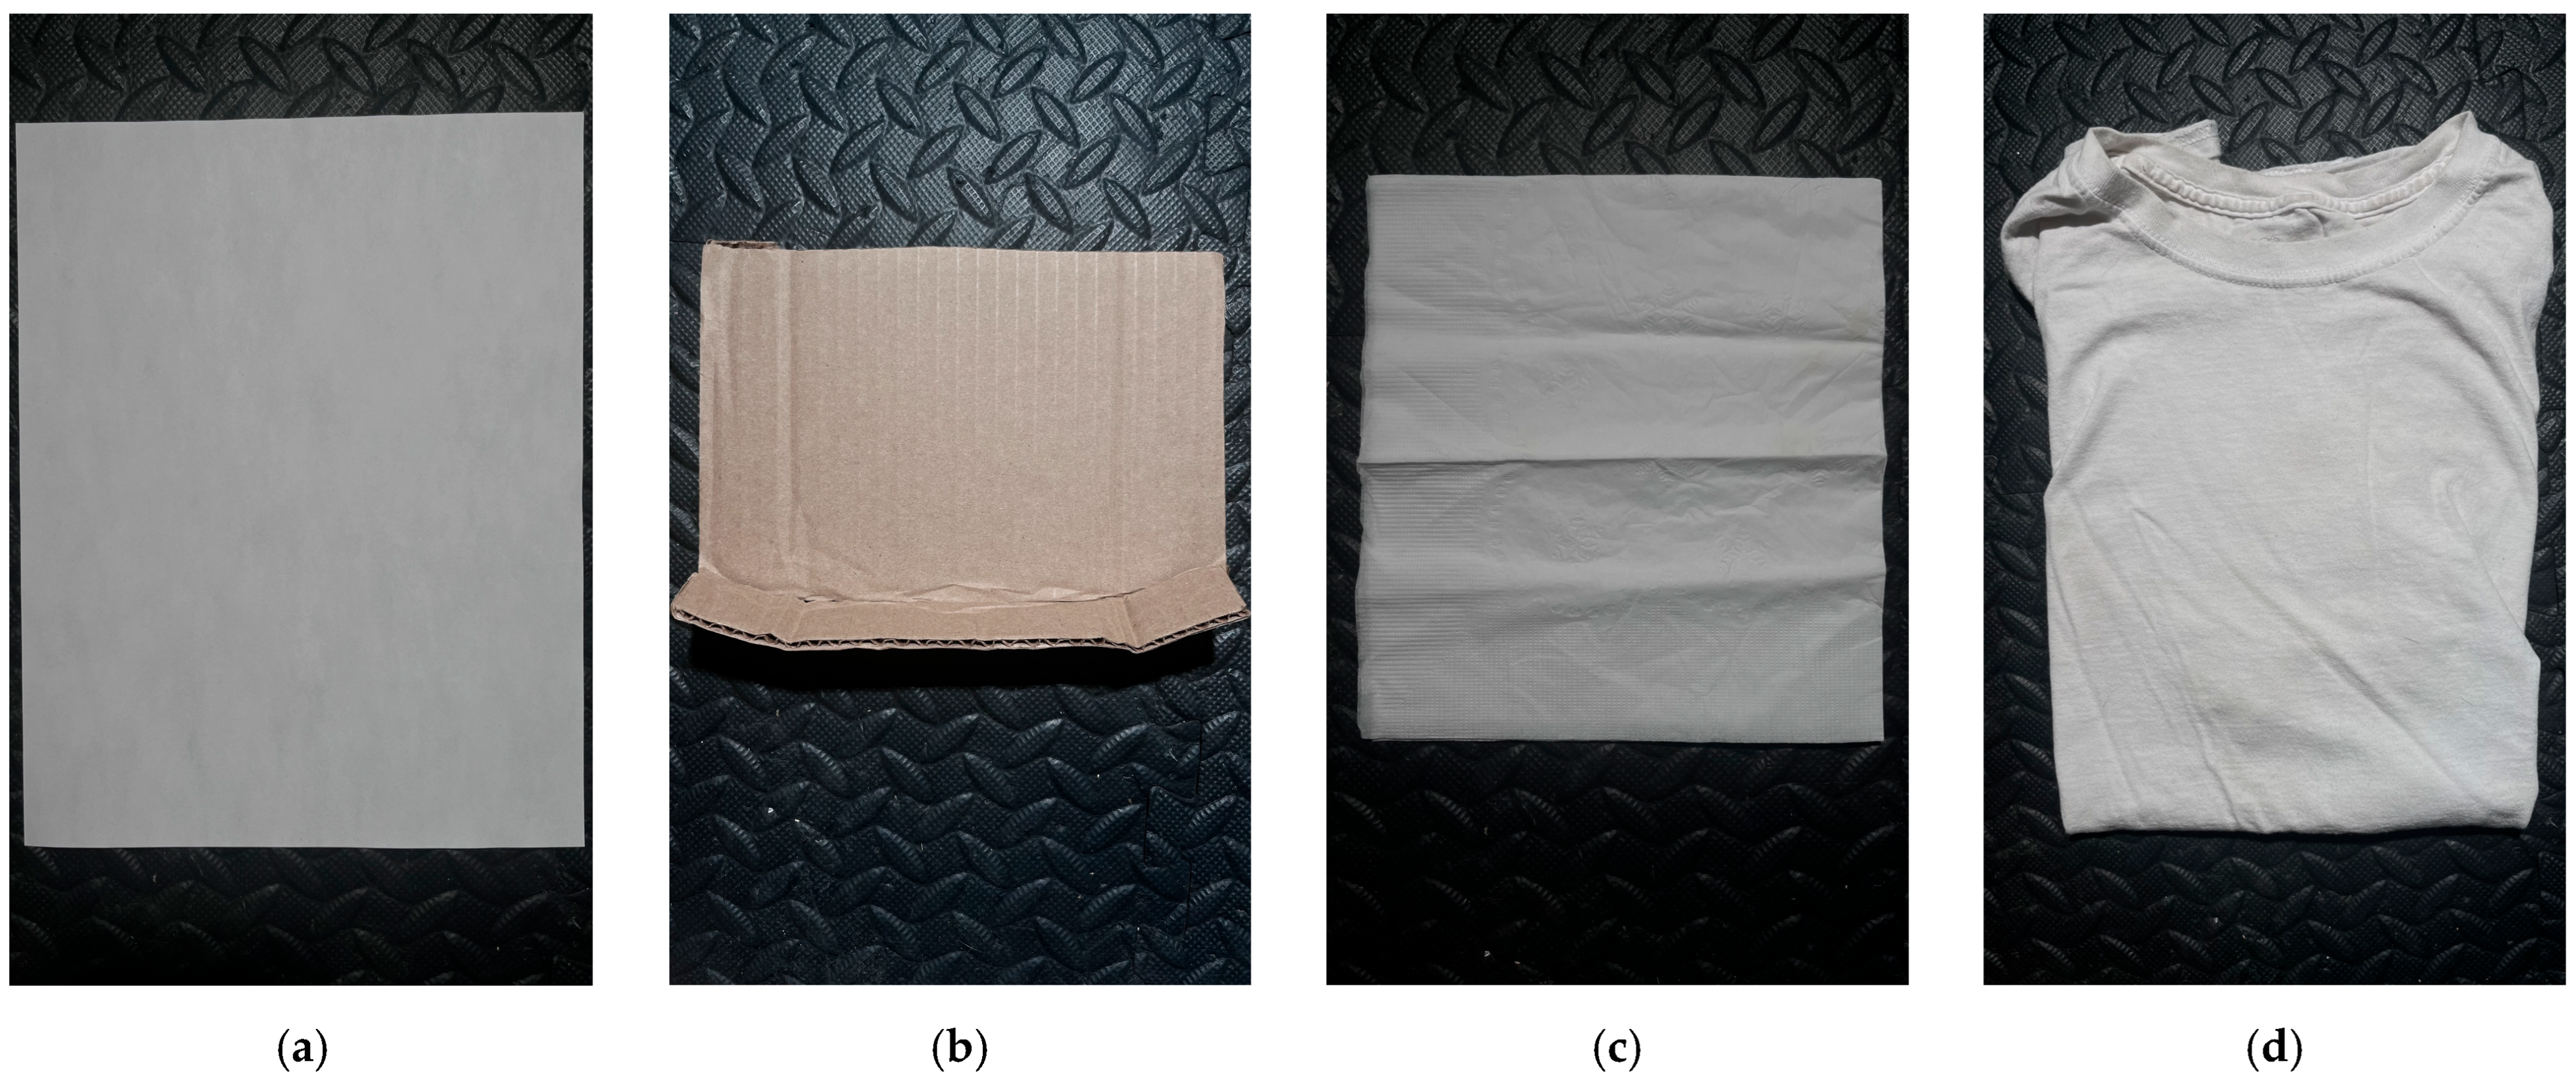
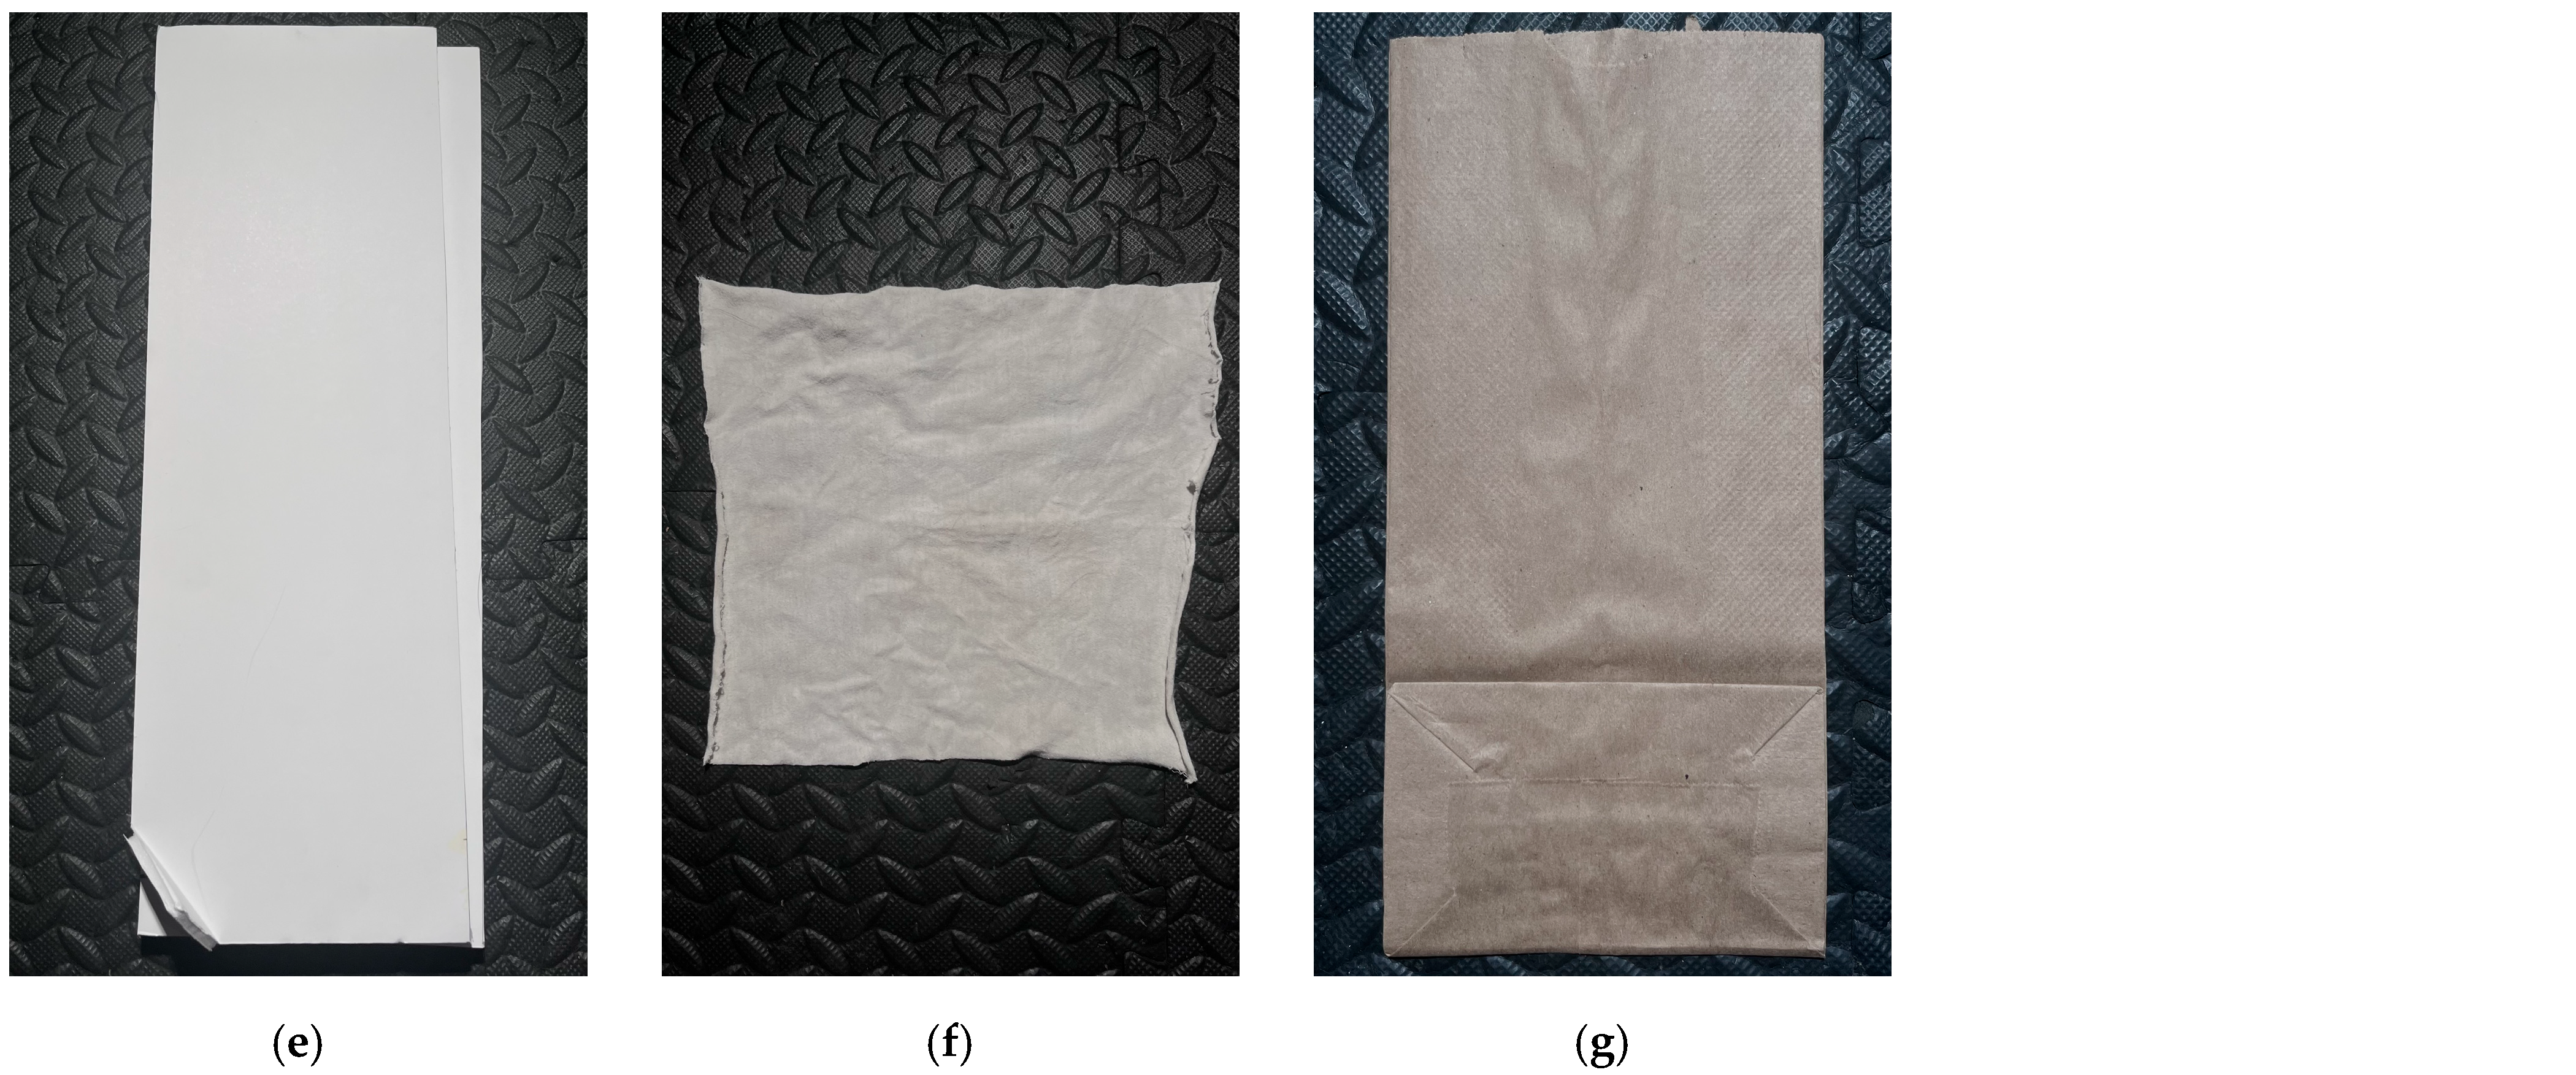
Several candidate materials, including printer paper, cardboard, a paper napkin, a t-shirt, foam, cloth, and a paper bag, were evaluated for their reflective properties. The materials were selected based on their accessibility and abundance in interior settings.
Figure 4 shows the material candidates evaluated. Additionally, measurements were also taken for a laboratory-calibrated reflectance standard (Labsphere Spectralon SRS-99-020) as a reference. The reflectance standard is a near-Lambertian surface and is widely used for calibrating lighting instruments and software outputs.
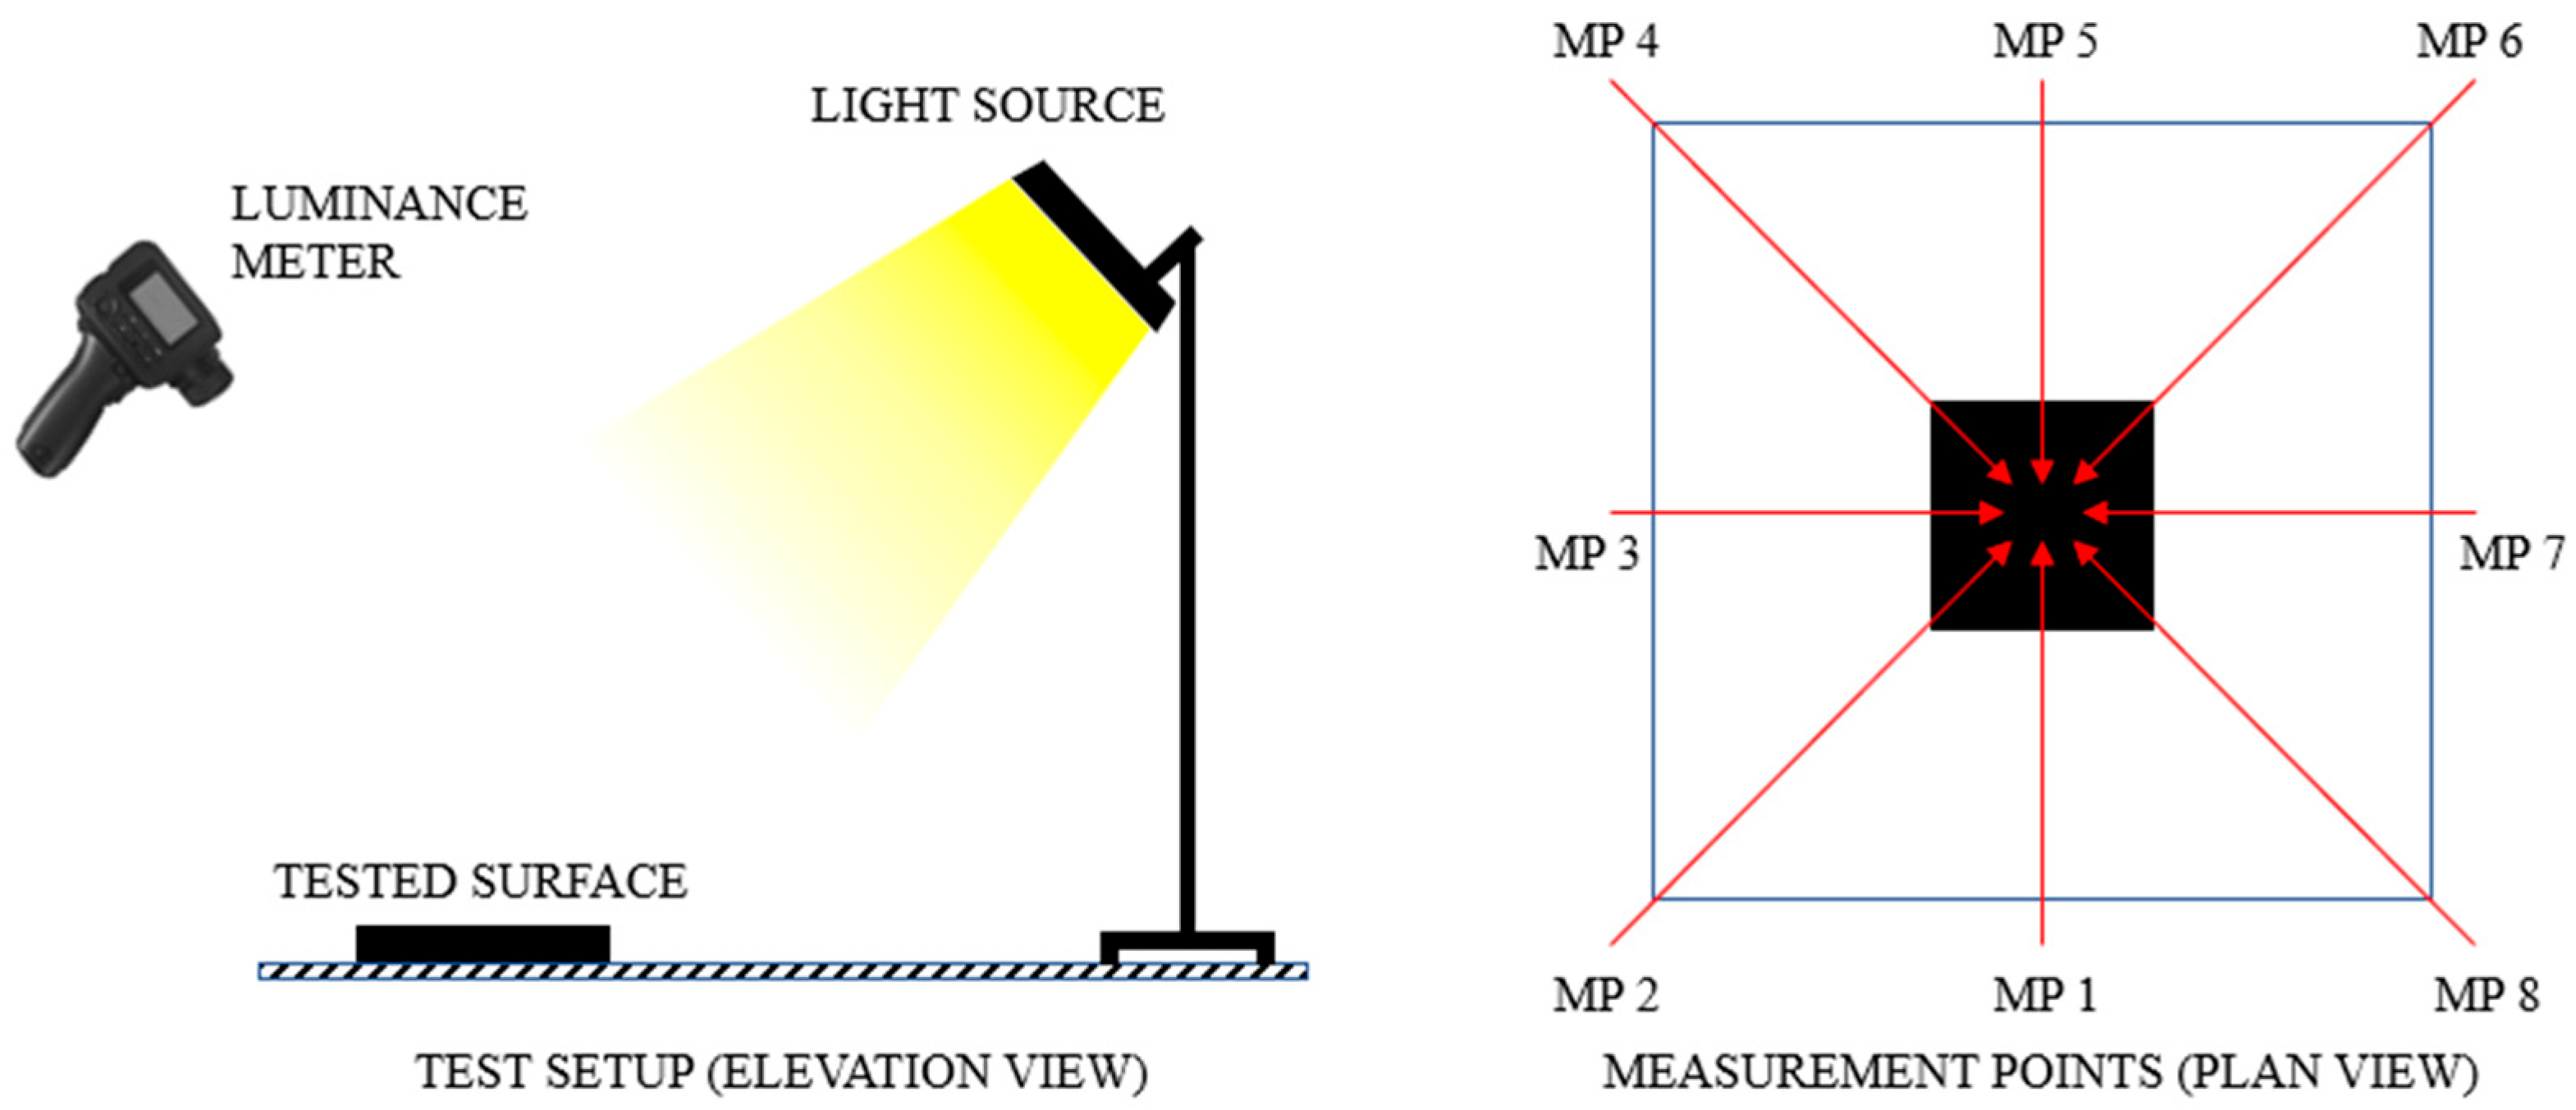
The selection process involved measuring luminance at eight angular positions around each material, measured at 45-degree intervals across 360 degrees using a calibrated Konica Minolta CS-150 luminance meter.
Figure 5 illustrates the eight positions and reflectance measurement setup for the blank printer paper.
The total mean error, expressed as a percentage deviation from behaving like a Lambertian surface, was computed for each material using the following equation:
Figure 6 illustrates the luminance values (normalized) from each measurement point (angle). Theoretically, a near-Lambertian surface should exhibit isotropic luminance (as evidenced in Equation (1)) across all measurement points.
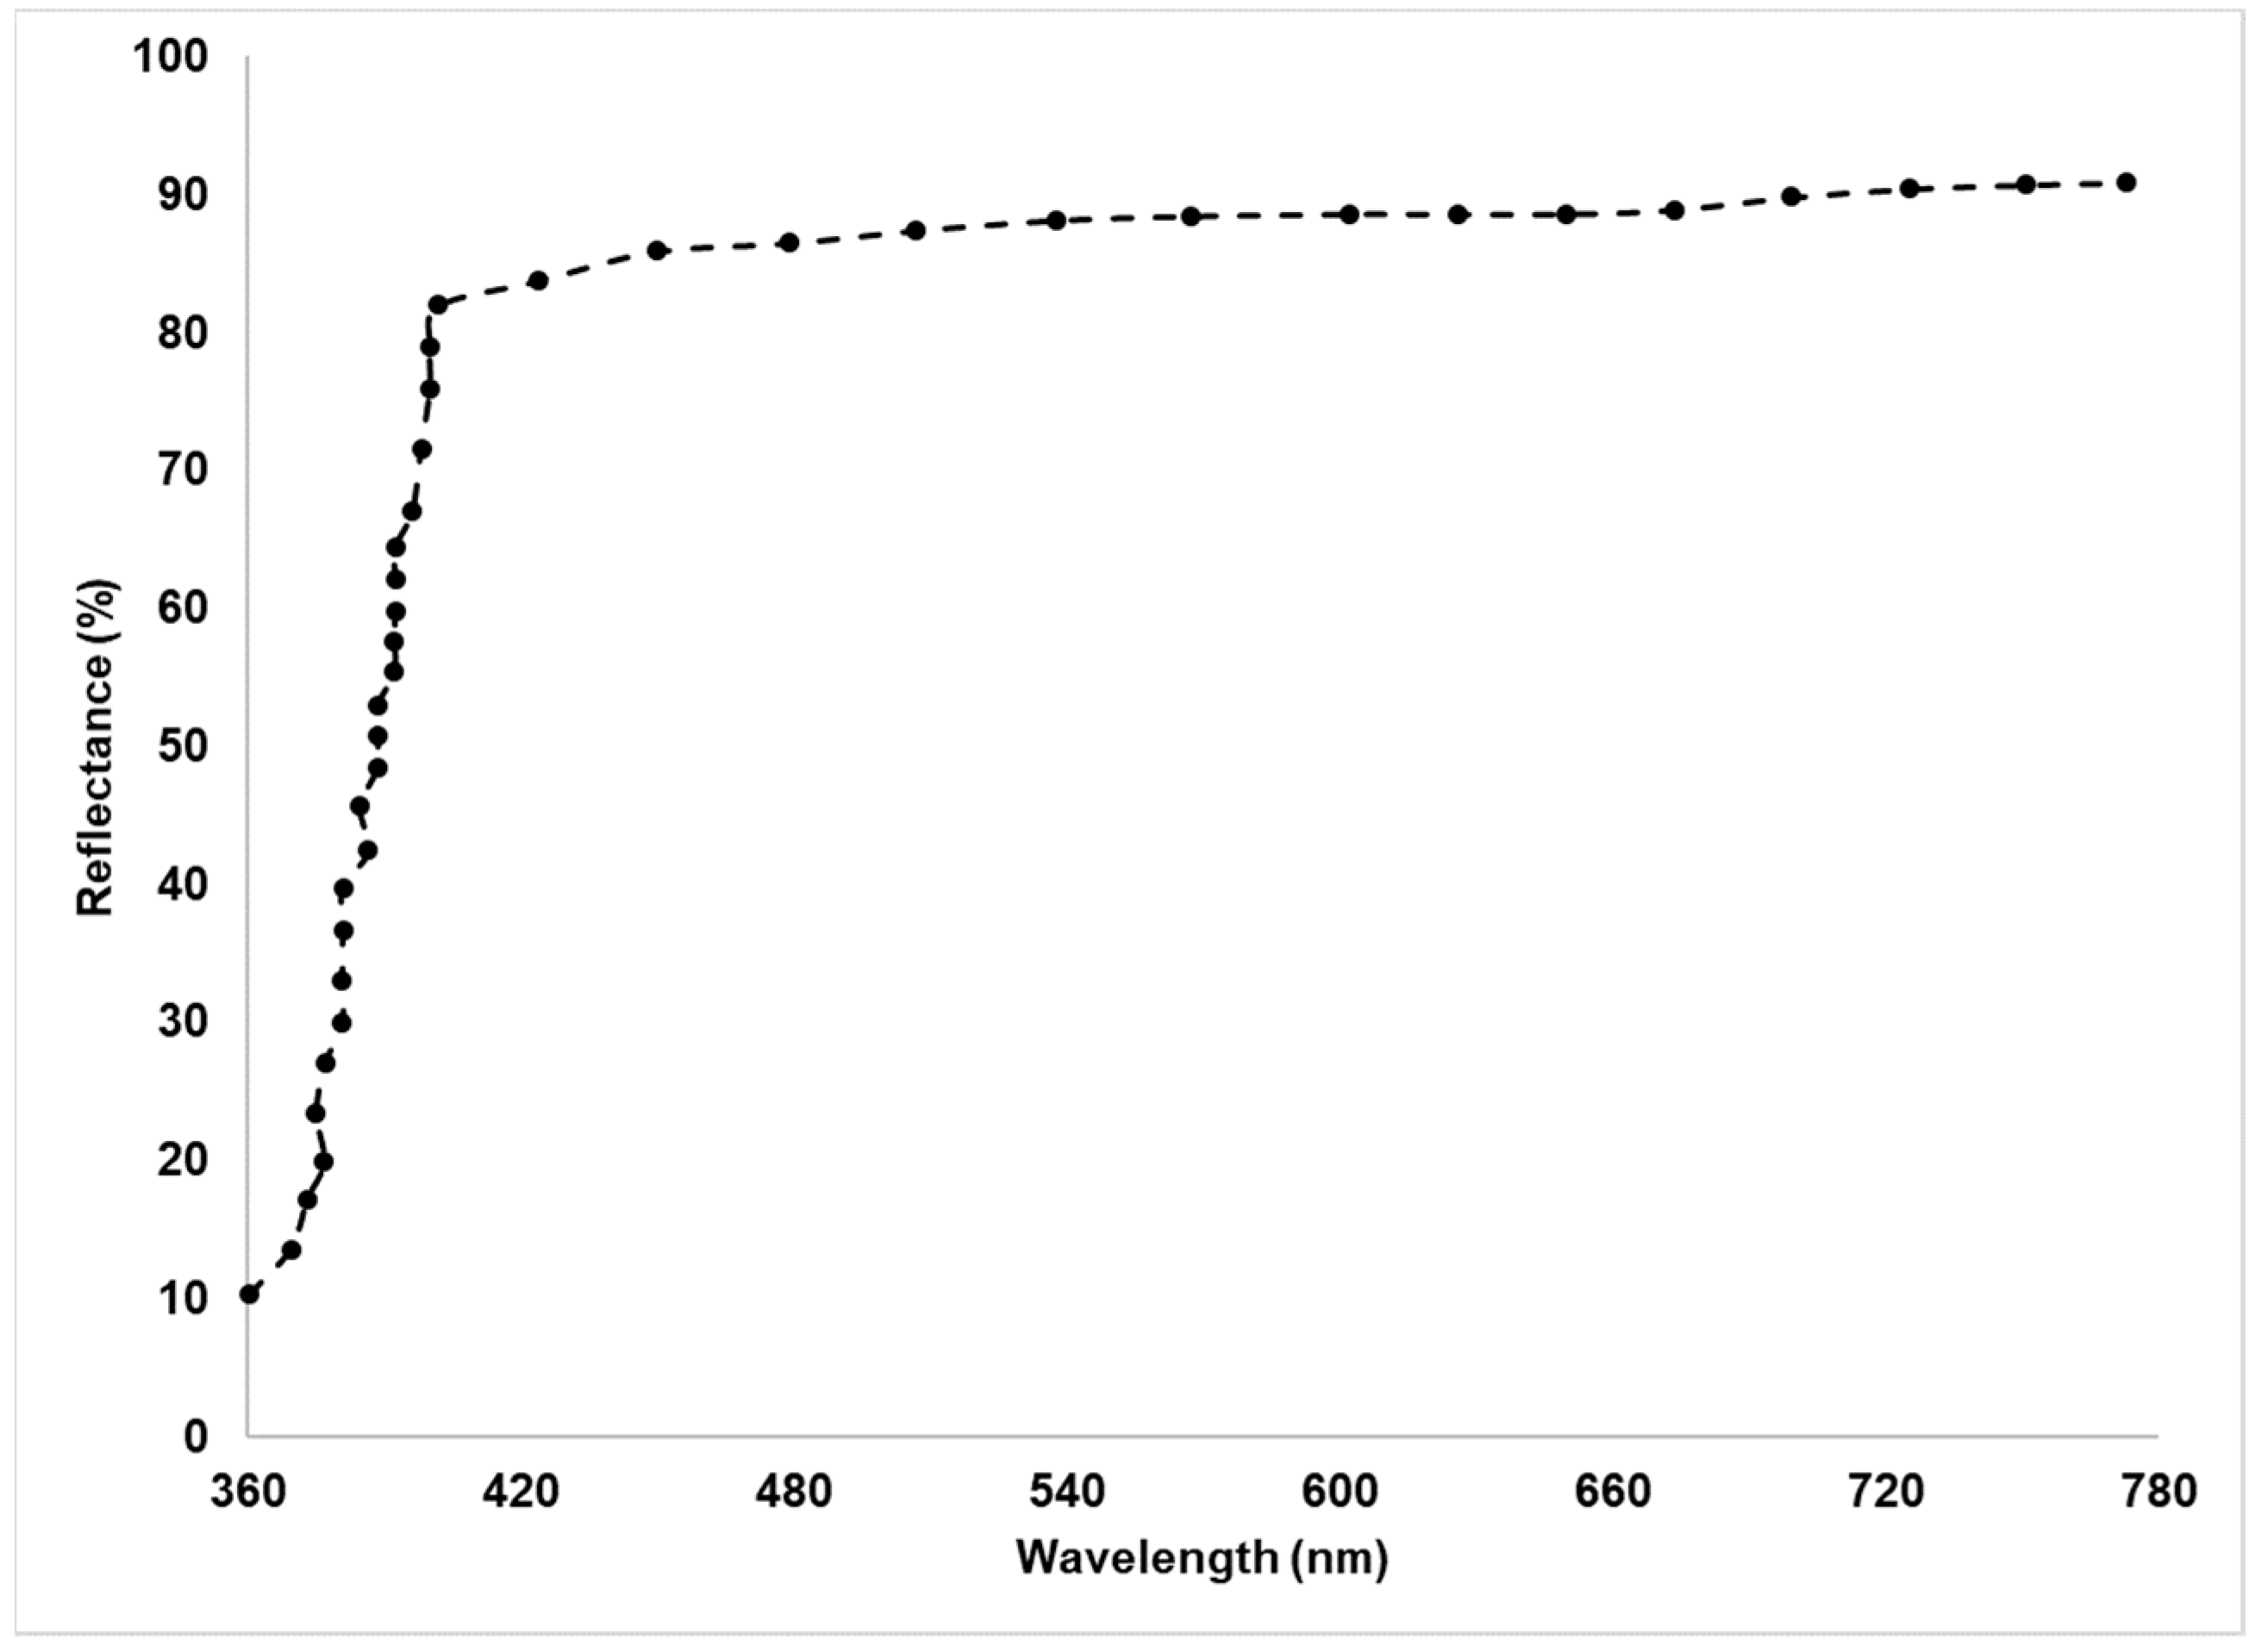
Among the candidate materials, the letter-size blank printer paper (Boise X-9, 92 brightness) exhibited a mean deviation of 2.11%, making it the most suitable option due to its low error.
Figure 7 contains the spectral response function for blank printer paper.
This material was therefore designated as the proxy-Lambertian surface for subsequent calculations. While higher-precision materials, such as professional-grade reflectance standards, offer lower deviations, their cost and limited accessibility make them impractical for widespread use in post-occupancy illuminance assessments. The choice of blank printer paper aligns with the study’s goal of developing an accessible and reproducible methodology for lighting professionals and researchers.
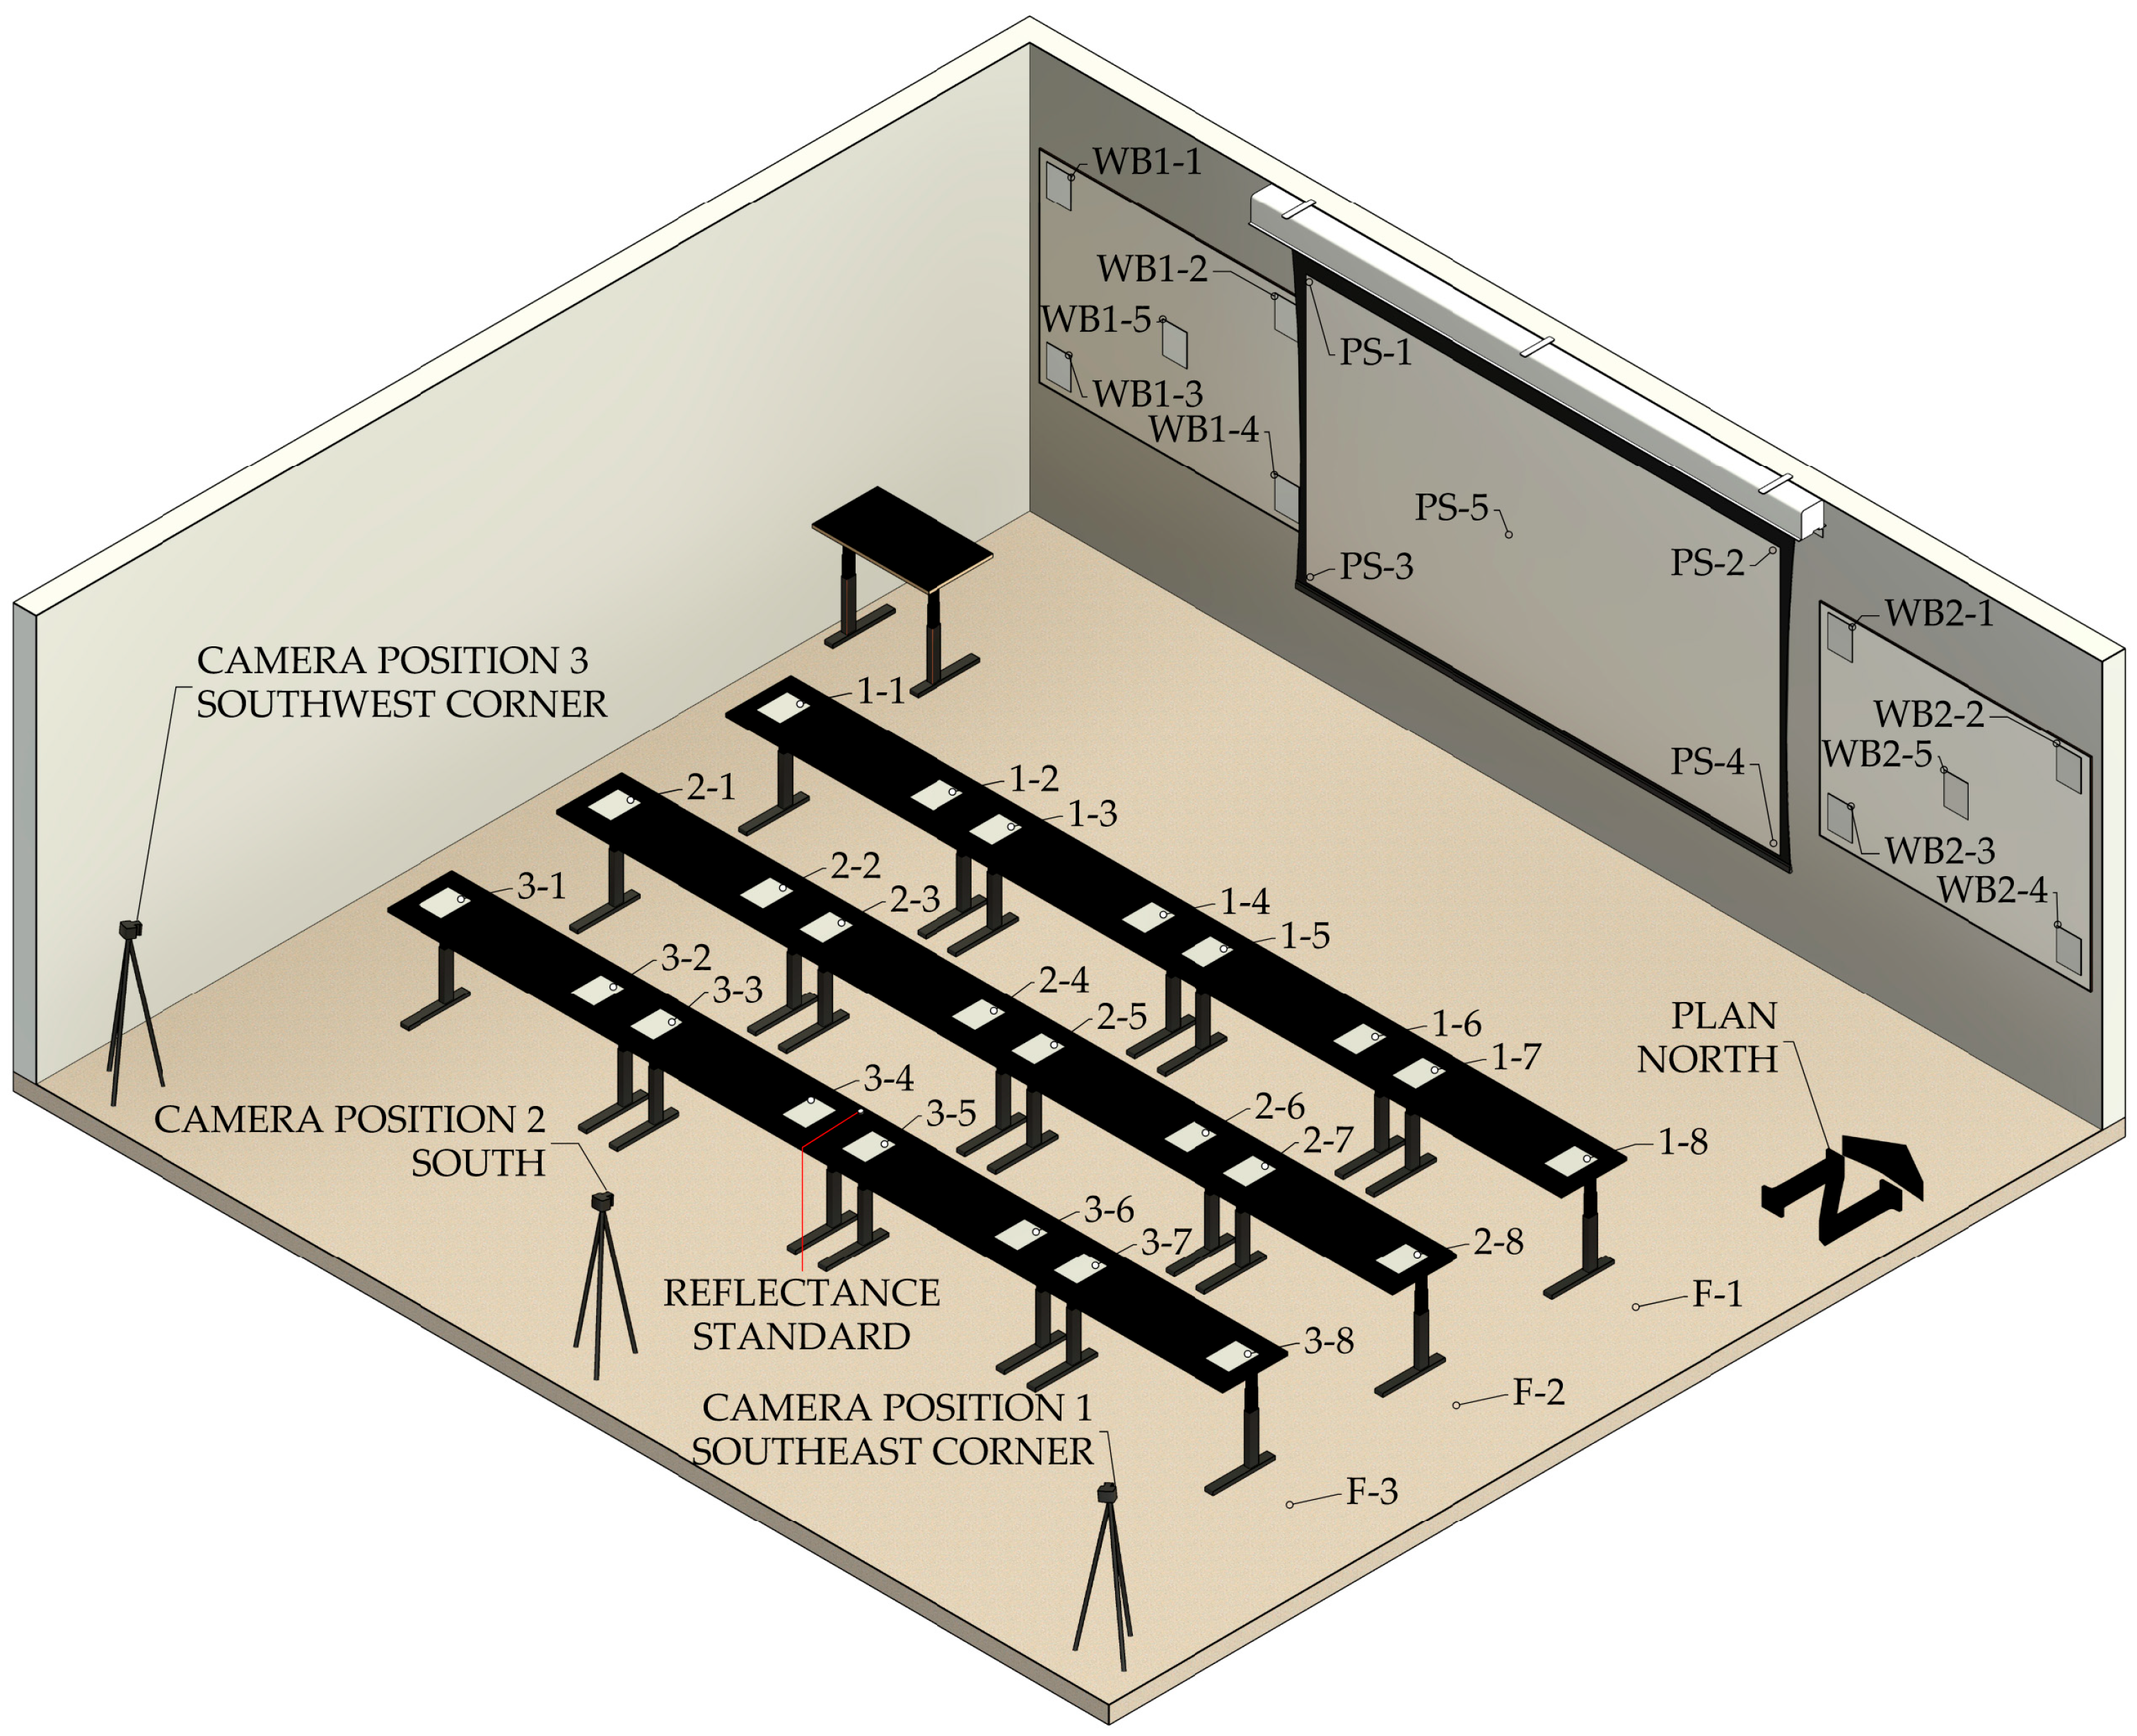
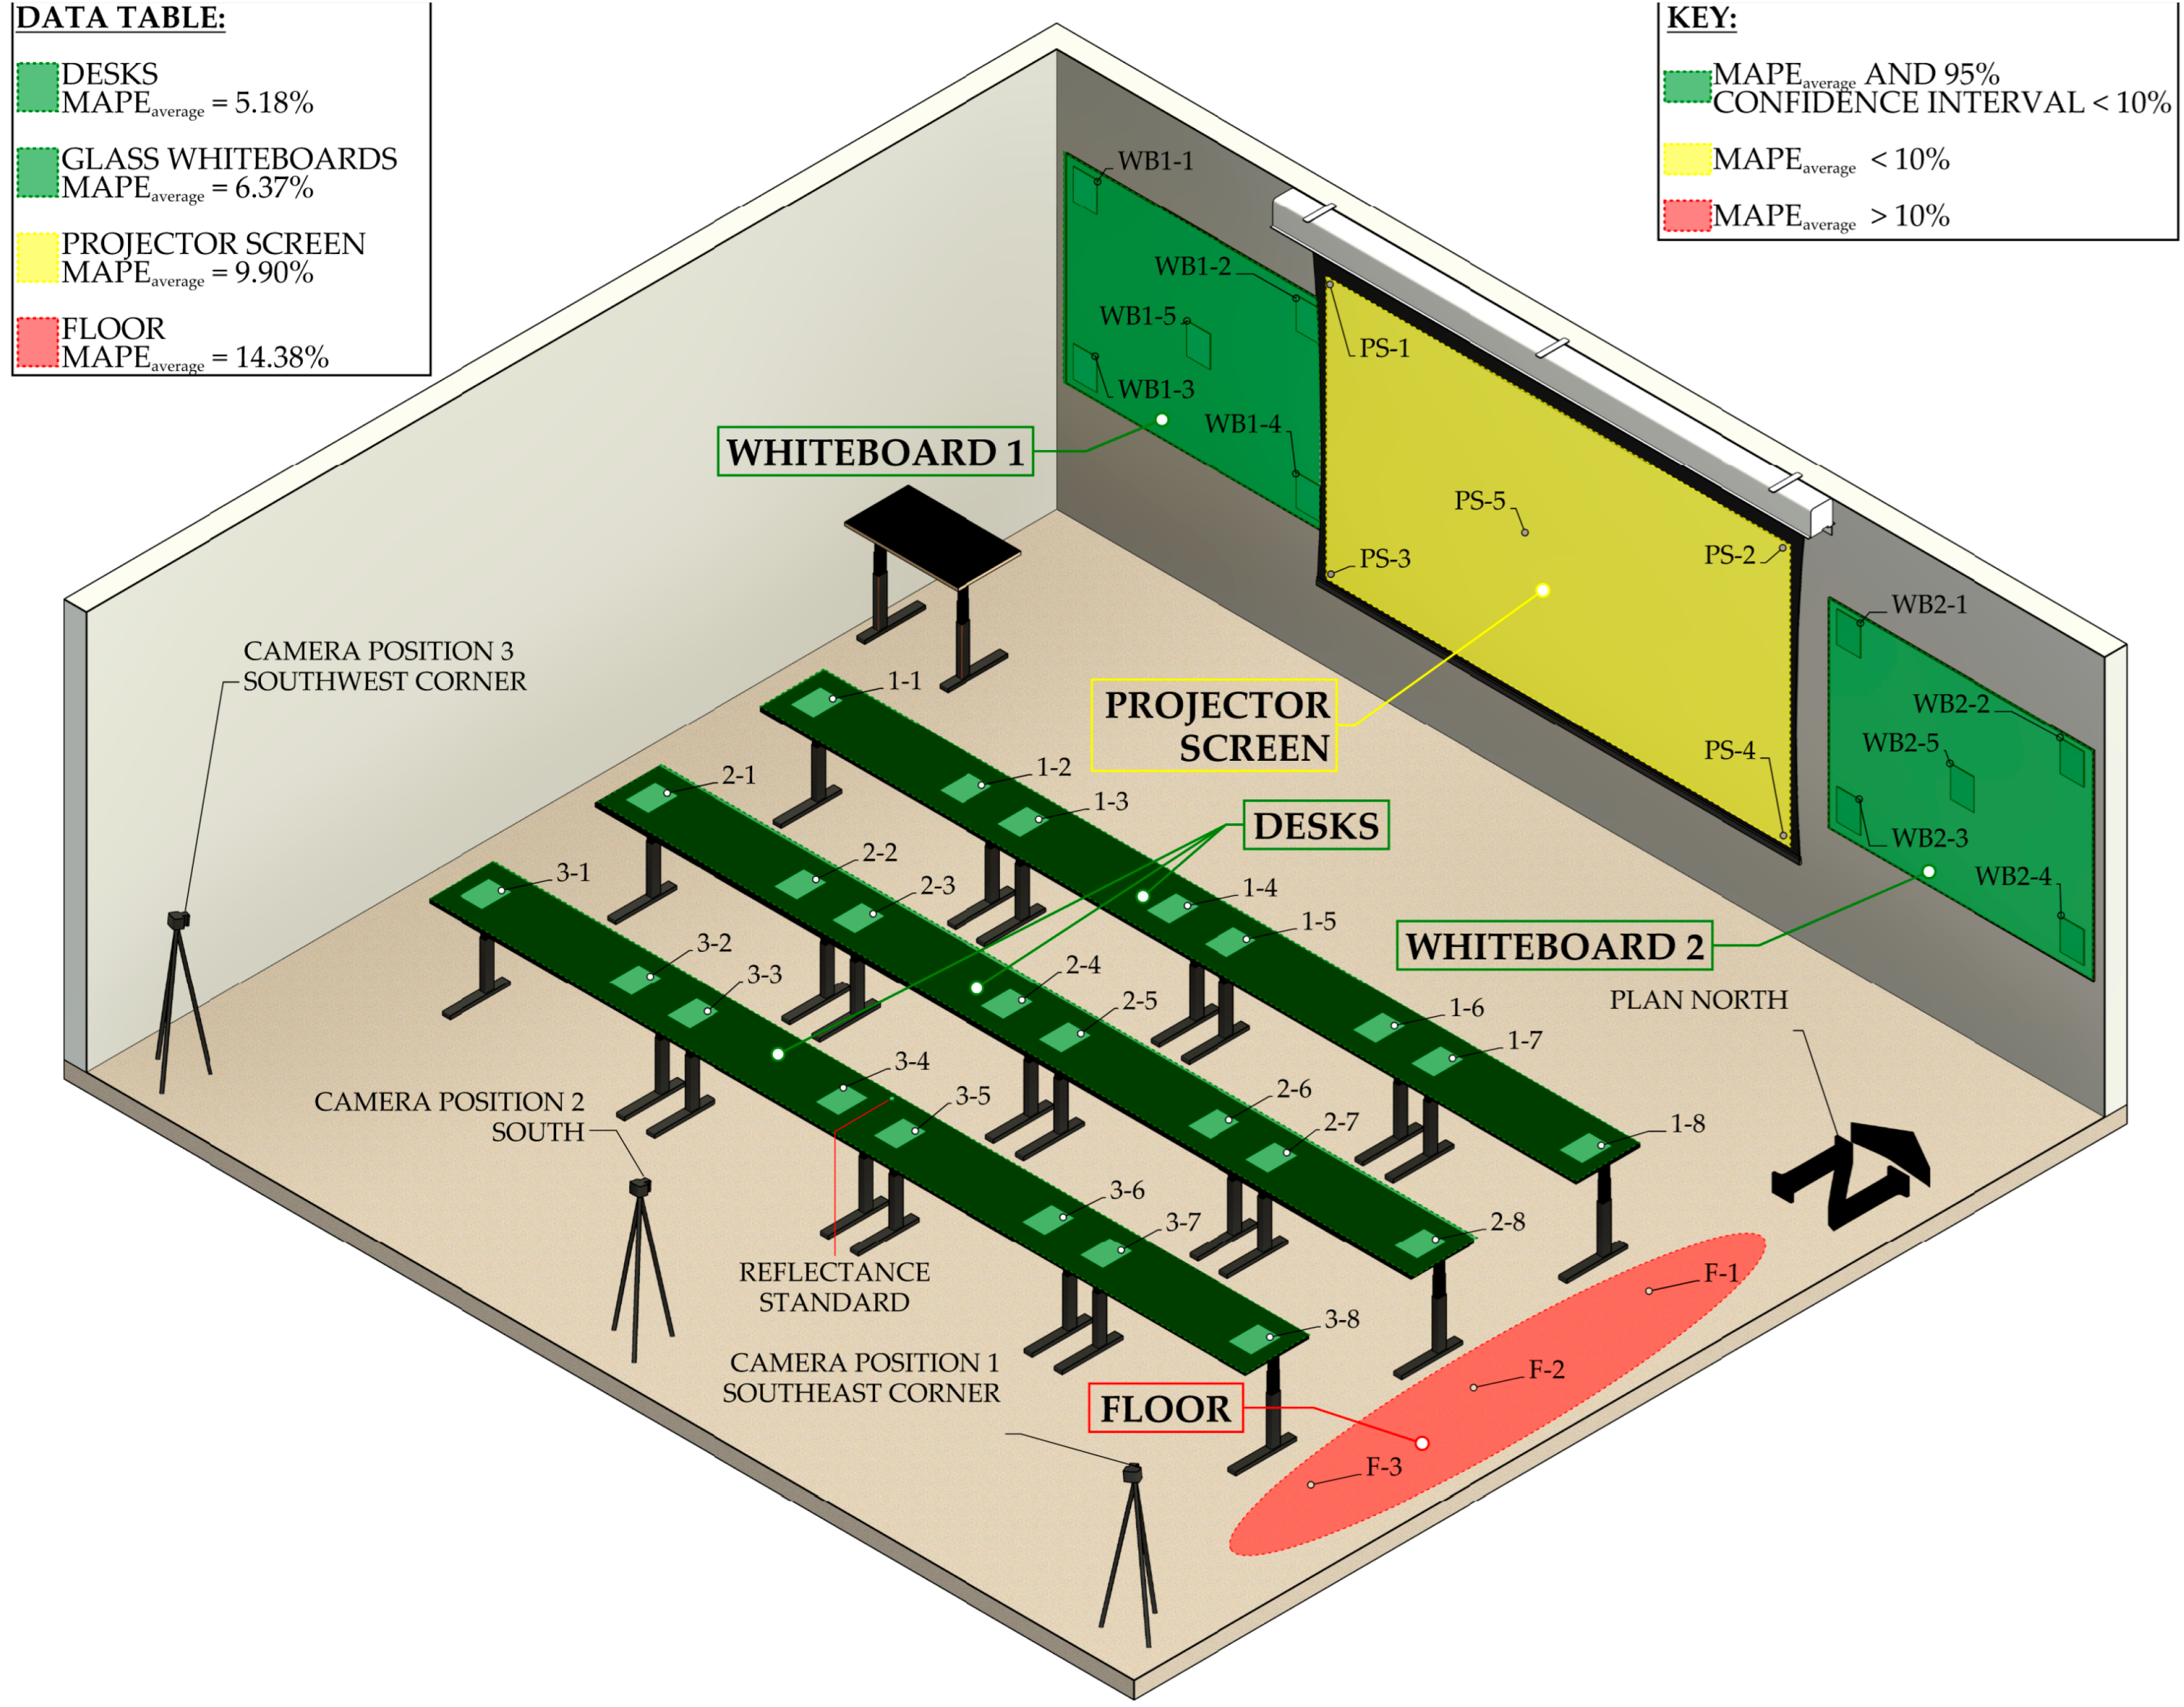
Furthermore, the study is conducted in a classroom setting—an indoor environment that typically provides a variety of reflective surfaces. The room was illuminated by overhead T8 fluorescent fixtures. Measurement points were strategically placed at desks, the carpeted floor (circulation area), the whiteboard, and the projector screen, representing surfaces that would typically be analyzed in post-occupancy lighting assessments. Desks were chosen to assess horizontal illuminance at the work-plane level, while the whiteboard and projector screen were included to evaluate vertical illuminance.
Figure 8 clarifies room layout and point locations for the experiment.
The desks and whiteboards received blank printer paper—the proxy-Lambertian surface. The floor and projector screen display Lambertian abilities and did not receive paper. Reflectance values for the printer paper, carpeted floor, and projector screen are calculated using Equation (4).
Table 3 displays the results of each surface’s reflectance calculation.
The computed reflectance values require accurate HDR images adjusted for luminance. Therefore, a digital camera adjusted for indoor scenes and optimized for HDR creation is vital. The image acquisition process involved utilizing the remote image capture functionality on a Canon EOS 2000D DSLR camera mounted on a tripod to maintain consistent framing and avoiding confounding artifacts, such as capturing shadows or unintended movement between shots. The SEC technique was followed to create the HDR image, and, accordingly, a fixed f-stop (f/5.6) and ISO (100) were maintained to ensure consistent aperture and sensor sensitivity across each LDR image, allowing variations in exposure time to be the only changing parameter. An overview of camera settings is provided in
Table 4.
The LDR images ranged in exposure time from 1/4000 s to 30 s, ensuring that both the darkest and brightest regions of the scene were properly captured. The images were taken in a controlled indoor environment to minimize external lighting interference and maintain consistent illumination throughout the capture process. To enhance reciprocity and robustness data were collected from three locations in the studied space—the southwest corner, the south, and the southeast corner.
Photosphere, a software validated for research [
21,
22], is utilized to align and merge these LDR images which compensates for slight exposure differences while preserving luminance accuracy. A critical step in this process is calibration, in which a reference luminance value is used to scale the HDR image accurately. For this study, a manual luminance measurement (using a Konica-Minolta CS-150 luminance meter) taken at a laboratory calibrated reflectance standard (Labsphere Spectralon SRS-99-020) was utilized as the calibration reference. The resultant HDR images are shown in
Figure 9.
To further ensure accuracy, Photosphere’s built-in correction tools were utilized to reduce error-causing artifacts such as lens flare or ghosting. Once the HDR images were finalized, subsequent luminance extraction and illuminance calculation steps could begin.
Photosphere’s built-in luminance analysis extracts luminance values at the predetermined measurement locations. These locations corresponded to key surfaces, such as desks, whiteboards, floors, and projector screens, where illuminance values were expected to be relevant for post-occupancy lighting assessments.
Given the computed reflectance (0.76) of the printer paper, illuminance was determined using Lambertian approximation. For instance, at a desk location where Photosphere generated a calibrated luminance of 149 cd/m
2, the computed illuminance was
This process was followed for all the measurement points and the computed values were compared to measured illuminance (631 lux) using a Gigahertz-Optik MSC 15 spectral light meter to assess accuracy.
Figure 10 displays the Gigahertz-Optik MSC 15 spectral light meter and the device interface.
It must be noted that the spectral light meter was chosen to eliminate potential errors due to spectral mismatch, which is especially important for environments/surfaces lit by LED fixtures. This mismatch is compensated by applying a spectral mismatch correction factor (SMCF), usually denoted by “a*” or its inverse F*. Both the Gigahertz-Optik MSC 15 spectral light meter and the Konica Minolta CS-150 luminance color meter are class B meters (f1’ ≤ 4%) as categorized by DIN 5032-7, and, based on the relationship between F* and f1’, a deviation of ±3.20% must be considered for phosphor-based LED measurements [
23,
24]. However, there is little to no literature on SMCFs when fluorescent lighting (present in the studied environment) is involved. The research team moved forward with the assumption that the deviations in measurement due to the spectral filter sensitivity of both meters are minimal for fluorescent sources.
3. Results
The accuracy of the proposed method for calculating illuminance values from HDR images was evaluated through a direct comparison with measured illuminance values. Illuminance values were recorded at the desks, the floor, the whiteboard, and the projector screen, serving as reference points for assessing the method’s reliability. Using the known reflectance of the proxy-Lambertian surface (0.76) and the luminance values extracted from the HDR images, the illuminance was computed and compared to the measured values. To further validate the method, a confidence interval analysis was conducted at a 95% confidence level.
MAPE was used to quantify the accuracy of the HDR-derived illuminance values relative to the measured values. MAPE is a statistical measure that expresses error as a percentage, providing a clear metric for evaluating discrepancies. It is calculated using the following equation:
where E
measured represents the measured illuminance at a given location, E
calculated is the derived illuminance value using Lambertian approximation, and n is the total number of images in the dataset. A lower MAPE value indicates greater accuracy with 10% set as the benchmark for acceptable error in this study [
18,
21,
25].
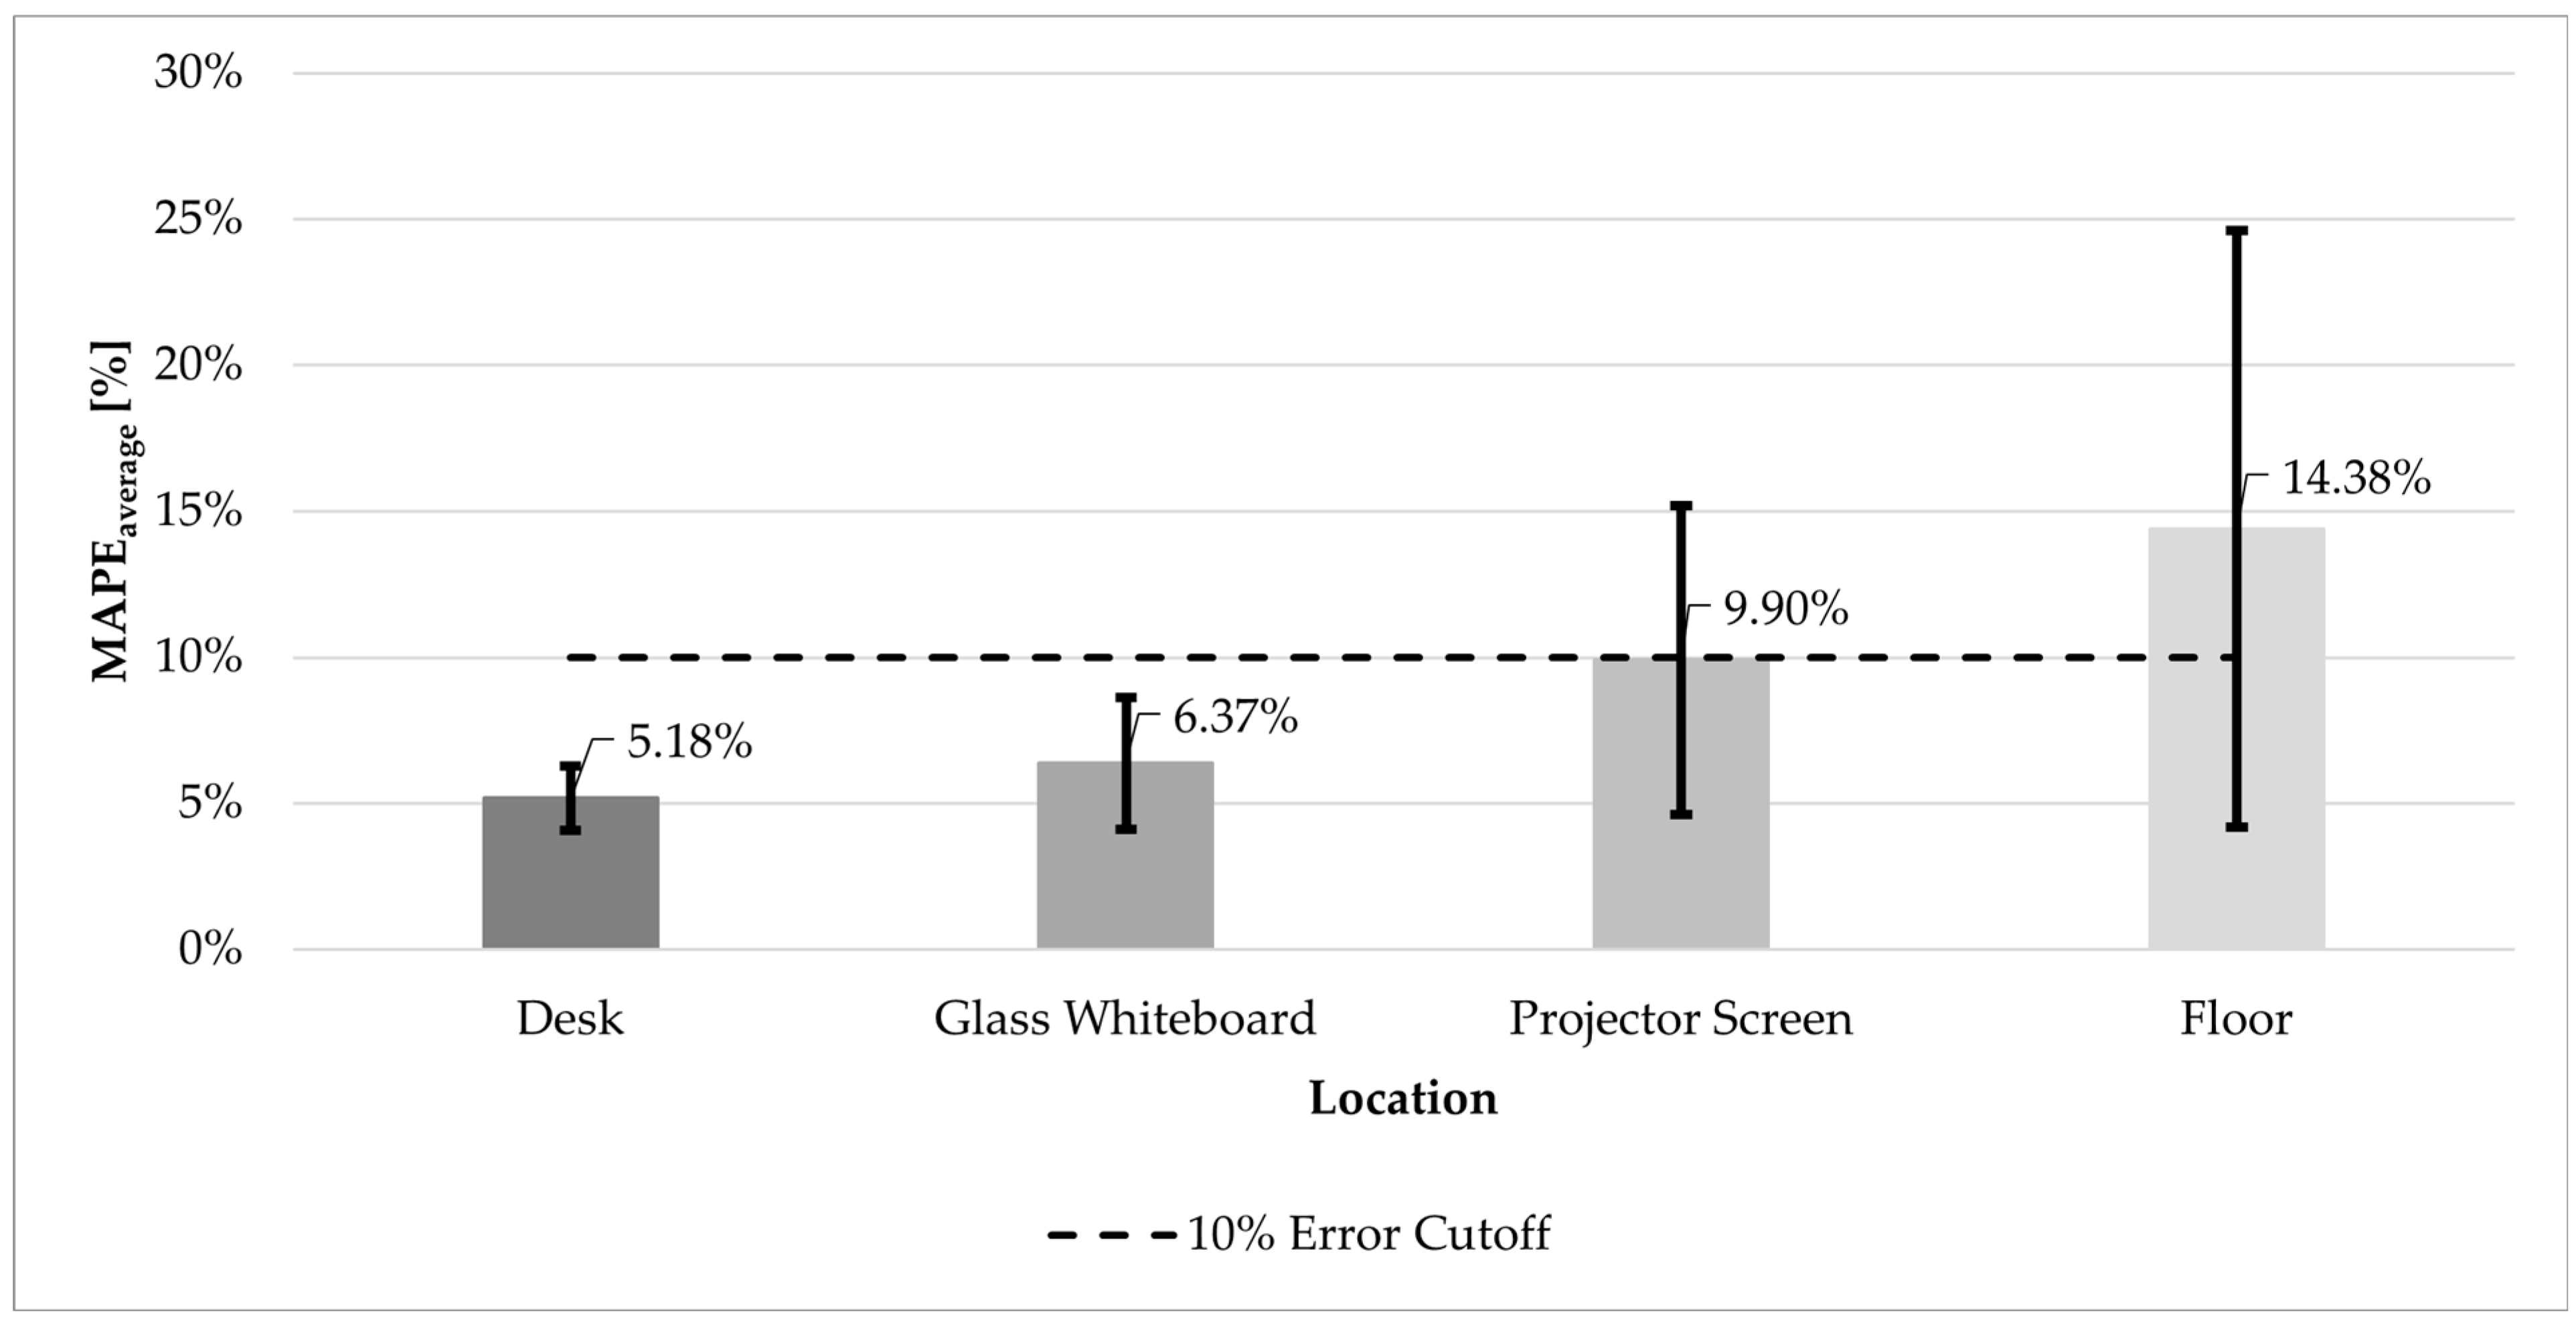
For horizontal surfaces, specifically desks, the average measured illuminance was 579.50 lux, closely matched by the HDR-derived calculations at 576.80 lux, resulting in a MAPE of 5.18% across 24 measurement points. Similarly, for the vertical surface of the glass whiteboard, the measured illuminance averaged 173.40 lux, with the HDR calculations producing a comparable mean of 164.80 lux and an associated MAPE of 6.37% across 10 points.
Higher discrepancies were observed for surfaces deemed to be near-Lambertian and not covered with the proxy-Lambertian material. The projector screen recorded a measured mean illuminance of 184.40 lux but exhibited significant deviations, with HDR calculations averaging 445.70 lux, resulting in a MAPE of 9.90% across five measurement points. The carpeted floor area exhibited the broadest variability, with a measured illuminance of 362.50 lux and the HDR-derived calculations averaging 414.50 lux, yielding a MAPE of 14.38% across three points.
Figure 11,
Figure 12 and
Figure 13 display the results of the MAPE calculations for each studied surface.
Confidence interval analyses at a 95% confidence level indicated relatively low variability for desks (±1.11%) and moderate variability for the whiteboard (±2.26%). However, significantly higher variability was noted for the projector screen (±5.27%) and floor measurements (±10.22%), highlighting the potential need for methodological refinements. The results of the confidence interval analyses are summarized in
Table 5.
5. Conclusions
This study demonstrates the capabilities of HDR imaging and a readily available proxy-Lambertian surface as a practical and accurate method for indoor illuminance measurements with significant implications in the streamlining of traditional post-occupancy evaluation procedures. The results confirm the method’s reliability for horizontal and vertical surfaces—specifically desks and whiteboards—with errors consistently below the 10% acceptance threshold, validating its effectiveness for typical interior lighting assessments. However, the findings highlight increased variability and reduced accuracy for surfaces exhibiting near-Lambertian behavior, such as carpeted flooring and projector screens. These discrepancies suggest that the accuracy of the proposed method depends strongly on the uniformity of the measurement surface reflectance characteristics and emphasizes the importance of employing a suitable proxy-Lambertian surface across all measurement points. Additionally, the proposed method also makes the measurement surfaces agnostic of reflectance patterns—since illuminance is not dependent on surface reflectance, utilizing a proxy-Lambertian surface widens the scope of applicability to surfaces with virtually any kind of reflectance.
The approach presented in this research offers significant practical benefits, including reduced labor, cost, and complexity, compared to conventional manual illuminance measurements. By leveraging commonly available materials and standard photographic equipment, the method can be readily adopted by lighting professionals, facility managers, and researchers.
That being said, the wide-scale applicability of the proposed HDR-based method will depend significantly on the scale of deployment, frequency of assessments, and available resources. For example, in certain practical real-world deployment scenarios, particularly in larger spaces, this paper-based setup may encounter certain logistical challenges, such as the placement of the proxy surfaces and the coverage of the camera field-of-view. While blank printer paper offers simplicity and affordability, its deployment might be cumbersome for such extensive assessments, where mobile lux meters or photometric surveys may traditionally offer quicker, albeit more labor-intensive, solutions.
Future investigations should focus on enhancing the ease of implementation and exploring alternative proxy materials or configurations that simplify large-scale applications, further increasing the practicality and attractiveness of HDR-based illuminance assessments in diverse building environments.


