
Experimental Study on the Seismic Performance of Pre-Inserted Prefabricated Shear Walls


Abstract
1. Introduction
2. Experimental Overview
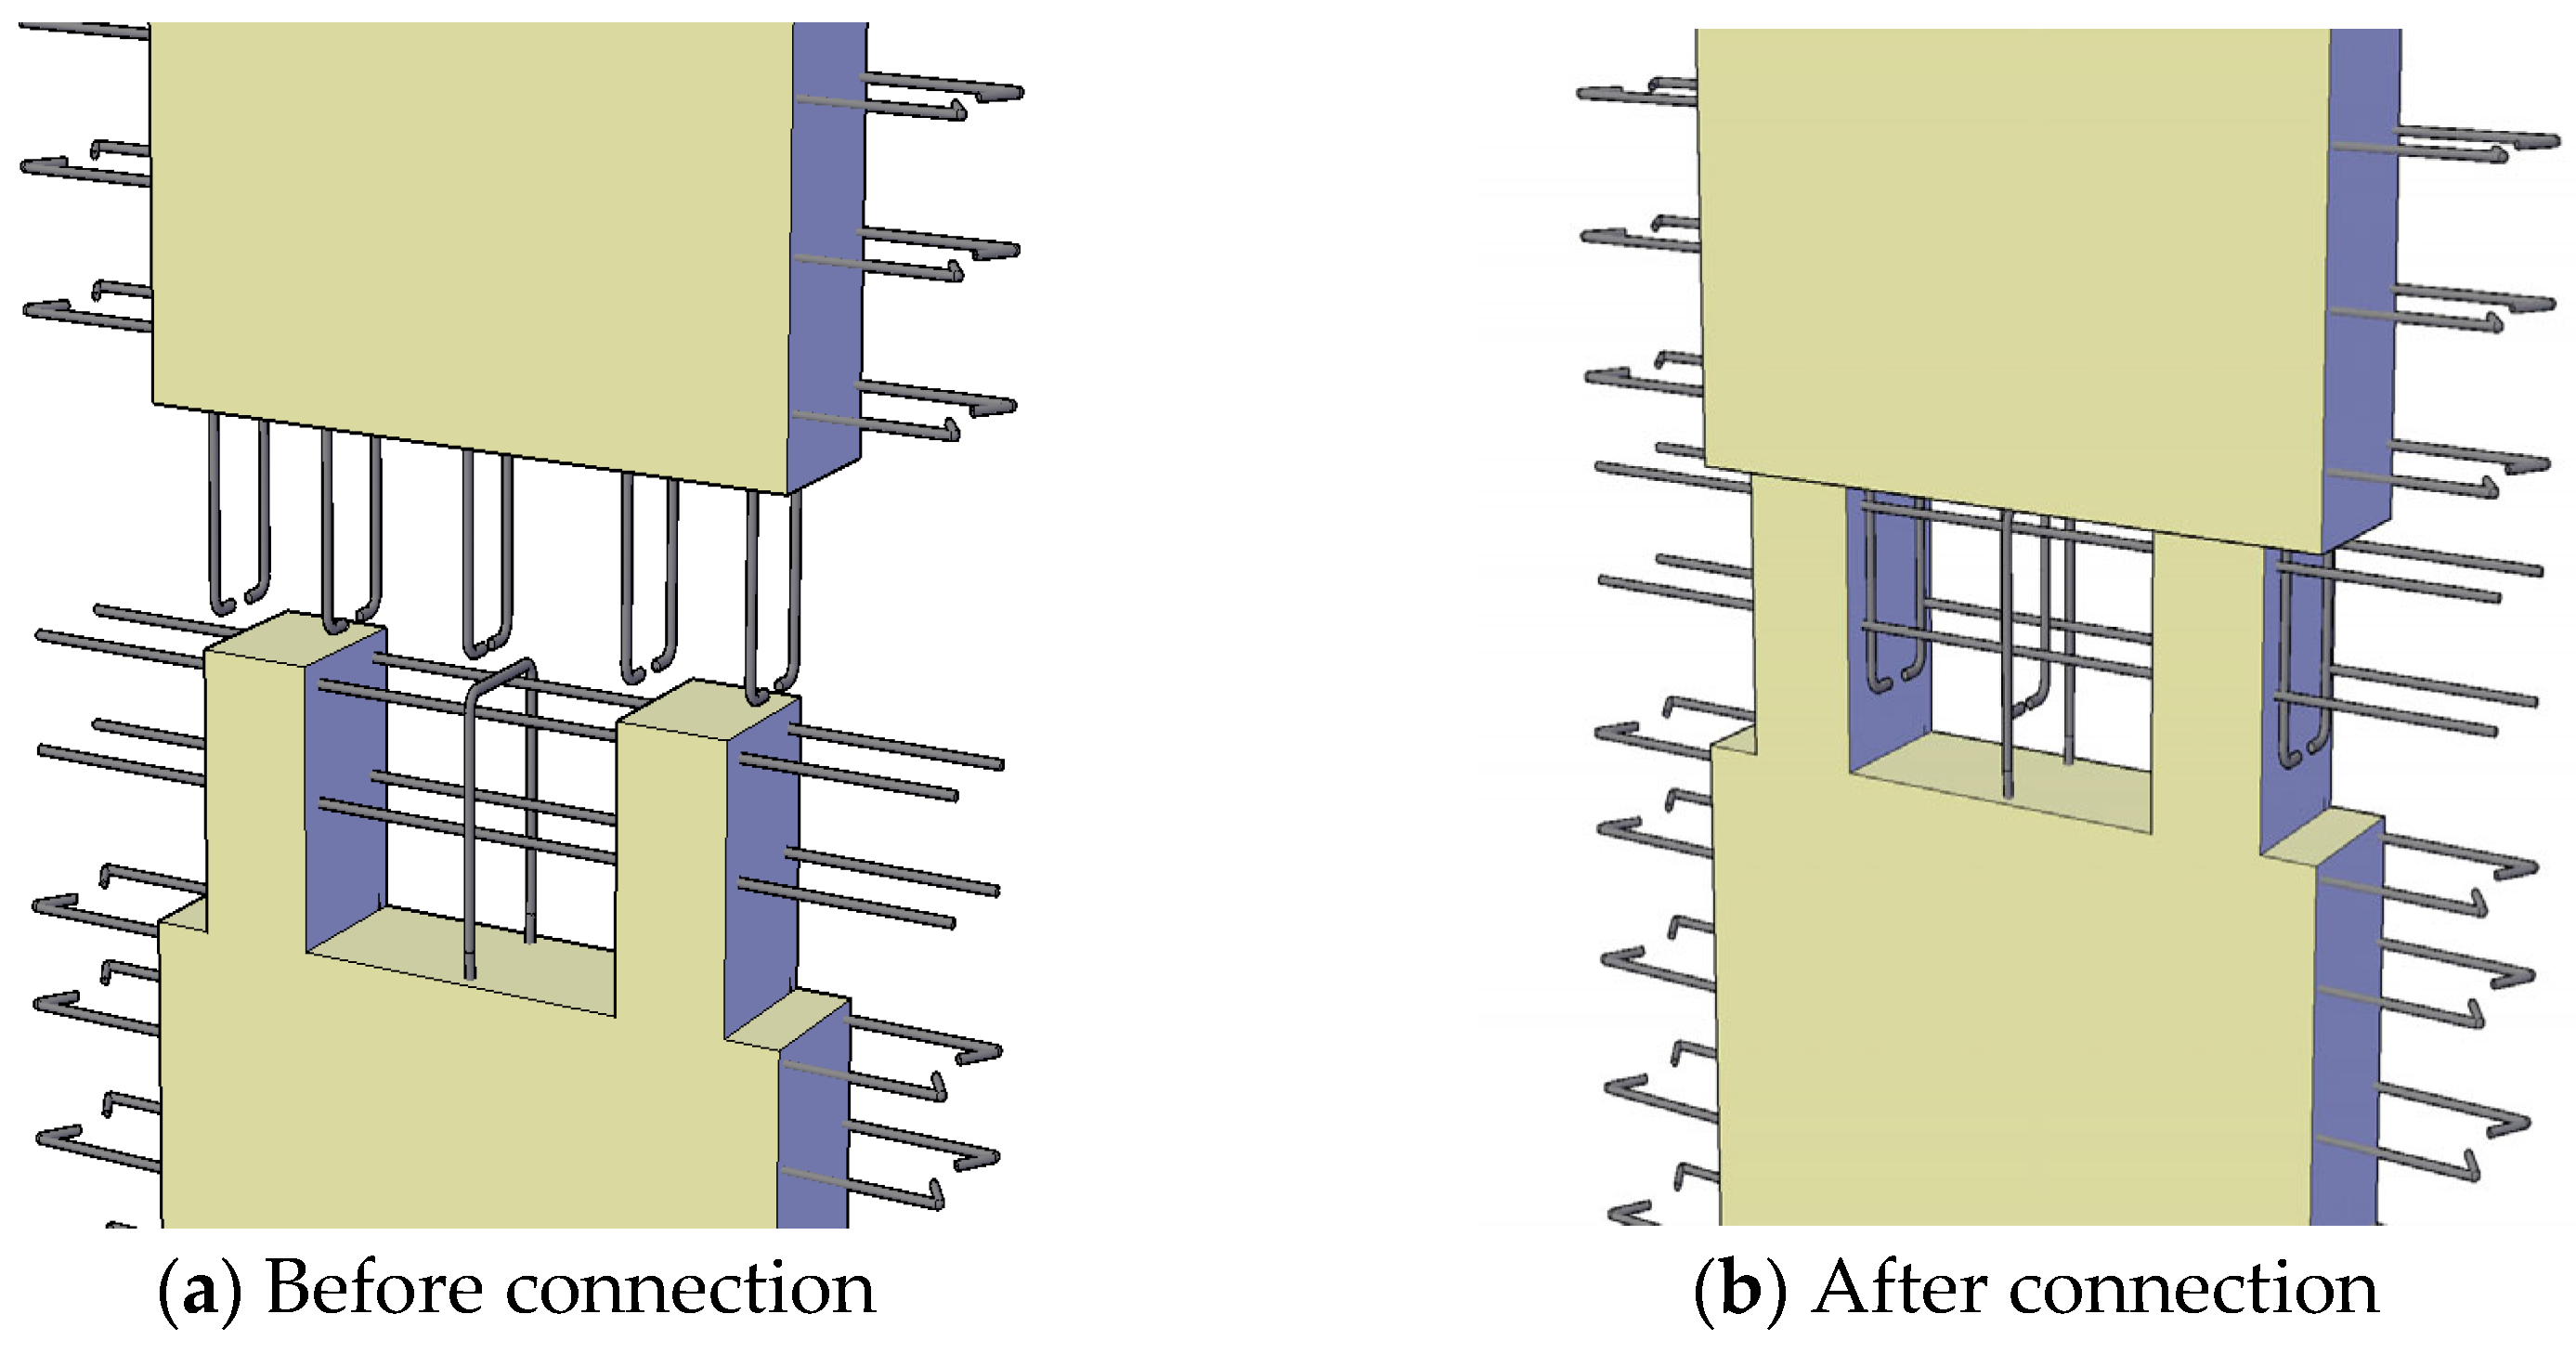
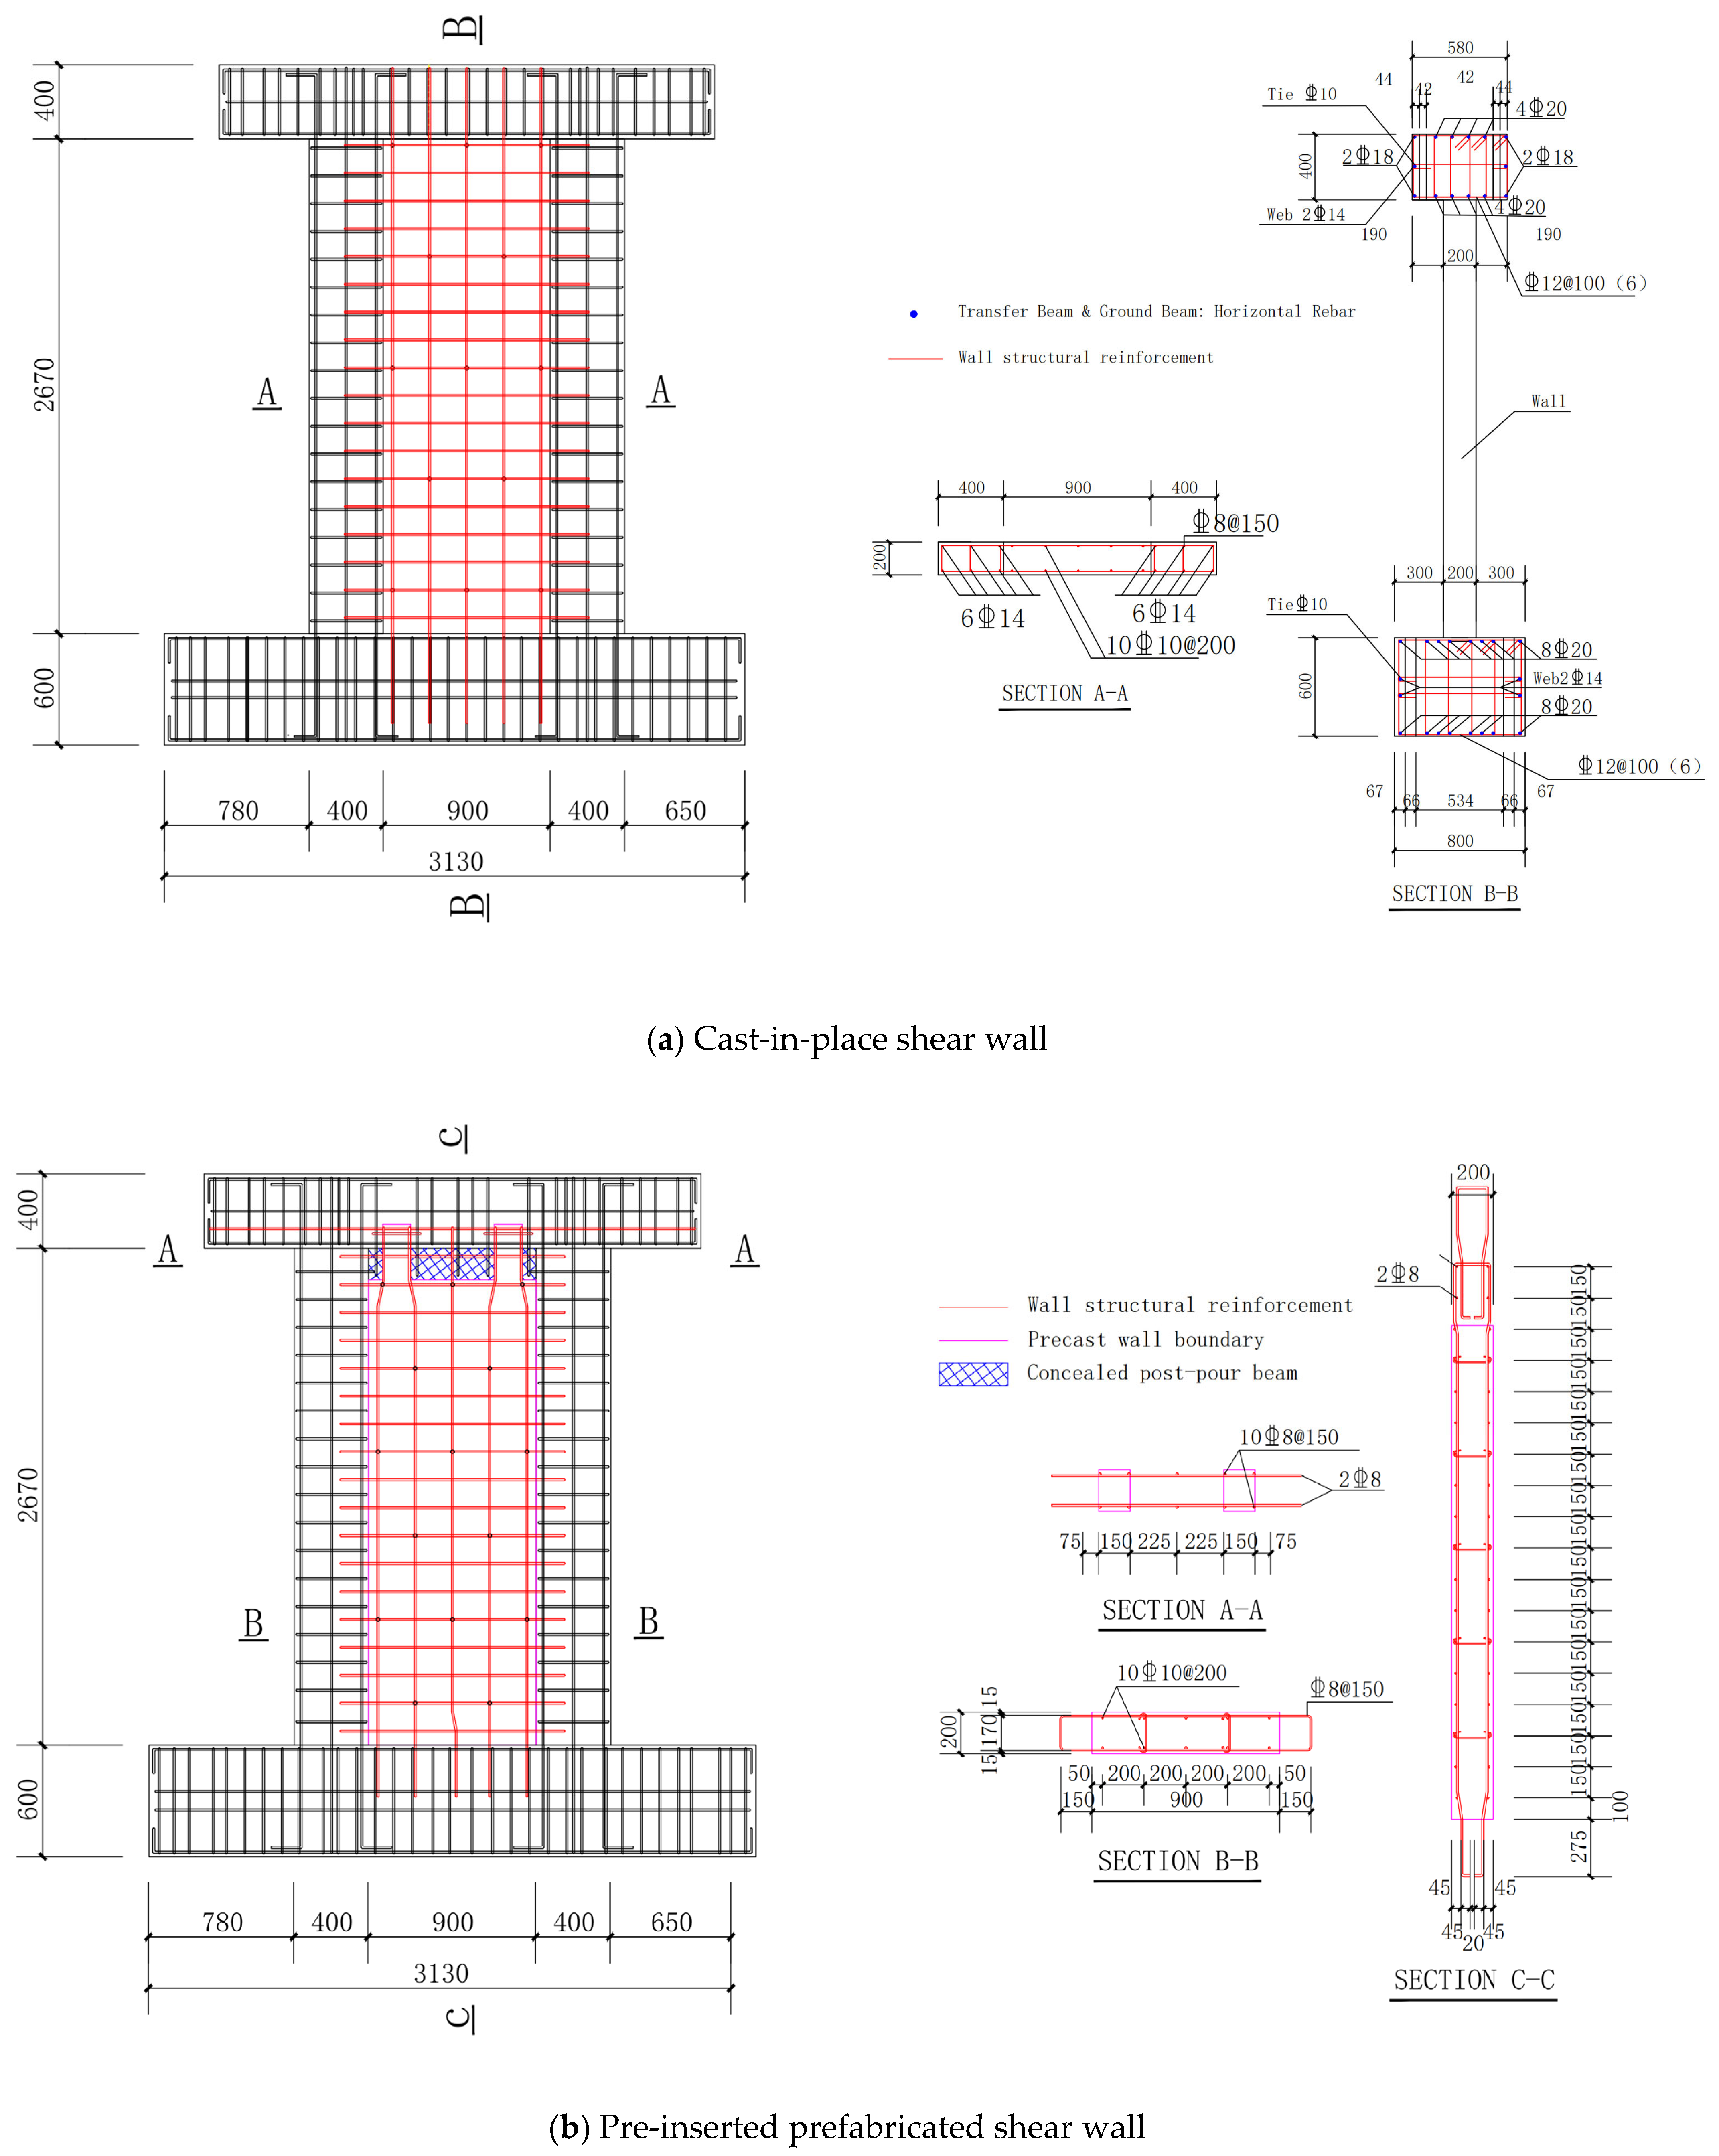
2.1. Specimen Design
2.2. Material Mechanical Properties
2.3. Loading Apparatus and Loading Protocol
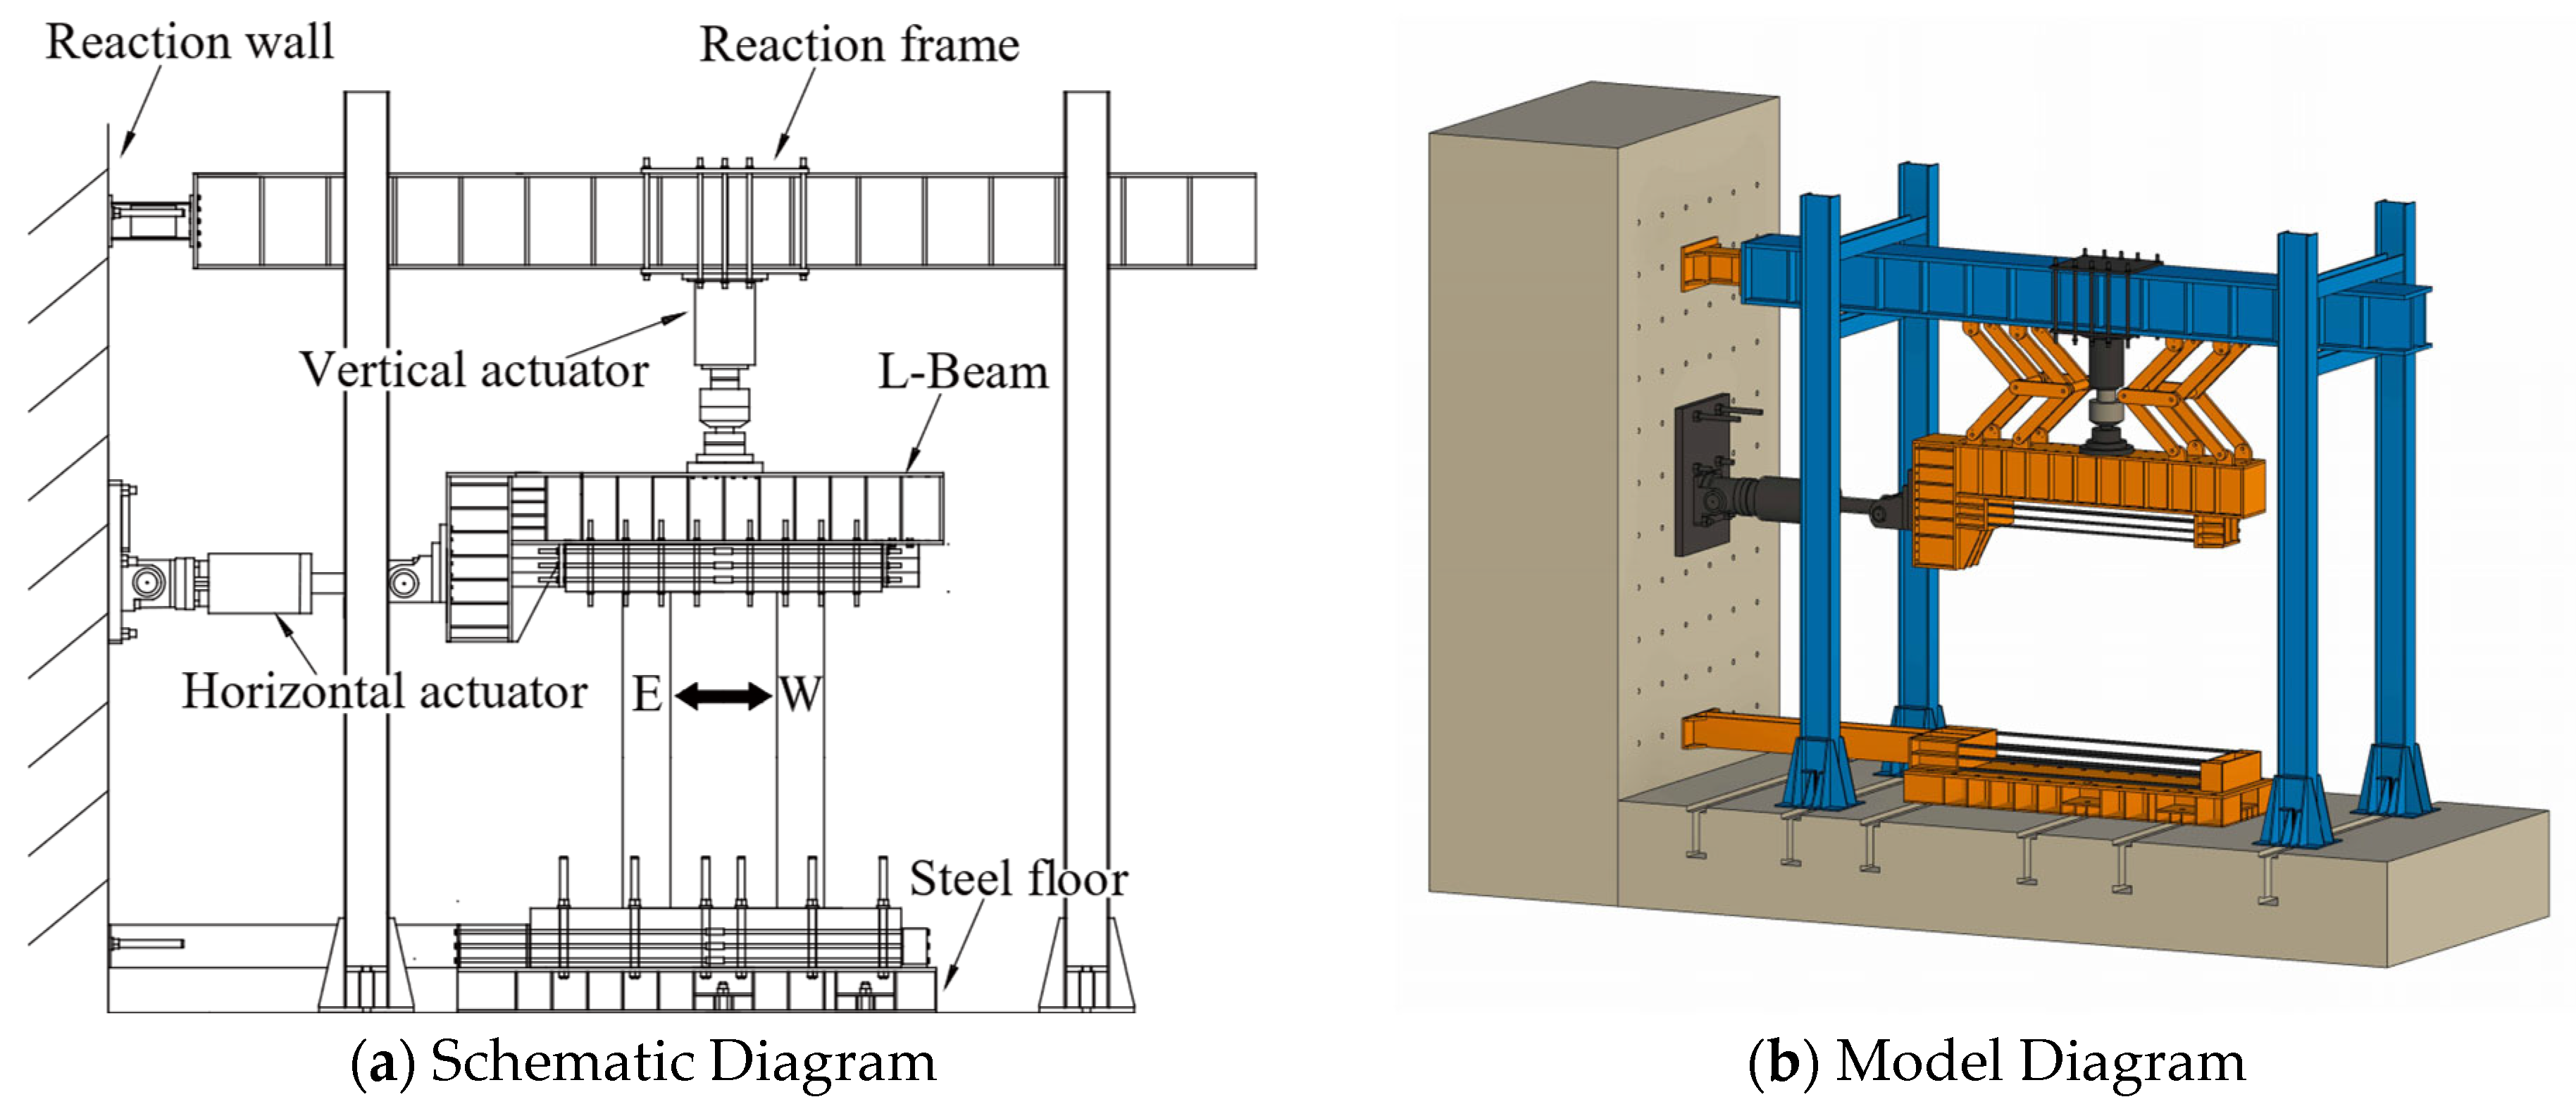
2.3.1. Loading Apparatus
2.3.2. Loading Protocol
- Preloading: A preload not exceeding 10% of the specimen’s yield load was applied to verify the proper functioning of all instrumentation. Following preloading, the instruments were calibrated, and initial readings were recorded.
- Formal loading: The vertical load was first applied according to the design axial compression ratio and maintained constant. Subsequently, horizontal low-cycle reversed loading was implemented. The loading protocol employed a force–displacement hybrid control method as illustrated in Figure 4, where the force-controlled phase consisted of five incremental loading steps up to the estimated yield load Py with one cycle per step, while the estimated yield displacement Δy and displacement increment Δ0 for the displacement-controlled phase were determined based on experimental observations. During the displacement-controlled phase, the displacement amplitude was incrementally increased by Δ0 at each loading step, with three complete loading cycles performed per displacement level.
- The specimen is considered to have failed, and loading is stopped, when its bearing capacity drops to 80% of the peak load or when it can no longer sustain the applied load.
2.3.3. Different Damage States
- Initial cracking state: First visible cracks (crack width typically ≤0.1 mm).
- Reinforcement yielding state: Steel bars yield (strain of outermost reinforcement εy ≈ 0.002).
- Peak load state: Maximum load-bearing capacity (ultimate strength reached).
- Post-peak degradation state: Strength deterioration (load drops below 85% of peak load).
- Ultimate failure state: Concrete crushing (spalling of confined edge concrete or buckling of longitudinal reinforcement).
3. Results and Phenomenological Section
3.1. Test Phenomena and Failure Modes
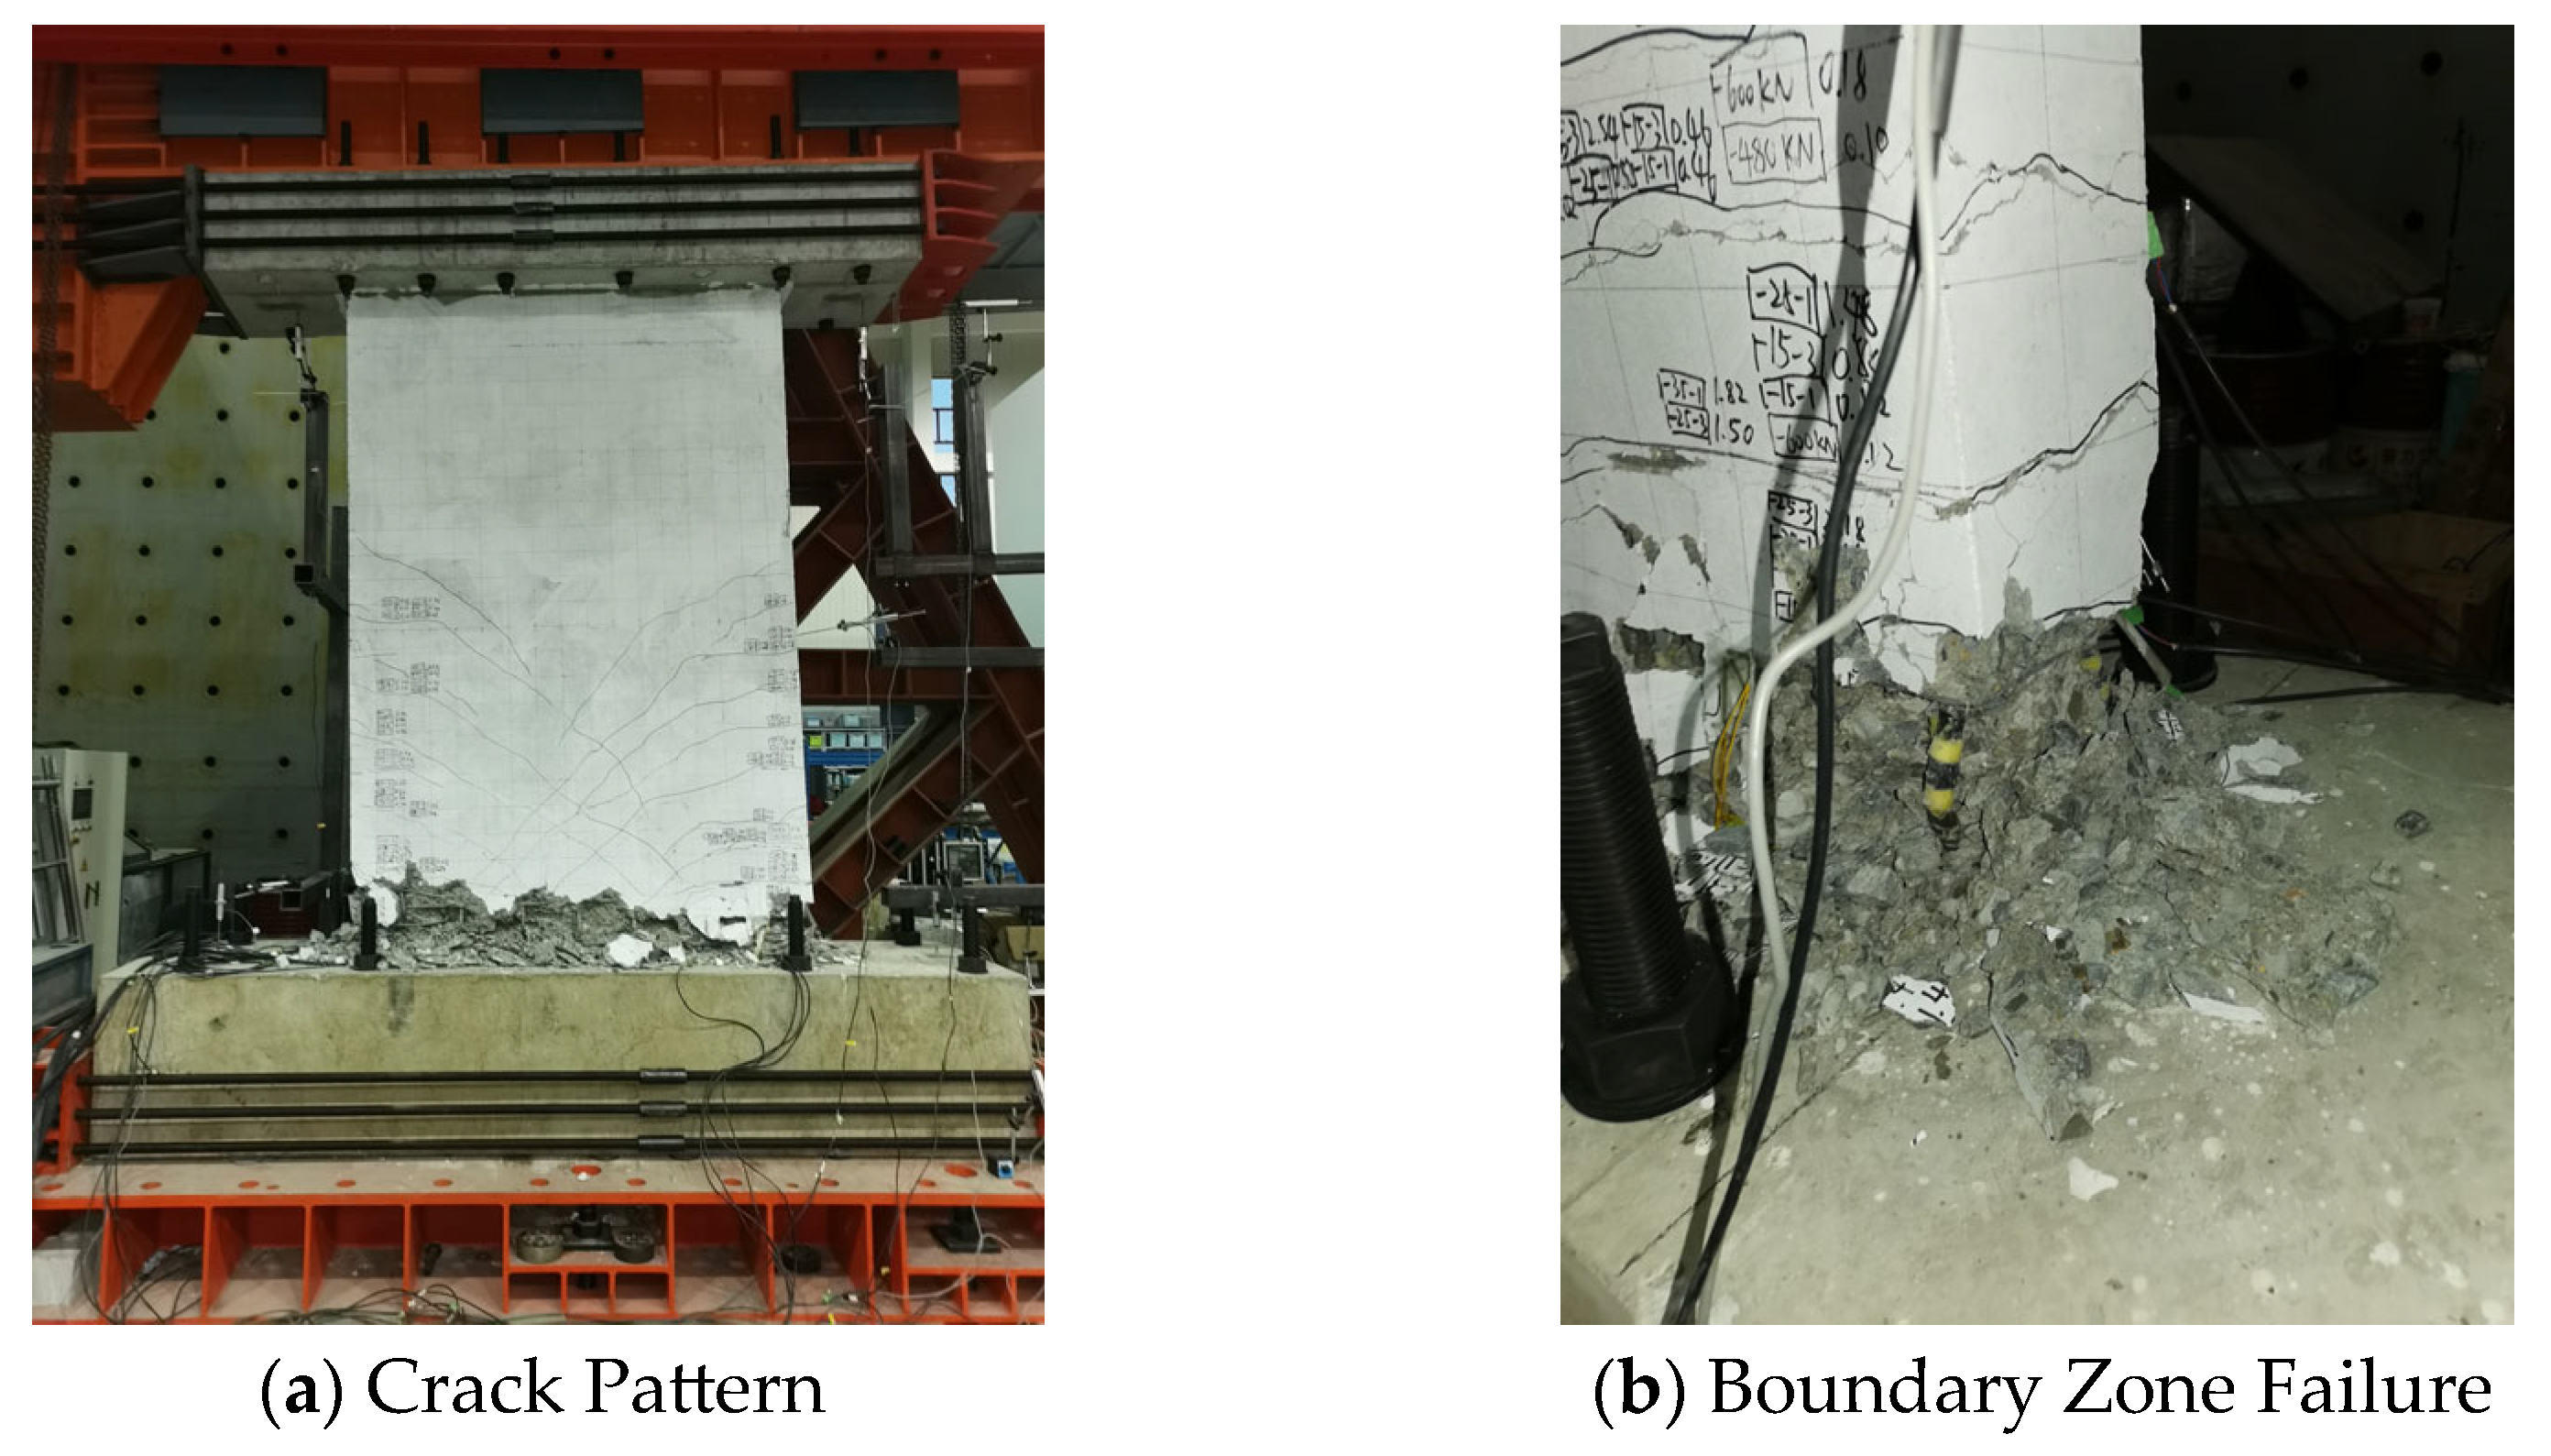
3.1.1. CSW-0.2
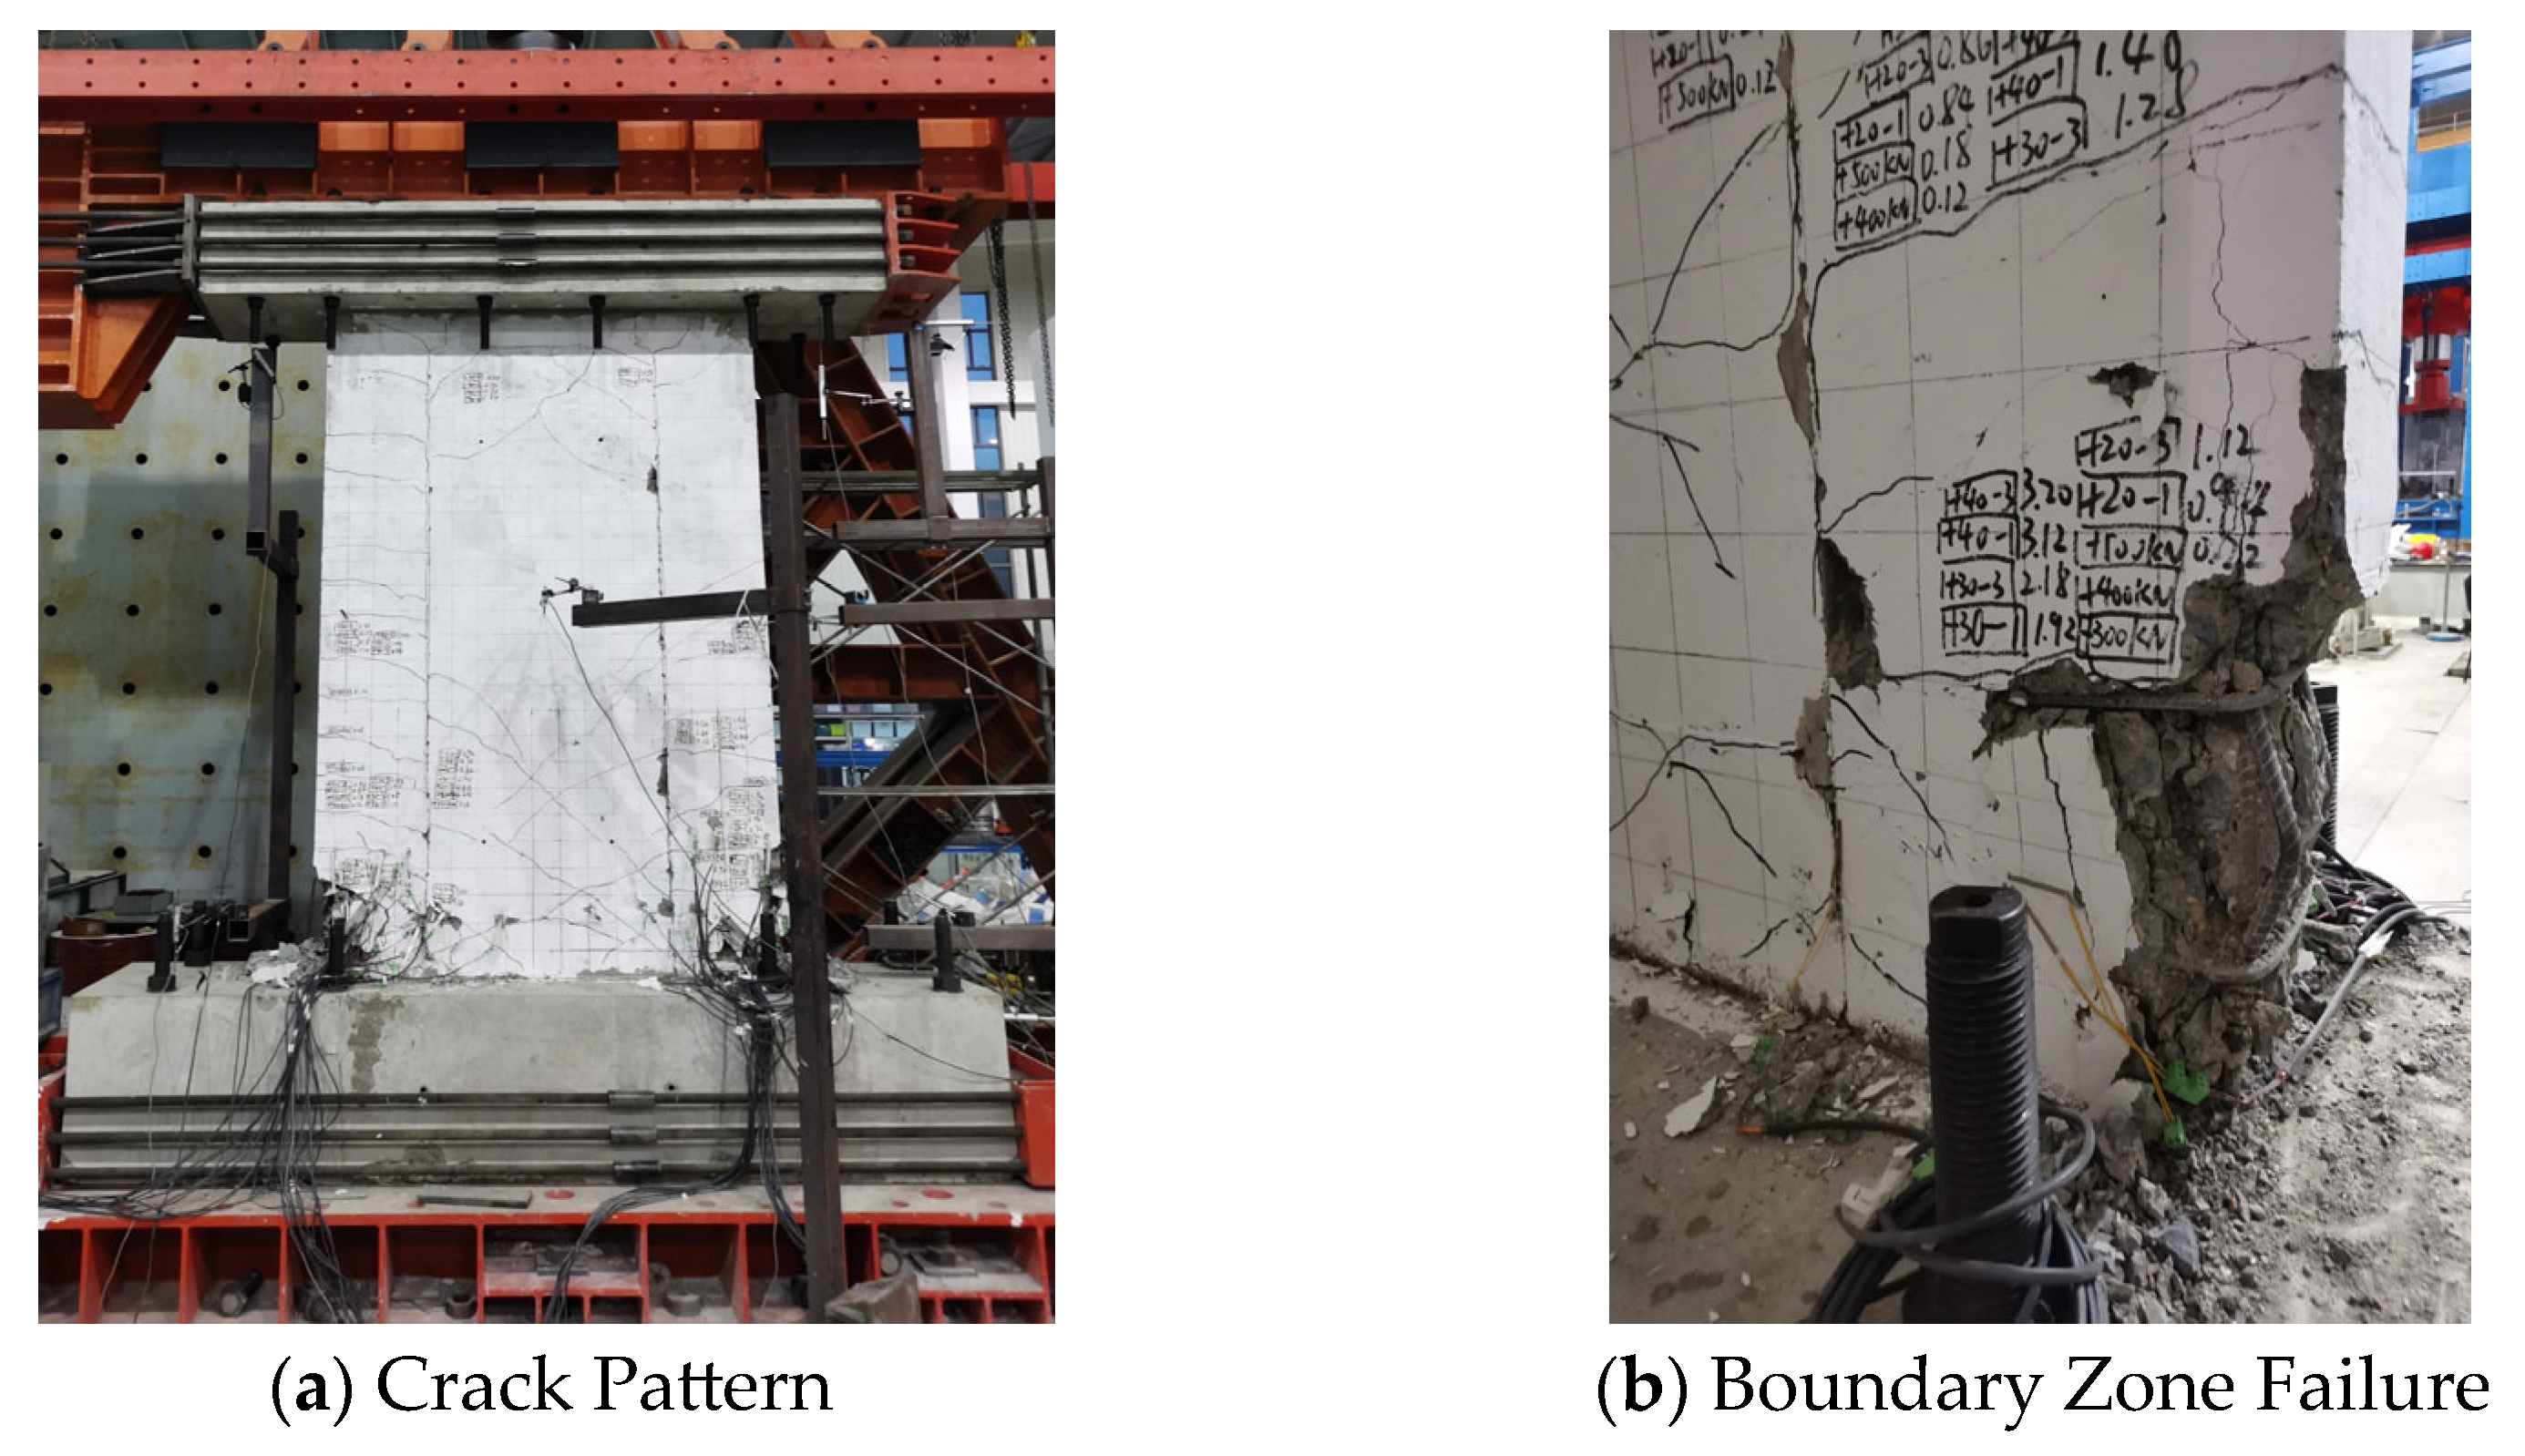
3.1.2. CSW-0.4
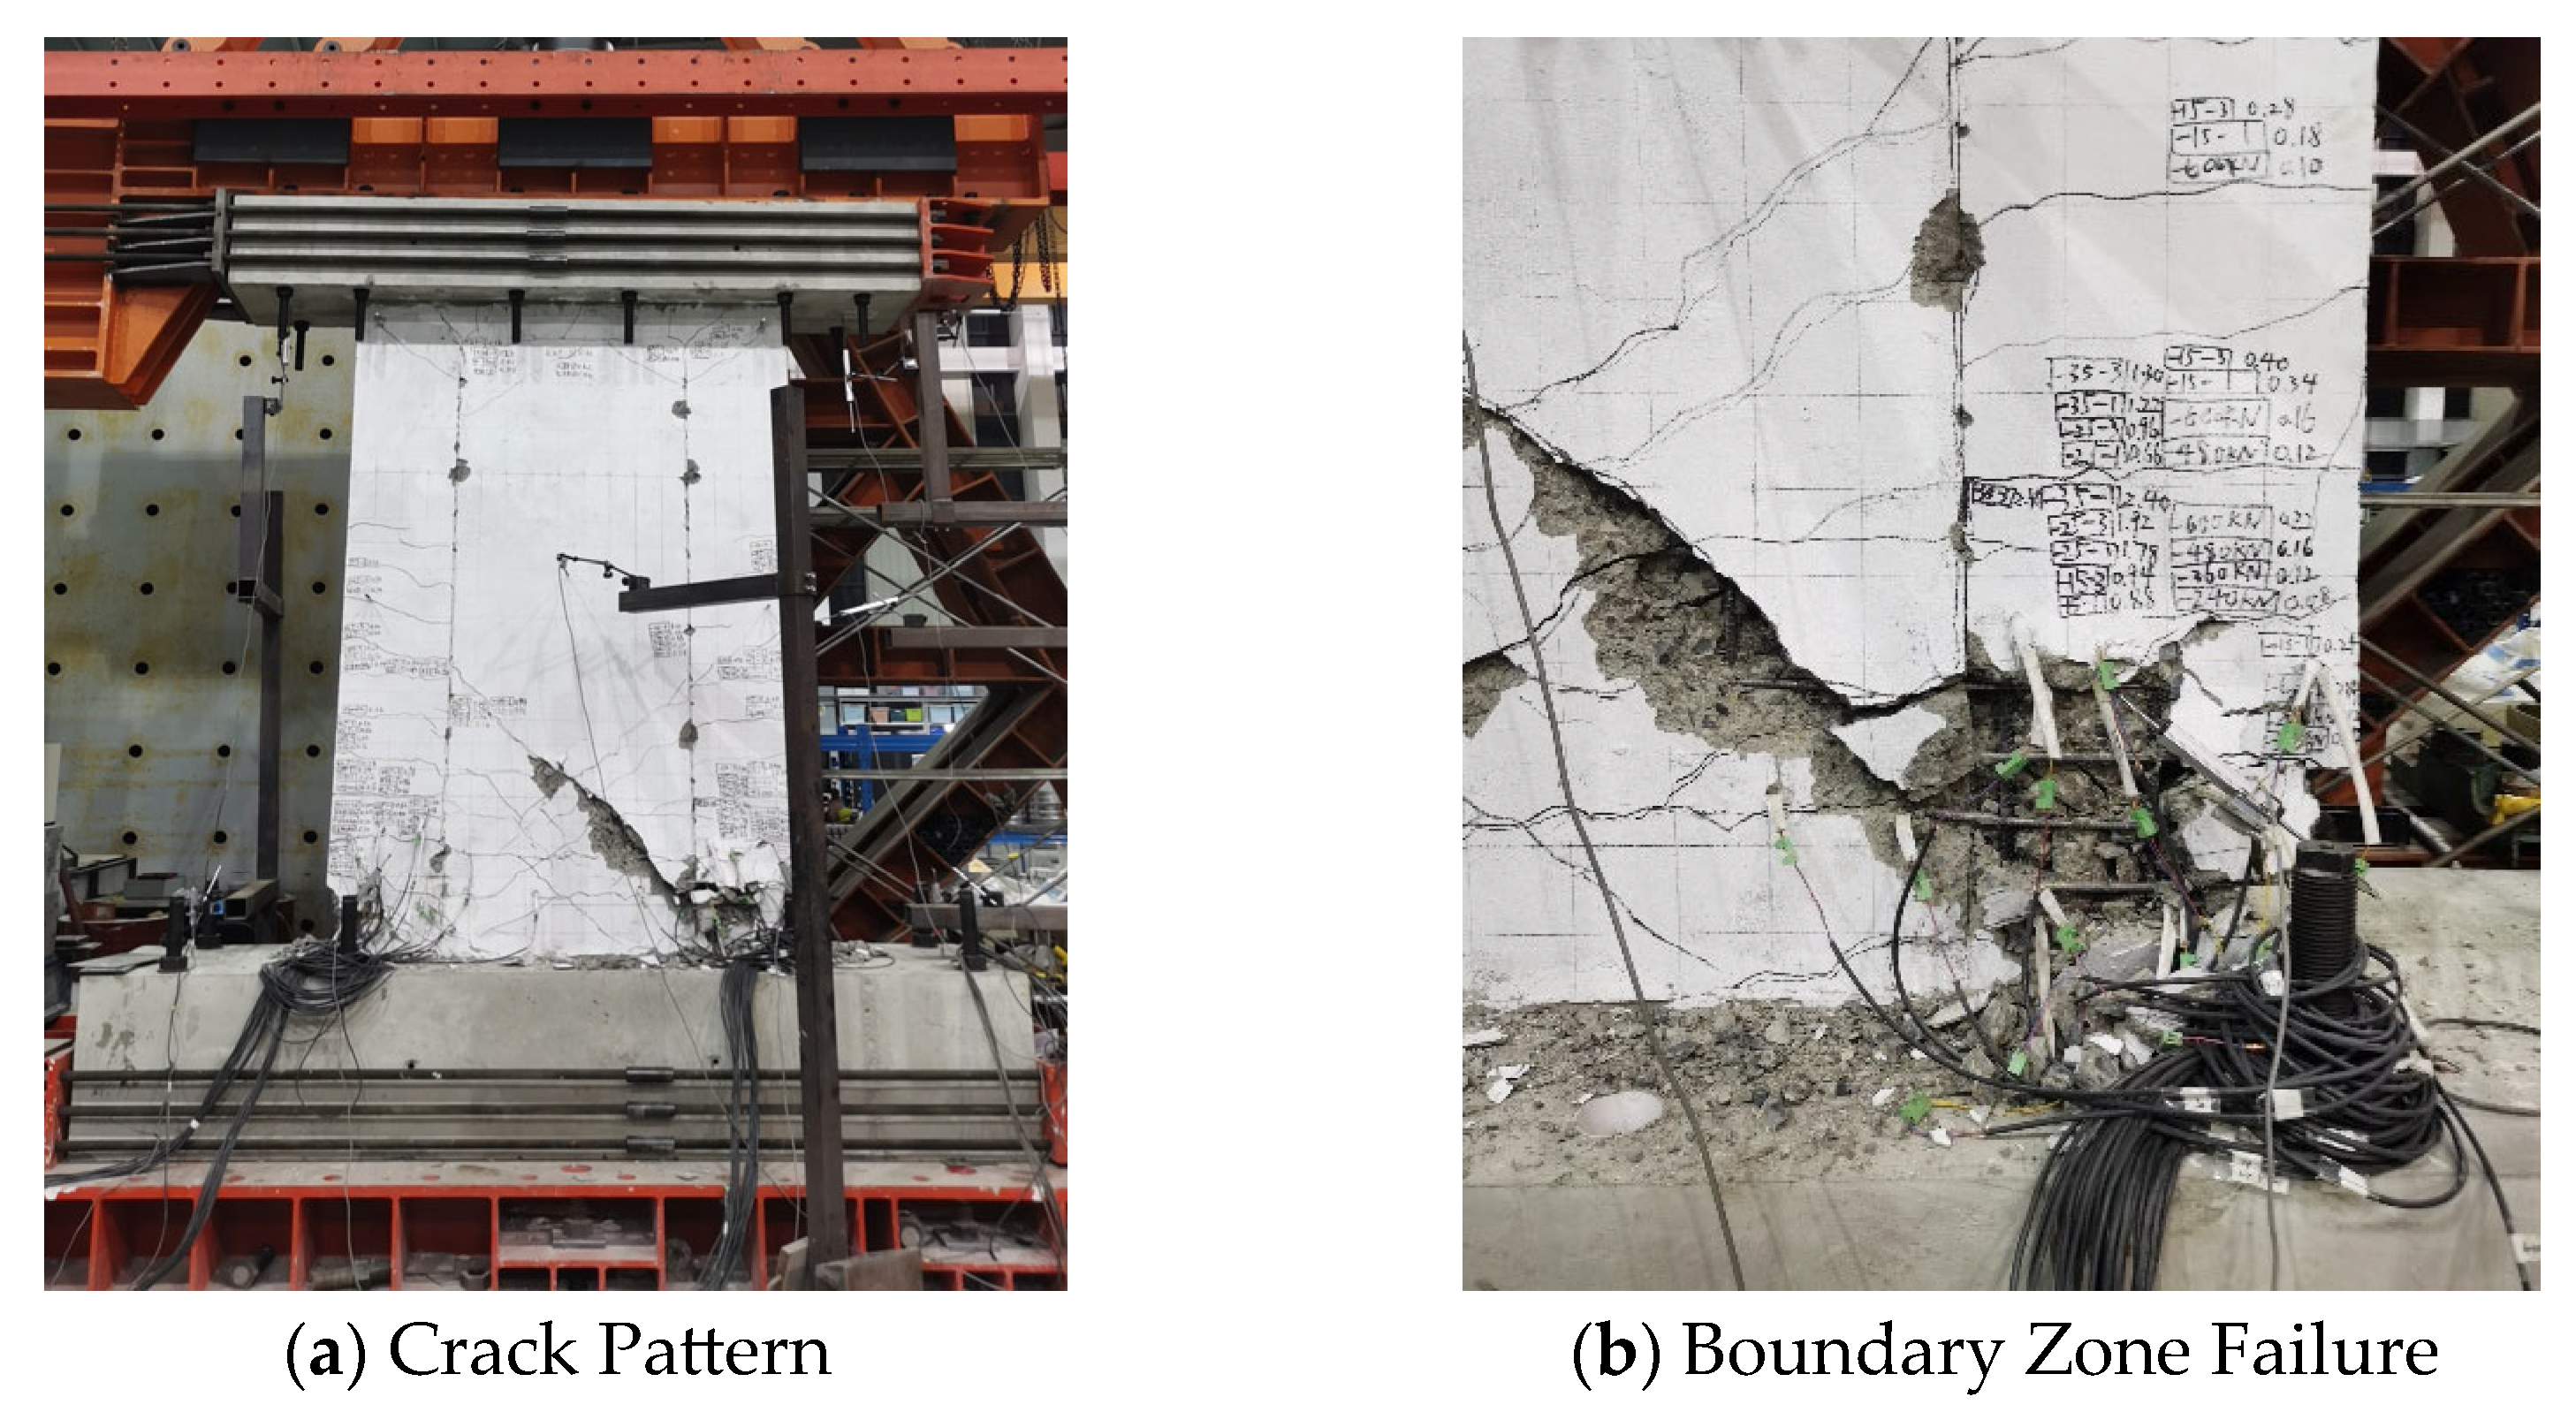
3.1.3. PPW-0.2
3.1.4. PPW-0.4
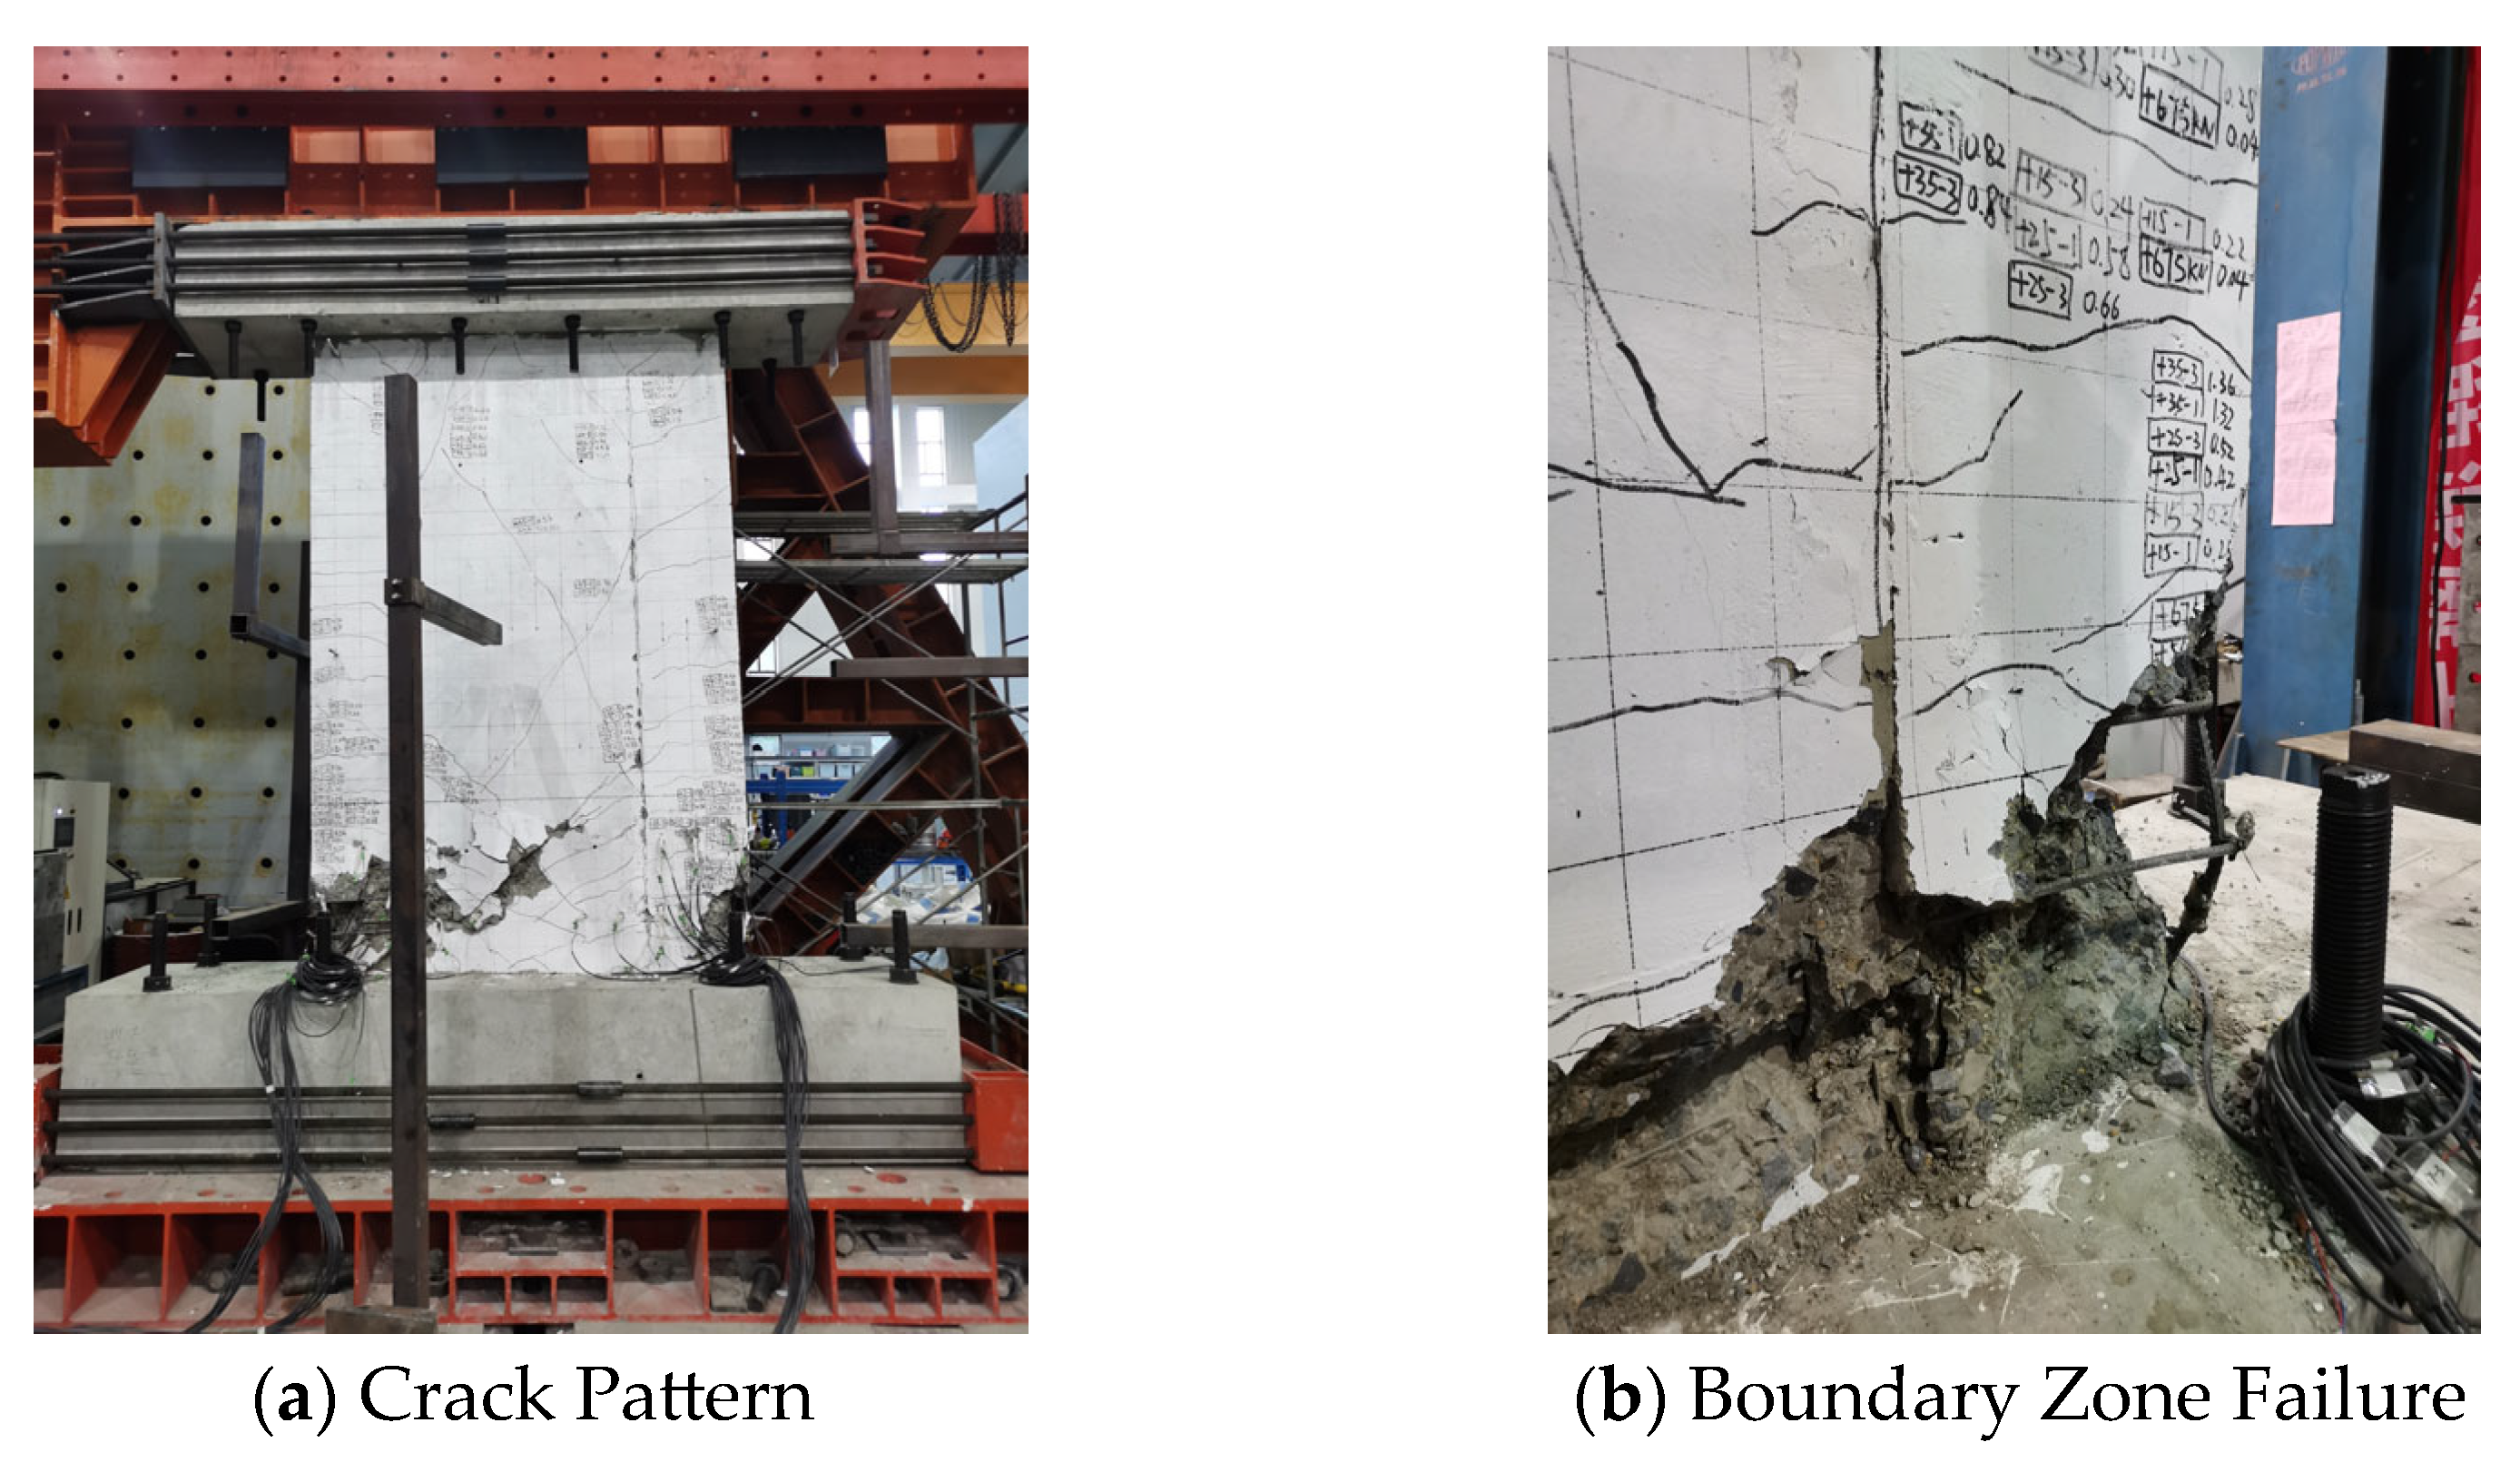
3.1.5. PPW-0.5
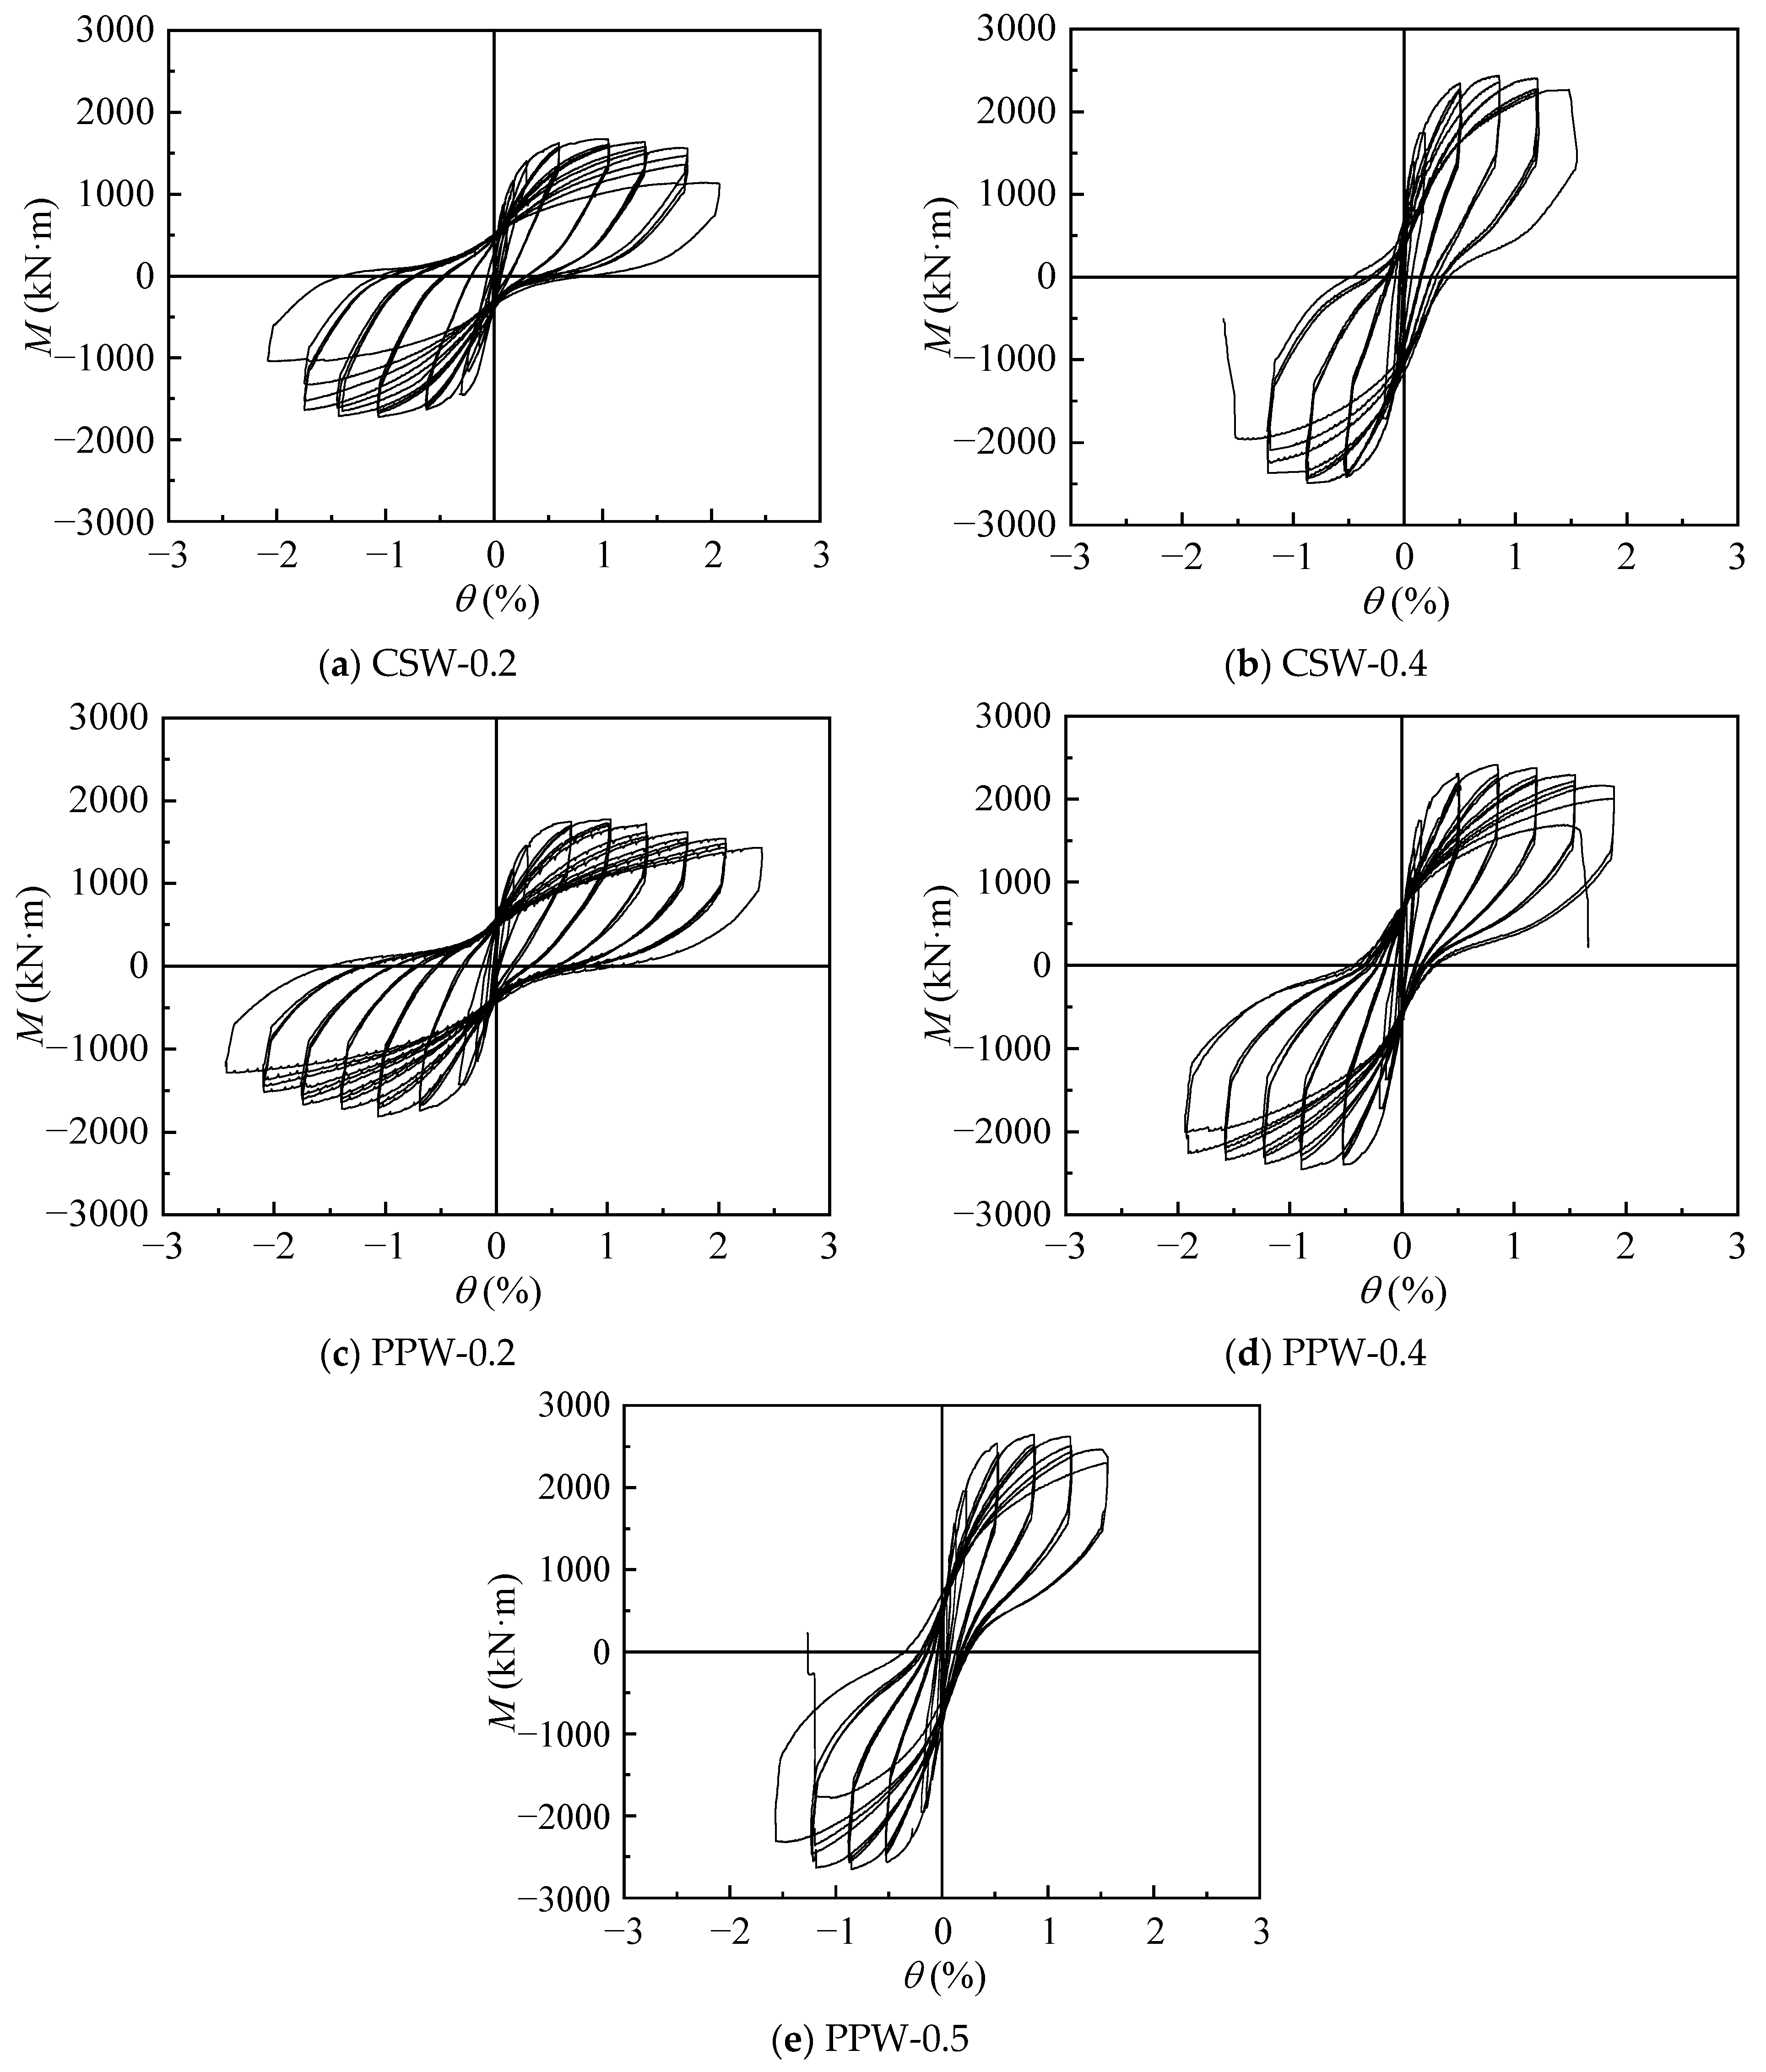
3.2. Hysteretic Behavior
3.3. Bearing Capacity and Ductility Analysis
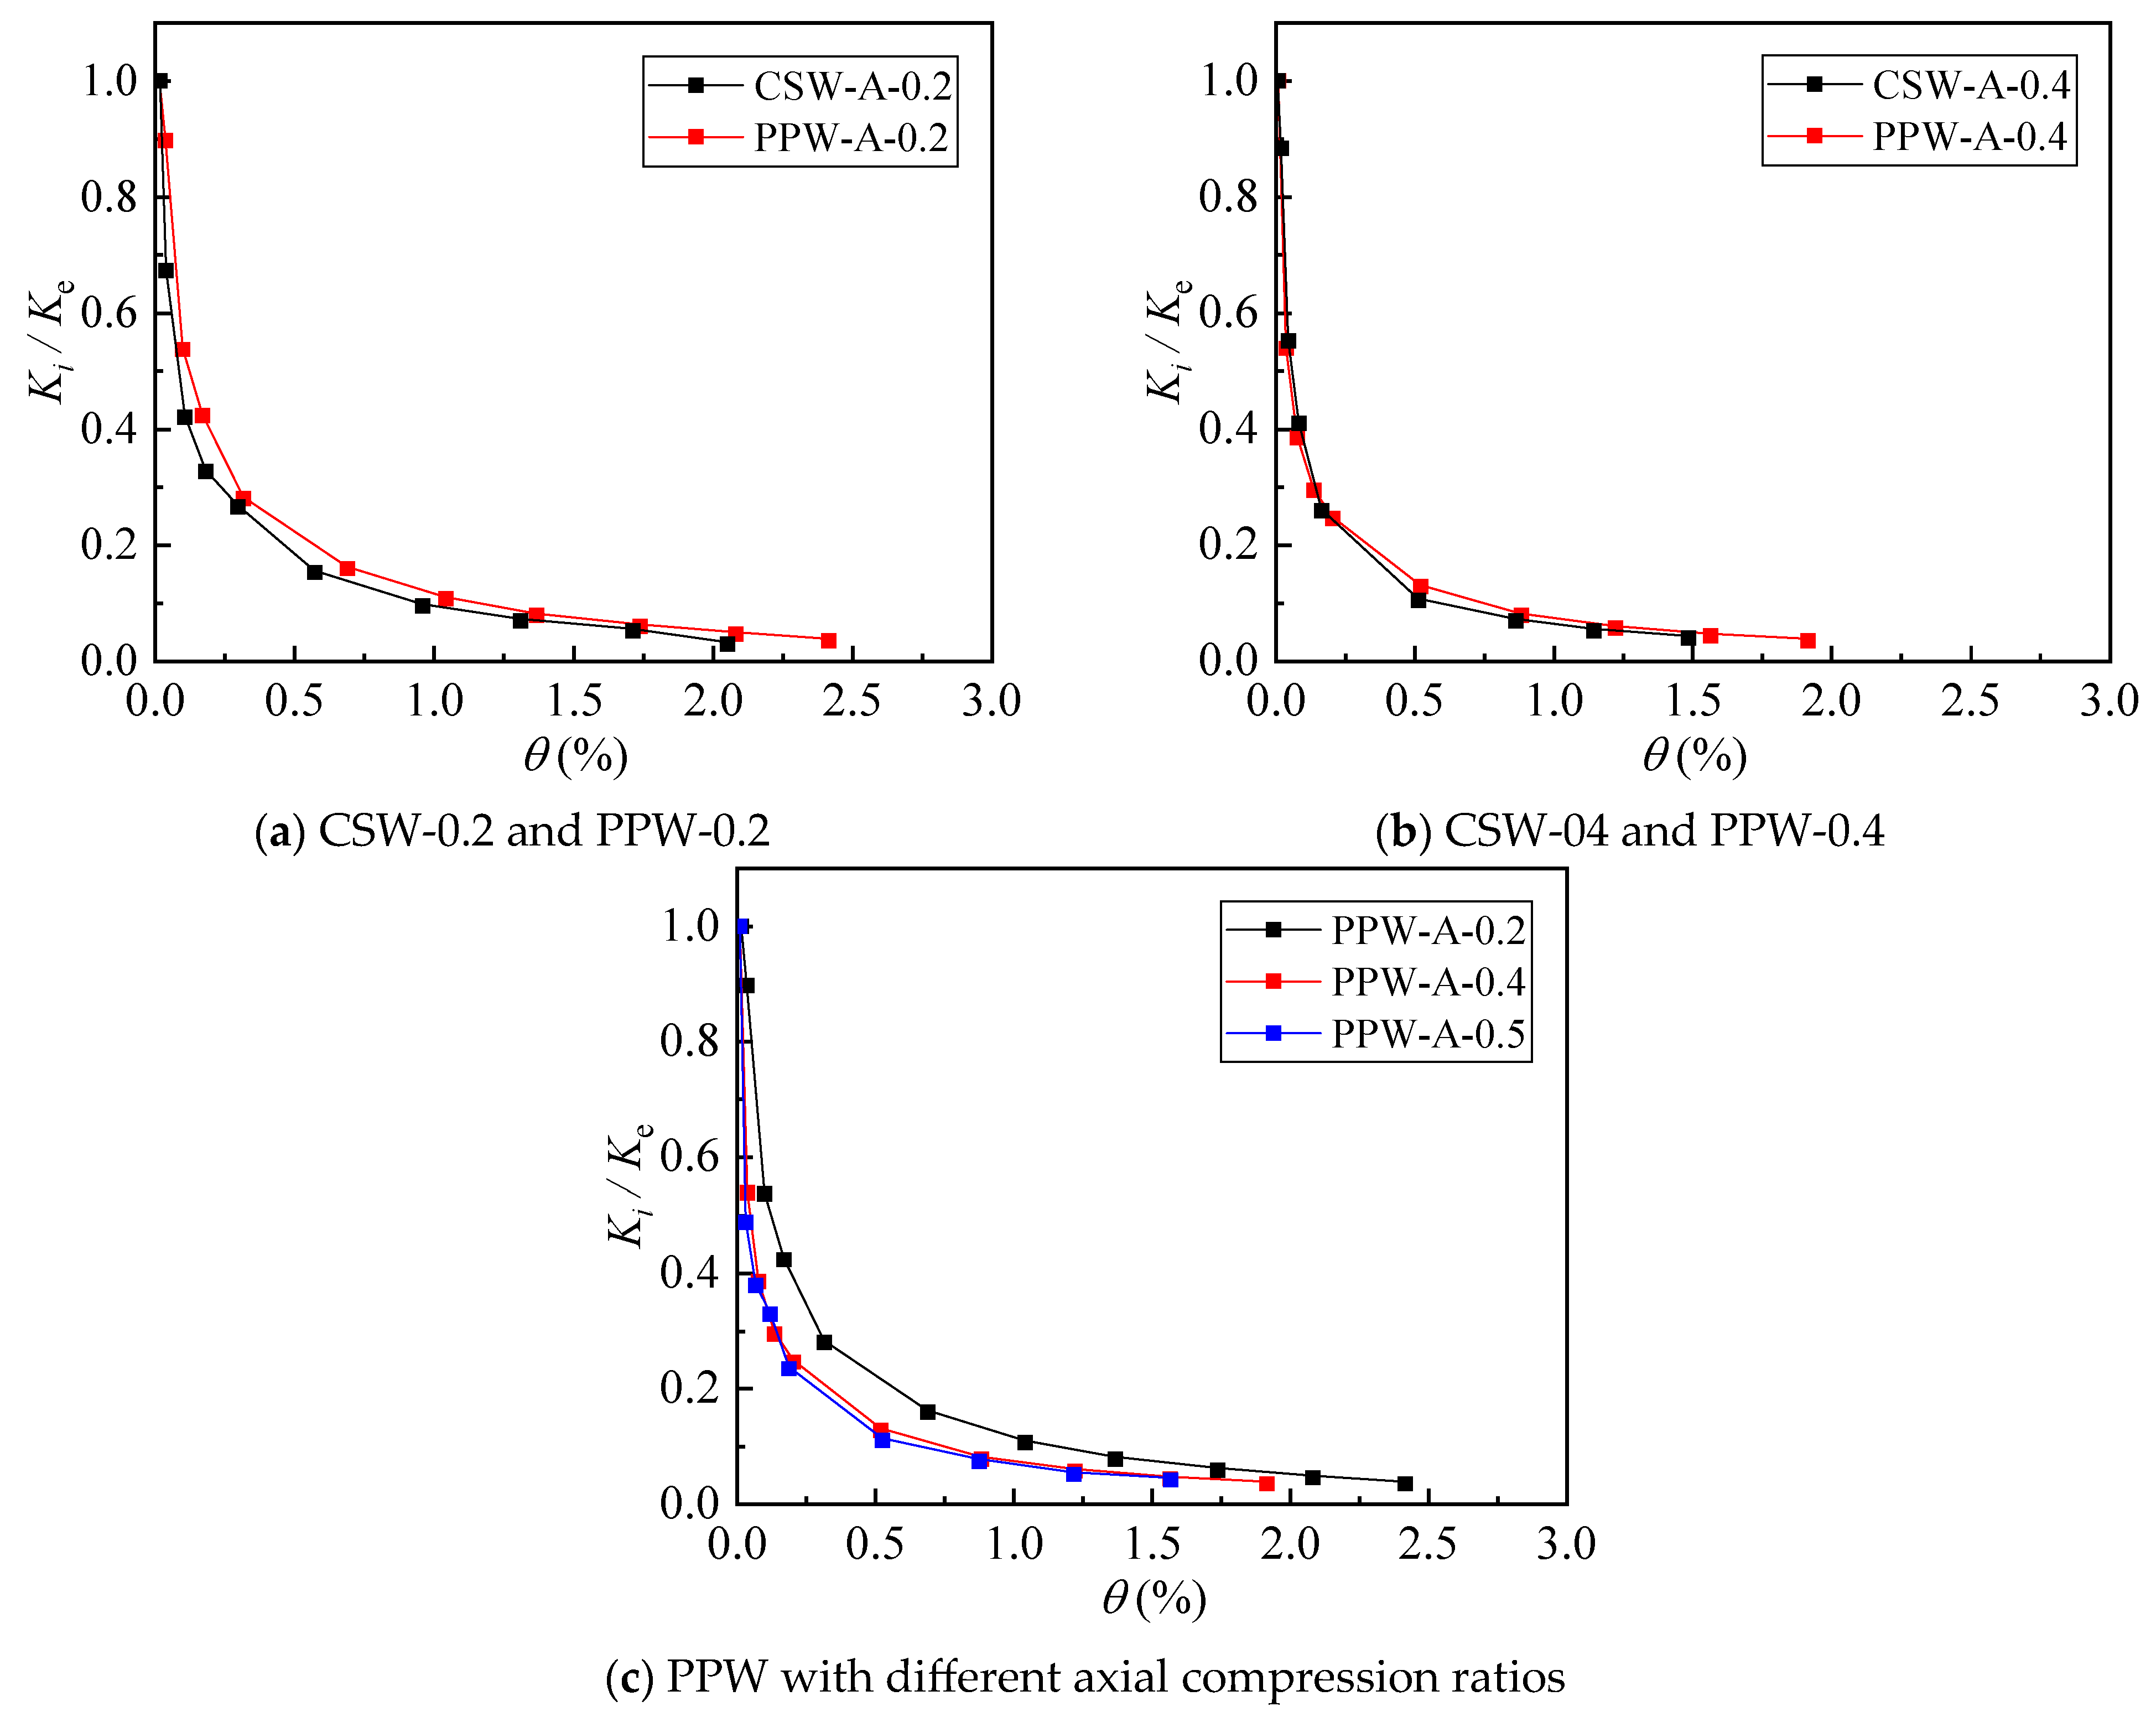
3.4. Stiffness Degradation Analysis
- Ki = secant stiffness at the i-th level of cyclic loading (kN/mm).
- Pi = peak load value of the i-th loading cycle (kN).
- Δi = displacement corresponding to the peak load point of the i-th cycle (mm).
3.5. Energy Dissipation Capacity
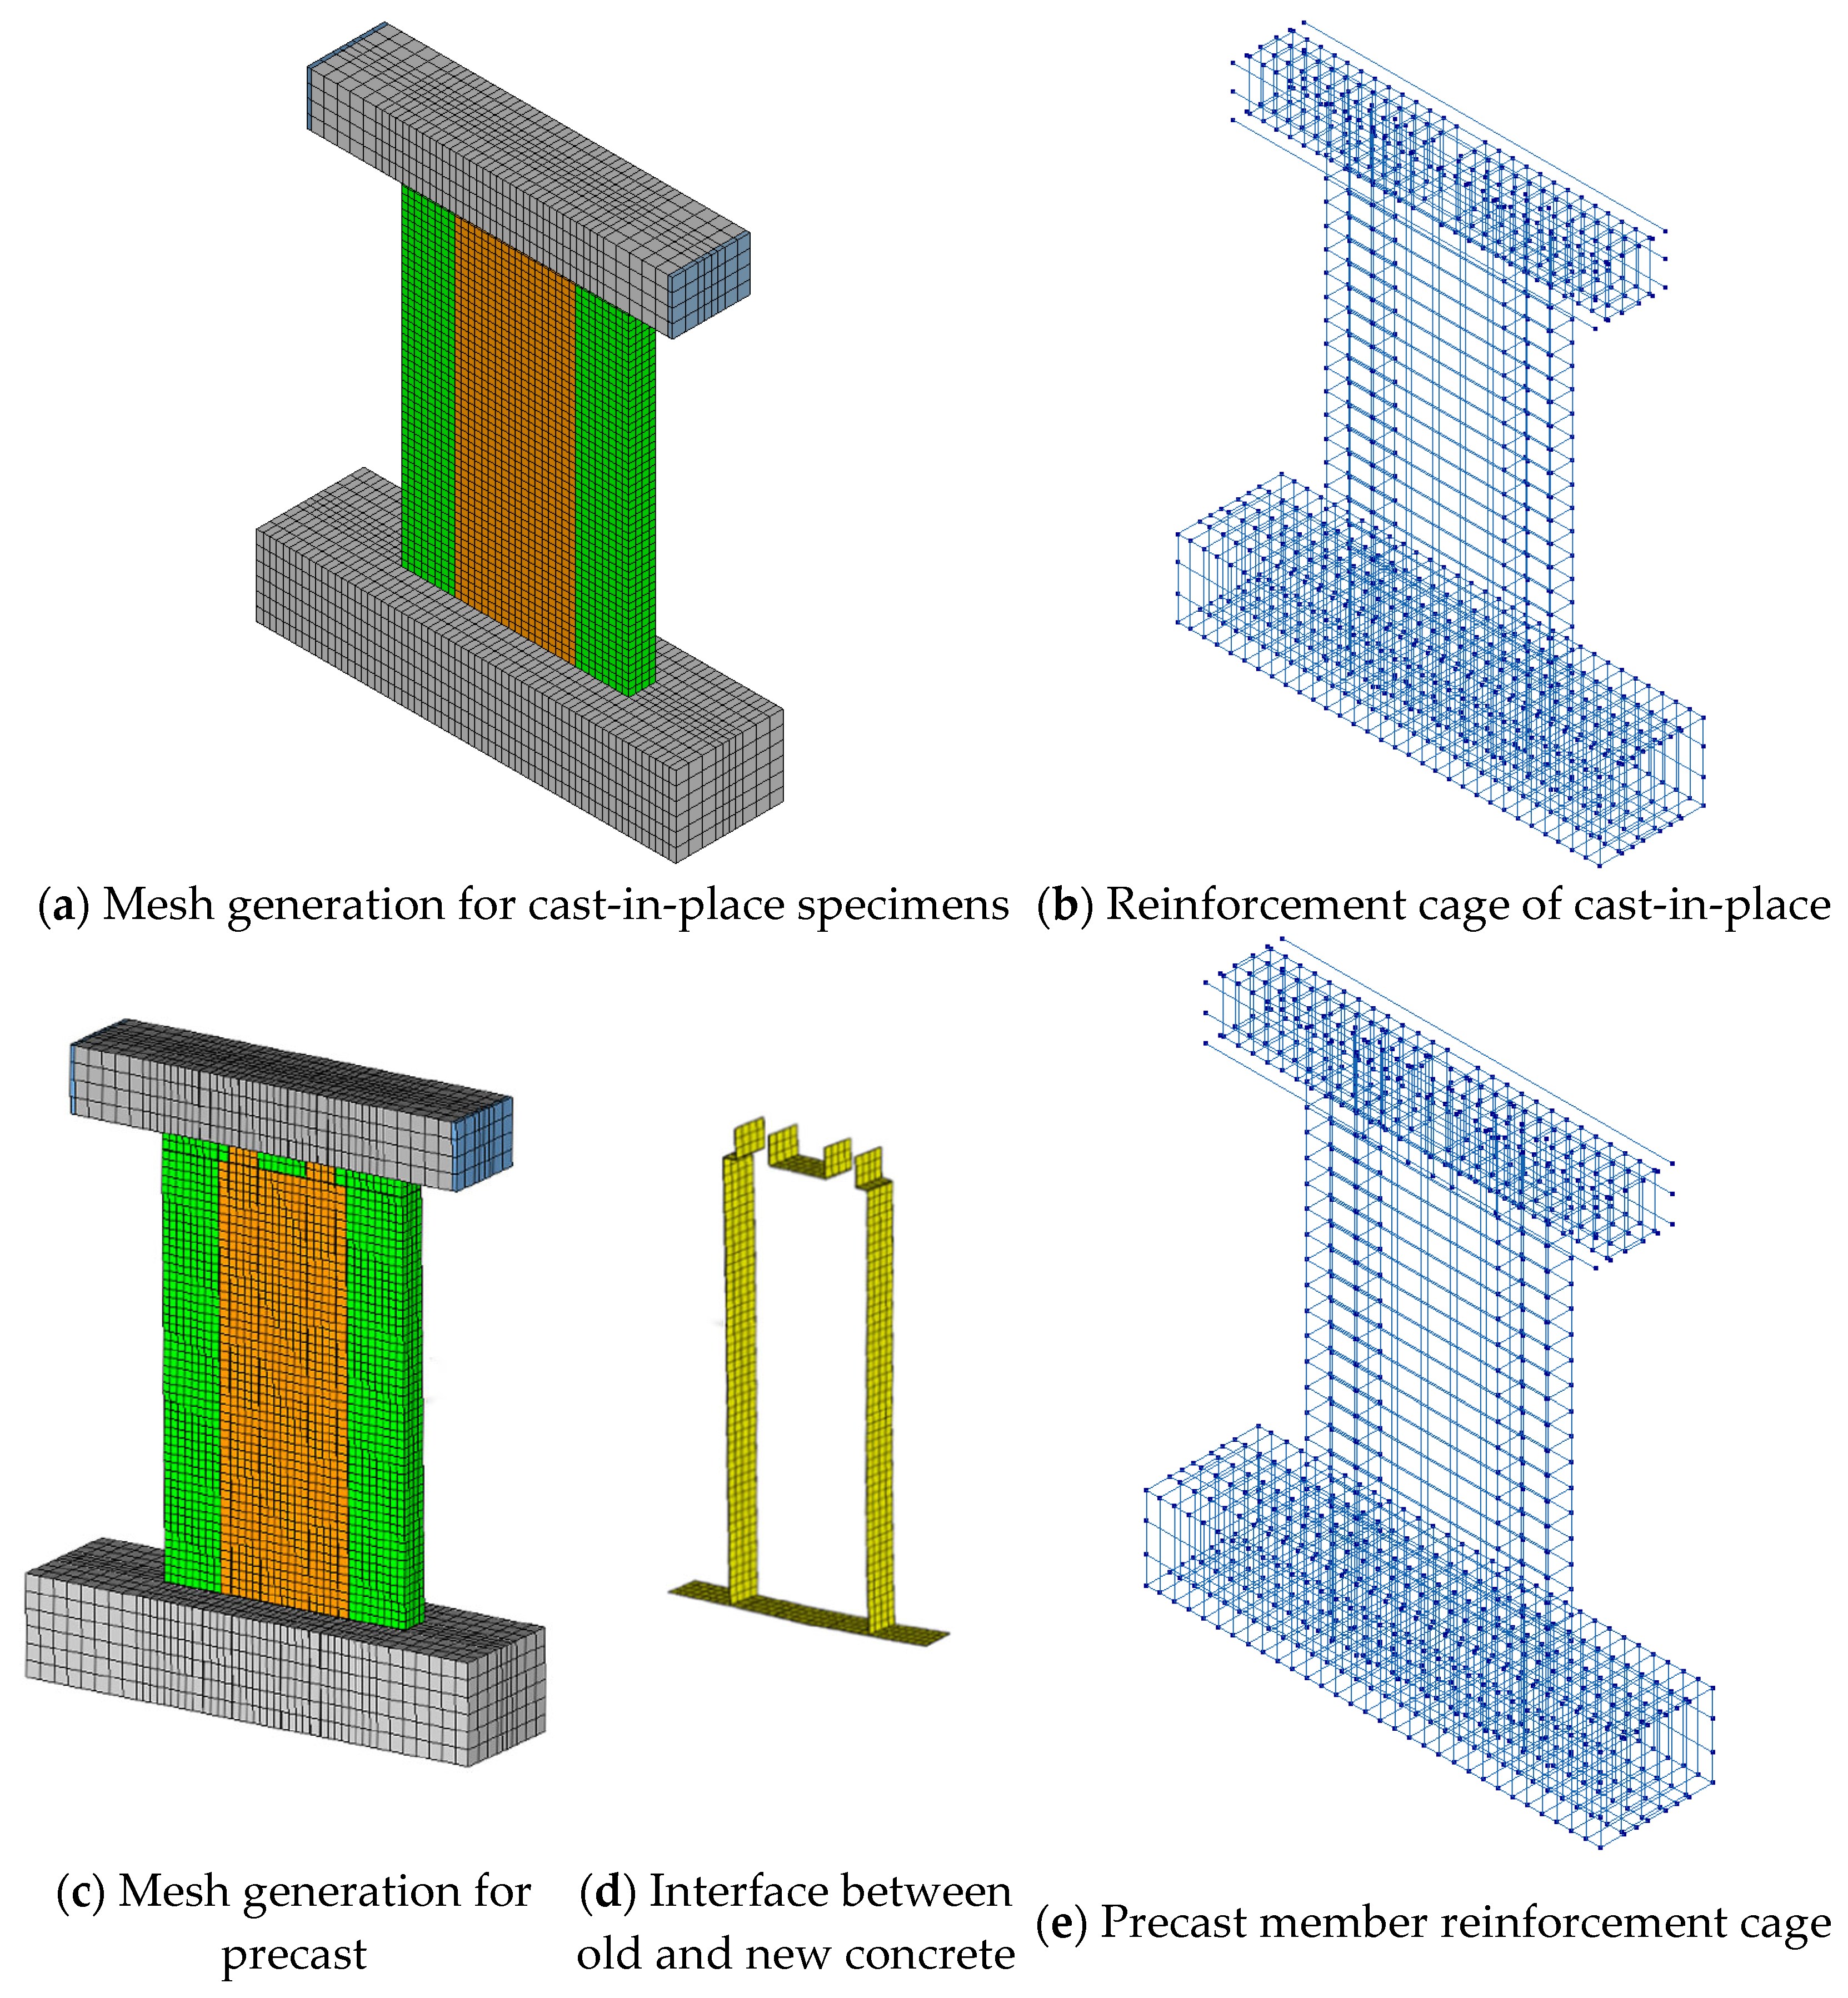
4. Finite Element Analysis
4.1. Finite Element Model
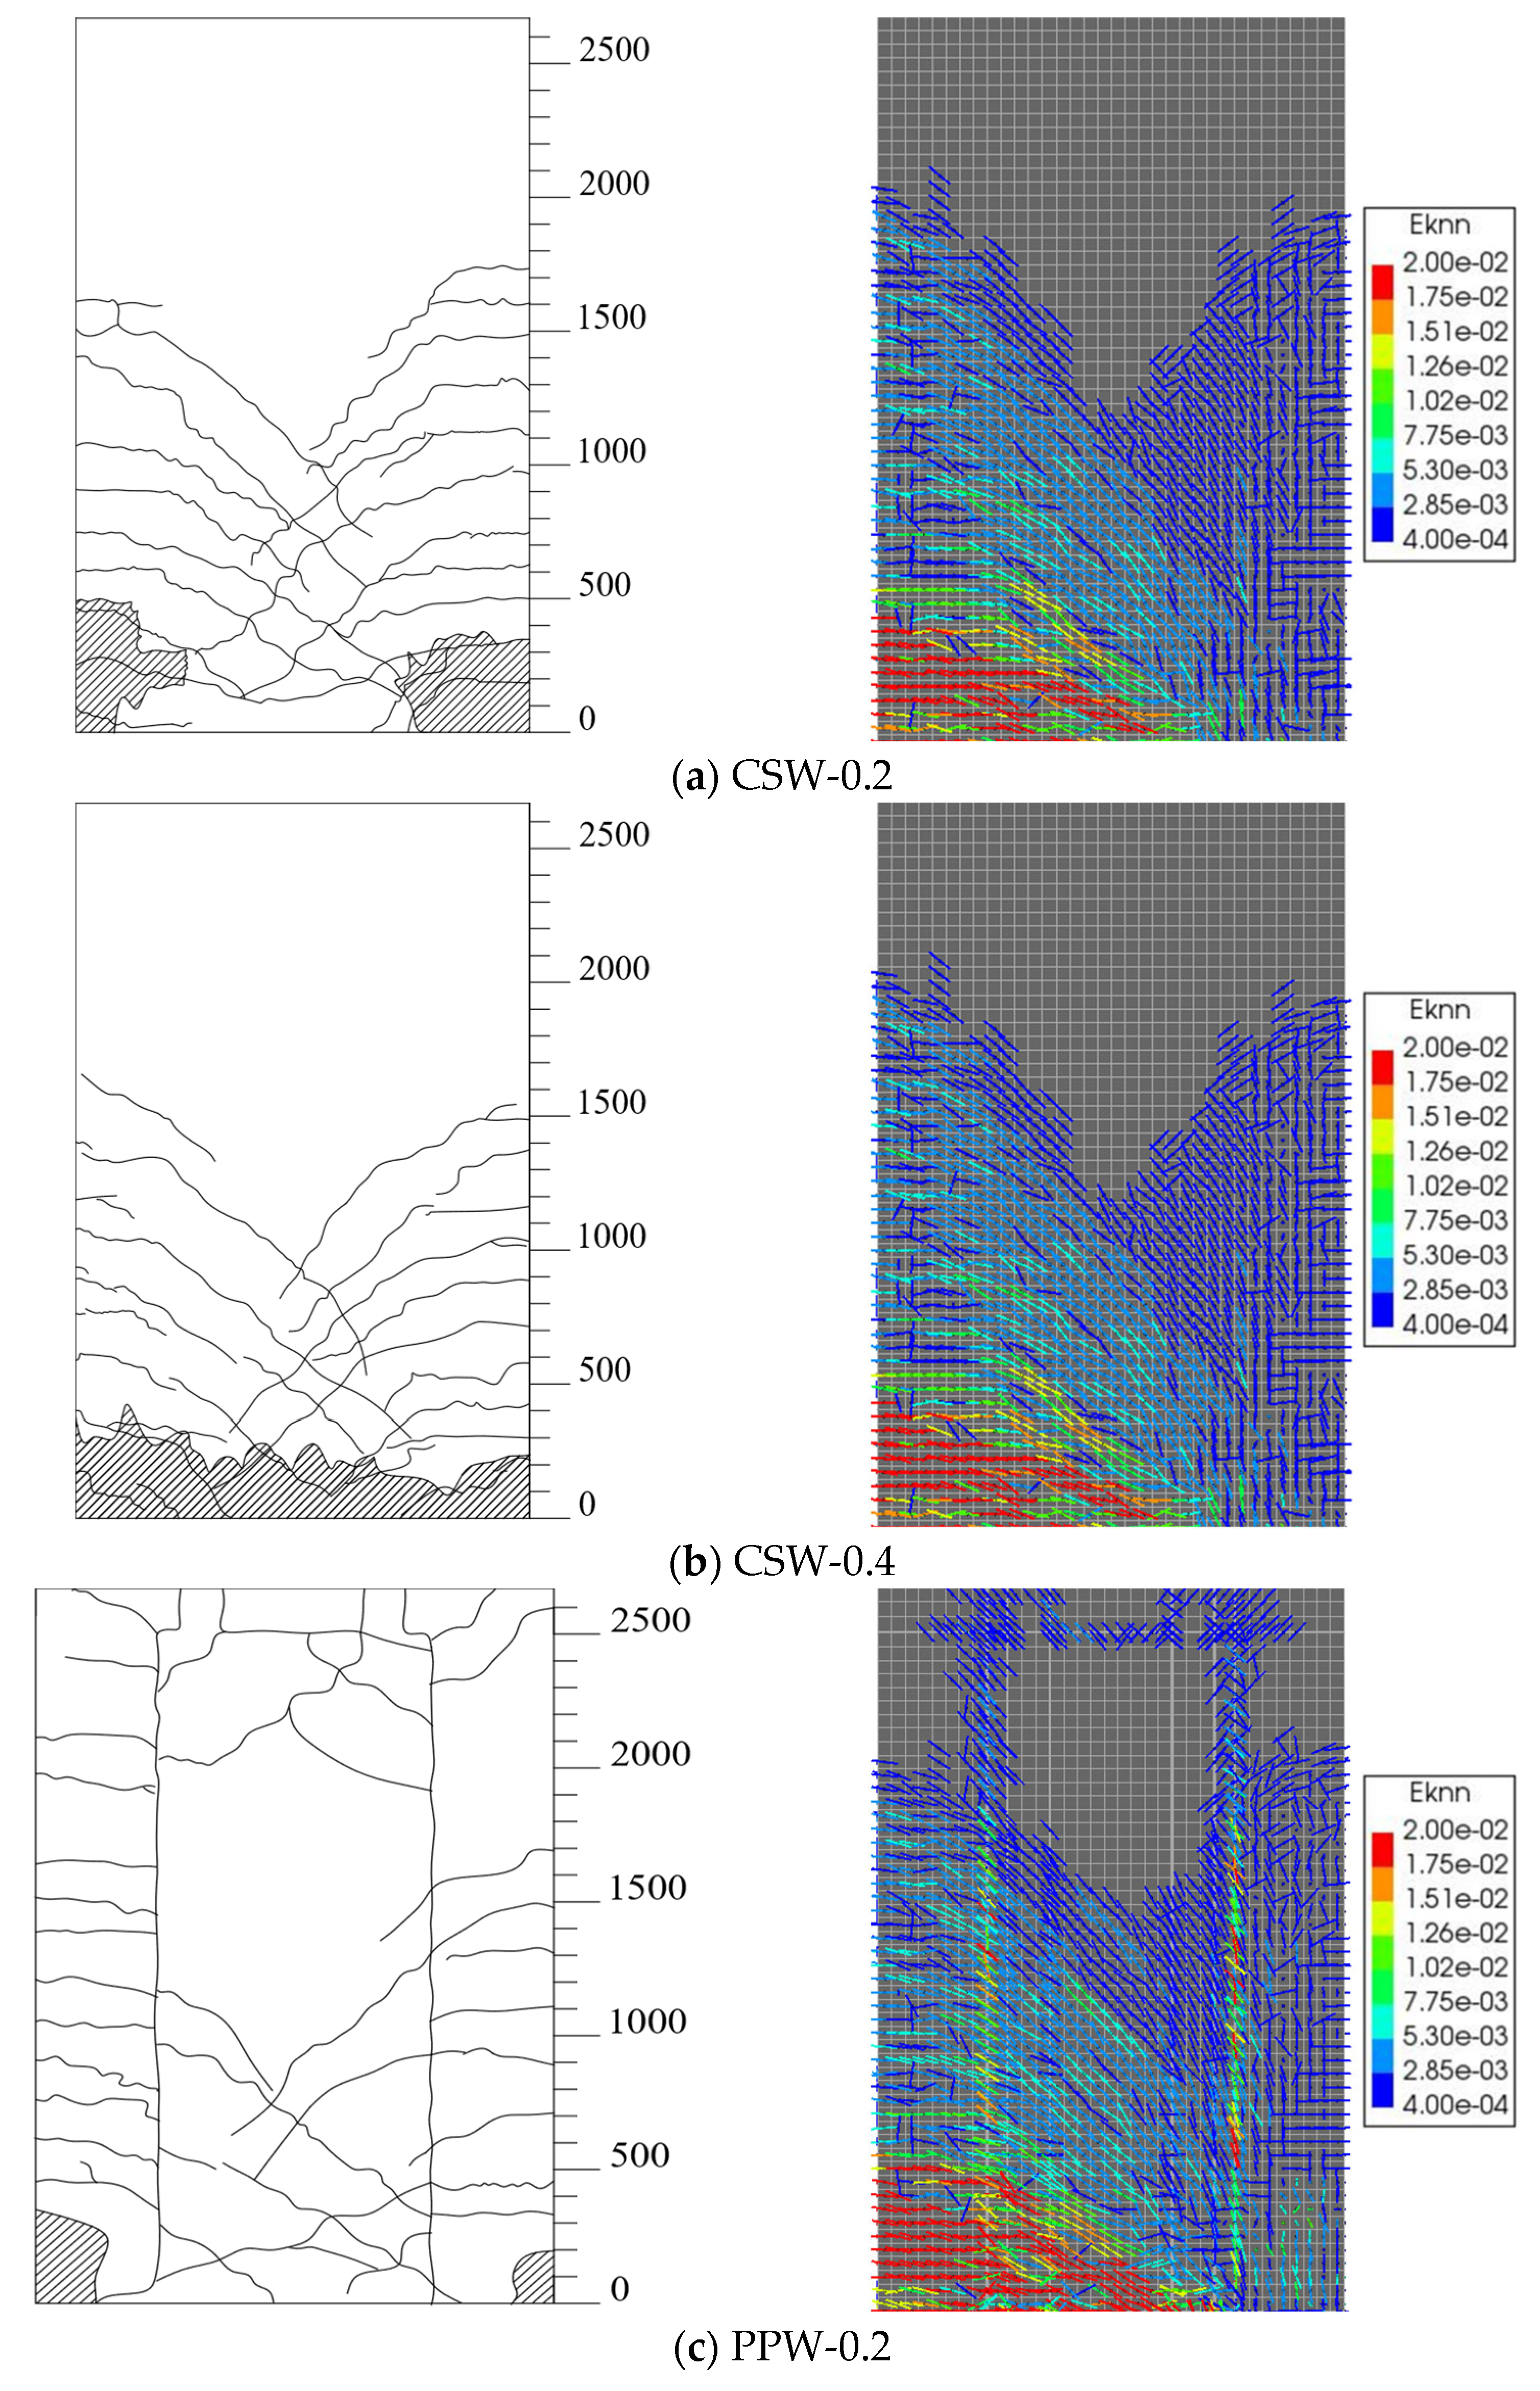
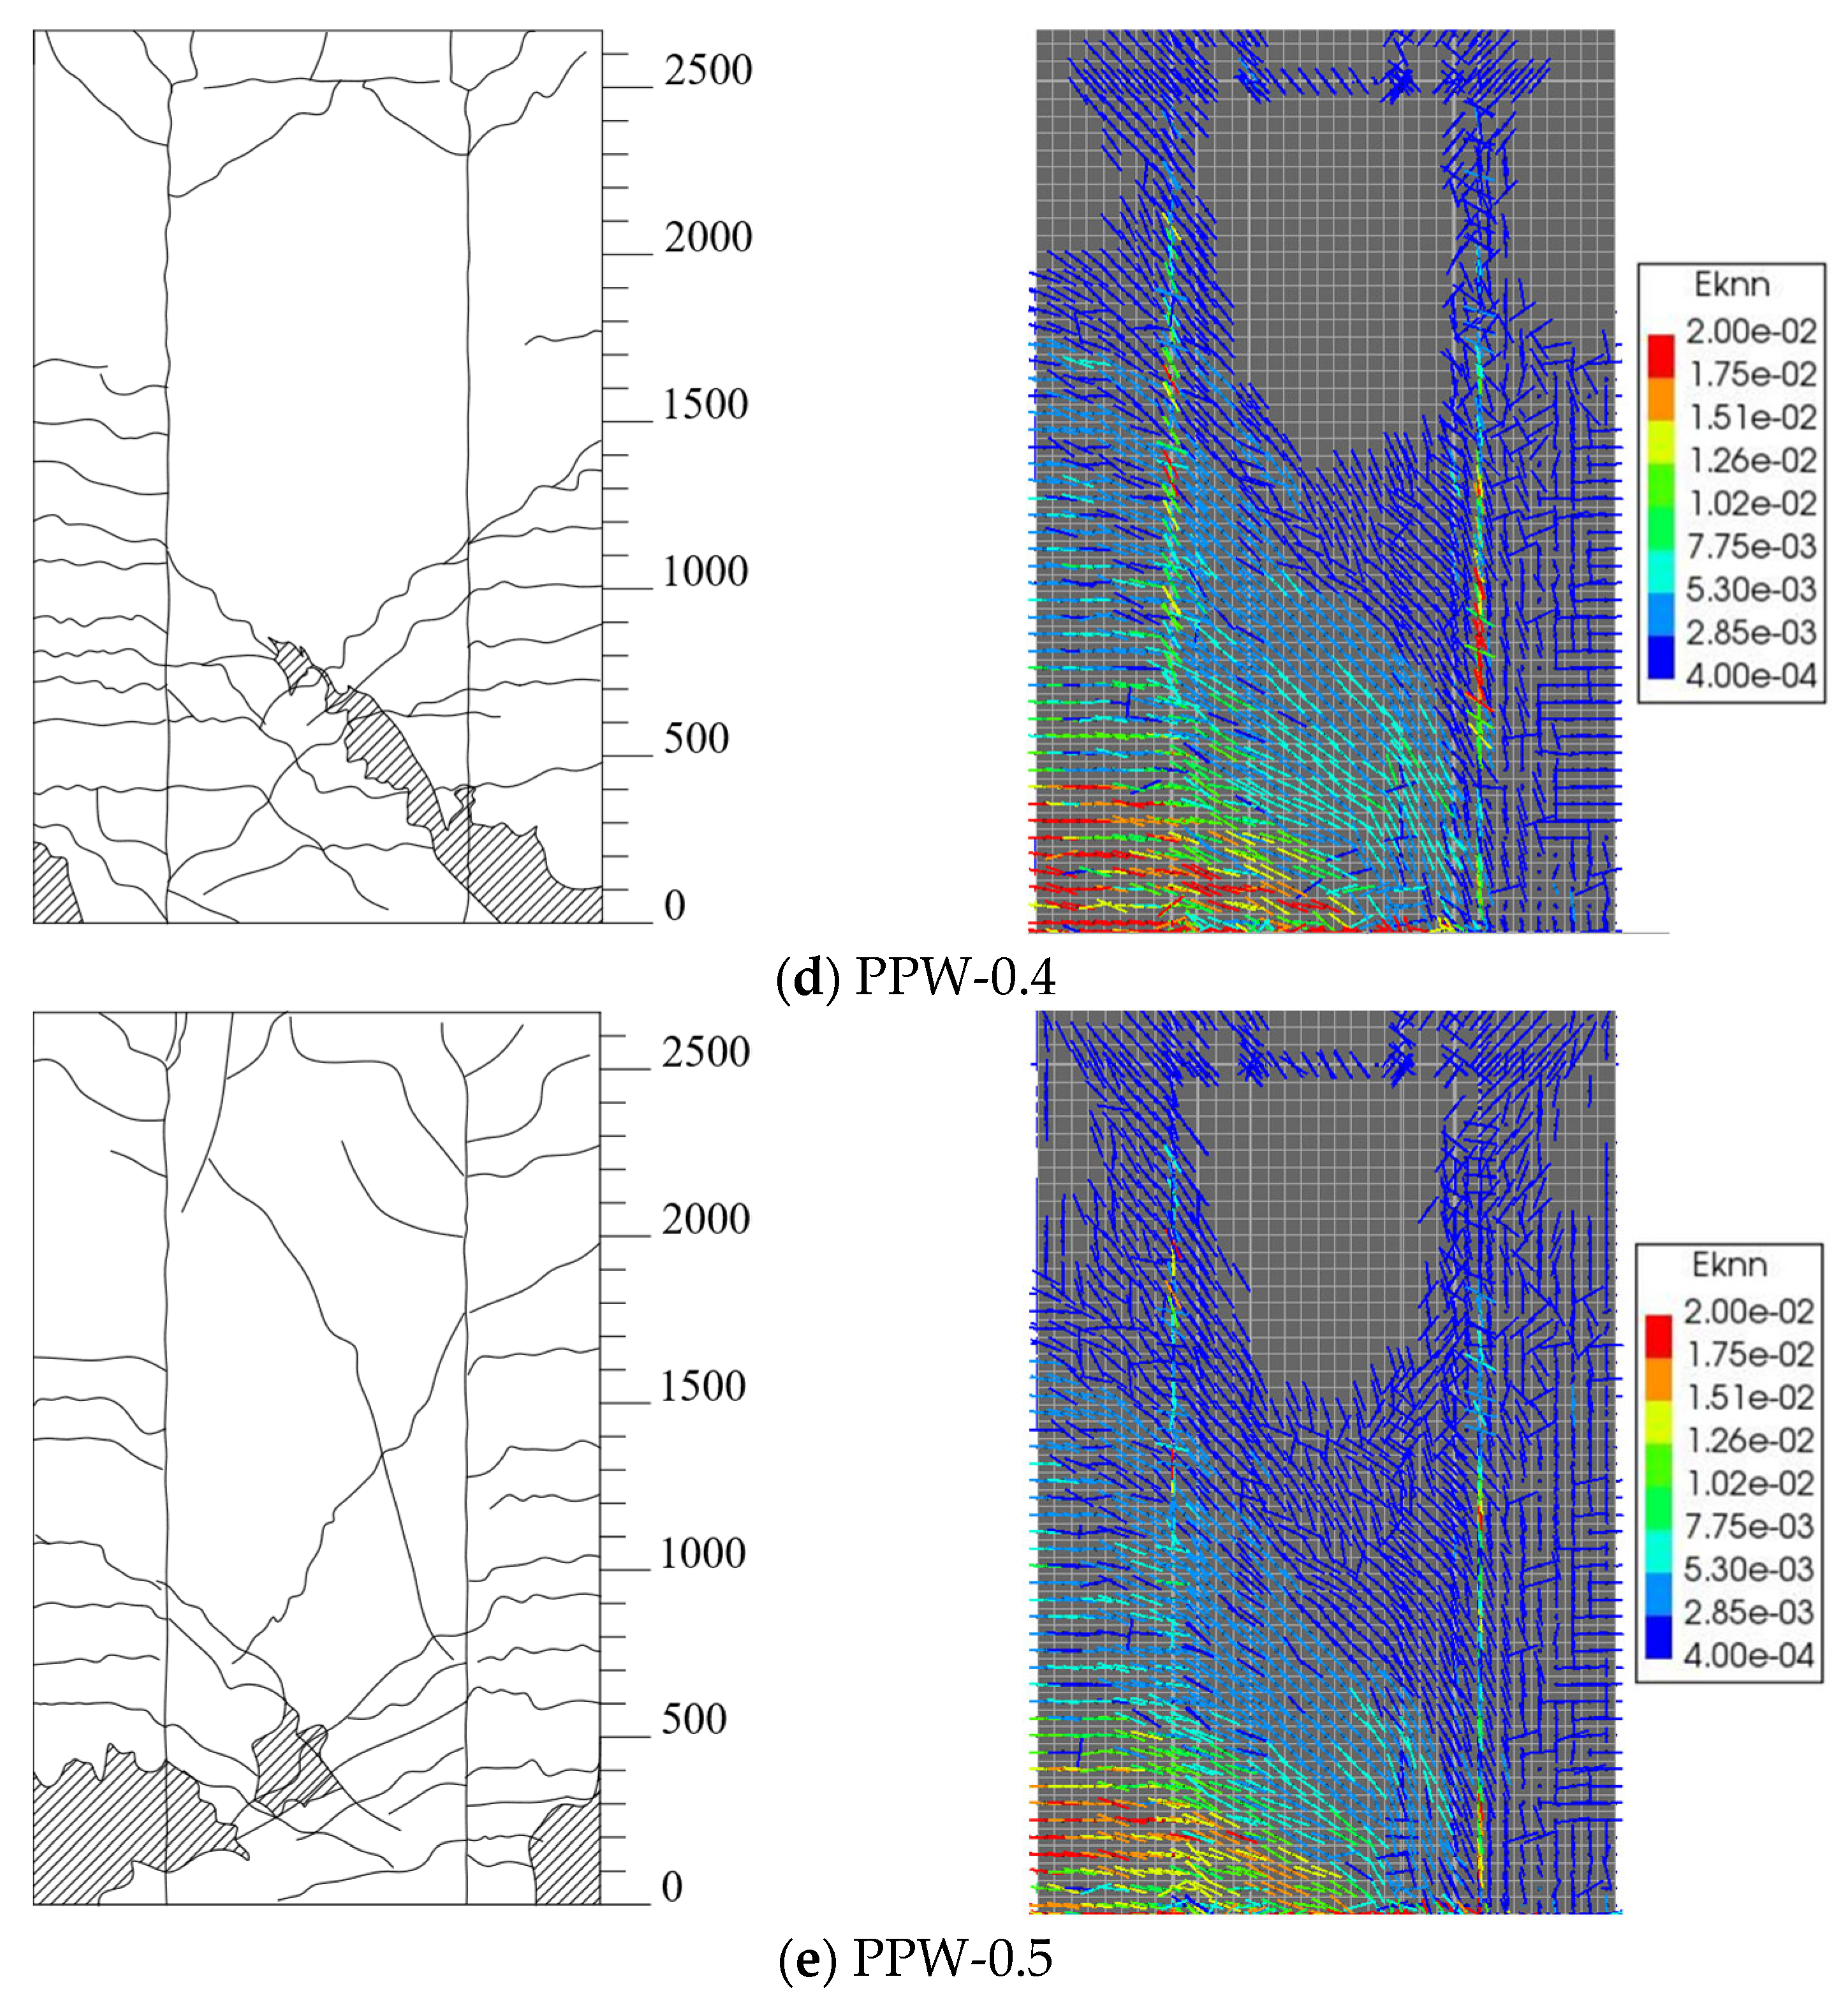
4.2. Comparison Between Experimental and Finite Element Simulation Results
5. Conclusions
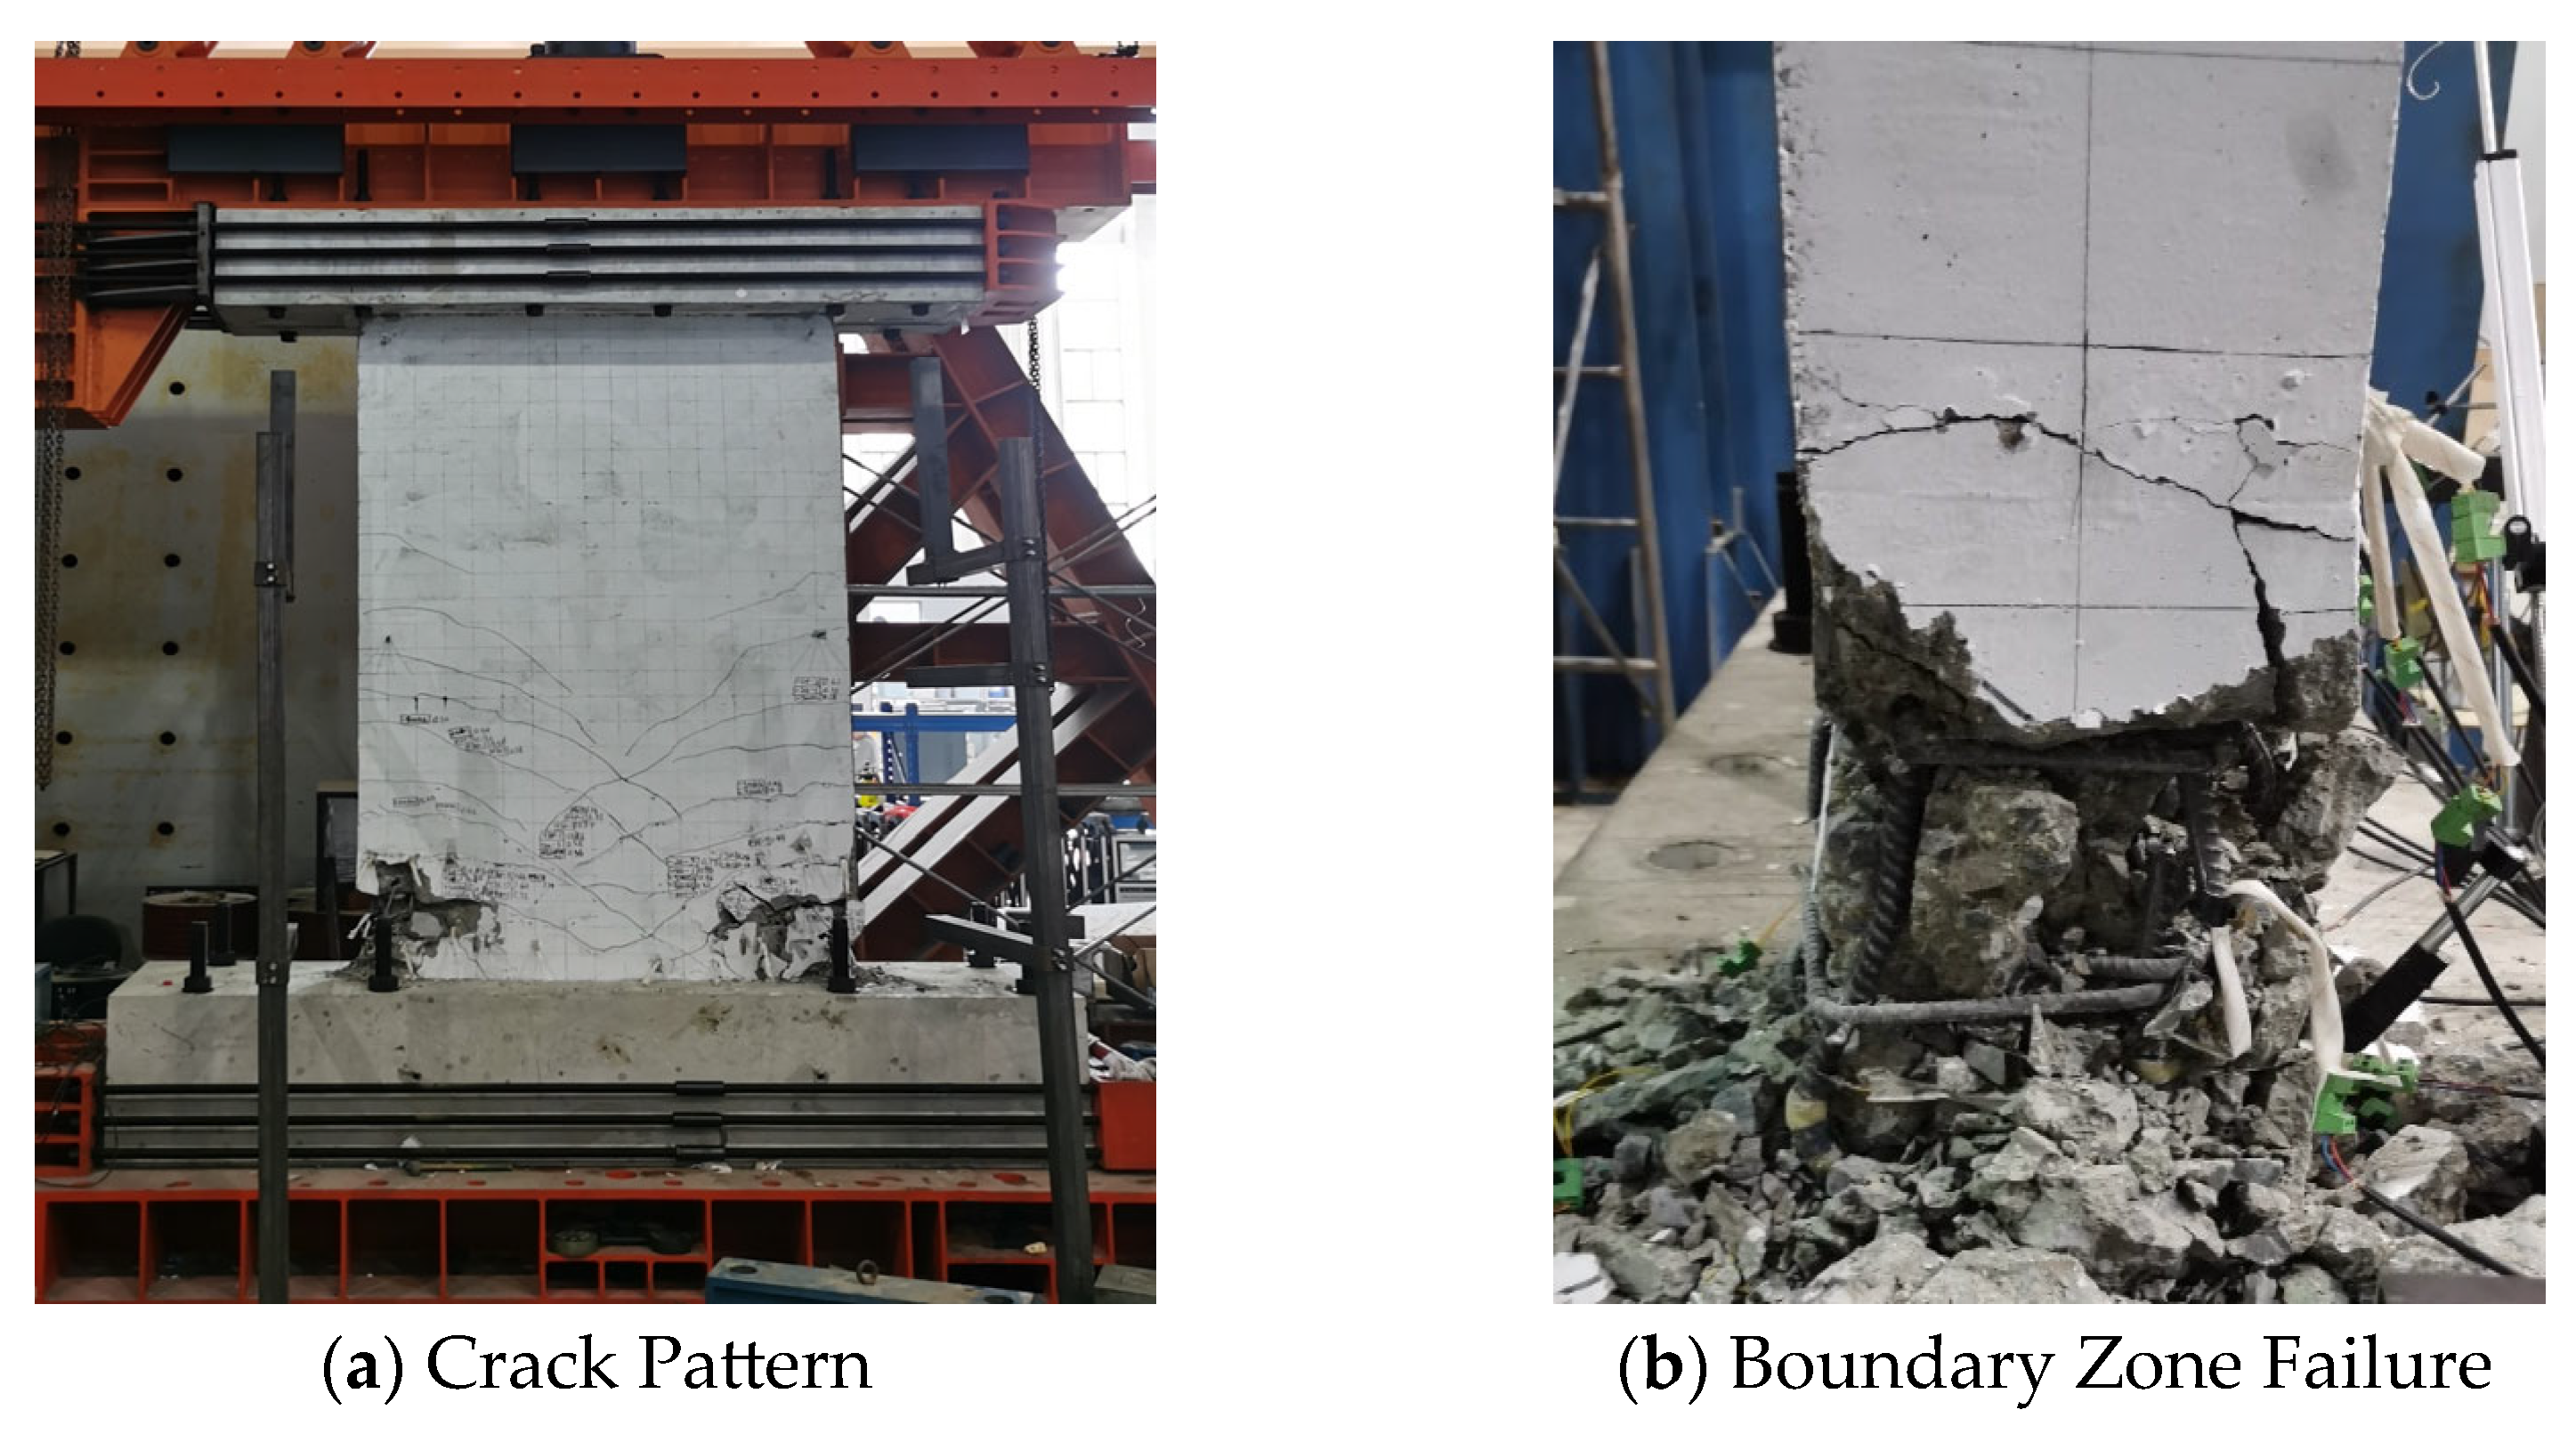
- Under low-cycle reversed loading, cracks in the shear wall specimens initially developed from the tensile edge and propagated diagonally at approximately 45° as loading progressed. Precast shear wall specimens exhibited more extensive crack distribution compared to cast-in-place shear walls, with additional cracking occurring at the interface between new and existing concrete.Failure modes varied with axial compression ratios:
- At the 0.2 axial compression ratio, both precast and cast-in-place shear walls failed due to the fracture of tensile reinforcement;
- At higher axial compression ratios (0.4, 0.5), failure transitioned to the compressive crushing of concrete.
- All shear wall specimens exhibited “bow-shaped” hysteresis loops with significant pinching effects. Under identical axial compression ratios, the precast shear walls using the pre-inserted method and cast-in-place walls demonstrated comparable hysteresis loop areas. However, with increasing axial compression ratios, both precast and cast-in-place specimens showed more pronounced pinching in their hysteresis loops.
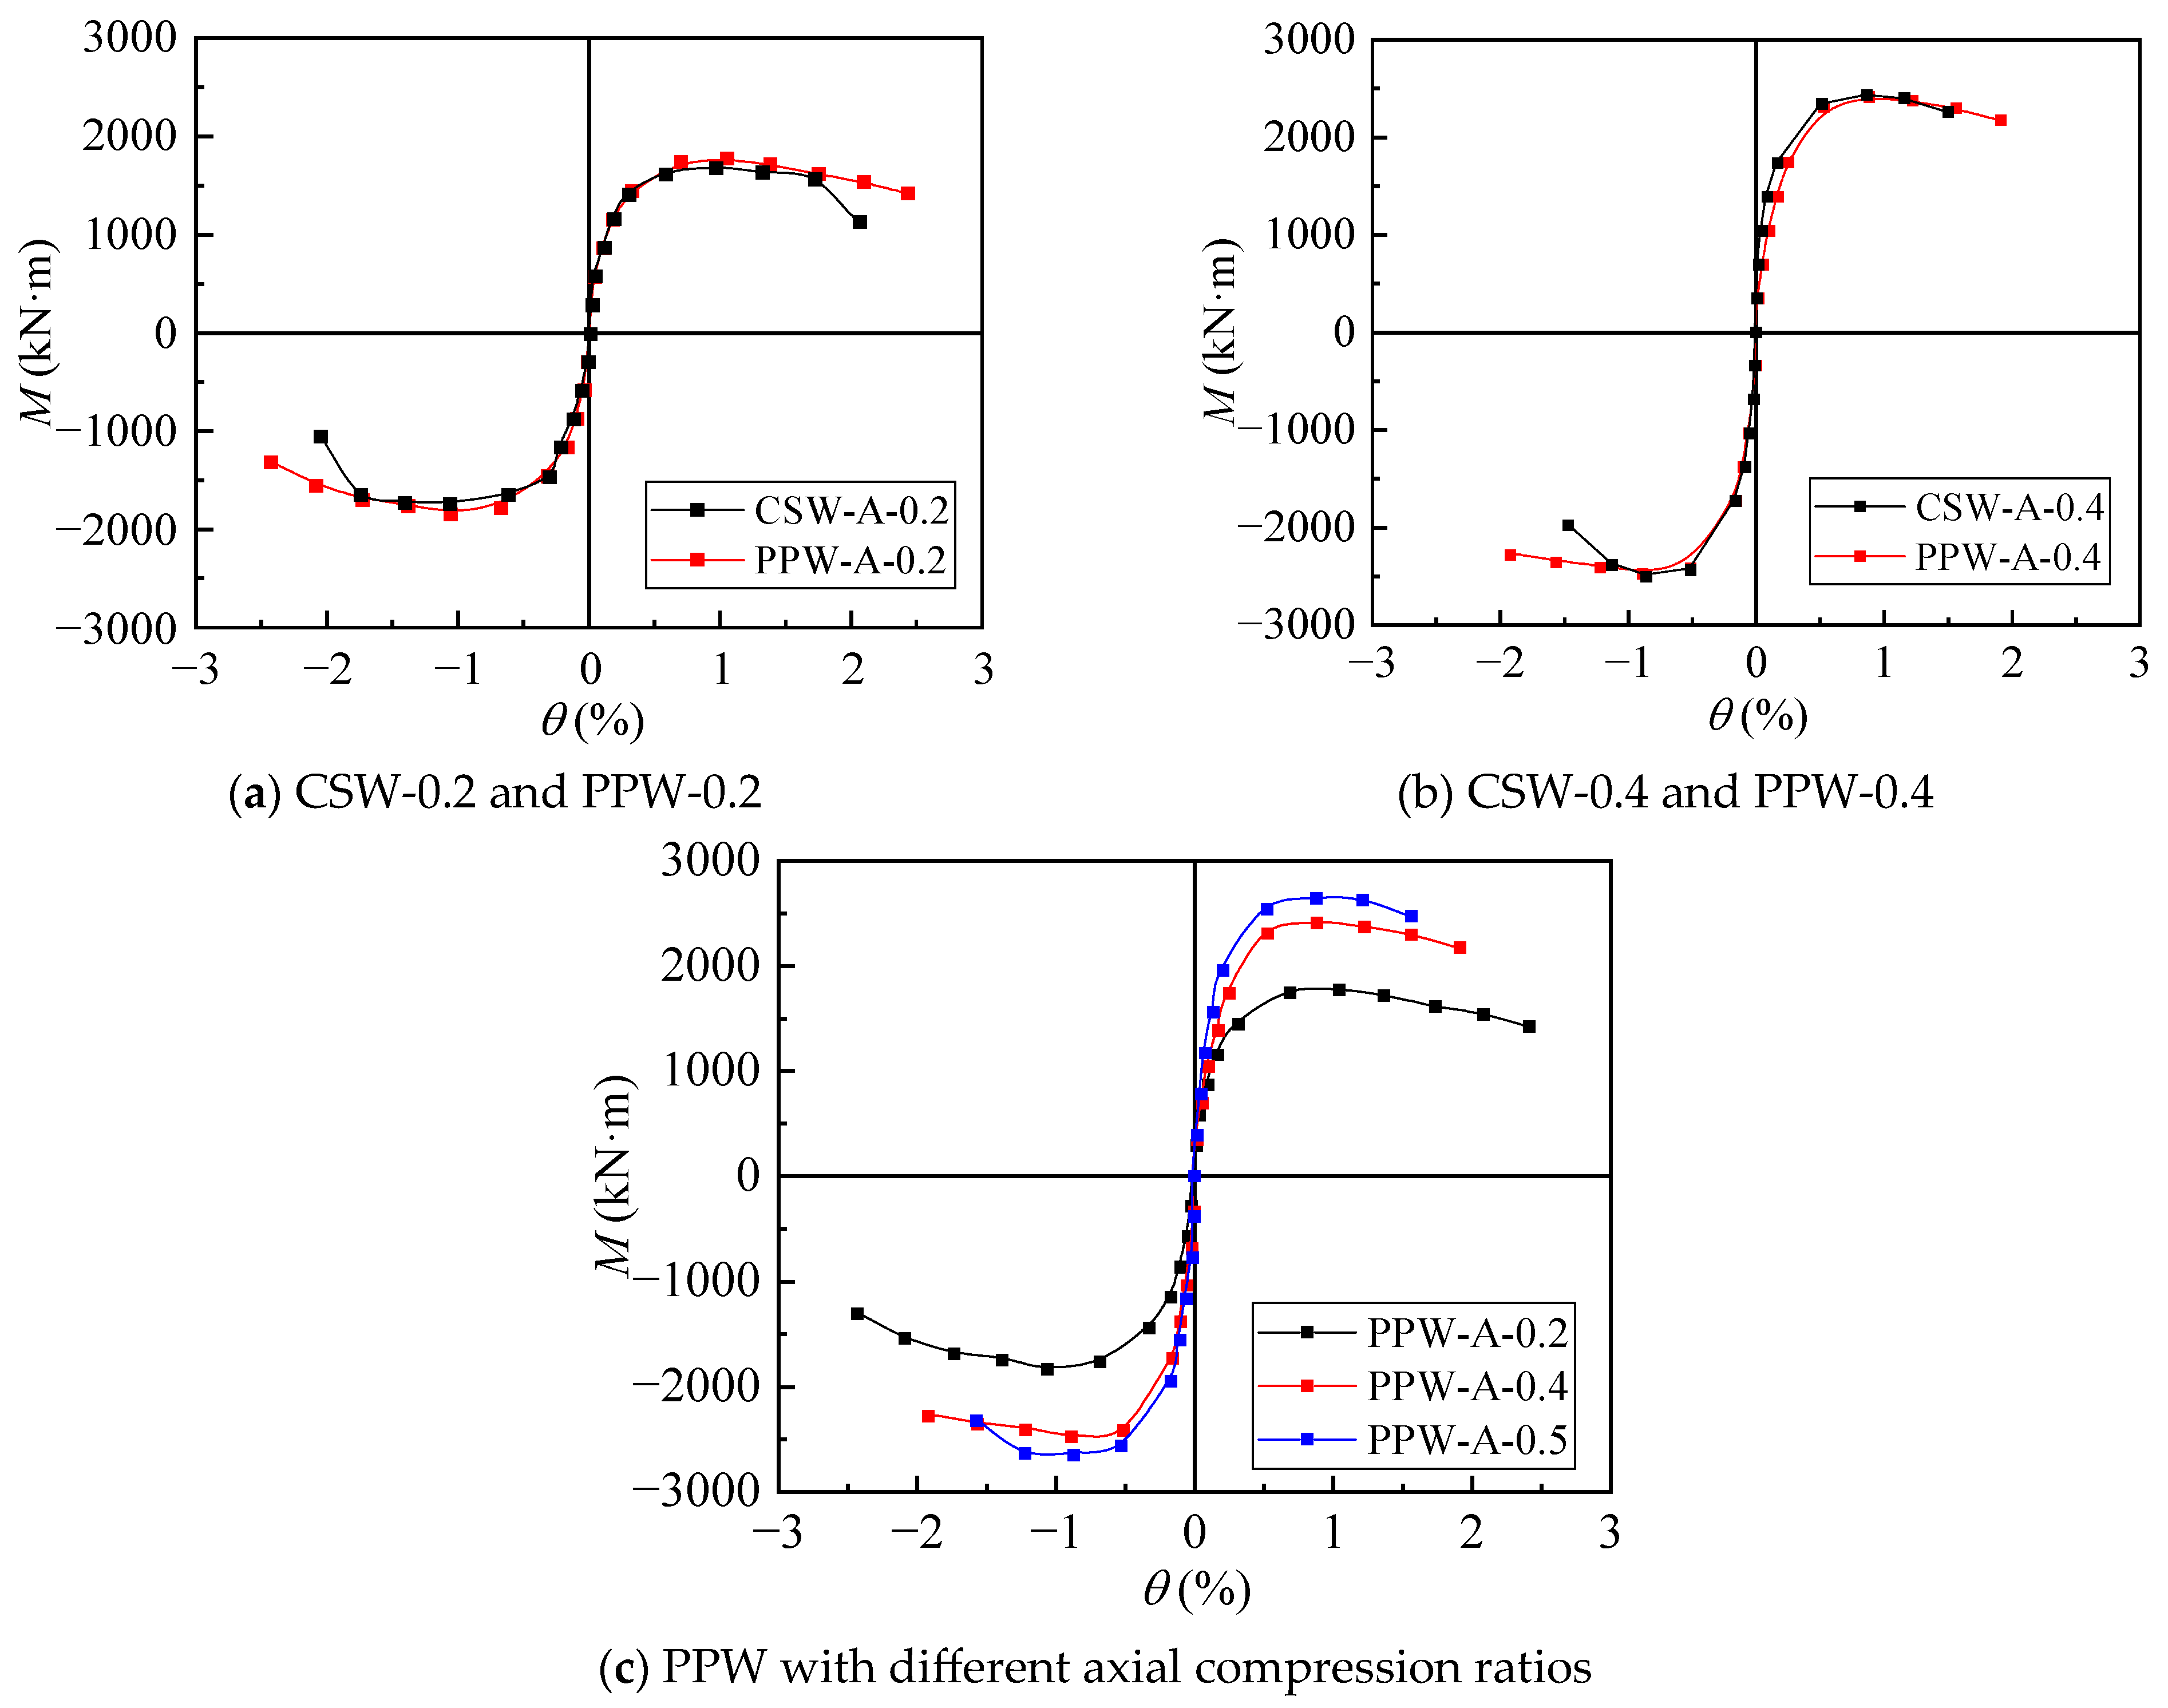
- The skeleton curves of all five shear wall specimens exhibited an “S-shape,” indicating that the specimens underwent four distinct stages during loading: elastic, elastoplastic, and plastic development, and failure. Under the same axial compression ratio, the prefabricated shear wall specimens with the pre-inserted method demonstrated comparable stiffness and peak load-bearing capacity to the cast-in-place shear walls. As the axial compression ratio increased, all specimens showed a significant improvement in peak load-bearing capacity.
- Cracking at the interface between new and old concrete during loading led to prefabricated shear wall specimens (pre-inserted method) exhibiting greater deformation capacity and a slightly slower stiffness degradation rate compared to cast-in-place specimens. As the axial compression ratio increased, both wall types showed reduced displacement ductility coefficients and accelerated stiffness degradation. The shear deformation proportion was similar for both wall types and remained nearly unaffected by axial compression ratio changes.
- The pre-inserted prefabricated shear walls and cast-in-place shear walls exhibited similar trends in relative energy dissipation capacity. After entering the elastoplastic stage, the equivalent viscous damping coefficient gradually increased with displacement, and variations in the axial compression ratio had no significant effect on the relative energy dissipation capacity. Before failure, the equivalent viscous damping coefficients of all specimens were concentrated around 20%, indicating that each specimen possessed favorable relative energy dissipation performance.
- The hysteretic curves obtained from numerical analysis closely match those from experimental tests in terms of shape and enclosed area, with less than 10% difference in both yield capacity and peak load-bearing capacity, demonstrating that the numerical results can accurately reflect the seismic performance of the precast shear wall with the pre-inserted method. The concrete crack strains derived from the simulation effectively characterize the cracking behavior of the shear wall, and the crack distribution patterns align well with the experimental observations.
- This shear wall can be widely applied in residential buildings and high-rise structures with stringent lateral resistance requirements, effectively improving its prefabrication level. Currently, only quasi-static tests have been conducted on this shear wall. Future research could include pseudo-dynamic tests, more extensive numerical simulation parameter analyses, as well as refined theoretical studies and pilot projects for practical application.
Author Contributions
Funding
Data Availability Statement
Conflicts of Interest
References
- Xue, W.; Hu, X. State of the art of studies on precast concrete shear wall structures. J. Build. Struct. 2019, 40, 44–55. [Google Scholar]
- Qian, J.; Peng, Y.; Zhang, J.; Qin, H.; Li, J.; Liu, G.; Zhao, F.; Li, L. Tests on seismic behavior of pre-cast shear walls with vertical reinforcements spliced by grout sleeves. Build. Struct. 2011, 41, 1–6. [Google Scholar]
- Qian, J.; Yang, X.; Qin, H.; Peng, Y.; Zhang, J.; Li, J. Tests on seismic behavior of pre-cast shear walls with various methods of vertical reinforcement splicing. J. Build. Struct. 2011, 32, 51–59. [Google Scholar]
- Qian, J.; Han, W.; Zhao, Z.; Qin, H.; Zhang, Y.; Yu, J.; Ma, T.; Tian, D. Pseudo-dynamic substructure test on a 3-story full-scale model of prefabricated concrete shear wall structure with rebars splicing by grout sleeves. J. Build. Struct. 2017, 32, 26–38. [Google Scholar]
- Jiang, H.; Chen, Z.; Zhang, J.; Wu, B.; Tian, Y.; Liu, W. Quasi-static test of precast reinforced concrete shear wall structure. J. Build. Struct. 2011, 32, 34–40. [Google Scholar]
- Chen, Y.G.; Liu, J.B.; Guo, Z.X.; Zhang, J.X. Test on seismic performance of precast shear wall with reinforcements grouted in holes and spliced indirectly in horizontal connections. J. Harbin Inst. Technol. 2013, 45, 83–89. [Google Scholar]
- Xue, W.; Gu, X.; Hu, X.; Li, X. Experimental study of assembled monolithic concrete shear wall with bolted connection under low reversed cyclic loading. China Civ. Eng. J. 2014, 47, 221–226. [Google Scholar]
- Xue, W.; Hu, X.; Chu, M. Experimental Study of Precast Concrete Shear Wall with Bolted Connection Under Low Reversed Cyclic Loading; Tongji University College of Civil Engineering: Shanghai, China, 2018; pp. 33–94. [Google Scholar]
- Wu, H.; Liu, B.; Jiang, H.; Wang, S.; Yi, X.; Liu, H. Experimental study on seismic performance of precast shear walls connected by large-diameter screws and UHPC. J. Build. Struct. 2022, 43, 61–68. [Google Scholar]
- Zhi, Q.; Yuan, Z.; Zheng, Y.; Jia, L.; Guo, Z. Experimental Research on Seismic Performance of Precast Concrete Shear Walls with a Novel Grouted Sleeve Used in the Connection. J. Earthq. Eng. 2023, 28, 1379–1403. [Google Scholar] [CrossRef]
- Jiao, A.L.; Zhang, P.; Li, Y.H.; Zhi, X.D. Tests on seismic behavior of pre-cast shear walls with annular closed reinforcements. J. Build. Struct. 2015, 36, 103–109. [Google Scholar]
- Gao, Y.F.; Jiao, A.L.; Zhang, Z.S.; Liu, J.; Zhi, X.D. Tests on out-of-plane bending of precast shear walls with annular closed reinforcements. Build. Struct. 2016, 46, 439–442. [Google Scholar]
- Jiao, A.; Zhang, P.; Gao, Y.; Zhang, Z. Research on anchoring performance mechanism of vertical connection of prefabricated shear walls with annular closed reinforcements. Ind. Constr. 2019, 49, 69–76+129. [Google Scholar]
- Xizhi, Z.; Jian, M.; Peng, H. Shear behavior on prefabricated shear wall alveolar type connection. J. Build. Struct. 2017, 38, 93–100+121. [Google Scholar]
- Zhang, X.Z.; Li, X.Q.; Zhang, S.H.; Li, Q.; Xu, S. Experimental study on seismic behavior of prefabricated shear wall with composite alveolar connection and U-type reinforcements overlap. J. Build. Struct. 2020, 41, 79–88. [Google Scholar]
- Zhao, J.; Yin, L.; Li, X.; Li, B.; Zhao, T. Study on seismic performance of prefabricated shear walls using non-contact lapping with steel fiber reinforced sulphoaluminate concrete connection. J. Build. Eng. 2023, 78, 107681. [Google Scholar] [CrossRef]
- Han, Q.; Wang, D.; Xu, S.; Zheng, Z.; Mao, J. Numerical investigation of a new precast concrete shear wall system with horizontal connections. Structures 2024, 70, 107616. [Google Scholar] [CrossRef]
- Han, Q.; Yasir, N.; Wang, D.; He, J. Aseismic performance of prefabricated concrete shear walls with strong horizontal and weak vertical hybrid connections. J. Vib. Shock. 2024, 43, 306–318. [Google Scholar]
- GB 50010-2010; Code for Design of Concrete Structures. China Architecture & Building Press: Beijing, China, 2010.
- GB 50011-2010; Code for Seismic Design of Buildings. China Architecture & Building Press: Beijing, China, 2010.
- Zhang, X.; Li, F.; Li, Y.; Li, X.; Zhang, S.; Yu, Z. Experimental Study on Shear Behavior of Precast Shear Wall with Composite Alveolar Connections. J. Tianjin Univ. (Sci. Technol.) 2022, 55, 57–65. [Google Scholar]
- JGJ3-2010; Technical Specification for Concrete Structure of Tall Building. China Architecture & Building Press: Beijing, China, 2010.
- JGJ/T 101-2015; Specifications for Seismic Test of Buildings Code; Beijing. China Architecture & Building Press: Beijing, China, 2015.
- Mander, J.B.; Priestley, M.J.N.; Park, R. Theoretical stress-strain model for confined concrete. J. Struct. Eng. 1988, 114, 1804–1826. [Google Scholar] [CrossRef]
- Hordijk, D.A. Local Approach to Fatigue of Concrete. Ph.D. Thesis, Delft University of Technology, Delft, The Netherlands, 1991. [Google Scholar]
- Menegotto, M.; Pinto, P.E. Method of analysis for cyclically loaded reinforced concrete plane frames including changes in geometry and non-elastic behavior of elements under combined normal force and bending. In Proceedings of the IABSE Symposium on Resistance and Ultimate Deformability of Structural Acted on by Well-Defined Repeated Loads, Lisbon, Portugal, 13–14 September 1973; pp. 15–22. [Google Scholar]


| Specimen Number | Type | Height (mm) | Width (mm) | Thickness (mm) | Axial Compression Ratio |
|---|---|---|---|---|---|
| CSW-0.2 | Cast-in-place | 2670 | 1700 | 200 | 0.2 |
| CSW-0.4 | Cast-in-place | 2670 | 1700 | 200 | 0.4 |
| PPW-0.2 | Precast | 2670 | 1700 | 200 | 0.2 |
| PPW-0.4 | Precast | 2670 | 1700 | 200 | 0.4 |
| PPW-0.5 | Precast | 2670 | 1700 | 200 | 0.5 |
| Rebar Specifications | Es (GPa) | fy (MPa) | fu (MPa) | Agt (%) |
|---|---|---|---|---|
| Φ14 | 203 | 418 | 596 | 17 |
| Φ10 | 196 | 398 | 557 | 17 |
| Φ8 | 200 | 455 | 606 | 14 |
| Specimen | Loading Direction | My (kN·m) | θy (%) | Mmax (kN·m) | max (%) | θu (%) | Ductility Coefficient |
|---|---|---|---|---|---|---|---|
| CSW-A-0.2 | (+) | +1354.6 | +0.31 | +1671.2 | +0.96 | +2.09 | 6.74 |
| (−) | −1411.6 | −0.30 | −1723.0 | −1.07 | −2.09 | 7.08 | |
| CSW-A-0.4 | (+) | +2018.5 | +0.27 | +2427.5 | +0.86 | +1.52 | 5.56 |
| (−) | −2060.5 | −0.25 | −2504.7 | −0.86 | −1.44 | 5.63 | |
| PPW-A-0.2 | (+) | +1461.5 | +0.34 | +1771.1 | +1.04 | +2.42 | 7.25 |
| (−) | −1485.2 | −0.36 | −1832.0 | −1.06 | −2.43 | 7.12 | |
| PPW-A-0.4 | (+) | +2041.2 | +0.30 | +2408.3 | +0.88 | +1.91 | 6.36 |
| (−) | −2056.1 | −0.34 | −2477.7 | −0.89 | −1.92 | 6.89 | |
| PPW-A-0.5 | (+) | +2151.7 | +0.28 | +2642.4 | +0.89 | +1.57 | 5.54 |
| (−) | −2187.8 | −0.31 | −2651.9 | −0.87 | −1.57 | 5.10 |
| Specimen | Loading Direction | Mty (kN·m) | Msy (kN·m) | Mty/Msy | Mtmax (kN·m) | Msmax (kN·m) | Mtmax/Msmax |
|---|---|---|---|---|---|---|---|
| CSW-A-0.2 | (+) | +1354.6 | +1424.4 | 0.95 | +1671.2 | +1710.5 | 0.98 |
| (−) | −1411.6 | −1431.2 | 0.99 | −1723.0 | −1790.9 | 0.96 | |
| CSW-A-0.4 | (+) | +2018.5 | +1904.9 | 1.06 | +2428.4 | +2333.0 | 1.04 |
| (−) | −2060.5 | −1910.2 | 1.08 | −2507.3 | −2374.2 | 1.06 | |
| PPW-A-0.2 | (+) | +1461.5 | +1436.1 | 1.02 | +1771.1 | +1628.3 | 1.09 |
| (−) | −1485.2 | −1447.6 | 1.03 | −1832.0 | −1635.2 | 1.12 | |
| PPW-A-0.4 | (+) | +2041.2 | +2047.0 | 1.00 | +2408.3 | +2465.8 | 0.98 |
| (−) | −2056.1 | −2039.8 | 1.01 | −2477.7 | −2440.0 | 1.02 | |
| PPW-A-0.5 | (+) | +2151.7 | +2103.4 | 1.02 | +2642.4 | +2683.9 | 0.98 |
| (−) | −2187.8 | −2103.4 | 1.04 | −2651.9 | −2672.4 | 0.99 |
Disclaimer/Publisher’s Note: The statements, opinions and data contained in all publications are solely those of the individual author(s) and contributor(s) and not of MDPI and/or the editor(s). MDPI and/or the editor(s) disclaim responsibility for any injury to people or property resulting from any ideas, methods, instructions or products referred to in the content. |
© 2025 by the authors. Licensee MDPI, Basel, Switzerland. This article is an open access article distributed under the terms and conditions of the Creative Commons Attribution (CC BY) license (https://creativecommons.org/licenses/by/4.0/).
Share and Cite
Xu, Q.; Yang, S.; Li, B.; Xu, M.; Zhang, M. Experimental Study on the Seismic Performance of Pre-Inserted Prefabricated Shear Walls. Buildings 2025, 15, 1945. https://doi.org/10.3390/buildings15111945
Xu Q, Yang S, Li B, Xu M, Zhang M. Experimental Study on the Seismic Performance of Pre-Inserted Prefabricated Shear Walls. Buildings. 2025; 15(11):1945. https://doi.org/10.3390/buildings15111945
Chicago/Turabian StyleXu, Quanbiao, Shenghang Yang, Benyue Li, Mingwei Xu, and Mingshan Zhang. 2025. "Experimental Study on the Seismic Performance of Pre-Inserted Prefabricated Shear Walls" Buildings 15, no. 11: 1945. https://doi.org/10.3390/buildings15111945
APA StyleXu, Q., Yang, S., Li, B., Xu, M., & Zhang, M. (2025). Experimental Study on the Seismic Performance of Pre-Inserted Prefabricated Shear Walls. Buildings, 15(11), 1945. https://doi.org/10.3390/buildings15111945