Abstract
High-temperature and high-pollution mobile sources are frequently encountered in industrial environments. Fixed-position exhaust outlets often fail to promptly remove heat and contaminants when these sources are in motion, leading to local accumulation and reduced indoor air quality. This study proposes a novel mobile exhaust system capable of tracking and dynamically aligning with moving emission sources to improve heat removal and cooling efficiency. Three configurations were evaluated: (1) a fixed exhaust outlet, (2) an exhaust vent moving synchronously with the heat source, and (3) a buoyancy-driven tracking exhaust outlet. Small-scale experiments and CFD simulations using dynamic mesh techniques were conducted. The results showed that the synchronous system reduced ambient temperature by an average of 0.25 to 2.3 °C compared to the fixed outlet, while the buoyancy-tracking system achieved an additional 0.15 to 2.5 °C reduction. The study also introduces a correlation between thermal plume inclination and the Archimedes number, providing a predictive basis for exhaust positioning. Given the similar dispersion patterns of heat and airborne pollutants, the proposed system holds promise for both thermal management and contaminant control in dynamic industrial environments. Furthermore, the system may offer critical advantages in emergency ventilation scenarios involving intense heat or hazardous pollutant outbreaks.
1. Introduction
High-intensity heat and pollutant sources are prevalent in industrial environments. Workers in such settings often experience reduced productivity and are susceptible to a range of occupational illnesses, including dermatological conditions, respiratory disorders, and cardiovascular diseases [1,2]. In 2022, nearly 1.11 million cases of occupational diseases were reported in China, with pneumoconiosis and other respiratory ailments accounting for approximately 68% of these cases [3]. These statistics underscore the urgent need for effective ventilation systems capable of removing hazardous pollutants [4].
The characteristics of heat and pollutant sources significantly influence both the temperature distribution and pollutant dispersion within indoor environments [5,6]. For instance, in electric welding workshops, arc welding machines generate high-temperature smoke that rapidly ascends to the ceiling. The welding position is often adjusted based on operational requirements. The chemical components in welding fumes can irritate the human respiratory tract, potentially leading to bronchitis and impaired lung function [7]. Similarly, in steel mills, high-temperature smelting processes emit substantial quantities of harmful gases and particulates, such as dust, carbon monoxide, sulfur dioxide, and hydrogen sulfide [8]. During the transportation of molten steel, these heat and pollutant sources become mobile, resulting in dynamic changes in the spatial distribution of heat and contaminants within the facility [9,10,11]. Other common mobile heat or pollution sources in industrial workshops include drying equipment and portable burners.
To ensure a healthy and productive working environment, extensive research has been conducted on the effectiveness of various ventilation strategies for the removal of waste heat and airborne pollutants. Conventional exhaust systems include centralized, local, displacement, and mechanical exhaust systems [12]. Centralized exhaust systems are frequently employed in settings with multiple emission sources, such as painting operations [13] and metallurgical processes [14]. However, the required exhaust rate—and, consequently, the total ventilation volume—is closely tied to the specifics of the production process, often leading to substantial energy consumption [15].
Local exhaust systems are widely recognized as a cost-effective solution for controlling gaseous and particulate pollutants in industrial contexts. Examples include welding fumes, dust, and particulates in metalworking workshops, as well as aerosols and volatile organic compounds in painting facilities. Devienne et al. [16] analyzed the characteristics of hot plumes using an exhaust hood and helium as a tracer gas, revealing that plume behavior was sensitive to the vertical distance between the heat source and the exhaust vent. Wang et al. [7] conducted field measurements and numerical simulations in a welding workshop, demonstrating that displacement ventilation combined with localized exhaust devices can significantly enhance ventilation performance. Huang et al. [17] used a 1:15 scale model to simulate the ventilation performance in a steel mill workshop, identifying the exhaust flow rate, pollutant source intensity, airflow obstructions, and source-vent distance as key factors affecting pollutant capture efficiency. Duan et al. [18] examined the behavior of thermal plumes around heated particles, discovering that such particles experience greater drag and reduced velocities during free fall. Zhao et al. [19] investigated pollutant dispersion in a large aircraft painting workshop, showing that a targeted ventilation system could reduce airflow volume by 75% while maintaining the same decontamination efficacy.
Despite advances in local and displacement ventilation technologies, several limitations remain. For local exhaust systems, capture efficiency decreases sharply as the distance between the source and the exhaust hood increases. Furthermore, the sporadic and unpredictable nature of pollutant emissions can further compromise system performance. Displacement systems, on the other hand, tend to underperform in large-scale or structurally complex spaces [20].
Regarding thermal plumes, numerous studies have investigated the behavior of different types of heat and pollutant sources. Yang et al. [21] explored thermal stratification and plume characteristics from multiple heat sources in naturally ventilated rooms through experimental and numerical methods. Lin et al. [22] conducted water tank experiments to assess buoyancy-driven flows from a single elevated heat source in a naturally ventilated space. Harish et al. [23] used numerical simulations to study the impact of heat source aspect ratio on plume behavior in rooms with combined horizontal and vertical openings. Hernandez et al. [24] examined the development of thermal plumes generated by a single source under natural convection in both two- and three-dimensional settings. Naffouti et al. [25] investigated natural convection in narrow, elongated spaces, focusing on the heat transfer and flow characteristics of thermal columns generated by localized sources. Saidi et al. [26] employed numerical simulations to assess how the movement paths of pollutant sources affect indoor air quality and the effectiveness of ventilation. Their findings revealed that pollutant dispersion significantly increased when the source moved in directions misaligned with the dominant airflow. However, when source movement aligned with airflow and the exhaust vent was placed laterally, dispersion was minimized and pollutants tended to accumulate in specific zones. Yang et al. [27] utilized a two-dimensional cleanroom model with vertical laminar flow to simulate the impact of human movement speed, curtain length, and other variables on airflow.
Their results showed that most existing ventilation models and simulations assume stationary sources, neglecting the complex plume behavior and shifting the thermal gradients associated with moving sources. Studies rarely address how exhaust systems can actively track or adapt to moving plumes to optimize removal efficiency. The use of dimensionless parameters (e.g., Archimedes number) to inform the design of exhaust systems based on real plume behavior is limited. Moreover, there is currently no technology or research available focusing on real-time movable exhaust vents.
High-temperature and high-pollution mobile sources are frequently encountered in various industrial environments, such as welding workshops, steel mills, and chemical processing facilities. These mobile sources generate substantial heat and contaminants, which, if not effectively ventilated, can accumulate and degrade indoor air quality, increase energy consumption, and compromise worker health and productivity. Traditional ventilation systems with fixed-position exhaust vents are generally inadequate in such settings, as they cannot dynamically respond to the moving nature of the heat and pollutant sources. This mismatch leads to inefficient heat removal and the potential for localized overheating or pollutant buildup.
The motivation for this study arises from the growing need for intelligent, adaptive ventilation strategies that can respond in real-time to dynamic thermal environments, thereby improving thermal comfort, air quality, and energy efficiency. Despite the extensive research on industrial ventilation systems, most studies focus on static conditions or assume stationary heat sources are present. In reality, mobile sources are common and present unique challenges in terms of exhaust design and control.
To address these challenges, this study proposes a novel mobile exhaust system that can dynamically follow mobile heat sources, enabling the immediate removal of heat or airborne contaminants. The performance of this system is evaluated through experimental investigations and numerical simulations under various heat source intensities and movement speeds. Given the analogous behavior of heat and pollutant diffusion, this study focuses exclusively on heat dispersion as a simplification.
Section 2 presents the methodology, including the experimental setup and CFD modeling. Section 3 compares the heat removal performance of different exhaust strategies. Section 4 discusses the results in the context of heat plume behavior and exhaust efficiency. Finally, Section 5 concludes with the key findings and implications for industrial ventilation design.
2. Methodology
On-site measurements are a fundamental approach to ventilation research, commonly involving temperature monitoring, air velocity measurements, and smoke visualization. In parallel, a substantial body of prior research has demonstrated that Computational Fluid Dynamics (CFD) simulations offer reliable insights into industrial ventilation performance, particularly in relation to heat sources and exhaust vent configurations [28,29,30]. CFD has also proven effective in accurately predicting buoyancy-driven flows in large enclosed spaces [31,32]. In this study, both physical measurements and CFD simulations were conducted within a controlled environment of identical geometry to ensure consistency and comparability.
2.1. Experimental Setup
The experimental study was carried out at a well-sealed laboratory space measuring 10 m (length) × 3.5 m (width) × 2.8 m (height), as shown as Figure 1. To minimize the influence of external temperature fluctuations on indoor conditions, the experiments were conducted over the period from 3 to 7 October 2023. During this timeframe, local weather conditions were predominantly overcast, with an average outdoor temperature of approximately 22 °C and an indoor temperature of around 25 °C. To further eliminate the influence of solar radiation, all experimental sessions were conducted between 19:00 and 23:00 daily.

Figure 1.
Room measurement points and fixed exhaust vents.
The two primary variables investigated in the experiment were the intensity of the heat source and its movement speed. Three levels of heat source intensity were tested: 1.2 kW, 2.4 kW, and 3.6 kW. For each intensity level, the heat source was moved at three different speeds—0.5 m/s, 0.8 m/s, and 1.0 m/s—resulting in a total of nine distinct experimental cases. Prior to formal data collection, approximately six trial runs were performed for each case to calibrate heat source intensity, movement speed, direction, and distance.
The mobile heat source system comprised several components, as illustrated in Figure 2: (a) a voltage regulator for controlling heating power; (b) a variable-speed motor to adjust the movement speed; (c) a camera for monitoring and recording the setup; (d) a measurement instrument for capturing temperature and air velocity data; (e) a smoke generator for plume visualization; (f) a mobile trolley to simulate a moving heat source.
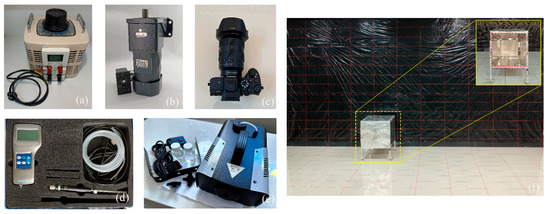
Figure 2.
Experimental instruments and devices: (a) voltage regulator (TDGC20K, CNCQIANG, Wenzhou, Zhejiang, China), (b) speed-regulating motor(TGU-40K, TVT, Wenzhou, Zhejiang, China), (c) high-speed camera(ILCE-7CL, Sony, Tokyo, Japan), (d) air velocity probe (Model 65Ser, KANOMAX, Shenyan, Liaoning, China), (e) smoke generator(FM1500, Jieyoong, China), and (f) heat source device (Handmade, in which the red dotted line indicates the edge).
The mobile trolley featured a cubic frame with side length of 0.5 m, elevated 0.2 m above the ground. An electrically heated wire was uniformly wrapped around the frame, with its power regulated within the range of 1.2 kW to 3.6 kW. To mitigate the effects of thermal radiation, the heating element was covered with aluminum foil containing uniformly distributed fine perforations. The smoke produced by the generator was directed through a heat-resistant PVC hose into the heating unit and uniformly emitted through the perforated foil surface. The trolley was mechanically pulled in a straight line by a motor via a traction rope, with movement speed controlled by a speed regulator.
Six vertical measurement lines—designated as A, B, C, D, E, and F—were arranged on a vertical plane within the room to monitor the spatial temperature distribution, as illustrated in Figure 1. Each line was equipped with seven measurement points spaced 0.25 m apart vertically, with a horizontal interval of 1.5 m between adjacent lines.
Smoke visualization techniques were employed to observe the trajectory of the thermal plume generated by the moving heat source. Upon the simultaneous activation of the heating element and smoke generator, the mobile trolley was set in motion, allowing for dynamic plume tracking. The measurement accuracy of the instruments used in the experimental setup is detailed in Table 1.

Table 1.
Measurement range and uncertainty of main instruments.
Figure 3 illustrates the configuration of the mobile heat source in conjunction with a corresponding tracking exhaust vent. The exhaust vent was mounted in the upper region of the room and was capable of traversing the ceiling space via a system of pulleys and tracks. Its position was regulated by an automated positioning system, which was assumed to detect the real-time location of the heat source and adjust the exhaust vent’s position accordingly. To accommodate the vent’s mobility, the connected duct was designed to be flexible and retractable.

Figure 3.
Moving heat source and tracking exhaust.
To quantify the reliability of the experimental measurements, an uncertainty analysis was conducted for the main instruments used in the study. As listed in Table 1, the accuracy of the temperature sensors was ±0.5 °C, and the air velocity measurements have an uncertainty of ±0.03 m/s. During each experiment, measurements were repeated four times under identical conditions. The standard deviation of the recorded temperatures across all repetitions was within 0.2–0.5 °C, while the variation in plume velocity remained within 0.1–0.2 m/s. It is acknowledged that the instrumentation used in the experiments has a finite measurement uncertainty and that some of temperature differences in the following results chapter fall within this uncertainty range. However, these values should be interpreted as relative trends rather than absolute measurements. The consistency of the repeated trials and their agreement with the simulation results provide confidence in the observed patterns, even though the absolute differences may lie within the margin of measurement error.
The combined uncertainty of temperature measurements was calculated using the root-sum-square method for multiple sources of uncertainty. The overall expanded uncertainty in the average temperature measurement was estimated to be ±0.6 °C at a 95% confidence level. Given the scale of the temperature differences observed between cases, this level of uncertainty is acceptable and does not significantly impact the interpretation of the results. This analysis supports the robustness of the experimental data used for CFD validation and performance evaluation.
2.2. CFD Settings
2.2.1. Case Configuration
As illustrated in Figure 2, three fixed-position exhaust outlets—designated as Exhaust 1, Exhaust 2, and Exhaust 3, from left to right—were arranged along the ceiling. A single air inlet was positioned at the lower part of the right-side wall of the computational domain, measuring 1.5 m in length and 0.35 m in width. The heat source was modeled as a cubic enclosure with a side length of 0.5 m, elevated 0.2 m above the floor surface. The thermal power of the mobile heat source was set at three levels: 1200 W, 2400 W, and 3600 W, respectively.
The motion of the heat source, driven by a variable-speed motor, was divided into three distinct phases: acceleration (startup), constant-speed travel, and deceleration (stopping). However, the acceleration and deceleration phases were completed within a negligibly short time frame and thus were omitted from the simulation. Accordingly, the velocity component in the inertial term of the Archimedes number was approximated using the average speed during the heat source’s motion, with set values of 0.5 m/s, 0.8 m/s, and 1.0 m/s. A detailed summary of these configurations is presented in Table 2.

Table 2.
Parameters of cases in terms of exhaust, heat source speed, and Archimedes number (Ar).
The definition and formulation of the Archimedes number (Ar) are provided in Equation (10) and will be discussed further in Section 2.3.
2.2.2. Heat Source Movement Process
The motion of the heat source was modeled in two sequential stages. In the first stage, the heat source traveled at a constant speed from a position directly beneath Exhaust 1 to a position beneath Exhaust 3. In the second stage, the heat source remained stationary beneath Exhaust 3 for a fixed duration before reversing direction and repeating the cycle.
The pause durations at Exhaust 3 were determined based on the preset movement speeds, with corresponding values of 10 s, 6.25 s, and 5 s for speeds of 0.5 m/s, 0.8 m/s, and 1.0 m/s, respectively. Each complete cycle of motion—including the forward travel, pause, and return—had a total duration of 100 s across all working conditions. The temporal variation in the heat source’s velocity is illustrated in Figure 4.
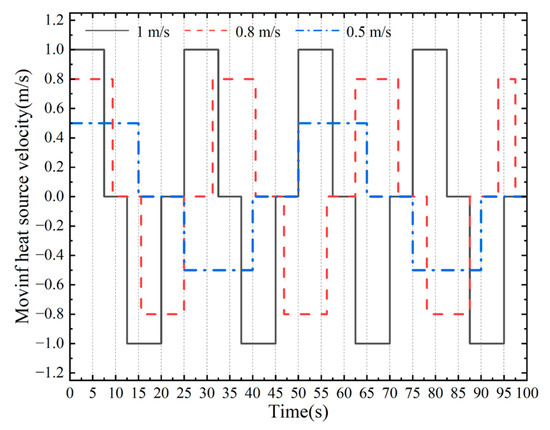
Figure 4.
Moving speeds of heat source over time.
2.2.3. Principles of Numerical Simulation
Computational Fluid Dynamics (CFD) is based on the fundamental principles of fluid mechanics, namely the conservation of mass, momentum, and energy. The governing equations are described by the continuity equation as shown as Equation (1), the Navier–Stokes momentum equation (Equation (2)), and the energy conservation equation as shown as Equation (3) [33]:
Here, ρ is the fluid density, ui is the velocity component, t is time, P is pressure, Tij is the shear stress tensor, gi is the gravitational acceleration component, h is enthalpy, T is temperature, k is the thermal conductivity, and q is the heat source term. Indices i and j denote the spatial directions in a Cartesian coordinate system.
The selection of an appropriate turbulence model is critical for CFD accuracy. The Rayleigh number (Ra), defined in Equation (4), helps determine whether the buoyancy-driven flow is turbulent [34]:
where Ts is the surface temperature, T∞ is the ambient temperature, L is the characteristic length, μ is the dynamic viscosity, α is the thermal diffusivity, and β is the coefficient of thermal expansion. In this study, the calculated Rayleigh number under the lowest heating power (1200 W) is approximately 6.6 × 10¹¹, indicating turbulent buoyancy-driven convection [35].
2.2.4. Turbulence Models
Several turbulence models are used to simulate indoor airflow, including Large Eddy Simulation (LES) [36,37] and Reynolds-Averaged Navier–Stokes (RANS) methods [38]. Although LES offers high accuracy through resolving small-scale vortical structures, it requires substantial computational resources and time [39]. Zhang et al. [31] compared eight lower-cost turbulence models and found the SST k − ω and RNG k − ε models accurately predicted thermal plumes. Similarly, Rohdin et al. [40] found that the RNG k − ε model yielded the closest match to the measured data in large spaces. Cao et al. [41] also confirmed that this model achieves a good balance between accuracy, efficiency, and robustness.
Based on these findings, this study adopted the RNG k − ε turbulence model. It modifies the standard k − ε model using renormalization group theory and incorporated transport equations for turbulent kinetic energy (k) and dissipation rate (ε), as shown in Equations (5) and (6):
In these equations, μeff = μ + μt is the effective viscosity, with μ as the dynamic viscosity and μ as the turbulent viscosity. αk and αε are reciprocal turbulent Prandtl numbers. The term Gk, representing the production of turbulent kinetic energy, is calculated as follows:
The empirical constants used are C1ε = 1.42 and C2ε = 1.68, and the additional term Rε unique to the RNG model is defined by
where η is the local strain rate and the model parameters are μ0 = 4.38 and β = 0.012.
The empirical constants C1ε = 1.42 and C2ε = 1.68 are well-established values derived from renormalization group theory and have been extensively validated in previous studies of indoor airflow and buoyancy-driven turbulence. Similarly, the model-specific parameters = 4.38 and β = 0.012 are based on the theoretical foundation of the RNG formulation. They control the rate at which the dissipation correction term Rε modifies the standard turbulence dissipation rate and have been shown to improve prediction accuracy in high-gradient and anisotropic flow fields. Given the consistency of these constants across the validated literature, they were retained in this study without further modification.
2.2.5. Solution Methods and Buoyancy Model
The coupled algorithm was employed for pressure–velocity coupling. For pressure discretization, the PRESTO scheme was used, while the second-order upwind scheme was chosen for momentum, k, and ε due to its higher accuracy in capturing complex flow structures compared to first-order schemes.
For natural convection, the Boussinesq approximation was applied, where density is treated as a linear function of temperature. The buoyancy force term is expressed as Equation (9):
where ρ is the reference density at temperature and β = This approximation is valid when ≪ 1, a condition satisfied in this study.
The use of Equation (9) is based on the Boussinesq approximation, which assumes that variations in fluid density are negligible except where they appear in the buoyancy term. This approach simplifies the governing equations while maintaining accuracy for natural convection flows where temperature differences are moderate.
In this study, the maximum temperature difference in the simulation domain did not exceed 20–25 K, which satisfies the condition ≪ 1, which is required for applying the Boussinesq approximation. Additionally, this model allows the CFD solver to treat air as an incompressible fluid while still accounting for buoyancy effects, thereby significantly improving computational stability and efficiency.
Previous studies [42,43,44] have validated the use of this approximation in large indoor air simulations, including industrial spaces with thermal stratification and plume rise phenomena. Therefore, Equation (9) is both physically justified and computationally advantageous for modeling natural convection in the present context.
2.2.6. Dynamic Mesh Methods
To simulate moving objects, three dynamic mesh methods are typically used: traditional dynamic mesh, overset mesh, and sliding mesh. Each has unique advantages. Traditional dynamic mesh includes layering, elastic smoothing, and local remeshing. Among these, elastic smoothing with local remeshing is best suited to non-rigid three-dimensional movement. Overset mesh allows for the independent motion of overlapping mesh zones but is computationally intensive and complex to set up. Sliding mesh is mainly used in rotating machinery and is limited in its applicability in linear translational motion.
Considering computational efficiency and geometric complexity, this study employed elastic smoothing combined with local remeshing to simulate the 3D motion of the mobile heat source and the 2D tracking of the exhaust vent. All simulations were carried out using ANSYS FLUENT 2021, a well-established tool with a validated performance in similar CFD applications.
2.2.7. Boundary Conditions
For the CFD simulations, the following boundary conditions were applied. Exhaust Velocity: The exhaust velocity at the three fixed exhaust openings (Exhaust 1, Exhaust 2, and Exhaust 3) was set to 1 m/s. Wall Conditions: The walls were assumed to be adiabatic (no heat exchange) and non-slip, meaning no heat transfer was assumed across the walls. This approach was chosen to reflect the insulated or thermally passive characteristics of the laboratory test environment, where the walls were constructed to minimize heat exchange with the surroundings. Additionally, during the physical experiments, the test chamber was located in a well-sealed room with limited external thermal influence, and the experimental schedule deliberately avoided periods of solar radiation or large ambient temperature fluctuations. Ambient Conditions: The ambient temperature was set to = 298.15 K (reference temperature), and the reference pressure was Pop = 101,325 Pa.
To simulate the movement of the heat source, the DEFINE_CG_MOTION macro in the Fluent User-Defined Function (UDF) program was used. The heat source moved a total of 7.5 m along the positive X-axis direction (from left to right, as shown in Figure 2). The dynamic mesh technology was applied, incorporating spring smoothing combined with mesh reconstruction (remeshing) to accommodate the movement of the heat source.
In order to avoid negative cell volumes during the dynamic mesh simulation, the following settings were used. The spring constant factor was set to 0.1, with a maximum number of iterations of 100. The mesh was smoothed using tetrahedral elements within tetrahedral zones. The minimum cell size was set to 0.4 Lmin, and the maximum cell size was set to 1.4 Lmax, where Lmin and Lmax refer to the minimum and maximum mesh sizes defined during mesh generation, respectively. The maximum cell skewness was limited to 0.75, and the maximum face skewness was set to 0.5. The remeshing interval for size adjustments was set to 1.
The time step for the unsteady calculations was set according to the relation Δt = Δs/v, where Δs is the minimum grid size, and v is the velocity of the moving heat source [33]. The convergence of all simulation results was assessed by monitoring the residuals. The residuals for the velocity equation, continuity equation, k-equation, and ε-equation were required to be less than 10−5, while the residual for the energy equation was required to be less than 10−8. The formation of the thermal plume was primarily driven by convective heat transfer in this study. The effects of radiation were not considered in the simulations.
2.2.8. Mesh Generation and Near-Wall Treatment
Temperature and velocity were particularly sensitive to mesh resolution and near-wall treatment in the simulation of indoor airflow environments [45]. In this study, Fluent Meshing was employed to construct the computational grid, using exclusively tetrahedral mesh elements throughout the domain.
To enhance the numerical stability and ensure the accurate prediction of velocity, temperature, and pressure distributions, particularly in regions with significant gradients, mesh refinement was applied in critical areas. Specifically, a densified boundary layer mesh was generated around the surface of key objects, such as the moving heat source. The boundary layer near the heat source surface was divided into 10 layers, enabling the more accurate capture of thermal plume development and wall shear effects, as illustrated in Figure 5a,b.

Figure 5.
(a) Three-dimensional perspective view of the computational domain mesh; (b) XY plane view. The red box indicates that the grid at the edge has been refined.
Additionally, local mesh refinement was applied at both the inlet and outlet boundaries to better resolve the airflow characteristics in these regions, where velocity and pressure variations are typically more pronounced.
2.2.9. Grid Independence Verification
To ensure the reliability of the simulation results while maintaining the computational efficiency, a mesh independence study was conducted using four different mesh densities. The total number of cells for each case was approximately: 0.93 million (a), 1.47 million (b), 2.04 million (c), and 2.76 million (d). Detailed mesh configuration information is presented in Table 3, with differences primarily concentrated in the refined regions near the inlet, outlet, and heat source surfaces.

Table 3.
Meshing method and mesh information.
Figure 6 compares the dimensionless temperature and velocity distributions in the vertical region directly above the heat source (0.3–2.1 m) for the four mesh configurations. The results show that all four meshes produce simulation outputs consistent with the experimental measurements. Among them, the Mesh Scheme c (2.04 million cells) demonstrates the closest agreement with the experimental data, indicating it has sufficient resolution to accurately capture flow and thermal gradients.
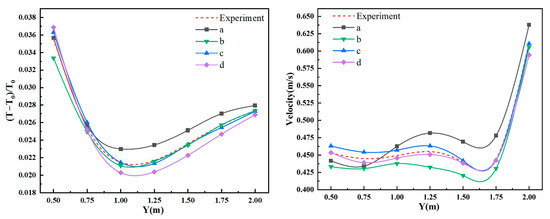
Figure 6.
Predicted temperature and velocity distributions above the heat source at four mesh densities.
Based on the trade-off between computational accuracy and efficiency, Scheme c was selected as the mesh strategy for all subsequent numerical simulations in this study.
2.3. Comparison of Simulation and Experimental Data
The Archimedes number (Ar) is a dimensionless parameter that characterizes the relative significance of buoyancy forces to inertial forces in natural convection flows. This provides valuable insight into the thermal plume behavior in relation to the motion of the heat source. The definition of Ar adopted in this study follows that proposed by Nielsen et al. [46], and is expressed as follows:
where g is the acceleration due to gravity (m/s2), β is the thermal expansion coefficient of the fluid (1/K), is the surface temperature of the heat source (K), is the ambient temperature (K), L is the characteristic length of the heat source (m), and U is the characteristic velocity of the heat source movement (m/s).
In this study, the surface temperature was determined as the average of five monitoring points, located 0.1 m above the four corners and at the center of the upper surface of the heat source, once the indoor temperature distribution reaches a quasi-steady state. The characteristic length L corresponds to the edge length of the cubic heat source, and the velocity U refers to the set average translational speed of the moving heat source.
The calculated Archimedes numbers for all 27 simulated cases—covering different combinations of heating power and moving speeds—are summarized in the rightmost column of Table 2 in Section 2.2.1. These values are used to assess the interaction between thermal plume development and source velocity, and form the basis for a comparison between the simulation results and the experimental measurements as Figure 7 and Figure 8.
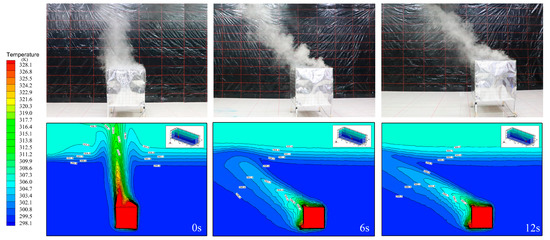
Figure 7.
Comparison of smoke visualization and numerical simulation temperature fields at 0 s, 6 s, and 12 s in Case 2 (Ar = 2.04).
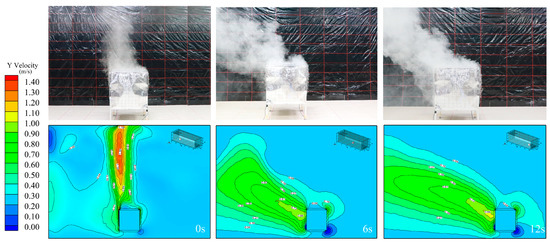
Figure 8.
Comparison of smoke visualization and numerical simulation velocity fields at 0 s, 6 s, and 12 s in Case 3 (Ar = 2.99).
To visually verify the accuracy of the numerical simulation, we selected Case 2 and Case 3, that is, when the Exhaust 1 in Figure 1 is open, the heat source moving speed is 0.5 m/s. The heating intensities of 2.4 kW (Ar = 2.04) and 3.6 kW (Ar = 2.99) are presented in Figure 7 and Figure 8, compared with experimental photos respectively. Figure 7 shows the temperature contours at 0 s, 6 s, and 12 s in Case 2, as well as velocity in Figure 8. Obviously, the numerical simulation results have good similarities with smoke in terms of temperature field and flow field.
In addition, Figure 9 presents a comparison of the vertical temperature profiles obtained from both the simulation and the experimental results. Figure 9a specifically illustrates the temperature distribution along the six vertical lines A to F (as defined in Figure 2) when the heat source remains stationary. In the transient simulation, the formation of temperature stratification is observed over time, with warmer air accumulating in the upper region of the room (Y = 1.6 m to 2.1 m) and subsequently being removed through the ceiling exhaust vents.
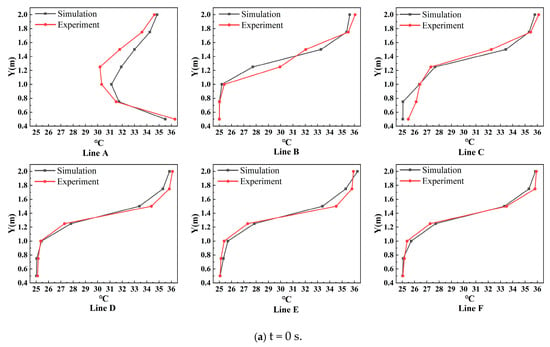
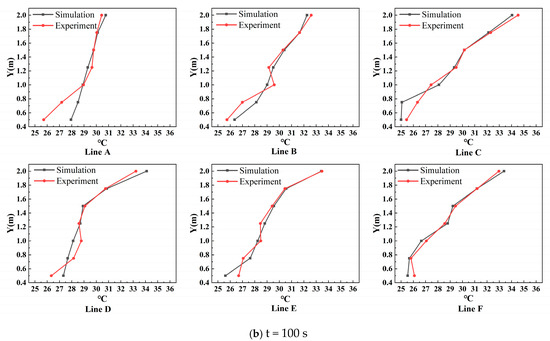
Figure 9.
Temperatures of different measuring points in the experiment and simulation before and after the heat source movement: (a) 0 s; (b) 100 s (Ar = 2.99).
The comparison reveals that the temperature trends predicted by the simulation closely match those measured experimentally across all six vertical lines. Nevertheless, a maximum discrepancy of approximately 2 °C is observed at a height of 1.25 m on line A, which is positioned closest to the heat source. This deviation is attributed to local temperature fluctuations in the region above the heat source—a phenomenon consistent with findings in a previous study [47]. In contrast, test lines C through F, which are located further away from the heat source, exhibit smaller differences between the simulated and experimental values, further validating the accuracy of the CFD model in regions less affected by the direct thermal plume.
Figure 9b shows the vertical temperature distributions along each test line after the heat source has been in motion for 100 s. Overall, the simulated and experimental thermal profiles demonstrate good agreement, indicating that the simulation effectively captures the general behavior of the indoor airflow and heat transfer. However, noticeable discrepancies appear in the height range of Y = 0.4 m to 0.8 m, where the experimental temperatures deviate slightly from the simulation results.
This discrepancy is primarily attributed to fluctuations in the thermal plume and localized convection effects that are difficult to fully capture in the numerical model. In the experiments, slight variations in airflow, turbulence, and heat dispersion caused by surrounding air disturbances or non-ideal insulation may have contributed to the uneven temperature readings at specific heights. Furthermore, the simplifications used in the CFD model, such as the Boussinesq approximation, idealized boundary conditions, and mesh resolution limitations, can also lead to deviations in predicting peak thermal gradients.
Despite these localized deviations, the results confirm that the numerical model accurately predicts the temperature distribution throughout most of the domain, further validating the effectiveness of the simulation methodology under dynamic heat source conditions.
3. Results and Analysis
3.1. Fixed Exhaust Vent with a Fixed Heat Source
This section evaluates the heat removal effectiveness of three different exhaust outlet positions—Exhaust 1, Exhaust 2, and Exhaust 3 (refer to Figure 2)—with the heat source power fixed at 3.6 kW. As shown in Figure 10a–c, the heat source generates a vertical thermal plume, which accumulates beneath the ceiling and forms a distinct high-temperature stratification layer.
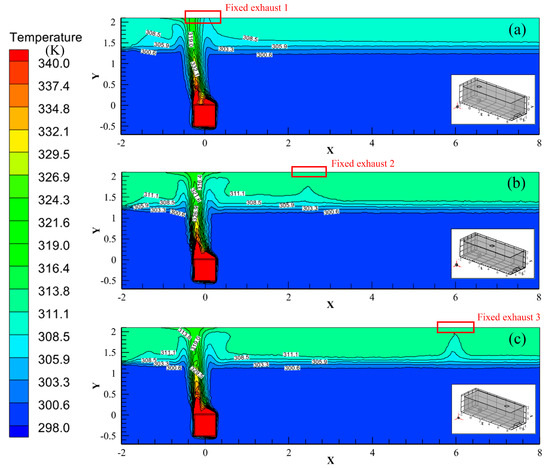
Figure 10.
Temperature distribution on the mid-vertical plane for (a) Exhaust 1, (b) Exhaust 2, and (c) Exhaust 3, with a stationary 3.6 kW heat source.
In the case of Exhaust 1 (Figure 10a), the high-temperature region (T > 308.5 K) is primarily located in the upper zone (Y > 1.6 m). The temperature remains below 300.6 K in the lower region (Y < 1.3 m), indicating clear vertical stratification.
For Exhaust 2 (Figure 10b), the temperature in the upper part of the room increases further, exceeding 311.1 K for Y > 1.3 m. The T = 300.6 K isotherm descends slightly, now located around Y = 1.2 m, suggesting more pronounced heat accumulation at the top.
In the scenario of Exhaust 3 (Figure 10c), although the general stratification pattern is similar to that of Exhaust 2, the temperature layer between 308.5 K and 311.1 K becomes thinner in the horizontal range of X = 1–5 m. This thinner stratified layer results from the increased distance between the heat source and Exhaust 3. As the hot air takes longer to reach the outlet, it circulates more within the room, leading to a higher overall room temperature.
These results clearly show that the closer the exhaust vent is to the heat source, the more efficiently the heated air is expelled, reducing indoor heat accumulation under stationary source conditions.
Figure 11 illustrates the temperature profiles along vertical line A under three heat source powers—1.2 kW, 2.4 kW, and 3.6 kW—for three fixed exhaust vent locations. Across all working conditions, the temperature trend exhibits a non-monotonic pattern: it first decreases and then increases along the vertical axis. The temperature reaches its peak near the heat source at Y = 0.5 m, followed by a decrease in the mid-region (Y = 0.6–1.8 m) as the heated air disperses upward. Subsequently, the temperature increases again in the upper region of the room (Y > 1.8 m) due to thermal accumulation near the ceiling. However, this upper-region temperature remains lower than the peak near the heat source, suggesting intense local convective heat transfer near the ground-level heat source.
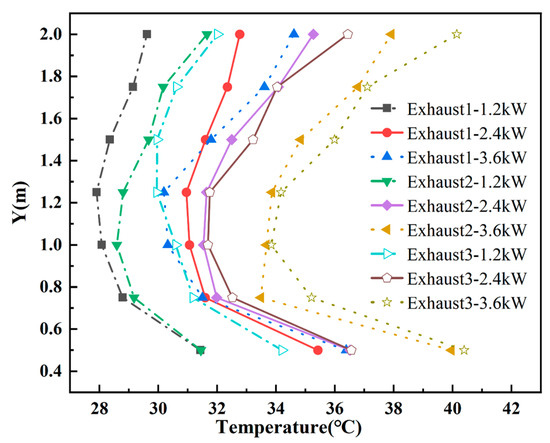
Figure 11.
Temperature distribution along vertical line A under different heat source powers (1.2 kW, 2.4 kW, and 3.6 kW) and exhaust vent positions (Exhaust 1, Exhaust 2, and Exhaust 3) with a stationary heat source.
This stratification phenomenon—characterized by an upper warm layer and a cooler middle layer—is consistently observed across all heat source power levels. The high local temperature gradient near the source can be attributed to its proximity to the ground and the resulting strong buoyancy-driven convection caused by the significant temperature difference between the source surface and the surrounding air. Furthermore, a comparison of exhaust vent configurations clearly shows that TExhaust 1-1.2 kW < TExhaust 2-1.2 kW < TExhaust 3-1.2 kW at the same height. This pattern confirms that the proximity of the exhaust vent to the heat source significantly enhances heat removal efficiency. Similar trends were observed for the 2.4 kW and 3.6 kW conditions, further validating this conclusion.
When the heat source is stationary, the closer the exhaust vent is to the heat source, the more efficiently the high-temperature air can be discharged, minimizing heat buildup in the space. However, many industrial environments feature moving heat sources, making it impractical to maintain a fixed exhaust vent directly above the source. Therefore, the next section will explore an idealized scenario in which both the heat source and exhaust vents are mobile and synchronized, allowing the vent to remain directly above the heat source during motion.
3.2. Synchronously Moving Exhaust Vent
In conventional ventilation systems, exhaust vents are typically fixed in position. However, when a heat source is mobile, fixed exhaust configurations may struggle to remove the rising hot air effectively, leading to indoor heat accumulation. This raises a critical question: Can the efficiency of heat removal be improved if the exhaust vent moves in sync with the heat source? To explore this idea, we conducted a numerical study based on Case 3, characterized by an Archimedes number (Ar) of 2.99, a heat source power of 3.6 kW, and a constant motion velocity of 0.5 m/s.
The motion trajectory of the heat source is as follows. It moves uniformly along the positive X-axis (left to right in Figure 2) at 0.5 m/s, traveling from the starting point (X = 0 m) to the endpoint (X = 7.5 m) in 15 s. After reaching the endpoint, it remains stationary for 10 s. It then returns to the starting point at the same speed. Finally, it remains at the starting point for 10 s. This entire movement sequence is defined as one complete cycle. The simulation covers two such cycles over a total time of 100 s.
Figure 12a,b illustrate the temperature contours over time in two scenarios. One is a fixed exhaust vent, Exhaust 1, shown in Figure 12a. A synchronously moving exhaust vent that tracks the heat source in real-time, maintaining a position directly above the source throughout the motion, is shown in Figure 12b.
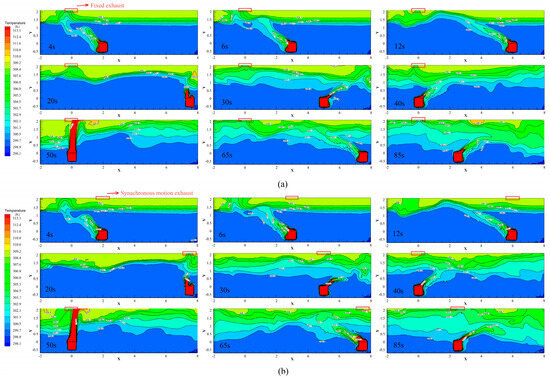
Figure 12.
Temperature stratification when Ar = 2.99: (a) fixed exhaust; (b) synchronous-motion exhaust.
It can be seen from Figure 12a that at t = 4 s, the temperature stratification patterns are similar for both exhaust configurations. However, by t = 6 s, the motion of the heat source begins to induce minor disturbances in the stratified thermal layers. During the first 20 s, a relatively stable temperature stratification is maintained in the upper part of the room. As the heat source continues to move, by t = 40 s, the upper thermal layer starts to gradually mix with the lower layers, disrupting the vertical temperature profile. A similar trend is observed in Figure 12b for the synchronously moving exhaust vent.
A comparison between Figure 12a,b at t = 40 s reveals that the thickness of the high-temperature layer (T > 300 K) in the case of a fixed exhaust is slightly greater than in the moving exhaust scenario. At the Y = 1.5 m plane, the air temperature with the fixed exhaust is approximately 1 K higher, and at Y = 1.2 m, the difference increases to nearly 2 K in favor of the synchronously moving vent.
After t = 50 s, the non-moving region on the left side of the heat source becomes significantly influenced by the exhaust type. With a fixed exhaust, the vertical thickness of the area where T > 299.8 K is roughly 0.3 m thicker than that observed under the synchronous exhaust configuration. However, by t = 85 s, the thermal distributions from both setups become more similar, making it difficult to clearly distinguish performance differences.
Figure 13a,b illustrate the velocity field and streamlines on the mid-plane (XY) of the room. At t = 4 s, during the early stage of movement, the thermal plume remains concentrated around the heat source and begins to diffuse upwards.
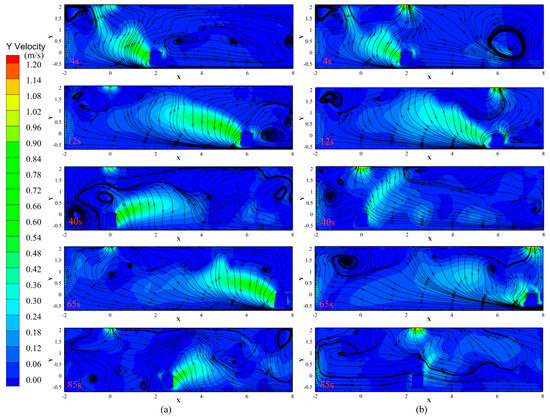
Figure 13.
Streamlines of the XY plane when Ar = 2.99: (a) fixed exhaust; (b) synchronous-motion exhaust.
In Figure 13a, where the exhaust outlet is fixed, the thermal plume is not discharged efficiently, causing streamlines to accumulate near the heat source. As the movement continues, the plume spreads more horizontally along the X-direction, becoming unstable. Since the exhaust remains stationary at Exhaust 1, buoyant heat removal becomes inefficient, and the streamlines become increasingly chaotic, with larger vortex structures forming—indicating thermal stagnation and recirculation.
In contrast, Figure 13b depicts the indoor airflow pattern with a synchronously moving exhaust outlet. During t = 0–65 s, the indoor recirculation zones and vortices are significantly smaller than in the fixed exhaust case. By t = 85 s, these flow disturbances are further reduced. This is attributed to the exhaust vent remaining directly above the moving heat source, and therefore continuously removing the rising hot air in a timely and localized manner. As a result, the thermal diffusion is effectively controlled, and the formation of complex flow structures is minimized.
Figure 14 presents the thermal flux through the exhaust, calculated using the integral function in Ansys Fluent. At t = 20 s, the heat flux from the synchronously moving exhaust is significantly higher than that of the fixed exhaust. The synchronous exhaust can effectively track the heat source, allowing it to discharge the heat more efficiently. At this moment, the heat flux through the moving exhaust is approximately 4750 W, whereas the fixed exhaust, unable to follow the moving heat source, shows a flux of around 4600 W.
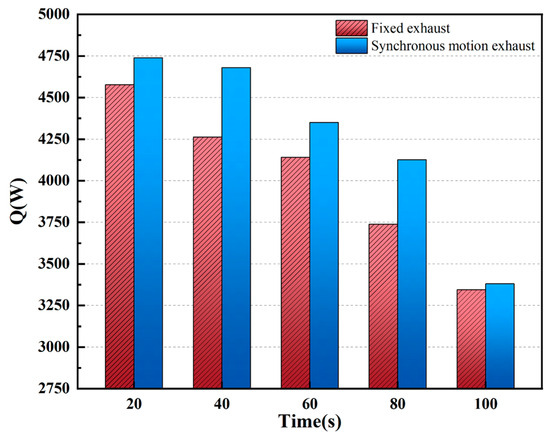
Figure 14.
Heat flux through outlet over time; Ar = 2.99.
At t = 40 s, the moving exhaust continues to exhibit high heat removal efficiency, with a heat flux of approximately 4680 W, while the fixed exhaust’s flux drops significantly to about 4250 W. Over time, although both exhaust types show a downward trend in heat flux, the synchronous exhaust consistently maintains a higher heat flux, indicating a more effective heat removal process. This results in better heat dissipation and improved thermal comfort. The synchronously moving exhaust increases the exhaust air volume by an average of 8% compared to the fixed exhaust system.
The decreasing heat flux in both exhaust systems can be attributed to the continuous movement of the heat source, which causes the mixing of the upper- and lower-temperature regions in the room. Initially, a large amount of heat is extracted, leading to a high heat flux. However, as the temperature field inside the room becomes increasingly stirred, the temperature stratification is disrupted, resulting in a decrease in the average temperature at the exhaust outlet.
In summary, the synchronously moving exhaust outperforms the fixed exhaust by an average of 8%. Its ability to adjust its position in real-time and stay aligned with the moving heat source allows it to remove heat more efficiently, while also reducing vortex formation and backflow.
Furthermore, Figure 12 and Figure 13 show that, during the heat source’s movement, the heat plume forms an angle with the vertical direction. If the exhaust vent could move along the centerline of the heat plume, this could further enhance the heat removal efficiency. However, before optimizing this system, the angle of the heat plume must be considered, which will be discussed in the following section.
3.3. Thermal Plume Characteristics of Mobile Heat Sources
In Figure 12, we can observe an angle α between the heat plume and the vertical direction when the power and moving speed of the heat source are fixed. This suggests that an Archimedes number (Ar) can be established to characterize the relationship between the forces of buoyancy and inertia. To more precisely define the angle α between the heat plume and the vertical direction, we can choose to measure the angle at t = 6 s, as shown in Figure 15.
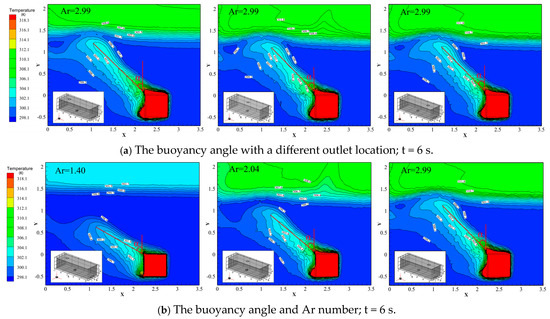
Figure 15.
Thermal plume angle of moving heat source.
In Figure 15a, the angle α remains approximately constant at 46° across all three exhaust port positions (Exhaust 1, Exhaust 2, and Exhaust 3). This holds true whether the heat source power is 1.2 kW (Ar = 1.40) or 2.4 kW (Ar = 2.04). These results suggest that the correlation between the heat plume and the fixed exhaust port position is minimal. Therefore, the effect of exhaust position will not be discussed further.
In Figure 15b, the angle α of buoyancy varies with different Archimedes numbers (Ar). Specifically, it is 60° for Ar = 1.40, 51° for Ar = 2.04, and 46° for Ar = 2.99. Figure 16 shows the corresponding relationship between α and the Archimedes number across different cases (1–3, 10–12, and 19–21 in Table 1) for three different powers and speeds. The Archimedes number Ar is given by Equation (10), derived from Nielsen [39]. Using linear regression fitting, the formula for α (Equation [11]) is obtained. From the results, it is evident that for each unit increase in Ar, the angle α decreases by approximately 11°.
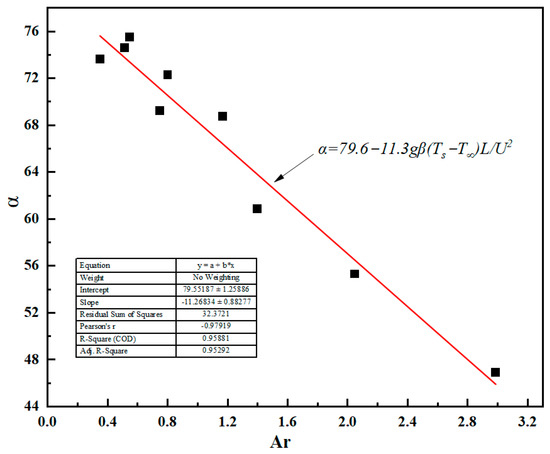
Figure 16.
Linear relationship between thermal plume angle α and Ar number.
In the next section, we will examine the heat removal effect when the moving exhaust vent is positioned along the centerline of the heat plume.
3.4. Buoyancy-Tracking Exhaust Vent
This section explores the heat removal effect when the exhaust vent follows the moving heat source and is located along the centerline of the heat plume. Firstly, the angle α is approximately 46° when Ar = 2.99 (p = 3.6 kW and v = 0.5 m/s).
Figure 17 illustrates the relative motion between the moving heat source and the exhaust vent that tracks the heat plume. The exhaust vent begins to move in sync with the heat source to remain aligned with the centerline of the heat plume. Initially, the heat source moves forward along the X-axis at a speed of 0.5 m/s for 4 s from the starting position (t = 0 s, X = 0 m). The heat source reaches the end point (X = 7.5 m) after 15 s, then remains stationary for 10 s. Afterward, the heat source returns along the same path at the same speed. This cycle repeats twice, totaling 100 s. The buoyancy-tracking exhaust vent always lags behind the heat source by 4 s to maintain its alignment with the heat plume’s centerline.
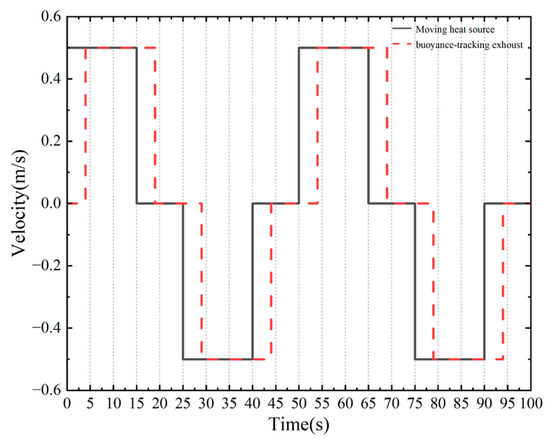
Figure 17.
Speed of the buoyancy-tracking exhaust over time.
Throughout the 0–100 s time period, we recorded the room temperature every 10 s, resulting in a total of 11 sets of average room temperature data (with Ar = 2.99, p = 3.6 kW, and v = 0.5 m/s). To evaluate the differences in heat removal efficiency, a variance analysis and a paired-sample t-test were conducted. The results of these statistical tests are presented in Table 4.

Table 4.
Average temperature levels between fixed exhaust vent and tracking exhaust vent.
Table 4 indicates that there is a difference in controlling indoor temperature between the fixed exhaust vent (M = 28.69, SD = 0.29) and the tracking exhaust vent (M = 28.62, SD = 0.24). The tracking exhaust vent proves to be more effective in expelling indoor heat and controlling the indoor temperature. The statistical analysis results show t(11) = 3.98, p = 0.003 (p < 0.05), confirming the difference in heat removal efficiency.
In Figure 18a, a comparison of three ventilation technologies—(1) fixed-position Exhaust 1, (2) synchronous-motion exhaust (located at the same x-coordinate as the heat source), and (3) buoyancy-tracking exhaust (located at the center line of the heat plume when Ar = 2.99 (p = 3.6 kW and v = 0.5 m/s)—shows the following trends.

Figure 18.
Average room temperatures over time using three different forms of outlets.
The temperature increased by 1.1 °C from 28.24 °C at 0 s to 29.37 °C at 100 s. This rise is attributed to the fixed exhaust outlet’s inability to track the heat source, resulting in heat accumulation, especially when the heat source was far from the exhaust vent. The temperature increased by 0.9 °C, from 28.2 °C at the initial moment to 29.1 °C at 100 s, showing a better heat removal efficiency in the synchronous-motion exhaust than the fixed exhaust. For the buoyancy-tracking exhaust, the temperature increased by 0.7 °C, from 28.2 °C at time 0 s to 28.9 °C at 100 s, making it the most efficient option, outperforming both the fixed exhaust and synchronous-motion exhaust by 0.4 °C and 0.2 °C, respectively.
Figure 18b shows that when the heat source intensity is further increased to 7.2 kW, 10.8 kW, and 14.4 kW, the temperature reduction achieved by the buoyancy-tracking exhaust vent relative to the fixed exhaust outlet is approximately 2.1 °C, 2.8 °C, and 3.8 °C, respectively. The temperatures for the synchronously moving exhaust vent remain between the two, at 0.8 °C, 1.9 °C, and 2.3 °C, respectively.
These data clearly demonstrate the improved performance of the buoyancy-tracking exhaust, which achieves better thermal comfort by maintaining more effective heat removal.
3.5. Plane Temperature of Each Horizontal Section
In Figure 19, the temperature distribution at different heights (ranging from 1.2 m to 2.7 m) is analyzed for three types of exhaust vents at 15 s, 55 s, and 90 s.
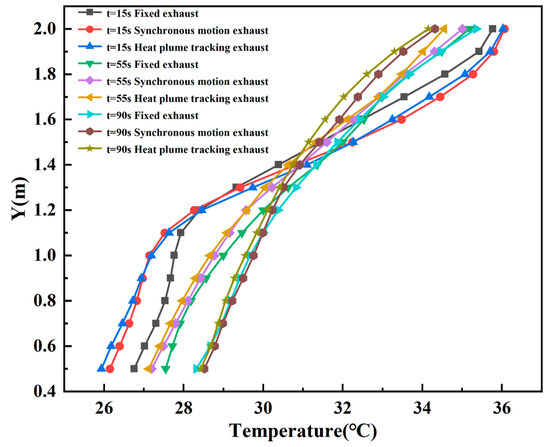
Figure 19.
Temperature shown along line A for three different types of outlets.
At 15 s, both synchronous-motion exhaust and buoyancy-tracking exhaust vents show similar effects on the vertical temperature distribution in the room. These mobile exhausts manage to reduce the room temperature by about 1 °C compared to the fixed exhaust vent between Y = 0.5 m and 1.3 m (the lower part of the room). The fixed exhaust vent performs slightly better in maintaining a lower temperature in the upper part of the room (Y > 1.3 m), likely due to its steady position and stable exhaust flow.
At 55 s and 90 s, the effects of all three exhaust types become more apparent, especially in the upper part of the room (Y > 1.3 m). Mobile exhaust vents continue to increase the temperature reduction in this upper region, with the buoyancy-tracking exhaust outperforming the synchronous-motion exhaust, showing a maximum temperature difference of around 1.5 °C at the top of the room.
Thus, mobile exhaust vents (both synchronous-motion and buoyancy-tracking) generally offer better temperature control in the lower part of the room (Y < 1.3 m). The buoyancy-tracking exhaust performs the best overall, especially in the upper part of the room, providing more efficient heat removal compared to other exhaust types.
The heat removal efficiency is an indicator for evaluating indoor air quality and is calculated using Formula (12), from [48]. It directly affects multiple aspects, such as heat removal efficiency, thermal comfort, and energy consumption. The heat removal efficiency ET is a critical factor for evaluating indoor air quality. It is defined by the following formula:
where is the exhaust air temperature, is the supply air temperature, and is the occupied area temperature (the average temperature of the entire room), in K.
From Figure 20, we can observe the heat exhaust efficiency of three different exhaust vent types during the periodic movement of the heat source in the room. For the fixed exhaust vent, the heat removal efficiency remains relatively low throughout the time period. From 65 s to 100 s, the efficiency remains constant at around ET = 1.8, significantly lower than that of both the synchronous-motion exhaust vent and the buoyancy-tracking exhaust vent. This vent moves synchronously with the heat source, and its heat removal efficiency is generally better than that of the fixed exhaust vent. The performance is closely comparable to the buoyancy-tracking exhaust vent in the first 65 s, showing an overall good heat removal capability. The buoyancy-tracking exhaust vent tracks the heat plume and is located at the center line of the heat plume. It consistently exhibits the best heat removal efficiency, especially from 65 s to 100 s. The efficiency of this system is slightly higher than that of the synchronous-motion exhaust vent, making it the most efficient system for capturing heat and managing indoor temperature.
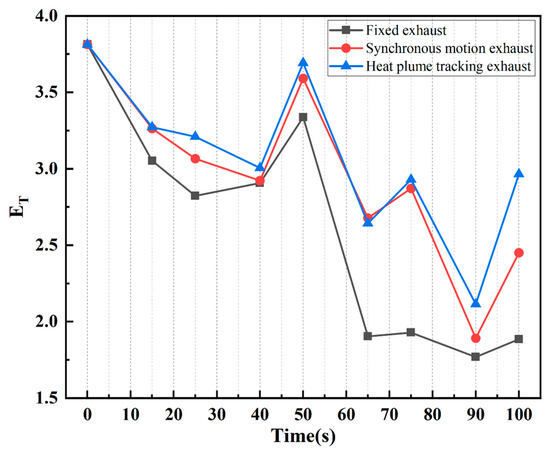
Figure 20.
Heat removal efficiency in three types of outlets.
In summary, the buoyancy-tracking exhaust vent, which is positioned at the center of the heat plume, provides the most effective heat removal. This is due to its ability to closely follow the movement of the heat plume, capturing heat as it moves, and maintaining a higher heat removal efficiency. On average, the tracking exhaust vent’s efficiency is 1.18 times better than that of the fixed exhaust vent across all time points, demonstrating a clear advantage in optimizing heat removal.
4. Discussion
4.1. Overview of Heat Exhaust Efficiency in Different Systems
The study examined three different exhaust strategies in a room with a moving heat source: a fixed exhaust vent, a synchronous-motion exhaust vent, and a buoyancy-tracking exhaust vent. The primary objective was to compare their efficiency in removing heat generated by the heat source, which moves along the X-axis with a velocity of 0.5 m/s and powers of 3.6 kW, 7.2 kW, 10.8 kW, and 14.4 kW. Our analysis also considered how each exhaust system affects the room’s temperature stratification and heat removal efficiency.
From the results, it is clear that the buoyancy-tracking exhaust vent outperforms the other two exhaust systems in terms of heat removal efficiency and overall thermal management within the room. The fixed exhaust system demonstrated the least efficient heat removal, particularly when the heat source was far from the exhaust outlet. Conversely, the synchronous-motion exhaust vent, while more efficient than the fixed exhaust vent, still could not match the performance of the buoyancy-tracking exhaust vent.
4.2. Thermal Stratification and Temperature Distribution
The study extensively analyzed the temperature distribution in the room at various heights and time intervals. Both the synchronous-motion exhaust vent and the buoyancy-tracking exhaust vent show an advantage over the fixed exhaust vent in reducing the temperature in the lower half of the room. By continuously tracking the heat source, these mobile exhaust systems helped prevent the accumulation of hot air in the room’s upper sections.
The temperature stratification near the ceiling was better maintained in the case of the fixed exhaust vent in the upper part of the room (Y > 1.3 m), but this benefit was outweighed by the overall superior temperature control provided by the mobile exhaust systems. The buoyancy-tracking exhaust vent also reduced the room temperature by a larger margin in the upper section compared to the other systems, demonstrating its superior ability to effectively manage thermal stratification.
4.3. Heat Removal Efficiency
The heat removal efficiency was directly correlated with the movement and positioning of the exhaust vent. As shown in Figure 20, the buoyancy-tracking exhaust vent consistently exhibited the highest efficiency, particularly as it followed the centerline of the heat plume. This tracking ability enabled the exhaust system to capture heat more effectively, as the exhaust vent was always aligned with the heat source, minimizing heat buildup and thermal discomfort.
The synchronous-motion exhaust vent, while not as efficient as the buoyancy-tracking exhaust, still provided an obvious improvement over the fixed exhaust system at average temperature reductions of 0.25 °C, 0.8 °C, 1.9 °C, and 2.3 °C. The fixed exhaust vent performed poorly in the second half of the cycle when the heat source moved away from the vent, leading to inefficient heat removal and room temperature increases.
From the statistical analysis, the buoyancy-tracking exhaust vent exhibited an average heat removal efficiency that was 1.18 times greater than that of the fixed exhaust system, and the temperature reduction achieved by the buoyancy-tracking exhaust vent relative to the fixed exhaust outlet was approximately 0.4 °C, 2.1 °C, 2.8 °C, and 3.8 °C. This demonstrates the efficiency gains achieved by exhaust systems that are capable of dynamically adjusting their position to follow the heat source.
4.4. The Role of Archimedes Number (Ar) and Heat Plume Angle
The Archimedes number (Ar) proved to be a crucial factor in understanding the interaction between buoyancy and inertia, which significantly influences the heat plume’s behavior and the exhaust system’s ability to remove heat. A higher Ar value, indicating stronger buoyancy forces, was associated with a larger heat plume angle. In our study, the heat plume angle (α) decreased with increasing Ar, indicating that stronger buoyancy forces result in a more vertical heat plume.
This observation is critical when positioning exhaust vents. For effective heat removal, exhaust systems should be able to track the heat plume’s centerline, as the plume’s behavior is strongly dependent on its angle. By dynamically positioning exhaust outlets along this line, we can achieve more efficient heat removal, as seen with the buoyancy-tracking exhaust vent.
4.5. Guidelines for Implementing Dynamic Exhaust Systems in Industrial Environments
Based on the findings, several practical guidelines can be established for the implementation of dynamic exhaust systems in industrial environments:
- (1)
- Mobile exhaust systems are essential in workspaces with moving high-temperature or high-pollution sources (e.g., arc welding or molten metal transfer). Fixed exhaust vents are insufficient when the source is serous, strong, or dangerous.
- (2)
- Synchronous motion exhausts (aligned with the horizontal motion of heat sources) offer an improvement over static designs and can be implemented using rail-guided or motorized arms with position sensors.
- (3)
- Buoyancy-tracking exhausts, which align with the centerline of the heat plume, yield the highest removal efficiency. These systems can be optimized by predicting the thermal plume angle using the Archimedes number, as proposed in this study.
- (4)
- The proposed tracking method can reduce average room temperature by up to 0.4 °C more than conventional systems, which translates to improved thermal comfort, increased energy efficiency, and improved worker health outcomes.
- (5)
- This framework is also applicable to pollutant-tracking, as heat and gaseous contaminant plumes behave similarly. Therefore, the system can be adapted to track fumes, VOCs, or particulate emissions in dynamic environments.
4.6. Challenges and Future Research Directions
Despite the promising results of the buoyancy-tracking exhaust system, there are challenges in implementing such systems in real-world settings. These include the complexity of designing and installing dynamic exhaust systems that can track heat sources with precision and the cost associated with integrating such technologies into existing ventilation infrastructures. Future research should explore the following:
- (1)
- The development of advanced tracking mechanisms that can dynamically adjust the position of the exhaust vent in real-time based on heat source movement.
- (2)
- The optimization of control algorithms for synchronizing exhaust vent movement with heat source behavior, considering factors like air velocity, temperature gradients, and room geometry.
- (3)
- Energy-efficiency assessments and long-term cost–benefit analyses of buoyancy-tracking exhaust systems compared to traditional ventilation solutions.
- (4)
- Field testing in industrial environments to validate the performance of tracking exhaust systems under real-world conditions, including varying heat source configurations and operational schedules
- (5)
- Future work should focus on integrating real-time sensors, automated control algorithms, and multi-source tracking systems to enable an adaptive ventilation that scales with complex industrial layouts.
4.7. Limitations and Future Works
This study has several limitations. First, the experiments were conducted in a scaled-down laboratory setting under controlled boundary conditions, which may not fully capture the complexities of real industrial environments, such as multi-source interference, machinery obstacles, or unpredictable airflows. For example, the temperature drop of 0.4 °C at the mobile exhaust vent is not a significant result. However, this may be due to the intensity of the heat source being too low for the entire room. Perhaps in scenarios with greater heating power, this advantage will be more pronounced.
Second, the current CFD modeling assumes a simplified heat source geometry and steady motion paths, without considering the sudden accelerations or irregular movement patterns that are common in practice. The dynamic mesh technique also introduces computational cost and mesh distortion risks for longer simulations. Third, pollutant dispersion was not explicitly modeled in this study. While the heat plume is used as a proxy for airborne pollutants due to its similar buoyancy behavior, actual chemical interactions, particle size distributions, or reactivity were not addressed.
Additionally, it should be noted that there may be issues regarding the excessively high costs associated with this technology. However, it should still be emphasized that if the heat source intensity is exceptionally high or if the pollutants are extremely hazardous, then cost may not be a primary concern. Of course, economic viability does need to be carefully calculated in the preliminary stages.
Building upon the promising results of this study, future research should aim to validate the proposed exhaust systems in full-scale, real-world industrial environments where multiple heat or pollutant sources interact and airflow conditions are more complex. The development of intelligent, adaptive control systems that use real-time sensor data to dynamically adjust the position of the exhaust vents will be essential for practical deployment. Furthermore, extending the current modeling approach to simulate more realistic, non-uniform source motions, variable emission intensities, and obstacle-rich geometries would improve the applicability of the findings. Finally, incorporating detailed pollutant dispersion modeling, particularly for gas-phase contaminants and particulate matter, will enable a more comprehensive evaluation of indoor air quality impacts. Future work could also explore the economic feasibility and energy-saving potential of deploying mobile exhaust systems at scale. Emergency ventilation may also be suitable for such mobile exhaust equipment when there is a high-intensity heat source or pollutant source.
5. Conclusions
This study investigated the performance of three different exhaust strategies—a fixed-position exhaust, a synchronous-motion exhaust, and a buoyancy-tracking exhaust—for the removal of heat generated by mobile sources in industrial environments. Through experiments and CFD simulations employing dynamic mesh techniques, the results demonstrated that exhaust systems capable of moving with or aligning with the heat plume significantly outperform traditional fixed systems in terms of heat removal efficiency and indoor thermal control.
Among the configurations tested, the buoyancy-tracking exhaust system—positioned along the centerline of the inclined thermal plume—exhibited the best overall performance, achieving an average temperature reduction of 0.4 °C to 3.8 °C compared to the fixed outlet. The study also established a quantitative relationship between the inclination angle of the thermal plume and the Archimedes number, which provides a predictive tool for exhaust placement design. These findings suggest a viable path forward for adaptive ventilation strategies in dynamic industrial settings where fixed exhausts are insufficient.
From a practical standpoint, the proposed tracking systems are particularly valuable in environments with moving high-intensity heat or pollutant sources, such as welding workshops or smelting lines. They may also serve as effective emergency ventilation solutions in the event of localized thermal or chemical incidents. Although concerns remain regarding the potential cost and mechanical complexity of such systems, their benefits in high-risk or high-intensity scenarios may justify the investment.
Future research should focus on validating these systems in real industrial applications, incorporating real-time sensing and adaptive control algorithms, and extending the approach to pollutant dispersion modeling. Such advancements would further enhance the applicability and robustness of mobile exhaust solutions for modern industrial ventilation challenges.
Author Contributions
Z.X. completed the CFD simulation, drew the figures, analyzed the data, and wrote the paper. W.Y. proposed the idea and revised the manuscript and English writing. X.H. and S.Z. provided suggestions for the experiments. T.L. provided comments and T.P. revised the manuscript. L.E. carefully checked and revised the whole paper. All authors have read and agreed to the published version of the manuscript.
Funding
This study was funded by the National Natural Science Foundation of China (51308206), Key Scientific Research from Hunan Provincial Department of Education in China (24A0334), and Science and Technology Plan Project in Hunan Province of China (2023SK2014).
Data Availability Statement
Data is contained within the article.
Acknowledgments
The idea for this paper came from the collaborative research at IEA-EBC-Annex 62 Ventilative Cooling, IEA-EBC-Annex 80 Resilient Cooling, and IEA-EBC-Annex 97 Sustainable Cooling in Cities.
Conflicts of Interest
The authors declare no potential conflicts of interest with respect to the research, authorship, or publication of this article.
References
- Iavicoli, I.; Leso, V.; Fontana, L.; Bergamaschi, A. Characterization of inhalable, thoracic, and respirable fractions and ultrafine particle exposure during grinding, brazing, and welding activities in a mechanical engineering factory. J. Occup. Environ. Med. 2013, 55, 430–445. [Google Scholar] [CrossRef]
- Şener, M.U.; Şimşek, C.; Özkara, Ş.; Yücel, H.; Cöplü, L. Comparison of the international classification of high-resolution computed tomography for occupational and environmental respiratory diseases with the international labor organization international classification of radiographs of pneumoconiosis. Ind. Health 2019, 57, 495–502. [Google Scholar] [CrossRef] [PubMed]
- National Health Commission of the People’s Republic of China. Occupational Disease Prevention Notice; National Health Commission of the People’s Republic of China: Beijing, China, 2022; pp. 22–23. [Google Scholar]
- Wang, Y.; Cao, Y.; Meng, X. Energy efficiency of industrial buildings. Indoor Built Environ. 2019, 28, 293–297. [Google Scholar] [CrossRef]
- Huang, Y.; Wang, Y.; Ren, X.; Hu, L. Ventilation guidelines for controlling smoke, dust, droplets and waste heat: Four representative case studies in Chinese industrial buildings. Energy Build. 2016, 128, 834–844. [Google Scholar] [CrossRef]
- Liu, F.; Qian, H.; Ma, J.; Guo, H. A simple model for predicting dispersion characteristics of high-temperature airflow and particle distribution during smelting process in a thermally stratified foundry shop. Energy Build. 2023, 278, 112614. [Google Scholar] [CrossRef]
- Wang, H.Q.; Huang, C.H.; Liu, D.; Zhang, H. Fume transports in a high-rise industrial welding hall with displacement ventilation system and individual ventilation units. Build. Environ. 2012, 52, 119–128. [Google Scholar] [CrossRef]
- Yang, Y.; Wang, Y.; Song, B.; Li, X. Stability and accuracy of numerical investigation of droplet motion under local ventilation airflow. Build. Environ. 2018, 140, 32–42. [Google Scholar] [CrossRef]
- Yang, D.; Huo, R.; Zhang, X.L.; Li, S. Comparative study on carbon monoxide stratification and thermal stratification in a horizontal channel fire. Build. Environ. 2012, 49, 1–8. [Google Scholar] [CrossRef]
- Lin, Y.J.P.; Lin, C.L. A study on flow stratification in a space using displacement ventilation. Int. J. Heat Mass Transf. 2014, 73, 67–75. [Google Scholar] [CrossRef]
- Bouzinaoui, A.; Vallette, P.; Lemoine, F.; Courbon, J. Experimental study of thermal stratification in ventilated confined spaces. Int. J. Heat Mass Transf. 2005, 48, 4121–4131. [Google Scholar] [CrossRef]
- Zhao, X.; Yin, Y. Hazards of pollutants and ventilation control strategy in industrial workshops: Current state and future trend. Build. Environ. 2024, 251, 111229. [Google Scholar] [CrossRef]
- Litomisky, A. New saving opportunity: On-demand industrial ventilation. Energy Eng. 2006, 103, 25–40. [Google Scholar] [CrossRef]
- Litomisky, A. Exhaust ventilation energy saving in car manufacturing and other industries. Energy Eng. 2007, 104, 54–80. [Google Scholar] [CrossRef]
- American Society of Heating, Refrigerating and Air-Conditioning Engineers, Inc. (ASHRAE). HVAC applications. In ASHRAE Handbook; ASHRAE: Atlanta, GA, USA, 2007. [Google Scholar]
- Devienne, R.; Fontaine, J.R.; Kicka, J.; Vassal, P. Experimental characterization of a plume of passive contaminant above a thermal source: Capture efficiency of a fume extraction hood. Ann. Occup. Hyg. 2009, 53, 739–748. [Google Scholar] [PubMed]
- Huang, Y.; Wang, Y.; Liu, L.; Wu, J. Reduced-scale experimental investigation on ventilation performance of a local exhaust hood in an industrial plant. Build. Environ. 2015, 85, 94–103. [Google Scholar] [CrossRef]
- Duan, M.; Wang, Y.; Wang, D.; Li, X. Modeling dynamic variation of drag force acting on single hot particle. Powder Technol. 2019, 344, 432–442. [Google Scholar] [CrossRef]
- Zhao, L.; Liu, J.; Yin, Y.; Wang, H. Field investigation of pollutant characteristics and targeted ventilation control strategies in high-ceiling aircraft spraying workshop. Process Saf. Environ. Prot. 2022, 159, 627–639. [Google Scholar] [CrossRef]
- Cho, D.H.; Kang, S.Y.; Choi, C.H.; Lee, D.H. Improvement of indoor air environment in a large welding factory by displacement ventilation. In Proceedings of the SAREK Conference; The Society of Air-Conditioning and Refrigerating Engineers of Korea: Seoul, Republic of Korea, 2005; pp. 69–74. [Google Scholar]
- Yang, C.; Chen, L.; Li, T.; Wu, Z. Investigation of thermal plume and thermal stratification flow in naturally ventilated spaces with multiple heat sources. Build. Environ. 2023, 244, 110754. [Google Scholar] [CrossRef]
- Lin, Y.J.P.; Xu, Z.Y. Buoyancy-driven flows by a heat source at different levels. Int. J. Heat Mass Transf. 2013, 58, 312–321. [Google Scholar] [CrossRef]
- Harish, R. Effect of heat source aspect ratio on turbulent thermal stratification in a naturally ventilated enclosure. Build. Environ. 2018, 143, 473–486. [Google Scholar] [CrossRef]
- Hernandez, R.H. Natural convection in thermal plumes emerging from a single heat source. Int. J. Therm. Sci. 2015, 98, 81–89. [Google Scholar] [CrossRef]
- Naffouti, T.; Zinoubi, J.; Maad, R.B. Experimental characterization of a free thermal plume and in interaction with its material environment. Appl. Therm. Eng. 2010, 30, 1632–1643. [Google Scholar] [CrossRef]
- Saidi, M.H.; Sajadi, B.; Molaeimanesh, G.R. The effect of source motion on contaminant distribution in the cleanrooms. Energy Build. 2011, 43, 966–970. [Google Scholar] [CrossRef]
- Yang, S.J.; Fu, W.S. A numerical investigation of effects of a moving operator on airflow patterns in a cleanroom. Build. Environ. 2002, 37, 705–712. [Google Scholar] [CrossRef]
- Espinosa, F.A.D.; Glicksman, L.R. Determining thermal stratification in rooms with high supply momentum. Build. Environ. 2017, 112, 99–114. [Google Scholar] [CrossRef]
- Tao, Y.; Inthavong, K.; Tu, J.Y. Dynamic meshing modelling for particle resuspension caused by swinging manikin motion. Build. Environ. 2017, 123, 529–542. [Google Scholar] [CrossRef]
- Xu, Y.; Cao, C.; Ma, M.; Zhang, L. Direction air supply design and optimization in industrial settings to reduce gaseous contaminant exposure. Build. Environ. 2022, 216, 109003. [Google Scholar] [CrossRef]
- Zhang, Z.; Zhang, W.; Zhai, Z.J.; Zuo, Z. Evaluation of various turbulence models in predicting airflow and turbulence in enclosed environments by CFD: Part 2—Comparison with experimental data from literature. HVACR Res. 2007, 13, 871–886. [Google Scholar] [CrossRef]
- Liu, P.C.; Lin, H.T.; Chou, J.H. Evaluation of buoyancy-driven ventilation in atrium buildings using computational fluid dynamics and reduced-scale air model. Build. Environ. 2009, 44, 1970–1979. [Google Scholar] [CrossRef]
- Fluent Development Team. Chapter 1.2. Continuity and Momentum Equations, 5.2. Modeling Conductive and Convective Heat Transfer. In Ansys Fluent Theory Guide; ANSYS, Inc.: Canonsburg, PA, USA, 2024. [Google Scholar]
- Incropera, F.P.; DeWitt, D.P.; Bergman, T.L.; Lavine, A.S. Introduction to Heat Transfer, 7th ed.; Wiley: Hoboken, NJ, USA, 2017. [Google Scholar]
- Nee, A. Assessment of high order regularized hybrid lattice Boltzmann scheme for turbulent thermal convection. Int. Commun. Heat Mass Transf. 2023, 143, 106723. [Google Scholar] [CrossRef]
- Luo, N.; Weng, W.; Xu, X.; Cheng, X. Experimental and numerical investigation of the wake flow of a human-shaped manikin: Experiments by PIV and simulations by CFD. In Building Simulation; Tsinghua University Press: Beijing, China, 2018; pp. 1189–1205. [Google Scholar]
- Jiang, Y.; Chen, Q. Study of natural ventilation in buildings by large eddy simulation. J. Wind Eng. Ind. Aerodyn. 2001, 89, 1155–1178. [Google Scholar] [CrossRef]
- Gilani, S.; Montazeri, H.; Blocken, B. CFD simulation of stratified indoor environment in displacement ventilation: Validation and sensitivity analysis. Build. Environ. 2016, 95, 299–313. [Google Scholar] [CrossRef]
- van Hooff, T.; Blocken, B.; Tominaga, Y. On the accuracy of CFD simulations of cross-ventilation flows for a generic isolated building: Comparison of RANS, LES, and experiments. Build. Environ. 2017, 114, 148–165. [Google Scholar] [CrossRef]
- Rohdin, P.; Moshfegh, B. Numerical predictions of indoor climate in large industrial premises. A comparison between different k–ε models supported by field measurements. Build. Environ. 2007, 42, 3872–3882. [Google Scholar] [CrossRef]
- Cao, Z.; Bai, Y.; Wang, Y.; Hu, L. Numerical study on the effect of buoyancy-driven pollution source on vortex ventilation performance. Build. Environ. 2022, 225, 109634. [Google Scholar] [CrossRef]
- Tominaga, Y.; Stathopoulos, T. CFD simulations of near-field pollutant dispersion with different plume buoyancies. Build. Environ. 2018, 131, 128–139. [Google Scholar] [CrossRef]
- Zeytounian, R.K. Joseph Boussinesq and his approximation: A contemporary view. Comptes Rendus Mec. 2003, 331, 575–586. [Google Scholar] [CrossRef]
- Zhou, Y.; Wang, M.; Wang, M.; Zhang, W. Predictive accuracy of Boussinesq approximation in opposed mixed convection with a high-temperature heat source inside a building. Build. Environ. 2018, 144, 349–356. [Google Scholar] [CrossRef]
- Kosutova, K.; van Hooff, T.; Blocken, B. CFD simulation of non-isothermal mixing ventilation in a generic enclosure: Impact of computational and physical parameters. Int. J. Therm. Sci. 2018, 129, 343–357. [Google Scholar] [CrossRef]
- Nielsen, P.V. Air Distribution Systems: Room Air Movement and Ventilation Effectiveness; Indoor Environmental Technology: Clearwater, FL, USA, 1992; Volume R9250, No. 25. [Google Scholar]
- Song, X.; Wei, Y.; Hao, X. Controllable baffle-type exhaust-hood in home kitchen. Int. J. Vent. 2024, 23, 309–327. [Google Scholar]
- Karimipanah, T.; Awbi, H.B.; Sandberg, M.; Olesen, B.W. Investigation of air quality, comfort parameters, and effectiveness for two floor-level air supply systems in classrooms. Build. Environ. 2007, 42, 647–655. [Google Scholar] [CrossRef]
Disclaimer/Publisher’s Note: The statements, opinions and data contained in all publications are solely those of the individual author(s) and contributor(s) and not of MDPI and/or the editor(s). MDPI and/or the editor(s) disclaim responsibility for any injury to people or property resulting from any ideas, methods, instructions or products referred to in the content. |
© 2025 by the authors. Licensee MDPI, Basel, Switzerland. This article is an open access article distributed under the terms and conditions of the Creative Commons Attribution (CC BY) license (https://creativecommons.org/licenses/by/4.0/).