Abstract
With industrial upgrading and increasingly diversified urban functions in small and medium-sized cities in China, the demand for convention and exhibition buildings has been steadily rising. However, current research mainly focuses on the planning and operation of such buildings in large cities, with a lack of systematic and targeted studies on small and medium-sized cities that have relatively limited resources and varied development orientations. According to data collection and field surveys of convention and exhibition buildings in 148 small and medium-sized cities nationwide, this paper constructs a case database and conducts in-depth research on building types and factor guarantee mechanisms. This study first employs cluster analysis to classify 73 typical cases, incorporating comparative analysis from multiple dimensions such as the city’s economic development level, characteristics of the convention and exhibition industry, primary functions, operational focus, service targets, and planning layout, based on literature review and expert opinions. It then proposes four convention and exhibition building positioning models—market type, production-based type, enclave type and comprehensive type—and analyzes the characteristics of their typical cases. Afterward, through surveys, literature reviews, and expert interviews, this study identifies relevant indicators—such as resource factors and development conditions—and applies the importance index method to select 19 core indicators. These are used to establish a factor guarantee indicator system comprising two levels: “city-related factors” and “regional-related factors”. Subsequently, by analyzing the development strategies and core support factors of different building types using the priority diagram method, this study clarifies the resource demands and development paths for each model. The results indicate that the positioning strategy for convention and exhibition buildings in small and medium-sized cities should align with local industrial foundations and stages of urban development, fostering the formation of differentiated and sustainable development models. This research offers theoretical support and practical guidance for the scientific planning and efficient construction of convention and exhibition buildings in small and medium-sized cities, contributing to improved functionality, regional economic growth, and optimized urban spatial structure.
1. Introduction
The “14th Five-Year Plan” explicitly calls for accelerating the development of small and medium-sized cities and optimizing their spatial layout. This national strategy plays a crucial role in promoting sustained, healthy, and high-quality economic growth. With policy support and strategic direction, small and medium-sized cities have gradually become key destinations for industrial transfer and a deepening division of labor, steadily advancing toward greater specialization and diversification [1] (Figure 1). Moreover, the accelerated processes of informatization and urbanization are gradually eliminating the constraints that previously hindered the development of the convention and exhibition industry in these cities. This trend not only enhances the economic driving effect of convention and exhibition services in small and medium-sized cities but also further stimulates real demand for the construction of related facilities [2,3] (Figure 2).
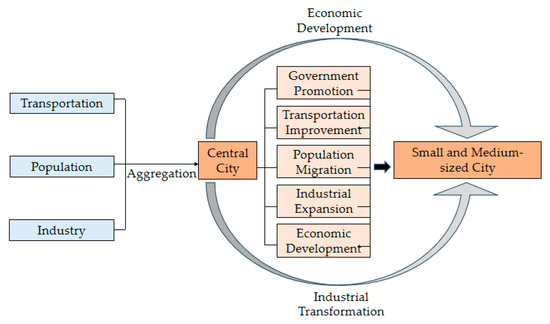
Figure 1.
Interaction mechanism between central cities and small and medium-sized cities.
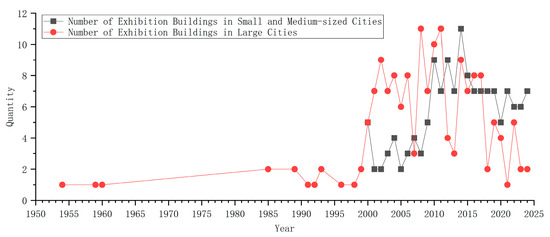
Figure 2.
Comparison of convention and exhibition building construction in large cities versus small and medium-sized cities.
The emergence of convention and exhibition buildings in small and medium-sized cities is driven by the rapid development of the convention and exhibition economy in these areas. This economy refers to the range of economic activities, phenomena, and effects generated by convention and exhibition events held in small and medium-sized cities. The establishment of the “Small and Medium-Sized Cities Convention and Exhibition Industry Development Research Center” by the China Convention and Exhibition Economic Society in 2017 [4], along with the expansion of China’s convention and exhibition market to approximately CNY 560 billion in 2019—a year-on-year increase of 8.6% [5]—reflects the sector strong growth momentum. This upward trend has attracted increasing attention from both exhibitors and visitors to small and medium-sized cities. Convention and exhibition buildings, as the material foundation for industrial development, have become a vital support for driving the robust growth of the convention and exhibition economy in small and medium-sized cities.
For a long time, academic and practical research on convention and exhibition buildings has mainly concentrated on large cities, resulting in a relatively mature theoretical framework and extensive construction experience. However, small and medium-sized cities differ significantly from large cities in terms of urban classification, industrial structure, and market capacity. Simply replicating the development models of large cities often leads to problems such as resource misallocation, underutilized facilities, and inefficient operations [2]. Therefore, it is essential to develop a deep understanding of the unique development logic of convention and exhibition buildings in small and medium-sized cities. Identifying their specific characteristics and development pathways has become an urgent and necessary focus of research.
- (1)
- Development Characteristics of the Convention and Exhibition Industry in Small and Medium-Sized Cities in China
The development of the convention and exhibition industry in small and medium-sized cities in China exhibits distinct typological characteristics, which stem from the diverse trajectories of urban industrial development. According to a review of relevant literature [6,7], the convention and exhibition industry in these cities can generally be categorized into three typical types.
The first type comprises economically advanced cities such as Kunshan, Jinjiang, and Yiwu. These cities benefit from favorable geographical locations, convenient transportation networks, and the developmental influence of nearby central cities. Their convention and exhibition industries are supported by a diversified industrial base, including sectors such as equipment manufacturing and new energy [8].
The second type involves specialized convention and exhibition models, such as the Shouguang International Vegetable Expo and the Guangrao International Rubber Tire Expo. In these cases, the convention and exhibition industry is closely aligned with the industrial chain needs of core cities.
The third type is the interactive convention and exhibition model, mainly found in regions rich in tourism and cultural resources, such as the World Internet Conference in Wuzhen, Zhejiang. This model emphasizes the deep integration of themed exhibitions with local culture, offering a strong sense of immersion and participation.
The differentiated development of these types reflects the structural transformation occurring in China’s new urbanization process. As infrastructure continues to improve and cities become more “flat” in terms of development, small and medium-sized cities are facing unprecedented opportunities. The convention and exhibition industry, serving as a barometer of urban economic development, is becoming increasingly specialized and differentiated [9]. The author believes that this trend of differentiation will become more pronounced in the future. On one hand, the collaborative development of urban agglomerations will enhance the professional division of interactive exhibitions; on the other hand, consumption upgrades will propel specialized exhibitions toward more immersive experiences. Therefore, as a key platform for the convention and exhibition industry, the standards for convention and exhibition buildings should incorporate a dynamic adjustment mechanism. These standards should follow the principles of “integration of production and exhibition” and “one city, one policy”, enabling convention and exhibition buildings to become a vital driver of industrial upgrading in small and medium-sized cities [1,4,10].
- (2)
- Review of Theories on Convention and Exhibition Architecture
Theories on convention and exhibition buildings have traditionally been based on the “MICE” system (meetings, incentives, conventions, and exhibitions), with a primary focus on the spatial organization, functional integration, and operational management of large convention and exhibition facilities. However, in recent years, as convention and exhibition activities have expanded in small and medium-sized cities, academic and industry research on convention and exhibition buildings in these cities has gradually gained momentum.
In international research, Fred Lawson (2000) systematically explored the planning, design, and management lifecycle of convention and exhibition facilities in Meetings and Exhibition Facilities: Planning, Design, and Management [11]. Clemens F. Kusche (2014) focused on construction practices and design principles for exhibition halls [12]; UFI (The Global Association of the Convention and Exhibition Industry) published reports in 2011 and 2017 titled World Map of Exhibition Venues, which statistically analyzed the spatial distribution and development trends of major exhibition venues worldwide. Additionally, internationally renowned projects, such as the ASEM Exhibition Center designed by SOM and the New Leipzig Fair by GMP, have provided valuable references for the spatial design and functional integration of convention and exhibition buildings.
Domestically, significant progress has also been made in related research. Chen Jianfei and Mei Hongyuan (2008) outlined the basic logic and spatial transformation path of the convention and exhibition industry in convention and exhibition buildings [13]. Zhou Zhenyu (2008) examined the evolution mechanism of convention and exhibition buildings in China through an interdisciplinary approach [14]. Ni Yang (2017) applied typological methods to identify convention and exhibition building models that reflect the characteristics of contemporary China [15]. Hou Xiao (2019) introduced the “Symbiosis Theory” to study the sustainable development mechanisms of convention and exhibition complexes [16]. Qin Siyuan (2021) [17] and Tian Yulong (2021) [18] developed evaluation systems and design strategies from the perspectives of elasticity and adaptability. In the field of convention and exhibition economy research [17,18], Zhang Jiankang (2012) focused on sustainable operational models for small and medium-sized cities [19], while Zhu Feiyue (2022) emphasized the practical need for an integrated “hardware + software” service system in these cities [1].
Through a systematic analysis of existing literature, this study identifies four key issues in current research on convention and exhibition buildings in small and medium-sized cities.
- (1)
- Bias in research focus: Existing domestic and international studies predominantly concentrate on convention and exhibition facilities in large metropolitan areas, while insufficient attention has been paid to the unique constraints of small and medium-sized cities, including site limitations, differentiated operational models, and restricted economic carrying capacity.
- (2)
- Lack of tailored theoretical frameworks: Current theoretical approaches (e.g., Ni Yang’s typological study and Hou Xiao’s symbiosis theory) fail to adequately account for the developmental characteristics of small and medium-sized cities and the specificities of their convention and exhibition industries. This results in significant limitations when applying these theories to guide the planning and design of convention and exhibition buildings in such contexts.
- (3)
- Insufficient interdisciplinary integration: The development of convention and exhibition buildings in small and medium-sized cities must be closely aligned with local industrial characteristics. However, current research remains largely confined to traditional architectural perspectives and lacks effective integration with theories and methodologies from related disciplines such as convention management and urban governance.
- (4)
- Methodological limitations: Existing studies predominantly rely on qualitative analysis, expert judgment, and case studies, lacking systematic data collection and statistical validation. Consequently, the reliability and generalizability of their findings remain questionable.
In summary, while research on convention and exhibition buildings in large cities has developed a relatively mature framework, systematic studies on convention and exhibition buildings in small and medium-sized cities remain limited. The lack of tailored theoretical guidance and empirically validated strategies has led to an uncritical adoption of development models designed for large urban contexts, disregarding the distinct characteristics of smaller cities in terms of urban scale, industrial composition, and market dynamics.
Given the increasing diversification of the convention and exhibition industry in small and medium-sized cities, these unique regional and industrial traits necessitate differentiated approaches to the functional and strategic positioning of such buildings. Consequently, investigating the typology of positioning models for convention and exhibition buildings in these urban contexts carries substantial theoretical and practical implications. The positioning of these buildings not only determines the economic viability and social impact of individual projects but also influences broader urban development objectives, including industrial restructuring, spatial resource optimization, and regional economic coordination.
This study addresses the central issue of positioning typologies for convention and exhibition buildings in small and medium-sized cities, with a focus on the following research questions:
- (1)
- Typology and Differentiation: What are the typical types of positioning models for convention and exhibition buildings in small and medium-sized cities, and what are the main differences between them?
- (2)
- Sustainability and Resource Dependencies: What are the key resources and development conditions required for the sustainable operation of convention and exhibition buildings under different positioning models?
By addressing these questions, this research aims to contribute to a more nuanced understanding of how small and medium-sized cities can leverage their unique advantages to develop convention and exhibition facilities that align with local conditions and long-term growth objectives.
2. Research Design
This study addresses the two core issues identified in the previous section: first, the types and differences in positioning models for convention and exhibition buildings in small and medium-sized cities; second, the key resources and development conditions required for the sustainable operation of convention and exhibition buildings under different positioning models. To systematically explore these issues, this paper constructs a research framework based on two dimensions: “typological characteristics” and “elemental guarantees” (Figure 3).
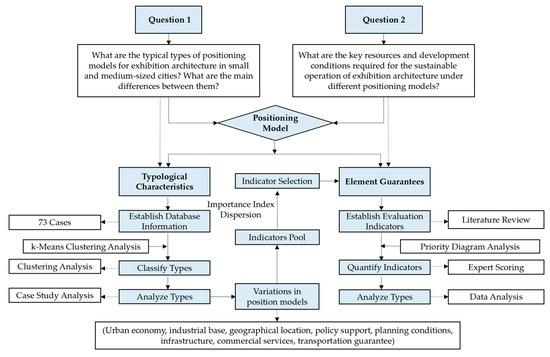
Figure 3.
Research design.
In the “typological characteristics” research section, the goal is to clarify the distinctive features of convention and exhibition buildings in small and medium-sized cities and to construct a typological system through inductive generalization. The specific steps are as follows: First, a database is established based on 73 convention and exhibition building cases from small and medium-sized cities nationwide, collecting relevant attribute information. Second, element analysis is used to extract key dimensions, and clustering algorithms are applied to classify the samples, identifying representative architectural types. Finally, in-depth comparisons of the morphological characteristics, functional configurations, and urban integration of various building types are conducted through typical case analysis, aiming to construct a more systematic typological spectrum of convention and exhibition buildings in small and medium-sized cities.
The “Element Guarantees” research section focuses on the supporting conditions for sustainable development of different types of exhibition buildings. Typological studies reveal significant variations among different positioning models in terms of urban economic and industrial foundations, geographic location and policy dimensions, planning conditions and infrastructure, as well as commercial services and transportation guarantees, which provide the basis for extracting element guarantee factors for different positioning models. By integrating project documentation from the authors’ and their team’s engineering practice over the past five years, existing literature, and expert interviews, an evaluation Indicators Pool for element guarantees was established. The importance index and dispersion degree of indicators were then calculated through the expert scoring method to screen the evaluation indicators. Finally, the precedence chart method was employed to conduct quantitative comparisons of key elements across different positioning models, identifying core supporting resources in their operational mechanisms. The research findings contribute to exploring feasible development pathways for various positioning types of convention and exhibition buildings and proposing corresponding development strategies and resource allocation recommendations.
Through the research design outlined above, this paper aims to address the gaps in typological identification and development mechanisms within current studies on convention and exhibition buildings in small and medium-sized cities. The goal is to provide theoretical support and practical guidance for decision-making, planning, construction, and operational management of convention and exhibition buildings in these cities.
3. Research Methods
3.1. Database Information Collection
This study utilizes various methods, including field surveys, telephone interviews, and online data collection, to systematically organize and analyze data on convention and exhibition buildings in small and medium-sized cities. Over the two-year research process, the author collected and organized data on 148 convention and exhibition buildings in small and medium-sized cities, including field surveys of 73 representative cases. In the sample selection process, this study adopted rigorous scientific screening methods. Based on the preliminary list of convention and exhibition buildings in small and medium-sized cities compiled from literature such as the “China Exhibition Economic Development Report”, the research team identified issues such as inaccurate project names, discrepancies in floor area, and outdated operational status information during field investigations. Therefore, the team conducted a comprehensive nationwide survey over two years, ultimately verifying and establishing a database of 148 completed cases. Building upon this database, this study employed a multi-dimensional comprehensive screening method to select 73 typical cases according to the following six core principles: (1) Geographical Coverage Balance Principle: Ensure the samples cover seven major geographical regions (East China, Central China, South China, etc.) to reflect regional characteristics. (2) Operational Status Validity Principle: Exclude projects that have undergone functional transformations or long-term inactivity, focusing on normally operated representative cases. (3) Functional Feature Typicality Principle: Systematically classify cases based on key indicators such as exhibition resource endowment, usage patterns, and spatial organization. (4) Quality Feature Representativeness Principle: Selected samples must exhibit typical characteristics of convention and exhibition buildings in small and medium-sized cities across at least three dimensions: architectural quality, external space, and location features. (5) Type Heterogeneity Principle: Ensure sufficient diversity in scale, location (urban center/new district/suburb), and spatial form (centralized/dispersed). (6) Sample Size Appropriateness Principle: Control the sample size to ensure research depth while maintaining statistical significance.
The collected data encompass four major categories of information (Figure 4): city information, project details, core information, and additional information. The indicators adopted in the database are primarily derived from two reliable sources: First, a systematic review of authoritative literature on convention and exhibition architecture from recent research in both exhibition studies [1,4,20,21,22,23,24,25,26,27,28,29,30,31,32,33] and architectural [2,12,13,17,18,34,35,36,37,38,39,40,41] disciplines, through which core information on convention and exhibition buildings was extracted. Second, the integration of key decision-making indicators validated by expert teams during the preliminary planning and conceptual design phases of four representative convention and exhibition projects (including Jinjiang International Convention and Exhibition Center, Sanya International Convention and Exhibition Center, and Changde International Convention and Exhibition Center—all located in small and medium-sized cities) that the research team participated in over the past five years.
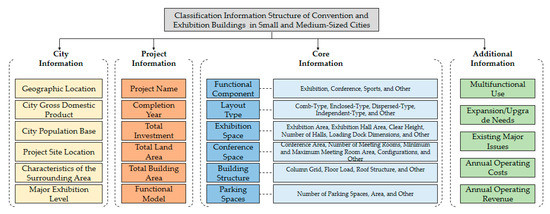
Figure 4.
Classification information structure of convention and exhibition buildings in small and medium-sized cities.
City Information: This mainly reflects the city’s economic development level, industrial structure, and the foundation of its convention and exhibition industry, helping to analyze its positioning and competitiveness within the regional convention and exhibition landscape.
Project Information: This focuses on the fundamental technical indicators of the building itself, such as building area, design capacity, and year of construction, providing a comprehensive understanding of the project’s construction background and physical attributes.
Core Information: This addresses key parameters like building function layout, usage frequency, and spatial organization, aiming to gain a deeper understanding of the spatial features and usage logic of convention and exhibition buildings.
Additional Information: This includes operational status, revenue conditions, and usage efficiency. Since these data involve the commercial secrets of operating companies, it is difficult to obtain through online channels. Some of this information was gathered through field visits and oral communications, making it somewhat scarce and confidential.
3.2. Clustering Analysis
Clustering is a fundamental task in data analysis, and the k-Means clustering algorithm, a widely used method, has become a popular tool across various disciplines due to its simplicity and efficiency [42]. Particularly suited for our study on convention and exhibition buildings in small and medium-sized cities, k-Means offers distinct advantages: (1) its computational efficiency enables rapid analysis of our medium-sized dataset (73 cases); (2) the algorithm’s ability to handle multiple quantitative variables aligns perfectly with our multidimensional evaluation framework encompassing economic, spatial and functional indicators; (3) the clear cluster centroids facilitate interpretability of results, which is crucial for deriving the four distinct positioning models in our research. While other methods like hierarchical clustering would be computationally intensive for our dataset, and DBSCAN’s density-based approach might overlook meaningful patterns in our carefully selected indicators, k-Means provides the optimal balance between analytical rigor and practical applicability for our urban planning research context. The algorithm is extensively applied in fields such as pattern recognition, machine learning, bioinformatics, and image processing (Figure 5).
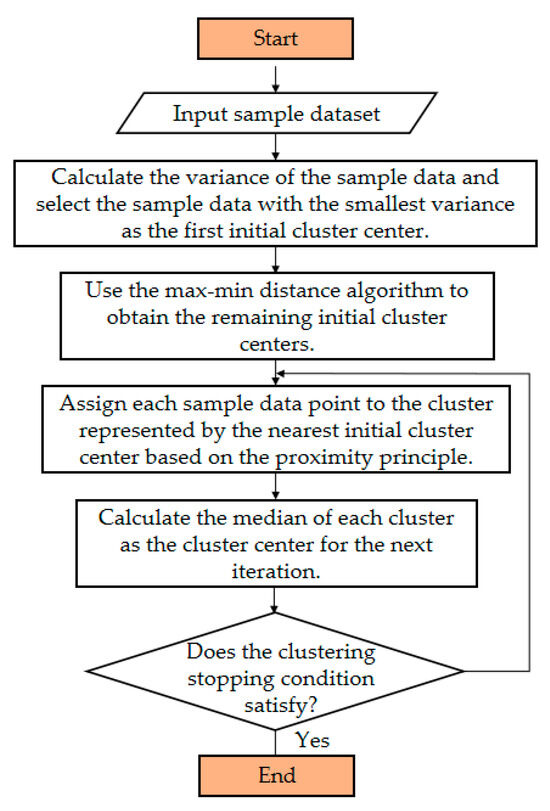
Figure 5.
Flowchart of the classic k-Means algorithm.
Let the dataset be , where each , and divide the data into M disjoint clusters . The core idea of the k-means algorithm is to minimize the sum of the variances within each cluster, i.e.,
Assuming the dataset consists of n sample data points, the steps for dividing X into k clusters are as follows:
(1) Randomly select k sample data points from X as the initial cluster centers, denoted as .
(2) Calculate the distance from each sample data point to the cluster centers , and assign each point to the nearest cluster center based on the nearest neighbor principle.
(3) Calculate the mean of each cluster to determine the new cluster center.
(4) Repeat steps 2 and 3 until the cluster centers no longer change or the specified number of iterations is reached, at which point the clustering process concludes [43].
3.3. Indicator Selection and Questionnaire Data Processing
3.3.1. Indicator Selection Method
According to the evaluation indicator set established by the author, the importance index method is used to select the indicators. In this approach, experts involved in the decision-making process assign importance scores to each indicator on a scale from 1 to 5. The expert scoring results are processed as follows: First, for the i-th indicator, calculate the number of experts who assigned each score and determine the total score. Then, compute the average score of the i-th indicator, which serves as the basis for assessing its level of importance. Second, the importance index is applied to statistically analyze the scores by calculating the degree of dispersion δi using the mean and standard deviation. The threshold criteria (I < 80 or δ > 0.25 for elimination) follow established methodological standards: the I ≥ 80 requirement (equivalent to 4/5 on Likert scale) ensures only high-importance indicators are retained, while δ ≤ 0.25 maintains expert consensus (analogous to Cronbach’s α > 0.7 reliability threshold). This dual-filter approach, validated in urban renewal studies, effectively balances indicator significance with rating consistency [44]. If the importance index (I) of the i-th indicator is less than 80, or if δ exceeds 0.25, the indicator is deemed either insufficiently important or subject to significant disagreement and should, therefore, be eliminated.
Here, k represents the score assigned by experts; scores of 0 are excluded from the analysis, so k = 1, 2, ..., 5; denotes the number of experts who assigned a score of k to the i-th indicator, and N is the total number of experts participating in the evaluation.
represents the standard deviation of the i-th indicator, calculated based on the statistical distribution of expert scores.
represents the average score of the i-th indicator based on the evaluations provided by the expert group.
This method directly evaluates the relevance and significance of candidate indicators in relation to the assessment objectives. By combining comparative analysis with quantitative statistical calculations, it facilitates the selection of appropriate indicators. Integrating both qualitative and quantitative approaches, it offers strong practical value and is adopted as the primary method for selecting factor assurance evaluation indicators for convention and exhibition buildings in small and medium-sized cities.
3.3.2. Questionnaire Data Processing
This study adopts the expert survey method, placing emphasis on the authority and scientific validity of the evaluators, as the level of expertise directly influences the reliability of the results. To finalize the indicators and calculate their weights, consultation, and evaluation forms were distributed [45].
The questionnaire respondents were grouped into three categories of professionals:
Category I: Convention and Exhibition Industry Practitioners—individuals involved in organizing convention and exhibition events or managing venue operations.
Category II: Professional Exhibitors—participants who regularly attend conventions and exhibitions for promotional or procurement purposes, including curators and industry-specific visitors
Category III: Convention and Exhibition Building Designers—professionals involved in the planning and design of convention and exhibition buildings, including architects and technical experts from various disciplines.
The average weight of each type of respondent’s scores denoted as G, is calculated using the following formula: , where represents the score of the i-th questionnaire, and n is the number of valid questionnaires. According to a percentage scoring system, pairwise comparisons were conducted using the precedence chart method, which addresses the limitations of purely subjective expert scoring for each indicator. To enhance data accuracy and reliability, the precedence chart method was applied for both pairwise comparisons and weight calculations, resulting in more precise and dependable analytical outcomes [46,47].
The precedence chart, first introduced by P. E. Moody in 1983, serves as a tool for multi-criteria decision analysis, mainly used to rank or prioritize multiple evaluation indicators or alternatives [48]. The weight calculation method using the precedence chart involves summing the numbers filled in each row (referred to as the total through line (TTL) value). The weight of each indicator is then calculated by dividing its TTL value by the sum of all TTL values for the indicators.
represents the TTL value of the i-th indicator, and n is the total number of evaluated indicators. According to these calculations, a corresponding weight table for the key assurance factors is generated).
4. Analysis of Convention and Exhibition Building Typologies in Small and Medium-Sized Cities
4.1. Clustering Calculation of Typological Patterns
Considering factors such as data completeness, geographical distribution, and the scale of the host cities, this study selected 73 convention and exhibition building projects in small and medium-sized cities as research samples for cluster analysis. To enhance the scientific rigor and accuracy of the clustering process, string-format variables were numerically encoded: hierarchical categorical variables (e.g., site selection types) used ordinal encoding, while nominal variables employed integer label encoding, with all numerical variables standardized via Z-score normalization. Validation through silhouette score demonstrated limited impact of different encoding methods on the stability of final cluster structures (average silhouette score > 0.5). When interpreting cluster centroids, we only referenced the means of numerical and ordinal variables, while nominal variable labels were solely used for type descriptions (e.g., “Cluster 2 is predominantly manufacturing-oriented”). Adopting a mixed-method approach, our quantitative clustering analysis enables scientific identification of positioning patterns for convention and exhibition buildings in small and medium-sized cities. However, for individual case analysis, we further refined and adjusted the results by incorporating typological definitions (see Section 4.2 of the paper) (Table 1).

Table 1.
Explanation of data information and final cluster center classification.
Using a self-constructed database and employing SPSS software (IBM SPSS Statistics 22) along with Formula (1) and Analysis of Variance (ANOVA), it was found that the variables “Exhibition Hall Area” and “Total City GDP” were highly correlated at the 0.01 significance level, with F-values of 99.799 and 37.790, respectively. These two statistically significant variables were selected as the primary basis for the clustering analysis, and a corresponding cluster diagram was generated (Figure 6). After testing multiple cluster numbers, a four-cluster model was identified as the optimal solution, as the resulting clusters showed high compactness and clear differentiation.
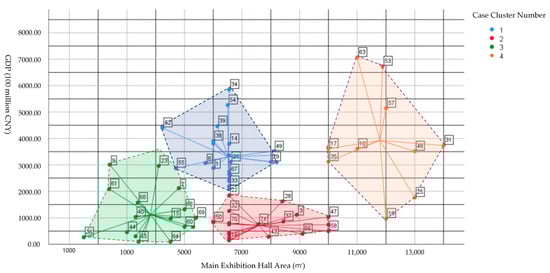
Figure 6.
Database information cluster diagram.
The numbers represent different item/project codes.
4.2. Definition of Type Patterns
This study utilizes cluster analysis to systematically examine the definitions and classification criteria for convention and exhibition buildings in small and medium-sized cities. According to the results of the cluster analysis (Table 2) and factors such as the city’s economic development level, the primary function of the building, operational focus, target audience, and development model, while also considering the specific characteristics of the convention and exhibition industry in small and medium-sized cities, four distinct positioning models for convention and exhibition buildings are identified: market-oriented, production-based, enclave, and integrated. The classification of type definitions is mainly based on three dimensions. First, the industrial foundation and development orientation are the main considerations, evaluated using three criteria: (1) whether the convention and exhibition building has a clear construction goal; (2) whether the city has a dominant industry of a certain scale; and (3) whether large-scale thematic convention and exhibition activities rely on the city’s industry. Additionally, this study takes into account the content characteristics and capacity scale of the convention and exhibition activities. Finally, spatial factors such as the building location, functional configuration, and scale characteristics are considered to further clarify the connotations and characteristics of each positioning model.
Table 2.
Positioning types and key features.
4.3. Analysis of Model Types
- Market type
The market-oriented positioning model is driven by market demand and is mainly applicable to medium and small cities with relatively high development levels and favorable geographic locations. These cities typically have large consumer markets, well-developed import and export trade, and comprehensive transportation infrastructure, including airports and ports serving as logistics hubs. As a result, they require high-end platforms to access integrated product information and foster the growth of a market-driven convention and exhibition industry (Table 3). The market-oriented positioning model is characterized by the following:
Table 3.
Typical cases of the market-oriented positioning model.
(1) High Commercialization: Centered on economic benefits, this model prioritizes high-standard construction to meet large-scale market demands, attracting exhibitors and visitors. Its development approach mirrors that of large urban convention and exhibition venues and requires maintaining a competitive edge in a highly competitive environment.
(2) Modernized Facilities: Equipped with advanced infrastructure, including flexible spatial design, professional equipment (such as rigging points, mechanical and electrical systems, and audiovisual equipment), and comprehensive support services (such as Internet access and conference facilities), this model is capable of supporting a wide range of event requirements.
(3) Exhibition Diversification: This model leverages the city’s economic and demographic foundations to accommodate a wide range of exhibition types and scales, requiring high efficiency and flexibility in spatial usage. Its growth is often fueled by metropolitan economic spillover, with site selection emphasizing accessibility and the availability of comprehensive supporting infrastructure.
- 2.
- Production-based type
The production-oriented development model emerges from the internal demands of urban industrial growth. Anchored by well-established industrial clusters, this model has fostered a convention and exhibition economy centered around related products (see Table 4). In these small and medium-sized cities, the scale of industrial clusters generates a strong demand for platforms that support trade negotiations, product exhibitions, and marketing efforts. The production-oriented positioning model is characterized by the following:
Table 4.
Typical cases of production-oriented positioning model.
(1) Industrial Focus:
Development is driven by specific industrial clusters, with convention and exhibition activities closely aligned to industry needs. The goal is to facilitate technological exchange and collaboration. This positioning strategy is tailored to the requirements of industrial growth, offering specialized services such as industry-focused event planning, curated exhibition content, and coordinated exhibitor participation.
(2) Professional Orientation:
This model emphasizes specialized exhibitions and conferences that highlight cutting-edge technologies and attract industry professionals. Venue design must cater to specific industry requirements—such as clear ceiling height and load-bearing capacity—and support complementary activities such as seminars, training sessions, and product demonstrations within the industrial value chain.
(3) Regional Connectivity:
As a regional industrial hub, this model facilitates connections across upstream and downstream segments of the industrial chain and promotes synergy through themed exhibitions. Architectural design should align with local industrial characteristics and embody the region’s cultural identity to enhance relevance and appeal.
- 3.
- Enclave type
In urban planning and geography, an “enclave” refers to land that is governed by a specific administrative region but is not contiguous with it. The enclave-oriented positioning model refers to convention and exhibition buildings and operations located outside the main urban area, typically developing a distinctive convention and exhibition economy based on tourism or cultural resources. These venues are situated away from city centers, occupying independent spaces and facilities that serve various types of exhibitions and events (Table 5). The enclave-oriented model has the following characteristics:
Table 5.
Typical cases of enclave-oriented positioning model.
(1) Cultural Tourism Integration:
This model leverages the city’s unique historical, cultural, or tourism resources to develop a non-physical economy centered around exhibitions. Venues are often situated in tourism hotspots, attracting visitors to engage in convention and exhibition activities while also serving as platforms for cultural display. This approach promotes the transformation and upgrading of traditional industries. For example, the Wuyishan Tea Tourism Town Convention Center combines the tea industry with the Internet to create a distinctive tea-tourism model.
(2) Architectural Landmark Quality:
These venues emphasize distinctive architectural design to establish a unique and recognizable brand identity. The architecture typically integrates with the natural environment, fostering a development model that combines technology, exhibitions, and tourism. This approach enhances public engagement and visibility while avoiding standardized, industrialized aesthetics.
(3) Resource Synergy:
Small and medium-sized cities often face high construction and operational costs, requiring the integration of diverse resources to ensure sustainable development. By aligning the convention and exhibition industry with other revenue-generating sectors, these venues create synergistic growth models that address the challenge of “buildable but unsustainable” infrastructure.
(4) Ecological Sustainability:
Environmental protection is a core principle, with a strong emphasis on sustainable construction practices. Architectural design is harmonized with the local topography, landscape, and spatial layout to promote a balanced coexistence between the built environment and nature.
- 4.
- Comprehensive type
The comprehensive-type positioning model refers to a convention and exhibition industry development approach shaped by the combined influence of multiple favorable factors, including industrial development, market demand, geographical location, transportation infrastructure, and policy support. This model is typically suited to cities where no single industry dominates, and the convention and exhibition sector features a relatively balanced mix of event types. Such cities often focus on hosting meetings and small to mid-scale exhibitions while leveraging local consumer industries to stimulate the growth of the convention and exhibition economy (Table 6). The comprehensive-type positioning model is characterized by the following features:
Table 6.
Typical cases of the comprehensive positioning model.
(1) Functional Integration: By integrating functions such as conferences, exhibitions, business, and catering, this model creates a cultural complex within the city. The design should prioritize spatial organization and technology choices to ensure functional flexibility, spatial diversity, and long-term operational viability. Usage rates can be increased through supplementary functions such as sports facilities, fitness centers, and warehouse leasing.
(2) Geographical Synergy: These venues are typically located in city centers or transportation hubs, emphasizing interaction and integration with nearby commercial areas. Through the inclusion of street-facing retail, public plaza designs, and other urban elements, the exhibition space becomes organically connected to the city’s commercial zones, attracting foot traffic and stimulating regional economic growth.
(3) Urban Integration: This approach focuses on deeply embedding the venue within the urban environment and the daily lives of residents. It advocates for a “Convention and Exhibition+” model that combines functions such as culture, sports, and administration, enhancing the venue’s landmark status and improving surrounding real estate value. Functional design should be tailored to the city’s characteristics, supporting diversified and sustainable operational development.
5. Elemental Guarantees Analysis for Convention and Exhibition Buildings in Small and Medium-Sized Cities
Different positioning models for convention and exhibition buildings in small and medium-sized cities require distinct resources and support. To better understand the characteristics and development needs of each model, conducting element assurance research ensures the practical feasibility of these positioning strategies. Element assurance is integral to the entire decision-making process for convention and exhibition buildings, encompassing feasibility studies, goal setting, site planning, economic analysis, and other relevant factors. By combining element analysis with different positioning types, the characteristics of each model can be clarified, urban shortcomings identified, and a scientific foundation provided for positioning decisions in small and medium-sized cities.
5.1. Selection of Evaluation Indicators for Element Guarantees
According to the previously defined positioning models, and incorporating insights from interviews with convention and exhibition operators, surveys, and relevant literature, this study identifies 27 key indicators. Using the importance indicator method (Formulas (2)–(5)), 19 evaluation indicators were selected. These evaluation indicators for element assurance are categorized into urban-related and regional-related factors (Table 7).
Table 7.
Results of the selection of evaluation indicators for element assurance.
5.1.1. Explanation of Urban-Related Factors
Urban-related factors reflect the city’s capacity to support the construction of convention and exhibition buildings. This mainly includes the potential impact of urban economic, population, policy, and industrial development trends on the convention and exhibition industry. The positioning and planning of convention and exhibition venues must align with these factors to ensure compatibility with the city’s overall development direction. Specifically, this includes the following aspects:
(1) Urban Vitality refers to the city’s ability to provide the necessary resources for the future development of the convention and exhibition industry. It reflects the city’s economic structure, resource advantages, population characteristics, and whether these factors can meet the demands of the convention and exhibition sector. This can be summarized as urban location, resource endowment, and population and economic factors.
(2) Industrial Foundation refers to whether the city has a solid industrial development foundation and level, including the scale, categories, and competitiveness of its industries.
(3) Policy Formulation refers to the city’s fiscal support for the development of the convention and exhibition industry, as well as land supply policies that ensure the availability of land for venue development.
5.1.2. Explanation of Regional-Related Factors
Regional-related factors mainly reflect whether the environmental conditions in the region where the project is located are adequate to meet the needs of convention and exhibition activities. These factors determine whether the regional environment supports the growth of the convention and exhibition industry in small and medium-sized cities or enhances the development potential of regional convention and exhibition sectors. Additionally, they contribute to improving the operational value of convention and exhibition buildings.
(1) Higher-Level Planning includes urban master planning, spatial planning, regional planning, special planning, and detailed planning. A well-structured planning system ensures the city has clear development strategies for convention and exhibition buildings.
(2) Location Environment mainly refers to the population density in the area surrounding the convention and exhibition building, the availability of land for development, and nearby land uses. This reflects the vitality of the surrounding urban environment.
(3) Development Potential refers to both land development value and urban cultural development value. Land development value considers whether the land’s worth and profitability can be increased and whether it facilitates project financing. Cultural development value evaluates whether the convention and exhibition building, as a significant landmark, can enhance the urban spatial environment, culture, and image.
(4) Supporting Facilities refers to the necessary infrastructure for large-scale convention and exhibition activities, including road conditions, public transportation systems, general infrastructure, and support services. These facilities are crucial for hosting and successfully operating convention and exhibition events.
5.2. Quantification of Element Guarantees
Analyzing the characteristics of element guarantees in different development models helps to understand the distinctions between these models and enables better judgment of whether the conditions and guarantees for developing convention and exhibition buildings of a particular type are met before making decisions.
5.2.1. Survey Distribution and Calculation
The study distributed 19 questionnaires and received 18 valid responses from three professional groups: (1) 7 convention and exhibition industry practitioners (Category I: 4 Vice Presidents, 2 Operations Supervisors, and 1 President), (2) 5 professional exhibitors (Category II: 2 Vice Presidents, 2 Operations Supervisors, and 1 President), and (3) 6 convention and exhibition building designers (Category III: 4 Senior Engineers, 1 Intermediate Engineer, and 1 Junior Engineer). Building upon the author’s analysis of different development model characteristics, the research established a factor feature model with an associated scoring system to assess elemental guarantees for convention and exhibition buildings in small and medium-sized cities, with survey results evaluating the relative importance of these support factors across development models (Table 8).
Table 8.
Questionnaire statistics of factor characteristics for different development models of element assurance.
The survey questionnaire was divided into three levels. The first and second-level evaluation options allowed for a comparative assessment of different choices for each question. To ensure the differentiation and completeness of the weight data, the total score for the first and second-level indicators was set at 100 points, while there was no limit for the third-level factor indicators. To ensure the reliability and accuracy of the questionnaire results, Cronbach’s Alpha coefficients for the survey results were 0.988, 0.990, 0.979, and 0.984 (all greater than 0.7), indicating good internal consistency. Finally, the questionnaire data were weighted according to Formula (6) (Table 9).
Table 9.
Relevant weights of element guarantees factors.
5.2.2. Factor Comparison Analysis
The evaluation analysis of primary indicators across different positioning models is illustrated in Figure 7. The origin-based, market-based, and integrated development models are more reliant on urban element guarantees, such as urban vitality, industrial foundation, and related policies. Among these, the origin-based model is most dependent on the city’s development foundation, mainly influenced by the city’s leading industries. The integrated model requires a more balanced demand for both urban and regional element guarantees. The market-based model requires guarantees at both the city and regional levels, especially in terms of regional site selection, planning, land value, and population density, which require proactive planning. The enclave-based development model, on the other hand, relies more on regional element guarantees. Since its site selection is typically far from the city’s main urban area (e.g., resorts, ports, and tourist attractions), support from the city center is limited. As such, it is crucial to focus on regional factors such as upper-level planning, development value, and supporting facilities.
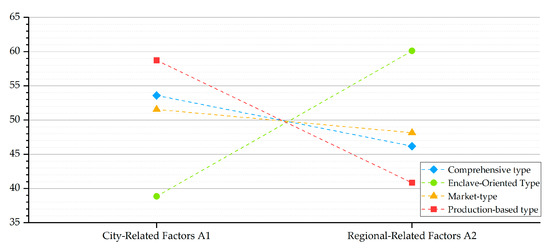
Figure 7.
Comparison chart of primary indicator weights across different positioning models.
Overall, the origin-based and enclave-based models have well-defined service content, a relatively clear market environment, and simpler positioning planning. These models mainly serve local industrial needs and aim to enhance the city’s influence and reputation through exhibitions. In contrast, the market-based and integrated models involve more complex positioning planning with relatively vague objectives. Their success depends not only on the construction of convention and exhibition buildings but also on the collaboration between upper-level planning, policy support, and the coordination of spatial functions and operational models.
The evaluation analysis of secondary indicators across different positioning models is illustrated in Figure 8. The origin-based development model mainly relies on support from supporting facilities, industrial foundations, policy formulation, and upper-level planning, rather than on urban vitality and development potential. Its industrial development direction is clear, requiring complete infrastructure and long-term policy guarantees, with minimal influence from factors such as population, economy, natural resources, and land value (Figure 8b). The market-based development model, on the other hand, places higher demands on the location environment, urban vitality, and supporting facilities. Compared with the origin-based model, it requires a stronger industrial foundation, better infrastructure, and superior urban location. Driven by market mechanisms, this model has a higher demand for comprehensive factors (Figure 8a). The enclave-based development model relies on policy support, upper-level planning, and development potential. Simply having natural or tourism resources is not sufficient to drive its development; adequate element guarantees are necessary to ensure sustainable operation (Figure 8c). The integrated development model has the strictest requirements for the location environment and supporting facilities. Whether it involves function-integrated or usage-integrated buildings, it demands a certain population base, commercial environment, infrastructure, and mixed-use land development to enhance regional attractiveness. A well-developed urban environment not only provides services for convention and exhibition activities but also helps attract populations, thereby promoting the development of lifestyle-oriented exhibitions (Figure 8d).
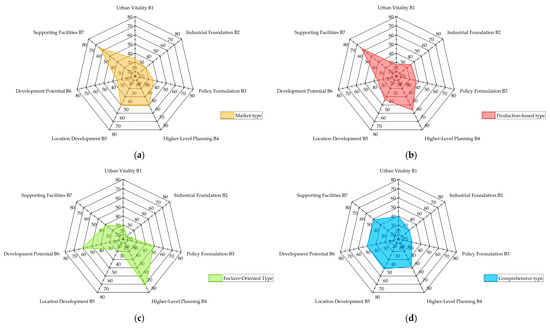
Figure 8.
(a) Radar chart of weights of market-type secondary indicators. (b) Radar chart of weights of production-based type secondary indicators. (c) Radar chart of weights of enclave-oriented type secondary indicators. (d) Radar chart of weights of comprehensive type secondary indicators.
Experts believe that the positioning of market-based and integrated models must be grounded in a solid urban construction foundation. Without a robust commercial environment, market competitiveness, and supporting policies, the development of the convention and exhibition industry will be challenging. Overall, the element guarantee requirements vary across different models. Small and medium-sized cities should choose an appropriate development model based on their actual conditions or undertake construction after improving the necessary guarantee conditions. The absence of clear goals and comprehensive element guarantees will negatively impact the overall effectiveness of convention and exhibition buildings.
Evaluation analysis of tertiary indicators across different positioning models is illustrated in Figure 9. The origin-based, market-based, and integrated development models all have high requirements for factors such as road construction, public transportation, infrastructure, and support services (Figure 9a,b,d). Among these, transportation conditions are critical to the sustained development of the convention and exhibition industry, with the market-based and integrated models placing particular emphasis on this. Excellent transportation conditions help exhibition and trade companies attract exhibition business, as well as exhibitors and audiences from outside the region. As a result, newly constructed convention and exhibition buildings in recent years focus on connecting to transportation hubs such as high-speed rail stations and airports. In contrast, the site selection for the origin-based and enclave-based models is more influenced by the specific needs of the convention and exhibition industry and industrial location (Figure 9b,c).
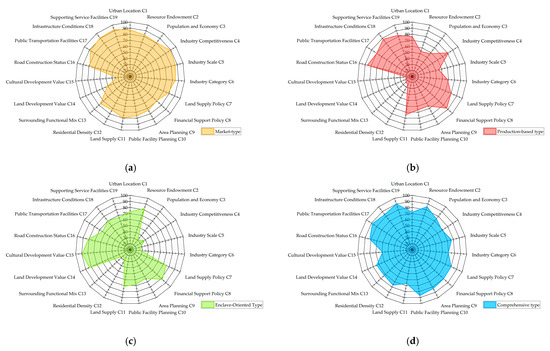
Figure 9.
(a) Radar chart of weights of market-type tertiary indicators. (b) Radar chart of weights of production-based type tertiary indicators. (c) Radar chart of weights of enclave-oriented type tertiary indicators. (d) Radar chart of weights of comprehensive type tertiary indicators.
The enclave-based development model has higher demands for cultural development value, land development value, fiscal support policies, and resource endowment, all of which are essential for its sustainable development (Figure 9c). Land supply and fiscal policies are crucial for all four models, as a favorable policy environment is vital for the healthy growth of the convention and exhibition industry in small and medium-sized cities. Therefore, small and medium-sized cities should leverage existing policies or develop long-term plans to ensure the steady advancement of the convention and exhibition industry. The origin-based model has lower requirements for cultural development value, land development value, functional integration, and residential density. However, it has higher demands for transportation, infrastructure, and supporting facilities, as well as stronger policy guarantees related to industrial competitiveness, land supply policies, supportive policies, and district planning.
The market-based and integrated models have similar demands. Except for the lower requirement for cultural development value in the market-based model, the need for support in other tertiary indicators is higher. The development of these two models relies on more comprehensive urban construction and industrial support, which results in relatively higher thresholds (Figure 9a,d).
6. Limitations of the Study
Limitation 1: First, in terms of research methodology, this study uses the importance index method and expert scoring method to effectively highlight the differences in the demand for development elements across various convention and exhibition building positioning types. However, it does not provide a detailed analysis of the indicator system and weight distribution for element guarantees. Specifically, this study lacks a process for constructing an indicator system using quantitative methods such as the analytic hierarchy process and conducting consistency tests. This methodological limitation will be a key focus of future research, with plans to improve the study through the following measures: (1) constructing a systematic evaluation indicator system; (2) adopting more scientific weight analysis methods; and (3) establishing a quantifiable evaluation model. These improvements will significantly enhance the scientific rigor of the research and its practical value.
Limitation 2: This study’s data sample has certain limitations. Although more than 150 convention and exhibition buildings have been constructed nationwide, this study only selected 73 projects with adequate field research and relatively complete data as research samples. Future research will expand the sample size and improve the construction of the database to further enhance the accuracy and generalizability of the research conclusions, providing more comprehensive data support for convention and exhibition building positioning decisions in small and medium-sized cities.
Limitation 3: The respondents in this study’s questionnaire survey were mainly industry experts whom the author and their team met during recent engineering projects, as well as professionals considered to have specialized knowledge in the field. While these respondents are somewhat representative, the sample size remains limited due to factors such as the uneven distribution of economic development levels, expert availability, and differences in perspectives, which may affect the generalizability and accuracy of the research conclusions. Therefore, future research could expand the scope of the questionnaire distribution and increase both the number and variety of expert samples to improve the representativeness, accuracy, and reliability of the research findings.
Limitation 4: While this study establishes typological positioning criteria and implements case-specific adjustments (e.g., reclassifying high-GDP cities with exhibition facilities primarily serving satellite towns or tourism development as enclave-type models), our cluster analysis remains constrained by its heavy reliance on quantitative indicators (e.g., GDP, floor area metrics), which inadequately captures qualitative dimensions such as cultural heritage, architectural distinctiveness, and policy frameworks, resulting in certain limitations and uncertainties. To address these issues, future research should (1) adopt the Delphi method to develop weighted evaluation matrices incorporating qualitative indicators (cultural, policy, etc.), and (2) enhance research depth and practical applicability through specialized studies on policy implementation guidelines (tax incentives, subsidies, reward mechanisms) and decision-making frameworks (e.g., a tri-dimensional “economic–cultural–policy” evaluation model).
7. Conclusions
Conducting a scientific cluster analysis of convention and exhibition buildings in small and medium-sized cities is a fundamental prerequisite for achieving accurate functional positioning and rational spatial planning. It also serves as a vital analytical tool for enabling decision-makers to gain a deeper understanding of the development characteristics and structural logic behind different building types. Addressing common issues such as vague positioning, homogeneous development models, and mismatched element guarantees systems, this study analyzes 73 representative cases and proposes four positioning models: market type, production-based type, enclave type, and comprehensive type. Through comparative analysis, this study systematically explores the development logic and resource support demands associated with each model, thereby constructing a comprehensive and practical multi-dimensional evaluation framework.
The findings indicate that the development of convention and exhibition buildings is not an isolated phenomenon but is closely tied to the economic structure, industrial foundation, resource endowment, and policy context of the host city. Production-based and enclave models are particularly suited to cities with distinct industrial features or strong resource advantages, and their success largely depends on the ability to respond effectively to local industrial demands or transform specific resources into spatial and economic value. In contrast, the market type and comprehensive type models demonstrate more diverse objectives and multifunctional integration, requiring not only sound physical infrastructure but also advanced policy coordination, spatial planning, and operational innovation. These models are more appropriate for cities with diversified economies and robust institutional support.
The analysis of elemental guarantees further reveals significant differences in resource allocation, policy dependency, and coordination mechanisms among the four models. For instance, enclave models rely heavily on external resources and inter-regional collaboration, making policy synergy and spatial connectivity particularly critical. Comprehensive models exhibit a high degree of systematic resource demand, necessitating the alignment of planning strategies, market mechanisms, and spatial functions. These insights provide theoretical guidance and practical tools for developing differentiated, context-specific positioning strategies for convention and exhibition buildings in small and medium-sized cities.
Future research should focus on the dynamic performance of different positioning models in real-world operations, especially on how to optimize the element guarantees system to enhance both spatial efficiency and economic effectiveness. Small and medium-sized cities should avoid blindly replicating the development paths of large metropolitan areas. Instead, they should strengthen top-level design, align development strategies with local economic stages, industrial structures, and resource conditions, and clarify their target user groups and service functions. A clear positioning model combined with a well-matched support system is essential not only for improving the economic returns of convention and exhibition facilities, but also for avoiding inefficient resource allocation and functional mismatch.
Ultimately, by identifying the characteristics and element guarantees requirements of different positioning models, cities can better leverage the platform functions of convention and exhibition buildings, enhance their competitiveness and regional influence, and promote a virtuous cycle of integration between the exhibition industry and urban development. This study provides both theoretical reference and practical implications for the spatial optimization and high-quality development of the convention and exhibition industry in small and medium-sized cities.
Author Contributions
Conceptualization: J.L. and Y.X.; Methodology: J.L.; Software: Y.X.; Validation: P.D.; Formal Analysis: Y.X.; Investigation: J.L. and Y.X.; Resources: J.L. and P.D.; Data Curation: Y.X.; Writing—Original Draft Preparation: Y.X.; Writing—Review and Editing: Y.X. and J.L.; Visualization: Y.X.; Supervision: J.L. and P.D.; Project Administration: J.L. and P.D.; Funding Acquisition: J.L. All authors have read and agreed to the published version of the manuscript.
Funding
This research did not receive any external funding.
Data Availability Statement
The data presented in this study are available upon request from the corresponding author.
Acknowledgments
The authors extend their gratitude to the Architectural Design and Research Institute of SCUT for providing project drawings and data.
Conflicts of Interest
The authors declare no conflicts of interest.
References
- Zhu, F. Exploration and Practice of Convention and Exhibition Industry Development in Small and Medium-Sized Cities; Huazhong University of Science and Technology Press: Wuhan, China, 2022. [Google Scholar]
- Xie, Y. Research on the Architectural Programming Elements of Conference and Exhibition Buildings in Small and Medium-Sized Cities; South China University of Technology: Guangzhou, China, 2024. [Google Scholar]
- Xie, Y.; Lujo, J.; Du, P. Subjective Evaluation of Place Environmental Quality in Conference and Exhibition Buildings in Small- and Medium-Sized Cities: An Empirical Case Study. Buildings 2025, 15, 1553. [Google Scholar] [CrossRef]
- Yi, L. Viewing the Development of Convention and Exhibition Economy in China’s Small and Medium-Sized Cities from the Perspective of City Management. Reform Strategy 2003, 10, 38–41. [Google Scholar]
- China Council for the Promotion of International Trade. China Exhibition Economic Development Report—2019; China Council for the Promotion of International Trade: Beijing, China, 2019. [Google Scholar]
- An, S. Functional Enhancement of Small and Medium-Sized Cities in Metropolitan Areas; Science Press: Beijing, China, 2020. [Google Scholar]
- Compilation Committee of Annual Report on Development of Small and Medium-Sized Cities in China. Annual Report on the Development of Small and Medium-Sized Cities in China (2022): Development of Small and Medium-Sized Cities Under the Goal of Common Prosperity; Social Sciences Academic Press: Beijing, China, 2022. [Google Scholar]
- Jia, X. Research on the Development Path and Countermeasures of New Urbanization in Hulunbuir City. Pract. (Theor. Ed.) 2014, 8, 25–27. [Google Scholar]
- Compilation Committee of Annual Report on Development of Small and Medium-Sized Cities in China. Annual Report on Development of Small and Medium-Sized Cities in China (2020–2021); Social Sciences Academic Press: Beijing, China, 2021. [Google Scholar]
- Guo, X. Development Prospects of Convention and Exhibition Industry in Small and Medium-Sized Cities in China. Mod. Bus. 2018, 8, 24–25. [Google Scholar]
- Lawson, F. Convention and exhibition facilities; Dalian University of Technology Press: Dalian, China, 2003. [Google Scholar]
- Kusche, K. Handbook of Convention and Exhibition Building Design and Construction; Huazhong University of Science and Technology Press: Wuhan, China, 2014. [Google Scholar]
- Chen, J. Convention and Exhibition Buildings; China Architecture & Building Press: Beijing, China, 2008. [Google Scholar]
- Zhou, Z. Development Trends of Contemporary Convention and Exhibition Buildings and Exploration of Their Development in China; Tongji University: Shanghai, China, 2008. [Google Scholar]
- Ni, Y. Research on the Typological Evolution of Convention and Exhibition Buildings in the Context of China’s Urban Development; South China University of Technology: Guangzhou, China, 2018. [Google Scholar]
- Hou, X. Research on the Design of Convention and Exhibition Complexes Based on Symbiosis Theory; South China University of Technology: Guangzhou, China, 2019. [Google Scholar]
- Qin, S. Research on the Design and Evaluation System of Medium-Sized Convention and Exhibition Buildings in Southern China for Flexible Needs; South China University of Technology: Guangzhou, China, 2021. [Google Scholar]
- Tian, Y.; Wang, W. Research on Adaptive Design of Exhibition Buildings in Small and Medium-Sized Cities: A Case of Yibin International Convention and Exhibition Center Phase Ⅱ Project. Urban. Archit. 2021, 18, 93–96. [Google Scholar]
- Zhang, J.K. On sustainable development of convention and exhibition complexes in small-medium cities. Bus. Cult. 2012, 7, 212–213. [Google Scholar]
- Zhong, Z.; Cheng, X.; Fa, S.; Wei, Z.; Hui, Y. Annual Report on the Development of Small and Medium-Sized Cities in China-2012: The Path to New Urbanization in Small and Medium-Sized Cities; Social Sciences Academic Press: Beijing, China, 2012. [Google Scholar]
- Compilation Committee of Annual Report on Development of Small and Medium-Sized Cities in China. China Small and Medium-Sized Cities Development Report (2019): The Path to High-Quality Development; Social Sciences Academic Press: Beijing, China, 2019. [Google Scholar]
- Gao, J.; Zhu, H.; Chen, J. A Preliminary Study on the Development Conditions and Dynamic Mechanisms of the MICE Industry. Tour. Sci. 2003, 1, 24–27. [Google Scholar]
- Zhou, C. Research on the Process and Characteristics of Government Intervention in Urban Convention and Exhibition Industry; China Books Press: Beijing, China, 2013. [Google Scholar]
- Wang, Z. Path Selection for the Development of the Convention and Exhibition Industry in Secondary Convention and Exhibition Cities—A Case Study of Hefei City. J. Hubei Univ. Econ. (Humanit. Soc. Sci. Ed.) 2010, 7, 32–33. [Google Scholar]
- Liang, Y.; Hu, X. Preliminary Study on the Development of Convention and Exhibition Tourism in Small and Medium-sized Cities—A Case Study of Wuhu City, Anhui Province. Resour. Dev. Mark. 2009, 25, 669–672. [Google Scholar]
- Wang, P.; Cai, M.; Peng, P. Research on the Development Path of Convention and Exhibition Industry in Small and Medium-sized Cities—A Case Study of Chenzhou. Hunan Soc. Sci. 2018, 4, 152–158. [Google Scholar]
- Zeng, L.; Qiu, M. Research on the Development of Convention and Exhibition Tourism in Small and Medium-sized Cities in China—A Case Study of Langfang City. Chin. Foreign Entrep. 2020, 2, 242. [Google Scholar]
- Shen, T. Revisiting the Path of MICE Economy Development in Small and Medium-Sized Cities Through the “Long Tail Theory”. In Proceedings of the 2007 Annual Academic Conference of China Convention and Exhibition Economic Research Association, Dongguan, China, 1 March 2007; pp. 139–144. [Google Scholar]
- Dong, Z. Research on the Integrated Development Path of the MICE Industry and Local Industries. Exhib. Econ. Trade. 2025, 2, 4–7. [Google Scholar]
- Zhang, S.; Li, S. Characteristics of MICE Economy and Enhancement of Urban Functions. Areal Res. Dev. 2002, 21, 71–74. [Google Scholar]
- Hsiao, Y.-H. A Study on the Evaluation Model for International Conference Venue Selection: Application of Fuzzy AHP; Nanhua University Institutional Repository (NHUIR): Dalin, Taiwan, 2005. [Google Scholar]
- Zhang, F. Conference and Exhibition Planning; Huazhong University of Science and Technology Press: Wuhan, China, 2019. [Google Scholar]
- Li, H. Practical Conference and Exhibition Planning; China Renmin University Press: Beijing, China, 2019. [Google Scholar]
- Ni, Y. Introduction to Typology of Convention and Exhibition Buildings; South China University of Technology Press: Guangzhou, China, 2019. [Google Scholar]
- Chen, J.; Zhang, X. Multiple Aggregation and Organic Symbiosis: Formal Design of Convention and Exhibition Architecture. Low Temp. Archit. Technol. 2004, 98, 20–22. [Google Scholar]
- Wan, J. Architectural Design Research for Exhibition Spaces in Convention Centers; Beijing University of Civil Engineering and Architecture: Beijing, China, 2015. [Google Scholar]
- Zhang, Y.; Yin, J. Reflections on the Design of Convention and Second Exhibition Buildings. Contemp. Archit. 2021, 10, 134–139. [Google Scholar]
- Liu, Z. Research on Site Selection and Layout Design Strategies for Extra-Large Convention and Exhibition Buildings in China Based on Accessibility Analysis; South China University of Technology: Guangzhou, China, 2019. [Google Scholar]
- Su, Z. Research on Composite Design Strategies for Small and Medium-Sized Convention and Exhibition Buildings; Kunming University of Science and Technology: Kunming, China, 2016. [Google Scholar]
- Zhou, Q. Preliminary Study on the Architectural Design of Convention and Exhibition Buildings; Tianjin University: Tianjin, China, 2008. [Google Scholar]
- Zhang, G. History of Convention and Exhibition Buildings and Venue Design; China Architecture & Building Press: Beijing, China, 2019. [Google Scholar]
- Han, B. Research on Text Clustering Algorithm Based on Deep Learning and Improved K-Means; Dalian Jiaotong University: Dalian, China, 2023. [Google Scholar]
- Zhang, Y. Prediction of Highway Freight Transportation Growth Trend Based on Cluster Analysis; Harbin University of Science and Technology—Computer Science and Technology: Harbin, China, 2022. [Google Scholar]
- Xie, H. Research on the Renewal of Old Industrial Districts Under Urban Stock Optimization; South China University of Technology: Guangzhou, China, 2023. [Google Scholar]
- Wu, Z. Construction of Physical Fitness Evaluation Index System for Outstanding Female Football Players in Sichuan Universities Based on the Precedence Chart Method; Chengdu Sport University: Chengdu, China, 2023. [Google Scholar]
- Tang, Y. Comprehensive Comparison and Application of Precedence Chart Method and Percentage Ratio Method. Career Horiz. 2007, 22, 29. [Google Scholar]
- Jin, X.; Li, Y. Comparative Study and Application of Precedence Chart Method and Analytic Hierarchy Process in Determining Weights. Chin. J. Health Stat. 2001, 18, 119–120. [Google Scholar]
- Moody, P.E. Decision Making: Proven Methods for Better Decisions; McGraw-Hill Press: New York, NY, USA, 1983. [Google Scholar]
- Hong, F. Analysis of Planning and Design Principles for Emerging Convention Centers. Anhui Archit. 2022, 29, 12–13. [Google Scholar]
- Liu, D. Five Considerations for Developing Convention and Exhibition Industries in Small and Medium-Sized Cities. China Conv. Exhib. 2020, 3, 18. [Google Scholar]
- Sun, X. Exploration and Practice of Convention and Exhibition Industry Development in Small and Medium-Sized Cities of Zhejiang Province. Money China 2020, 7, 58. [Google Scholar]
- Zhou, X.; Ye, Q. Research on Convention and Exhibition Industry Competitiveness and Interprovincial Trade Barriers—An Empirical Analysis Based on Chinese Provincial Data. J. Cent. South Univ. (Soc. Sci. Ed.) 2011, 17, 74–79. [Google Scholar]
- Zhu, F. Convention and Exhibition Centers in Small and Medium-sized Cities Should Shift from "Landlord" to "Platform" Management. China Conv. Exhib. 2022, 7, 20. [Google Scholar]
- Huang, W. Research on the Development of the Convention and Exhibition Industry in Coastal Small and Medium-sized Cities—A Case Study of Zhoushan City. China Urban Econ. 2011, 1, 36–37. [Google Scholar]
- Fu, Y.; Zheng, X. Integration of Tourism and Convention and Exhibition Industries: Industrial Value Chain Analysis, Paths, and Countermeasures. J. Northwest AF Univ. (Soc. Sci. Ed.) 2014, 14, 146–153. [Google Scholar]
- Hong, F. Research on the Planning and Design of Mountain Convention and Exhibition Centers; North China University of Technology: Beijing, China, 2022. [Google Scholar]
- He, W. Reflections on the Development of Convention and Exhibition Economy in Small and Medium-sized Cities. J. Bus. Econ. 2004, 11, 49–51. [Google Scholar]
- Sun, Y.; Ma, Y.; Dai, X. Research on the Development Status of E-commerce in the Urbanization Process of Small and Medium-sized Cities. J. Inn. Mong. Univ. Natl. 2011, 17, 62–64. [Google Scholar]
- Yang, Q. The Driving Effect of Convention and Exhibition Economy on the Economic Development of Small and Medium-sized Cities and Countermeasures. Tour. Overv. 2014, 4, 249. [Google Scholar]
- Zheng, B.; Zhang, Y. Qualitative Research on the Low Utilization Rate of Convention and Exhibition Venues in Small and Medium-sized Cities—A Multi-perspective Analysis Based on Stakeholder Theory. China Bus. Mark. 2022, 16, 136–139. [Google Scholar]
- Feng, K. Urban Functions: From Industrial Manufacturing to Service Sector—How Chinese Cities Can Overcome the Development Dilemma of Service Industries. City Plan. Rev. 2013, 37, 93–96. [Google Scholar]
- Liu, T. New Ideas for County Convention and Exhibition—Analysis of the Interactive Relationship Between Agricultural Convention and Exhibition and Rural Economic Development. China Conv. Exhib. 2025, 3, 48–50. [Google Scholar]
- Qi, S. Thoughts on the Development of Convention and Exhibition Tourism in Small and Medium-sized Tourist Cities—A Case Study of Wuyishan. J. Nanping Teach. Coll. 2006, 2, 81–84. [Google Scholar]
- Chen, J. Location Selection and Development Strategies for Convention and Exhibition Centers. J. Chongqing Technol. Bus. Univ. (West. Econ. Forum) 2003, 3, 102–104. [Google Scholar]
- Li, K.; Wang, T.; Han, Z.; Yang, Y.; Wang, S. Jinjiang International Convention and Exhibition Center PPP Project; Social Sciences Academic Press: Beijing, China, 2019. [Google Scholar]
- Wang, H. Research on the Branding Development of Convention and Exhibition Industry in Small and Medium-Sized Cities; Hunan University: Changsha, China, 2013. [Google Scholar]
- Liu, G.; Guo, Y. Feasibility Study on Planning a Sports and Convention Center at Harbin High-speed Rail Station. Heilongjiang Sci. Technol. Inf. 2009, 26, 352. [Google Scholar]
- Song, L. Research on Energy-saving Operation Methods of Power Supply and Distribution Systems for Large Convention and Exhibition Projects in Second- and Third-tier Cities; Beijing University of Civil Engineering and Architecture: Beijing, China, 2014. [Google Scholar]
- Cai, G. Discussion on the Development Needs of Urban Convention and Exhibition Center Planning and Design—A Case Study of Nanjing International Expo Center. Mod. Urban Res. 2015, 2, 55–59. [Google Scholar]
- Tian, X. Attempts in Convention and Exhibition Buildings Under Specific Regional Conditions—Zunyi Shidi Qiangwei International Convention and Exhibition Center. Archit. Tech. 2019, 2, 78–85. [Google Scholar]
- Cheng, J.; Ai, C. Convention and Exhibition Economic Development, Convention and Exhibition City Competitiveness, and Urban Function Enhancement. City Plan. Rev. 2008, 10, 15–20. [Google Scholar]
- Chen, J.; Zhang, X. Multi-Dimensional Aggregation and Organic Symbiosis—Research on the Formal Creation of Convention and Exhibition Buildings. In Proceedings of the Academic Symposium on New Situations and Technological Innovation, Nicosia, Cyprus, 14 March 2004; p. 3. [Google Scholar]
- Wang, T. China PPP Annual Development Report (2017); Social Sciences Academic Press (Law & Society Division): Beijing, China, 2018. [Google Scholar]
- Fang, Q. Research on the Relationship Between Traffic Impact Assessment and Urban Design—A Case Study of the Urban Design of Urumqi Convention and Exhibition Center Area. Hous. Real Estate 2020, 9, 249. [Google Scholar]
- Wang, F.; Li, Q. Research on the Correlation Between the Positioning of Large and Medium-sized Sports Venues and Traffic Accessibility—A Case Study of the Guangzhou-Foshan Area. South. Archit. 2021, 6, 100–106. [Google Scholar]
- Yu, H.; Qian, H.; Yang, M. Discussion on Key Contents of Traffic Impact Analysis for Sports and Convention Centers—A Case Study of Traffic Impact Assessment for Zhenjiang Sports and Convention Center. Traffic Transp. (Acad. Ed.) 2010, 26, 3. [Google Scholar]
- Zhang, D. Research on Traffic Impact Assessment in Small and Medium-Sized Cities; Chongqing Jiaotong University: Chongqing, China, 2014. [Google Scholar]
- Fortin, P.A.; Ritchie, J.R.R.; Arsenault, J. A Study of the Decision Process of North American Associations Concerning the Choice of a Convention Site; Quebec Planning and Development Council: Quebec City, QC, Canada, 1976. [Google Scholar]
- Mair, J. Conferences and Conventions; Routledge: London, UK, 2014. [Google Scholar]
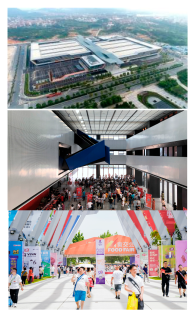
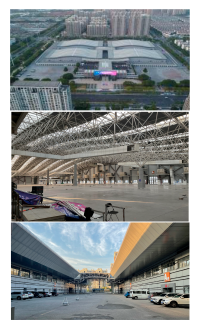
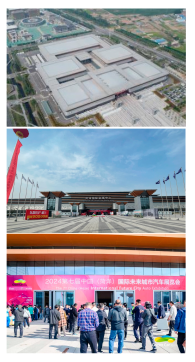
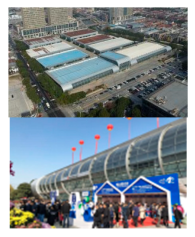
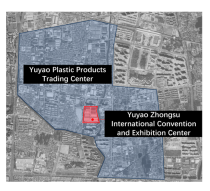
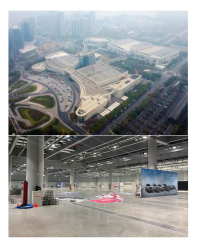
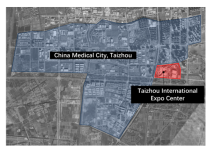
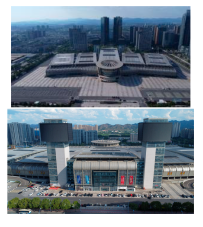
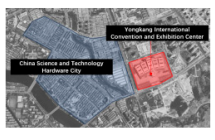
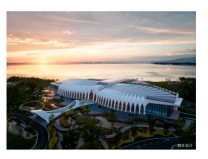
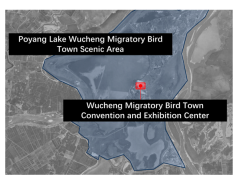
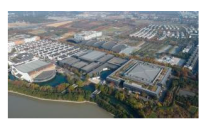
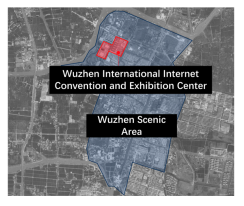
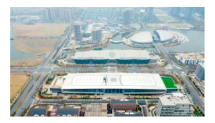
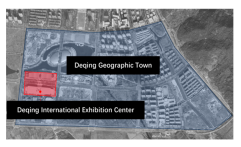
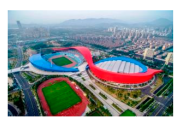
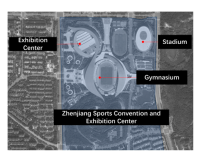
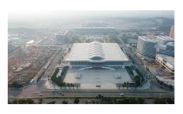
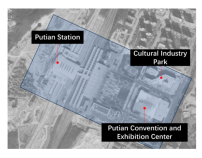
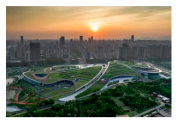
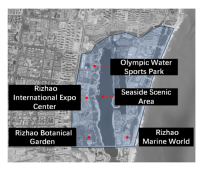
Disclaimer/Publisher’s Note: The statements, opinions and data contained in all publications are solely those of the individual author(s) and contributor(s) and not of MDPI and/or the editor(s). MDPI and/or the editor(s) disclaim responsibility for any injury to people or property resulting from any ideas, methods, instructions or products referred to in the content. |
© 2025 by the authors. Licensee MDPI, Basel, Switzerland. This article is an open access article distributed under the terms and conditions of the Creative Commons Attribution (CC BY) license (https://creativecommons.org/licenses/by/4.0/).