Article

Study on New Natural Ventilation Performance Based on Seat Air Supply in Gymnasiums

1
Central-South Architectural Design Institute Co., Ltd., (CSADI), Wuhan 430071, China
2
School of Civil Engineering and Architecture, Wuhan University of Technology, Wuhan 430070, China
3
Sanya Science and Education Innovation Park, Wuhan University of Technology, Sanya 572024, China
*
Authors to whom correspondence should be addressed.
Buildings 2025, 15(10), 1600; https://doi.org/10.3390/buildings15101600
Submission received: 8 April 2025 / Revised: 30 April 2025 / Accepted: 7 May 2025 / Published: 9 May 2025
(This article belongs to the Special Issue Building Energy-Saving Technology—3rd Edition)

Abstract

In recent years, China has continuously increased the construction of sports facilities, with the number and area of sports venues steadily growing. The use of more energy-efficient ventilation methods in gymnasiums has become one of the research hotspots. Taking a multi-functional gymnasium in Wuhan as an example, the gymnasium adopts a seat air supply device driven by natural wind to enhance indoor ventilation. This study uses the methods of field measurement and CFD simulation to analyze the application effect of this new type of natural ventilation device in hot summer and warm winter areas during the transition season. Through CFD simulation of the ventilation performance of the seat air supply at different opening rates, the indoor ventilation effect and thermal comfort were analyzed. The application of the seat air supply greatly improved the indoor environment and enhanced the comfort of personnel. After turning on the seat air supply, the maximum temperature difference between the indoors and outdoors increased from 1.7 °C to 3.4 °C, the natural air intake rate increased from approximately 50% to approximately 70%, the wind speed in the seat area significantly increased, the uniformity of the wind speed field in the movement area significantly increased, and the proportion of areas with low wind speed and no wind speed decreased to 9.6%. The proportion of areas with wind speeds ranging from 0.3 to 0.5 m/s increased from 8.8% to 33.0%. At 10:00 a.m., the temperature at the indoor station was relatively low. The opening of the seat air supply device reduced the PMV value of the front seats by an average of 0.39. When the indoor platform temperature reached the maximum value, the impact of equipment activation on the PMV index of the seat area was relatively small, with an average reduction of only 0.19. The research results show that the application of a natural wind-driven seat air supply in sports venues is very promising, providing a new idea for the energy-saving renovation of gymnasiums and effectively promoting the development of low-carbon undertakings.

1. Introduction

In recent years, countries have continuously increased the construction of sports facilities, and the number and area of sports venues have continued to increase. Taking China as an example, according to the statistics of Workers’ Daily, the number of sports venues in China in 2023 will be 4,592,700, an increase of 1,430,700 over 2018, and a year-on-year increase of 45.25%. Therefore, how to introduce the concept of green and low-carbon facilities will also be an important issue in this era [1].
At present, many indoor stadiums use air conditioning systems to ensure the constant air temperature and comfort in the sports venues. However, due to the large size of indoor venues and poor air circulation, indoor air quality is often worse than outdoor air quality [2,3,4]. If there is no proper ventilation, the air quality in the venues will rapidly decline [5,6,7]. Qian et al. [8], focusing on sports architecture, summarized 62 high-quality papers published in the field of building science over the past 30 years and showed that the current research is mainly focused on four main areas: indoor air quality, ventilation, the thermal environment and energy consumption, and green technology innovation. The traditional energy-saving approach to improving indoor stadium ventilation is mainly to use the regulation system supplemented by natural ventilation and the main component of mechanical ventilation. Compared with complete natural ventilation, extra energy is needed to drive the mechanical device [9,10]. More attention has been focused on the feasibility of using natural ventilation to improve air quality in indoor venues [11,12]. Among them, hot-pressure ventilation and wind-pressure ventilation are the two most common forms of natural ventilation [13]. These two ventilation forms are affected by outdoor wind speed, building shape, and surrounding weather and are not easy to control [14,15]. Haw et al. [16] studied how wind-induced natural ventilation towers can generate a high air-change rate (ACH) for indoor building environments in hot and humid climates. Qian et al. [17] carried out a computational fluid dynamics (CFD) simulation analysis on the opening and closing scenes of the roof of the Jiading Natatorium in Tongji University, Shanghai. The results showed that when the opening rate was 35%, a good ventilation effect was achieved, and excessive wind pressure was avoided. Kang et al. [18] tested the influence of the angle of external window louvers on natural ventilation. The louvers aligned with the oncoming wind effectively promoted stagnant airflow within the factory building under study. Cui et al. [19] studied the influence of the size of window openings on the constant air circulation rate and suggested setting larger windows at the dominant wind direction. Lin et al. [20] studied the natural ventilation of large spaces, taking into account the chimney effect, and found that a window opening area exceeding 0.9% was sufficient to provide fresh air to meet indoor air quality requirements. Chen et al. [21] measured the indoor thermal environment of the Shanghai International Gymnastics Stadium and found that during the transitional season, the upper opening was always conducive to energy conservation. Karaiskos et al. [22] found that high concentrations of CO2, TVOC, and PM in some working conditions of natural ventilation exceeded the recommended limits. Cheng et al. [23] investigated the potential of natural ventilation to maintain indoor air quality and thermal comfort in gymnasiums. With the improvement in roof vents, the acceptable ventilation time increased from 21.5% to 99.5%. Guo et al. [24] combined a building energy model (BEM) and computational fluid dynamics (CFD) and found that the thermal comfort of the exercise area of medium-sized gymnasiums in subtropical areas using a passive ventilation mode is better than that of the spectator area in the transition season of spring and autumn.
Sekhar’s research shows that compared with natural ventilation, mechanical ventilation can significantly enhance the ventilation effect of a room, but it also requires additional energy consumption [25]. The seat air supply combines the air outlet with the seat of the personnel, without bearing the load of the whole large space, and is suitable for places with high heat source density [26,27]. The concept of seat air supply was proposed in the last century. It was initially applied in the automotive industry and later widely used in passenger aircraft and high-speed railways [28,29,30,31,32]. At the same time, the combination with air conditioning systems has led to the appearance of seat air supply devices in large spaces such as theaters and conference halls [33,34,35]. The application effect of air conditioning systems with seat air supply devices in large spaces has been fully studied. A seat air supply directly delivers air to the human body, forming a uniform temperature and velocity field without bearing the load of the entire large space, thereby reducing energy consumption. Additionally, it ensures controlled wind speed within the competition field and minimizes airflow impact compared to that of the competition area. The shortcomings of the seat air supply system are also quite obvious. Its complex design makes its construction difficult. Meanwhile, compared with the top air supply system, the seat air supply system has a larger air supply volume and higher fan energy consumption [36,37]. Zhang et al. [38] chose to adopt an air conditioning scheme under seats in an audience area during their research on the design scheme of a gymnasium air conditioning system. Nishioka et al. [39] measured and evaluated the indoor thermal environment of a large dome stadium and found that the seat air conditioning system and multi-zone technology were sufficient to effectively cool the corresponding space. Table 1 summarizes the advantages and disadvantages of these studies on natural ventilation and mechanical ventilation.
Although compared to mechanical ventilation, natural ventilation systems in large indoor spaces are prone to the stratification of pollutants [40,41], they play a significant role in reducing energy consumption in sports venues [42,43]. If natural ventilation can be combined with seat air supply, it can provide a good indoor environment while fully leveraging the energy-saving advantages of both systems. The term “seat air supply” mentioned here refers to the following: by arranging air ducts and air outlets on the seats and directly connecting them to the outside, fresh air from outside is delivered to the audience area driven by natural wind. This is a more practical natural ventilation technology that combines natural ventilation with seat air supply, quickly regulating the temperature and humidity near the indoor residents and achieving the goal of low carbon and energy conservation.
For sports venues with fixed seats, this paper proposes a seat air supply device driven by natural wind. Through on-site measurements and CFD simulations of gymnasiums adopting this natural ventilation form, the application effect of seat air supply in transitional seasons is verified. This research found that the activation of the seat air supply increased the maximum temperature difference between the indoors and outdoors from 1.7 °C to 3.4 °C, significantly improved the natural air intake rate, and enhanced the uniformity of the wind speed field in the movement area. The application of air supply for seats has greatly improved the indoor environment and enhanced the comfort of personnel.
The overall motivation of this research is to analyze the application effect of this kind of seat air supply that is completely driven by natural wind, aiming to reduce the ineffective energy consumption caused by the unreasonable use of mechanical ventilation during the transitional season, improve personnel comfort, contribute to promoting the realization of low-carbon goals in the construction field, and provide a replicable technical path for the implementation of green building technology in large public spaces.
This manuscript first introduces the experimental part, indicating the measured areas and measured objects, in order to clarify the generalization value of the research. Immediately following, the test instruments of the experiment, the layout of the test points, and the four working conditions of the test are introduced in detail, and the test results are presented. The next part is an introduction to the simulation. In the manuscript, the ventilation effect under five opening conditions is simulated with a 25% gradient. Combined with the PMV index, the application effect of the seat air supply driven by natural wind in the gymnasium is comprehensively analyzed.

2. Study Site and Measurements
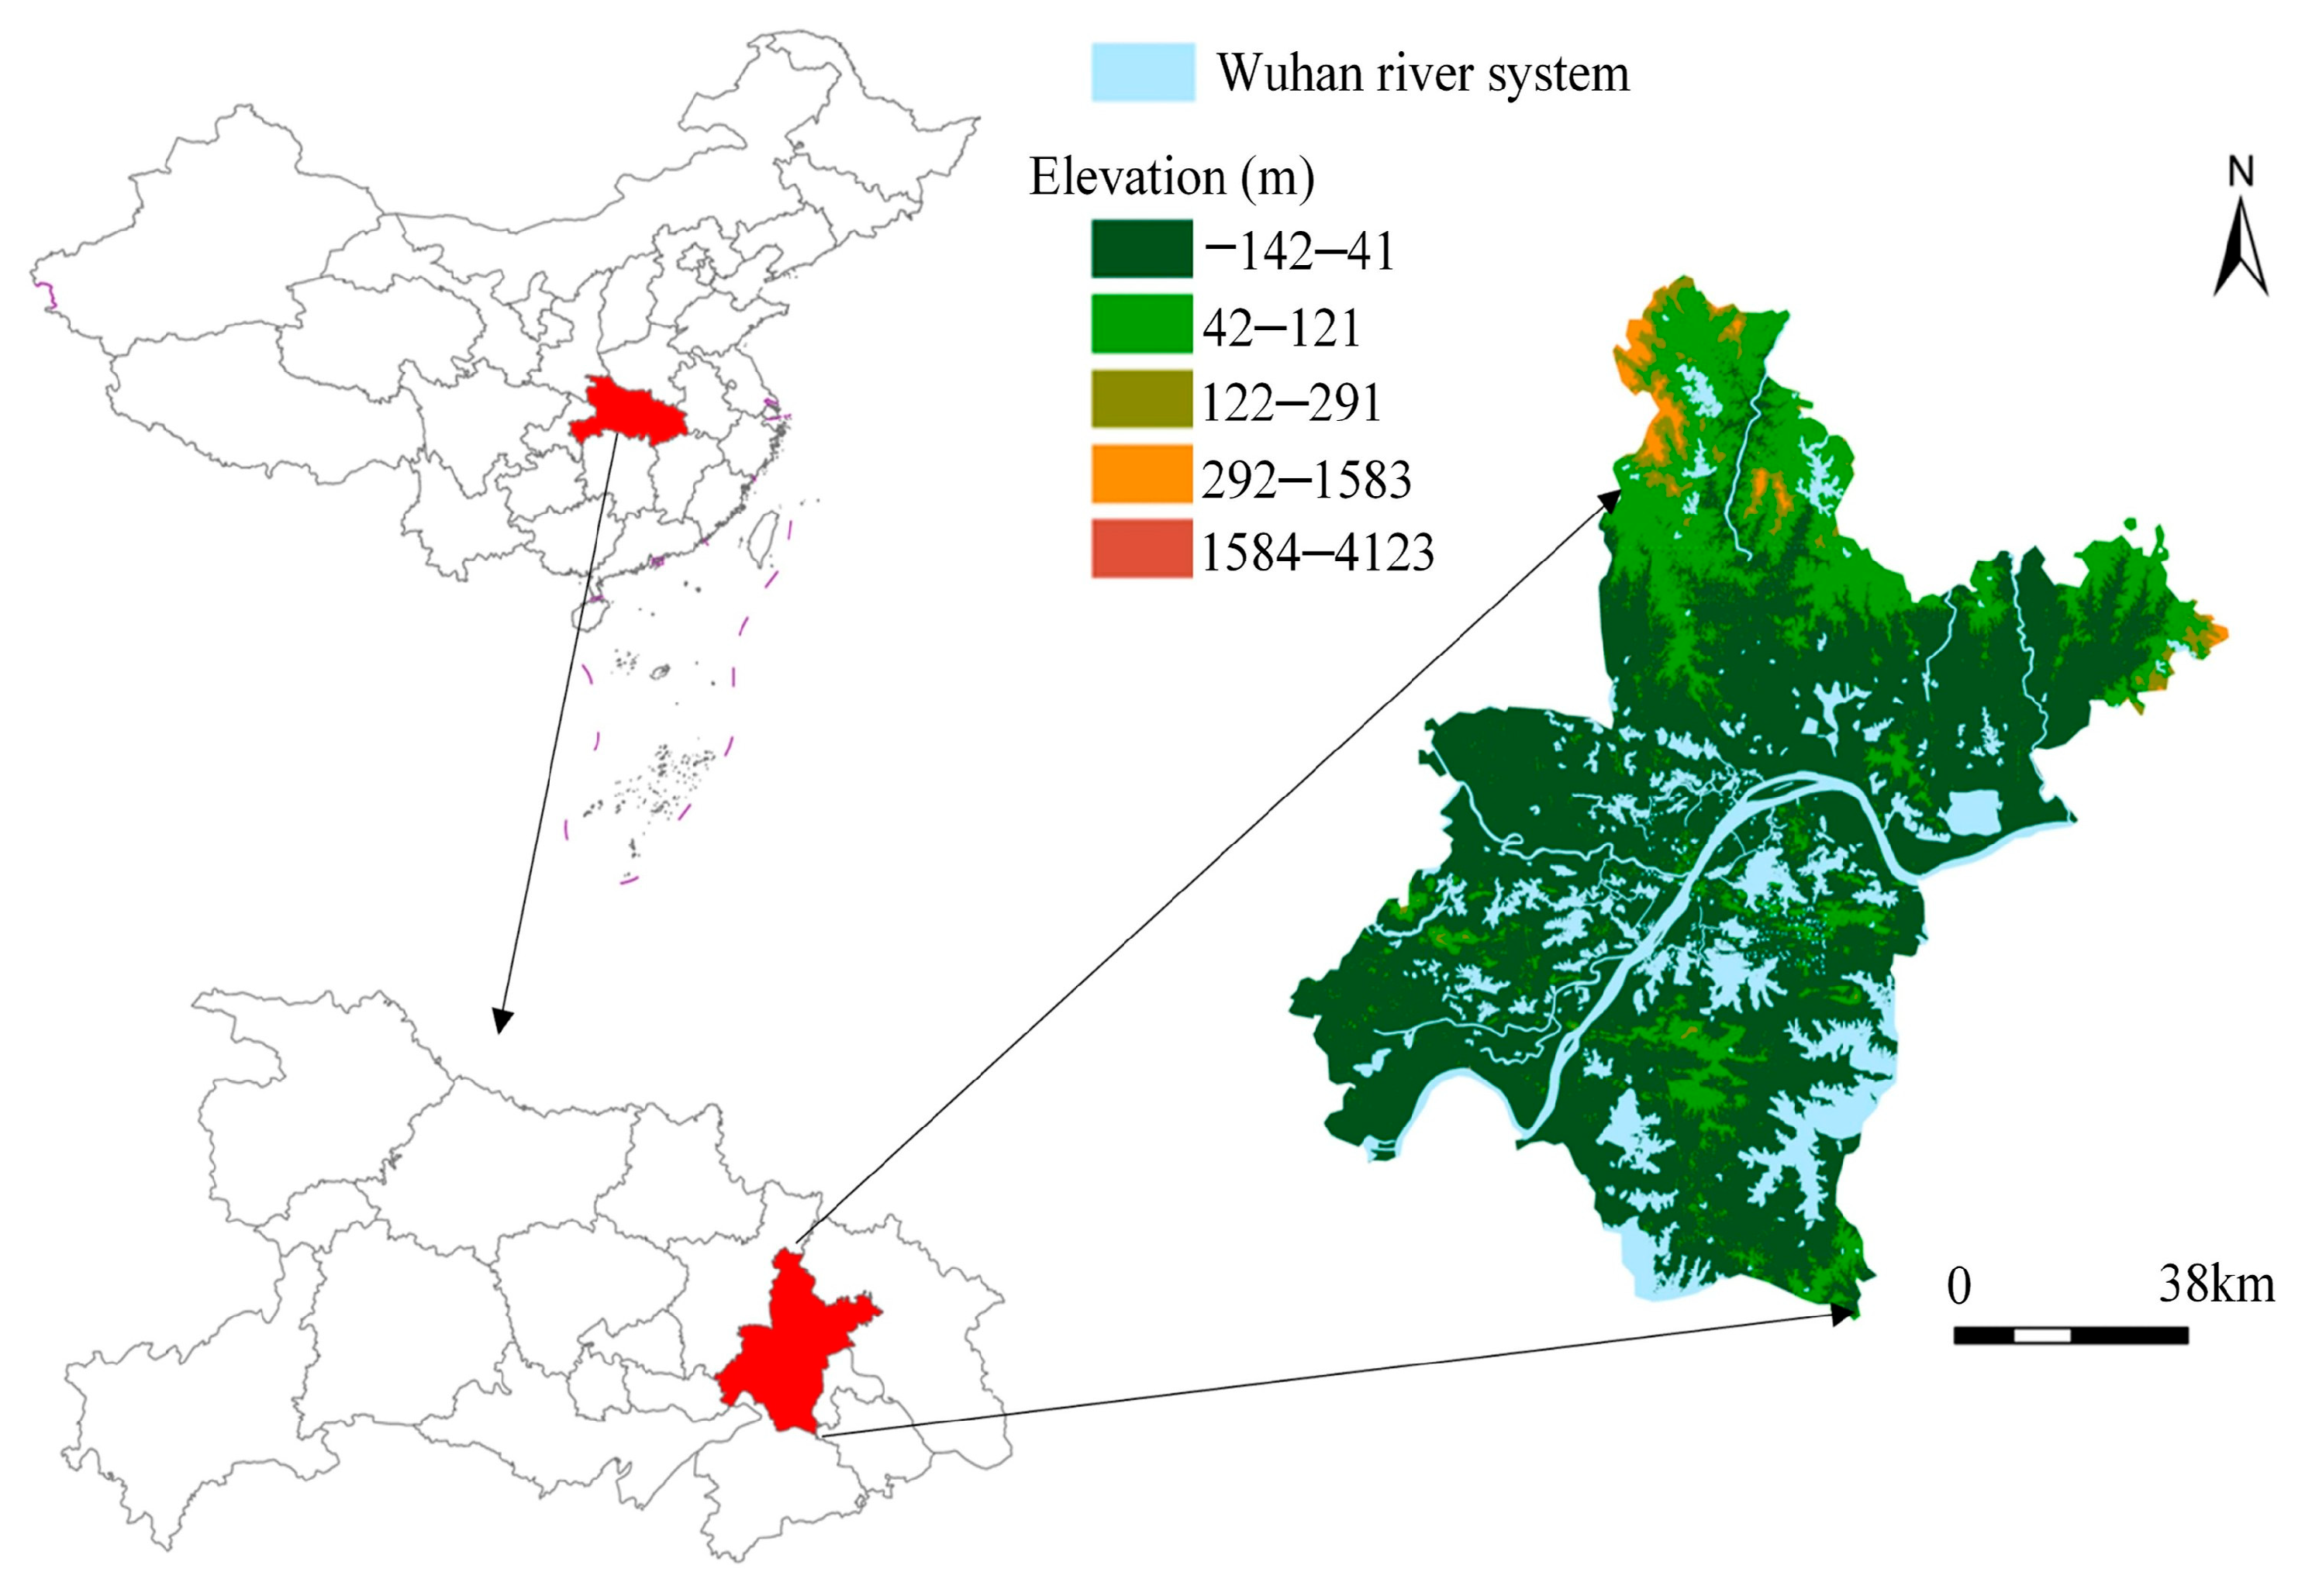
2.1. Research Area

2.1.1. Location

This research focuses on the application of seat air supply driven by natural wind in gymnasiums with hot summers and warm winters during transitional seasons. Due to its unique geographical location and distinct four-season climate, Wuhan has become an ideal location for the research. Wuhan is located between 113°41′ E~115°05′ E and 29°58′ N~31°22′ N, in the center of China’s hinterland and the eastern part of Hubei Province. As shown in Figure 1, it is the confluence of the Yangtze River and its largest tributary, the Han River. Wuhan has a subtropical monsoon climate with distinct seasons, abundant rainfall, and is suitable for human habitation and various economic activities [44]. As a central city in the central region of China and an important transportation hub, Wuhan has a well-developed water, land, and air transportation network, which radiates over half of China and has direct flights to five continents [45,46]. Research on the application effect of seat air supply devices in Wuhan gymnasiums is of great significance for the energy-saving renovations of gymnasiums in hot summer and warm winter areas in China.

2.1.2. Climate Information

According to the data from the China Weather Network, Wuhan has a subtropical humid monsoon climate with abundant rainfall, sufficient sunshine, and four distinct seasons. The overall climate and environment are favorable. Over the past 30 years, the average annual rainfall has been 1269 mm, and most of it is concentrated from June to August. The average annual temperature ranges from 15.8 °C to 17.5 °C. The annual frost-free period is generally 211 to 272 days, and the total annual sunshine duration is 1810 to 2100 h. The climate in Wuhan is dominated by winter and summer. Early summer starts in mid-May each year, and it enters midsummer in July. The highest temperature is mostly between 37 and 39 degrees Celsius, but the lowest temperature is relatively high, usually between 29 and 30 degrees Celsius. Coupled with the high humidity, it often makes people feel muggy and uncomfortable. The precipitation is abundant but unevenly distributed throughout the seasons. In summer, it is necessary to prevent heatstroke and keep cool. In winter, one needs to deal with the damp and cold conditions, and air conditioners are used frequently.

2.2. Field Measurement

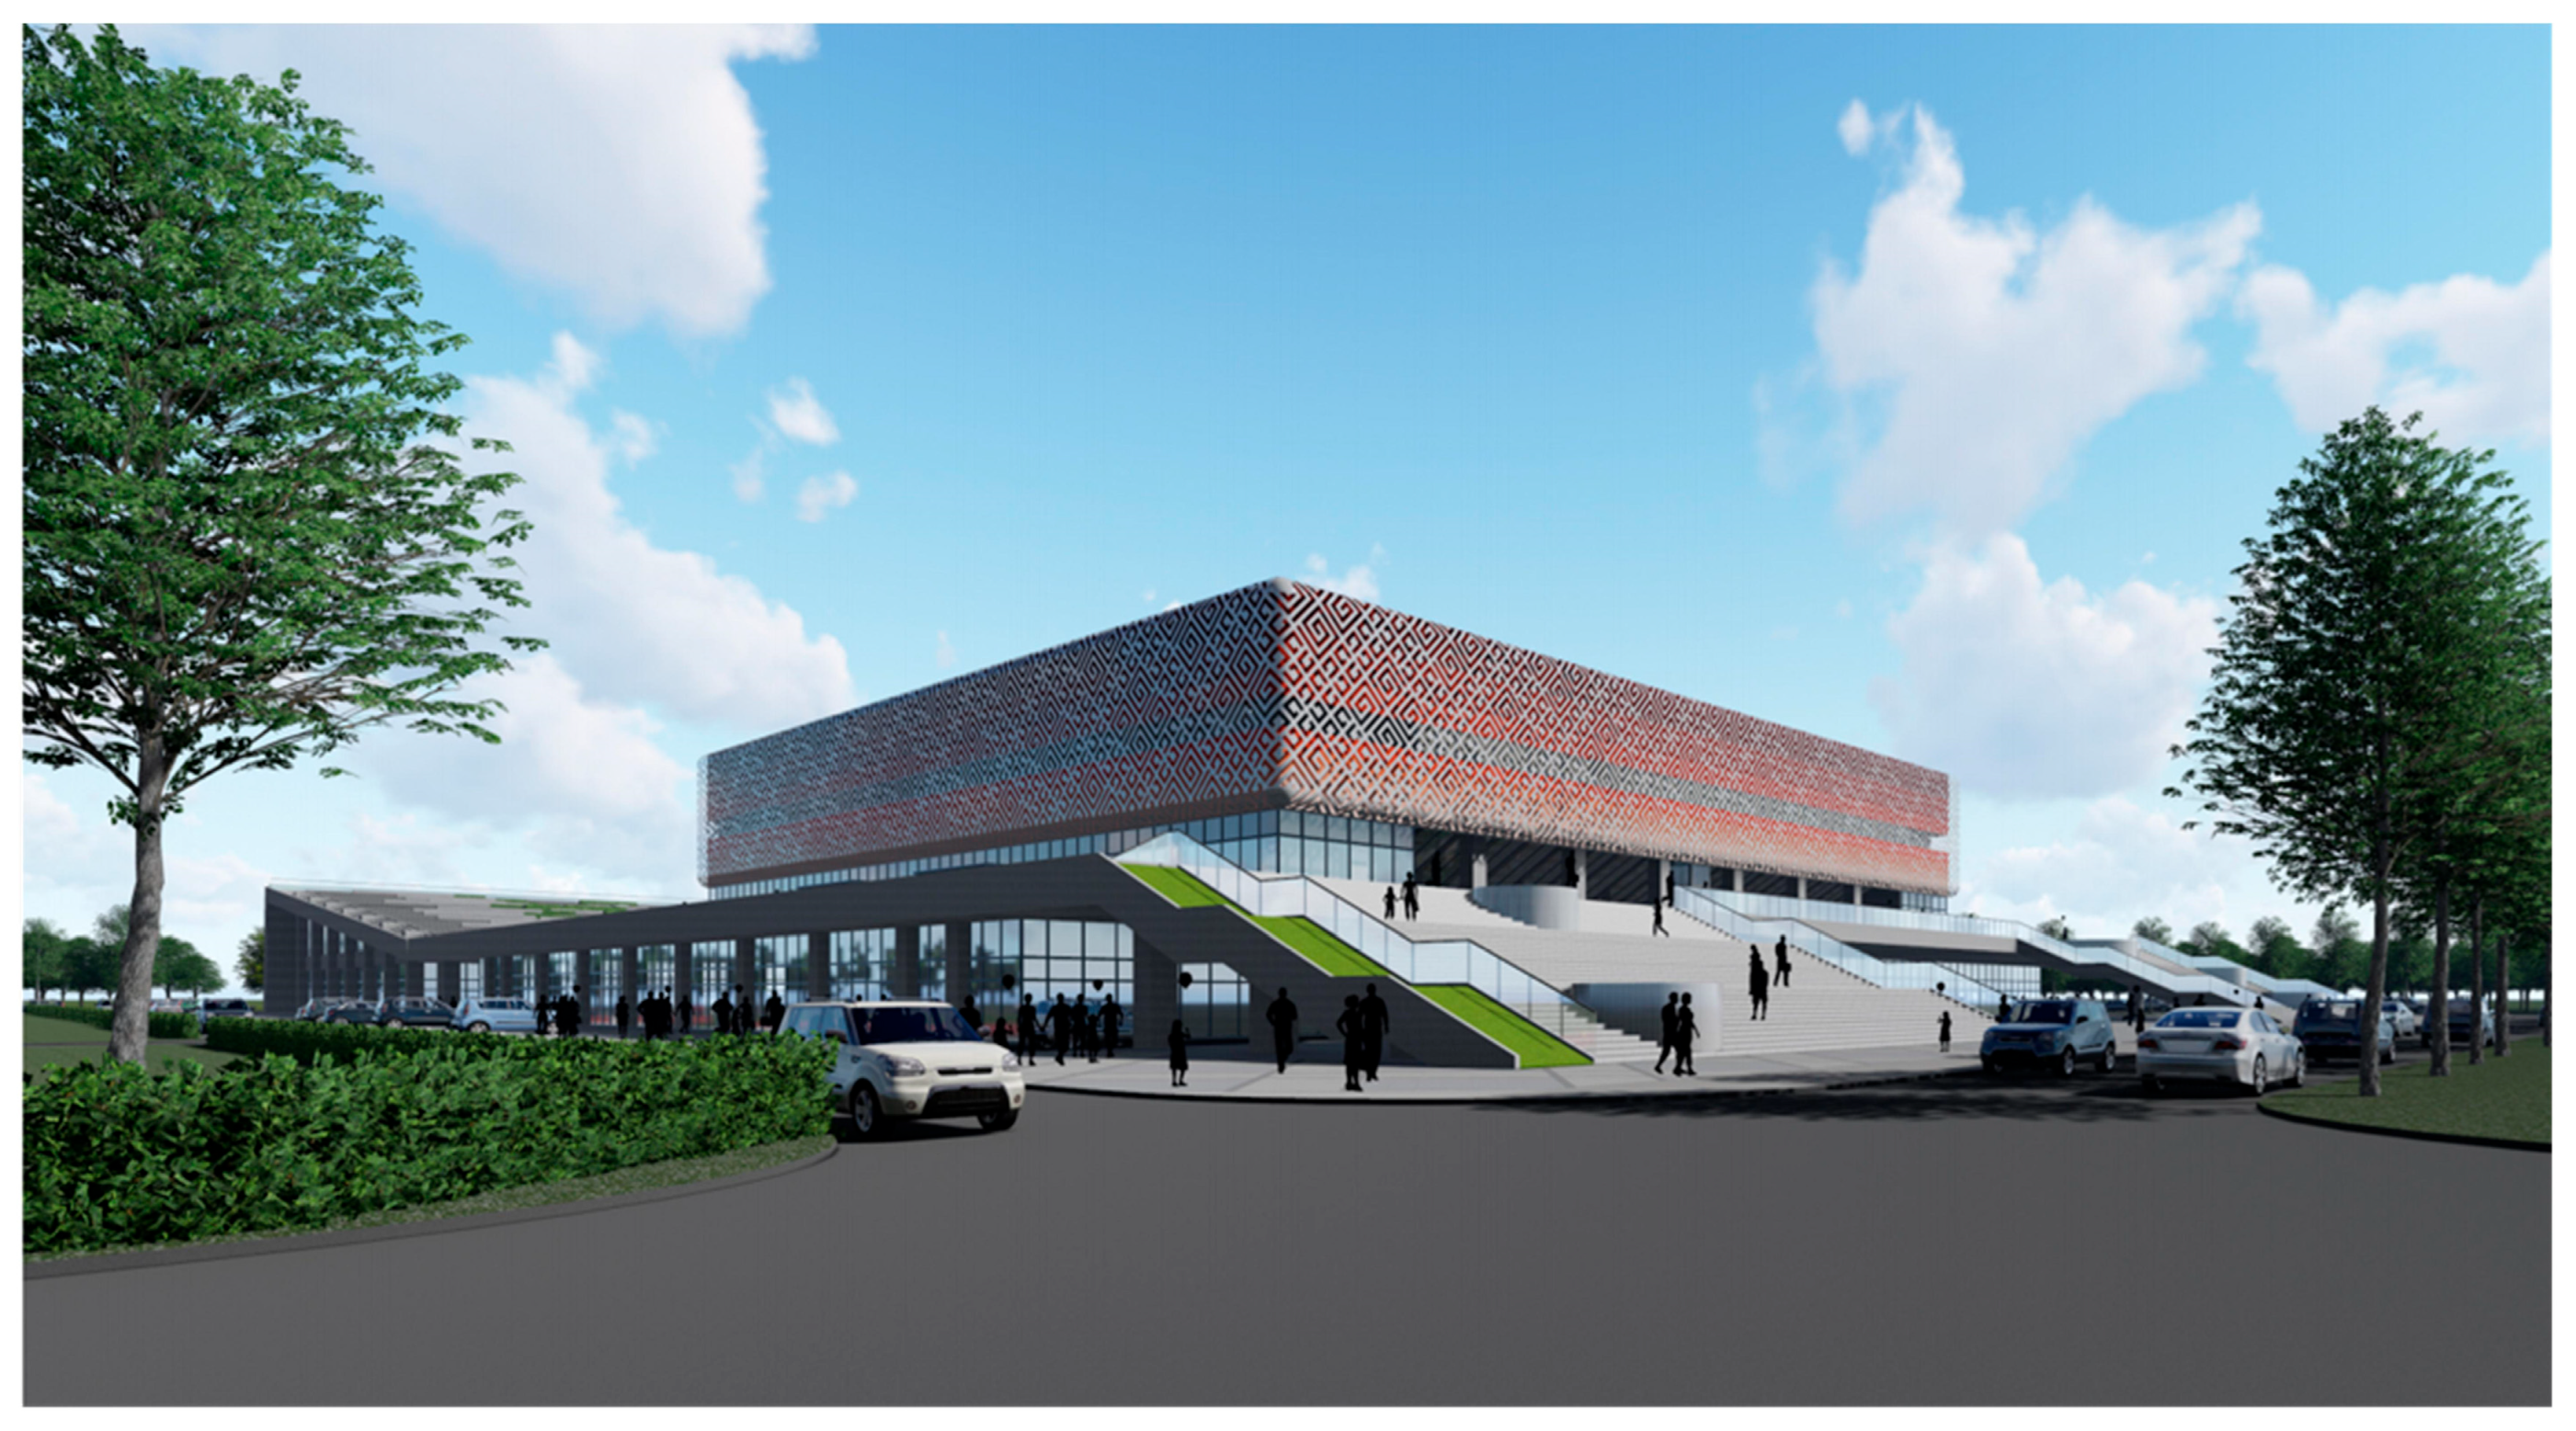
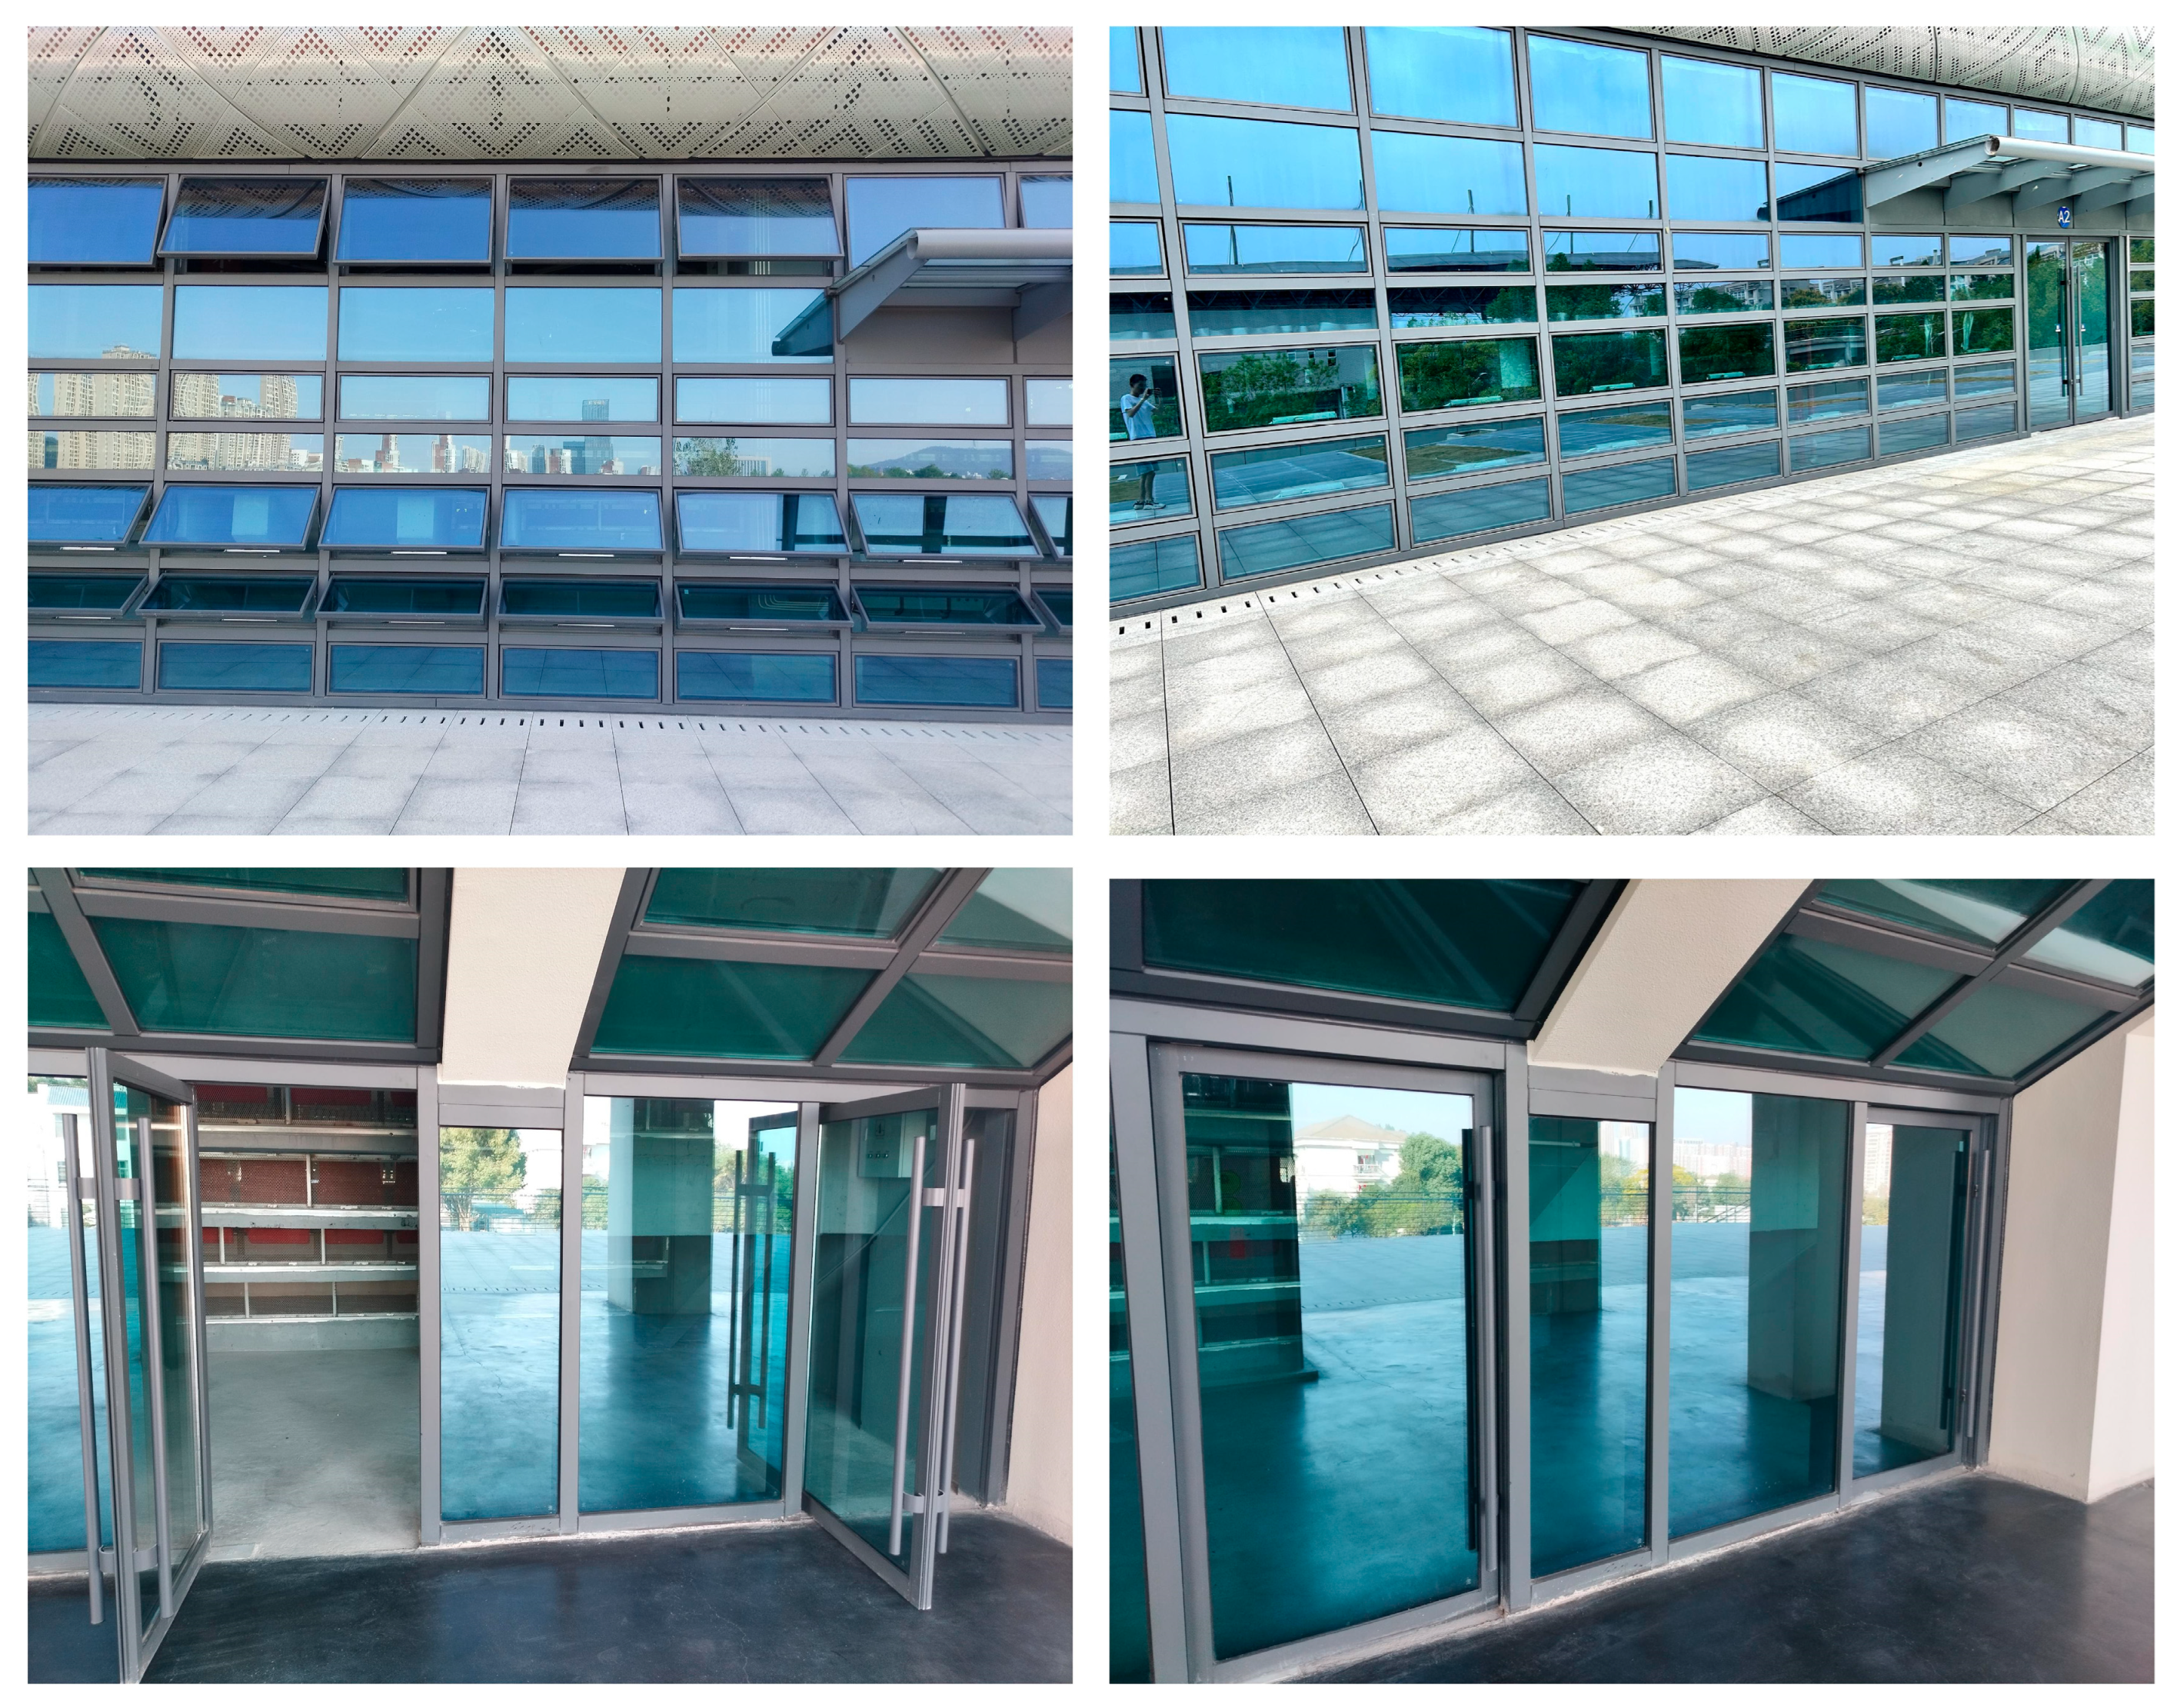
2.2.1. Measurement Object

The gymnasium studied is the gymnasium of the Sunshine Campus of Wuhan Textile University (Figure 2), which is located on Sunshine Avenue, Jiangxia District, Wuhan City, and was completed in 2023, with a total building area of 23,405.79 square meters, of which 21,882.1 square meters is above ground and 2223.69 square meters is underground, with a height of 20 m. The stadium has a total of 6573 seats, of which 3301 are large sports venue fixed seats. The indoor temperature and humidity regulation is mainly completed by natural ventilation and air conditioning. The gymnasium is not designed with a lobby, so the ventilation pathways are unobstructed. The ventilation distance between the inside and outside of the stadium is very short, and the natural ventilation effect is good, which can meet the indoor temperature and humidity and ventilation regulation needs of small- and medium-sized activities.
The natural ventilation method with seat air supply is used, where the backrests of the seats are perforated and each seat is equipped with an air supply vent that is directly connected to the outside of the venue. The seat air supply device enhances the connection between indoor and outdoor air. Fresh outdoor air can be directly delivered to the vicinity of the indoor personnel, fully leveraging the energy-saving advantage and quickly regulating the temperature and humidity near the indoor personnel (Figure 3). Compared with mechanical ventilation, seat air supply has obvious advantages: it directly introduces undiluted outdoor air into the vicinity of people, enhancing comfort, and at the same time does not require fans or complex air duct systems, making it suitable for the renovation of existing buildings. The reliance on weather conditions becomes a drawback of the seat air supply.

2.2.2. Measurement Schedule and Instruments

The measurements of the gymnasium were conducted from 22 April to 25 April 2024. The measurement plan for the gymnasium was divided into outdoor and indoor tests, and indoor and outdoor tests were carried out simultaneously to ensure that all segment tests belonged to the same time. The selection and reasons for the measurement variables, measuring instruments, and measurement point positions are as follows.
After a comprehensive analysis of the indoor and outdoor environmental variables, parameters such as temperature, wind speed, and humidity, which have a significant impact on human comfort, became the focus of the measurements. The determination of these variables can clarify the changes in the indoor environment. The six environmental parameters finally selected for the research include indoor wind speed, indoor temperature, indoor relative humidity, outdoor wind speed, outdoor temperature, and outdoor relative humidity.
The measuring instruments were determined based on the selected measurement parameters. The measuring instruments used in the actual measurement are shown in Table 2. A HOBO Pro Temperature Recorder was used to measure the indoor and outdoor temperature and humidity. Its temperature accuracy reaches ±0.1 °C, humidity accuracy reaches ±2%, and the recording frequency is 15 min each time. A TSI-AP500 wireless anemometer was used to record wind speeds both indoors and outdoors. The instrument has an accuracy of ±2% and records once every 15 min. The accuracy of the selected instrument meets the research requirements, and all target parameters can be effectively tested and collected.
The positions of the measurement points were selected according to the research requirements and were divided into outdoor measurement points and indoor measurement points. The coordinates of all measurement points are marked in Figure 4 (unit: meters). The measurement points were arranged outside the gymnasium to record the outdoor temperature and wind speed of the gymnasium. A total of 12 measurement points were set up. Among them, the measurement point in the X direction was located 5.5 m away in the direction of the gate in the X direction, and the measurement point in the Z direction was located 5 m away in the direction of the gate in the Z direction. Thirty-two internal measurement points were set up to record the temperature and wind speed at the second-floor stands inside the gymnasium, located at each air intake and in front of the control rooms at the four corners, respectively. The indoor measurement points had stable wind direction and strong wind speed, which is conducive to improving the accuracy of the measurement results. Eight temperature measurement points were set at a height ranging from 3 m to 7.5 m at the cross-section inside the gymnasium to record the temperature distribution inside the gymnasium.
In order to achieve the purpose of testing the actual effect of the seat air supply device, the four-day measurement cycle was divided into two working conditions (the opening conditions of all ventilation outlets are shown in Table 3): the seat air supply device was kept off for the first two days and turned on for the next two days, as shown in Figure 5. The experiment did not change other ventilation facilities in the gymnasium to maintain the daily ventilation conditions but only adjusted the on and off of the air supply of the seats. By comparing the test results, this study aims to verify and investigate the performance of the seat air supply system under natural ventilation conditions.

2.2.3. Measurement Results

Figure 6 shows the variation in outdoor temperature at the gymnasium from 10:00 AM to 5:00 PM in the spring of 2024. The data are the average temperatures from outdoor measure points located at the four directions of the gymnasium, with the highest outdoor temperature occurring between 2:00 PM and 3:00 PM. The thermal insulation effect of the enclosure structure is reflected by the temperature difference between inside and outside of the building. The maximum indoor and outdoor temperature difference during the closing of the seat air supply device is 1.7 °C, and the maximum indoor and outdoor temperature difference increases to 3.4 °C after the opening of the seat air supply device, indicating that the opening of the seat air supply device further reduces the indoor temperature. As shown in Figure 7, different from the temperature rule in the stand, the indoor temperature is almost always rising, but it rises slowly; even under the condition that the air supply of the seat is closed, the highest temperature only reaches 24.9 °C. The opening of the device makes the overall temperature of the indoor section of the stadium drop by about 1 °C, which is because the air supply of the seat increases the indoor air circulation, forming a large circulation between the internal and external environment of the gymnasium.
Table 4 shows the average indoor and outdoor wind speed of the gymnasium after four days of testing. Due to the frequent real-time wind speed changes and the minimum and maximum standard deviation of the indoor and outdoor wind speeds during the test period being 0.04 and 0.13, respectively, the average wind speed of one day was taken as the outdoor wind speed measurement result of the gymnasium.
When the seat air supply device was closed, only the second floor door was open to achieve natural ventilation. At this time, the natural air intake rate was only about 50%. When the seat air supply device was opened, the natural air intake rate increased to about 70%. From these results, it is shown that the seat air supply device can significantly increase the wind speed and natural air intake rate in the gymnasium. Figure 8 shows the indoor and outdoor wind speeds on 23 April and 24 April in each direction. The wind speed on the southeast side is larger, and the wind speed on the northwest side is smaller. After opening the seat for air supply, the indoor wind speed on the southeast side was significantly increased, while that in the southwest side was not. It was further confirmed that the wind speed of the indoor stands in the gymnasium was greatly affected by the outdoor wind speed and was less affected by the hot-pressure ventilation.
We compared the indoor and outdoor temperature differences on 23 April and 24 April (Figure 6) and analyzed the effect of the seat air supply. After the seat air supply was turned on, the maximum temperature difference between the indoor and outdoor areas on the east side increased from 1.7 °C to 3.4 °C. It can be found in combination with Figure 8 that the significant change in temperature difference is related to the change in indoor wind speed. Due to the opening of the seat air supply, the indoor wind speed increased. More cool air that has sufficient heat exchange with the wall surface enters the room and then flows out through the skylight, further taking away the indoor heat. The maximum temperature difference between indoors and outdoors in the southern area only increased by 0.9 °C. This might be related to the relatively small number of air inlets connecting the indoors and outdoors in the southern direction and the relatively strong solar radiation. On the west and north sides, due to the relatively low outdoor wind speed, the opening of the device did not have a particularly significant impact on the indoor wind speed, and the maximum temperature difference between the indoors and outdoors was relatively small. The seat air supply driven by natural ventilation can achieve a better ventilation effect in Wuhan City with high wind speed, but the effect would be poor in areas with low wind speed.
According to the test results, the relative humidity inside the gymnasium is significantly lower than that outside (Table 5), indicating that the gymnasium is relatively dry. When the seat air supply equipment is turned on, the relative humidity inside the stadium is increased to the same level as the outdoor, and the average difference between the indoor and outdoor humidity is reduced from the highest at 9.25% in the unturned state to 1%. This shows that the opening of the seat air supply device improves the indoor and outdoor air circulation in the stadium, thereby increasing the indoor air relative humidity.

3. Results and Discussion

3.1. Comparison of Simulation and Experimental Results

3.1.1. Simulation Model

This study established a full-scale model (Figure 9) based on the medium-sized gymnasiums of universities in Wuhan, and ANSYSFluent was used to simulate and analyze the seat air supply device in the hall under different opening conditions, verifying the advantages of this new natural ventilation system in the transition season. ANSYSFluent is a general-purpose computational fluid dynamics (CFD) software developed by ANSYS, a company based in Canonsburg, PA, USA. It is widely used for modeling and analyzing fluid flow, heat transfer, mass exchange, and chemical reaction processes. The size of the stadium is 71.72 m × 70.91 m, of which the size of the sports areas is 56.83 m × 39.23 m, the height of the middle skylight is 16 m, and the depth of the sinking sports areas is 5.7 m. By adjusting the inlet opening rate of the device, five models were generated using a 25% gradient. A grid independence test was conducted to ensure the accuracy and stability of the CFD simulation results [47]. Using the unstructured grid generation method and considering the computing resources, the partitioning scheme of 13 million grids was selected.

3.1.2. Consistency Verification Between Simulation Results and Experimental Results

This study uses Mean Error (ME), Root Mean Square Error (RMSE), and Consistency Index (d) to qualitatively evaluate the simulations [48,49,50]. Steady-state simulations were conducted using the ambient wind speeds tested on 22 April and 24 April as outdoor conditions. The second-order upwind format was used to improve the calculation accuracy, and the indoor simulation results were compared and verified with the measured values. The average wind speed of the stands from both the simulations and the actual measurements is shown in Table 6, and the error analysis of the average wind speed in each direction of the stands is presented in Table 7. The average errors of the ME and RMSE of the simulation results are less than 0.1, and the Consistency Index is basically 0.9. After a comprehensive analysis, the errors of the simulation results and measured values under the two working conditions are within the acceptable range. The simulation results have certain applicability and can be used as a reference for evaluating the quality of natural ventilation in gymnasiums. At the same time, they also show that the full-size model established in this study can basically reflect the real wind field conditions.
M E = 1 n i = 1 n   | P i O i |
Here, P i is the predicted value, unit: m/s, O i is the observed value, unit: m/s, and ME is the estimate of the reliability of the simulated data. When the ME value is small, the reliability of the simulation is better, whereas when the ME value is large, the reliability of the simulation is not so good.
M S E = 1 n i = 1 n   P i O i 2
Here, P i is the predicted value, unit: m/s, and O i is the observed value, unit: m/s. The smaller the RMSE value, the closer the simulated value is to the measured value and the better the simulation effect is.
d = 1 i = 1 n   P i O i 2 i = 1 n   | P i | | O i | 2
Here, P i = P i P , O i = O i O ,     P is the average of the predicted value, O is average value of observation, Unit: m/s. The value range of the Consistency Index is [0, 1]. The larger the value, the smaller the deviation between the simulated value and the measured value.

3.2. The Influence of the Opening Rate on the Indoor Wind Environment

3.2.1. Case Model

The inlet opening rate of the seat air supply system can be adjusted for controllable regulation, thereby affecting the indoor ventilation effect of the gymnasium. The simulation used a 25% gradient to generate five operational scenarios (Table 8) to analyze the impact of different conditions, with inlet opening percentages of 0%, 25%, 50%, 75%, and 100% (representing the maximum actual opening area). The seat air supply system model was simplified, neglecting the effect of the surface material inside the device. The simulation uses the environmental data measured on 24 April, which has been verified to further improve the accuracy of the simulation results.
In the evaluation of the ventilation effect of the sports venue, we primarily focused on parameters such as wind speed, temperature, pressure distribution, and comfort in the spectator and activity areas. The wind speed and pressure distribution inside the sports venue were obtained through simulations of the full-size model, while the temperature in the spectator and activity areas was obtained through actual measurements. This study uses the PMV (Predicted Mean Vote) index to measure human comfort, with factors affecting comfort including temperature, humidity, wind speed, and human heat production [51]. The PMV (dimensionless) index indicates the average vote of a group on thermal sensation in seven levels from +3 to −3 (Table 9).
The PMV equation is as follows:
P M V = 0.303 × e 0.036 M + 0.028 { M W 3.05 × 10 3 5733 6.99 M W P a 0.42 M W 58.15 1.7 × 10 5 M 5867 P a 0.0014 M 34 t a 3.96 × 10 8 f c l t c l + 273 4 t s + 273 4 f c l h c t c l t a }
Here, M is the metabolic rate, unit: W, W is the power of the human body, unit: W, P a is the partial pressure of water vapor in the ambient air, unit: P a , t a is the air temperature, unit: °C, f c l is the ratio of the clothed body to the naked surface area and is dimensionless, t s is the radiation temperature, unit: °C, t c l is the average temperature of the outer surface of the clothed body, unit: °C, and h c is the convective heat transfer coefficient, unit: W / m 2 · K .
The average temperature t c l of the outer surface of the clothed body can be obtained by the following formula:
t c l = 35.7 0.0275 ( M W ) + I c l f c l [ 4.13 ( 1 + 0.01 d T ) + h c t a ] 1 + I c l f c l [ 4.13 ( 1 + 0.01 d T ) + h c ]
Here, d T = t s 20 , unit: °C.
The ratio of clothed body to naked surface area f c l is derived from the following formula:
f c l = 1.00 + 1.29 I c l ,   w h e n   I c l 0.078 1.05 + 0.645 I c l ,   w h e n   I c l > 0.078
where I c l is the thermal resistance of clothing, unit: Clo.

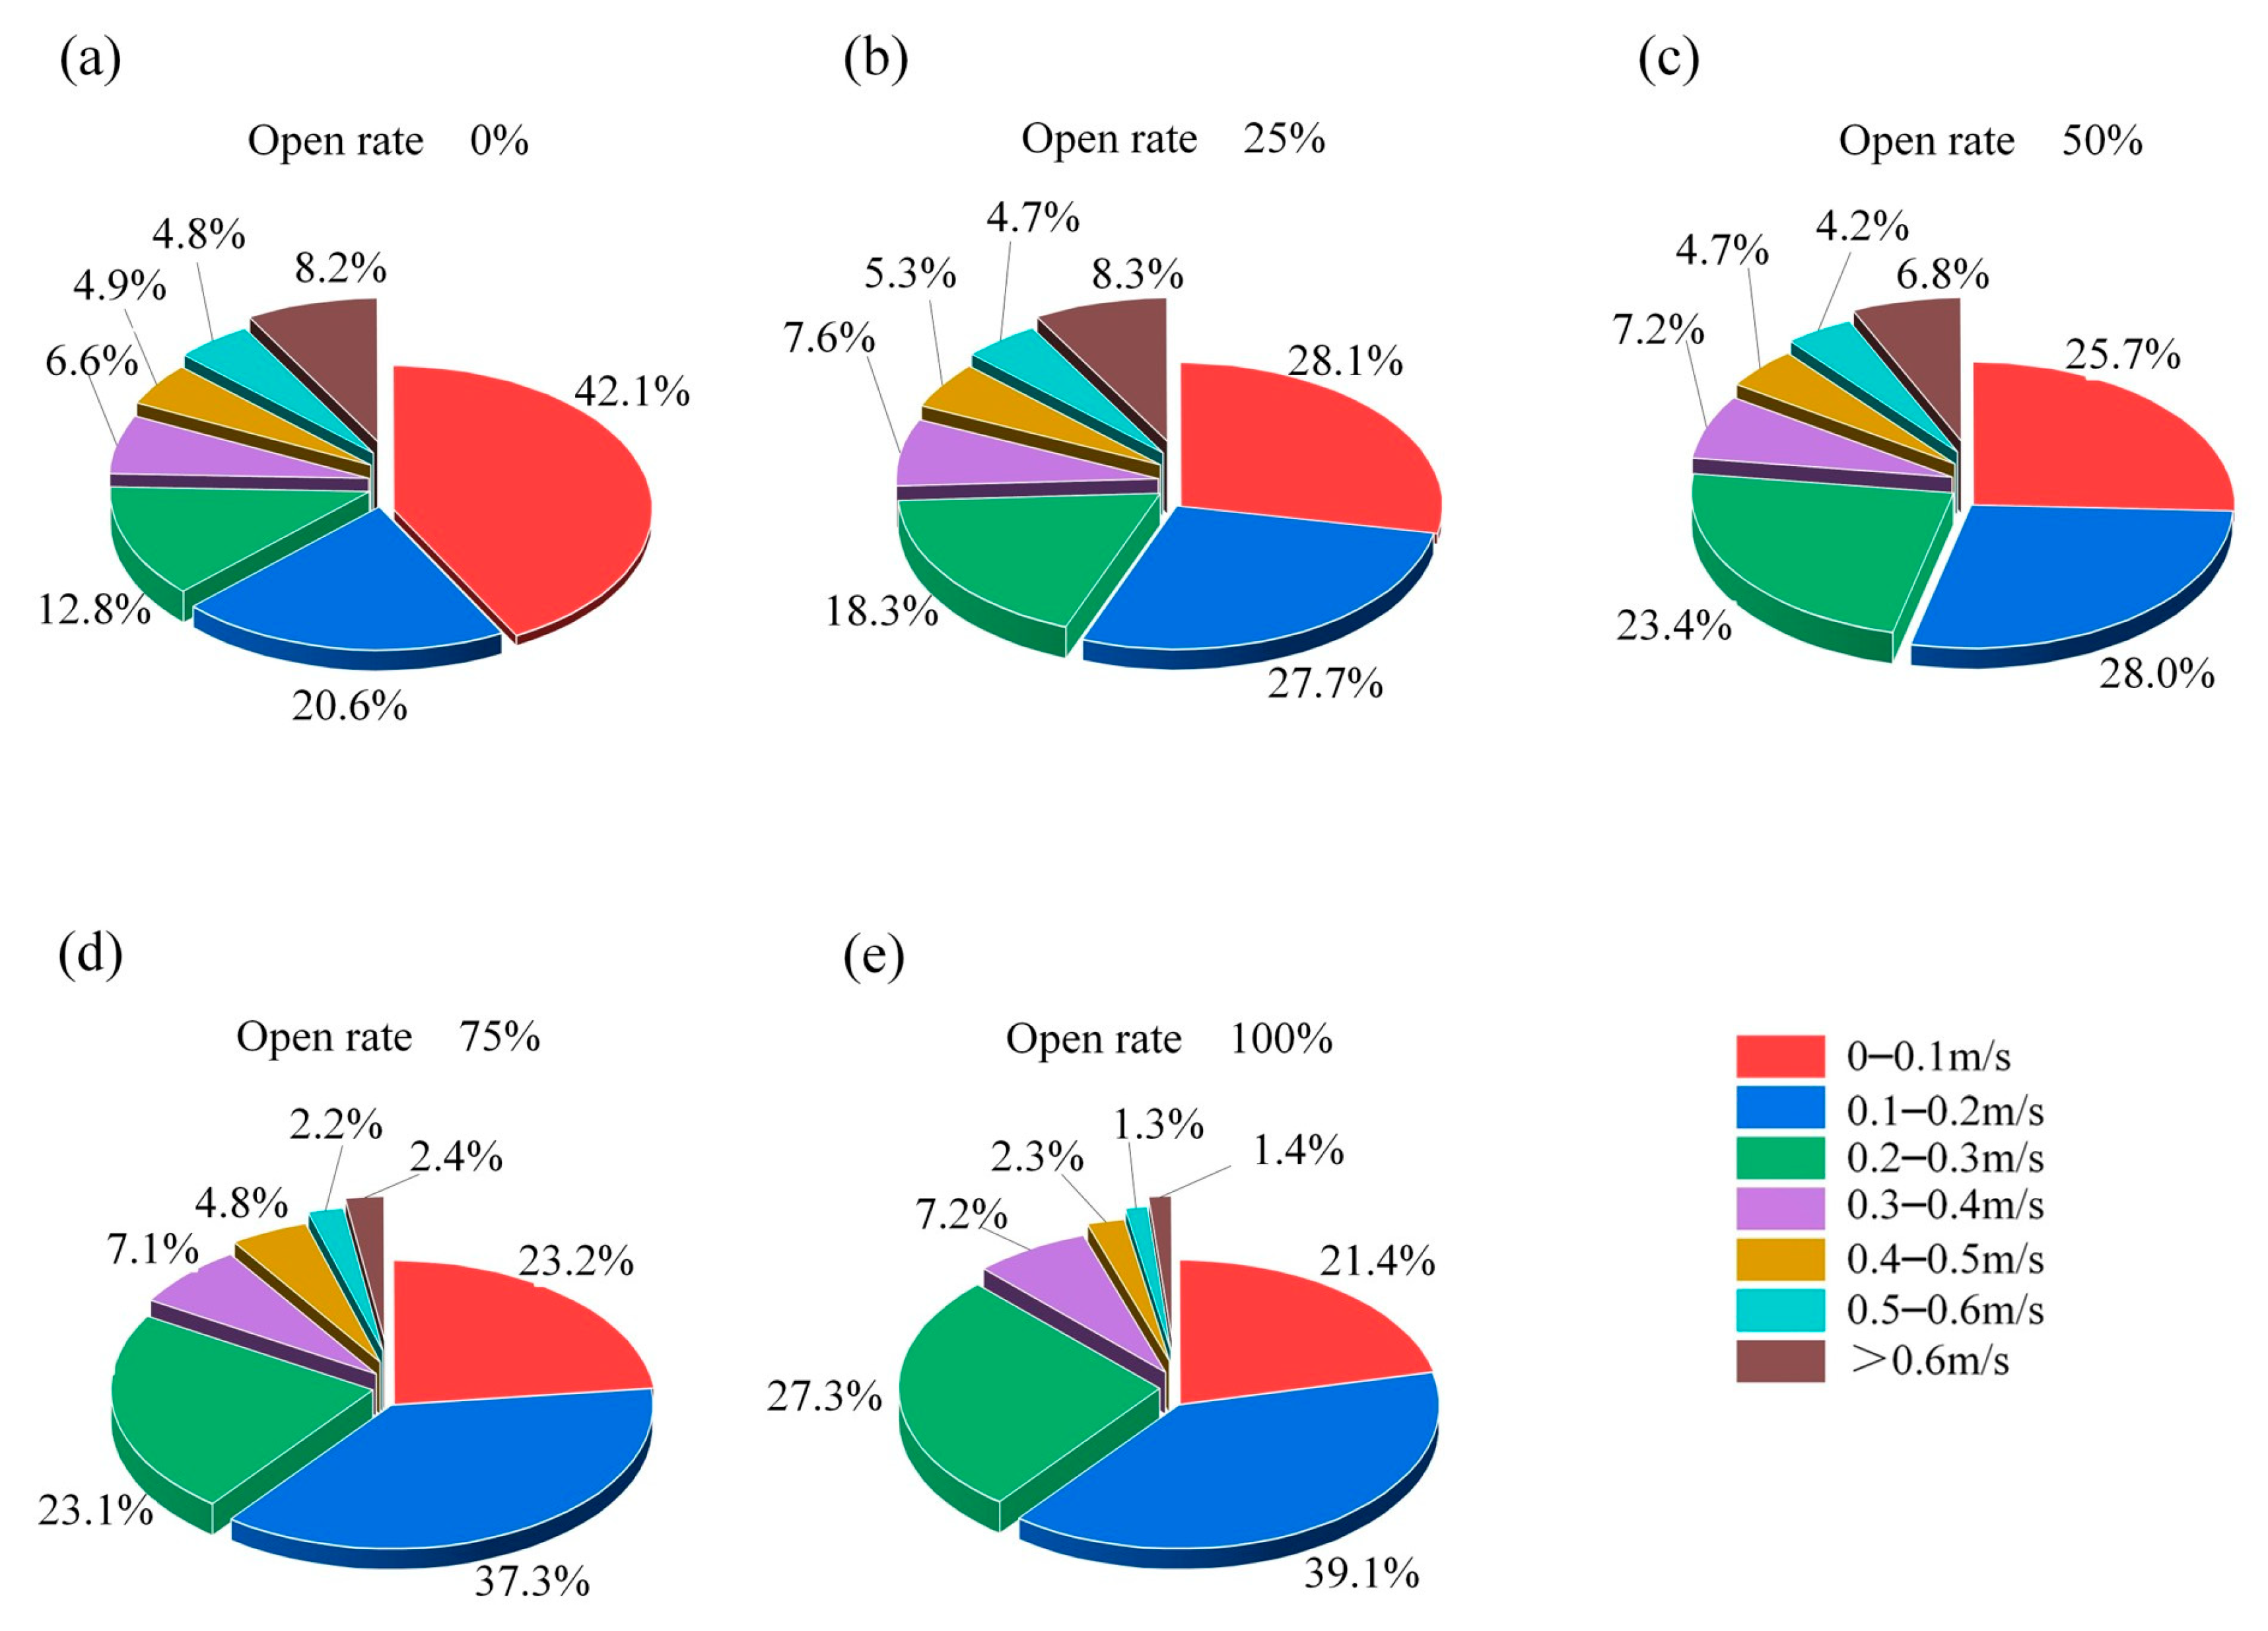
3.2.2. The Impact of the Equipment Activation Rate on Indoor Grandstand Areas

In Figure 10, 20 sections were evenly selected from the seating area in each direction, and the average wind speed of these sections was used to represent the wind speed field at the seating area. This allowed for an analysis of the overall ventilation condition in the seating area. In all cases where the seat air supply system was activated, the wind speed in the seating area gradually decreased as the distance increased. In the east–west direction, where the seating depth is larger, the seat air supply could not fully cover the entire area. In contrast, in the north–south direction, where the seating depth is smaller, the seat air supply was sufficient to meet the ventilation needs of the entire seating area. When the seat air supply device was turned off, the wind speed in the seat area was almost zero. When the seat air supply was turned on, the maximum wind speed in each direction was divided into 0.24 m/s, 0.60 m/s, 0.30 m/s, and 0.22 m/s, and the wind speed in the seat area was significantly improved.
The metabolic rate of a sedentary human body was 100 W, and the PMV index was calculated by using the highest and lowest temperature measured by the experiment and combined with the simulated indoor wind speed (Figure 11). When the temperature of the indoor stand (ST) is low, with the increase in the opening of the air supply device of the seat, the PMV index of the section gradually decreases, and the human comfort gradually increases. The device plays an obvious role in improving the comfort of the seat area. When the temperature of the indoor stand reaches the maximum temperature, the opening of the seat air supply device has little influence on the PMV index of the seat area. The variation in wind speed in the seat area directly affects the PMV index of this area. When the temperature is constant, the PMV index decreases with the increase in wind speed. This effect is more obvious at lower temperatures. The increase in temperature weakens the influence of wind speed on the PMV index. This is consistent with the research results of Ji et al. [52]. They studied the PMV index under three different exercise intensities. The results showed that when the temperature and humidity are constant, the PMV index decreases slowly with the increase in indoor wind speed. When the wind speed and humidity are constant, the PMV index increases rapidly with the rise in temperature. The cloud maps of the wind speed field at different opening rates are shown in Figure 12. Figure 13 shows the wind speed distribution in the bleacher aisle area with different opening degrees. When the seat is not open for air supply, the wind speed distribution in the aisle area of the stand is very uneven, the proportion of the low wind speed area (less than 0.1 m/s) is 42.1%, and the proportion of the wind speed area greater than 0.5 m/s is 13%. With the opening of the device, the proportion of the low wind speed area decreased to 21.4%, the proportion of the area greater than 0.5 m/s decreased to 2.7%, and the uniformity of the wind speed field was significantly improved.

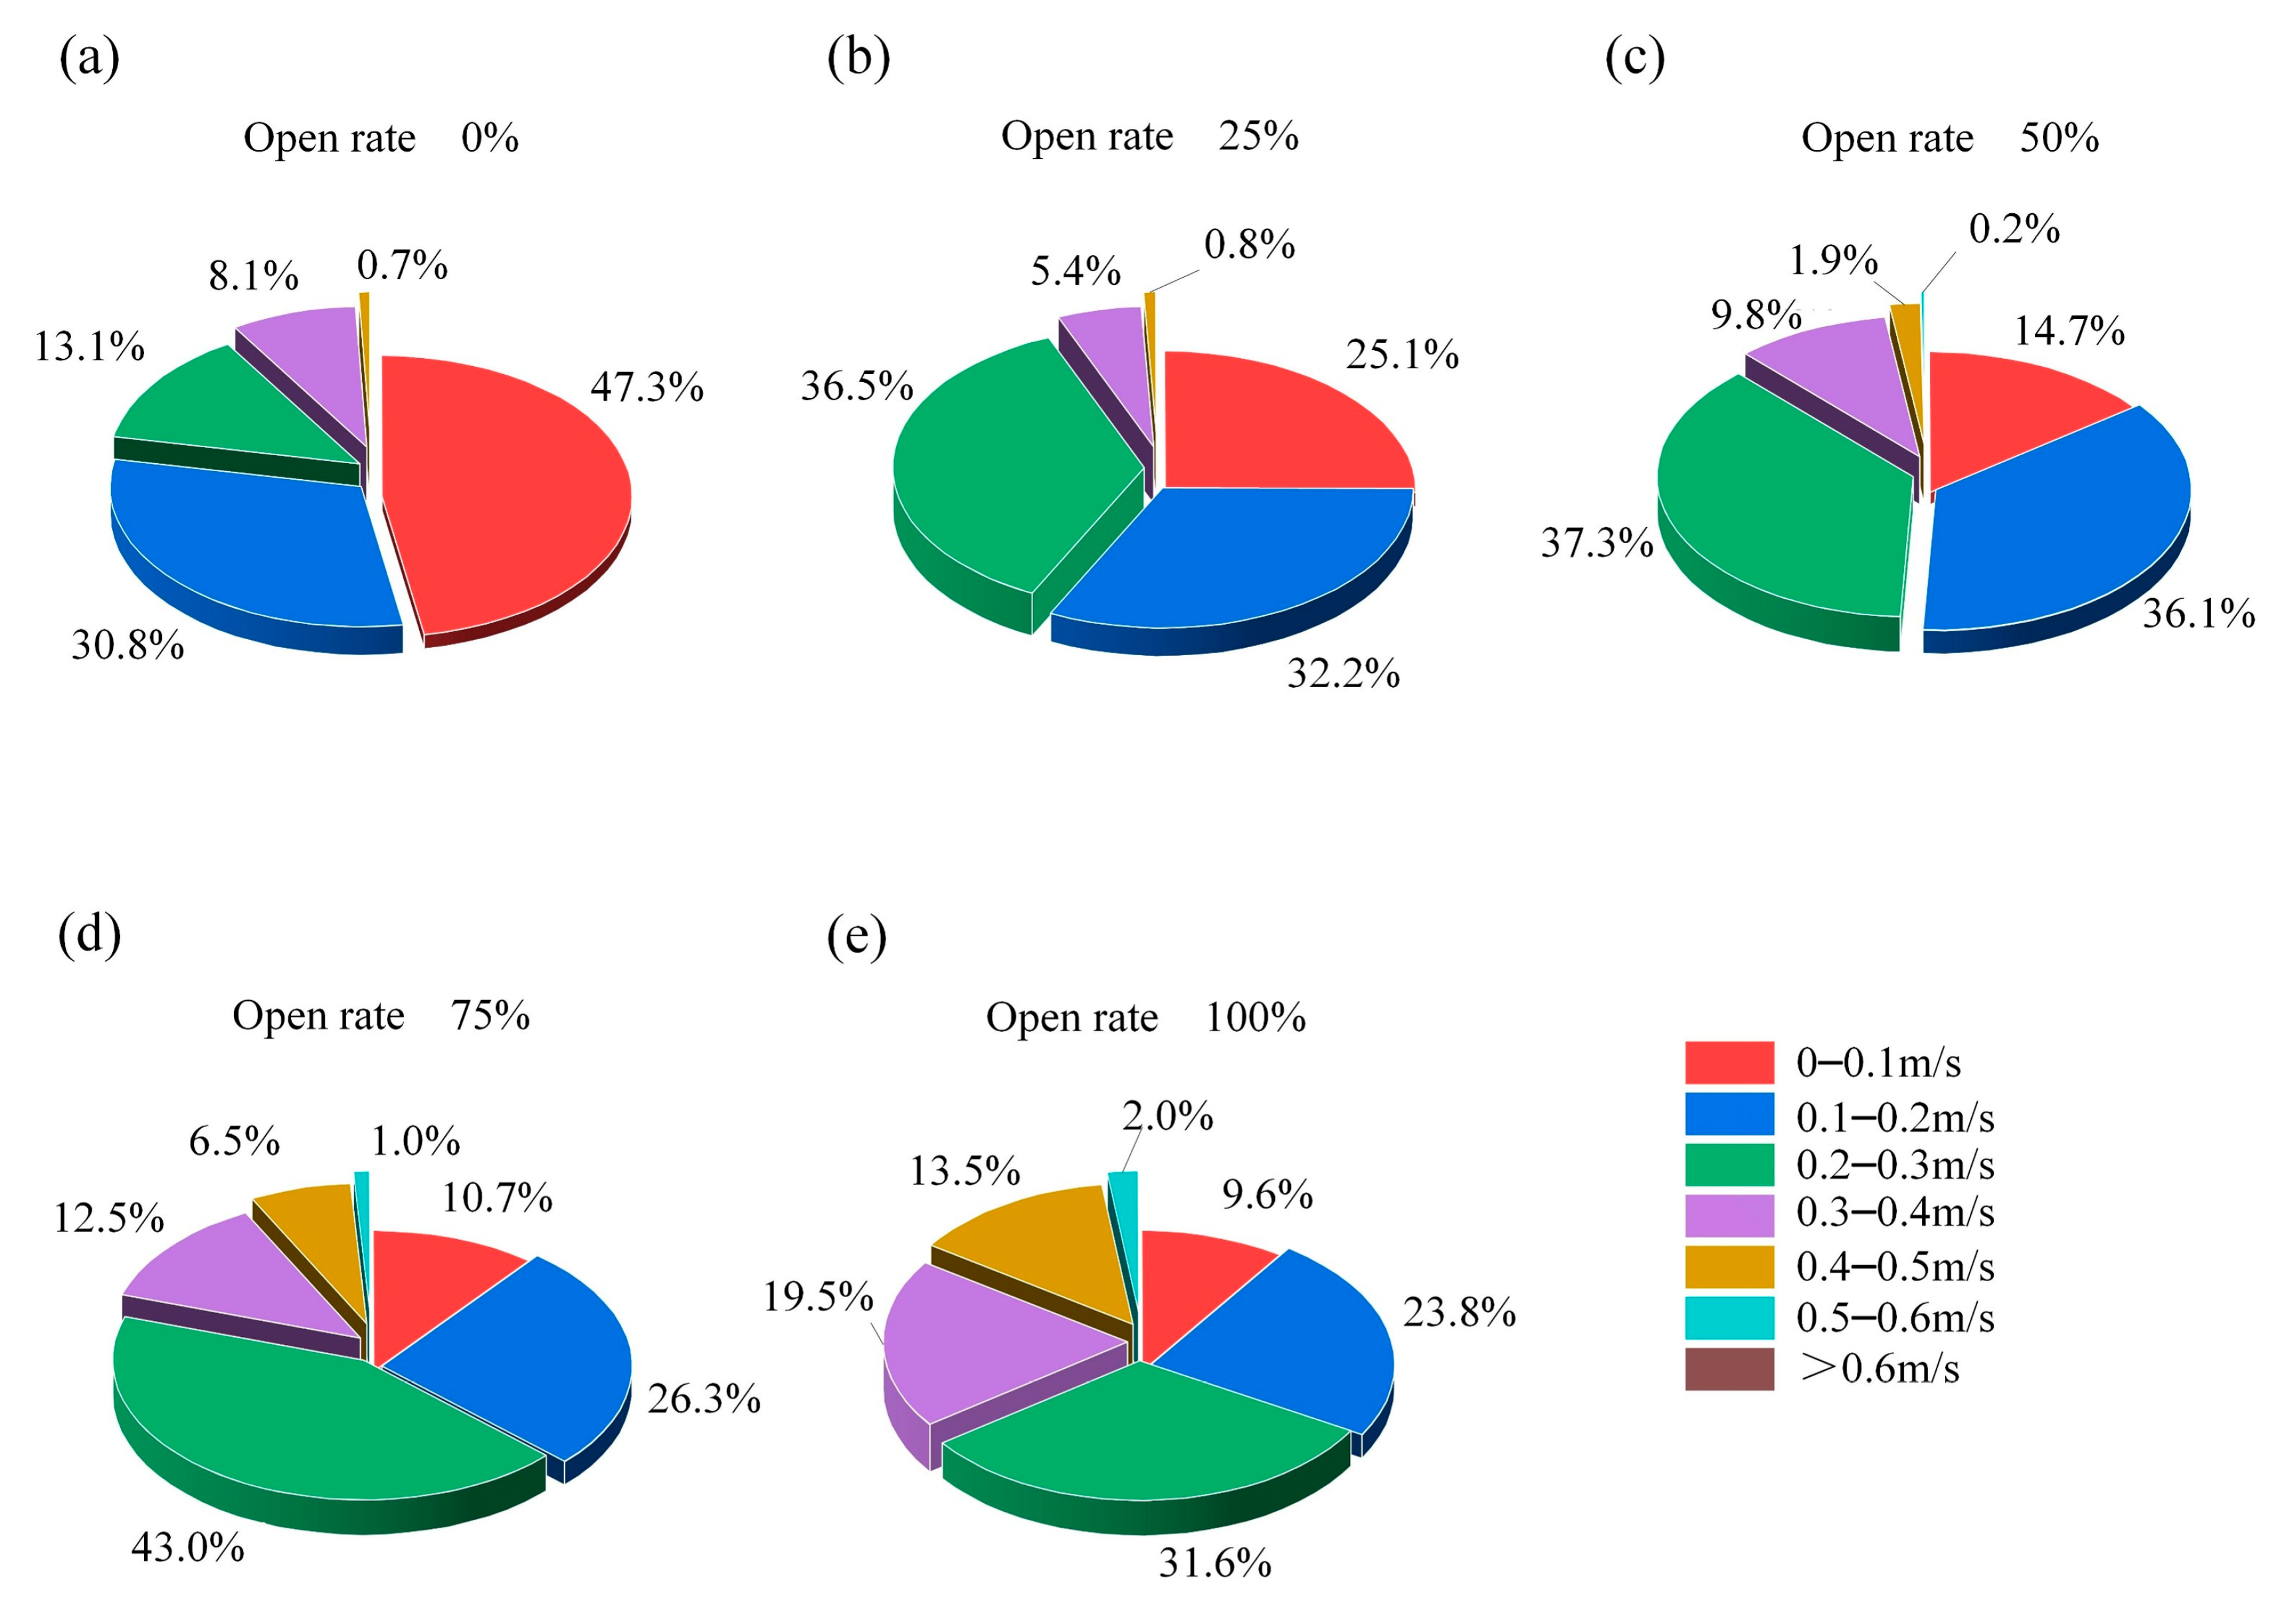
3.2.3. The Impact of Device Activation Rate on Indoor Sports Areas

Figure 14 indicates that the wind speed on the south side of the sports areas is always relatively high, which may be related to the dominant wind direction being south wind. The opening of the air supply device of the seat can significantly re-duce the proportion of the low-pressure area in the sports areas (Figure 15), and the high proportion of the positive-pressure area helps to maintain the fresh and clean in-door air, strengthen the ventilation of the entire space, and avoid the accumulation of polluted gases in the sports areas of personnel. At the same time, with the opening of the seat air supply device, the uniformity of the wind speed field in the sports areas increases significantly (Figure 16). The proportion of areas with low wind speed and no wind speed decreased from 47.3% to 9.6%, and the proportion of areas with wind speed between 0.3 and 0.5 m/s increased from 8.8% to 33.0%. In general, the indoor wind speed is best controlled between 0.3 and 0.5 m/s. The wind speed in this range can create a good indoor environment and avoid discomfort caused by excessive wind speed.

3.3. Discussion

The ventilation effect of the seat air supply is affected by the outdoor wind speed, which can be seen in Figure 8. On the sides where the outdoor wind speed is higher, the opening of the device significantly increases the indoor wind speed. On the sides where the outdoor wind speed is lower, the opening of the device has a relatively limited effect on the change in the indoor wind speed. A seat air supply driven by natural ventilation can be used in areas with strong outdoor winds (including Wuhan during the transitional season) and can significantly improve the indoor wind environment.
The use of the seat air supply in the gymnasium under study increased the temperature difference between the indoors and outdoors, increased the indoor air intake rate, and effectively improved the indoor wind environment. It must be admitted that the application of the seat air supply driven by natural wind in other types of buildings (including theaters, concert halls, etc.) still needs to be studied. Based on the findings of this study, when applying a seat air supply in high spaces such as sports venues, local climatic conditions, especially wind speed conditions, must be taken into account, and the architectural form needs to be reasonably designed to ensure smooth air intake.
The data in Figure 11 indicate that when the indoor temperature is low, the activation of the seat air supply can significantly reduce the PMV index and enhance personnel comfort. Moreover, this effect decreases significantly as the indoor temperature rises. This finding is consistent with the research results of Hodson et al. According to the simulation results, with the increase in the device opening rate, the uniformity of the wind field in the sports areas is significantly improved, and the low wind speed area is significantly decreased. Since the dominant wind direction of the simulated working condition environment is southeast wind, the wind speed on the south side of the movement area is greater than that on the north side (Figure 14). Figure 15 shows that with the activation of the device, a low-pressure area appears in the southern region, which is an unfavorable factor. Polluted gases and dust may accumulate here, posing a challenge to the health of personnel in this area. The positive pressure in the northern region is conducive to the discharge of stale air.

4. Conclusions

This study focuses on the application effect of a seat air supply driven by natural wind in gymnasiums under the working conditions of the transition season and conducts a comprehensive evaluation by using the method of experiments and simulations. Through on-site indoor and outdoor environmental tests and the simulation of ventilation effects under five opening rates, the following conclusions were obtained:
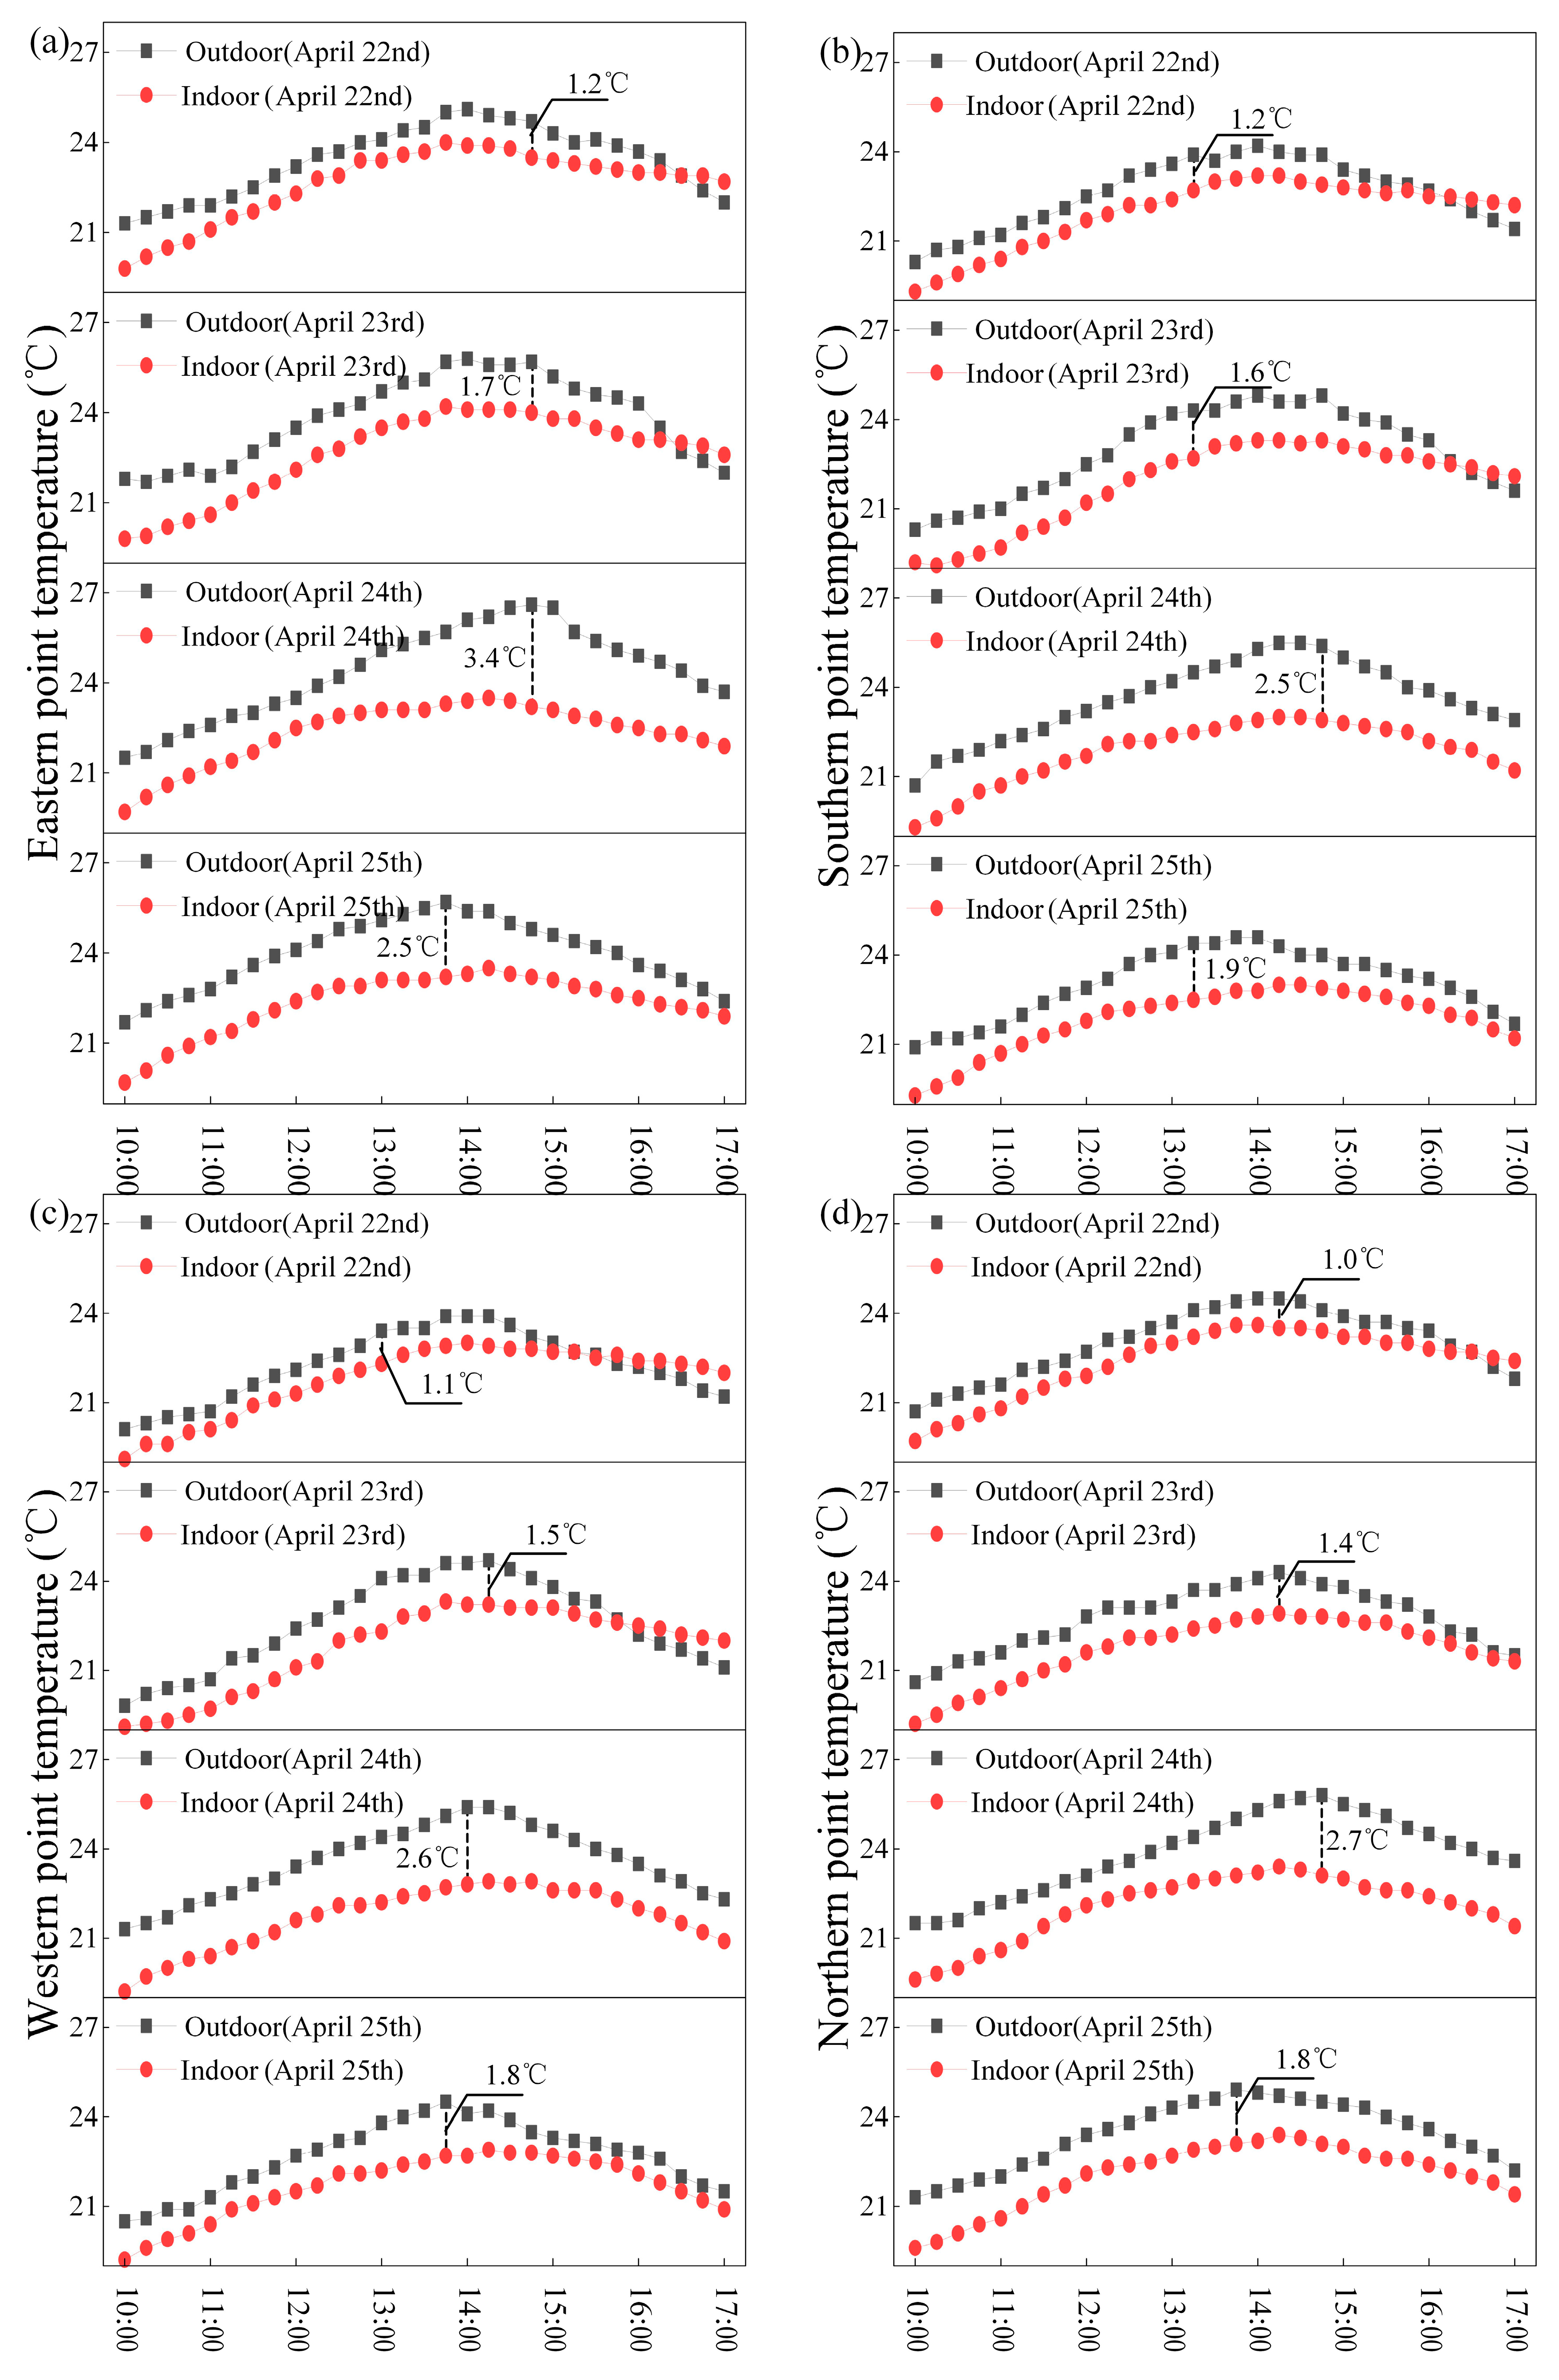
  • During the period when the seat air supply system is turned off, the maximum indoor–outdoor temperature difference is 1.7 °C, which proves that the sports venues’ exterior walls have good thermal insulation properties, helping to maintain a comfortable indoor temperature. After the seat air supply system is turned on, the maximum indoor–outdoor temperature difference increases to 3.4 °C, indicating that the activation of the seat air supply system further reduces the indoor temperature.
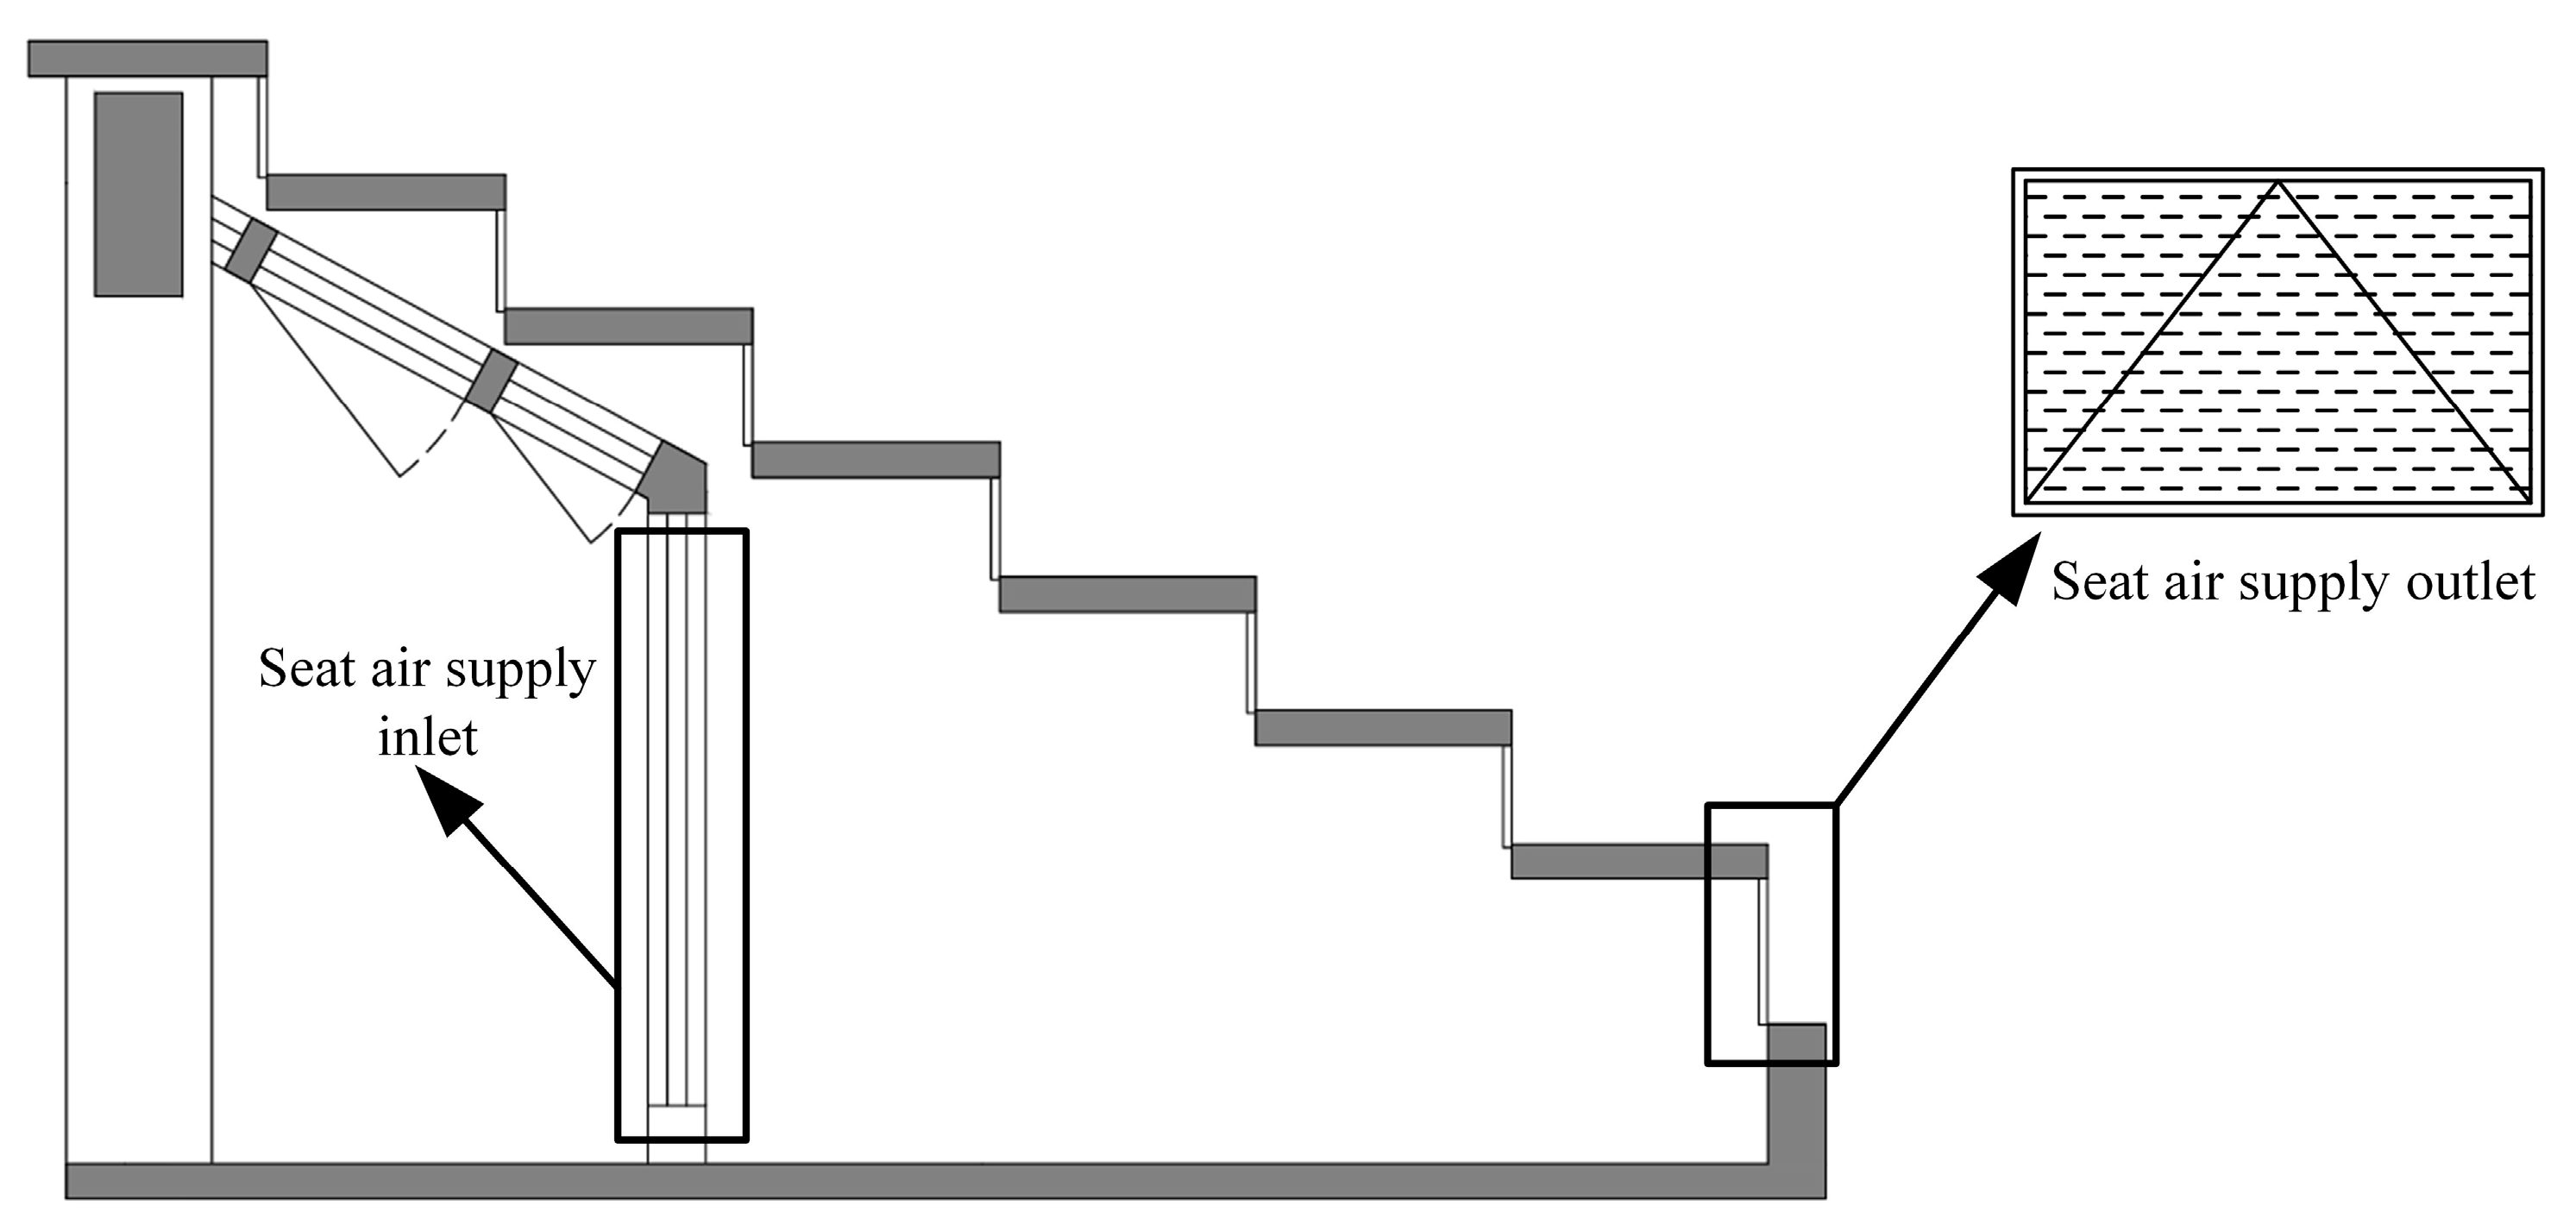
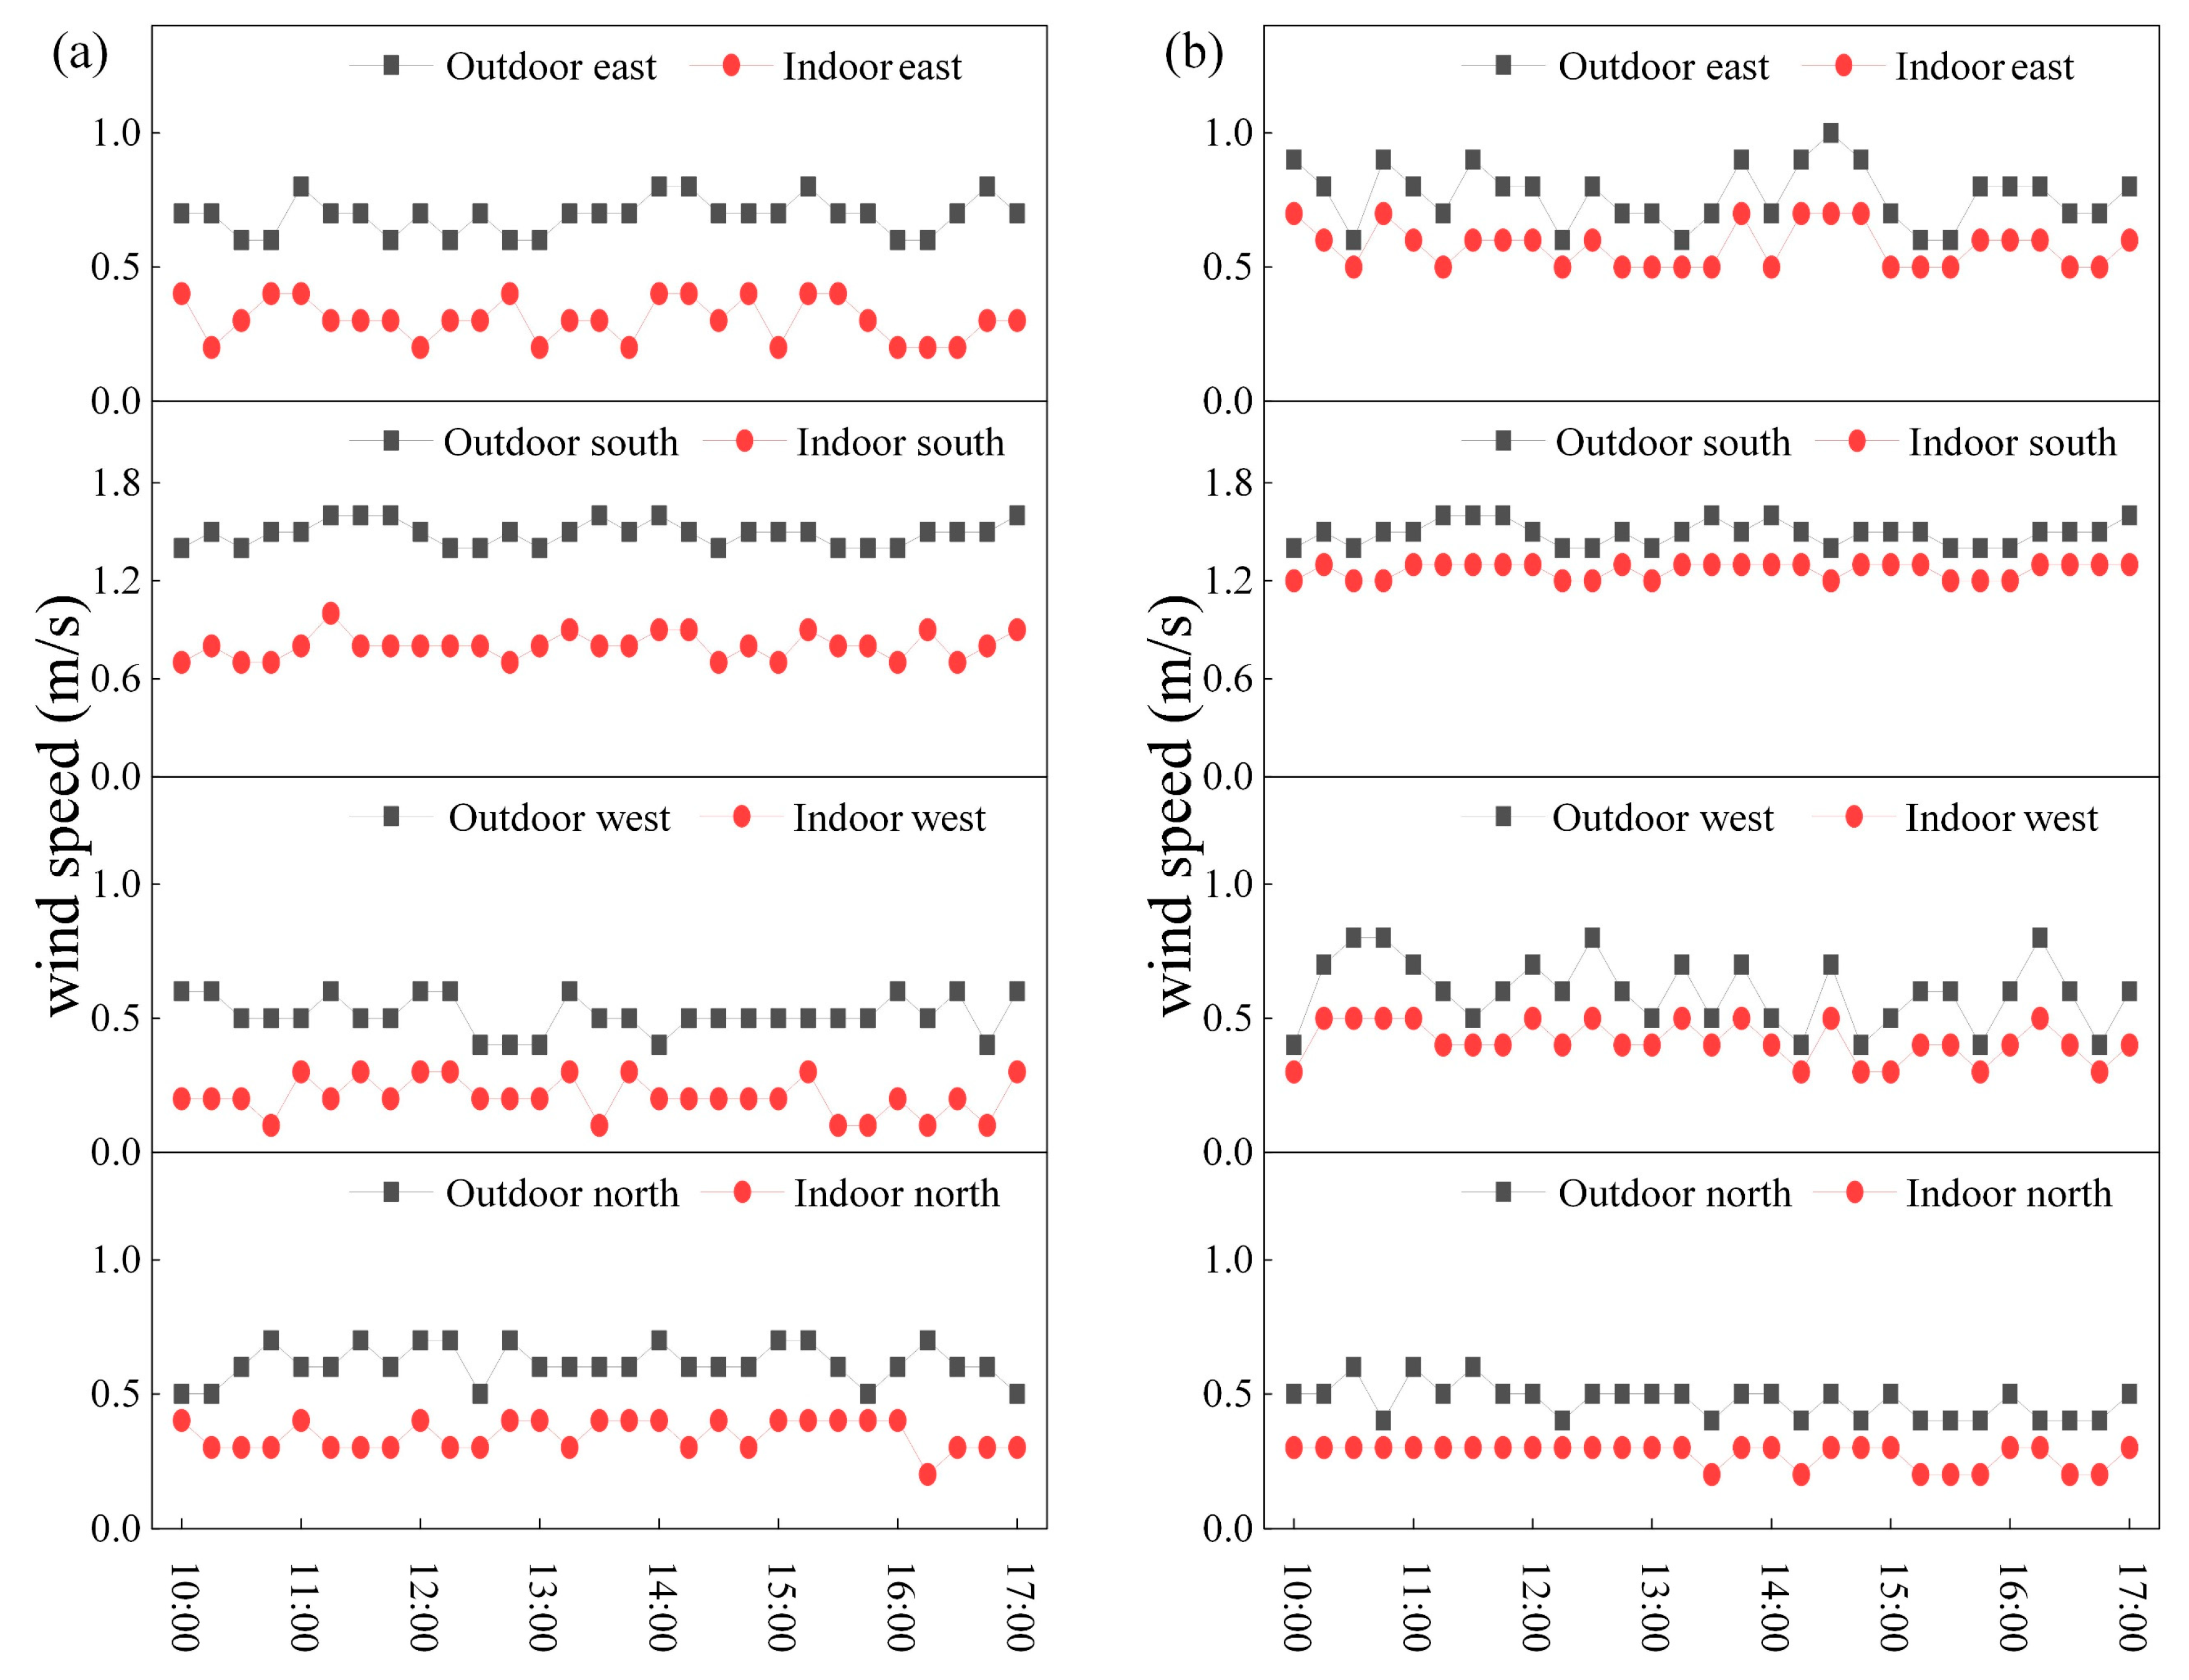
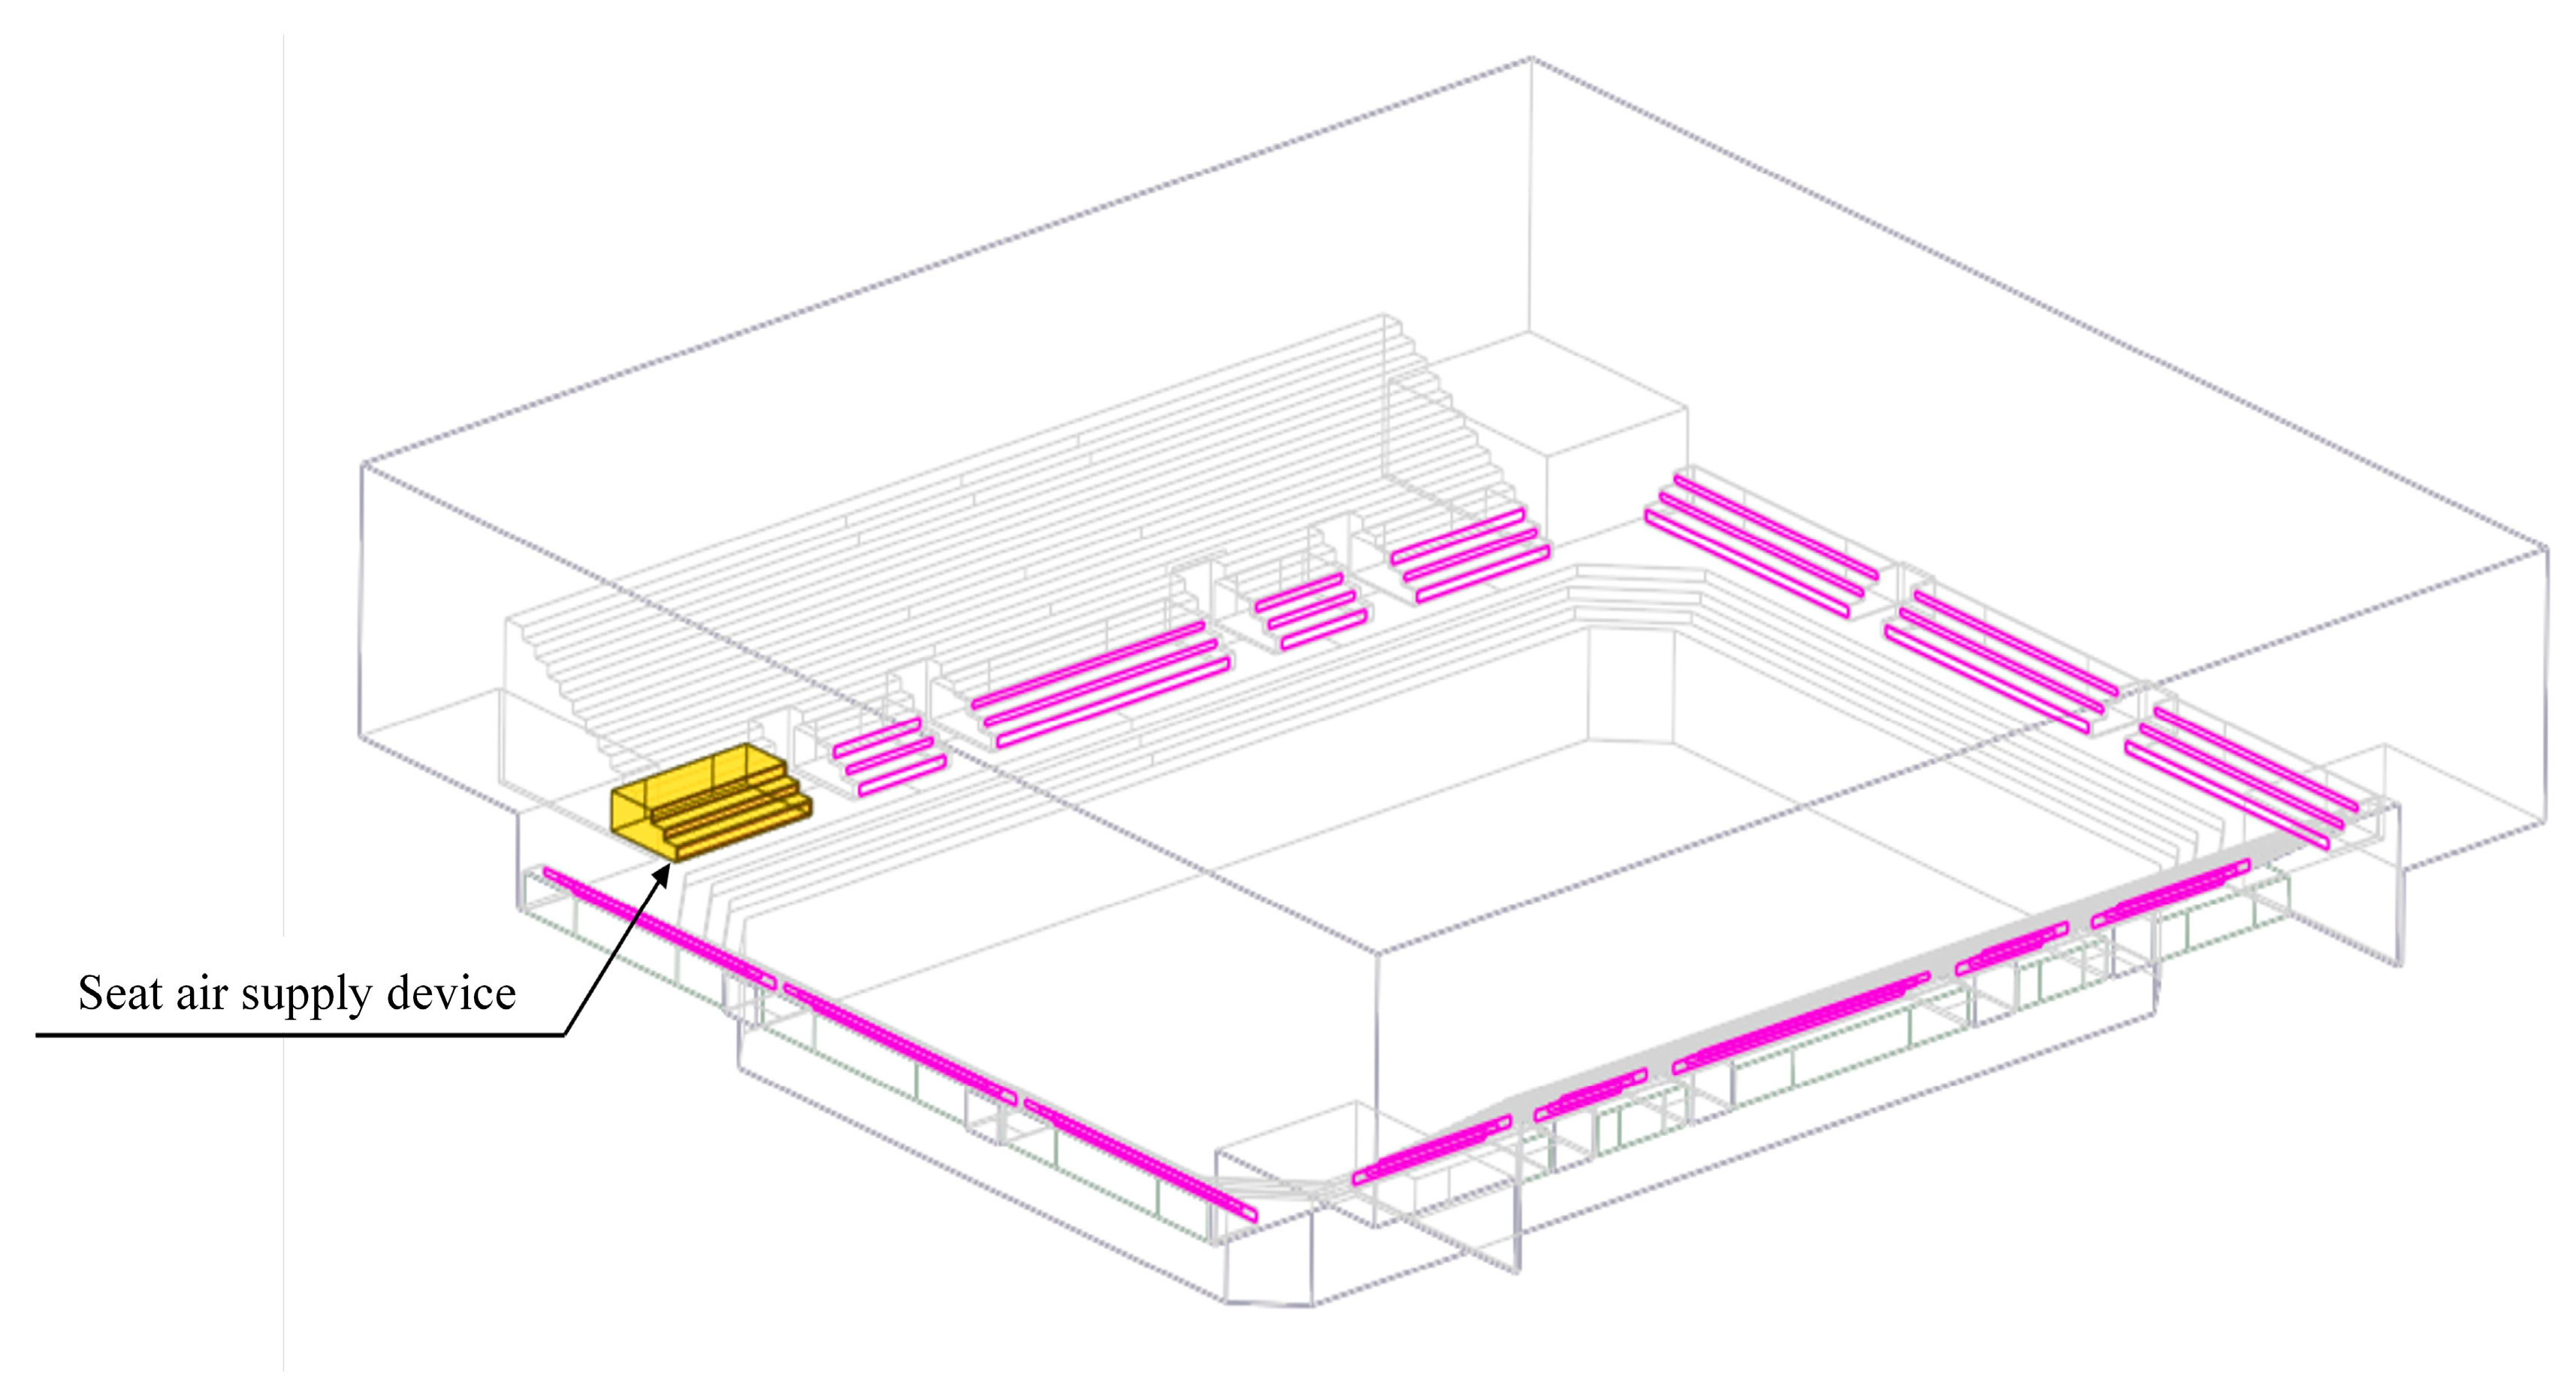
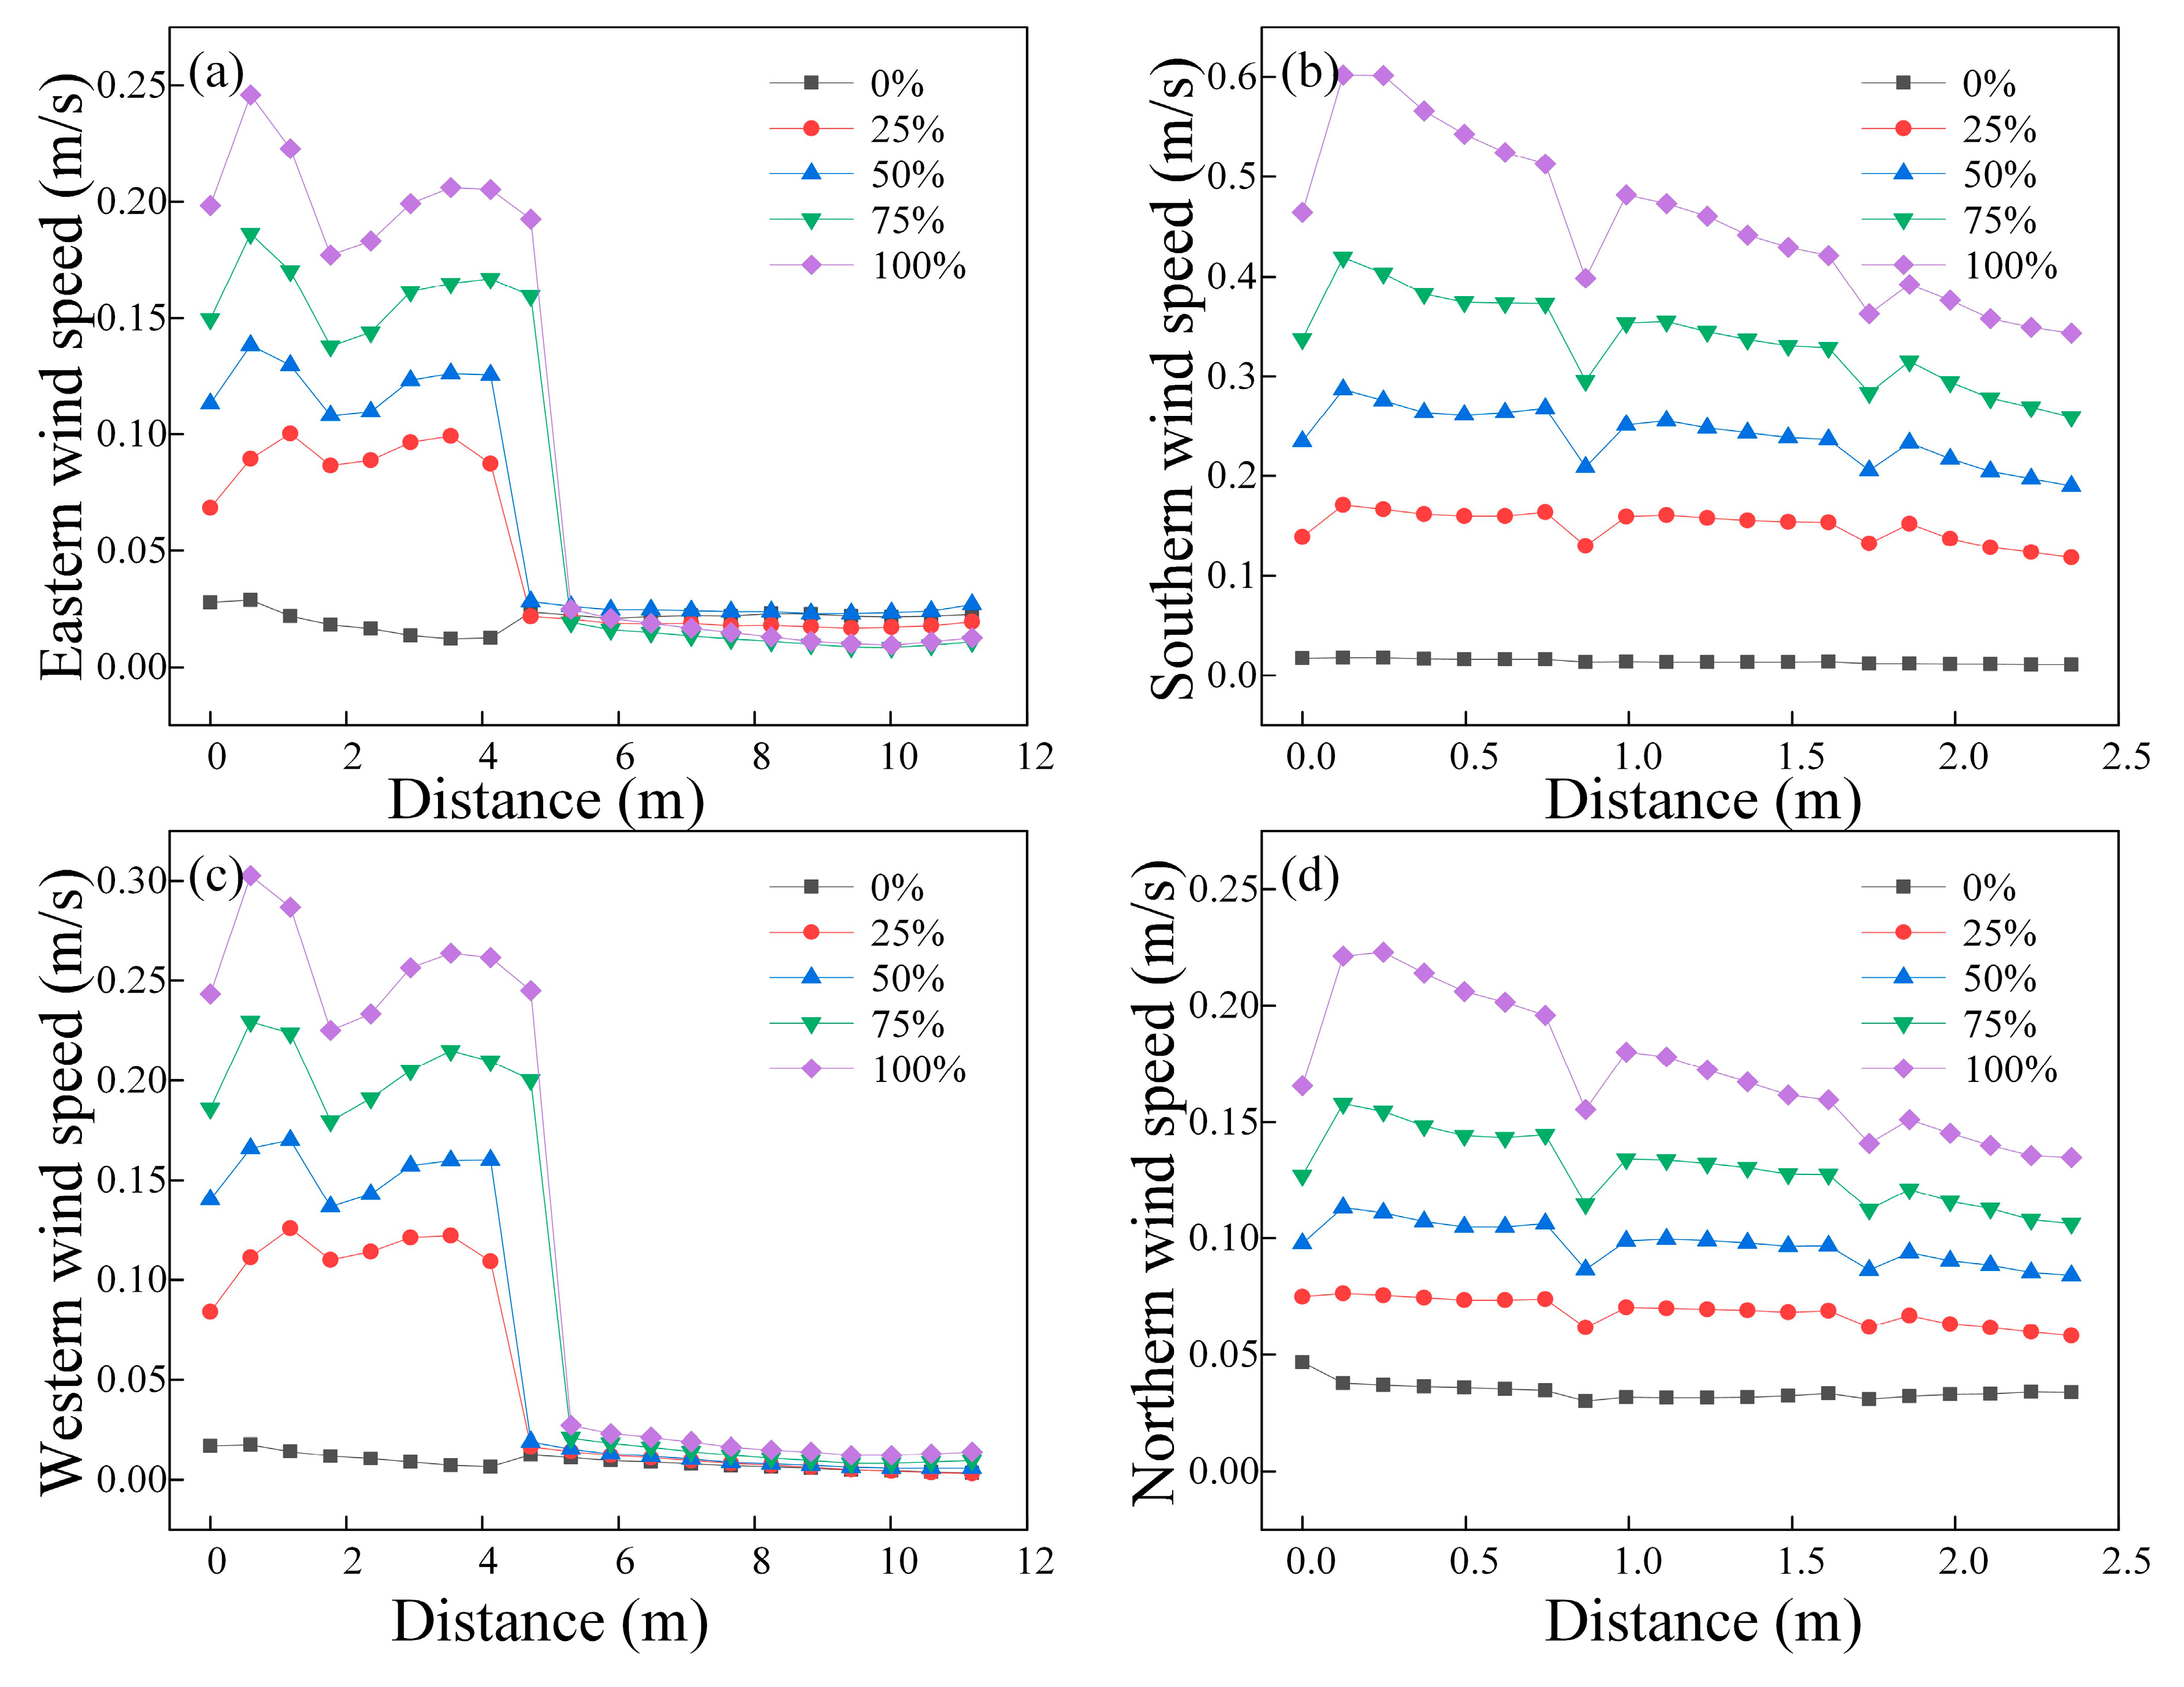
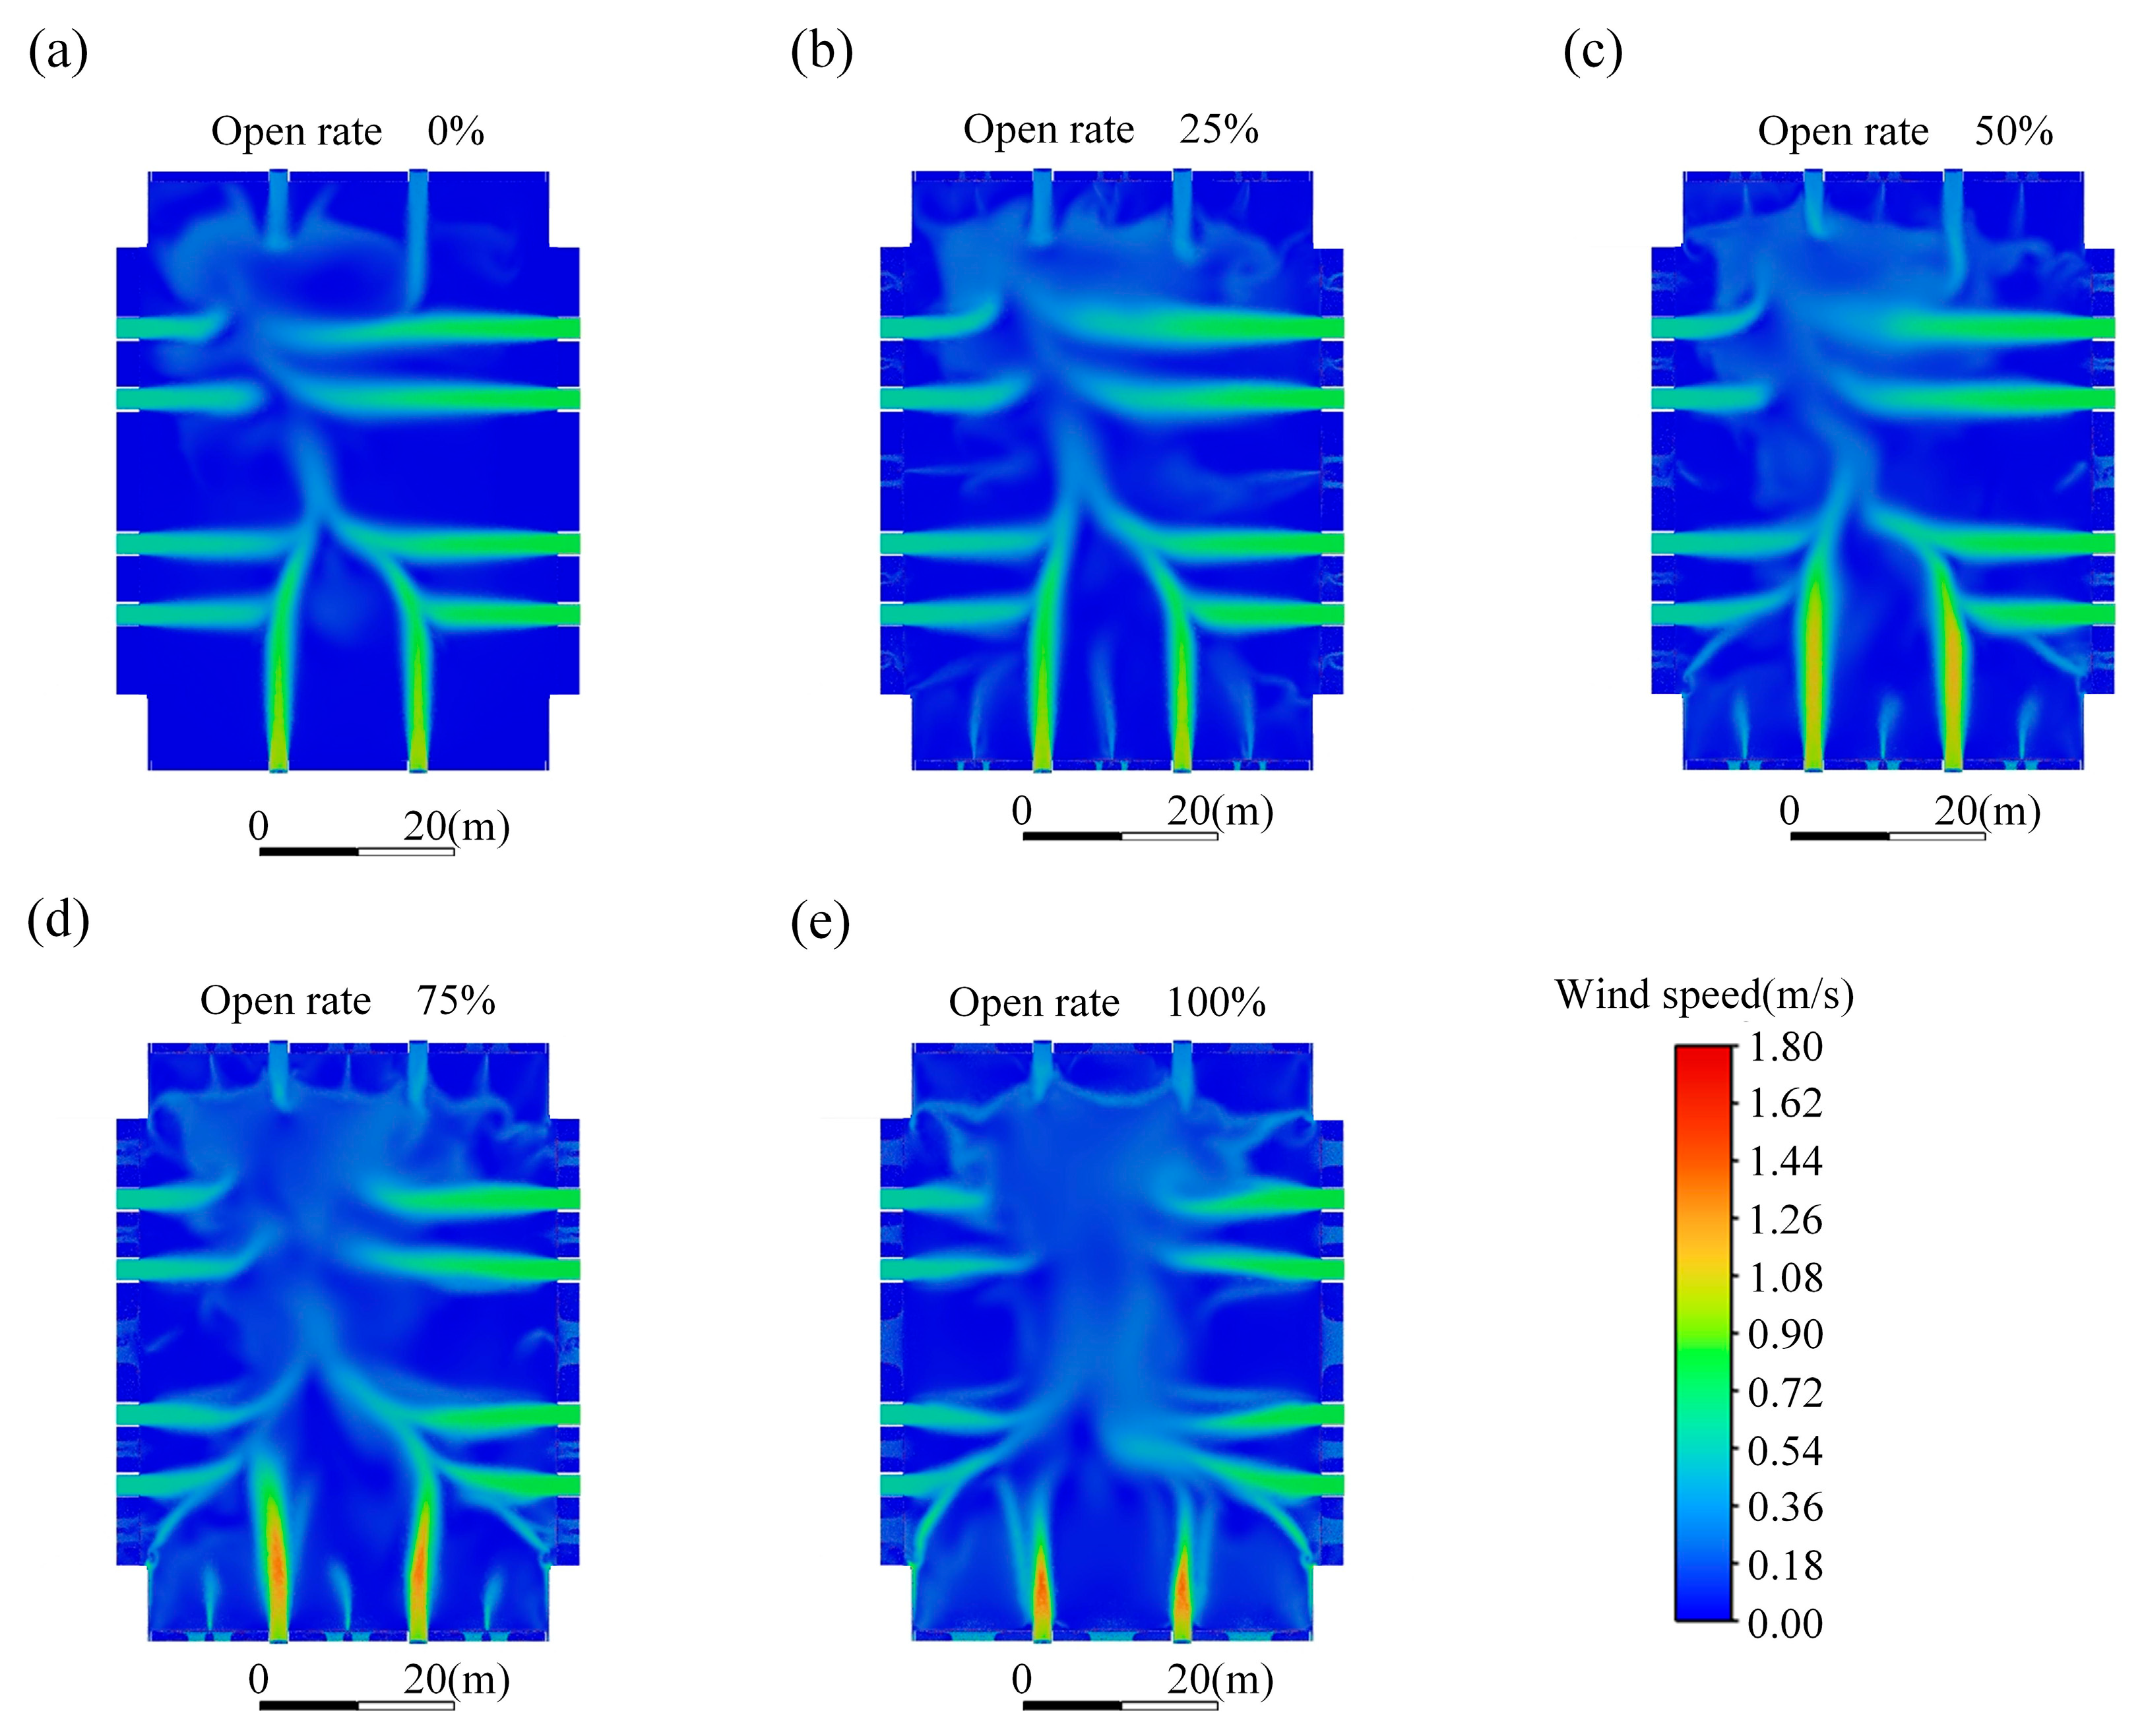
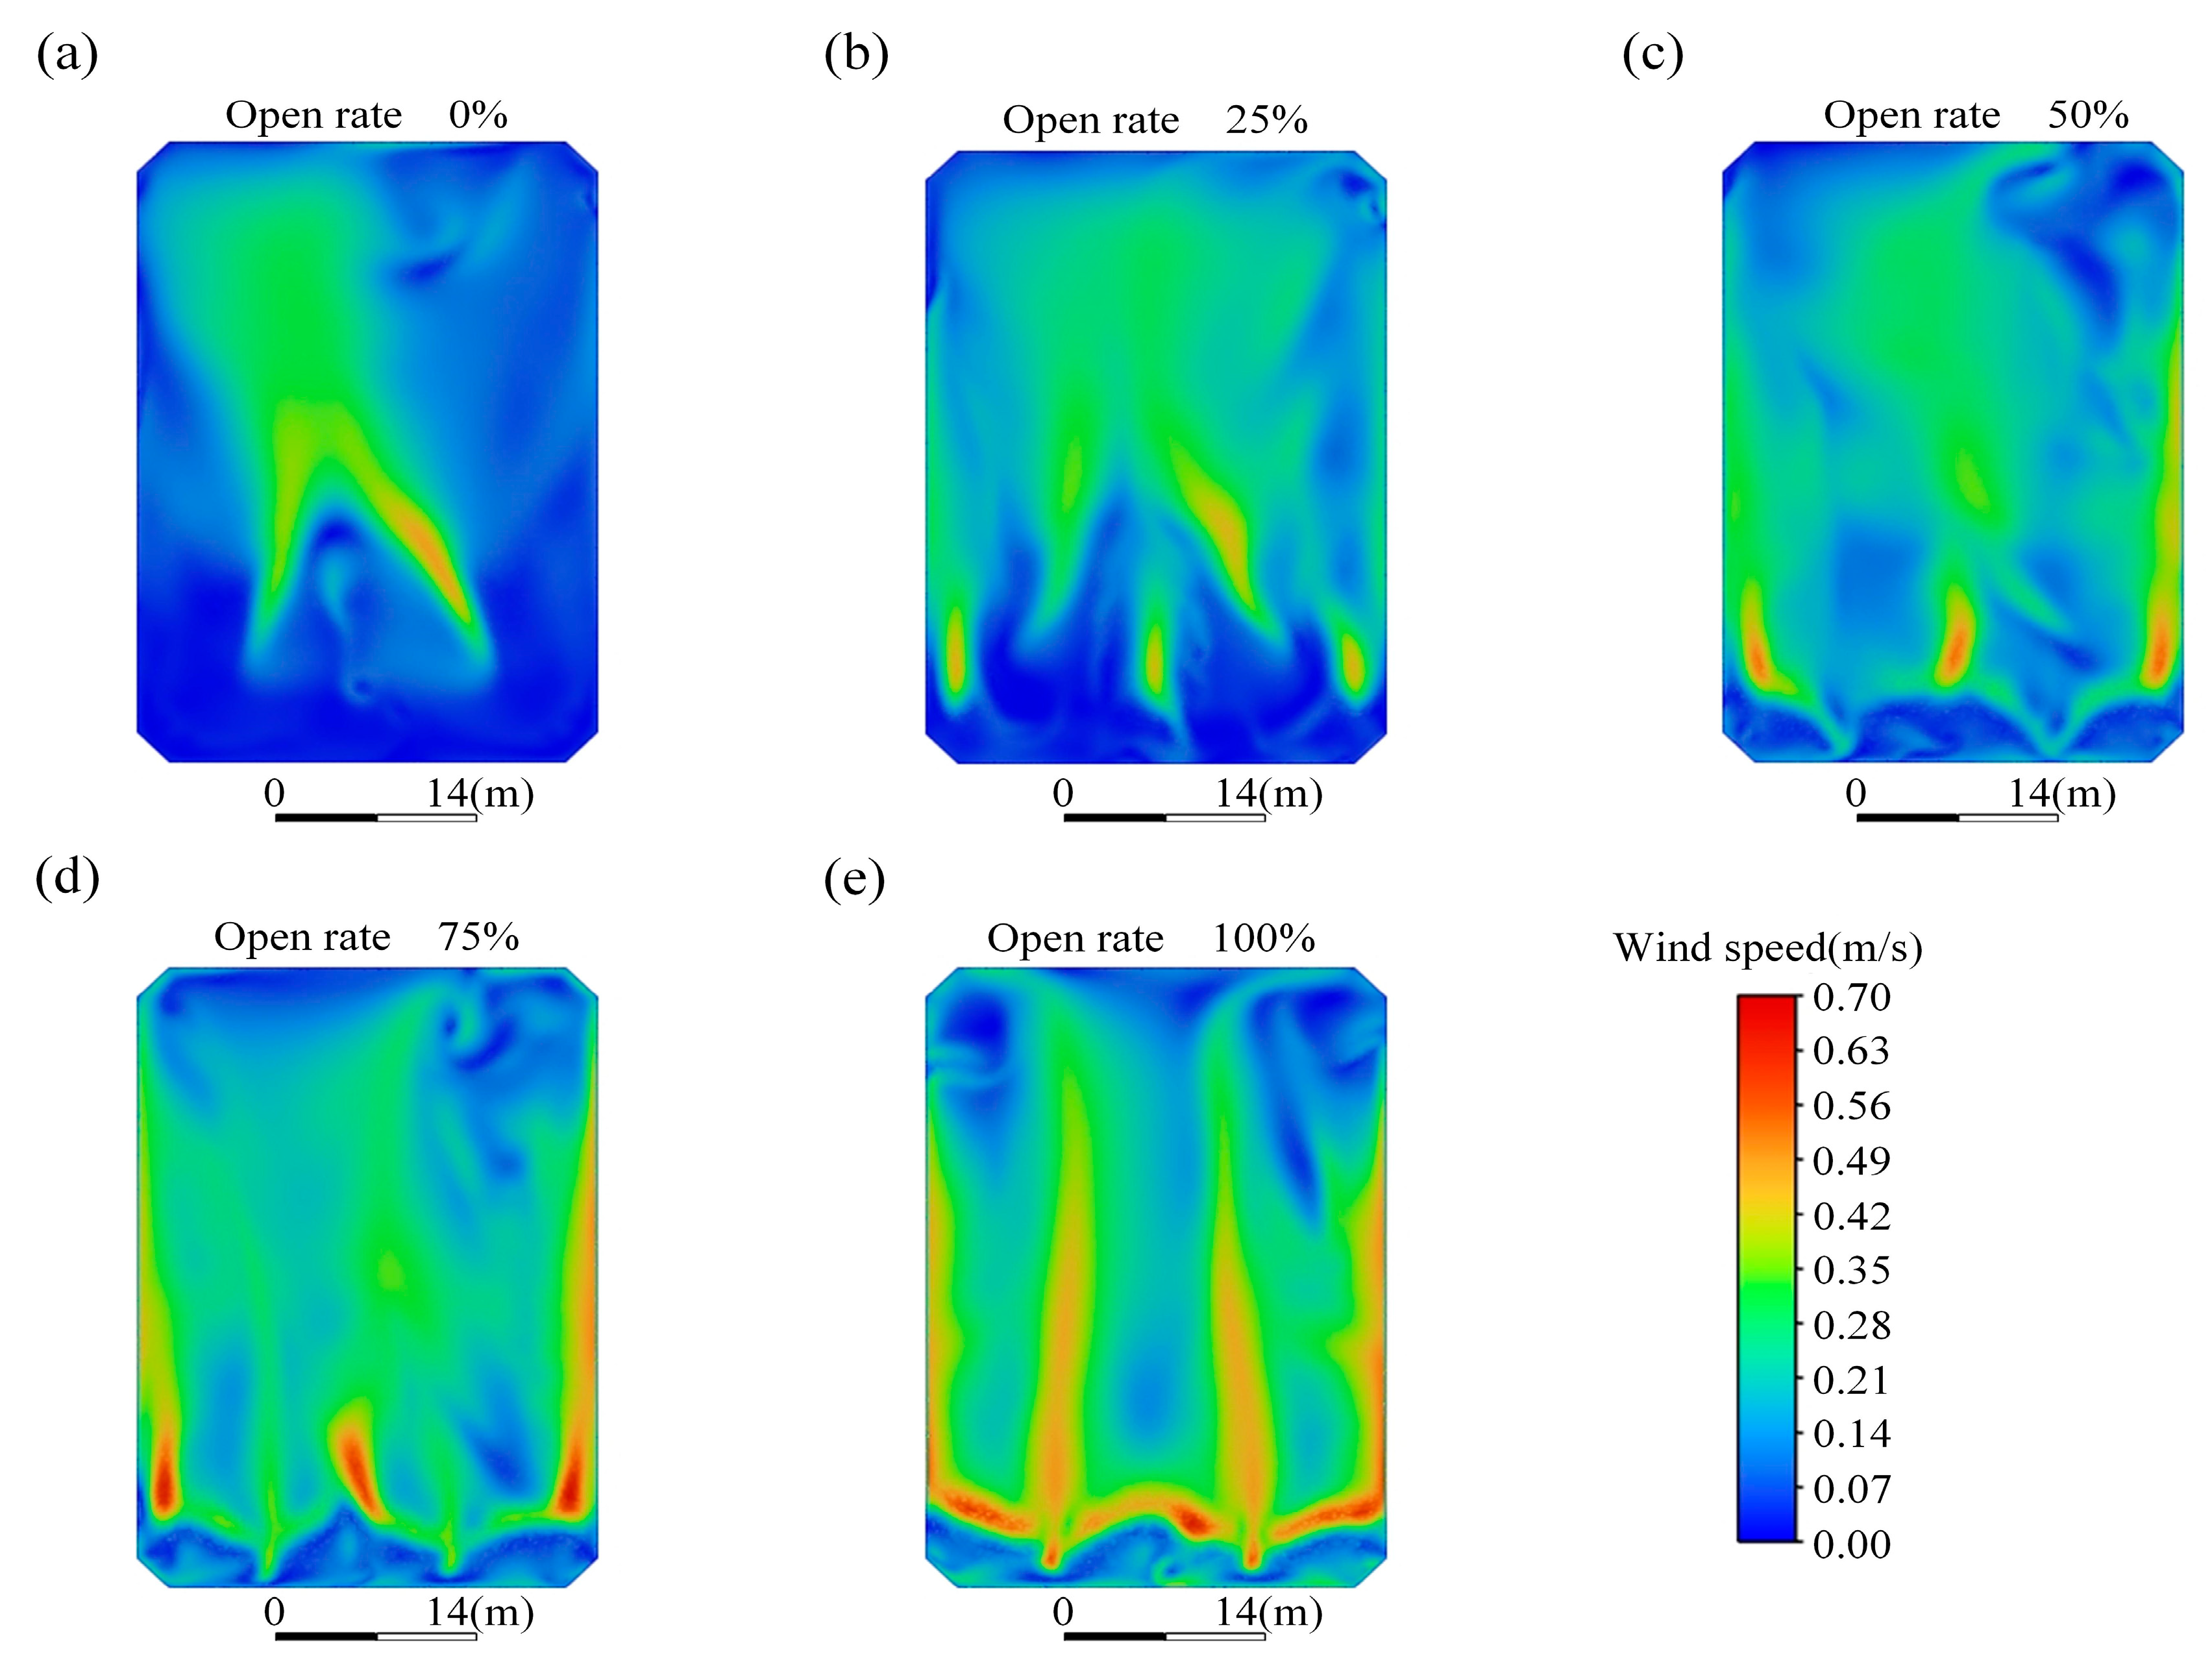
  • When the seat air supply is turned off, the wind speed in the seat area is almost zero. The opening of the seat air supply significantly increases the wind speed in the seat area, improving the natural ventilation effect. Meanwhile, the uniformity of the wind speed field in the sports areas also increases significantly with the opening of the seat air supply device, which is conducive to the creation of a good indoor environment.
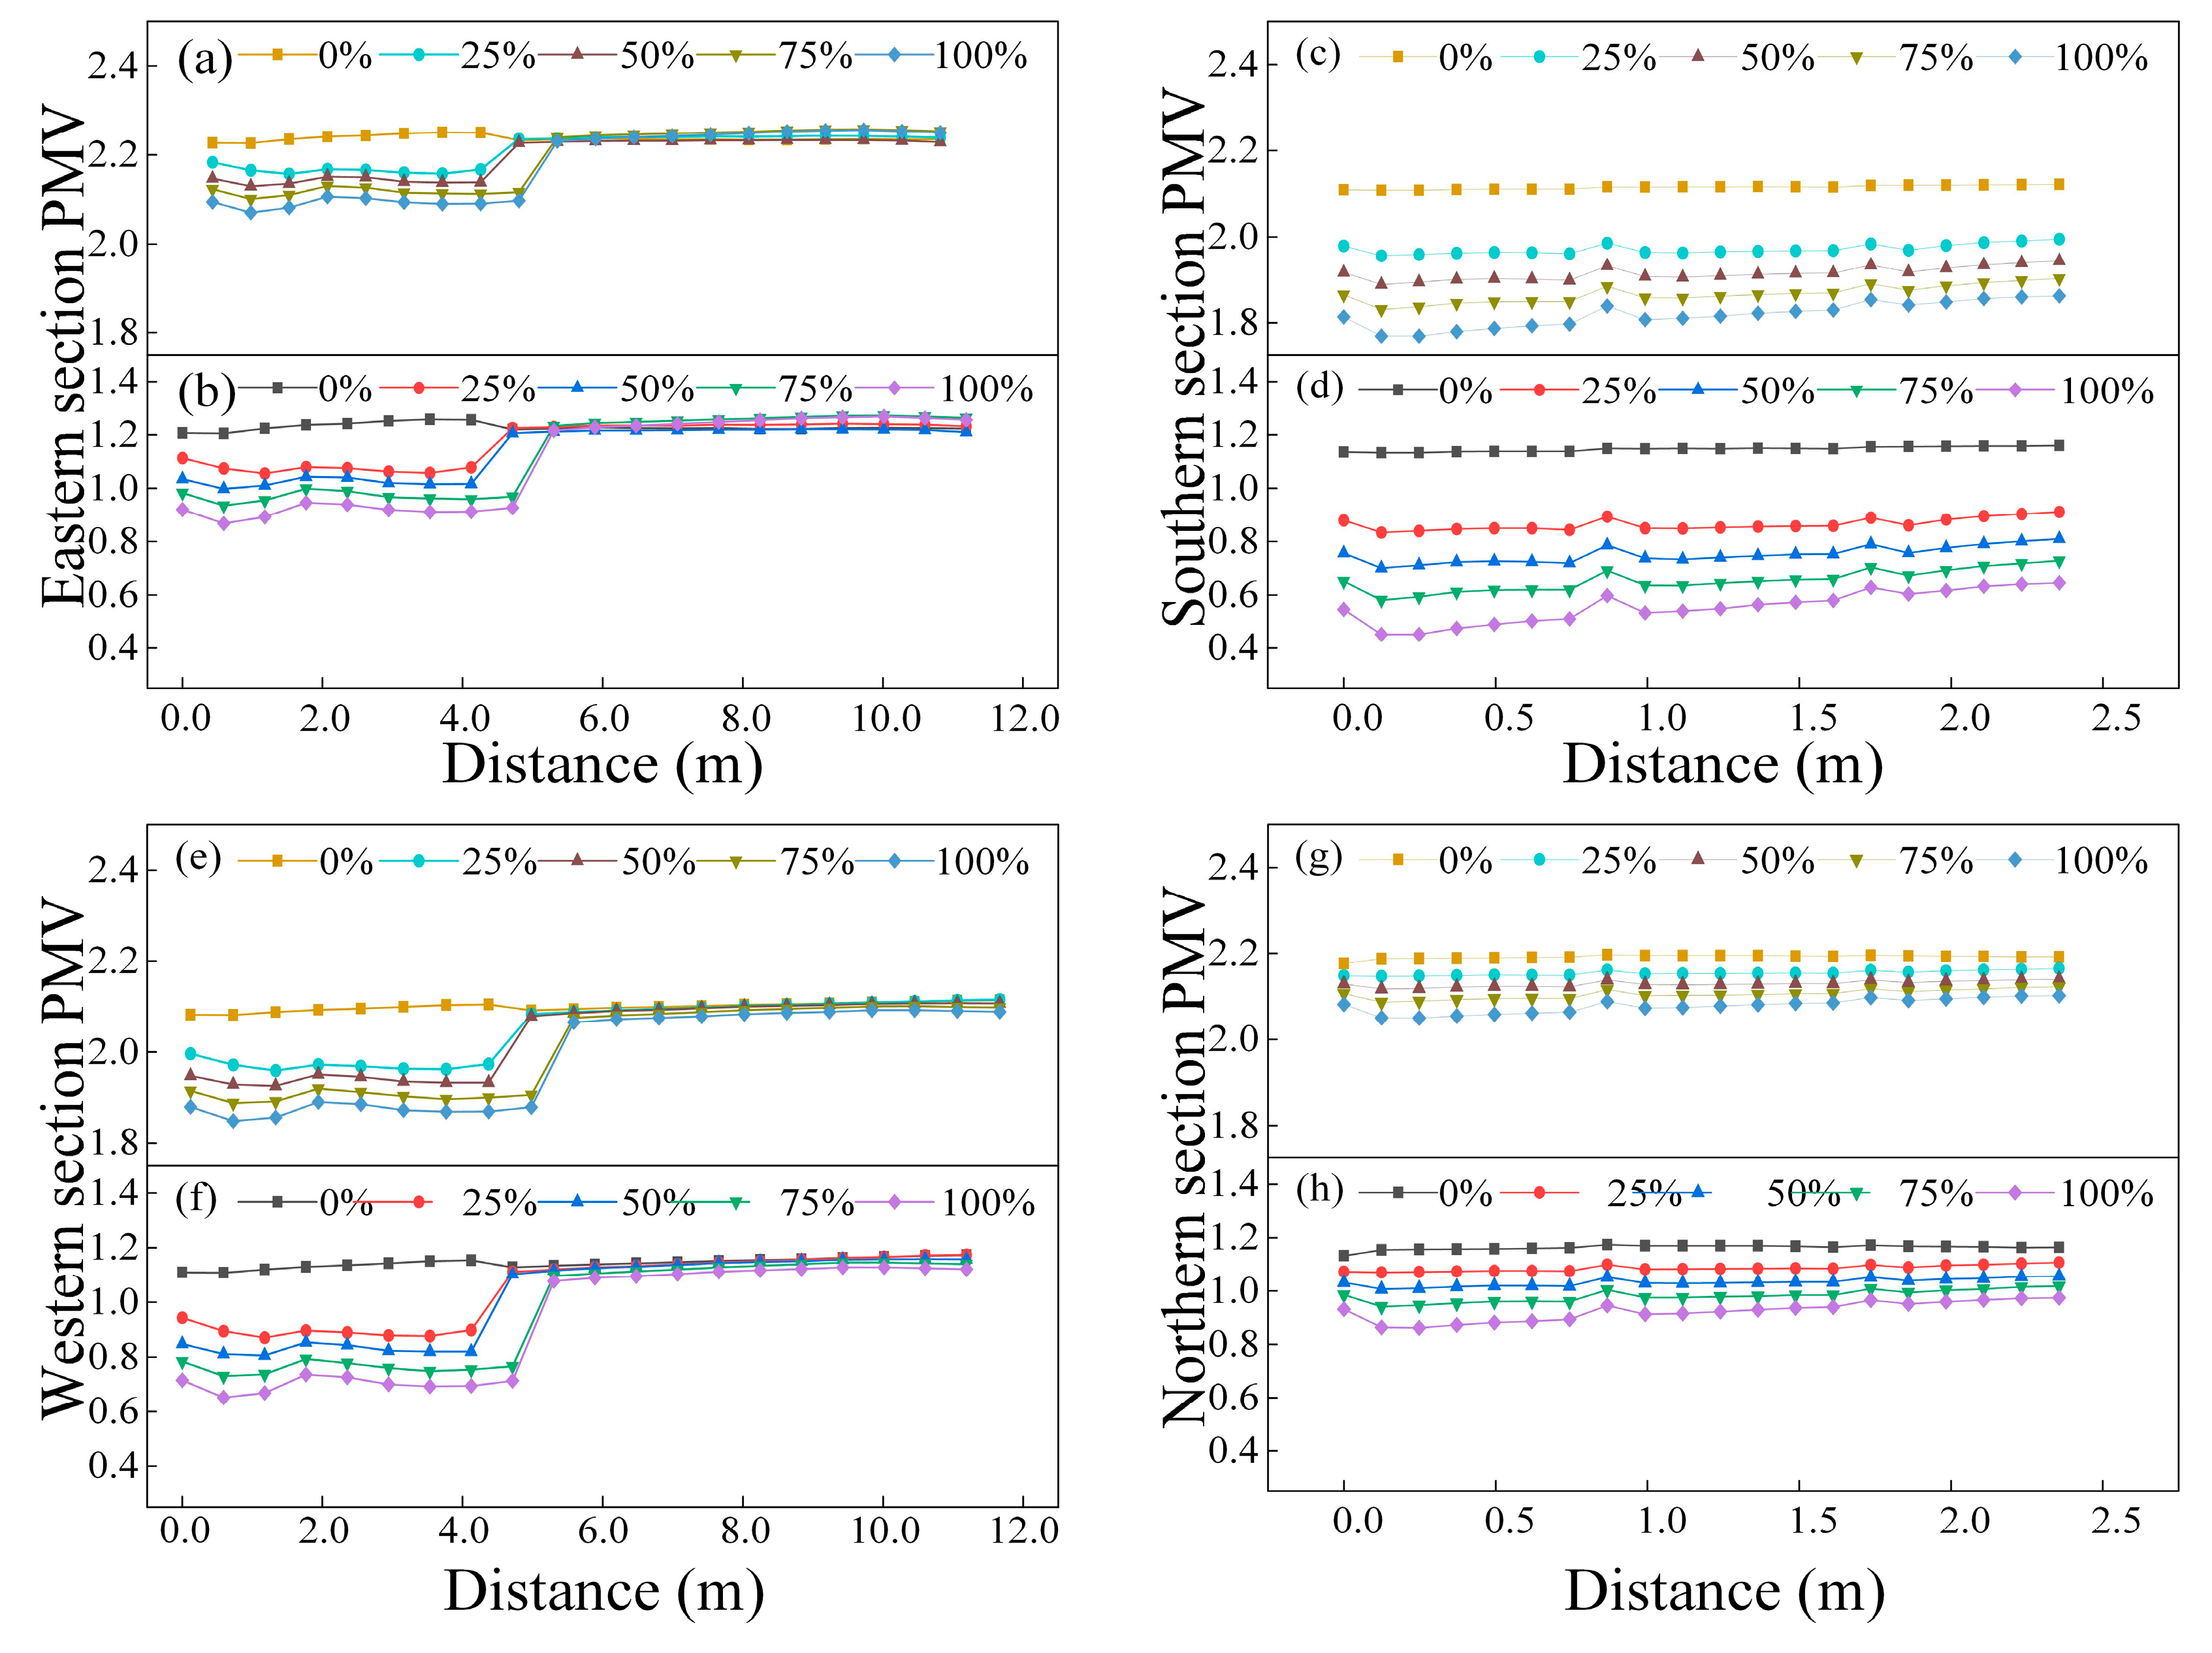
  • When the temperature of the indoor stand is low (10:00 am), the opening of the seat ventilation device causes a significant change in the PMV index of the front seat area, and the average reduction in the four directions is 0.39. The seating area on the south side changed the most, from 1.15 before the device was turned off to 0.56. The seating area on the north side changed the least, from 1.16 before the device was turned off to 0.92. When the temperature of the indoor stand reaches the maximum, the influence of the device opening on the PMV index of the seat area is small, and the average reduction is only 0.19.
  • This study only investigates the application effect of a natural wind-driven seat air supply in gymnasiums. Its application in more types of buildings remains to be studied. The application of nature-driven seat air supply in stadiums is very promising and can effectively promote the development of low-carbon undertakings.

Author Contributions

Methodology, Q.D.; software, Y.W. (Yimin Wang) and M.W.; data curation, Y.W. (Yinguang Wu) and Y.W. (Yimin Wang); writing—original draft, Y.W. (Yinguang Wu); writing—review and editing, Y.W. (Yinguang Wu) and Y.W. (Yimin Wang); supervision, Q.D. and W.T.; project administration, W.T.; funding acquisition, W.T. All authors have read and agreed to the published version of the manuscript.

Funding

This project was funded by the Central-Southern China Engineering Consulting and Design Group Co., Ltd. (Grant No. CSADI-2022-08).

Data Availability Statement

The data that support the findings of this study are available from the corresponding author upon reasonable request.

Conflicts of Interest

Authors Yinguang Wu, Wensheng Tang and Meng Wang were employed by the company Central-South Architectural Design Institute Co., Ltd. The remaining authors declare that the research was conducted in the absence of any commercial or financial relationships that could be construed as a potential conflict of interest.

Abbreviations

The following abbreviations are used in this manuscript:
ACHAir-change rate
CFDComputational fluid dynamics
TVOCTotal Volatile Organic Compounds
PMParticulate matter
MEMean Error
RMSERoot Mean Square Error
PMVPredicted Mean Vote
STTemperature of the indoor stand

References

  1. Ke, Y. Research on energy-saving strategies of college stadiums and sports venues under the concept of low carbon development. E3S Web Conf. EDP Sci. 2021, 275, 02007. [Google Scholar] [CrossRef]
  2. Alves, C.A.; Calvo, A.I.; Castro, A.; Fraile, R.; Evtyugina, M.; Bate-Epey, E.F. Air quality in sports venues with distinct characteristics. Int. J. Environ. Ecol. Eng. 2013, 7, 298–302. [Google Scholar] [CrossRef]
  3. Bralewska, K.; Rogula-Kozłowska, W. Health exposure of users of indoor sports centers related to the physico-chemical properties of particulate matter. Build. Environ. 2020, 18, 106935. [Google Scholar] [CrossRef]
  4. Kuskowska, K.; Rogula-Kozłowska, W.; Widziewicz, K. A preliminary study of the concentrations and mass size distributions of particulate matter in indoor sports facilities before and during athlete training. Environ. Protect. Eng. 2019, 3, 103–112. [Google Scholar] [CrossRef]
  5. Sracic, M.K. Modeled regional airway deposition of inhaled particles in athletes at exertion. J. Aerosol Sci. 2016, 99, 54–63. [Google Scholar] [CrossRef]
  6. Abelsohn, A.; Stieb, D.M. Health effects of outdoor air pollution. Approach to counseling patients using the Air Quality Health Index. Can. Fam. Physician 2011, 57, 881–887. [Google Scholar]
  7. Flaherty, J.M.; Smoliga, J.M.; Zavorsky, G.S. The effect of increased physical activity on pulmonary diffusing capacity in unfit women. Exp. Physiol. 2014, 99, 562–570. [Google Scholar] [CrossRef]
  8. Qian, F.; Shi, Z.; Yang, L. A Review of Green, Low-Carbon, and Energy-Efficient Research in Sports Buildings. Energies 2024, 17, 4020. [Google Scholar] [CrossRef]
  9. Yang, D.; Li, P. Natural ventilation of lower-level floors assisted by the mechanical ventilation of upper-level floors via a stack. Energy Build. 2015, 92, 296–305. [Google Scholar] [CrossRef]
  10. Moosavi, L.; Mahyuddin, N.; Ab Ghafar, N.; Ismail, M.A. Thermal performance of atria: An overview of natural ventilation effective designs. Renew. Sustain. Energy Rev. 2014, 34, 654–670. [Google Scholar] [CrossRef]
  11. Rajagopalan, P.; Luther, M.B. Thermal and ventilation performance of a naturally ventilated sports hall within an aquatic centre. Energy Build. 2013, 58, 111–122. [Google Scholar] [CrossRef]
  12. Nguyen, S. Thermal Comfort in Indoor Sports Facilities and the Adequacy of Demand-controlled Ventilation. Master’s Thesis, Aalto University, Espoo, Finland, 2023. [Google Scholar]
  13. Zhong, H.Y.; Sun, Y.; Shang, J.; Qian, F.P.; Zhao, F.Y.; Kikumoto, H.; Jimenez-Bescos, C.; Liu, X. Single-sided natural ventilation in buildings: A critical literature review. Build. Environ. 2022, 212, 108797. [Google Scholar] [CrossRef]
  14. Kulmala, I.; Hynynen, P.; Welling, I.; Säämänen, A. Local ventilation solution for large, warm emission sources. Ann. Occup. Hyg. 2007, 51, 35–43. [Google Scholar]
  15. Khan, N.; Su, Y.; Riffat, S.B. A review on wind driven ventilation techniques. Energy Build. 2008, 40, 1586–1604. [Google Scholar] [CrossRef]
  16. Haw, L.C.; Saadatian, O.; Sulaiman, M.Y.; Mat, S.; Sopian, K. Empirical study of a wind-induced natural ventilation tower under hot and humid climatic conditions. Energy Build. 2012, 52, 28–38. [Google Scholar] [CrossRef]
  17. Qian, F.; Shi, Z.; Yang, L. Thinking of Green, Low Carbon, and Energy-Saving Designs Based on the Variable Ventilation of Natatoriums: Taking the Jiading Natatorium of Tongji University as an Example. Sustainability 2024, 16, 4476. [Google Scholar] [CrossRef]
  18. Kang, J.H.; Lee, S.J. Improvement of natural ventilation in a large factory building using a louver ventilator. Build. Environ. 2008, 43, 2132–2141. [Google Scholar] [CrossRef]
  19. Cui, S.; Stabat, P.; Marchio, D. Numerical simulation of wind-driven natural ventilation: Effects of loggia and facade porosity on air change rate. Build. Environ. 2016, 106, 131–142. [Google Scholar] [CrossRef]
  20. Lin, J.T.; Chuah, Y.K. A study on the potential of natural ventilation and cooling for large spaces in subtropical climatic regions. Build. Environ. 2011, 46, 89–97. [Google Scholar] [CrossRef]
  21. Huang, C.; Zou, Z.; Li, M.; Wang, X.; Li, W.; Huang, W.; Yang, J.; Xiao, X. Measurements of indoor thermal environment and energy analysis in a large space building in typical seasons. Build. Environ. 2007, 42, 1869–1877. [Google Scholar] [CrossRef]
  22. Karaiskos, P.; Martinez-Molina, A.; Alamaniotis, M. Analyzing indoor air pollutants in naturally ventilated athletic facilities. A case of study. J. Build. Eng. 2023, 77, 107457. [Google Scholar] [CrossRef]
  23. Cheng, Z.; Li, L.; Bahnfleth, W.P. Natural ventilation potential for gymnasia–Case study of ventilation and comfort in a multisport facility in northeastern United States. Build. Environ. 2016, 108, 85–98. [Google Scholar] [CrossRef]
  24. Guo, W.; Liang, S.; He, Y.; Li, W.; Xiong, B.; Wen, H. Combining EnergyPlus and CFD to predict and optimize the passive ventilation mode of medium-sized gymnasium in subtropical regions. Build. Environ. 2022, 207, 108420. [Google Scholar] [CrossRef]
  25. Sekhar, C.; Bivolarova, M.; Akimoto, M.; Wargocki, P. Detailed characterization of bedroom ventilation during heating season in a naturally ventilated semi-detached house and a mechanically ventilated apartment. Sci. Technol. Built Environ. 2020, 27, 158–180. [Google Scholar] [CrossRef]
  26. Cheng, Y.; Niu, J.; Gao, N. Stratified air distribution systems in a large lecture theatre: A numerical method to optimize thermal comfort and maximize energy saving. Energy Build. 2012, 55, 515–525. [Google Scholar] [CrossRef]
  27. Zítek, P.; Vyhlídal, T.; Simeunović, G.; Nováková, L.; Čížek, J. Novel personalized and humidified air supply for airliner passengers. Build. Environ. 2010, 45, 2345–2353. [Google Scholar] [CrossRef]
  28. Heinsohn, R.J.; O’Donnel, W.R.; Tao, J. Automobile passenger compartment ventilation. Ashrae Trans. 1993, 99, 3669. [Google Scholar]
  29. White, J.H. The American Railroad Passenger Car; JHU Press: Baltimore, MD, USA, 1985. [Google Scholar]
  30. Dobruszkes, F. High-speed rail and air transport competition in Western Europe: A supply-oriented perspective. Transp. Policy 2011, 18, 870–879. [Google Scholar] [CrossRef]
  31. Zhang, T.; Chen, Q.Y. Novel air distribution systems for commercial aircraft cabins. Build. Environ. 2007, 42, 1675–1684. [Google Scholar] [CrossRef]
  32. Yan, W.; Zhang, Y.; Sun, Y.; Li, D. Experimental and CFD study of unsteady airborne pollutant transport within an aircraft cabin mock-up. Build. Environ. 2009, 44, 34–43. [Google Scholar] [CrossRef]
  33. Niu, J.; Gao, N.; Phoebe, M.; Huigang, Z. Experimental study on a chair-based personalized ventilation system. Build. Environ. 2007, 42, 913–925. [Google Scholar] [CrossRef]
  34. Kwon, Y.I. A Study on the Improvement of ADPI and Ventilation Effectiveness in a Small Theater. Int. J. Air-Cond. Refrig. 2016, 24, 1650019. [Google Scholar] [CrossRef]
  35. Bolashikov, Z.; Melikov, A.; Krenek, M. Control of the free convective flow around the human body for enhanced inhaled air quality: Application to a seat-incorporated personalized ventilation unit. HvacR Res. 2010, 16, 161–188. [Google Scholar] [CrossRef]
  36. Gao, R.; Li, H.; Li, A.; Lai, T.; Du, W.; Deng, B.; Zhang, L.; Lei, W. Guardrail-based air supply terminal for improving ventilation effectiveness and saving energy in the waiting zone. Energy Explor. Exploit. 2021, 39, 1394–1414. [Google Scholar] [CrossRef]
  37. Gao, N. Numerical and experimental study of personalized ventilation. Ph.D. Thesis, The Hong Kong Polytechnic University, Hong Kong, China, 2007. [Google Scholar]
  38. Zhang, Y.; Wu, X.; Zhang, J.; Pan, Z. Study on the Design Schemes of the Air-Conditioning System in a Gymnasium. In Proceedings of the 2nd International Conference on Materials Science, Energy Technology and Environmental Engineering (MSETEE 2017), Zhuhai, China, 28–30 April 2017; IOP Publishing: Bristol, UK, 2017; Volume 81, p. 012158. [Google Scholar]
  39. Nishioka, T.; Ohtaka, K.; Hashimoto, N.; Onojima, H. Measurement and evaluation of the indoor thermal environment in a large domed stadium. Energy Build. 2000, 32, 217–223. [Google Scholar] [CrossRef]
  40. Stathopoulou, O.I.; Assimakopoulos, V.D.; Flocas, H.A.; Helmis, C.G. An experimental study of air quality inside large athletic halls. Build. Environ. 2008, 43, 834–848. [Google Scholar] [CrossRef]
  41. Fokaides, P.A.; Jurelionis, A.; Gagyte, L.; Kalogirou, S.A. Mock target IR thermography for indoor air temperature measurement. Appl. Energy 2016, 164, 676–685. [Google Scholar] [CrossRef]
  42. Wang, K.; Li, Q.; Yang, Y. Energy Saving Simulation Analysis of Natural Cooling of Fresh Air in Small and Medium-Sized Data Centers in Cold Winter and Hot Summer Regions. In Proceedings of the 2nd International Conference on Computer Engineering and Intelligent Control (ICCEIC),IEEE, Chongqing, China, 12–14 November 2021; pp. 201–204. [Google Scholar]
  43. Raji, B.; Tenpierik, M.J.; Bokel, R.; van den Dobbelsteen, A. Natural summer ventilation strategies for energy-saving in high-rise buildings: A case study in the Netherlands. Int. J. Vent. 2020, 19, 25–48. [Google Scholar] [CrossRef]
  44. Gang, Z.; Shuting, Y.; Fenglong, W. Study of the Urban Coordinated Development Capability Index in the Yangtze River Economic Belt. J. Landsc. Res. 2020, 12, 41. [Google Scholar]
  45. Li, Z.; Jiao, L.; Zhang, B.; Xu, G.; Liu, J. Understanding the pattern and mechanism of spatial concentration of urban land use, population and economic activities: A case study in Wuhan, China. Geo-Spat. Inf. Sci. 2021, 24, 678–694. [Google Scholar] [CrossRef]
  46. Wang, L.; Wang, K.; Zhang, J.; Zhang, D.; Wu, X.; Zhang, L. Multiple objective-oriented land supply for sustainable transportation: A perspective from industrial dependence, dominance and restrictions of 127 cities in the Yangtze River Economic Belt of China. Land Use Policy 2020, 99, 105069. [Google Scholar] [CrossRef]
  47. Lee, M.; Park, G.; Park, C.; Kim, C. Improvement of grid independence test for computational fluid dynamics model of building based on grid resolution. Adv. Civ. Eng. 2020, 2020, 8827936. [Google Scholar] [CrossRef]
  48. Fisher, R.A. A Mathematical Examination of the Methods of Determining the Accuracy of an Observation by the Mean Error, and by the Mean Square Error. Mon. Not. R. Astron. Soc. 1920, 80, 758–770. [Google Scholar] [CrossRef]
  49. Hodson, T.O. Root mean square error (RMSE) or mean absolute error (MAE): When to use them or not. Geosci. Model Dev. Discuss. 2022, 15, 5481–5487. [Google Scholar] [CrossRef]
  50. Farris, J.S. The retention index and the rescaled consistency index. Cladistics 1989, 5, 417–419. [Google Scholar] [CrossRef]
  51. Uğursal, A.; Culp, C.H. The effect of temperature, metabolic rate and dynamic localized airflow on thermal comfort. Appl. Energy 2013, 111, 64–73. [Google Scholar] [CrossRef]
  52. Ji, T.; Cai, J.; Wang, K. Investigation on the indoor thermal comfort in sports settings and an improvement to Fanger model. Int. J. Low-Carbon Technol. 2022, 17, 333–341. [Google Scholar] [CrossRef]
Figure 1. Research area (Wuhan City).
Buildings 15 01600 g001
Figure 2. View of the northeast corner of the gymnasium.
Buildings 15 01600 g002
Figure 3. Schematic diagram of seat air supply.
Buildings 15 01600 g003
Figure 4. Indoor and outdoor measuring points in the gymnasium: (a) external measure points; (b) indoor grandstand measuring point; (c) top view of cross-section temperature measuring point; (d) front view of cross-section temperature measuring point.
Buildings 15 01600 g004
Figure 5. Two types of air inlet opening and closing modes for the seat air supply device.
Buildings 15 01600 g005
Figure 6. Indoor and outdoor temperatures during the test: (a) eastern; (b) western; (c) southern; (d) northern.
Buildings 15 01600 g006
Figure 7. Temperature of room section: (a) 22 April; (b) 23 April; (c) 24 April; (d) 25 April.
Buildings 15 01600 g007
Figure 8. Indoor and outdoor wind speeds: (a) 23 April; (b) 24 April.
Buildings 15 01600 g008
Figure 9. Full-scale model of the gymnasium (full-scale model refers to a numerical or physical model constructed based on the true dimensions, geometric shapes, and physical parameters of an actual object, avoiding similarity errors caused by scaled-down models in CFD).
Buildings 15 01600 g009
Figure 10. Ventilation of the seating area in each direction (distance refers to the distance from the first row of seats: the depth of the east–west seating area is 11.19 m and the depth of the north–south seating area is 2.36 m): (a) eastern; (b) western; (c) southern; (d) northern.
Buildings 15 01600 g010
Figure 11. PMV of seat areas in different directions: (a) ST = 23.5 °C; (b) ST = 19.7 °C; (c) ST = 23.0 °C; (d) ST = 19.3 °C; (e) ST = 22.9 °C; (f) ST = 19.2 °C; (g) ST = 23.5 °C; (h) ST = 19.7 °C.
Buildings 15 01600 g011
Figure 12. Cloud image of wind speed field of the indoor stand at different opening rates (1.5 m above ground): (a) Open rate 0%; (b) Open rate 25%; (c) Open rate 50%; (d) Open rate 75%; (e) Open rate 100%.
Buildings 15 01600 g012
Figure 13. Wind speed distribution of the indoor stand at different opening rates (1.5 m above the ground): (a) Open rate 0%; (b) Open rate 25%; (c) Open rate 50%; (d) Open rate 75%; (e) Open rate 100%.
Buildings 15 01600 g013
Figure 14. Cloud image of wind speed field in the sports areas at different opening rates (1.5 m above ground): (a) Open rate 0%; (b) Open rate 25%; (c) Open rate 50%; (d) Open rate 75%; (e) Open rate 100%.
Buildings 15 01600 g014
Figure 15. Cloud image of pressure field in sports areas at different opening rates (1.5 m above ground): (a) Open rate 0%; (b) Open rate 25%; (c) Open rate 50%; (d) Open rate 75%; (e) Open rate 100%.
Buildings 15 01600 g015
Figure 16. Wind speed distribution in the sports areas at different opening rates (1.5 m above ground): (a) Open rate 0%; (b) Open rate 25%; (c) Open rate 50%; (d) Open rate 75%; (e) Open rate 100%.
Buildings 15 01600 g016
Table 1. Research on various forms of ventilation.
ScholarAdvantageDisadvantage
Natural
ventilation
Wind-induced ventilation towerHaw et al. [16]Ventilation performance can be maintained when the temperature difference between the indoors and outdoors is not large.Depending on wind and direction, there is a risk of rainwater flooding.
Opening at the topQian et al. [17]
Lin et al. [20]
Chen et al. [21]
Cheng et al. [23]
Flexible and controllable ventilation adjustment, making full use of thermal pressure ventilation.The structure is relatively complex, and the construction and maintenance costs are high.
External deflector louverKang et al. [18]Suitable for places where the wind is stable; the guidance of the blade increases the flow of the sucked air and takes into account the protection of the place.The design optimization is rather complex.
The window opening corresponding to the prevailing wind directionCui et al. [19]The wind pressure utilization is maximized, and the structure is simple.The heat preservation performance is affected. It increases the incoming solar radiation.
Seat air supply driven by natural windThis manuscriptThe airflow is guided to blow directly onto the user, enhancing local comfort. The structure is simple, and the maintenance cost is low.High environmental dependence.
Mechanical ventilationVentilatorSekhar et al. [25]High controllability and stability; flexible adaptation to complex scenarios.High energy consumption, and operating cost; noise.
Seat air supplyCheng et al. [26]
Zítek et al. [27]
Zhang et al. [38]
Nishioka et al. [39]
With the air conditioning system, it can effectively reduce or increase the local temperature and save energy.The energy consumption is still higher than that of natural ventilation, and the maintenance complexity is relatively high.
Table 2. Environmental parameter measurement instruments and accuracy.
ParameterMeasurement InstrumentPrecision AccuracySampling Frequency
TemperatureHOBO Pro Temperature Recorder±0.1 °C15-min interval
Relative humidity±2%
Wind speedTSI-AP500 wireless
anemometer
±2%
Table 3. Test conditions for gymnasium.
Condition 1Condition 2Condition 3Condition 4
Date22 April 23 April 24 April 25 April
Power sunroofONONONON
Seat air supply deviceOFFOFFONON
First floor entranceOFFOFFOFFOFF
Second floor entranceONONONON
Table 4. Average indoor and outdoor wind speeds during the measured period.
East
Outdoor/
Indoor (m/s)
South
Outdoor/
Indoor (m/s)
West
Outdoor/
Indoor (m/s)
North
Outdoor/
Indoor (m/s)
Air intake Rate
22 April 1.2/0.61.1/0.40.5/0.30.6/0.347%
23 April 0.7/0.31.5/0.80.5/0.20.6/0.348%
24 April 0.8/0.61.4/1.10.6/0.50.5/0.375%
25 April 1.1/0.80.4/0.20.5/0.31.2/0.969%
Table 5. Indoor and outdoor relative humidity of the gymnasium during the measured period.
East
Outdoor/
Indoor
South
Outdoor/
Indoor
West
Outdoor/
Indoor
North
Outdoor/
Indoor
Change in
Relative
Humidity
22 April 71%/63%72%/64%73%/62%71%/62%9.25%
23 April 71%/65%71%/66%71%/64%71%/62%6.75%
24 April 72%/71%71%/70%72%/71%73%/72%1%
25 April 56%/56%59%/58%56%/55%57%/56%0.75%
Table 6. Comparison between simulated and measured wind speed.
East
(m/s)
South
(m/s)
West
(m/s)
North
(m/s)
Air Intake Rate
OFFsimulated value0.560.340.310.2442.59%
measured value0.60.40.30.347.00%
ONsimulated value0.660.990.450.3674.34%
measured value0.61.10.50.375.00%
Table 7. Error analysis of the average wind speed simulation.
Seat Air SupplyValue
OFFME0.04
d0.89
RMSE0.05
ONME0.09
d0.90
RMSE0.11
Table 8. Boundary conditions under each simulated working condition.
Title 1Title 2Natural Ventilation Opening RateOutdoor Wind Speed (m/s)
CaseModelSeat air supplySecond floor entranceSkylight windowEastSouthWestNorth
1Standard k-e0%100%100%0.81.40.60.5
225%100%100%0.81.40.60.5
350%100%100%0.81.40.60.5
475%100%100%0.81.40.60.5
5100%100%100%0.81.40.60.5
60%100%100%1.21.10.50.6
Table 9. Scale used for the PMV.
Thermal SensationHotWarmSlightly WarmNeutralSlightly CoolCoolCold
PMV+3+2+10−1−2−3
Disclaimer/Publisher’s Note: The statements, opinions and data contained in all publications are solely those of the individual author(s) and contributor(s) and not of MDPI and/or the editor(s). MDPI and/or the editor(s) disclaim responsibility for any injury to people or property resulting from any ideas, methods, instructions or products referred to in the content.

