Abstract
Enhancing the energy efficiency of building envelopes is one of the key strategies for energy conservation and reducing consumption in buildings. This study employs numerical research methods to explore the impact of crucial factors such as solar cell coverage, air channel height, indoor relative humidity, and indoor wind speed on the power generation performance and thermal comfort of a photovoltaic (PV)—Trombe wall. The dynamic changes in optical and thermal performance and energy efficiency matching mechanisms of this system are also discussed in hot summer and warm winter regions. The research findings indicate that the periods of good thermal comfort and power generation efficiency for humans are from 9:00 to 17:00 in winter. In summer, these periods are from 5:00 to 8:00 as well as from 17:00 to 20:00. When the system height is 2 m, the electricity price for power supplied by the PV—Trombe wall system is 25% lower than the residential price, with an annual energy generation of 322.5 kWh/m2 of solar panel, which can save USD 6.35 in costs. Moreover, an experiment is conducted to investigate the thermoelectric correlation by constructing a traditional Trombe wall and an external PV—Trombe wall. When the coverage reached 52.08%, the overall system efficiency was maximized. At a coverage of 78.12%, the system’s thermal efficiency was at its lowest, while the maximum power generation was 510.3 W. It can be seen that the PV—Trombe wall possesses good economic benefits and energy saving as well as emission reduction potential in hot summers and warm winters regions, and the smooth implementation of related works will effectively promote its applications and promotions.
1. Introduction
With the need of economic and social development, the building sector has become one of the three major sectors of energy consumption in our country [], in which the cooling and heating load regulation of building HVAC and indoor lighting account for 58.25% and 5.26% of building energy consumption, respectively []; reducing the building cooling and heating load and increasing building clean energy conversion are important means to ease the energy crisis and a Trombe wall is a building envelope that uses solar energy to regulate the cooling and heating loads of buildings.
The conventional Trombe wall consists of an outer layer of highly transparent glass and an inner thermal storage wall. This thermal storage wall captures sunlight that passes through the glass cover, causing the air near the wall within the channel to warm and subsequently rise into the living space, thereby achieving the heating goals of residential environments. Research indicates that during cold winters, the indoor temperature can be maintained between 10 and 16 °C [], significantly reducing building energy consumption [], while also fulfilling the basic thermal comfort needs of occupants. Nonetheless, the traditional Trombe wall encounters several challenges due to its simplistic design, including low adaptability to seasonal changes, poor thermal efficiency, and limited solar energy utilization []. In recent years, to unveil the latent potential of the PV—Trombe wall, researchers have actively pursued the concept of clean and efficient energy conversion, culminating in the development of an innovative PV—Trombe wall system that builds upon the foundations of the traditional design. PV—TW was originally proposed by Ji et al. [] for space heating while generating electricity. Usually, an external PV—TW system comprises a laminated PV panel and a glass PV module installed into the Trombe wall’s exterior. The integrated system maintains the indoor temperature at a comfortable level of 13.4 °C and achieves an average daily power performance of 10.4%, which contributes to the overall energy utilization efficiency. Luo et al. [] proposed a novel and promising active building integrated photovoltaic thermoelectric wall system, which can reduce daily total and max instantaneous heat gain by around 70% and 180% compared with a conventional Trombe wall. According to the findings of Yu et.al. [], analyses of electricity output, space heating, formaldehyde degradation, and ventilation for a photo-thermal-driven synergetic catalytic photovoltaic—Trombe wall have been deeply explored. With photovoltaic coverage of 0.5, the proposed system showed 189.9 m3/(m2 day) total generated clean air, revealing an increase of 28.2% compared to the previous version. In summary, the evolution of Trombe wall research is geared towards enhancing its physical structure and embracing multifunctionality, leveraging these advancements to address its limitations.
The PV—Trombe wall shares similarities with the traditional Trombe wall in enhancing system responsiveness and fostering clean energy conversion. Extensive research underscores its superiority over the conventional Trombe wall in various aspects. For instance, it has been demonstrated to outperform the traditional wall in terms of functionality [], overall system efficiency [], and mitigating room temperature overheating issues [,]. Specifically, Wang et al. [] integrated microchannel heat pipes into a PV—Trombe wall system, achieving notable reductions in collector temperature and enhancing overall collector efficiency. This resulted in a stable average indoor temperature of 20.36 °C and a daily power output of 0.86 kWh during heating mode. Furthermore, Ma et al. [] compared internal and external PV—Trombe wall systems, revealing that the internal system exhibits superior thermal performance, with an indoor temperature difference of 1.5 °C compared to the external system. These findings highlight the PV—Trombe wall’s potential to revolutionize energy-efficient building designs. Regarding electrical performance, despite the outstanding thermal characteristics of the internal PV—Trombe wall, a tradeoff arises. The solar cells operate at higher temperatures and their light-receiving surface area diminishes, subsequently leading to a decrement in their photoelectric conversion efficiency. This phenomenon underscores the intricate balance between the system’s thermal prowess and its electrical performance. Although the development of PV—Trombe walls has showcased excellent functionality, there exists a competitive mechanism in solar thermal utilization, whereby thermal performance and electrical performance often rise and fall in opposition to each other. In addition, Xiao et al. [] suggested that the energy saving of building should be reconsidered on the premise of satisfying the thermal comfort of an indoor human body. The installation location of PV modules was studied in the Central Plain, comparing built-in versus three-center built-in structures. The external system yielded the longest duration of comfortable thermal conditions in summer, significantly alleviating the Trombe wall’s poor thermal comfort issue. However, there exists a notable climatic disparity between the Central Plain and South China, necessitating a deeper exploration into the PV—Trombe wall’s efficacy in addressing room temperature overheating issues in the latter region. While previous research has highlighted the advantages of photovoltaic—Trombe walls in enhancing functionality and overall system efficiency, there remains a lack of comprehensive analysis regarding their adaptability in different climatic conditions. Our focus on the application of photovoltaic—Trombe walls in hot summer and mild winter regions addresses this gap. To unravel the intricate interplay between light and heat efficiency within the PV—Trombe wall and assess its suitability in hot summer and warm winter climates, this study commences by establishing a numerical model of the PV—Trombe wall utilizing simulation techniques. Subsequently, a predictive mathematical model is formulated, tailored to the unique thermal and luminous characteristics of the PV—Trombe wall in Guangzhou—a representative city of the hot summer and warm winter zone. This endeavor holds paramount significance in guiding the application and widespread adoption of the PV—Trombe wall in such climatic regions.
In Section 2, the physical and mathematical modeling of the proposed PV—Trombe is carried out, with detailed descriptions of the boundary conditions, evaluation indicators, and experimental setup information. In Section 3 and Section 4, the results of the numerical calculations and laboratory experiments are discussed in detail, respectively. Finally, in Section 5, the conclusion of this study is presented.
2. Physical and Mathematical Models
2.1. Physical Model
The structure of the proposed PV—Trombe wall in this paper is shown in Figure 1, and the physical parameters are shown in Table 1. On the left side of the system is a transparent glass cover with a high light transmittance (depth D × thickness δg × height h of 0.5 × 0.005 × 2 m) as the outer cover, a monocrystalline silicon PV panel (depth D × thickness δpv × height h = 0.5 × 0.05 × 1.8 m) is used as interlayer, and an endothermic aluminum panel is an integrated PV glass panel with an inner cover. The central portion of the PV—Trombe wall is connected to the interior via air ducts at the top and bottom of the wall (depth D × thickness δa × height Ha = 0.5 × 0.1 × 2 m). There are two baffles on both sides of the air duct, which are directly connected with the outside world. When the season is winter, the two baffles are closed at the same time to keep the heat in the room. The inside of the PV—Trombe wall is a thermal storage wall, which absorbs energy during the day and radiates heat at night.
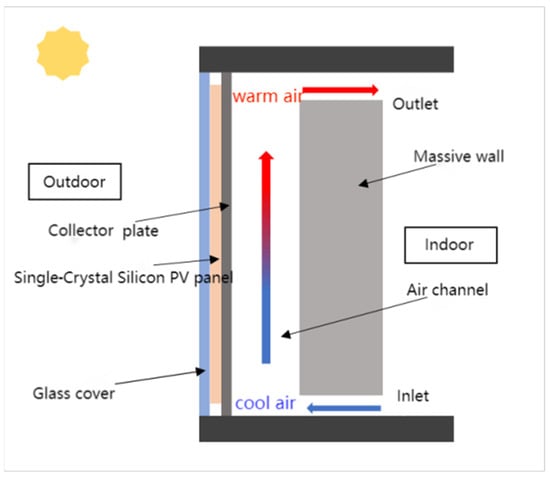
Figure 1.
Structure of the proposed PV—Trombe wall.

Table 1.
Material parameters of the proposed system.
2.2. Mathematical Model
With the aim of simplifying the calculations, the following assumptions can be made when establishing the mathematical model for the operation of a PV—Trombe wall system [,]:
- (1)
- All physical properties are assumed to be constants and independent of parameters such as temperature and pressure.
- (2)
- The leakage of air within the air layer and air channel is not considered.
- (3)
- The contact thermal resistance between the collector plate and the thermal storage wall is neglected.
2.2.1. The Boundary of Energy Balance
In order to deeply analyze the energy flow characteristics of the PV—Trombe wall, the energy balance equation of every component of the PV—Trombe wall is established in this section.
In the glass cover components, energy is transferred from the external temperature side to the inside side of the glass through the glass in the direction of the thickness of the glass. In addition, because the glass cover plate is thinner, the thermal resistance in the thickness direction can be approximately zero, and the temperatures on both sides of the component inside and outside are regarded as the same, and the energy balance equation can be defined as Equation (1).
where Te, Tg, and TPV represent the ambient temperature, glass cover surface temperature, and solar panel surface temperature, respectively, °C; hg,amb are mixed heat transfer coefficients, including the radiative and convective heat transfer of glass to the outside world, W·(m2·K)−1, taken as 29; and hr_g,pv is the radiative heat transfer coefficient between the glass cover and the PV panel, which can be calculated according to the following formula [].
where Nug,pv represents the Nusselt number, which is a dimensionless number. σ represents the Boltzmann constant, with a value of 5.67 × 10⁻⁸ W·(m2·K4)−1.
Due to encapsulation requirements, an aluminum heat-absorbing layer needs to be added to the back side of the solar cell in a solar module. The energy balance equation for the encapsulated module is given as Equation (3).
where Tb represents the temperature of the aluminum heat sink, °C; RPV represents the resistance of the packaged solar panel, clo; α′PV indicates the effective absorption rate of solar cells; ζPV indicates the coverage rate of solar cells, which can be approximated to the transmission rate; and EPV indicates the electrical energy output of PV panels, W.
The above effective absorption rate and solar panel energy output can be expressed as Equations (4) and (5).
where ηsta represents the standard photoelectric conversion efficiency value of the PV panel, which can be selected based on different operating temperatures with varying conversion values.
Within the flow channel, the air undergoes convective heat transfer with the heat-absorbing plate, resulting in heated air that rises. The heated air then enters the room through the upper flow port. After releasing heat, the air cools down and sinks, re-entering the air flow channel through the lower flow path. In this way, the heat released by the battery heats the room air through thermal convection, serving a heating function for the room. The energy equation is given as Equation (6).
where Tp, Ta, and Tw represent the temperatures of the encapsulated aluminum plate, the air within the flow channel, and the heat storage wall, respectively, °C. hp,a and ha,w represent the convective heat transfer coefficients between the air in the flow channel and the encapsulated aluminum plate, and between the air and the massive wall, W·(m2·K)−1. hp,a and ha,w can be expressed as follows.
The energy balance equation of the massive wall, which receives heat from the external air channel to the wall surface, can be expressed as Equation (8).
where ρW and cW represent the density and specific heat capacity of the massive wall, which are 1800 kg·m−3 and 840 J·(kg·K)−1, respectively.
2.2.2. Performance Evaluation Index
The work presented in this paper aims to reveal the matching mechanism of optical and thermal energy efficiency in PV—Trombe walls, while analyzing their application potential. Therefore, the model performance evaluation indicators are provided based on the requirements, including electrical performance evaluation indicators, thermal performance evaluation indicators, and economic evaluation indicators. Among them, the solar panel’s power generation efficiency, the human thermal comfort evaluation index Prediction Mean Vote (PMV), and the Levelized Cost of Energy (LCOE) are selected as evaluation parameters for electrical performance, thermal performance, and economic performance, respectively.
The power generation efficiency of solar panels can be expressed as Equation (9).
In the thermal performance evaluation indicators, PMV can be expressed using a semi-empirical formula [].
where the metabolic rate M of the human body is set at 70 W·m−2; the radiant power W emitted by the human body is set at 0 W·m−2; Troom and Tcl represent the indoor temperature and the clothing surface temperature, respectively, °C; pa represents the partial pressure of water vapor in the air, which represents a functional relationship with the indoor ambient temperature; fcl represents the ratio of the area of the clothed body to the area of the uncovered body, which usually varies between winter and summer; and hcl represents the convection heat transfer coefficient of the clothing surface, which is closely related to the surface flow velocity.
In the economic evaluation indicators, the LCOE can be calculated using Equations (11) and (12) [].
where Cinstall represents the annual installation cost, in USD; CRF represents the capital recovery factor or amortization of capital costs, in USD; O&M represents the annual maintenance cost, USD; i is the interest rate set at 6%; and n is the equipment life cycle, measured in 20-year units.
2.3. Experimental Setup
2.3.1. Experimental Works
In order to study the effect of solar intensity on the flow and heat transfer in the Trombe wall system, as well as the effect of air inlet intensity on the flow and heat transfer in the system under the traditional mode, the internal relationship between flow and heat transfer in the system is experimentally analyzed. As shown in Figure 2a, it is a wooden experimental platform with an equal-scale model. It is worth noting that all black lines, except those marking scales, are solid frame materials. The heat-collecting wall surface employs aluminum plates, while the ventilation ports are strategically positioned above and below these plates. For enhanced insulation, the remainder of the platform is wrapped with high-quality insulation materials. Figure 2b shows the actual construction of the experimental platform. The functions and specifications of each experimental instrument are shown in Table 2.
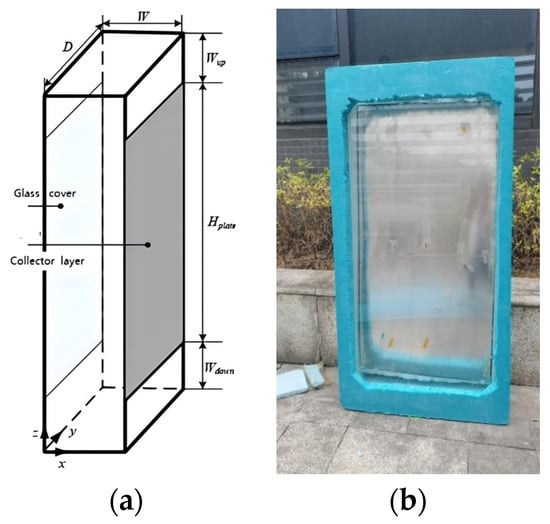
Figure 2.
(a) Theory structural of traditional Trombe wall model, and (b) structure of traditional Trombe wall model in practice.

Table 2.
Function and quantity/specification of experimental instruments.
2.3.2. Traditional Trombe Wall
- (a)
- Effect of solar intensity
Using the headlights provided in the laboratory, the cover plate was illuminated. The lights were set to vary the solar intensity from 200 W/m2 to 800 W/m2 by controlling the voltage and current input, with a gradient of 100 W/m2. To ensure consistency between the input and output of the heat flow boundary, it was necessary to measure the temperature of the heat flow boundary. A K-type thermocouple was employed to measure the temperature distribution of the heat flow boundary, calibrated in a 3 × 3 matrix format as shown in Figure 3a. Similarly, a 3 × 3 matrix was used to measure the air distribution within the flow channel, with the exception that the upper and lower thermocouples were placed at the mid-plane positions of the upper and lower outlets, as indicated by the dotted fill points in Figure 3b. A hot-wire anemometer was used to measure the wind speed at the midpoint of the inlet and outlet positions in Figure 3b, to analyze the enhancement mechanism of natural ventilation. The above tests were repeated three times, and the average values were taken to eliminate the interference of human errors on the experimental data.
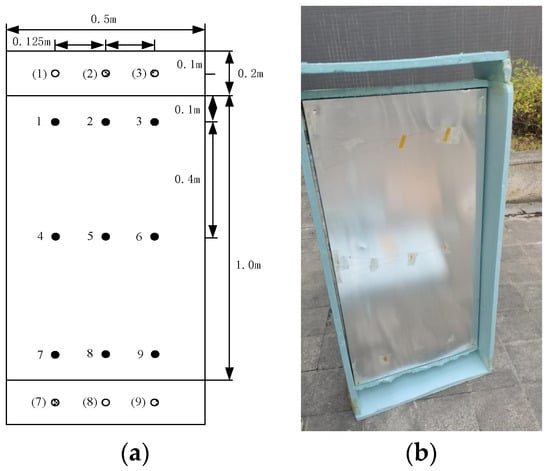
Figure 3.
(a) Experimental model thermometer speed testing point and (b) actual model temperature and velocity testing points.
- (b)
- Effect of inlet wind speed
By connecting an external power source, a fan was used as the inlet air velocity excitation source. With 600 W/m2 set as the standard solar intensity, experimental groups were established with air velocities ranging from 0.2 m/s to 0.45 m/s, with a gradient of 0.05 m/s. The objective was to investigate the flow and heat transfer characteristics of the Trombe wall under natural ventilation and multiple ventilation modes. All temperature and velocity points as specified in the above research were recorded, and the experiments were repeated three times to obtain average values.
2.3.3. PV—Trombe Wall
After completing the experimental research on the equally scaled Trombe wall system, the experiment was upgraded by purchasing several PV panels of 0.21 m by 0.31 m dimensions. These PV panels were closely attached to the glass cover plate, forming an external PV—Trombe wall system. Experiments were then conducted under a solar intensity of 600 W/m2 to investigate the thermoelectric correlation under varying coverage ratios. Specifically, experiments were conducted with 2, 4, and 6 PV panels covering the system, respectively, to explore their effects. The construction of the PV—Trombe wall experimental platform is shown in Figure 4.
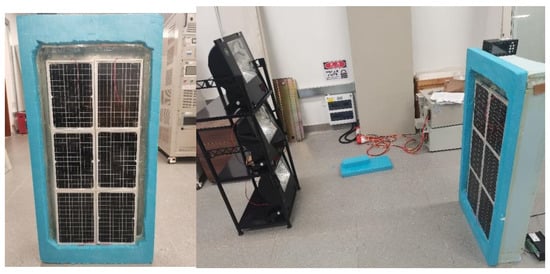
Figure 4.
External PV—Trombe wall experimental platform.
By introducing the coverage ε of PV cells, the formula of coverage is given as Equation (13).
where APW is the area of PV cell, m2; AGrass is the area of PV glass plate, m2. The PV conversion efficiency is as Equation (14).
3. Simulation Results Discussion
For the purpose of gaining an in-depth understanding of the energy efficiency matching mechanism of PV—Trombe walls in hot summer and warm winter regions in terms of solar light and heat utilization, as well as to analyze their promotion and application potential, the analysis process outlined in this paper is intended to proceed as follows. Firstly, an analysis network will be structured, subsequently establishing a theoretical analysis model and conducting its reliability validation. Secondly, separate parametric analyses will delve into the electrical and thermal performance of the system to pinpoint the optimal model configuration. Lastly, focusing on the application potential, targeted optimizations will be implemented across both aspects, coupled with an assessment of the system’s economic benefits to ensure maximum efficacy.
3.1. Numerical Simulation Analysis Process
The analysis network established in this paper is shown in Figure 5. Subsequently, reliability analysis, parametric analysis, and energy efficiency and economic analysis will be conducted separately based on the technical route.
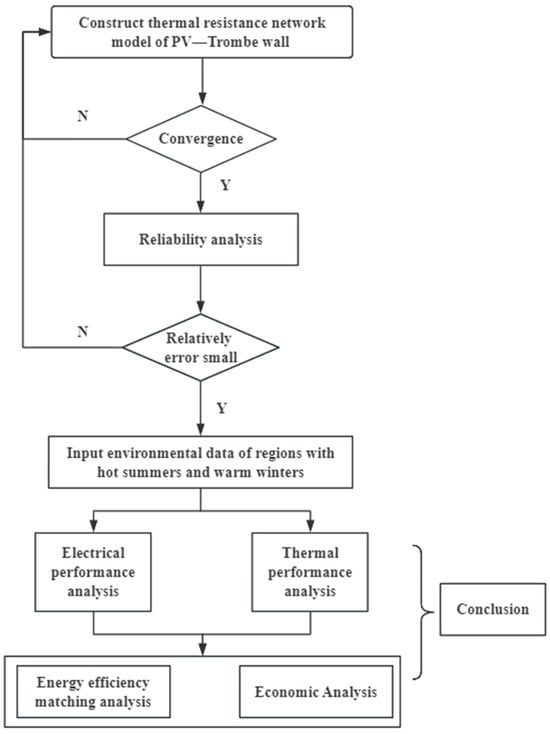
Figure 5.
The technical route of this work.
3.2. Model Validation for Simulation
Using the parameters such as solar intensity and outdoor temperature from the reference paper as initial boundary conditions, the relative humidity was set at 50%, and the wind speed at 0.2 m/s. The reliability of the model presented in this document was verified by comparing the numerical simulation results with those from reference []. The enclosure glass temperature Tg, PV temperature Tpv, and thermal comfort index PMV were adopted as validation indicators, with the validation results presented in Figure 6, Figure 7, and Figure 8, respectively.
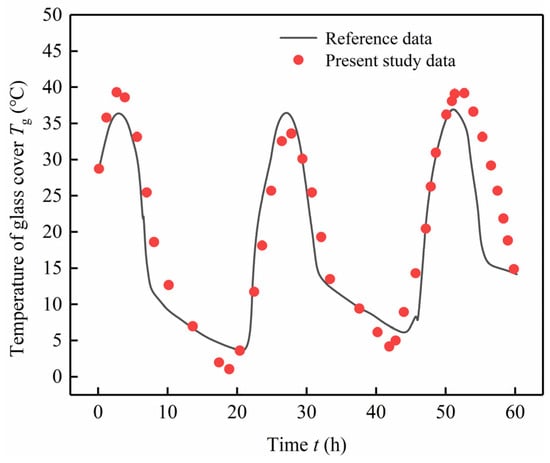
Figure 6.
Benchmark for the glass cover temperature.
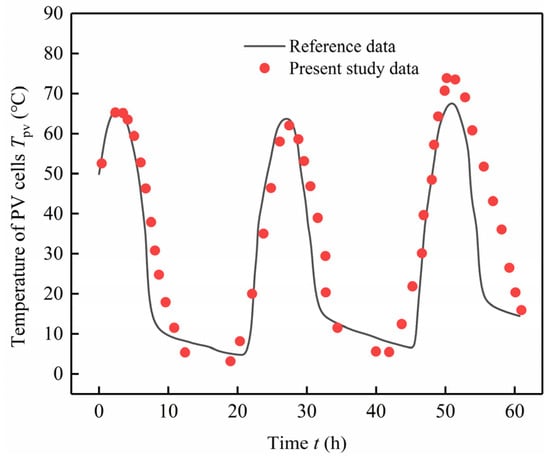
Figure 7.
Benchmark for the PV temperature.
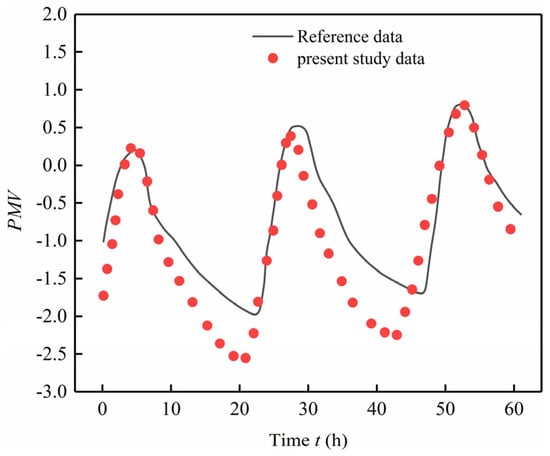
Figure 8.
Benchmark for the PMV.
From the validation results of the model, it can be observed that the numerical trends between the present model and the reference paper are fundamentally consistent. Specifically, the maximum relative error for the solar panel temperature is 7.6%, the maximum relative error for the glass cover temperature is 6.8%, and the maximum relative error for the thermal comfort index PMV is 9.4%. Overall, all errors are within 10%. In conclusion, the PV—Trombe wall model established in this document is feasible, reliable, and demonstrates good accuracy.
3.3. Analysis of Electrical Performance
3.3.1. Effect of PV Coverage
Figure 9 demonstrates the impact of solar cell coverage rates at 0.2, 0.4, 0.6, 0.8, and 1.0 on the system’s daily electricity generation, heat gain, and total energy output. According to the data, the daily electricity generation increases with the rise in coverage rate, from 0.11 kWh at a coverage of 0.2 to 1.16 kWh at a full coverage of 1.0, marking a substantial growth of 954%. This indicates a positive correlation between PV panel electricity generation and coverage rate. However, while enhancing the system’s electricity generation, an increase in PV coverage inevitably decreases solar transmittance, leading to a reduction in the thermal performance of the envelope structure. As depicted in Figure 9, the system’s daily heat gain decreases with higher coverage rates, dropping from 3.59 kWh at 0.2 coverage to 2.70 kWh at 1.0 coverage, representing a decrease of 25% year on year. This notable decline in heat gain ensures thermal comfort for occupants in summer but compromises the system’s heat storage capability in winter, highlighting that blindly increasing solar cell coverage fails to fully meet indoor thermal comfort requirements. Additionally, with increasing coverage rates, the system’s comprehensive utilization of solar energy rises from 3.87 kWh to 5.76 kWh, achieving a growth rate of 48.8%; it is consistent with the pattern demonstrated by the study conducted by Jiang et al. [], which has a negligible effect on electrical efficiency. And the system’s comprehensive utilization of solar energy rises from 3.87 kWh to 5.76 kWh, achieving a growth rate of 48.8%.
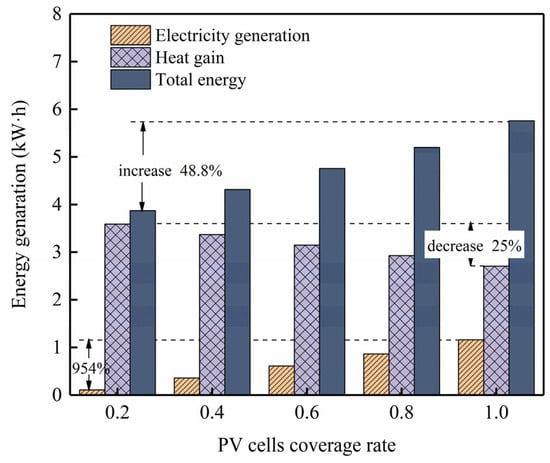
Figure 9.
Effect of coverage ratio for PV cell on electrical performance.
3.3.2. Effect of Channel Height
To investigate the impact of air channel height on the system’s electrical performance, six different air channel heights with a gradient difference of 0.25 m were selected in the study: 0.75 m, 1.00 m, 1.25 m, 1.50 m, 1.75 m, and 2.00 m. The purpose was to discuss the influence of the system’s physical structure on its solar PV conversion capabilities.
As shown in Figure 10, when the height of the air channel varies from 0.75 m to 2 m, the system’s daily total heat gain increases from 7.68 kWh to 9.40 kWh, representing a growth rate of 22.39%. Conversely, the system’s daily total electricity generation decreases from 0.85 kWh to 0.75 kWh and reaches a decline of 11.76%. With the increase in air channel height, the comprehensive utilization of solar energy by the Trombe wall system increases from 9.94 kWh to 11.39 kWh, marking a growth of 14.58%. From the above, it can be inferred that the overall increase in the system’s total effective utilization of solar energy is less than that of heat gain. This is primarily attributed to the decrease in electricity generation caused by the elevated temperature on the battery surface as a result of the increased air channel height.
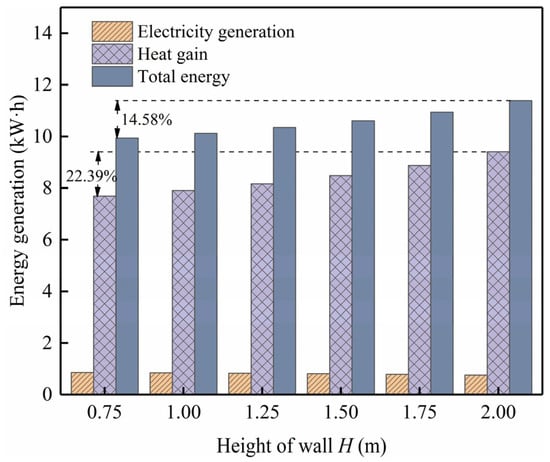
Figure 10.
Effect of channel height on electrical performance.
3.3.3. Dynamic Electrical Performance Analysis in Hot Summer and Warm Winter Regions
Figure 11 and Figure 12, respectively, examine the electricity generation, battery temperature, and power generation efficiency of the PV—Trombe wall throughout a day during the winter and summer seasons in a hot summer and warm winter region. As depicted in Figure 8, the trend of solar panel electricity generation follows that of solar radiation intensity, with both reaching their peak values between 14:00 and 15:00. The results for solar cell temperature and power generation efficiency are shown in Figure 9. Throughout the day, the power generation efficiency first increases and then decreases. Combining Equations (5) and (9), it is evident that the power generation efficiency decreases as the temperature of the PV panel rises. As the day progresses and solar radiation intensity increases, the PV panel converts solar energy into both thermal and electrical energy. The thermal energy leads to an increase in the panel’s temperature, resulting in a decrease in electrical efficiency, and the temperature of the PV panel peaks at 15:00, coinciding with the lowest electrical efficiency. Taking into account both the system’s electricity generation and generation efficiency, on 1 January, the solar panel’s electricity generation is 317.26 W with an average generation efficiency of 4.62%. In contrast, on 1 July, the corresponding electricity generation can reach as high as 556.80 W, accompanied by a significantly improved average generation efficiency of 7.01%.
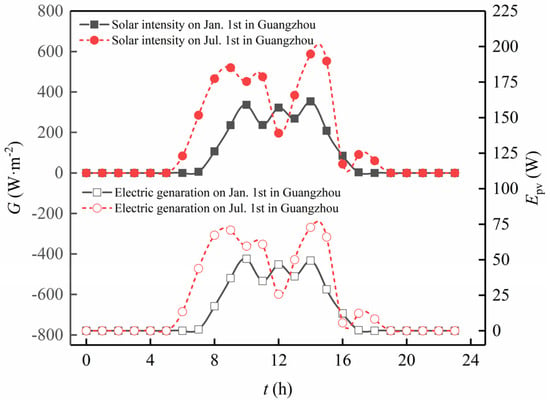
Figure 11.
Dynamic analyses of PV temperature and power generation efficiency.
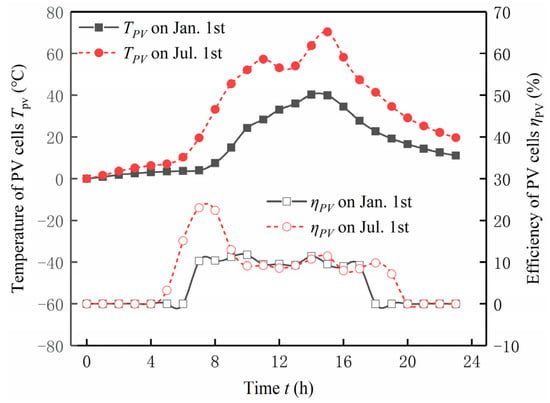
Figure 12.
Dynamic analysis of power generation.
3.4. Analysis on Thermal Comfort
3.4.1. Effect of Relative Humidity
As can be observed from Figure 13, PMV gradually increases with the rise in relative humidity. This is because relative humidity primarily affects the body’s ability to dissipate heat. The higher the relative humidity, the more difficult it becomes for the human body to dissipate heat, leading to a sensation of heat and stuffiness when the relative humidity is excessively high. When the relative humidity changes from 30% to 90%, PMV at a system room temperature of 22 °C increases from −0.42 to −0.03, a rise of 0.38. Similarly, at a system room temperature of 28 °C, PMV increases from 1.1 to 1.65, an increase of 0.54. It can be seen that as the room temperature rises, the impact of relative humidity on the body’s heat dissipation becomes more pronounced, and an excessively high relative humidity can drastically affect indoor thermal comfort.
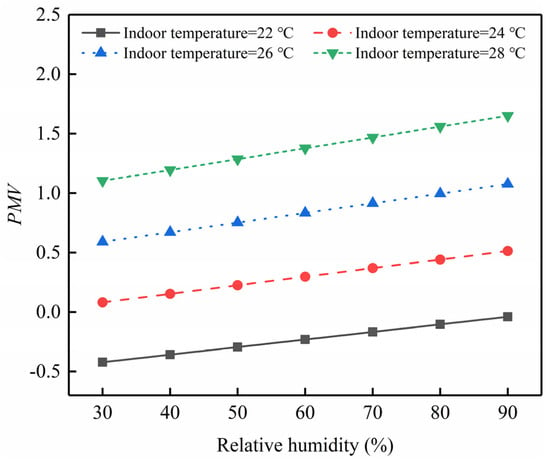
Figure 13.
Effect of relative humidity on PMV when indoor velocity is 0.2 m·s−1.
3.4.2. Effect of Wind Speed
As evident from Figure 14, an increase in indoor air velocity leads to a marked decline in human thermal comfort indicators, showcasing a negative correlation between PMV and air velocity. This phenomenon stems primarily from the fact that air velocity influences the heat transfer coefficient between the human body and the surrounding air, and it also alters the saturated vapor pressure, which, in turn, affects the rate of water evaporation. Higher air velocities facilitate faster evaporation, resulting in increased heat dissipation from the human body. Specifically, when the air velocity shifts from 0.1 m/s to 0.6 m·s⁻−1, PMV at a system room temperature of 22 °C drops from −1.0 to −0.63, indicating a decrease of 0.53. Similarly, at a room temperature of 28 °C, PMV decreases from 1.37 to 1.12, a lesser decrease of 0.25. These findings reveal that as the room temperature diminishes, the influence of air velocity on human heat dissipation intensifies, and excessively high air velocities can drastically deteriorate the indoor thermal comfort environment.
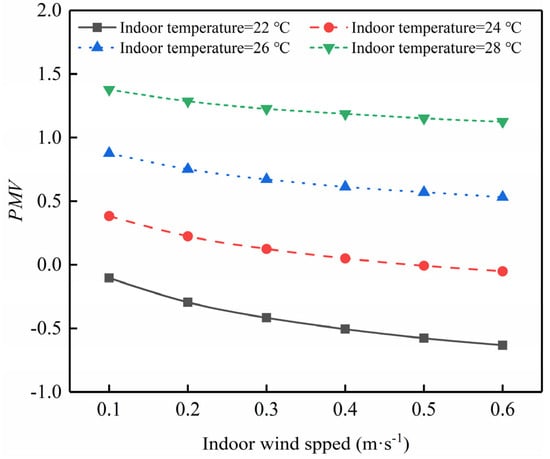
Figure 14.
Effect of indoor velocity on PMV when relative humidity is 50%.
3.4.3. Dynamic Thermal Comfort Performance Analysis in Hot Summer and Warm Winter Regions
The thermal comfort of a system is closely tied to temperature. Figure 15 presents the variations in external radiation and ambient temperature in the environment where the system is located. Meanwhile, Figure 15 illustrates the changes in indoor temperature and thermal comfort during summer and winter in regions with hot summers and warm winters. According to these two figures, in winter, the average temperature difference percentage between the indoor temperature of the Trombe wall with PV system and the outdoor temperature is 5.13%, while in summer, it is 4.81%. Notably, the maximum temperature difference does not exceed 10%, with an average difference of 5%, indicating that the Trombe wall with PV system exhibits excellent insulation and heat preservation capabilities.
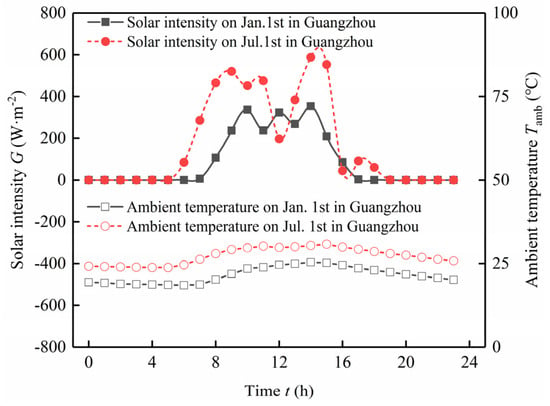
Figure 15.
Dynamic analysis of external thermal environment.
Combining Figure 15 and Figure 16, it can be observed that PMV is positively correlated with indoor ambient temperature; the higher the indoor temperature, the higher the PMV value. The comfortable range for PMV is between −1 and +1, and comfort gradually decreases outside this range. During winter, the PMV indicator is less than −1 from 00:00 to 09:00, and between −1 and 1 from 09:00 to 24:00. In summer, PMV is between 0 and 1 from 00:00 to 07:00, greater than 1 from 07:00 to 20:00, and less than 1 from 20:00 to 24:00. This indicates that during winter, the period of good thermal comfort for humans extends from noon to evening, while in summer, it falls between evening and morning.
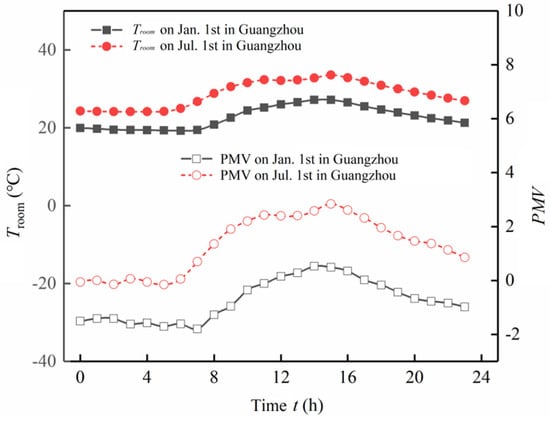
Figure 16.
Dynamic analyses of indoor temperature and PMV.
3.5. Analysis on Energy Efficiency Matching and Economic Evaluation
3.5.1. Analysis of Energy Efficiency Matching
As depicted in Figure 17, which outlines the thermal and electrical performance of the system during winter and summer, the optimal time periods for both human thermal comfort and power generation efficiency are distinctively different between seasons. In winter, the timeframe between 9:00 and 17:00 is characterized by both excellent human thermal comfort and generation efficiency. Conversely, in summer, these favorable conditions coincide with two separate intervals: 5:00 to 8:00 and 17:00 to 20:00.
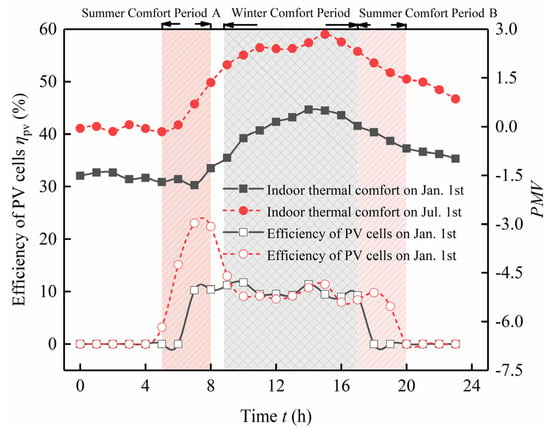
Figure 17.
Thermal and electrical energy efficiency matching results in hot summer and warm winter areas.
3.5.2. Analysis of Economic Evaluation
The economic analysis of the Trombe wall with PV system in this article employs the LCOE model, as exemplified by Equations (11) and (12). By simulating the installation and maintenance costs of PV modules [], while integrating annual environmental data from Guangzhou to calculate the total annual electricity generation, the economic analysis parameters of the system are presented in Table 3. Additionally, a comparison of electricity costs is shown in Table 4. Table 4 reveals that the electricity generated by the Trombe wall with PV system is 25% cheaper than residential electricity tariffs. Specifically, a 1 m2 PV panel can generate 322.5 kWh of electricity annually, leading to a cost savings of CNY 45.15 in electricity bills.

Table 3.
Economic analysis parameters of 1 m2 solar panel.

Table 4.
Comparison for electricity cost price.
4. Experimental Results Discussion
4.1. Analysis of Traditional Trombe Wall
4.1.1. Model Validation
To validate the reliability of the experimental model, a comparative study was conducted between the experimentally measured results and the numerical simulation outcomes of a Trombe wall model with the same structure and materials as the experimental model. Simulation and experimental data plots are drawn from the data, as shown in Figure 18.
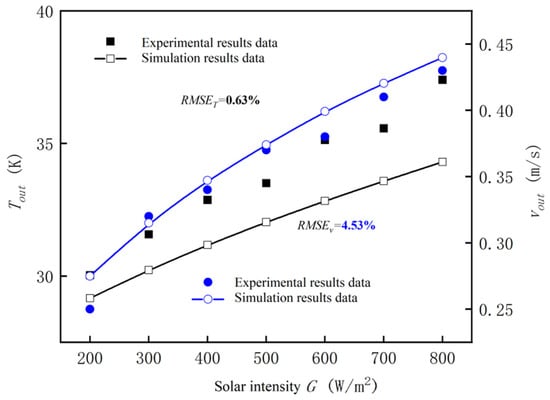
Figure 18.
Comparison of simulation and experimental data error.
As can be seen from Figure 18, the difference between the experimental outlet temperature and the simulated outlet temperature is no more than 5 °C, and the difference between the experimental outlet velocity and the simulated result is no more than 0.05 m/s. The temperature error rate is only 0.63%, and the velocity error rate is only 4.53%, both of which are within 5%. Therefore, the experimental data exhibit good credibility and accuracy.
4.1.2. Effect of Solar Intensity
As depicted in Figure 19, which illustrates the relationship between solar intensity and the near-wall temperature of the collector plate, the temperatures at all measurement points rise concurrently with the increase in solar intensity. Specifically, the temperatures at points 1, 2, and 3 are higher than those at points 4, 5, and 6, which in turn are higher than those at points 7, 8, and 9. This phenomenon is attributed to the principle of thermal pressure, resulting in higher temperatures on the upper side compared to the lower side. The minimum temperature difference between the topmost and bottommost points is 3.63 °C, while the maximum temperature difference reaches 6.17 °C. After the system is activated, the collector wall absorbs a significant portion of solar energy. Initially, convection is relatively weak, and heat transfer primarily occurs through conduction on the wall surface. Since the wall temperature exceeds the air temperature, a vertical boundary layer forms. Over time, the boundary layer ascends, with its temperature gradually increasing, ultimately contributing to the trend of higher temperatures on the upper side compared to the lower side.
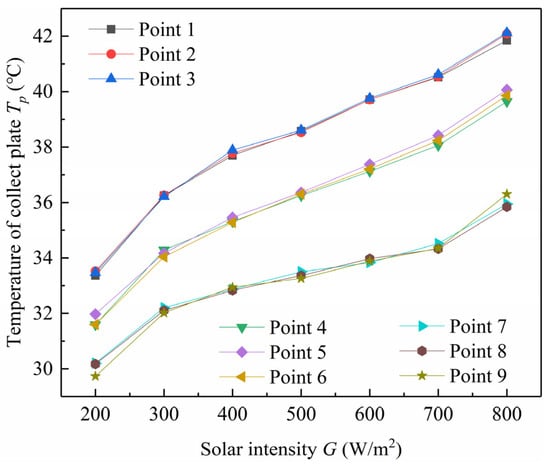
Figure 19.
Temperature of collector plate.
As shown in Figure 20, which depicts the solar intensity, ambient temperature, and inlet/outlet temperatures, it can be observed that as the light intensity increases, the ambient temperature remains unaffected. The temperature at the outlet of the flow channel is higher than that at the inlet, indicating that the Trombe wall effectively heats the interior air. Since this study focuses on vertical channel flow, the inlet temperature gradually rises with increasing light intensity, not exactly matching the ideal room temperature but remaining close to it. Due to the proportional scaling down of the model, its impact on indoor temperature is minimal, hence the ambient temperature remains largely unchanged. The outlet temperature, on the other hand, increases as the system absorbs more solar energy.
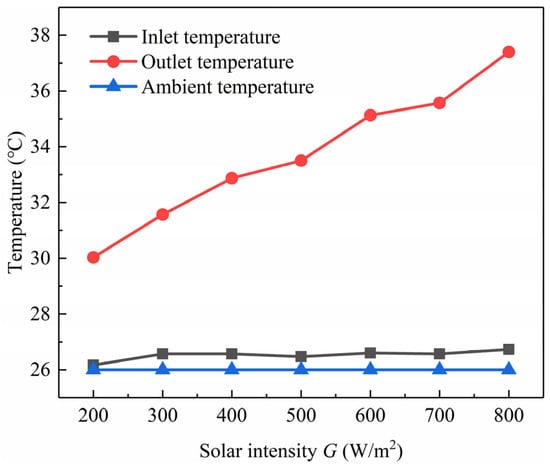
Figure 20.
Ambient, inlet, and outlet temperature under different solar intensities.
As illustrated in Figure 21, which depicts the relationship between light intensity and inlet/outlet air velocities, it can be seen that as the light intensity increases, the thermal effect of the Trombe wall enhances, resulting in an increase in both inlet and outlet air velocities. Notably, the inlet air velocity is higher than the outlet velocity, indicating the presence of air leakage in the experiment, which introduces a certain degree of error. With the increase in solar intensity, the flow efficiency within the Trombe wall improves, leading to an enhancement in the convective heat transfer efficiency.
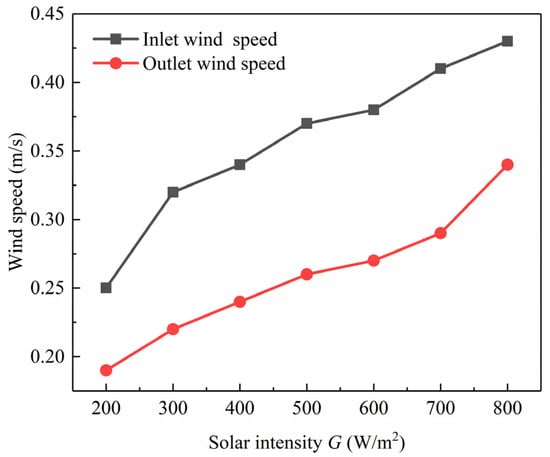
Figure 21.
Inlet/outlet wind speed under different light intensities.
4.1.3. Effect of Inlet Wind Speed
Based on the analysis of Figure 22, which presents the relationship between mechanical ventilation stimulation and the near-wall temperature of the collector plate, it can be concluded that as the mechanical ventilation stimulation increases, the temperature initially rises and then decreases. The temperature ceases to rise at a ventilation rate of 0.2 m/s and begins to drop when the mechanical stimulation exceeds 0.3 m/s. Due to the principle of thermal buoyancy, the temperature remains higher on the upper side compared to the lower side. The lower side, being closer to the fan, experiences a slight temperature drop. Without any mechanical stimulation, the inlet air velocity ranges from 0.2 m/s to 0.3 m/s. When the stimulation falls within this range, the overall thermal efficiency of the system improves. Once the threshold is reached, the thermal efficiency remains relatively constant, and beyond this range, the system temperature decreases, leading to a decline in thermal efficiency.
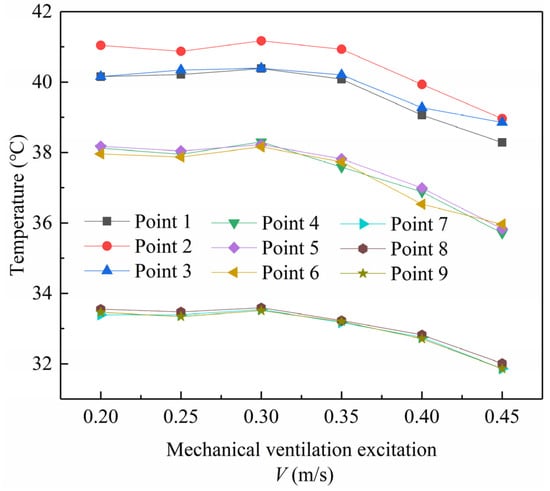
Figure 22.
Temperature of collector plate under different mechanical ventilation excitations.
In the absence of a fan, air flow is driven by the siphon effect caused by buoyancy, a form of natural convection. However, upon installing a fan, the air flow transitions to forced convection. Prior to reaching the maximum natural convection velocity of 0.3 m/s without a fan, the addition of the fan enhances the thermal performance of the system. Beyond 0.3 m/s, the fan accelerates the air circulation within the system, leading to the cooling of the system and subsequently reducing its thermal efficiency.
As evident from Figure 23, which illustrates the relationship between ventilation stimulation, ambient temperature, and inlet/outlet temperatures, when the mechanical stimulation is below 0.2 m/s, the inlet temperature begins to decrease due to the presence of the fan, while the outlet temperature starts to rise. This results in an increase in the internal circulation temperature and enhances the heat collection efficiency of the Trombe wall. Within the range of 0.2 m/s to 0.3 m/s, the system reaches a peak steady state. However, when the stimulation exceeds 0.3 m/s, the thermal efficiency of the system decreases, and the outlet temperature drops.
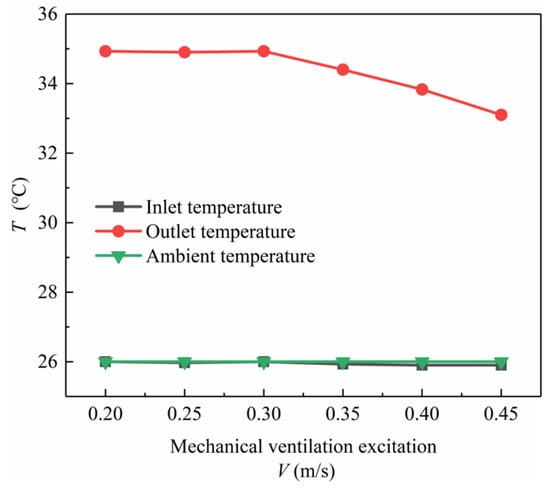
Figure 23.
Ambient/inlet/outlet temperature under different mechanical ventilation incentives.
The inlet temperature of the system, under the influence of the fan, closely approaches the ambient temperature when the fan speed exceeds 0.2 m/s. When the fan speed is below the optimal system velocity, it accelerates air circulation, allowing more heat to be carried into the interior, resulting in an increase in the outlet temperature of the flow channel. Conversely, when the fan speed surpasses the optimal system velocity, it acts as a cooling mechanism. At this point, the internal air velocity within the system increases, causing the incoming air to be inadequately heated, thereby reducing the indoor temperature and the outlet temperature of the flow channel. This, in turn, decreases the overall thermal efficiency of the system. Therefore, incorporating a fan that aligns with the inherent heating capabilities of the system is crucial to enhancing its efficiency. Excessively high fan stimulation can have an adverse effect, counteracting the intended benefits.
As depicted in Figure 24, which illustrates the relationship between ventilation stimulation and inlet/outlet air velocities, it is evident that as the ventilation stimulation increases, both inlet and outlet air velocities also increase. When the stimulation is less than 0.2 m/s, the increase in inlet and outlet velocities is gradual. However, once the stimulation exceeds 0.2 m/s, the velocities increase rapidly. At this point, the inlet and outlet air velocities are influenced by both the Trombe wall and the fan, leading to a decrease in the thermal performance of the wall. The air circulation within the wall is a combination of the effects of the fan and the Trombe wall operating without a fan. Considering the temperature dynamics, a ventilation stimulation of 0.3 m/s appears to be the optimal level for the system to achieve maximum working efficiency. Subsequently, the inlet and outlet air velocities are determined by the combined effects of both the Trombe wall and the fan, with the fan having a more significant influence.
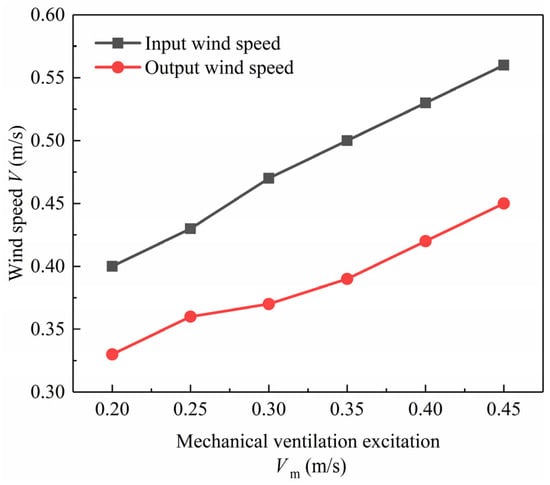
Figure 24.
Wind speed of inlet/outlet under different mechanical ventilation incentives.
4.2. Analysis of PV—Trombe Wall
As can be observed from Figure 25, with the increase in the coverage rate of PV panels, the temperatures at various monitoring points decrease. Based on practical scenarios, when the number of PV panels is two, the temperature at monitoring points (7, 8, 9) drops the fastest. Similarly, when the number of PV panels reaches four, the temperature at points (4, 5, 6) declines most rapidly, and when there are six PV panels, the temperature at points (1, 2, 3) experiences the sharpest decline. These observations align with practical expectations, yet the temperatures do not ultimately drop to room temperature due to the PV coverage rate not reaching 100%. This phenomenon can be explained by the fact that as the coverage rate increases, less solar energy penetrates through the cover plates, resulting in reduced solar energy being collected by the heat-collecting wall surface. Since the majority of heat in the flow channel originates from the solar energy collected by this wall surface, the air temperature within the flow channel decreases, giving the image an overall downward trend. Additionally, when the coverage rate is insufficient, the upper part of the system collects more solar energy than the lower part, leading to heat transfer through thermal conduction towards the lower regions. This differential heat transfer explains the varying rates of temperature decline observed at different monitoring points.
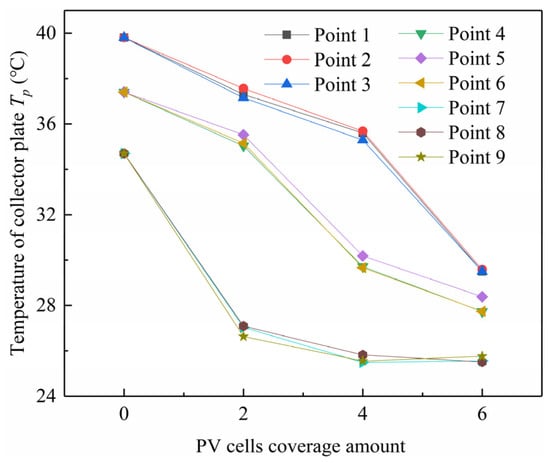
Figure 25.
Temperature of collector plate under different PV panel coverage amounts.
It can be seen that in Figure 26a,b, with the increase in the PV panel coverage rate, both the inlet and outlet air velocities and temperatures decrease, leading to a reduction in thermal efficiency. This is because as the PV panel coverage increases, the amount of solar energy collected by the system decreases, resulting in a drop in the temperature within the air flow channel. Consequently, the outlet temperature decreases vertically, and less heat is transferred into the indoor environment through convection and conduction, causing a reduction in room temperature. Simultaneously, as the system collects less solar energy, the air temperature within the flow channel decreases, diminishing the system’s thermal performance. This, in turn, leads to a lower efficiency in heating the incoming air, resulting in smaller inlet and outlet air velocities and reduced airflow. Overall, this translates into a decrease in the overall thermal efficiency of the system.
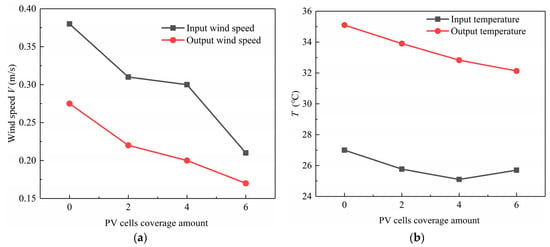
Figure 26.
(a) Wind speed of inlet/outlet under different PV cell coverage amounts. (b) Temperature of inlet/outlet under different PV cell coverage amounts.
As can be seen from Figure 27, with the increase in the PV panel coverage rate, both voltage and current increase, resulting in an enhancement in power generation. This is due to the fact that as more PV panels are added, the solar energy incident on these panels is converted into both electrical and thermal energy, leading to an upward trend in voltage and current. The solar energy that passes through the cover plates ultimately transfers heat to the indoors through conduction, convection, and radiation. However, as the number of PV panels increases, less solar energy penetrates through the cover plates, causing a decrease in the temperature of the heat-collecting wall surface and subsequently reducing the amount of heat that can be transferred into the indoors.
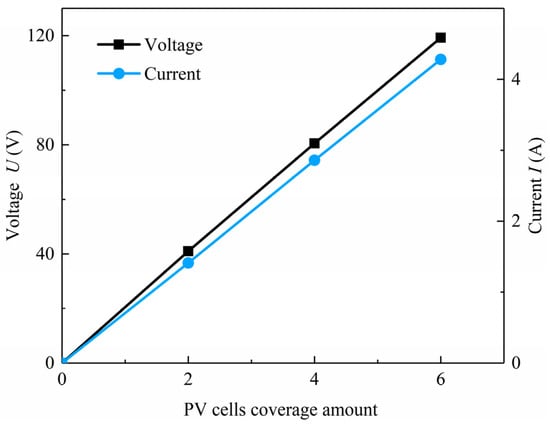
Figure 27.
Voltage and current under different PV cell coverage amounts.
The PV panel coverage rates of zero, two, four, and six panels are, respectively, 0%, 26.04%, 52.08%, and 78.12%. As the PV panel coverage rate rises, the total power generation increases, but the thermal efficiency decreases, significantly impacting temperature while the change in power generation efficiency remains relatively small.
Although the main structural parameters and physical characteristics of the PV—Trombe wall have been taken into account during the modeling process, some details may still be simplified. For example, the material properties of glass panels, solar panels, and thermal storage walls and fluctuations in ambient temperature and wind speed may be affected by a number of factors that may not be fully reflected in the model. Meanwhile, the assessment of power generation efficiency and thermal comfort in this paper is based on specific time periods and climatic conditions, but in practice these conditions may vary with season, weather, and building usage. Therefore, long-term, multi-point field testing may be more accurate to reflect the actual performance of the PV—Trombe wall. To sum up, some achievements have been made in the research of the efficiency matching and potential application of the PV—Trombe wall, but there are still some experimental limitations. The future research can further improve the accuracy and practicability of the research by expanding the experimental area and data range, improving the experimental model and parameters, strengthening the long-term practical test, evaluating the economic benefit in detail, and considering more influencing factors comprehensively.
5. Conclusions
This article continues the existing research on PV—Trombe walls, exploring their power generation performance and thermal comfort in regions with hot summers and warm winters. The most optimal electrical and thermal coefficients are subsequently evaluated upon analyzing pivotal parameters, including the PV cell coverage rate, airflow channel height, relative humidity, and indoor wind speed. Additionally, a dynamic analysis of the energy efficiency matching of PV envelope structures is conducted, along with an assessment of the system’s economic benefits. Furthermore, this article primarily adopts an experimental approach to investigate the thermal performance of both a traditional Trombe wall and a PV—Trombe wall by setting different solar intensity levels and inlet ventilation modes. Through relevant research, the following conclusions are drawn:
- (1)
- Under a light intensity of 600 W/m2, the thermal performance of a conventional Trombe wall attains its peak at a mechanical ventilation rate of 0.3 m/s, marked by peak internal air and heat-collecting wall temperatures. Below 0.2 m/s, augmentation in wind speed enhances performance; however, surpassing 0.3 m/s leads to a decline, reducing both wall and air temperatures despite increasing ventilation stimulus.
- (2)
- In the context of PV—Trombe walls, an increase in the PV panel coverage rate within the external system correlates with a decline in photoelectric conversion efficiency, yet total power generation escalates. This phenomenon is accompanied by diminished thermal efficiency and pronounced temperature fluctuations, albeit with marginal impacts on power generation efficiency. Optimum system efficiency (52.08% coverage) coexists with minimum thermal efficiency and maximum power output (510.3 W) at 78.12% coverage, necessitating a careful balance to optimize performance. When the PV coverage is moderate, the system can make more efficient use of solar energy for photovoltaic conversion, while avoiding a too high or too low indoor temperature, thus improving overall energy efficiency and living comfort.
- (3)
- Elevated PV coverage rates foster augmented power generation without compromising electrical efficiency. Conversely, thermal efficiency diminishes, yet the overall photoelectric and photothermal efficiencies are enhanced. The total system output undergoes a substantial 48.8% surge, from 3.87 kWh at 20% coverage to 5.76 kWh at full (100%) coverage. Additionally, augmenting the airflow channel height diminishes solar cell power generation, slightly impairing electrical performance, yet markedly enhances indoor heat gain and the comprehensive utilization of solar energy. Specifically, the total system output increases by 14.58%, from 9.94 kWh at 0.75 m to 11.39 kWh at 2 m.
- (4)
- As relative humidity escalates, the Predicted Mean Vote (PMV) of the system intensifies, particularly with rising room temperatures, progressing from 0.38 at 22 °C to 0.54 at 28 °C. This amplification exacerbates the influence on human heat dissipation, significantly compromising thermal comfort. Conversely, heightened air velocities lead to PMV reduction, improving from −1.0 to −0.63. Furthermore, at lower room temperatures, the impact of air velocity on human heat dissipation intensifies, notably influencing indoor thermal comfort levels.
- (5)
- Optimal timeframes for both human thermal comfort and efficient power generation are identified as 9:00 to 17:00 in winter and 5:00–8:00 and 17:00–20:00 in summer. When employing a PV—Trombe wall system with a 2 m air channel height, the power supply cost is 25% lower than residential electricity tariffs. Each square meter of solar panel annually generates up to 322.5 kWh of electricity, translating into an annual electricity bill savings of USD 6.35 compared to residential tiered pricing.
Author Contributions
Conceptualization, Q.G.; Methodology, Q.G.; Software, L.Y.; Validation, Z.S.; Investigation, L.Y. and D.G.; Data curation, J.H.; Writing—original draft, Q.G.; Writing—review & editing, Z.S. and Y.C.; Visualization, Y.H.; Supervision, Y.C. All authors have read and agreed to the published version of the manuscript.
Funding
The present research has been financially supported by the Science and Technology Project Funding from China Southern Power Grid Corporation (Grant. No. GDKJXM20230248 (030100KC23020019)), Guangdong Basic and Applied Basic Research Foundation (Grant No. 2023A1515010681), Fundamental Research Funds for the Central Universities (Grant No. 21622417) and Special Projects in Key Fields of Guangdong Universities (2022ZDZX1005).
Data Availability Statement
The data that support the findings of this study are available on request from the corresponding author, upon reasonable request.
Conflicts of Interest
Authors Qiang Gao, Lanqian Yang and Dade Gu were employed by the company Guangzhou Power Supply Bureau Co., Ltd. The remaining authors declare that the research was conducted in the absence of any commercial or financial relationships that could be construed as a potential conflict of interest. The authors declare that they have no known competing financial interests or personal relationships that could have appeared to influence the work reported in this paper. Qiang Gao, Lanqian Yang, Dade Gu are employees of China Southern Power Grid Corporation, who provided funding and teachnical support for the work. The funder had no role in the design of the study; in the collection, analysis, or interpretation of data, in the writing of the manuscript, or in the decision to publish the results.
Nomenclature
| Scheme | Tb | temperature of the aluminum heat sink, °C | |
| APW | the area of PV cell, m2 | Te | ambient temperature, °C |
| cW | the specific heat capacity of the massive wall, J·(kg·K)−1 | Tg | glass cover surface temperature, °C |
| D | depth, m | Tp | temperature of the encapsulated aluminum plate, °C |
| EPV | the electrical energy output of PV panel | TPV | solar panel surface temperature, °C |
| fcl | the ratio of the area of the clothed body to the area of the uncovered body | Troom | the indoor temperature, °C |
| G | solar radiation, W·m−2 | Tw | temperature of the heat storage wall, °C |
| h | height, m | W | the radiant power, W·m−2 |
| ha,w | the convective heat transfer coefficients between the air and the massive wall, W·(m2·K)−1 | Abbreviation | |
| hcl | the convection heat transfer coefficient of the clothing surface | LCOE | Levelized Cost of Energy |
| he | the PV conversion efficiency | PMV | Prediction Mean Vote |
| hg,amb | mixed heat transfer coefficients, W·(m2·K)−1 | PV | Photovoltaic |
| hp,a | the convective heat transfer coefficients between the air in the flow channel, W·(m2·K)−1 | TW | Trombe wall |
| hr_g,pv | radiative heat transfer coefficient between the glass cover and the PV panel, W·(m2·K)−1 | Greek symbols | |
| M | the metabolic rate, W·m−2 | δg | Thickness of layer, m |
| Nug,pv | the Nusselt number | σ | Boltzmann constant |
| pa | the partial pressure of water vapor in the air | ε | emissivity |
| RPV | the resistance of the packaged solar panel, clo | α′PV | the effective absorption rate of solar cells |
| Ta | temperature of the air within the cha nnel, °C | ζPV | the coverage rate of solar cells |
| ηsta | the standard photoelectric conversion efficiency value of the PV panel | ηPV | The power generation efficiency of solar panels |
| τ | transmittance | AGrass | the area of PV glass plate, m2 |
| ρW | the density of the massive wall, kg·m−3 | ||
References
- Wang, X.; Lu, Y.; Chen, C.; Yi, X.; Cui, H. Total-factor energy efficiency of ten major global energy-consuming countries. J. Environ. Sci. 2024, 137, 41–52. [Google Scholar] [CrossRef] [PubMed]
- United Nations Environment Programme. Global Status Report for Buildings and Constructions; United Nations Environment Programme: Nairobi, Kenya, 2021. [Google Scholar]
- Zhou, S.; Song, M.; Shan, K.; Razaqpur, A.G.; Huang, J.J. Effects of the position and melting point of the PCM layer on the comprehensive thermal performance of a Trombe wall under mixed dry climate. Energy Build. 2024, 307, 113932. [Google Scholar] [CrossRef]
- Sady, H.; Rashidi, S.; Rafee, R. Towards a net-zero-energy building with smart control of Trombe walls, underground air ducts, and optimal microgrid composed of renewable energy systems. Energy 2024, 294, 130703. [Google Scholar] [CrossRef]
- Liu, H.; Tan, Q.; Shi, Y.; Yu, B.; Zhang, M. Enhancing indoor thermal comfort and energy efficiency: A comparative study of RC-PCM Trombe wall performance. Renew. Energy 2024, 227, 120542. [Google Scholar] [CrossRef]
- Jie, J.; Hua, Y.; Gang, P.; Bin, J.; Wei, H. Study of PV-Trombe wall assisted with DC fan. Build. Environ. 2007, 42, 3529–3539. [Google Scholar] [CrossRef]
- Luo, Y.; Zhang, L.; Liu, Z.; Wang, Y.; Meng, F.; Wu, J. Thermal performance evaluation of an active building integrated photovoltaic thermoelectric wall system. Appl. Energy 2016, 177, 25–39. [Google Scholar] [CrossRef]
- Yu, B.; Fan, M.; Gu, T.; Xia, X.; Li, N. The performance analysis of the photo-thermal driven synergetic catalytic PV-Trombe wall. Renew. Energy 2022, 192, 264–278. [Google Scholar] [CrossRef]
- Wang, L.; Zhou, J.; Bisengimana, E.; Ji, Y.; Zhong, W.; Yuan, Y.; Lu, L. Numerical study on the thermal and electrical performance of a novel MCHP PV-Trombe wall system. Energy 2023, 269, 126941. [Google Scholar] [CrossRef]
- Jiang, B.; Ji, J.; Yi, H. The influence of PV coverage ratio on thermal and electrical performance of photovoltaic-Trombe wall. Renew. Energy 2008, 33, 2491–2498. [Google Scholar] [CrossRef]
- Bruno, R.; Bevilacqua, P.; Cirone, D.; Perrella, S.; Rollo, A. A Calibration of the Solar Load Ratio Method to Determine the Heat Gain in PV-Trombe Walls. Energies 2022, 15, 328. [Google Scholar] [CrossRef]
- Xiao, L.; Qin, L.L.; Wu, S.Y. Effect of PV-Trombe wall in the multi-storey building on standard effective temperature (SET)-based indoor thermal comfort. Energy 2023, 263, 125702. [Google Scholar] [CrossRef]
- Ma, Y.; Ji, J.; Sun, W.; Zhao, Z.; Xie, G. Comparative study on the optoelectronic and thermal properties of two types of PV Trombe walls. Acta Energ. Sol. Sin. 2019, 40, 2323–2329. [Google Scholar]
- Lin, Y.; Ji, J.; Lu, X.; Luo, K.; Zhou, F.; Ma, Y. Thermal and electrical behavior of built-middle PV integrated Trombe wall: Experimental and numerical study. Energy 2019, 189, 116173. [Google Scholar] [CrossRef]
- Ramadhan, M.; Naseeb, A. The cost benefit analysis of implementing PV solar system in the state of Kuwait. Renew. Energy 2011, 36, 1272–1276. [Google Scholar] [CrossRef]
- Sun, X.; Lin, Y.; Zhu, Z.; Li, J. Optimized design of a distributed PV system in a building with phase change materials. Appl. Energy 2022, 306, 118010. [Google Scholar] [CrossRef]
Disclaimer/Publisher’s Note: The statements, opinions and data contained in all publications are solely those of the individual author(s) and contributor(s) and not of MDPI and/or the editor(s). MDPI and/or the editor(s) disclaim responsibility for any injury to people or property resulting from any ideas, methods, instructions or products referred to in the content. |
© 2024 by the authors. Licensee MDPI, Basel, Switzerland. This article is an open access article distributed under the terms and conditions of the Creative Commons Attribution (CC BY) license (https://creativecommons.org/licenses/by/4.0/).