Article

Research on the Planning and Design of Med–Small-Sized Hospitals in China Based on Patient Perceived Value in the Context of Healthcare Model Transformation

by
Yunhui Zhu
and
Ying Zhou
*
School of Architecture, Southeast University, No. 2 Sipailou, Nanjing 210096, China
*
Author to whom correspondence should be addressed.
Buildings 2024, 14(9), 2918; https://doi.org/10.3390/buildings14092918
Submission received: 9 August 2024 / Revised: 12 September 2024 / Accepted: 13 September 2024 / Published: 15 September 2024
(This article belongs to the Section Architectural Design, Urban Science, and Real Estate)

Abstract

China’s aging society has led to a major transformation of the healthcare model from traditional therapeutic medical care to life support healthcare. Med–small-sized hospitals (with 20–299 beds) are expected to play a major role in this transition compared to large hospitals. However, hospitals often take 3–5 years or more from design to construction. In order to guide architects in planning and designing for future needs, this study aims to identify the key points of planning and design that can enhance the value of med–small-sized hospitals in terms of functional configuration, spatial environment, etc. In this study, a questionnaire survey was conducted on the perceived value of 600 patients in Nanjing, China. The data were used to construct a structural equation model (SEM) of perceived value for med–small-sized hospitals in China. There are 24 observed variables in six dimensions, including cost value, functional value, social value, cognitive value, patient satisfaction, and patient loyalty. The final SEM indicates that optimizing functional configurations and spatial environment design can significantly increase the value of hospitals, while patients’ willingness to go to the inpatient department is quite low. Finally, based on the survey findings from Nanjing, we proposed four optimization strategies: (1) promoting diversified development and collaboration based on regional characteristics, (2) optimizing functional configurations, (3) maintaining an efficient and concise patient experience, and (4) optimizing the inpatient department.

1. Introduction

With the change in disease spectrum and population structure brought about by China’s economic and social development, people’s healthcare needs have undergone a major adjustment, and the healthcare model is changing from the traditional therapeutic medical treatment to life support healthcare. Compared to large hospitals, med–small-sized hospitals (with 20–299 beds) will play a major role in this transformation, but hospitals often take 3–5 years or more from design to construction. In order to guide architects to make hospital planning and design that meets future needs, this study aims to explore the perceived value of patients to med–small-sized hospitals and identifies the key points of planning and design that can enhance the value of med–small-sized hospitals in terms of functional configuration, spatial environment, etc.
First of all, lifestyle diseases caused by bad lifestyle habits, such as obesity, diabetes, hypertension and hyperlipidemia, are gradually becoming major challenges to global health [1], and China is no exception. Lifestyle diseases can be fundamentally cured mainly by improving living habits [2], so the importance of life support healthcare based on chronic disease treatment, rehabilitation and health guidance will gradually become prominent in the future [3]. Med–small-sized hospitals are the main undertakers of life support healthcare system [4]. Secondly, in China’s healthcare system, large hospitals are generally responsible for the treatment of acute and difficult diseases, while med–small-sized hospitals participate in the treatment of common and frequently occurring diseases, home care, and community healthcare, which main users include the elderly and children. In 2021, the population aged 65 and above in China reached 14.2% and entered the aging society [5]. The increase in the proportion of elderly people has led to a decrease in the demand for acute medical treatment and an increase in the demand for rehabilitation, chronic care, and home care and nursing [6]. With the implementation of the two-child and three-child policies, the proportion of newborns and teenagers has increased, leading to a higher demand for maternal and child healthcare and services [7]. To sum up, med–small-sized hospitals close to residents’ lives and with high accessibility will play an increasingly important role [8]. However, the actual situation in China is that large hospitals are overcrowded and the utilization rate of med–small-sized hospitals is low, and the perceived value is an important indicator of patients’ recognition of policies or environments. Therefore, the author believes that the low perceived value of patients toward med–small-sized hospitals is the main reason why Chinese patients are reluctant to seek treatment in med–small-sized hospitals.
Disease spectrum transformation and demographic aging are common problems faced globally, so there are many experiences in the construction of med–small-sized hospitals that China should learn from. Taking Japan [9], which is similar to China and has entered the super-aged society in advance [10], as an example, after conducting a large number of surveys on patients’ healthcare needs, satisfaction [11], and hospital function evaluation [12], Japanese scholars proposed the slogan “high-quality chronic care makes Japan strong”, expanding the role of chronic hospitals, which should be closely integrated with the local communities [13] and be responsible for all healthcare treatment, except for the highly acute phase, and the important pillar supporting the chronic care system is med–small-sized hospitals [14]. Through the case study of Japanese hospitals, it can be seen that there are many types of med–small-sized hospitals in Japan, with a large outpatient volume, including specialized hospitals that participate in the healthcare division and cooperation system in urban areas with high population density and comprehensive hospitals that provide services from the acute stage and rehabilitation stage to hospice care in areas with low population density. On the other hand, many design studies addressing the diversity of wards were also found [15], such as studies on design strategies for rehabilitation wards, dementia care wards, hospice wards, etc. There is also some research on the impact of technological developments such as telemedicine and patient portals [16] on hospital design. Given that patients around the world perceive different values for med–small-sized hospitals, this affects their visiting behavior and, in turn, their architectural design. Therefore, it is necessary to conduct research on the perceived value among Chinese patients.
The original concept of perceived value is based on consumers’ perception of “what they have received” and “what they have given” from products and services [17,18,19] and was later extended to tourism and geographical studies [20], psychological research [21], transportation policy studies [22], and environmental impact and urban studies [23]. With the introduction of perceived value theory into the field of healthcare research, it provides a broad perspective on patient needs and has even influenced the philosophy of hospital management to a certain extent, meaning that patients, together with all their emotional and social needs, became the focus of hospital management strategy and the basic starting point of architectural design [24].
A space environment is the carrier for healthcare professionals to carry out medical behavior [25], and it is also the main carrier for patients’ perceived value of a hospital. The perceptual experience of patients in the hospital environment is a comprehensive feedback on the spatial function, atmosphere, and overall environmental quality [26]. This perception is comprehensive and multidimensional, involving the layout of the hospital functional space, color, light, sound, smell, and other aspects [27]. These perceptual experiences help us to understand more deeply the interaction between patient and healthcare spatial environment.
Despite the large number of med–small-sized hospitals in China, most of the related studies have been conducted from the perspective of architectural design [28,29], and less studies have been focused on patients’ perceptions. Therefore, based on the theory of perceived value, this study constructs a structural equation model of patients’ perceived value of med–small-sized hospitals, reveals their internal network relationships, and explores the correlation between various types of perceived value dimensions in med–small-sized hospitals and patients’ satisfaction and behavior intention based on loyalty. This paper identifies Chinese patients’ demands for the functional configuration and environmental design of med–small-sized hospitals and focuses on the perceived value elements of life support healthcare facilities. After that, we propose sustainable planning and design strategies for med–small-sized hospitals based on the actual research situation in Nanjing, which will serve as a reference for architects.

2. Research Model and Hypothesis

2.1. SEM

Structural equation modeling (SEM) [30,31] is a statistical method used to estimate the relationships between a set of observed variables, which represent conceptual variables in a statistical model. SEM began to be applied in the social sciences in the 1970s. Compared to first-generation statistical tools like regression models, SEM allows researchers to answer a series of interconnected research questions through simultaneous modeling of multiple constructs in a single, systematic, and comprehensive analysis [32]. Esposito categorized SEM into two types: covariance-based structural equation modeling (SEM-CB) and variance-based partial least squares structural equation modeling (SEM-PLS) [33]. The purpose of this study is to confirm and test the hypothesized model of patient perceived value in med–small-sized hospitals and analyze the relationships between measurement variables and observed variables, as well as the relationships among the observed variables. In addition, there are sufficient samples (300), so the SEM-CB model testing method was employed.
This study utilizes IBM SPSS Analysis of Moment Structures software (AMOS 26.0) to examine the constructed structural equation model. The value orientation of patients toward med–small-sized hospitals is a latent variable that cannot be directly measured [34]; thus, the measurement variables correspond to indicators of different dimensions. By using structural equation modeling, the measurement variables are transformed into observed variables, and the hypothesized relationships between the variables are tested, further explaining the impact of perceived value on patient satisfaction and loyalty.

2.2. Definition of the Dimensions of Perceived Value

Perceived value is a multidimensional variable that reflects an individual’s considerations of their own expectations and emotional needs, as well as their evaluation of the costs and benefits. The interpretation of perceived value varies depending on the context. In previous research literature on perceived value in hospitals, on the one hand, the common measurement dimensions include functional value, emotional value, cost value, social value, health value, economic value [35,36], etc. On the other hand, for the surveyed subjects, which are patients, commonly used measurement dimensions are satisfaction and loyalty. Therefore, when selecting the dimensions of patient perceived value and corresponding variables, after referencing the PERVAL scale [37] and the GLOVAL scale [38], which are commonly used classification scales of perceived value, five initial perceived value measurement dimensions of cost value, functional value, social value, cognitive value, and risk value were selected according to the functional positioning of med–small-sized hospitals in China and the characteristics of the service population.
In this study, functional value refers to the elements that demonstrate the utility of a hospital when it is used or that are perceived to create its value. Cost value is divided into monetary costs and non-monetary costs such as time and effort. Social value refers to the public impact value generated after the establishment of the hospital. Patients’ understanding of the hospital’s welfare policies and their effects on society can alter or deepen their perception of the hospital’s utility. Additionally, the positive effects that the hospital has on society can gain recognition from social groups, further enhancing patients’ acknowledgment of the value of the hospital’s establishment. Cognitive value refers to the subjective judgments made by patients regarding the hospital’s value during or after their healthcare treatment, including emotional experiences. Risk value pertains to the risks associated with medical accidents, environmental safety [39], and physical and mental health that patients may face during the construction and operation of the hospital.

2.3. Model Construction and Research Hypothesis

Perception is the process of perceiving, organizing, and understanding the information received from the environment, which, in turn, causes motivation and drives the individual to take action [40]. The describable and quantifiable dimensions of perceived value can induce subjective cognition and further influence individuals’ loyalty. In reality, perceived value has both direct and indirect effects on patient loyalty. Loyalty, as a complex outcome variable, is not only influenced by perceived value but also involves the mediating effects of variables such as satisfaction. Currently, there have been studies that have established the relationship between patient value, satisfaction, and loyalty [41]. According to the logic that objective evaluation promotes patients’ subjective opinions, the five value dimensions mentioned above can be divided into two categories, and both have direct or indirect effects on satisfaction and loyalty; at the same time, satisfaction also has an impact on loyalty.
In the SEM, all the seven variables in the model belong to potential variables, and there are “causal relationships” and “correlation relationships” among the variables. Therefore, functional value, cost value, and social value are classified as exogenous potential variables, while cognitive value, risk value, satisfaction degree, and behavioral intention are classified as endogenous potential variables, and all possible hypothetical paths between the variables are plotted. The hypothetical model of patient perceived value of med–small-sized hospitals is shown in Figure 1.
Since these seven potential variables cannot be directly observed, previous research experience and literature findings were referred to set up multiple initial observed variables for each potential variable. In order to determine whether the observed variables selected in the study are more applicable to China’s national conditions and the background of healthcare transformation, the authors convened a meeting of a panel of 7 experts on 15 June 2024, including two hospital administrators, two architects, an architecture professor, a doctor, and a head nurse. Seven measurement variables were adopted by means of expert group meetings, while 37 observation variables were collected and identified. These specialists have all been involved in the construction or renovation of med–small-sized hospitals in the past few years. Finally, the measurement variables and observation scale were formed, as shown in Table 1.

3. Research Design

3.1. Research Framework

This work comprehensively employs methods such as literature review, questionnaire survey, field investigation, and other methods to construct a perceived value model for patients in med–small hospitals through structural equation modeling, find out the value factors affecting patients’ satisfaction and loyalty, and reveal their internal network relationships. The research consists of four steps: Stage 1: Construct a hypothetical model through literature review and expert group meetings, including the selection of latent and observed variables and the hypothesized paths of relationships among the variables. Data on the required variables are collected through field observations, interviews, and other methods. Stage 2: Use SPSS 26.0 software to conduct an exploratory factor analysis (EFA) and confirmatory factor analysis to determine the latent dimensions of perceived value variables and complete the dimensional classification. Stage 3: Fit the structural equation model into AMOS 26.0 software and make adjustments until the model fit indices fall within acceptable ranges. Stage 4: Utilize the correlation values to interpret the paths indicated by the model and analyze the value factors affecting patient satisfaction and loyalty. The research framework is illustrated in Figure 2.

3.2. Materials for Research

This work selected 15 med–small-sized hospitals in Nanjing, China, and conducted questionnaire surveys and interviews with patients nearby. Nanjing is located in Eastern China, along the lower reaches of the Yangtze River, with a permanent population of 9.457 million. The total number of healthcare institutions is 814; among which, there are 413 med–small-sized medical hospitals with 20 to 299 beds, accounting for 55.8% of the total. As the capital city of Jiangsu Province, Nanjing’s healthcare resource situation can, to some extent, represent the healthcare level of strong second-tier cities in China. Furthermore, based on the author’s previous research experience, since most med–small-sized hospitals in China are non-profit hospitals, and they face many common issues, which lends a degree of universality to the research findings.
There are many types of med–small-sized hospitals. Taking Nanjing as an example, they can be mainly categorized into community hospitals, general hospitals, and various specialized hospitals. Among these, community hospitals and general hospitals have similar functions and can be grouped together. In the end, according to the proportional distribution of different types of hospitals in Nanjing, we selected 7 community hospitals and 8 specialized hospitals for the research. The specific locations are shown in Table 2.

3.3. Data Collection

A questionnaire was created based on the 37 observational variables in Table 1. For each variable, a five-point Likert scale was employed, following the principle that “the higher the value score of the hospital, the higher the value” (1: strongly disagree, 2: relatively disagree, 3: fair, 4: relatively agree, and 5: strongly agree). Respondents were requested to assess each variable based on the aforementioned levels of agreement. Meanwhile, the questionnaire also collected information on the gender, age, education, and income level of the respondents.
From July to August 2024, a random questionnaire was distributed among patients at 8 med–small-sized specialized hospitals and patients who had received treatment at or near 7 community hospitals in Nanjing, China (Table 2). All included participants gave their oral and written informed consent (all participants were 18 years of age or older), with a total of 600 questionnaires distributed and 375 questionnaires recovered, with a recovery rate of 60%. The study was approved by the ethical committee of IEC for Clinical Research of Zhongda Hospital (the number of ethic approval: 2024ZDSYLL212-P01). After excluding invalid questionnaires, 300 valid questionnaires were obtained, with a validity rate of 80%.
Among the 300 valid questionnaire respondents, 52.3% were male and 47.6% were female, with ages ranging from 18 and 83. Additionally, 48% of the respondents had a university degree or higher. The average income of the respondents belonged to the middle level. Detailed statistics are shown in Table 3.

3.4. Reliability and Validity of EFA

Firstly, the reliability test was conducted for the whole questionnaire. The Cronbach’s α of the 300 questionnaires were calculated by using SPSS 26.0. After the test, the Cronbach’s α of the whole scale was 0.909 (>0.9), indicating a high reliability of the questionnaire, and exploratory factor analysis can be used to proceed to the next step.
During the validity test, the satisfaction evaluation (CS1, CS2, CS3, and CS4) was defined as a fixed dimension and did not participate in the factor analysis. Firstly, the Kaiser–Meyer–Olkin (KMO) and Bartlett’s test of sphericity were conducted using SPSS 26.0, and the results are shown in Table 4. The results show that the KMO coefficient is greater than 0.8, which is highly suitable for a factor analysis, and the numerical result of Bartlett’s test of sphericity is less than 0.05, which passed the significance test [42] (Table 4).
The essential structure among the variables was processed by exploratory factor analysis (EFA) for dimensionality reduction. The information about the remaining 33 indicators was extracted by principal component analysis using SPSS26.0, and the factor load coefficient of each indicator was obtained by varimax rotation. The absolute value of the factor loading coefficient was greater than 0.4, indicating that the indicators were strongly correlated with each other and could be combined into one dimension. The results showed that there were two dimensions composed of a single variable, and thus, their corresponding indicators (FV7 and FV8) were excluded. Meanwhile, the three indicators SV5, PV6, and PV7 did not have clear dimensions, so they were also deleted in order to improve the overall fit of the model.
Six dimensions (with initial eigenvalues greater than 1) were extracted from the remaining 28 indicators, and the cumulative variance contribution rate reached 66.537% (Table 5). Table 6 shows that six dimensions and variables correspond well to each other. The first common factor F1 mainly reflects users’ negative feelings about hospital construction or the process of medical treatment, corresponding to “value at risk”. The second common factor F2 mainly reflects the user’s subjective feelings of medical treatment, corresponding to “cognitive value”. Similarly, F3 corresponds to “functional value”, F4 corresponds to “behavioral intention”, F5 corresponds to “social value”, and F6 corresponds to “cost value”. Subsequently, the adjusted subscales were tested for reliability again, revealing high reliability. Therefore, they are suitable for using structural equation modeling to investigate the relationship between variables.

4. Results

4.1. SEM Validation

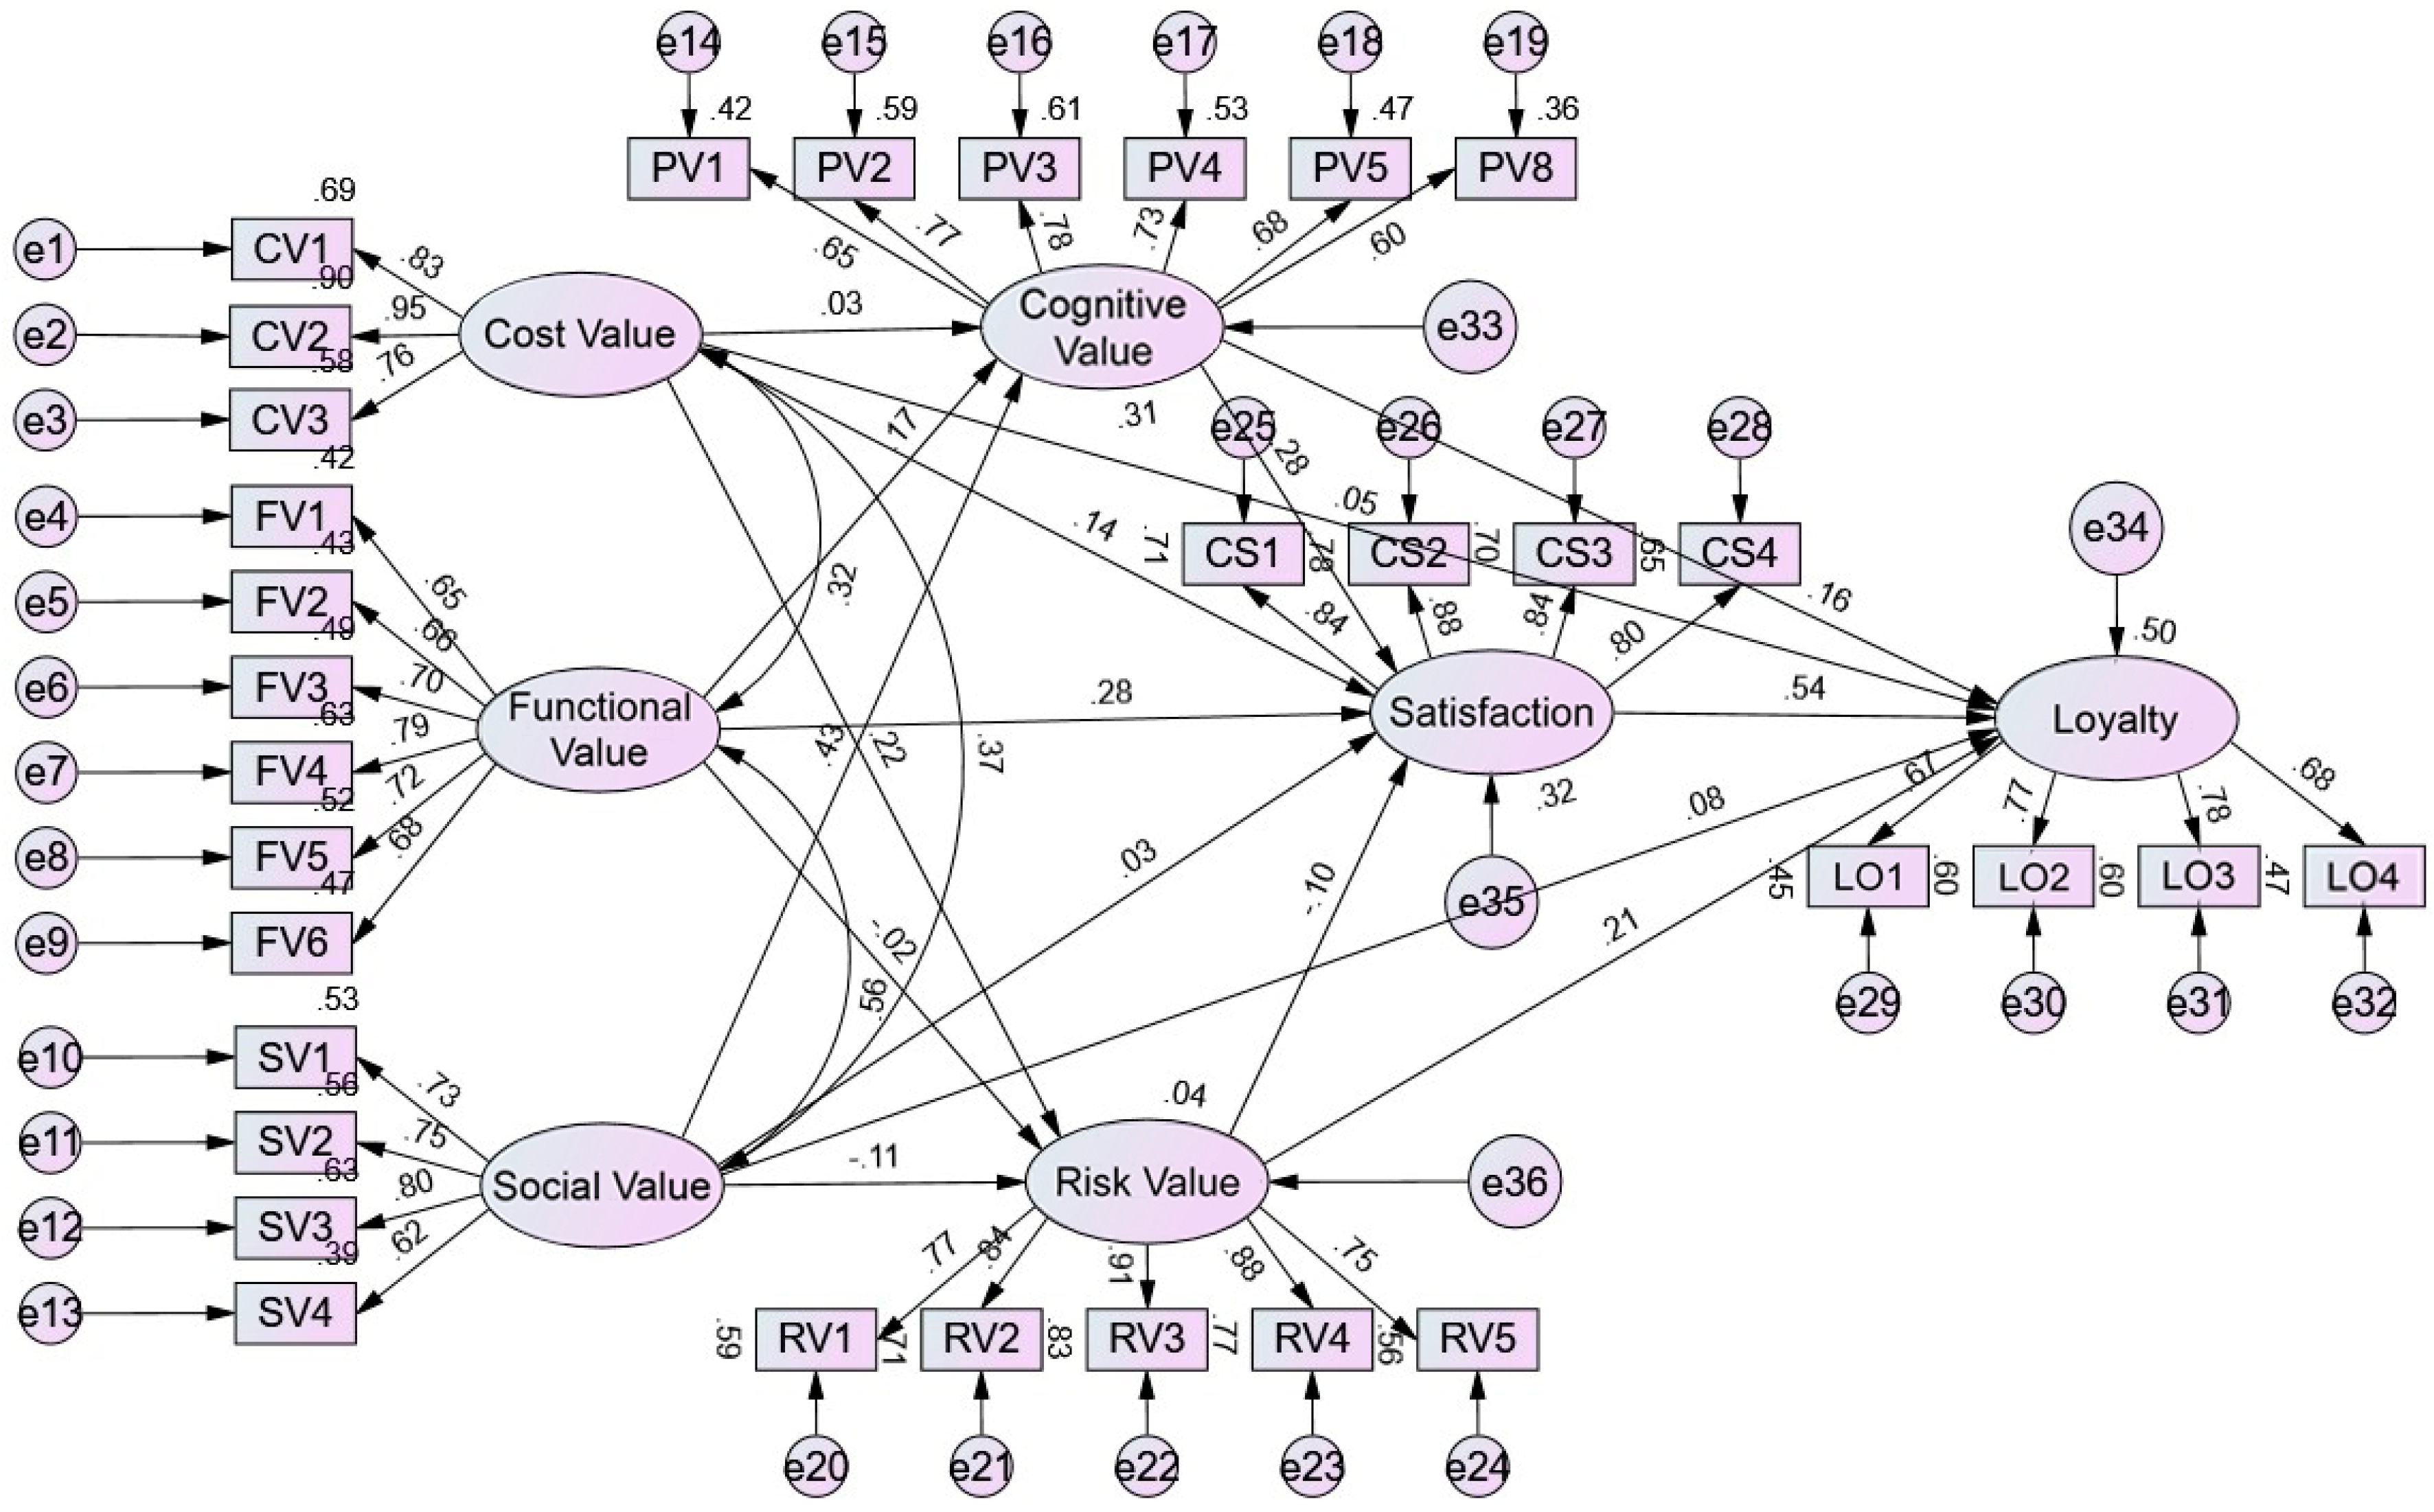
Based on the data processing results mentioned above, AMOS 26.0 software was used to build a structural equation model of patient perceived value of med–small-sized hospitals, and the significance and importance of the model variables and the collinearity of the three exogenous variables were tested by non-standardized calculation and standardized calculation [43,44]. The running results of the model are shown in the Figure 3.
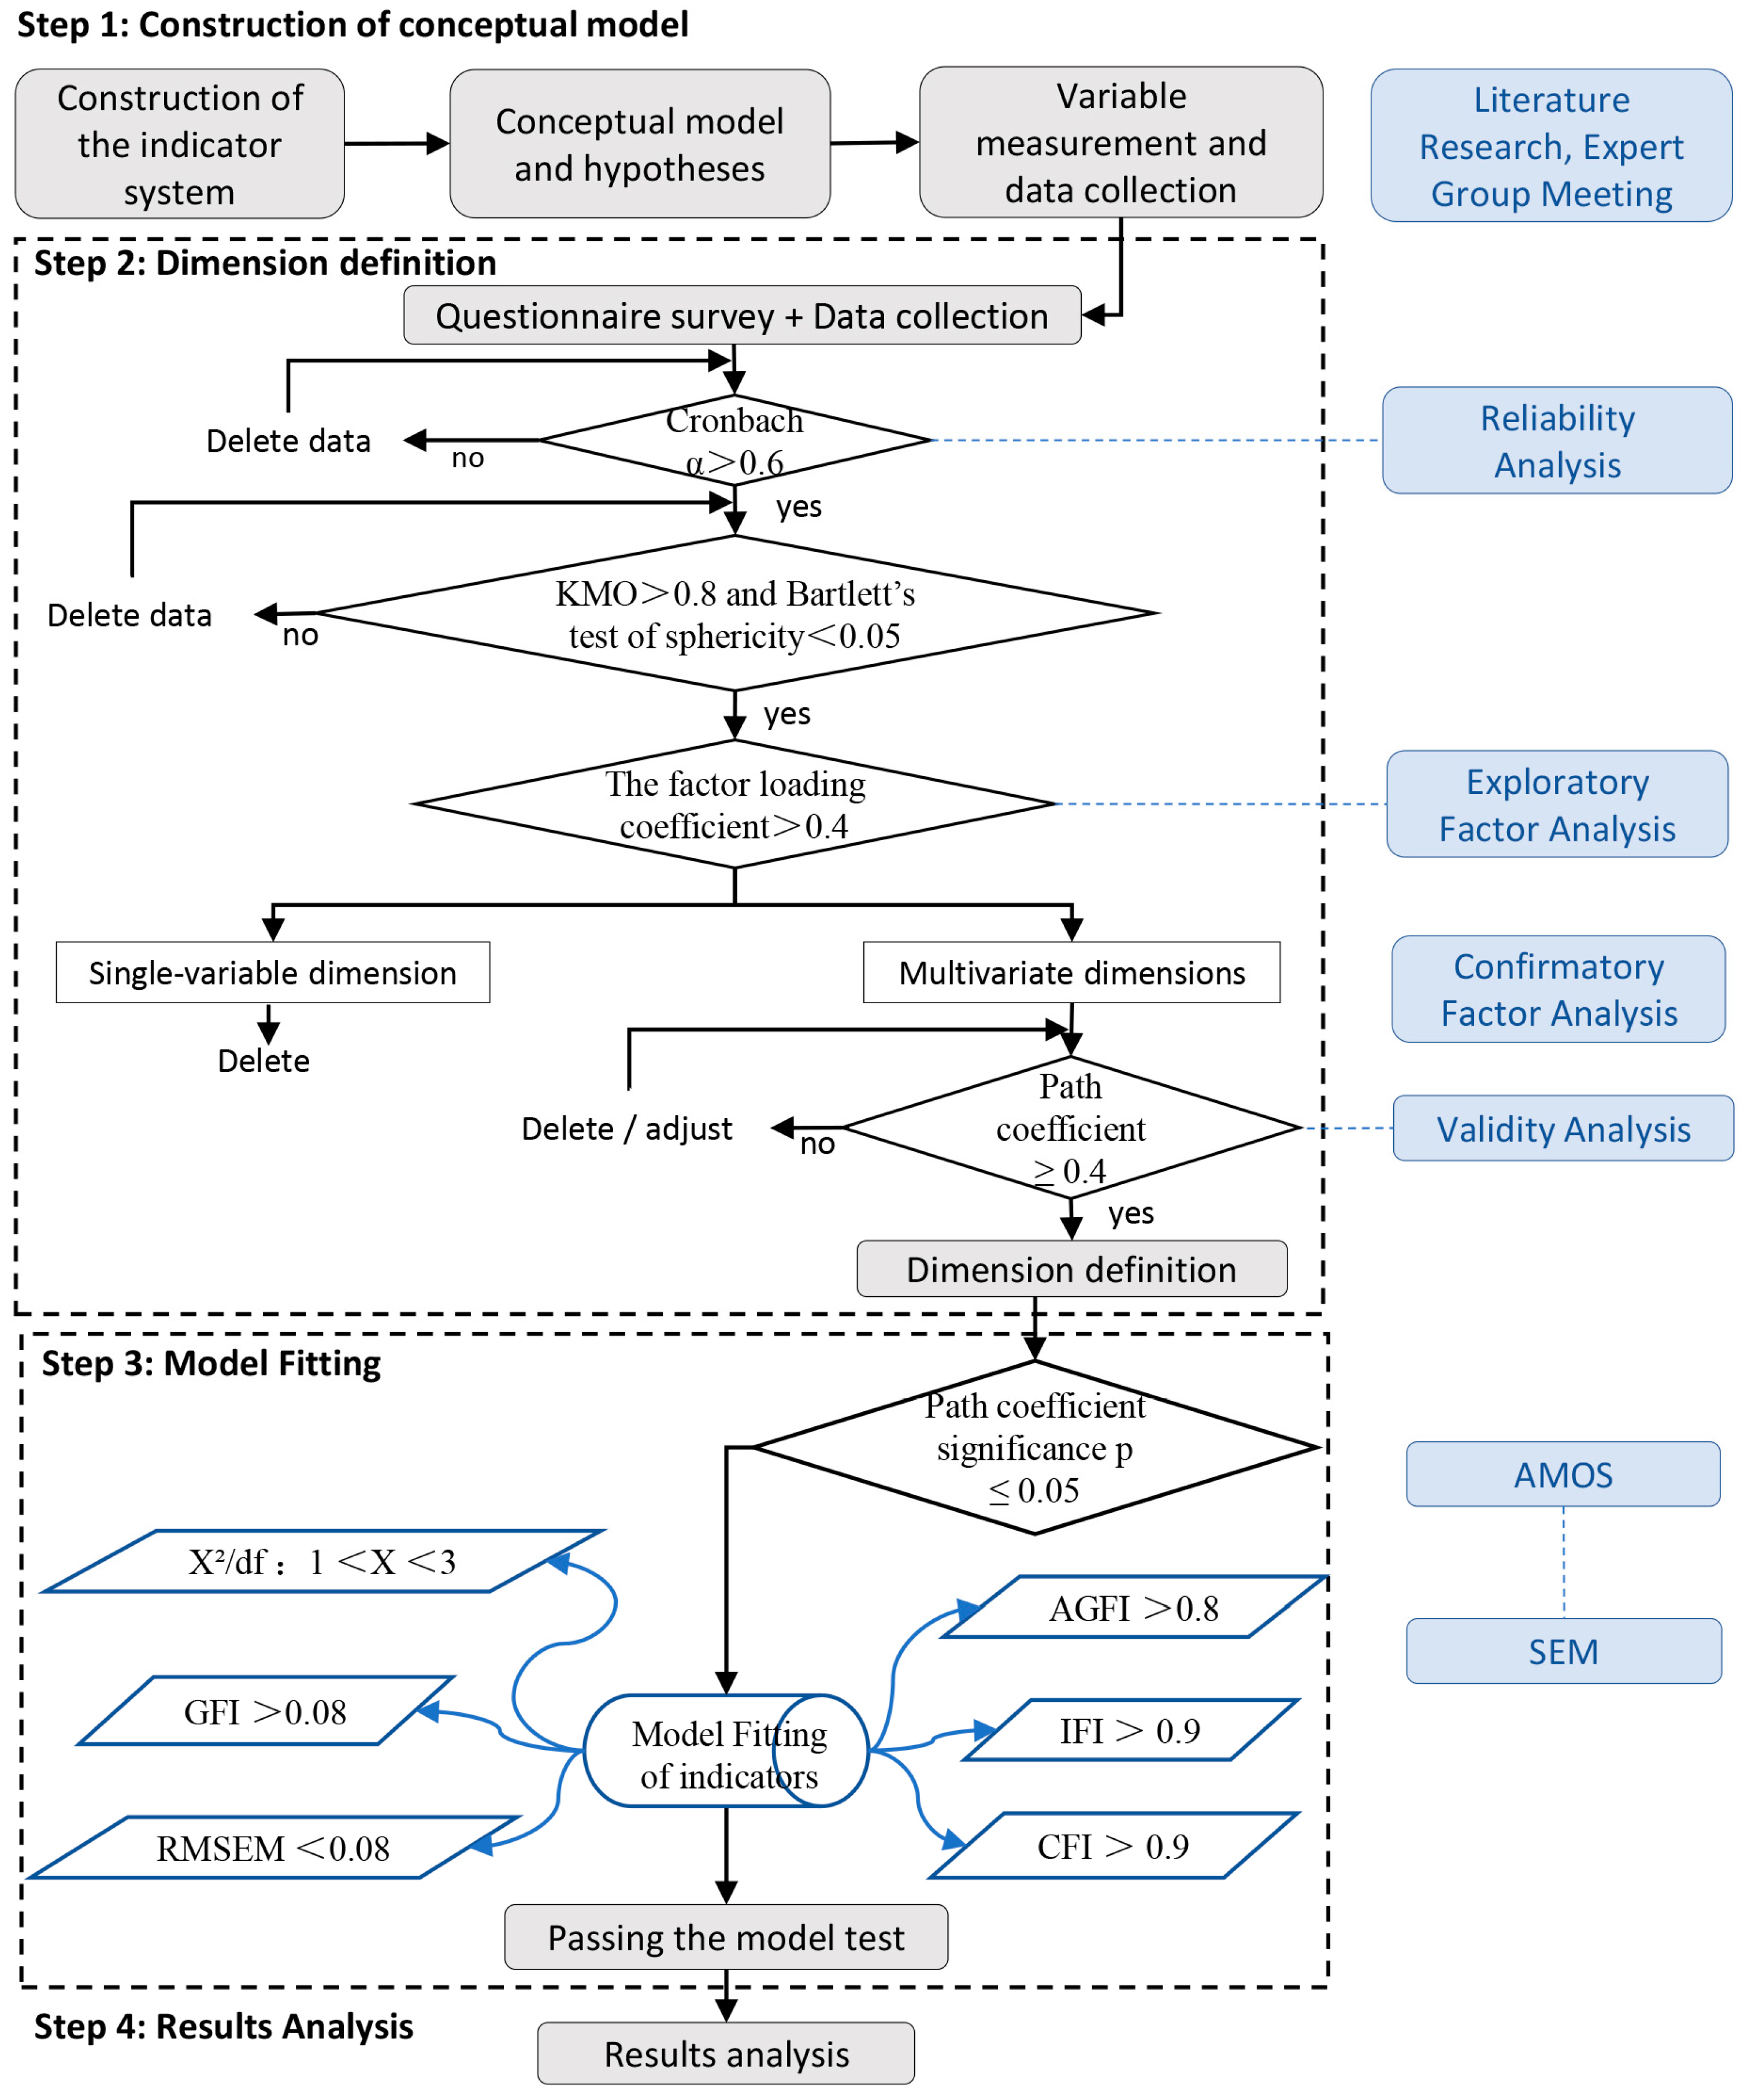
The next step is to perform a goodness-of-fit test, convergent validity, and discriminant validity of the SEM. The initial model (Figure 3) failed to pass the goodness-of-fit test, so the model was modified until the final model (
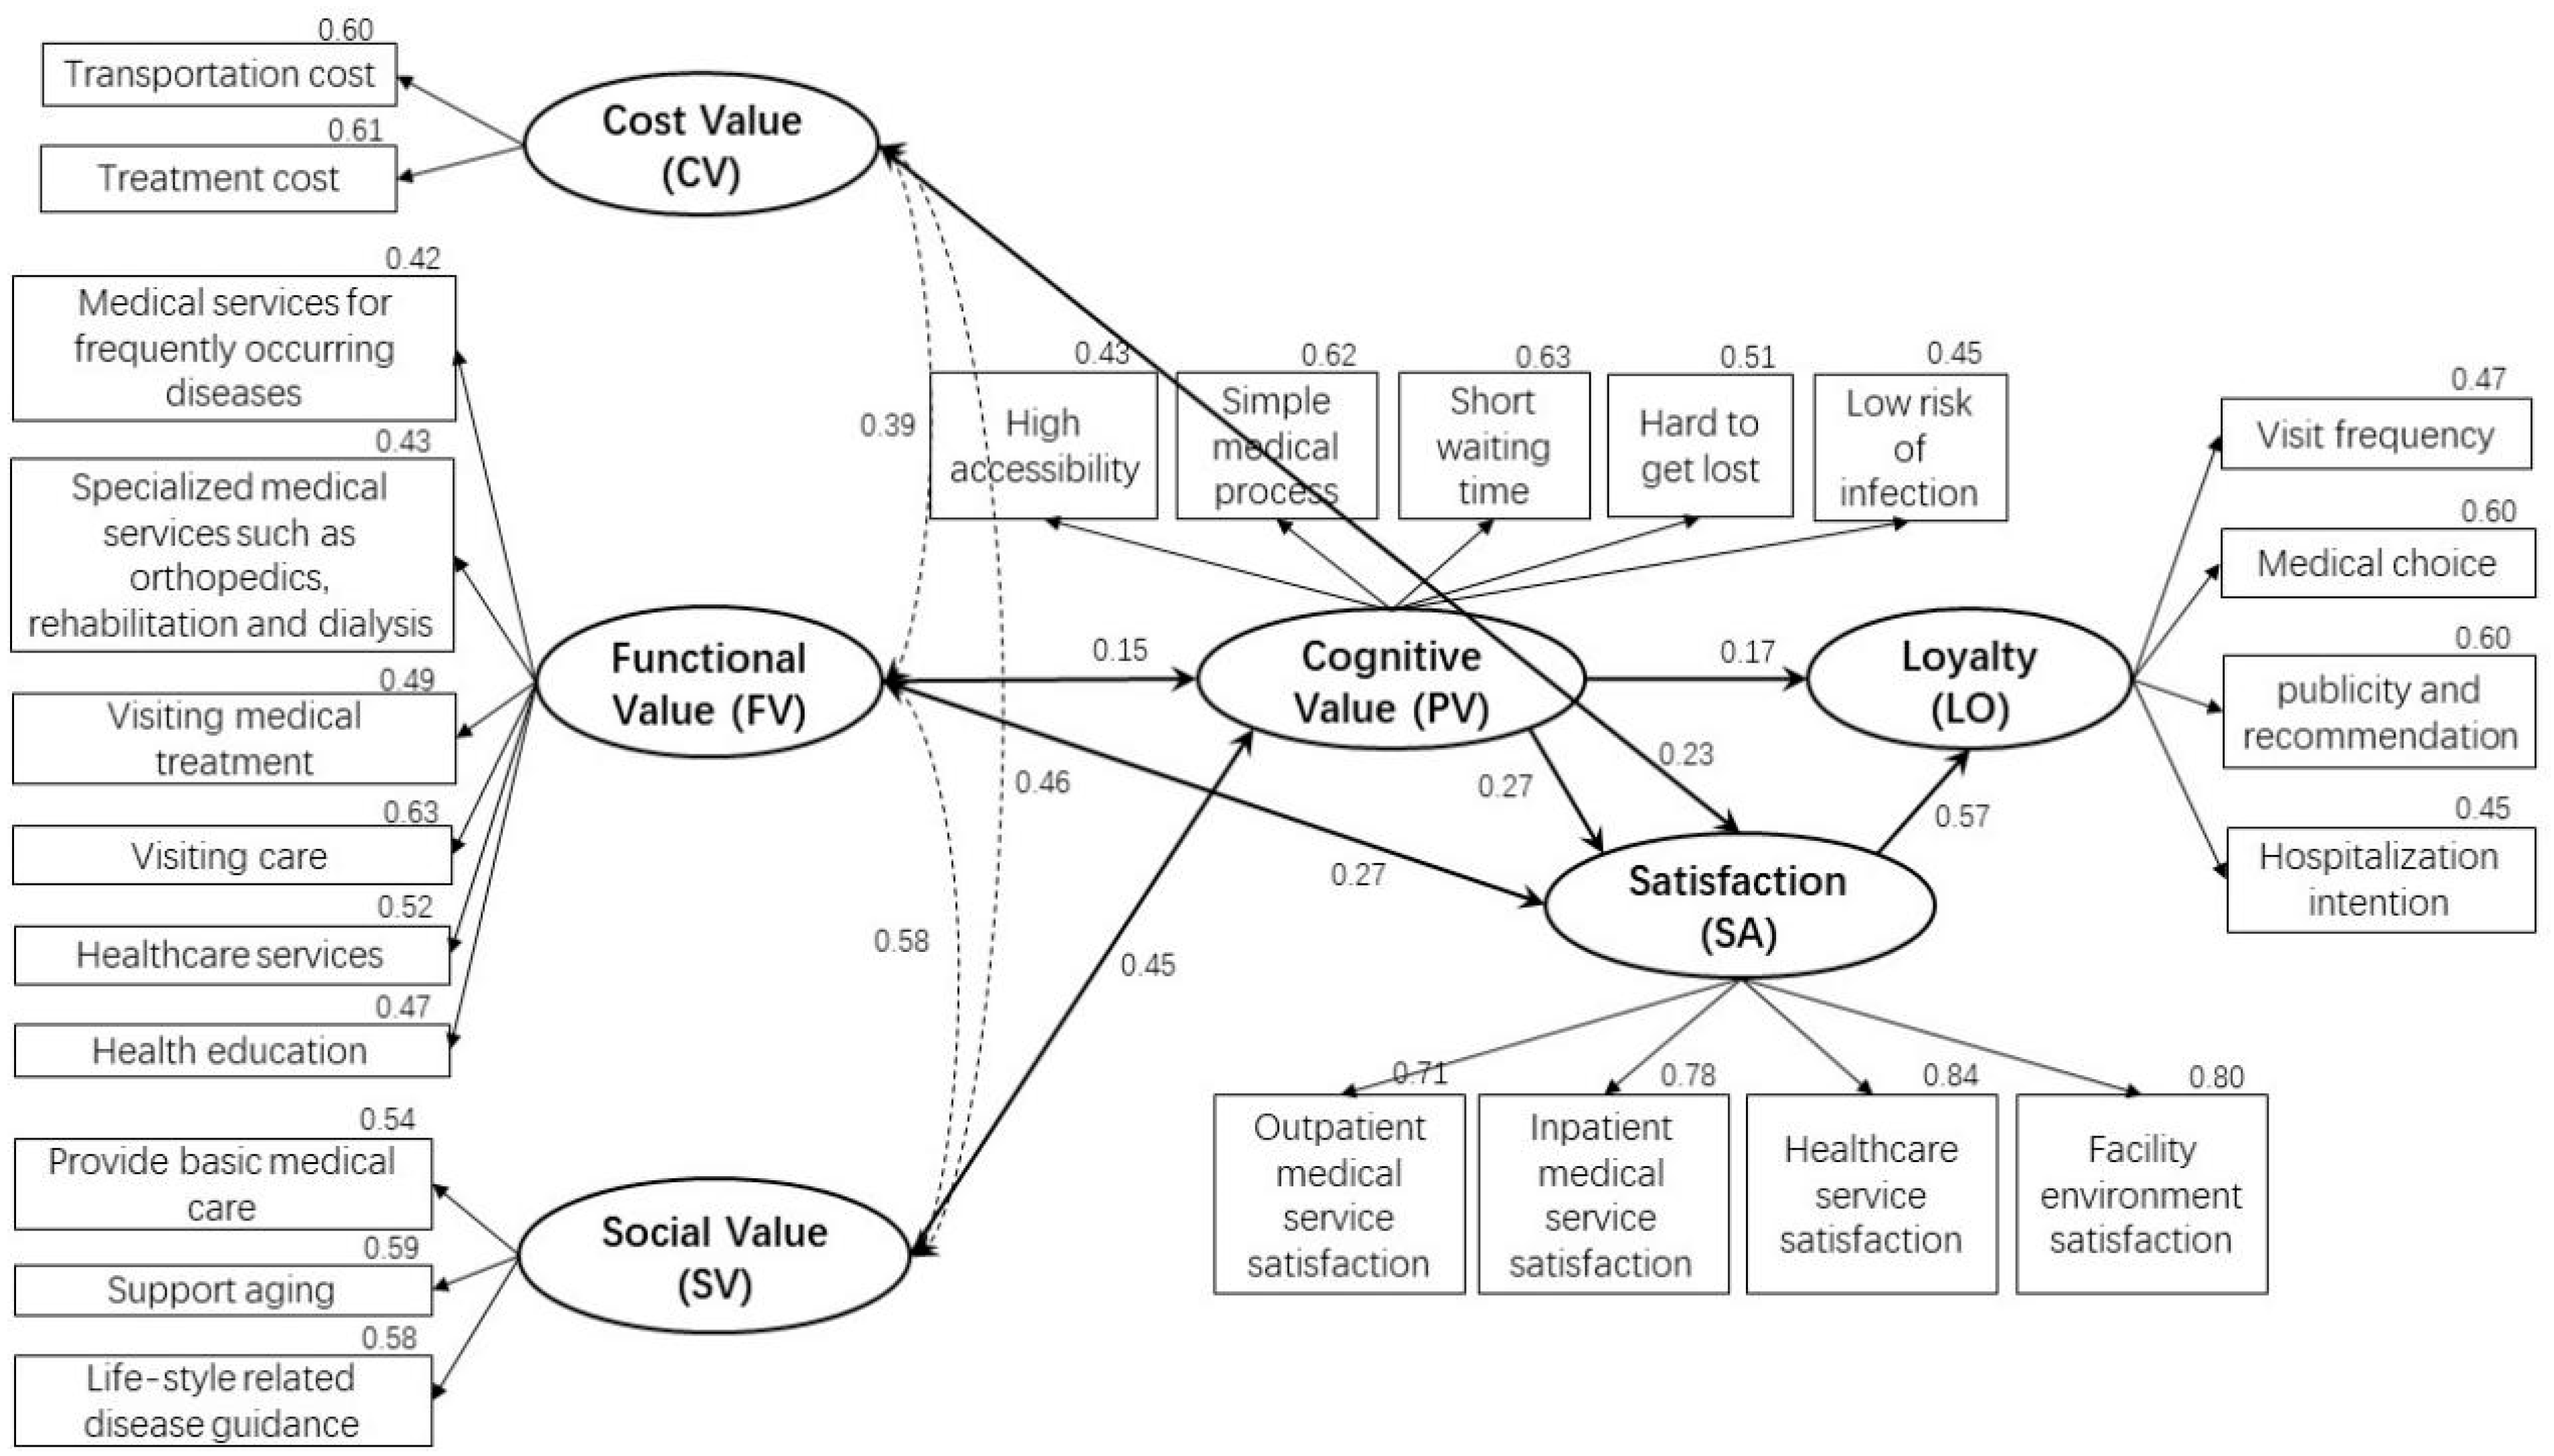
Figure 4) met the verification requirements in the fit degree test (Table 7), and the AVE values among the measured variables in the convergent validity were all >0.5 and the CR values were greater than 0.8. The correlation coefficients among the measured variables in the discriminant validity test were smaller than the square root of the AVE values (Table 8). The final model (Figure 4) displayed the observed variables with large explanatory coefficients corresponding to each measurement variable and retained seven paths and correlation coefficients with high significance among the measurement variables.

4.2. Results of SEM

The final SEM revealed that among cost value, functional value, social value, and cognitive value, functional and cognitive values, have the greatest impact on patient satisfaction and loyalty. This indicated that, for med–small-sized hospitals, functional configuration and environmental design can significantly enhance the hospital’s value. Additionally, in the behavioral statistics based on patient loyalty, it was found that patients’ willingness to go to the inpatient department is the lowest.

4.3. Comparative Analysis of the Final Model and Hypothetical Model

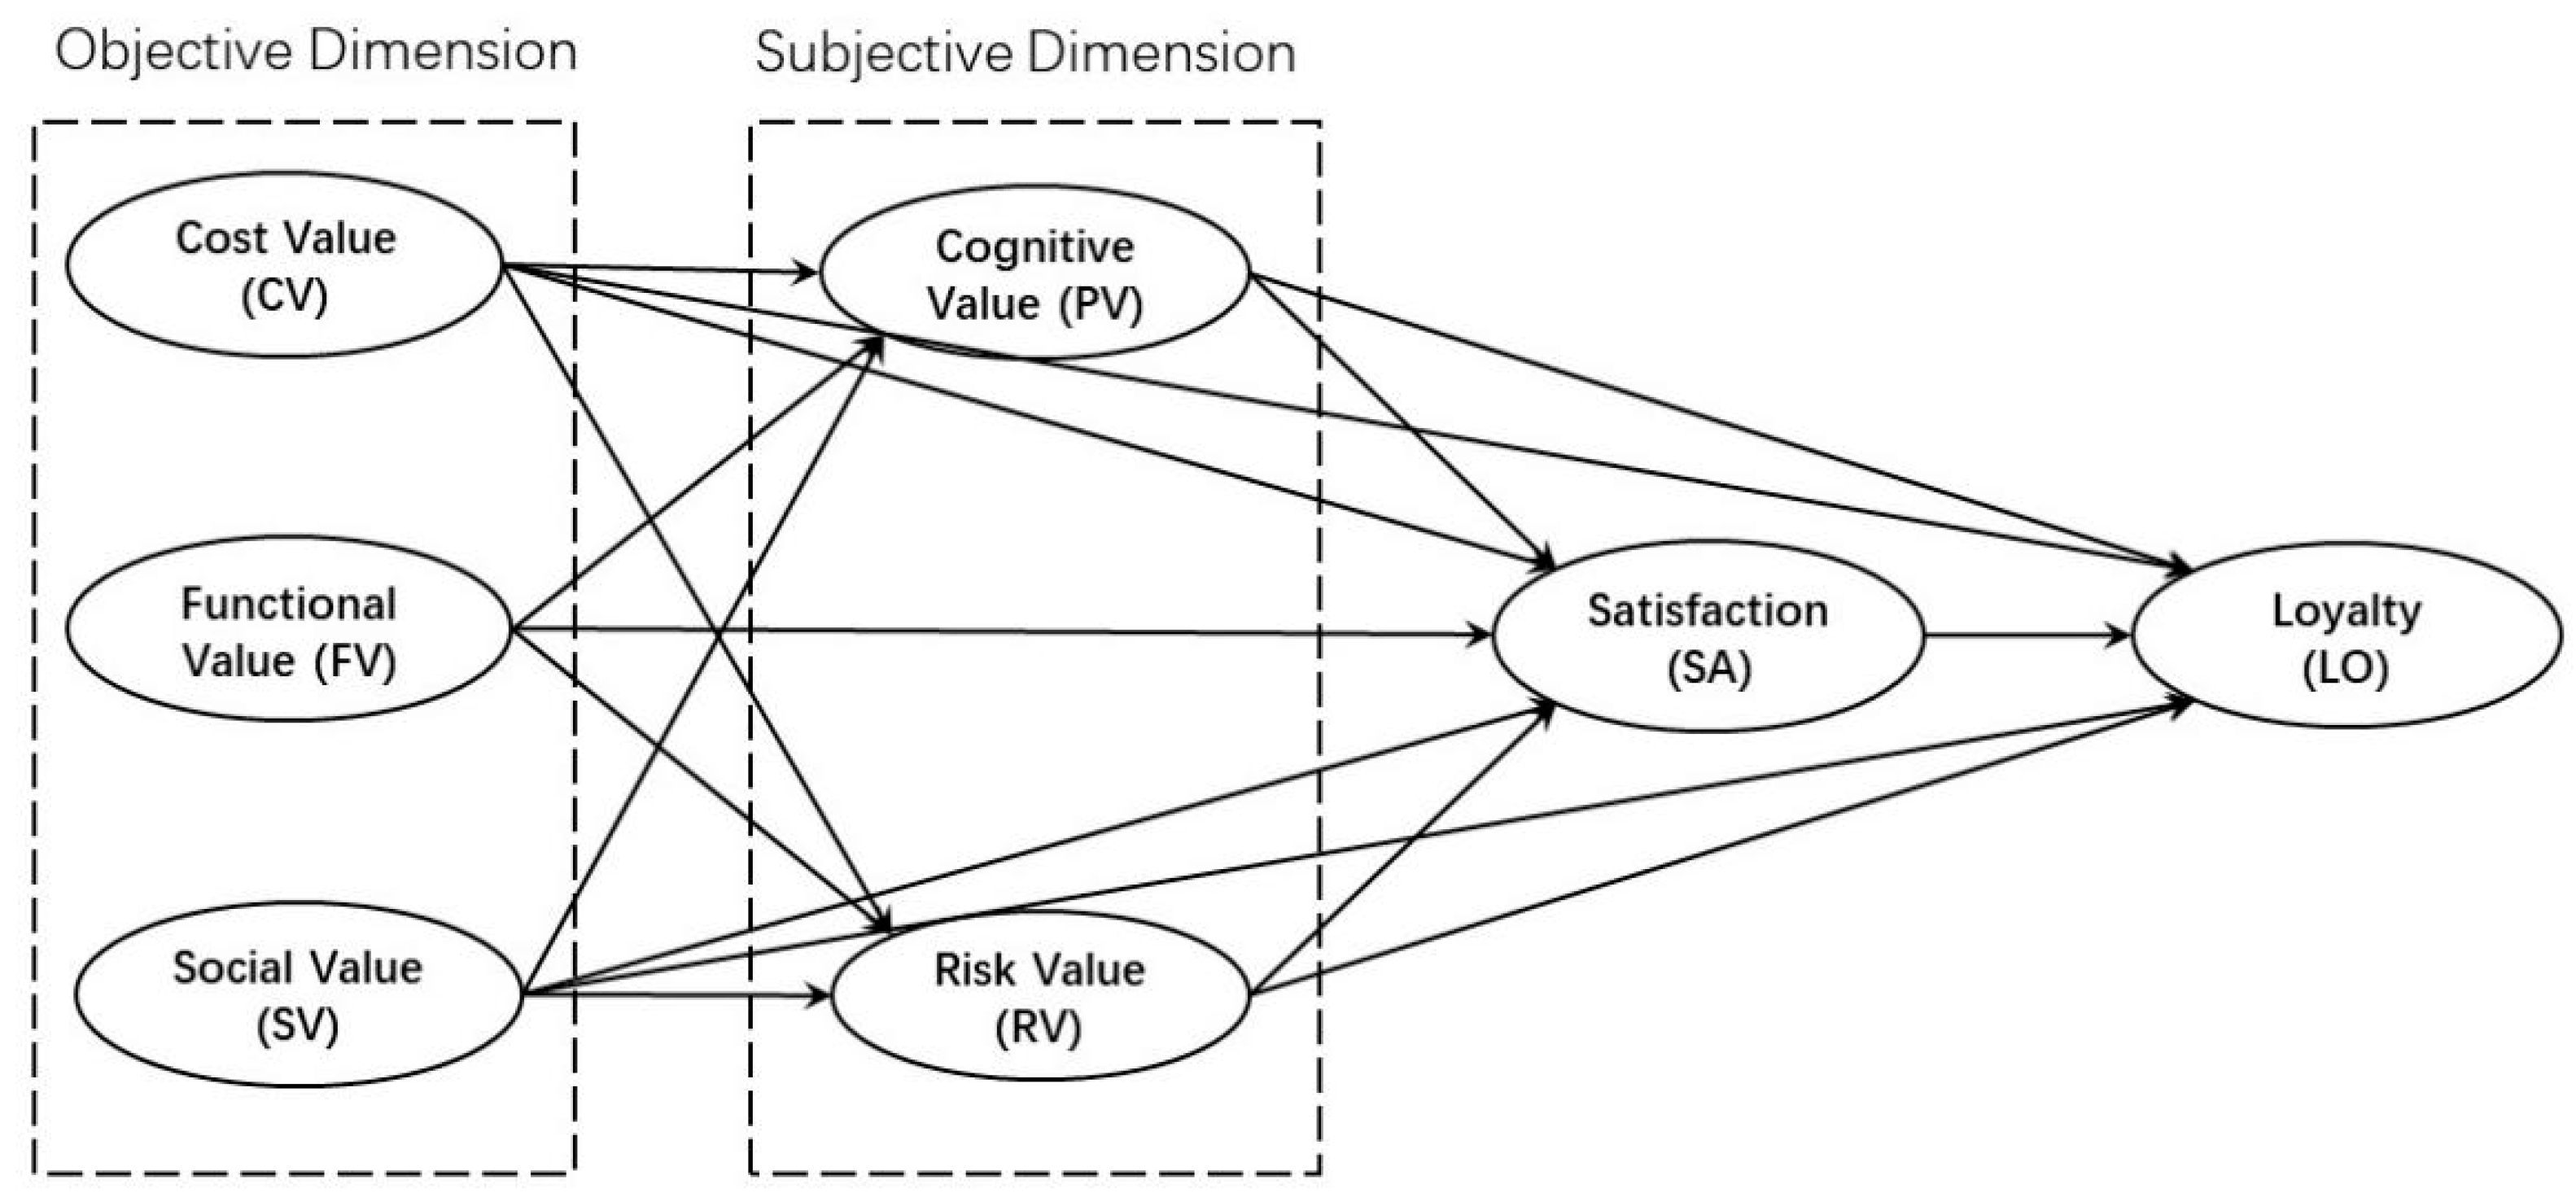
Comparing the final model with the initial hypothetical mode, the results showed that (1) the risk value was removed due to low correlation with the overall structural model, indicating low sensitivity in patients’ subjective perception of the potential negative impact on med–small-sized hospitals, and (2) the hypothetical model sets a total of 16 correlation paths among the variables, while the final model retained a total of 7 correlation paths among the 6 potential variables, reflecting the real path relationships between patient perceived value variables, satisfaction variables, and loyalty variables. In addition, the final model relationship path diagram in Figure 3 shows that there may be a mediating effect between patient perceived value and loyalty; that is, patient loyalty may be driven by the direct and indirect dual paths of intermediary variables such as cognitive value and satisfaction.

4.4. Important Relationship Path Interpretation

In the pathway of the “objective dimension—cognitive value”, only functional value and social value will have a positive impact on cognitive value, while cost value does not. Social value has a greater impact, with a path coefficient of 0.45. The provision of basic medical care, support for aging, and guidance on lifestyle-related disease are the three most important aspects constituting the social value of med–small-sized hospitals. Among the six observed variables of functional value, visiting care (0.63) had the largest explanatory coefficient, followed by health services (0.52), while medical services for common diseases and frequently occurring diseases (0.42) had the smallest explanatory coefficient.
In the paths of “patient perceived value—satisfaction”, cost value, functional value, and cognitive value all have a direct positive impact on satisfaction, with path coefficients of 0.23, 0.27, and 0.27, respectively. In the observed variables of cost value, because med–small-sized hospitals are close to the residents’ life circle, the time cost for patients can be ignored.
Analyzing the paths between “cognitive value—satisfaction—loyalty”, cognitive value, as the subjective perception of patients, has a direct positive influence on satisfaction and loyalty, with path coefficients of 0.27 and 0.17, respectively. Among the five observed variables of cognitive value, short waiting time (0.63), short medical process (0.62), and easy navigation due to smaller size (0.51) are the three variables with the most significant impact, and they represent important directions in architectural environmental design to enhance patient experience. Additionally, satisfaction also positively influences loyalty, with a path coefficient of 0.57, which is greater than the impact of cognitive value on loyalty. Among the observed variables of satisfaction, outpatient medical services, inpatient medical services, healthcare, and facility environment have high explanatory coefficients. Notably, among the four behavioral intentions of loyalty, the coefficient for the hospitalization intention is the lowest, suggesting that the inpatient department of med–small-sized hospitals has the lowest attractiveness to patients.

4.5. Mediation Effects Tests and Path Analysis

There are both direct and indirect influence relationships between variables. In the final SEM, six paths with mediating effects are shown. Firstly, AMOS 26.0 software was used to test the significance of indirect effects among the model variables [45,46] (Table 9). The results indicated that the indirect effects in the path of “functional value—cognitive value—satisfaction” did not pass the significance test. This suggested that, compared to the direct impact of functional value on satisfaction, the indirect impact of cognitive value can be ignored. The mediation effect of the remaining five paths all passed the significance test.
Then, the specific effect values of the full effect, direct effect, and indirect effects among the variables were calculated, and the results are shown in Table 10 below.
According to the data in the table above, it can be explained as follows: (1) Cognitive value has both direct and indirect effects on loyalty, while satisfaction has only direct effects on loyalty, and other variables have only indirect effects on loyalty. (2) The direct impact of cognitive value on loyalty is equivalent to its indirect impact on loyalty through satisfaction. (3) Social value, functional value, and cost value indirectly influence loyalty through cognitive value or satisfaction. Changes in cost value have a weak impact on loyalty, followed by social value, while functional value has the most significant impact on loyalty.

5. Discussion

5.1. Differences from Previous Research Results

In previous research mainly focused on patient perceived value indicators in large hospitals [35] such as public hospitals [24], private hospitals, university hospitals, or military medical academy [36], patients and their families placed the highest emphasis on the treatment effectiveness for acute medical conditions and complex diseases, as well as medical costs [47] and the efficiency of communication with healthcare providers [48]. Their perception of value regarding the medical environment and spatial design was quite low [41]. However, the results of this work indicated that, for med–small-sized hospitals, functional configuration and patient experience are the two primary perceived value factors for patients. This suggested that the importance of functionality and environmental design is greater for med–small-sized hospitals than for large hospitals.
The reason for this can be attributed to the fact that med–small-sized hospitals often handle the treatment of mild cases and chronic illnesses, which are significantly less complex than those treated in large hospitals. Additionally, most med–small-sized hospitals in China are non-profit institutions established by the government, resulting in lower treatment costs. The community hospital network, which closely aligns with the living circles of residents, enhances accessibility for the public. This greatly reduces both the financial and transportation costs for citizens, making these two value factors, which are relatively important for large hospitals, of lower priority for med–small-sized hospitals.
Furthermore, in terms of spatial environment design, large hospitals have a substantial size and complex functions, making it easy for patients to get lost. Additionally, with the current overcrowding in large hospitals, the waiting times and processes for receiving care can become lengthy, diminishing the patient experience. In contrast, med–small-sized hospitals, due to their smaller size and relatively simple functions, are less likely to cause patients to lose their way, and the care processes are shorter. This gives them a natural advantage in patient experience. Moreover, with the pandemic of COVID-19 in recent years [49], patients’ cognitive sensitivity to hospital infections has increased. Med–small-sized hospitals, characterized by their smaller volume and flexible space, can easily distinguish between healthy people and unhealthy people in a streamline design. This reduces the possibility of hospital infection and thus improves the patient safety.
In summary, due to the different functional positioning in the medical system, large hospitals and med–small-sized hospitals also have great differences in the medical experience brought to patients by scale, spatial layout, and environmental design. Therefore, many general hospitals and specialty hospitals should also classify and separately discuss their functional configurations, planning layouts, and spatial environments based on bed counts of 300 or more and 20 to 299.

5.2. Optimization Strategies for the Planning and Design of Med–Small-Sized Hospitals

The results presented by the final model in conjunction with the past literature and the research findings from Nanjing are further analyzed and discussed. Optimization strategies for the planning and design of med–small-sized hospitals are proposed.
(1)
Promote diversified development and collaboration based on regional characteristics
In the analysis of the final model, this work can still identify the shortcomings of med–small-sized hospitals. Although the number of med–small-sized hospitals in China is large, with dense and average distribution, they all provide the same basic medical services for frequently occurring diseases, which reduces the functional value of hospitals for patients and residents. Therefore, it is necessary to take a diversified development path based on the characteristics of the location. For example, if land in the city center is lacking, specialized hospitals with less bed demands such as dialysis hospitals, orthopedic hospitals, and dental hospitals can be built. On the contrary, in suburban areas where medical resources are scarce, the scale of community hospitals can be appropriately increased to undertake comprehensive medical services from acute to chronic stages within the service scope. In addition, functional planning can be carried out for various small and medium-sized hospitals within a certain area, and a collaborative network can be established [50]. For instance, to support and enhance the community’s elderly care medical system, nursing hospitals, geriatric day hospitals [51], rehabilitation hospitals for maintenance care, and hospice care hospitals [52] can be integrated into a planning and construction framework around high-age communities or in conjunction with elderly care institutions.
(2)
Optimize functional configuration
Functional value is a key aspect that patients prioritize. According to this survey, with the development of the home-based care for the aged concept, there is an increase in the proportion of women and children seeking medical treatment, as well as a rise in the number of sub-healthy individuals. Med–small-sized hospitals need to enhance or expand their medical service functions and departmental areas related to elderly chronic diseases, home care, maternal and child health, and adult diseases. Furthermore, research on several hospitals in Nanjing indicates that departments such as gynecology, pediatrics, dialysis, nursing, and rehabilitation are currently in high demand among patients. Additionally, following the pandemic, many studies have highlighted the need for hospitals to reserve space that can respond to sudden public health emergencies or allow for flexible adjustments in functionality.
(3)
Maintain the advantage of an efficient and streamlined medical process
Med–small-sized hospitals are less likely to cause patients to get lost, as their medical processes are shorter, which enhances patients’ experience and their awareness of the importance of the facility’s environment. Therefore, in terms of spatial layout and environmental design, it is essential to maintain these advantages. This includes designing the flow in outpatient departments with high crowd density; creating waiting spaces for popular departments such as traditional Chinese medicine, pediatrics [53], and maternal and child health; implementing noise reduction design in public areas of the hospital; and optimizing the lighting environment in treatment areas.
(4)
Optimize the inpatient department
In addition, compared to the situation that it is difficult to obtain a bed in the inpatient department of a large hospital, the willingness of patients to go to med–small-sized hospitals for inpatient treatment is not high. For example, the average hospital bed utilization rate in this survey was only 60%. It can be attributed to two main factors. One the one hand, the quality of treatment and nursing in med–small-sized hospitals is not high. On the other hand, there are no relevant guidelines for the functional classification of beds in med–small-sized hospitals, which cannot meet the inpatient needs of medical treatment, rehabilitation, nursing, etc.
Therefore, it is recommended to appropriately reduce the number of beds during planning. At the same time, due to the increase in the number of elderly and pediatric patients, the proportion of rehabilitation beds for the elderly and children, as well as beds that combine medical care and nursing, can be appropriately increased. Distinct design should be applied to inpatient units for rehabilitation and nursing [54]. Regarding room types, many research findings indicate that single rooms can significantly enhance patient satisfaction. Thus, the number of single rooms can be increased as appropriate based on the situation. Finally, in designing the ward environment, since the length of stay for chronic disease and nursing beds tends to be longer, the design approach can reference residential design [55]. In the design of wards for patients who are bedridden for extended periods, efforts should be made to help patients perceive the changes in the external natural environment as much as possible [56].

6. Conclusions

As China enters an aging society, changes in population structure and shifts in disease patterns have led to a major transformation of the healthcare needs of people from traditional therapeutic medical care to the life support healthcare model. Med–small-sized hospitals are expected to play a major role in this transition compared to large hospitals. However, hospitals often take 3–5 years or more from design to construction. In order to guide architects in planning and designing for future needs, this study based on the patient’s perspective utilizes perceived value research results to create a structural equation model of patient perceived value in Chinese med–small-sized hospitals. The model includes six dimensions: cost value, functional value, social value, cognitive value, satisfaction, and loyalty, comprising a total of 24 observation variables. The final model demonstrated good reliability, validity, and fit during testing. The model results intuitively indicate that optimizing a functional and spatial environmental design can significantly increase the value of hospitals and that there is a need to enhance the attractiveness of inpatient departments to patients. Based on these results, combined with the past literature and research findings from Nanjing, four optimization strategies were proposed for the planning and design of med–small-sized hospitals: promote diversified development and collaboration based on regional characteristics, optimize functional configuration, maintain the advantages of efficient and streamlined medical processes, and optimize the inpatient department.
This study investigates hospital design from the perspective of perception; uses the results of patient perceived value research to build a structural equation model; quantifies the degree of influence of the functional configuration, spatial environment, and other elements of perceived value of med–small-sized hospitals on patient satisfaction and loyalty-based behavior; and fills the gaps in the research of med–small-sized hospital design. It also combines the questionnaire data and field research to propose planning and design strategies for the sustainable development of med–small-sized hospitals in Nanjing, as well as providing important design references for architects.
However, there are still some limitations in this work: (1) The research location is in Nanjing, China, so the results of the study will be affected by the geographical limitations, and (2) the number of hospitals and respondents is limited, so the generalizability of the patient perceived value model in this study remains to be further empirically tested and verified.
In addition, different characteristics of the population, such as age, education, family structure, income, etc., will also affect the configuration of function planning. Therefore, in future research, the authors will conduct statistical analysis on the demographic differences within the surveyed population, particularly focusing on the varying needs of elderly and non-elderly people.

Author Contributions

Conceptualization, Y.Z. (Yunhui Zhu) and Y.Z. (Ying Zhou); methodology, Y.Z. (Ying Zhou); software, Y.Z. (Yunhui Zhu); validation, Y.Z. (Yunhui Zhu); formal analysis, Y.Z. (Yunhui Zhu); investigation, Y.Z. (Yunhui Zhu); resources, Y.Z. (Yunhui Zhu) and Y.Z. (Ying Zhou); data curation, Y.Z. (Yunhui Zhu); writing—original draft preparation, Y.Z. (Yunhui Zhu); writing—review and editing, Y.Z. (Yunhui Zhu) and Y.Z. (Ying Zhou); visualization, Y.Z. (Yunhui Zhu); supervision, Y.Z. (Ying Zhou). All authors have read and agreed to the published version of the manuscript.

Funding

This research was funded by the National Natural Science Foundation of China, grant number 51978143.

Institutional Review Board Statement

The study was approved by the ethical committee of IEC for Clinical Research of Zhongda Hospital (the number of ethic approval: 2024ZDSYLL212-P01).

Informed Consent Statement

All included participants gave their oral and written informed consent (all participants were 18 years of age or older).

Data Availability Statement

The datasets utilized and/or analyzed during the present study are available upon reasonable request from the corresponding author.

Acknowledgments

The authors would like to thank the hospitals and community managers they visited during the research in Nanjing for providing the research sites, as well as all the respondents who participated in the questionnaires and interviews.

Conflicts of Interest

The authors declare no conflicts of interest.

References

  1. Meen, T.-H.; Matsumoto, Y.; Wang, M.-S. Selected Papers From 2019 IEEE Eurasia Conference on Biomedical Engineering, Healthcare and Sustainability (IEEE ECBIOS 2019). Sustainability 2020, 12, 414. [Google Scholar] [CrossRef]
  2. Bauer, U.E.; Briss, P.A.; Goodman, R.A.; Bowman, B.A. Prevention of Chronic Disease in the 21st Century: Elimination of the Leading Preventable Causes of Premature Death and Disability in the USA. Lancet 2014, 384, 45–52. [Google Scholar] [CrossRef] [PubMed]
  3. Rippe, J.M. Lifestyle Strategies for Risk Factor Reduction, Prevention, and Treatment of Cardiovascular Disease. Am. J. Lifestyle Med. 2019, 13, 204–212. [Google Scholar] [CrossRef] [PubMed]
  4. Lin, W.; Jiang, H. Discussion About Combination of Medical Care and Social Care from the Aspect of Community. In Proceedings of the 4th International Conference on Economics and Management (ICEM), Chongqing, China, 24–25 June 2017; Destech Publications, Inc.: Lancaster, UK, 2017; pp. 16–20. [Google Scholar]
  5. Fang, E.F.; Scheibye-Knudsen, M.; Jahn, H.J.; Li, J.; Ling, L.; Guo, H.; Zhu, X.; Preedy, V.; Lu, H.; Bohr, V.A.; et al. A Research Agenda for Aging in China in the 21st Century. Ageing Res. Rev. 2015, 24, 197–205. [Google Scholar] [CrossRef]
  6. Shurney, D.W. Cummins’ Vision: Improved Health Through Lifestyle Medicine Innovation. Am. J. Lifestyle Med. 2018, 12, 46–48. [Google Scholar] [CrossRef]
  7. Zeng, Y.; Hesketh, T. The Effects of China’s Universal Two-Child Policy. Lancet 2016, 388, 1930–1938. [Google Scholar] [CrossRef]
  8. Alavi, K.; Sutan, R.; Shahar, S.; Manaf, M.R.A.; Jaafar, M.H.; Abdul Maulud, K.N.; Embong, Z.; Keliwon, K.B.; Markom, R. Connecting the Dots between Social Care and Healthcare for the Sustainability Development of Older Adult in Asia: A Scoping Review. Sustainability 2022, 14, 2573. [Google Scholar] [CrossRef]
  9. Zhou, Y.; Sun, Y.; Xu, Y.; Yuan, H. Study on Value-Based Design of Healthcare Facilities: Based on Review of the Literature in the USA and Japan. Front. Public Health 2022, 10, 883241. [Google Scholar] [CrossRef]
  10. Arai, H.; Ouchi, Y.; Toba, K.; Endo, T.; Shimokado, K.; Tsubota, K.; Matsuo, S.; Mori, H.; Yumura, W.; Yokode, M.; et al. Japan as the Front-Runner of Super-Aged Societies: Perspectives from Medicine and Medical Care in Japan. Geriatr. Gerontol. Int. 2015, 15, 673–687. [Google Scholar] [CrossRef]
  11. Tokunaga, J.; Imanaka, Y.; Nobutomo, K. Effects of Patient Demands on Satisfaction with Japanese Hospital Care. Int. J. Qual. Health Care 2000, 12, 395–401. [Google Scholar] [CrossRef]
  12. Aoki, T.; Yamamoto, Y.; Nakata, T. Translation, Adaptation and Validation of the Hospital Consumer Assessment of Healthcare Providers and Systems (HCAHPS) for Use in Japan: A Multicentre Cross-sectional Study. Open Access 2020, 10, e040240. [Google Scholar] [CrossRef] [PubMed]
  13. Katori, T. Japan’s Healthcare Delivery System: From Its Historical Evolution to the Challenges of a Super-Aged Society. Glob. Health Med. 2024, 6, 6–12. [Google Scholar] [CrossRef] [PubMed]
  14. Noda, S.; Hernandez, P.M.R.; Sudo, K.; Takahashi, K.; Woo, N.E.; Chen, H.; Inaoka, K.; Tateishi, E.; Affarah, W.S.; Kadriyan, H.; et al. Service Delivery Reforms for Asian Ageing Societies: A Cross-Country Study Between Japan, South Korea, China, Thailand, Indonesia, and the Philippines. Int. J. Integr. Care 2021, 21, 1. [Google Scholar] [CrossRef] [PubMed]
  15. Igarashi, A.; Yamamoto-Mitani, N.; Morita, K.; Matsui, H.; Lai, C.K.Y.; Yasunaga, H. Classification of Long-Term Care Wards and Their Functional Characteristics: Analysis of National Hospital Data in Japan. BMC Health Serv. Res. 2018, 18, 655. [Google Scholar] [CrossRef]
  16. Irizarry, T.; DeVito Dabbs, A.; Curran, C.R. Patient Portals and Patient Engagement: A State of the Science Review. J. Med. Internet Res. 2015, 17, e148. [Google Scholar] [CrossRef]
  17. Sweeney, J.C.; Soutar, G.N. Consumer Perceived Value: The Development of a Multiple Item Scale. J. Retail. 2001, 77, 203–220. [Google Scholar] [CrossRef]
  18. Zeithaml, V.A. Consumer Perceptions of Price, Quality, and Value: A Means-End Model and Synthesis of Evidence. J. Mark. 1988, 52, 2–22. [Google Scholar] [CrossRef]
  19. Dodds, W.B.; Monroe, K.B.; Grewal, D. Effects of Price, Brand, and Store Information on Buyers’ Product Evaluations. J. Mark. Res. 1991, 28, 307. [Google Scholar] [CrossRef]
  20. Vasiljević, Đ.A. Visitor Motivation and Perceived Value of Periurban Parks Case Study of Kamenica Park, Serbia. J. Outdoor Recreat. Tour. 2023, 42, 100625. [Google Scholar] [CrossRef]
  21. Chauv, J. Perceived Discrimination and Asian Cultural Values Are Associated with Beliefs about Psychological Services among Chinese International Students. Int. J. Intercult. Relat. 2022, 91, 138–149. [Google Scholar] [CrossRef]
  22. Cheng, Y.-H. Exploring the Effects of Perceived Values, Free Bus Transfer, and Penalties on Intermodal Metro–Bus Transfer Users’ Intention. Transp. Policy 2016, 47, 127–138. [Google Scholar] [CrossRef]
  23. Zheng, S. Exit, Voice, Loyalty, and Neglect Framework of Residents’ Responses to Urban Neighborhood Regeneration: The Case of Shanghai, China. Environ. Impact Assess. Rev. 2023, 100, 107087. [Google Scholar] [CrossRef]
  24. Moliner, M.A. Hospital Perceived Value. Health Care Manag. Rev. 2006, 31, 328–336. [Google Scholar] [CrossRef] [PubMed]
  25. Gharaveis, A.; Hamilton, D.K.; Pati, D. The Impact of Environmental Design on Teamwork and Communication in Healthcare Facilities: A Systematic Literature Review. HERD Health Environ. Res. Des. J. 2018, 11, 119–137. [Google Scholar] [CrossRef] [PubMed]
  26. Anåker, A.; Heylighen, A.; Nordin, S.; Elf, M. Design Quality in the Context of Healthcare Environments: A Scoping Review. HERD Health Environ. Res. Des. J. 2016, 10, 136–150. [Google Scholar] [CrossRef]
  27. Laursen, J.; Danielsen, A.; Rosenberg, J. Effects of Environmental Design on Patient Outcome: A Systematic Review. HERD Health Environ. Res. Des. J. 2014, 7, 108–119. [Google Scholar] [CrossRef]
  28. Zhang, Q.; Tang, H. Research on the Optimization Design of Community Health Service Center in a High Density City: Take Shenzhen as an Example. Archit. Cult. 2022, 06, 58–61. [Google Scholar] [CrossRef]
  29. Xu, Z.; Han, C.; Li, Z. Research on Architectural Design of Health Service Center of Elderly Friendly Community. Intell. Build. Smart City 2023, 01, 135–137. [Google Scholar] [CrossRef]
  30. Ullman, J.B. Structural Equation Modeling: Reviewing the Basics and Moving Forward. J. Pers. Assess. 2006, 87, 35–50. [Google Scholar] [CrossRef]
  31. Hershberger, S.L. Structural Equation Modeling: Concepts, Issues, and Applications. Struct. Equ. Model.- Multidiscip. J. 1997, 4, 253–256. [Google Scholar] [CrossRef]
  32. Kenny, D.A.; Little, T.D. (Eds.) Principles and Practice of Structural Equation Modeling, 4th ed.; Guilford Press: New York, NY, USA, 2023. [Google Scholar]
  33. Yuan, Y.; Shiau, W.; Wang, K.; Li, Y. Criteria of Structural Equation Modeling: Comparisons and Enlightenments of CB-SEM and PLS-SEM. J. Inf. Resourse Manag. 2023, 13, 6–22. [Google Scholar] [CrossRef]
  34. Bollen, K.A. Structural Equations with Latent Variables; John Wiley & Son Inc.: New York, NY, USA, 1989. [Google Scholar]
  35. Liu, S.; Hu, Y.; Lu, C.; Li, D.; Zhang, Z. Identifying Patient Perceived Values during Outpatient Encounters: An Empirical Study from Chinese Public Hospitals. BMC Health Serv. Res. 2023, 23, 852. [Google Scholar] [CrossRef] [PubMed]
  36. Teke, A.; Cengiz, E.; Çetin, M.; Demir, C.; Kirkbir, F.; Fedai, T. Analysis of the Multi-Item Dimensionality of Patients’ Perceived Value in Hospital Services. J. Med. Syst. 2012, 36, 1301–1307. [Google Scholar] [CrossRef]
  37. Sheth, J.N.; Newman, B.I.; Gross, L.G. Consumption Values and Market Choice; Shouth Western Publishing: Cincinnati, OH, USA, 1992. [Google Scholar]
  38. Sánchez, J.; Callarisa, L.; Rodríguez, R.M.; Moliner, M.A. Perceived Value of the Purchase of a Tourism Product. Tour. Manag. 2006, 27, 394–409. [Google Scholar] [CrossRef]
  39. Lorenz, S.G.; Dreher, H.M. Hospital Room Design and Health Outcomes of the Aging Adult. HERD Heal. Environ. Res. Des. J. 2011, 4, 23–35. [Google Scholar] [CrossRef] [PubMed]
  40. Wang, B.; Dane, G.; Arentze, T. A Structural Equation Model to Analyze the Use of a New Multi Media Platform for Increasing Awareness of Cultural Heritage. Front. Archit. Res. 2023, 12, 509–522. [Google Scholar] [CrossRef]
  41. Miao, R.; Zhang, H.; Wu, Q. Using Structural Equation Modeling to Analyze Patient Value, Satisfaction, and Loyalty: A Case Study of Healthcare in China. Int. J. Prod. Res. 2020, 58, 577–596. [Google Scholar] [CrossRef]
  42. Translation and Validation of Chinese Version of Health Sciences Evidence-Based Practice Questionnaire—All Databases. Available online: https://webofscience.clarivate.cn/wos/alldb/full-record/CSCD:7620741 (accessed on 5 July 2024).
  43. Jackson, D.L.; Gillaspy, J.A.; Purc-Stephenson, R. Reporting Practices in Confirmatory Factor Analysis: An Overview and Some Recommendations. Psychol. Methods 2009, 14, 6–23. [Google Scholar] [CrossRef]
  44. Iacobucci, D. Structural Equations Modeling: Fit Indices, Sample Size, and Advanced Topics. J. Consum. Psychol. 2010, 20, 90–98. [Google Scholar] [CrossRef]
  45. Ketchen, D.J. A Primer on Partial Least Squares Structural Equation Modeling. Long Range Planning. 2013, 46, 184–185. [Google Scholar] [CrossRef]
  46. Zhao, X.; Lynch, J.G.; Chen, Q. Reconsidering Baron and Kenny: Myths and Truths about Mediation Analysis. J. Consum. Res. 2010, 37, 197–206. [Google Scholar] [CrossRef]
  47. Zarei, E.; Arab, M.; Mahmoud Ghazi Tabatabaei, S.; Rashidian, A.; Rahimi Forushani, A.; Khabiri, R. Understanding Patients’ Behavioral Intentions: Evidence from Iran’s Private Hospitals Industry. J. Health Organ. Manag. 2014, 28, 795–810. [Google Scholar] [CrossRef] [PubMed]
  48. Fitriani, D.A.; Pasinringi, S.A.; Irwandy, I.; Amqam, H. The Effect of Perceived Value toward Loyalty through Patient Satisfaction in Hasanuddin University Hospital. Enferm. Clínica 2020, 30, 408–411. [Google Scholar] [CrossRef]
  49. Yan, Y.; Fan, T.; Zheng, Y.; Yang, H.; Li, T.; Wang, H.; Gu, Y.; Xiao, X.; Du, Z.; Sun, X. Prevention and Control of COVID-19 by Primary Health Care Facilities in China: A Field-Survey-Based Qualitative Study in Three Typical Cities. BMC Health Serv. Res. 2022, 22, 399. [Google Scholar] [CrossRef] [PubMed]
  50. Maghsoudi, T.; Cascón-Pereira, R.; Beatriz Hernández Lara, A. The Role of Collaborative Healthcare in Improving Social Sustainability: A Conceptual Framework. Sustainability 2020, 12, 3195. [Google Scholar] [CrossRef]
  51. Tousignant, M. Economic Evaluation of a Geriatric Day Hospital: Cost-Benefit Analysis Based on Functional Autonomy Changes. Age Ageing 2003, 32, 53–59. [Google Scholar] [CrossRef]
  52. Etkind, S.N.; Bone, A.E.; Gomes, B.; Lovell, N.; Evans, C.J.; Higginson, I.J.; Murtagh, F.E.M. How Many People Will Need Palliative Care in 2040? Past Trends, Future Projections and Implications for Services. BMC Med. 2017, 15, 102. [Google Scholar] [CrossRef]
  53. Jiang, S. Positive Distractions and Play in the Public Spaces of Pediatric Healthcare Environments: A Literature Review. HERD Health Environ. Res. Des. J. 2020, 13, 171–197. [Google Scholar] [CrossRef]
  54. Jimenez, F.E.; Rich, R.K.; Puumala, S.E.; Kentfield, M.; Schoenholtz, L.; Brittin, J. Effects of a Decentralized Nursing Model on Patient Outcomes in Two Rural Community Hospitals. HERD-Health Environ. Res. Des. J. 2021, 14, 157–173. [Google Scholar] [CrossRef]
  55. Chun, S.; Nam, K. User-Centred Design Approaches for Planning Inpatient Room of Geriatric Long-Term Care Hospitals: Design Factors with Practical Suggestions. Des. J. 2019, 22, 413. [Google Scholar] [CrossRef]
  56. Patterson, E.S.; Sanders, E.B.-N.; Sommerich, C.M.; Lavender, S.A.; Li, J.; Evans, K.D. Meeting Patient Expectations During Hospitalization: A Grounded Theoretical Analysis of Patient-Centered Room Elements. HERD Health Environ. Res. Des. J. 2017, 10, 95–110. [Google Scholar] [CrossRef] [PubMed]
Figure 1. Hypothetical model of patient perceived value of med–small-sized hospitals.
Buildings 14 02918 g001
Figure 2. Research framework.
Buildings 14 02918 g002
Figure 3. Initial SEM and the standardized results.
Buildings 14 02918 g003
Figure 4. Final SEM of patient perceived value in med–small-sized hospitals.
Buildings 14 02918 g004
Table 1. Measured and observed variables.
Measuring VariablesVariable TypeObserving Variables
Functional Value (FV)Exogenous latent variablesMedical services for frequently occurring diseases (FV1), specialized medical services such as orthopedics, rehabilitation and dialysis (FV2), visiting medical treatment (FV3), visiting care (FV4), healthcare services (FV5), health education (FV6), number of beds (FV7), and number of parking spaces (FV8).
Cost Value (CV)Exogenous latent variablesTransportation cost (CV1), transportation time (CV2), and treatment cost (CV3).
Social Value (SV)Exogenous latent variablesProvide basic medical care (SV1), support aging (SV2), guidance of life-style related disease (SV3), disaster support (SV4), and improve interpersonal communication (SV5).
Cognitive Value (PV)Endogenous latent variablesHigh accessibility (PV1), simple medical process (PV2), short waiting time (PV3), hard to get lost (PV4), low risk of infection (PV5), good doctor of traditional Chinese medicine (PV6), the general practitioner is competent (PV7), and facilitate family visits (PV8).
Risk Value (RV)Endogenous latent variablesPoor treatment outcomes (RV1), noise pollution (RV2), low safety (RV3), sanitary pollution (RV4), and occupation of community resources (RV5).
Satisfaction (CS)Endogenous latent variablesOutpatient medical service satisfaction (CS1), inpatient medical service satisfaction (CS2), healthcare service satisfaction (CS3), and facility environment satisfaction (CS4).
Loyalty (LO)Endogenous latent variablesVisit frequency (LO1), medical choice (LO2), publicity and recommendation (LO3), and hospitalization intention (LO4).
Table 2. Statistics on the locations where the questionnaires were distributed.
NoDistrictName
Community hospital 1Xuanwu DistrictSU Community Hospital
Community hospital 2Xuanwu DistrictGY Community Hospital
Community hospital 3Xuanwu DistrictPG Community Hospital
Community hospital 4Xuanwu DistrictMP Community Hospital
Community hospital 5Xuanwu DistrictBA Community Hospital
Community hospital 6Xuanwu DistrictPA Community Hospital
Community hospital 7Xuanwu DistrictDXG Community Hospital
Specialized hospital 1Jiangbei New DistrictDH Rehabilitation Hospital
Specialized hospital 2Drumtower DistrictJC Rehabilitation Hospital
Specialized hospital 3Pukou DistrictNZ Bone-setting Hospital
Specialized hospital 4Qinhuai DistrictNR Ear, Nose and Throat Specialized Hospital
Specialized hospital 5Qinhuai DistrictNB Nephrology Hospital
Specialized hospital 6Qinhuai DistrictNS China Orthopedic Hospital
Specialized hospital 7Pukou DistrictNY Rehabilitation Hospital
Specialized hospital 8Pukou DistrictNZW Orthopedic and Traumatology Hospital
Table 3. Demographic characteristics of respondents.
CharacteristicsPercentage (%)
GenderMale52.3
Female47.6
Age distribution18–2916.3
30–4933
50–5914.3
60–6916.3
70–7918.3
801.7
Educational attainmentJunior high school and below26.7
high school/secondary school25.3
university/college41.3
Master’s degree and above6.7
Monthly incomeLess than 2000 CNY7.3
2000–4000 CNY21
4000–6000 CNY37.7
6000–8000 CNY19.3
8000–10,000 CNY7.7
Table 4. KMO and Bartlett’s test of sphericity.
IndexNumerical value
KMO sampling suitability quantity.0.857
Bartlett’s test of sphericityApproximate cardinality5218.804
Degrees of freedom465
Significance0.000
Table 5. Total variance explained.
IngredientsInitial EigenvaluesExtraction Sums of Squared LoadingsRotation Sums of Squared
Loadings
TotalPercentage of VarianceCumulative
%
TotalPercentage of VarianceCumulative %TotalPercentage of VarianceCumulative %
17.17725.63125.6317.17725.63125.6313.83613.70113.701
24.03314.40440.0354.03314.40440.0353.56612.73426.436
32.3288.31648.3512.3288.31648.3513.54812.67139.106
41.9286.88755.2381.9286.88755.2382.7029.65048.756
51.7476.24161.4781.7476.24161.4782.5178.98857.744
61.4175.05966.5371.4175.05966.5372.4628.79366.537
70.9293.31769.854
80.7732.76172.615
90.7292.60575.221
100.6722.40077.621
110.5912.11279.733
120.5551.98081.713
130.5201.85783.570
140.4631.65385.223
150.4351.55286.775
160.4221.50888.283
170.3971.41789.699
180.3711.32491.024
190.3521.25892.282
200.3481.24293.524
210.3181.13694.660
220.2971.06095.721
230.2710.96696.687
240.2340.83797.524
250.2110.75598.279
260.1800.64498.923
270.1630.58499.507
280.1380.493100.000
Extraction method: principal component analysis.
Table 6. The component matrix after rotation.
IndicatorsDimensions
No. 1No. 2No. 3No. 4No. 5No. 6
FV1Medical services for common diseases and frequently occurring diseases−0.1250.1170.6680.1170.1840.156
FV2Specialized medical services such as orthopedics, rehabilitation and dialysis−0.0370.0690.7430.1530.092−0.028
FV3Visiting medical treatment0.0840.0630.7530.0210.0960.121
FV4Home care−0.0210.1120.7940.0620.1420.095
FV5Healthcare services0.0480.1610.7450.0290.0580.108
FV6Health education−0.0390.2470.6400.1060.2540.040
CV1Transportation costs0.0620.0880.1170.1240.1670.850
CV2Transportation time0.1120.0850.1260.1130.1110.903
CV3Treatment costs0.0460.1280.1670.1160.0940.816
SV1Provide basic medical care−0.0170.2520.2330.0210.6880.185
SV2Supporting aging−0.0890.2290.2230.0640.7010.173
SV3Life-style related disease guidance−0.0180.1660.2350.1030.7920.115
SV4Disaster support0.0320.1200.0940.2490.741−0.006
PV1High accessibility0.0170.6830.144−0.0040.1410.159
PV2Simple medical process−0.1460.7790.1620.0660.1250.038
PV3Short waiting times0.0120.8280.0830.0280.1390.022
PV4Hard to get lost−0.0390.7660.1120.1790.0600.057
PV5Low risk of infection0.0340.6570.1180.2760.1660.101
PV6Facilitate family visit0.0270.5920.1230.2790.1610.004
RV1Poor treatment outcomes0.8310.028−0.0500.0090.046−0.037
RV2Noise pollution0.8800.0010.023−0.0120.013−0.008
RV3Lower safety0.914−0.0040.0280.0320.0530.073
RV4Sanitary pollution0.891−0.006−0.0090.119−0.0920.049
RV5Occupation of community resources0.782−0.125−0.0510.126−0.1170.179
LO1Visit frequency−0.0910.2110.0680.7110.1610.088
LO2Medical choice0.0990.2150.1550.7680.1280.059
LO3Publicity and recommendation0.0850.1360.1760.7980.0440.069
LO4Hospitalization intention 0.1540.0530.0160.7580.0670.149
Extraction method: principal component analysis. Rotation method: varimax with Kaiser normalization. The rotation converged after 6 iterations.
Table 7. Model fitting of the indicators in the final SEM.
Fitting IndexModified Model Fitting ValueReference Value
χ2531.827The smaller the better
df242.000Larger indicates a more streamlined model
χ2/df2.1981~3.0
GFI0.875>0.8
AGFI0.845>0.8
RMSEA0.063<0.08
IFI0.917>0.9
CFI0.916>0.9
Table 8. Discriminant validity test.
VariablesCVFVSVPVSALO
CV0.842
FV0.358 **0.784
SV0.327 **0.379 **0.806
PV0.348 **0.426 **0.509 **0.815
SA0.389 **0.468 **0.467 **0.448 **0.801
LO0.251 **0.351 **0.583 **0.557 **0.537 **0.9
AVE0.7090.6140.6490.6640.6420.81
** means < 0.01.
Table 9. Path significance test of the mediating effect model among the variables.
Intermediary Pathwaysp-Value of Bilateral Test95% Confidence IntervalIntermediary Effects
Lower LimitUpper Limit
SV—PV—SA0.0010.0650.240Support
SV—PV—LO0.0010.0680.296Support
FV—PV—SA0.051−0.0010.137Unsupported
FV—SA—LO0.0010.1190.392Support
CV—SA—LO0.0020.0290.160Support
PV—SA—LO0.0010.0880.378Support
Table 10. Direct, indirect, and full effects among the model variables.
SVFVCVPVSALO
PVFull effect0.3580.1310.0000.0000.0000.000
Direct effect0.3580.1310.0000.0000.0000.000
Indirect effects0.0000.0000.0000.0000.0000.000
SAFull effects0.1330.3680.1610.3710.0000.000
Direct effect0.0000.3190.1610.3710.0000.000
Indirect effect0.1330.0490.0000.0000.0000.000
LOFull effects0.1580.2350.0890.4410.5550.000
Direct effect0.0000.0000.0000.2350.5550.000
Indirect effect0.1580.2350.0890.2060.0000.000
Disclaimer/Publisher’s Note: The statements, opinions and data contained in all publications are solely those of the individual author(s) and contributor(s) and not of MDPI and/or the editor(s). MDPI and/or the editor(s) disclaim responsibility for any injury to people or property resulting from any ideas, methods, instructions or products referred to in the content.

