Abstract
The construction industry, a driver for economic development worldwide, faces productivity challenges in Uganda, particularly in labour-intensive activities like in situ concrete beam construction. This study aims to identify and rank the factors influencing the production rate of reinforced in situ concrete beam construction in Kampala and Wakiso districts using principal component analysis (PCA). These factors including but not limited to weather, beam design and site conditions represent the independent variables while the production rate is the dependent variable. These variables were contextualized using a mixed-method approach in which data were collected from 20 construction sites through on-site measurements, a literature review and interviews. PCA was then employed to analyse the data and isolate the most influential factors on production rate, singling out beam length, daily temperature, the number of helpers, and the number of steel fixers, with average coefficients of 0.98, 0.882, 0.78, and 0.36, respectively, as the most significant. Therefore, this study provides an empirical ranking of factors influencing in situ concrete beam construction production rates, offering a foundation for better resource allocation and project management in Uganda’s construction sector.
1. Introduction
According to Alaloul et al. [1], the construction industry plays a crucial role in shaping infrastructure, providing shelter, and generating employment opportunities. This makes it a key driver in achieving SDGs, contributing up to a total of USD 1.7 trillion and impacting approximately 5–7% of the overall Gross Domestic Product (GDP) in most countries. In Uganda, the industry employs about 50% of non-farm labour and makes up 13% of its GDP with an annual growth rate of 5%; however, it is predominantly subjected to high pressures from the growing population, averaging an annual housing demand of 200,000 units [2,3]. As pointed out by Msinjili et al. [4], the satisfaction of this demand necessitates a framework for sustainable construction approaches and techniques to facilitate the development of physical infrastructure that can be maintained by the communities in which they are located. From an African perspective, this requires a synergy between employment opportunities, available labour, entrepreneurship, and the utilization of small and medium enterprises (SMEs) in the creation and maintenance of built infrastructure. As such, the adopted construction techniques should meet the socio-economic needs of the local communities and develop manpower. While multiple factors are responsible for the infrastructural development of the economy, the role of concrete, as a building material, plays the most outstanding role, given that it is the second most utilized resource globally after water [5].
Concrete construction is often a labour-intensive construction process; as such, Ramadan et al. [6] highlights that the construction workforce is the industry’s most valuable asset that accounts for a sizeable portion of the overall production costs. However, just like any construction operation, concrete construction is subject to hard labour conditions, low productivity, and high risks. Additionally, Hiyassat et al. [7] note that construction productivity has been low for decades, with contractors in developing countries suffering more productivity losses than those in developed economies; this therefore sparks concerns for the construction industry in Uganda that already manifests productivity challenges, as reported by the time and cost overruns witnessed countrywide [2]. This has been the foundation for the adoption of industrialization as a solution to promote construction productivity by integrating modern non-labour-intensive construction techniques such as the use of prefabricated concrete beams and columns [8].
However, the construction industry is notoriously known for its slow adoption and integration of technological advances and industrialization principes such as modularization and automation. As a result, there is still a high reliance on the use of labour-intensive concrete construction technologies such as in situ concrete. However, as illustrated by several scholars such as Ramadan et al. [6], technology adoption plays a vital role in increasing productivity and workforce output. As such, this necessitates a more efficient and industrialized construction of concrete structures to ensure the competitiveness of in situ concrete construction, given that the cost incurred on labour from preparation, the decommissioning of formwork, and the reinforcing, casting, and finishing of concrete is almost the equivalent of material costs, accounting for nearly 40% [9]. Additionally, Jarkas [10] estimates the overall cost of concreting trades to approximately one-third of the overall reinforced concrete frame cost, with labour expenditure on average accounting for 30% of this cost. Given the overall importance of in situ concrete construction in the industry and the influence of such construction technology on workforce performance and productivity, understanding the determinants of what impacts their performance is vital for the improvement of labour productivity [6]. For high-rise buildings, reinforced concrete construction involves the design of framed structures composed of beams and columns. Reinforced concrete beams are often subjected to various dynamic loading conditions; as such, they are fundamental for resisting damaging impact forces and the unregulated motion of heavy machinery [11].
While several studies have been implemented to assess the behaviour of reinforced concrete beams to such dynamic loading conditions, to the best knowledge of the authors, no study has empirically enumerated all the factors that influence in situ concrete beam construction and developed a relative importance ranking of such factors to enable practitioners to not only make informed decisions with regards to the supervision and management of work but also enable the optimization of how resources are allocated. This is critical for the development of better construction efficiencies such as the completion of work within a budget and the contractual schedule. This study adopted a multivariate unsupervised machine learning algorithm called principal component analysis (PCA) to determine and quantify the effects and relative influence of several factors in productivity models that are vital for the estimation of project costs, scheduling, and planning involved in in situ concrete beam construction. This involved an in-depth literature review to identify the factors that impact concrete construction labour productivity, the development of an on-site data collection instrument to collect data through on-site measurements, and a factor analysis to assess their relative significance.
This study was carried out in Kampala and Wakiso districts, where various construction projects were sampled through a stratified purposive technique to investigate the underlying factors influencing the production rate of reinforced in situ concrete beams. Figure 1 shows a map of the study area.
Figure 1.
Map of Uganda’s capital, Kampala, showing its divisions.
1.1. Reinforced In Situ Concrete Construction
Concrete is a product composed of cement, sand, known as fine aggregates, stone, known as coarse aggregates, and water, with the addition of chemical compounds known as admixtures to achieve special properties. From a global perspective, concrete is second to water as the most utilized material; this is attributed to its adaptability and enduring qualities that facilitate the construction of enduring structures [5]. Concrete products may be classified in two distinct categorizes, either as traditional cast-in-situ or prefabricated concrete. Given the role of industrialized construction in the promotion of sustainable development in the construction industry, traditional cast-in-situ concrete has fallen out of favour, given its low sustainability performance in terms of the triple environmental, economic, and social bottom line, due to its need for manual operation, lack of standardization, fragmentation, and discontinuity [12]. As reported by Samer et al. [13], industrialized construction that advocates for the adoption of prefabrication and modularization undoubtedly does significantly contribute to the triple bottom line of the construction industry by enhancing economic sustainability through the standardization of prefabrication and the elimination of non-value-added activities through lean construction, thereby improving the overall efficiency. Additionally, it facilitates environmental sustainability by minimizing on-site work and reducing workforce waste and construction pollution [14]. Furthermore, Nawi et al. [15] highlight that it is vital for social sustainability by reducing reliance on intensive labour through advanced on-site machinery and the use of off-site automation equipment.
However, it is worthwhile to note that the implementation of industrialized building systems (IBSs) is not effectively implemented in developing countries that are technologically dependent on developed countries as reported by the low share of industrialized building systems [16]. This is attributed to the fact that in most developing countries such as Uganda, the construction sector is largely informal, with the formal sector heavily relying on the informal sector for cheap available labour. As such, design and construction practices adapted for developed economies with the objective of minimizing labour costs and maximizing material utilization, such as prefabricated concrete, may not yield economic designs in Africa. For this reason, concrete technology in Africa should capitalize on the informal construction sector that is heavily dependent on the use of reinforced in situ concrete for the construction of large heavy-duty concrete-framed structures composed of beams and columns [4]. Beams, illustrated in Figure 2, which are the major area of focus for this study, are defined by Sookdeo [17] as structural elements subjected to bending loads transverse to their longitudinal axis. These components resist forces laterally or transversely applied to them as well as shear forces and bending moments. Additionally, these structural elements are responsible for transferring loads from the slab to the column and finally to the foundations. Concrete beams are reinforced with steel rods to ensure resistance to internal tension forces within the cross-section as the resulting bond between the steel and concrete enables the displacement of tensile forces from concrete to steel [18].
Figure 2.
Typical beam formwork and reinforcement.
1.1.1. Productivity in Reinforced Concrete Construction
While Wen et al. [19] highlight the lack of a universally accepted definition for productivity, from the construction industry perspective, it can be defined as the efficiency of labour and methods, which forms the foundation for competitiveness. Traditionally, productivity has been defined as the ratio of input/output expressed in Equation (1), where input refers to the associated resources (usually expressed in person-hours) and output refers to the real output in creating economic value [20].
Hence, construction productivity can be seen as an assessment of the results achieved through the integration of various inputs, with the objective of optimizing allocation and the utilization of resources in production activities. It is often quantified as the ratio of output to input in production as illustrated in Equation (1) [21]. While multiple methods for the assessment of productivity have been adopted by various scholars, the two most prominently used to gauge construction productivity include (1) total factor productivity expressed in Equation (2), accounting for all outputs and inputs, and (2) partial factor productivity, commonly known as single-factor productivity, focusing on outputs in conjunction with specific individual inputs. Productivity is often measured as the physical progress achieved per person-hour, such as person-hours per linear meter of the conduit laid or person-hours per cubic meter of the concrete poured [22]. It is important to note that productivity can be viewed at both macro and micro levels, encompassing factors such as contracting methods, labour legislation, labour organization, management, and the operation of a project.
1.1.2. Production Rates
The production rate denotes the average pace at which construction tasks progress, holding significant importance in the scheduling and management of construction activities. As a result, it emerges as a pivotal element in the overall process scheduling. Production rates, expressed in Equation (3), are utilized in construction to precisely calculate how long contracts will last. Accurately estimating production rates improves management effectiveness by cutting down delays and guaranteeing that projects are finished on schedule and under budget. Estimating manuals, project data, and site inspections are all necessary to determine production rates [23].
1.1.3. Factors That Determine Productivity in Construction
According to Vigneshwar and Sundarrajan [24], productivity factors encompass both quantitative and qualitative variables, with the latter affecting on-site hours, tasks, and activities. Additionally, they assert that establishing a consistent measure of productivity at the site, management, and industry levels can yield insights into the quantity of work accomplished, managerial capabilities, and industry developments (e.g., GDP). In construction, the conversion process from input to output occurs during project execution, and site productivity serves to elucidate the efficiency of labour, materials, machinery, and equipment, as well as management strategies for achieving output in residential, commercial, industrial, and infrastructure projects.
Several research studies on the calculation and validation of production rates make it abundantly evident that project-specific factors can cause these rates to differ dramatically. Location, route type, weather, project type, and operating conditions are common factors that affect output rates [25]. Mahamid [26] concluded that the political climate in Palestine, equipment shortages, old and inefficient equipment, a lack of labour experience, and subpar site management are the top five factors that have a negative impact on labour productivity in public construction projects. According to Alinaitwe et al. [2], the top 10 issues influencing labour productivity in Uganda are incompetent supervisors, workers’ lack of skills, rework, inadequate tools and equipment, inadequate building procedures, poor communication, erroneous designs and inaccurate drawings, stoppages because of work being rejected by consultants, insecurity, tools/equipment breakdown, and harsh weather conditions.
1.1.4. Work Study
Work study involves a systematic evaluation of current methods for conducting activities, aiming to optimize resource utilization and establish performance standards for an ongoing task [27]. The primary objective of work study is to scrutinize the execution of activities, streamline or modify operational methods to eliminate unnecessary non-value-adding elements such as rework and wastage, and ultimately establish standard time benchmarks for each activity [28]. Work study constitutes a thorough examination of all tasks performed by an organization, with the goal of optimizing the effective use of all available resources, including labour, supplies, capital, and equipment. This is possible by making use of methods to determine how long it takes an experienced worker to finish a task at a predetermined work rate [29]. Time study, which uses a variety of techniques to calculate the amount of time needed for a skilled worker to complete a task at a standardized working pace, and method study, which involves careful observations and an analysis of how an operation is carried out to identify areas for enhancement, are the two main approaches that make work study implementation easier.
1.1.5. Method Study
According to Kulkarni [30], the study of work for a task to improve the layout, design, and procedure, create a better working environment, and lessen tiredness is known as method study. Method study involves a detailed examination of each step within a specific task or job to identify and remove any redundant actions performed by workers, materials, or equipment, thereby streamlining the process. This process encompasses the establishment of standardized equipment, methods, and working conditions, as well as the training of operators to adhere to these standardized procedures. Figure 3 demonstrates the process involved in implementing a work study.
Figure 3.
Procedure of conducting work study.
A work study procedure entails seven fundamental steps. Initially, the selection of the task or job to be analysed is carried out. Subsequently, all pertinent information concerning the current method is recorded. Following this, a critical examination of the recorded facts is conducted, employing appropriate techniques and arranging them in a logical sequence. The aim is to develop the most practical, economical, and efficient method that adheres to the required processes in a sequential manner [31]. Once developed, the new method is precisely defined for easy identification. The next step involves the installation of the method as a standard practice within the production department of an industry. To ensure its sustainability, the method is regularly maintained through routine checks and standardization practices. This approach is particularly beneficial in identifying and eliminating unnecessary processes, allowing for the simplification of tasks through the utilization of straightforward and less complicated tools [32].
1.1.6. Time Study
Time study involves the application of specifically designed methods to ascertain the time needed for a proficient worker to finish a specific task at a predetermined level of skill. Its main emphasis is on scrutinizing and reducing any unproductive time associated with the task. Work measurement data serve as a dependable foundation for making decisions about equipment. The fundamental process of work measurement involves six steps, which include selection, recording, examination, measurement, compilation, and the precise definition of methods for calculating the standard time [33].
1.1.7. Principal Component Analysis
Principal component analysis (PCA) is a statistical technique that was developed by Harold Hoteling in 1933 used for identifying patterns, reducing the dimensionality of such datasets, and increasing interpretability whilst at the same time minimizing information loss. It does so by creating new uncorrelated variables that successively maximize variance [34]. This multivariate analysis technique reduces high dimensionality, which refers to the existence of multiple features often exceeding the number of samples in the data. Its working principle is based on concentrating exclusively on the data that is best explained by the primary components that have the highest variability or dispersion [35]. This is achieved with the fewest principal components, hence lowering the data’s dimension count and enhancing data interpretability. These components are aligned with the directions of maximum variance in the original data and are the eigen vectors of the covariance matrix of the data. PCA looks for unexpected connections and significant structures in multivariate data, presenting high-dimensional data in a low-dimensional space while accurately capturing the intended structural components of the data. The order of these principal components is based on the amount of variation that they individually explain. That is, the largest portion of the total variance in the data is explained by the first principal component, the second by the second, and so forth [36].
Principal component analysis is therefore an important technique, given the rise in high-dimensional datasets with plenty of features, which presents a challenge for data-driven decision making and the overfitting of machine learning models, which results in poor generalization to samples outside of the training set. The selection of the right number of principal components is essential to accurately model the system that strikes a balance between the variability in the dataset explained and the amount of information retained [37]. While an inadequate number of principal components undermines the underlying data structure, an excessive number guarantees the over-parameterization of subsequent models and the introduction of noise. In order to achieve successful PCA models, the number of components chosen should on average explain between 70% and 80% of the variability as this is widely accepted in PCA practice [38]. When extracting eigen values and eigen vectors during PCA modelling, statisticians may encounter a choice between a covariance matrix and a correlation matrix. We suggest that the decision should be based on the units of measurement of the variables in the dataset; that is, variables with different units of measurement are best interpreted by the correlation matrix PCA, as the covariance matrix PCA depends on unit-specific variance. However, the correlation matrix-based PCA needs more principal components to explain the same level of variance as fewer components would, using the covariance-based PCA [3].
2. Materials and Methods
2.1. Research Design and Nature of Data
This study employed a mixed research design approach that constituted both quantitative and qualitative aspects. The quantitative aspect was composed of primary numerical data collection through on-site data collection and measurement, while the qualitative aspect was composed of secondary data collection through desk study and interviewing personnel that identified the main independent variables comprising factors that determined the production rates of reinforced in situ concrete beams in Wakiso and Kampala, with construction production rates as the dependent variable. These independent variables factors were classified as site information, weather, crew configuration, design, work conditions, and operation as highlighted in Table 1. The principal component analysis (PCA) technique was employed to assess the factors and rank them in accordance to their impacts.
Table 1.
Classification of influencing factors investigated in the study.
2.2. Data Acquisition
2.2.1. Study Population and Sample
Purposive, stratified, and random sampling techniques that were used to identify candidate sites involved in the casting of reinforced in situ concrete beams were selected from metropolitan Kampala and Wakiso districts for data collection. A total of 20 construction project locations, illustrated in Table 2, were randomly selected from the five divisions in Kampala for a representative study, and field observations and measurements were conducted on each of them for their beam construction operations, resulting in 255 beam samples. Interviews were also conducted with key personnel, being various construction professionals running respective construction sites.
Table 2.
Location of sampled construction sites for data collection.
2.2.2. Data Quality Control and Cleaning
To ensure data quality, data enumerators were extensively trained on how to use data collection instruments, measurement instruments were correctly calibrated prior to use, and construction sites were designated distinctive identification numbers to ensure traceability. Collected data were subject to preprocessing in MATLAB R2016b to remove erroneous entries. Categorical data were label-encoded when classes were less than three and one-hot encoded for anything greater to prevent the prioritization of higher labels from label encoding. This meticulous process not only streamlines project tracking but also upholds a robust framework for maintaining confidentiality throughout the project lifecycle.
2.3. Data Analysis Techniques
This study implemented an unsupervised machine learning multivariate dimensionality algorithm to ascertain the relative importance of the various factors influencing reinforced concrete beam construction production rates. However, the interpretability of the new generated variables in a lower dimensional space is limited. As such, the Euclidean distance of the factor loading, which represents the correlation magnitude between the generated principal components and the original variable space, was used as a selection criterion for the most significant factors and to reduce dimensionality, given that the number of features was significantly larger than the number of data samples, using a covariance matrix.
PCA Procedure
The principal component analysis involved a multistep process, as demonstrated in Figure 4, starting with data preprocessing that involved data normalization, as most machine learning algorithms are based on data normality assumptions. Additionally, PCA is very sensitive to variances in variables as large differences in variable ranges are prioritized over small ranges. The analysis platform MATLAB R2016b necessitated data transformation into their matrix form and utilized a built-in PCA function. However, the selection of the optimal number of principal components (PCs) was based on the number of PCs that explained 80% of the dataset variance. Additionally, the relative ranking of variables was based on a Euclidean threshold of 0.3.
Figure 4.
PCA procedure workflow.
Postprocessing involved the analysis of insights from the coefficient matrix that illustrated the correlations between the new variables in the lower dimensional space and the original variables and the latent matrix that consisted the eigen values arranged in descending order, with the first eigen value explaining the largest variance. The explained matrix indicates the percentage of the total variance accounted for by each principal component, which aids in evaluating how each component contributes to the variability. When taken as a whole, these matrices serve as the foundation for understanding the dimensionality and underlying structure of the data, as disclosed by PCA. The cumulative variance explained determined how many PCs were taken into consideration. The explained matrix collectively provides the foundation for understanding the dimensionality and underlying structure of the data, as shown by PCA. A threshold of 70% variance was applied because it explains most of the variability in the data and hence allows for a comprehensive analysis. Principal components reflective of the 70% variance were selected and their Euclidean distance calculated. A threshold of 0.4 for factor loading was considered significant enough, and consequently, components with Euclidean distances greater than 0.3 were selected.
3. Results
3.1. Results from the Principal Component Analysis
The first step in this analysis was to import the observation data sheet in Microsoft Excel into MATLAB and transform it into a matrix. The second step was to run the principal component analysis using an inbuilt function in MATLAB. The input to this function was the original data that were converted into a matrix. The outputs included the coefficients of the principal components, the principal component scores, the principal component variances (the latent vector), Hotelling’s T-squared statistic, the percentage of total variance explained by each principal component, and the estimated means of the variables in the matrix.
3.1.1. Co-Efficient Matrix
The first output of the analysis was the coefficient matrix or loading matrix which shows the magnitude and direction of the original variables in relation to the principal components. In simple terms, these coefficients show the magnitude and direction of each of the original variables in relation to the principal components. The larger the co-efficient in whatever direction, the more important that variable is in that principal component. The coefficient matrix returned upon analysis in MATLAB is as shown in Table 3 below.
Table 3.
Coefficient matrix of the first four principal components.
3.1.2. Score Matrix
The principal component scores represent the original data instances’ location in the lower dimensional plane of the principal components. In other words, the data points are represented on a new coordinate system with non-variable correlations. This is essential in the graphical illustration of the correlation between the principal components and the original variable space.
3.1.3. Latent and Explained Matrices
The latent matrix is a column vector of each principal component’s eigen values. It was computed by taking the square of each data instance’s score for each principal component, adding up all of the squares, and then dividing the total by the number of data instances minus one. Each principal component’s variance explanation is displayed by these eigen values, and the vector is organized in descending order as illustrated in Table 4.
Table 4.
Principal component eigen values.
3.1.4. Hotelling’s T-Squared Statistic
The fourth output from the principal component analysis was the percentage of the variance explained by each principal component. Hotelling’s T-squared statistic is computed by adding the squares of the standardized scores for every observation. Significant deviation from the mean is indicated by a big T-Squared value, as was previously discussed. The results of running the PCA algorithm in MATLAB are displayed in the table below for Hotelling’s T-squared statistic.
3.1.5. Mean, Mu
The average of every factor (Table 5) found was the final result of the principal component analysis. As previously indicated, this was required to eliminate the mean from the data matrix and guarantee that the variability surrounding the mean was the one that could be explained.
Table 5.
Principal component means.
3.1.6. Principal Components Considered
The next crucial phase after completing the principal component analysis was to determine the number of principal components to use. This was conducted by coming up with a threshold percentage of the total variance in the data so that only the principal components with the largest percentages explained that added up to that threshold were considered. The threshold percentage considered in this study was 70%. The “result” input was also fixed at zero before the iterative process in the for loop of the function was started. Four principal components were returned as the ones to consider after running the code snippet in Figure 5.
Figure 5.
PC considered function.
3.1.7. Feature Selection
The feature selection involved choosing the characteristics that had the greatest influence on the production rate of reinforced in situ concrete beams. The 70% threshold of explained variance screened out the optimal principal components to aid the selection of the features that significantly affected the production rate. This was conducted by calculating the Euclidean distance of the factor loading of each factor within the first four principal components. The identification of the most significant features was based on a 0.3 Euclidean distance threshold, illustrated by the Boolean vector that identified significant features, with 1 for ‘true’ and 0 for ‘false’ (Table 6) for those features that had coefficients above and below the selected co-efficient, respectively.
Table 6.
Selected influencing factors.
3.2. Discussion of Results
3.2.1. The Coefficient Matrix
The results discussed in this section were derived from the first three principal components selected in accordance with the methodology as detailed earlier. The factors most heavily explained by principal component one was beam length (F20) and the number of helpers (F6), with co-efficient values of 0.62 and 0.56, respectively. The second principal component was also inclined towards beam length (F20) and the number of helpers as well (F6), with factor loadings of 0.75 and 0.45, respectively, while principal component three largely explained the number of electricians and weather, with coefficients of 0.6 and 0.3, respectively. This was conducted in order to identify which factors were most heavily correlated with the first three principal components. As such, principal component one and two can be referred to as a measure of the beam dimensions. It was discovered that the length of the beams to be cast, weather, and the number of helpers had the biggest impact (Table 7).
Table 7.
Factors with highest correlation.
3.2.2. The Score Matrix
Higher absolute values in the PCA scores indicate factors that have a stronger influence on the variability in the production rates. F1, F5, and F6 had higher scores in the first rows and thus were significant in explaining the variance in production rates. PCA also helped in identifying patterns or correlations between different factors. Factors closely correlated exhibited similar scores across the principal components.
3.2.3. The Latent and Explained Matrix
The eigen values decreased significantly from the first to the last, with the first three components capturing the most variance. This is typical in PCA, where the first few components are expected to capture the most significant patterns in the data. The first component alone captures a substantial amount, 43.207% of the variance in the dataset, thus representing major underlying factors that affect beam production rates.
The second component, also significant, suggests another strong, but less dominant, pattern in the data, explaining 25.37%, and the third principal component explains only 12.33%. The importance of subsequent components decreased with each subsequent eigen value. Components with very small eigen values (close to zero) contribute very little to explaining the variance in the data.
The cumulative sum of the first three eigen values returned a satisfactory level of over 70% of the total variance, surpassing the predetermined threshold to adequately represent the factors affecting beam production rates. Based on these eigen values, a decision was made on how many principal components to retain. In this study, since the first three components cumulatively explained over 80% of the variance, the rest were ignored to simplify the model, which made the analysis more manageable and interpretable. Components with very low eigen values were considered noise and disregarded so as to focus the analysis on the most meaningful factors, i.e., the top four principal components (Table 8).
Table 8.
Principal component percentages explained.
3.2.4. The Hotelling’s T-Squared Statistic
The Hotelling’s T-Squared statistic represented in Table 9 illustrates the amount of variation within the PCA model, the highest T-squared statistic sum identified was 90 for the observed 255 beams, while the lowest sum was 11. The highest value (90) implied a substantial deviation from the expected patterns captured by the principal components, suggesting that the corresponding observation differed significantly from the majority of the dataset and was thus an outlier. The lowest T-squared statistic value 10 implied minimal deviation from the expected patterns captured by the principal components; thus, the corresponding observation closely aligned with the underlying structure of the dataset and was consistent with the majority of the data and were reliable data points for model training and analysis. The dataset containing “NaN” instances stood for features with similar attributes and missing values and these were eliminated in order to guarantee the integrity and accuracy of the analysis.
Table 9.
Ranking of factors based on their T-squared statistic means.
3.2.5. Principal Components Considered
Four principal components which explained 70% of the variability in the data were selected, having run the function in MATLAB. This was underscored by the latent vector as well as the percentage of variability explained vector, which clearly showed that the first three principal components explained the bulk of the variability in the data.
3.2.6. Feature Selection
The threshold value for the coefficient above which a feature would have been qualified was selected on a trial-and-error basis. A Boolean operator was run to return a true value for a selected feature and a false value for a rejected one.
The bi-plot in the X-Y plane shows that beam length and the number of helpers are the factors most heavily correlated with principal component one (Figure 6a), which is still the same scenario as principal component two (Figure 6b). This confirms and reinforces beam length and the number of helpers as crucial factors in reinforced in situ beam production. The bi-plot in the Y-Z plane in (Figure 6c) above shows that principal component three was still positively correlated with beam length and the number of helpers. The last bi-plot (Figure 6d) makes it clear that the X-Z plots above are consistent with the coefficient matrix.
Figure 6.
Principle component bi-plots: (a) 2D bi-plot for components 1 and 2; (b) 2D bi-plot for components 1 and 3; (c) 2D bi-plot for components 2 and 3; (d) combined 3D bi-plot for components 1 to 3.
Aided by these bi-plots generated in MATLAB for the visualization of the significance of these factors in the direction of each principal component, it can be concluded that the features that affected the output the most were beam length, the number of helpers, the number of steel fixers, the number of carpenters, the number of electricians, the number of masons, the volume of concrete, and temperature, with average co-efficient values of 0.98, 0.78, 0.36, 0.48, 0.66, 0.37, 0.24, and 0.37, respectively. It should be noted that the MATLAB API can only generate up to three dimensions.
4. Conclusions and Recommendations
4.1. Conclusions
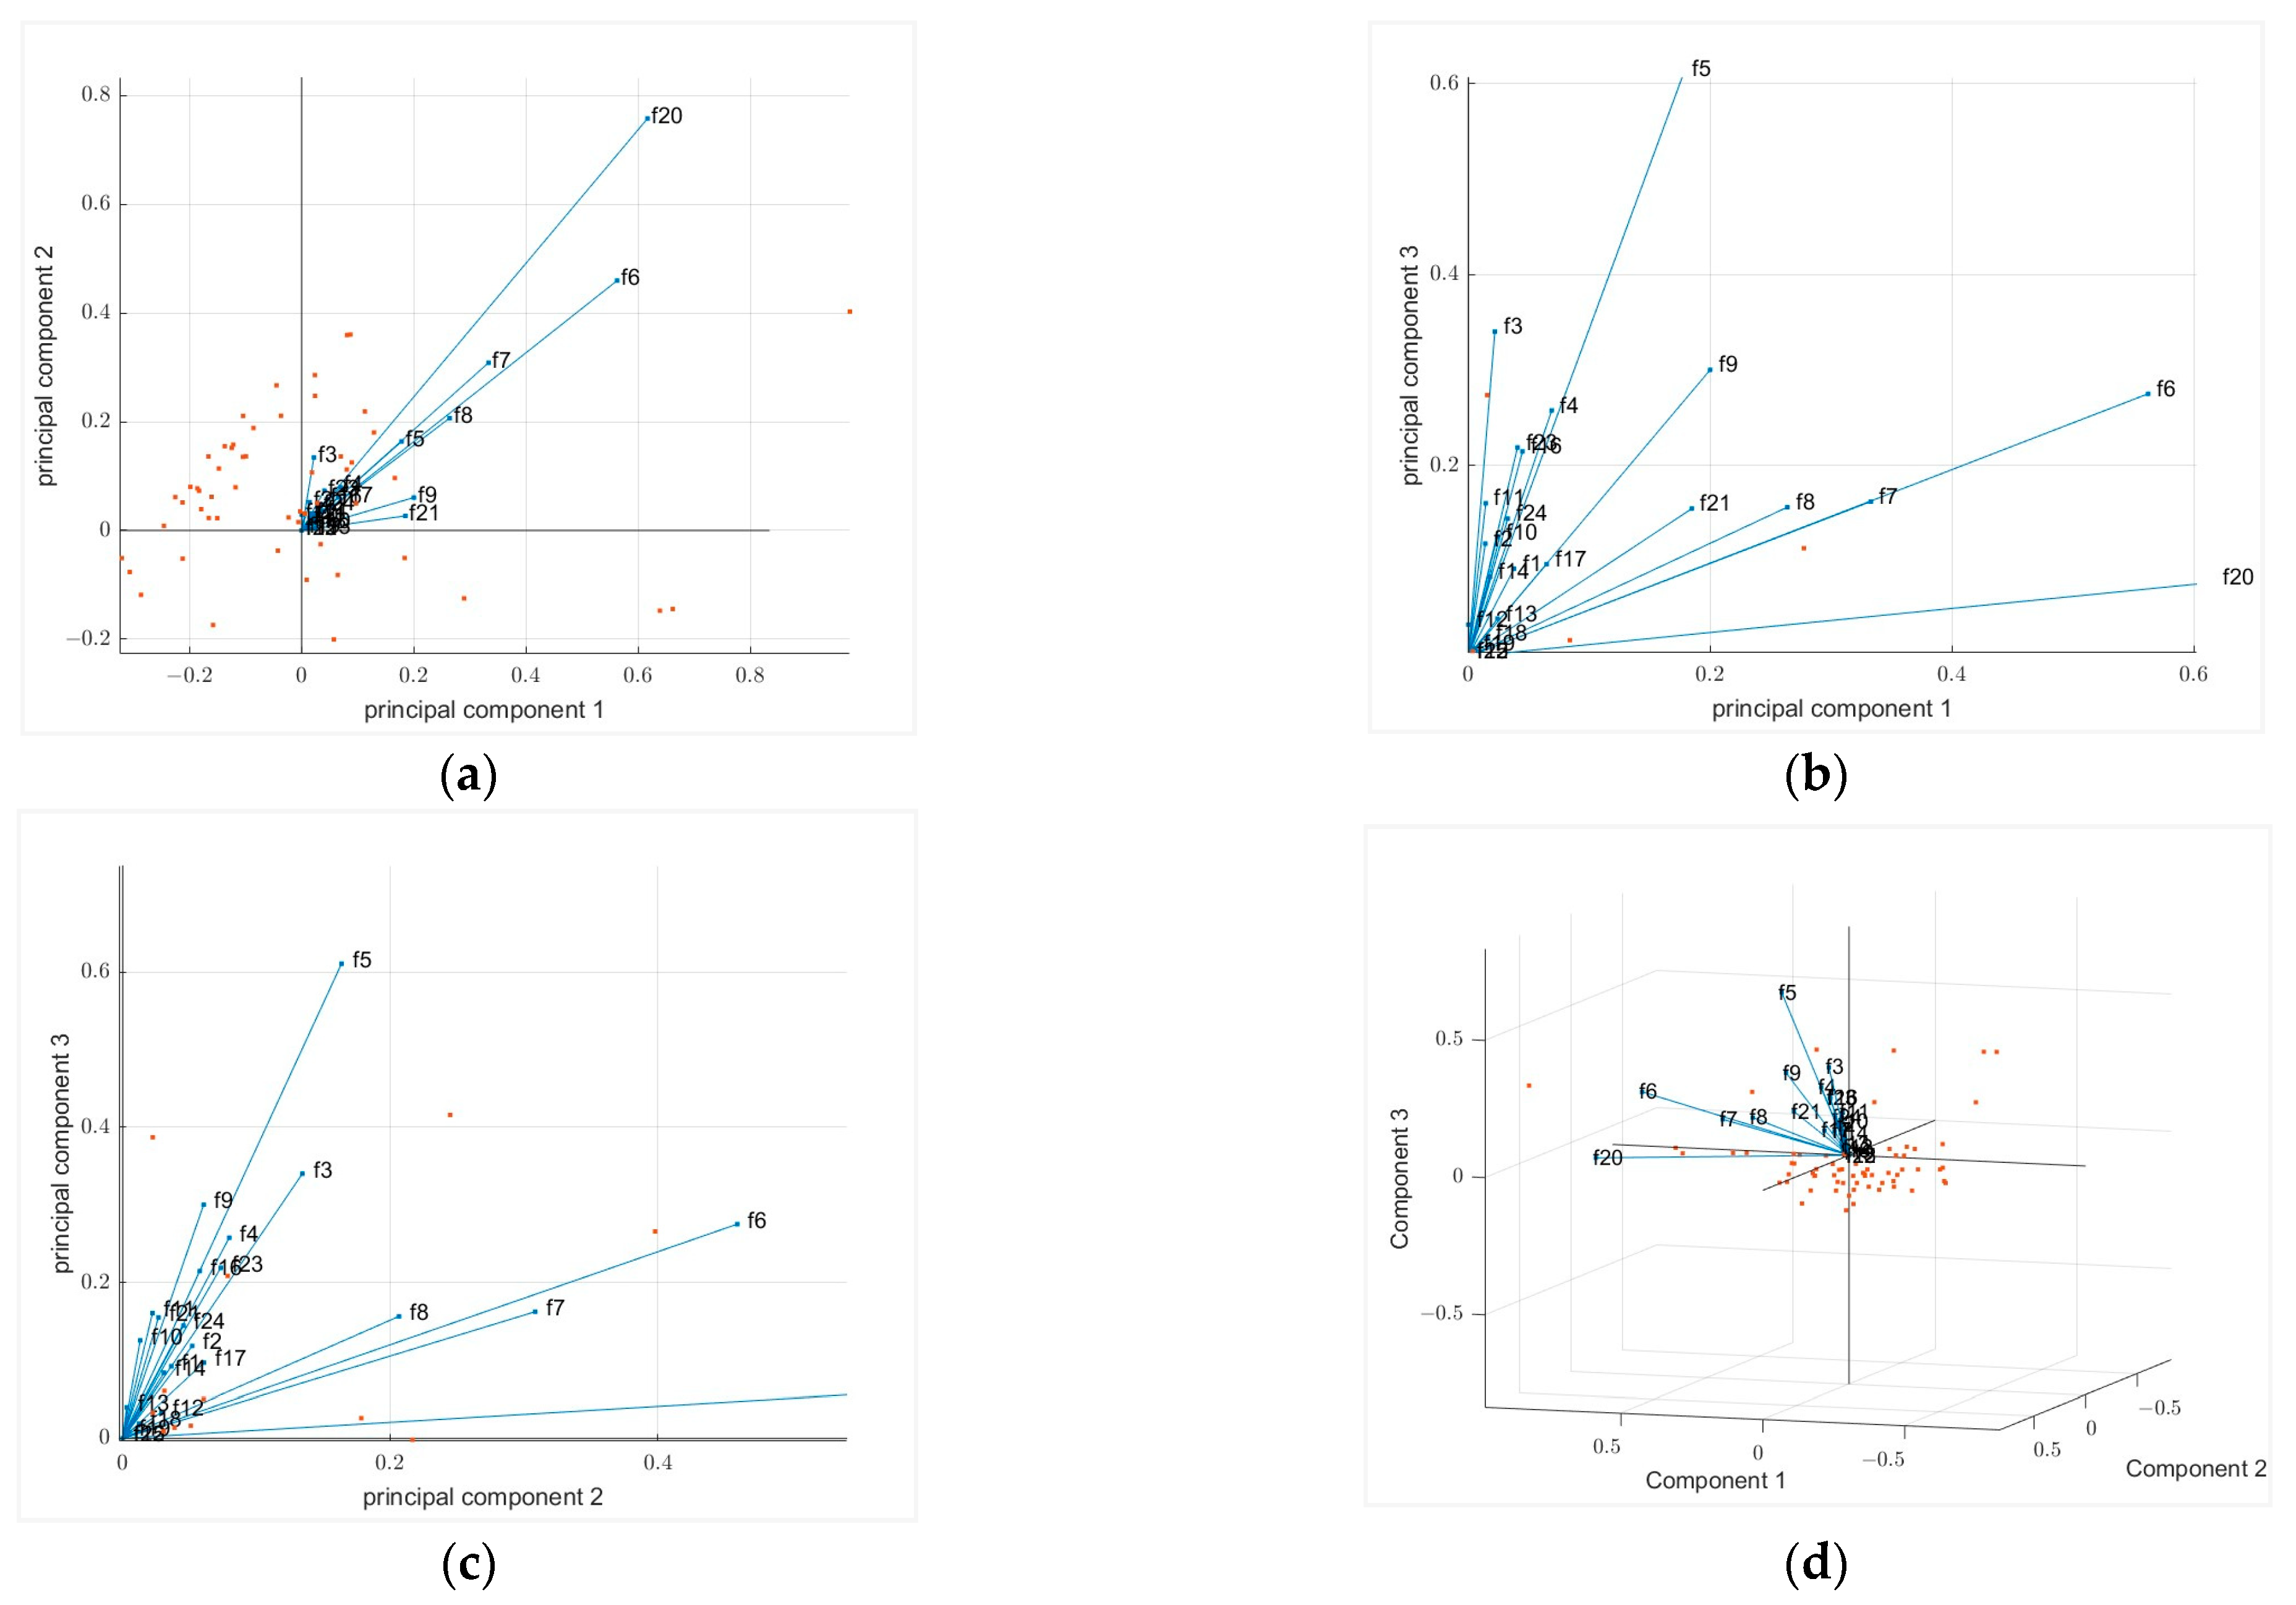
The construction industry, being vital for a country’s economic development, is characterized by productivity challenges in Kampala, Uganda. Furthermore, the activities involved in the construction industry are labour-intensive such as construction of in situ concrete beams. This therefore creates a need for the exploration of factors affecting the production rates of in situ concrete beams. This study therefore identifies and ranks the factors affecting the production rates of in situ concrete beams. From the data analyses conducted through principal component analysis, this paper underscored beam length, daily temperature, the number of helpers, and the number of electricians, with average co-efficient values of 0.98, 0.882, 0.78, and 0.66, respectively, as the top four key factors affecting production rates. These values were reinforced by graphical visualization in bi-plots generated in MATLAB that further emphasized the significance of these factors in the direction of each principal component. The findings on construction productivity provide insights for construction professionals, project managers, and policymakers in optimizing production rates in the construction industry. Further research in this area could explore additional factors influencing production rates and investigate strategies to enhance productivity and efficiency in construction projects.
4.2. Recommendations
The identification of beam length, the number of helpers, and weather conditions as the key factors affecting production rates was carried out. Thus, it is imperative that construction professionals carefully consider and prioritize these factors and understand their impact on production rates for more accurate estimations and better project management. Furthermore, it is vital to develop a standardized training program for the core workforce in this highly informal sector to develop a more competent and efficient workforce. The subset of essential features identified sets a foundation for the adoption of data-driven analyses such as intelligent machine learning systems to enable an accurate production rate estimation for the optimization of material and labour resource allocation to ensure successful project delivery within contractual budgets and schedule timelines. Additionally, given the informal nature of the construction sector in Uganda and the continued reliance on in situ reinforced concrete, there is an overwhelming need for the adoption of much more efficient and innovative industrialized concrete building construction to enable the competitiveness of reinforced in situ concrete for the future development of the informal construction sector.
Author Contributions
R.E. was involved in the formulation of the problem to be studied, designing the data collection instruments and writing up algorithms in MATLAB. R.E. also contributed to the write-up of different sections of the paper and coordinated the different activities in the work. C.K. and M.R. participated in designing data collection instruments, data collection, algorithm implementation in MATLAB, analysis, and the write-up of the journal paper. H.L. and G.G.T. contributed to writing up different sections of the journal paper. H.L. and G.G.T. also played a supervisory role throughout the other stages, providing valuable input and insights that improved the quality of the work. All authors have read and agreed to the published version of the manuscript.
Funding
This research received no external funding.
Data Availability Statement
The data were collected from construction sites about on-going operations. Due to privacy agreements made with the companies whose projects we studied, these data are unavailable.
Conflicts of Interest
Author Getaneh Gezahegne Tiruneh was employed by the company PME Inc. and EllisDon. The remaining authors declare that the research was conducted in the absence of any commercial or financial relationships that could be construed as a potential conflict of interest.
References
- Alaloul, W.S.; Musarat, M.A.; Rabbani, M.B.A.; Iqbal, Q.; Maqsoom, A.; Farooq, W. Construction sector contribution to economic stability: Malaysian gdp distribution. Sustainability 2021, 13, 5012. [Google Scholar] [CrossRef]
- Alinaitwe, H.M.; Mwakali, J.A.; Hansson, B. Factors affecting the productivity of building craftsmen—Studies of Uganda. J. Civ. Eng. Manag. 2007, 13, 169–176. [Google Scholar] [CrossRef]
- UBOS. 2014 NPHC-Main Report Main Report National Population and Housing Census 2014. 2016. Available online: www.ubos.org (accessed on 15 June 2024).
- Msinjili, N.S.; Makunza, J.; Akindahunsi, A.A. Infrastructural development in Africa by use of suitable construction approaches. In Proceedings of the ACCTA—International Conference on Advances in Cement and Concrete Technology in Africa 2013, Johannesburg, South Africa, 28–30 January 2013. [Google Scholar] [CrossRef]
- Mojapelo, K.S.; Kupolati, W.K.; Ndambuki, J.M.; Sadiku, E.R.; Ibrahim, I.D.; Maepa, C. Sustainable usage and the positive environmental impact of wastewater dry sludge-based concrete. Results Mater. 2022, 16, 100336. [Google Scholar] [CrossRef]
- Ramadan, B.; Nassereddine, H.; Taylor, T.R.B.; Goodrum, P. Impact of Technology Use on Frontline Supervision Practices in the Construction Industry. In Proceedings of the 2023 5th International Congress on Human-Computer Interaction, Optimization and Robotic Applications (HORA), Istanbul, Turkey, 8–10 June 2023. [Google Scholar] [CrossRef]
- Hiyassat, M.A.; Hiyari, M.A.; Sweis, G.J. Factors affecting construction labour productivity: A case study of Jordan. Int. J. Constr. Manag. 2016, 16, 138–149. [Google Scholar] [CrossRef]
- Katende, J.; Alinaitwe, H.; Tindiwensi, D. A Study into the Factors Hindering Development of the Construction Industry in Uganda. Available online: https://www.semanticscholar.org/paper/A-Study-into-the-Factors-Hindering-Development-of-Katende-Alinaitwe/010a2a4681eeae12e8a39595f3660d3ec339f1ae (accessed on 15 June 2024).
- Löfgren, I.; Gylltoft, K. In-Situ Cast Concrete Building Important Aspects of Industrialised Construction. 2001. Available online: https://research.chalmers.se/publication/9232 (accessed on 15 June 2024).
- Jarkas, A.M. Buildability Factors Influencing Concreting Labor Productivity. J. Constr. Eng. Manag. 2012, 138, 89–97. [Google Scholar] [CrossRef]
- Soleimani, S.M.; Sayyar Roudsari, S. Analytical Study of Reinforced Concrete Beams Tested under Quasi-Static and Impact Loadings. Appl. Sci. 2019, 9, 2838. [Google Scholar] [CrossRef]
- Li, L.; Li, Z.; Li, X.; Zhang, S.; Luo, X. A new framework of industrialized construction in China: Towards on-site industrialization. J. Clean. Prod. 2020, 244, 118469. [Google Scholar] [CrossRef]
- BuHamdan, S.; Alwisy, A.; Bouferguene, A.; Al-Hussein, M. Novel Approach to Overcoming Discontinuity in Knowledge: Application in Value-Adding Frameworks in Construction Industry. J. Constr. Eng. Manag. 2019, 145, 04019045. [Google Scholar] [CrossRef]
- Kamali, M.; Hewage, K.; Milani, A.S. Life cycle sustainability performance assessment framework for residential modular buildings: Aggregated sustainability indices. Build. Environ. 2018, 138, 21–41. [Google Scholar] [CrossRef]
- Nawi, M.N.M.; Lee, A.; Anuar, K.; Kamar, M.; Hamid, Z. Critical success factors for improving team integration in Industrialised Building System (IBS) construction projects: The Malaysian case. Malays. Constr. Res. J. 2012, 10, 44–62. [Google Scholar]
- Gan, Y.; Shen, L.; Chen, J.; Tam, V.W.Y.; Tan, Y.; Illankoon, I.M.C.S. Critical factors affecting the quality of industrialized building system projects in China. Sustainability 2017, 9, 216. [Google Scholar] [CrossRef]
- Sookdeo, B. Using method analysis to improve productivity: Case of a tap manufacturer. Int. J. Prod. Perform. Manag. 2020, 70, 1470–1486. [Google Scholar] [CrossRef]
- Choo, B.S. 25—Reinforced and prestressed concrete. In Advanced Concrete Technology; Newman, J., Choo, B.S., Eds.; Butterworth-Heinemann: Oxford, UK, 2003; pp. 3–17. [Google Scholar] [CrossRef]
- Yi, W.; Chan, A.P.C. Critical Review of Labor Productivity Research in Construction Journals. J. Manag. Eng. 2014, 30, 214–225. [Google Scholar] [CrossRef]
- Alaghbari, W.; Al-Sakkaf, A.A.; Sultan, B. Factors affecting construction labour productivity in Yemen. Int. J. Constr. Manag. 2019, 19, 79–91. [Google Scholar] [CrossRef]
- Thomas, A.V.; Sudhakumar, J. Critical analysis of the key factors affecting construction labour productivity—An Indian perspective. Int. J. Constr. Manag. 2013, 13, 103–125. [Google Scholar] [CrossRef]
- Dozzi, S.P.; AbouRizk, S.M. Productivity in Construction; Institute for Research in Construction, National Research Council: Ottawa, ON, Canada, 1993; p. 44. [Google Scholar]
- Williams, T.J. Relationships between Cost Estimates, Scheduling and Project Success in the Construction Sector. Ph.D. Thesis, Walden University, Minneapolis, MN, USA, 2021. [Google Scholar]
- Vigneshwar, R.V.K.; Shanmugapriya, S. Investigating the factors affecting construction site productivity—A case of India. Eng. Constr. Arch. Manag. 2022, 30, 963–985. [Google Scholar] [CrossRef]
- Neira, A.M. Evaluation of the Most Significant Factors Influencing the Production Rates of Highway Construction Activities. Master’s Thesis, The University of Texas Rio Grande Valley, Edinburg, TX, USA, 2019. [Google Scholar]
- Mahamid, I. Principal Factors Impacting Labor Productivity of Public Construction Projects in Palestine: Contractors’ Perspective. Int. J. Archit. Eng. Constr. 2013, 2, 194–202. [Google Scholar]
- Espinosa-Garza, G.; Loera-Hernández, I.; Antonyan, N. Increase of productivity through the study of work activities in the construction sector. Procedia Manuf. 2017, 13, 1003–1010. [Google Scholar] [CrossRef]
- Shah, D.; Patel, P. Productivity Improvement by Implementing Lean Manufacturing Tools in Manufacturing Industry. Int. Res. J. Eng. Technol. 2018, 5, 3794–3798. [Google Scholar]
- Nassazi, A. Effects of Training on Employee Performance: Evidence from Uganda. 2013. Available online: https://api.semanticscholar.org/CorpusID:167720972 (accessed on 15 June 2024).
- Kamble, R.; Kulkarni, V. Productivity Improvement at Assembly Station Using Work Study Techniques. Int. J. Res. Eng. Technol. 2014, 3, 480–487. [Google Scholar]
- Khandve, N.J. Productivity Improvements through Work Study Methods. Int. J. Sci. Res. Dev. 2017, 5, 2321–2613. [Google Scholar]
- Gujar, S.; Moroliya, M.R. Increasing the Productivity by Using Work Study in a Manufacturing Industry—Literature Review. Int. J. Mech. Prod. Eng. Res. Dev. 2018, 8, 369–374. [Google Scholar] [CrossRef]
- Adinyira, E.; Boadu, V.; Baiden-Amissah, A. Productivity Measurement Techniques Adopted by Construction Firms in Ghana. In Proceedings of the 7th International Conference on Infrastructure Development in Africa, ICIDA, Lagos, Nigeria, 28–30 March 2018. [Google Scholar]
- Alavi, M.; Visentin, D.C.; Thapa, D.K.; Hunt, G.E.; Watson, R.; Cleary, M. Exploratory factor analysis and principal component analysis in clinical studies: Which one should you use? J. Adv. Nurs. 2020, 76, 1886–1889. [Google Scholar] [CrossRef] [PubMed]
- Jolliffe, I.T.; Cadima, J. Principal component analysis: A review and recent developments. Philos. Trans. R. Soc. A Math. Phys. Eng. Sci. 2016, 374, 20150202. [Google Scholar] [CrossRef]
- Jolliffe, I.T. Principal Component Analysis, 2nd ed.; Springer: Berlin/Heidelberg, Germany, 2002. [Google Scholar]
- Valle, S.; Li, W.; Qin, S.J. Selection of the number of principal components: The variance of the reconstruction error criterion with a comparison to other methods. Ind. Eng. Chem. Res. 1999, 38, 4389–4401. [Google Scholar] [CrossRef]
- Muggeo, V.M.R. Principal Component Analysis via correlations or covariances? no better alternative? In Proceedings of the 35th International Workshop on Statistical Modelling (IWSM), Bilbao, Spain, 19–24 July 2020; Irigoien, I., Lee, D.-J., Martínez-Minaya, J., Rodríguez-Álvarez, M.X., Eds.; University of Palermo: Palermo, Italy, 2020. [Google Scholar] [CrossRef]
Disclaimer/Publisher’s Note: The statements, opinions and data contained in all publications are solely those of the individual author(s) and contributor(s) and not of MDPI and/or the editor(s). MDPI and/or the editor(s) disclaim responsibility for any injury to people or property resulting from any ideas, methods, instructions or products referred to in the content. |
© 2024 by the authors. Licensee MDPI, Basel, Switzerland. This article is an open access article distributed under the terms and conditions of the Creative Commons Attribution (CC BY) license (https://creativecommons.org/licenses/by/4.0/).