1. Introduction
The foundation pit engineering construction environment presents increasing challenges as urban underground space development expands [
1,
2]. In coastal areas, groundwater levels are high, and the soil layer is mostly made up of sand and gravel. The sand layer is porous and permeable; therefore, soil particles are easily transported. Excavating foundation pits in such conditions can lead to variations in the water levels inside and outside the pit. It is difficult to avoid defects or places of weakness in the foundation pit retaining structure due to factors such as the construction environment and construction quality [
3], which can result in water and sand leakage that leads to the progressive development of a hollow inside the layers. This may ultimately cause surface sinking, posing a threat to the safety of construction workers and the equipment.
Table 1 illustrates typical engineering catastrophes caused by surface sinking, due to water and sand leakage throughout the retaining structure.
The majority of recent research on engineering issues related to sand and water leakage has primarily concentrated on mining, water-rich tunnels, and dams [
9,
10,
11,
12,
13,
14,
15]. For example, Zhang et al. [
9] studied the water and sand leakage in shield tunnels in water-rich sand formations; Zheng et al. [
10] studied the deformation of strata triggered by water and sand leaks, using an elliptic theoretical model; and Sato et al. [
11] simulated the process of seepage erosion of underground structures after cracking, and concluded that the dominant channel for water–sand migration tends to be the closest path on the ground surface to the structural cracks. However, there has been a lack of attention given to water and sand leakage in foundation pit engineering. In terms of research on ground settlement due to pit excavation considering hydraulic factors, researchers are currently focusing on the pit dewatering process, with little consideration given to the combined loss of water and sand [
16,
17,
18]. Thus, the hazards of water and sand loss in foundation pits warrant more attention and thorough investigation to guarantee the stability and safety of construction projects.
The phenomenon of water–sand loss is, fundamentally, a significant deformation engineering problem caused by the interaction of fluid and sand particles. Among the various numerical analytical tools, the FEM approach is based on continuous media mechanics [
19], which makes it challenging to respond to the aforementioned engineering phenomena. In contrast, the DEM method discretizes the geotechnical body at a microscopic level and is frequently utilized to simulate extensive deformations and discontinuous processes of discrete particle assemblies under both quasi-static and dynamic conditions [
20,
21,
22]. The CFD–DEM coupling approach combines the analytical advantages of DEM and addresses the practical challenges of macro-scale particle response based on the fundamental principles of microscopic particle interaction. In recent years, some researchers have conducted simulation studies based on the CFD-DEM coupling method, effectively addressing large deformation engineering challenges in water-rich geological settings [
23,
24,
25].
It is worth noting that in the research on water and sand leakage in foundation pits using the CFD-DEM coupling method, Dai Xuan et al. [
26] analyzed the deformation of the stratum and the distribution of the stress field. However, the aforementioned analytical model is still limited to a two-dimensional scale and has not thoroughly analyzed the mechanism of disaster development from the perspectives of geostress and fluid. In conclusion, while assessing ground deformation caused by foundation pits, existing research paid less attention to the joint action elements of water leakage and sand leakage from enclosure structures, and research on the breeding mechanism of ground deformation is still limited. ln order to comprehensively investigate the process of water and sand leaking from the enclosing construction of a water-rich defective foundation pit, as well as its impact on ground deformation, this study established a discrete element three-dimensional model, analyzed the changes in the displacement field and stress field of the sand layer, and explored the process of catastrophe occurrence based on the principle of CFD–DEM computation.
2. Principles of Calculation and Simulation Background
2.1. Flow Field and Displacement Distribution
2.1.1. Fluid Calculation
The CFD module takes modified N-S equations for fluid calculations, accounting for the coupling effect of fluid–solid interaction. The flow field is considered to be continuous in space. Thus, the updated N-S equations and continuity equation for fluid motion are as follows:
where
ρf is the fluid density;
ε is the porosity of the fluid element;
is the average velocity of the fluid element;
u is the fluid viscosity;
is the pressure gradient of the fluid; and
fb is the volume force applied to the fluid by the particles.
where
V is the volume of the fluid grid;
j is the number of particles in the fluid grid; and
fdrag is the modified drag force on the particles.
2.1.2. Fluid–Particle Interaction Force
The total force of fluid–particle interaction is
The fluid’s drag force of the particles can be calculated individually for each particle, and the updated drag force equation is as follows:
where
represents the fluid drag force for individual particles, and
explains the empirical factor of local porosity. This adjustment term permits the drag force to be applied to systems with high and low porosity, as well as a wider range of Reynolds numbers. For a single particle, the drag force is given by
where
r is the particle radius;
v is the fluid velocity;
u is the particle velocity;
is the drag force coefficient; and the drag force coefficient is given by
The empirical coefficient is given by
The Reynolds number of a particle is defined as
where
u is the dynamic viscosity of the fluid.
2.1.3. Fluid–Solid Coupling
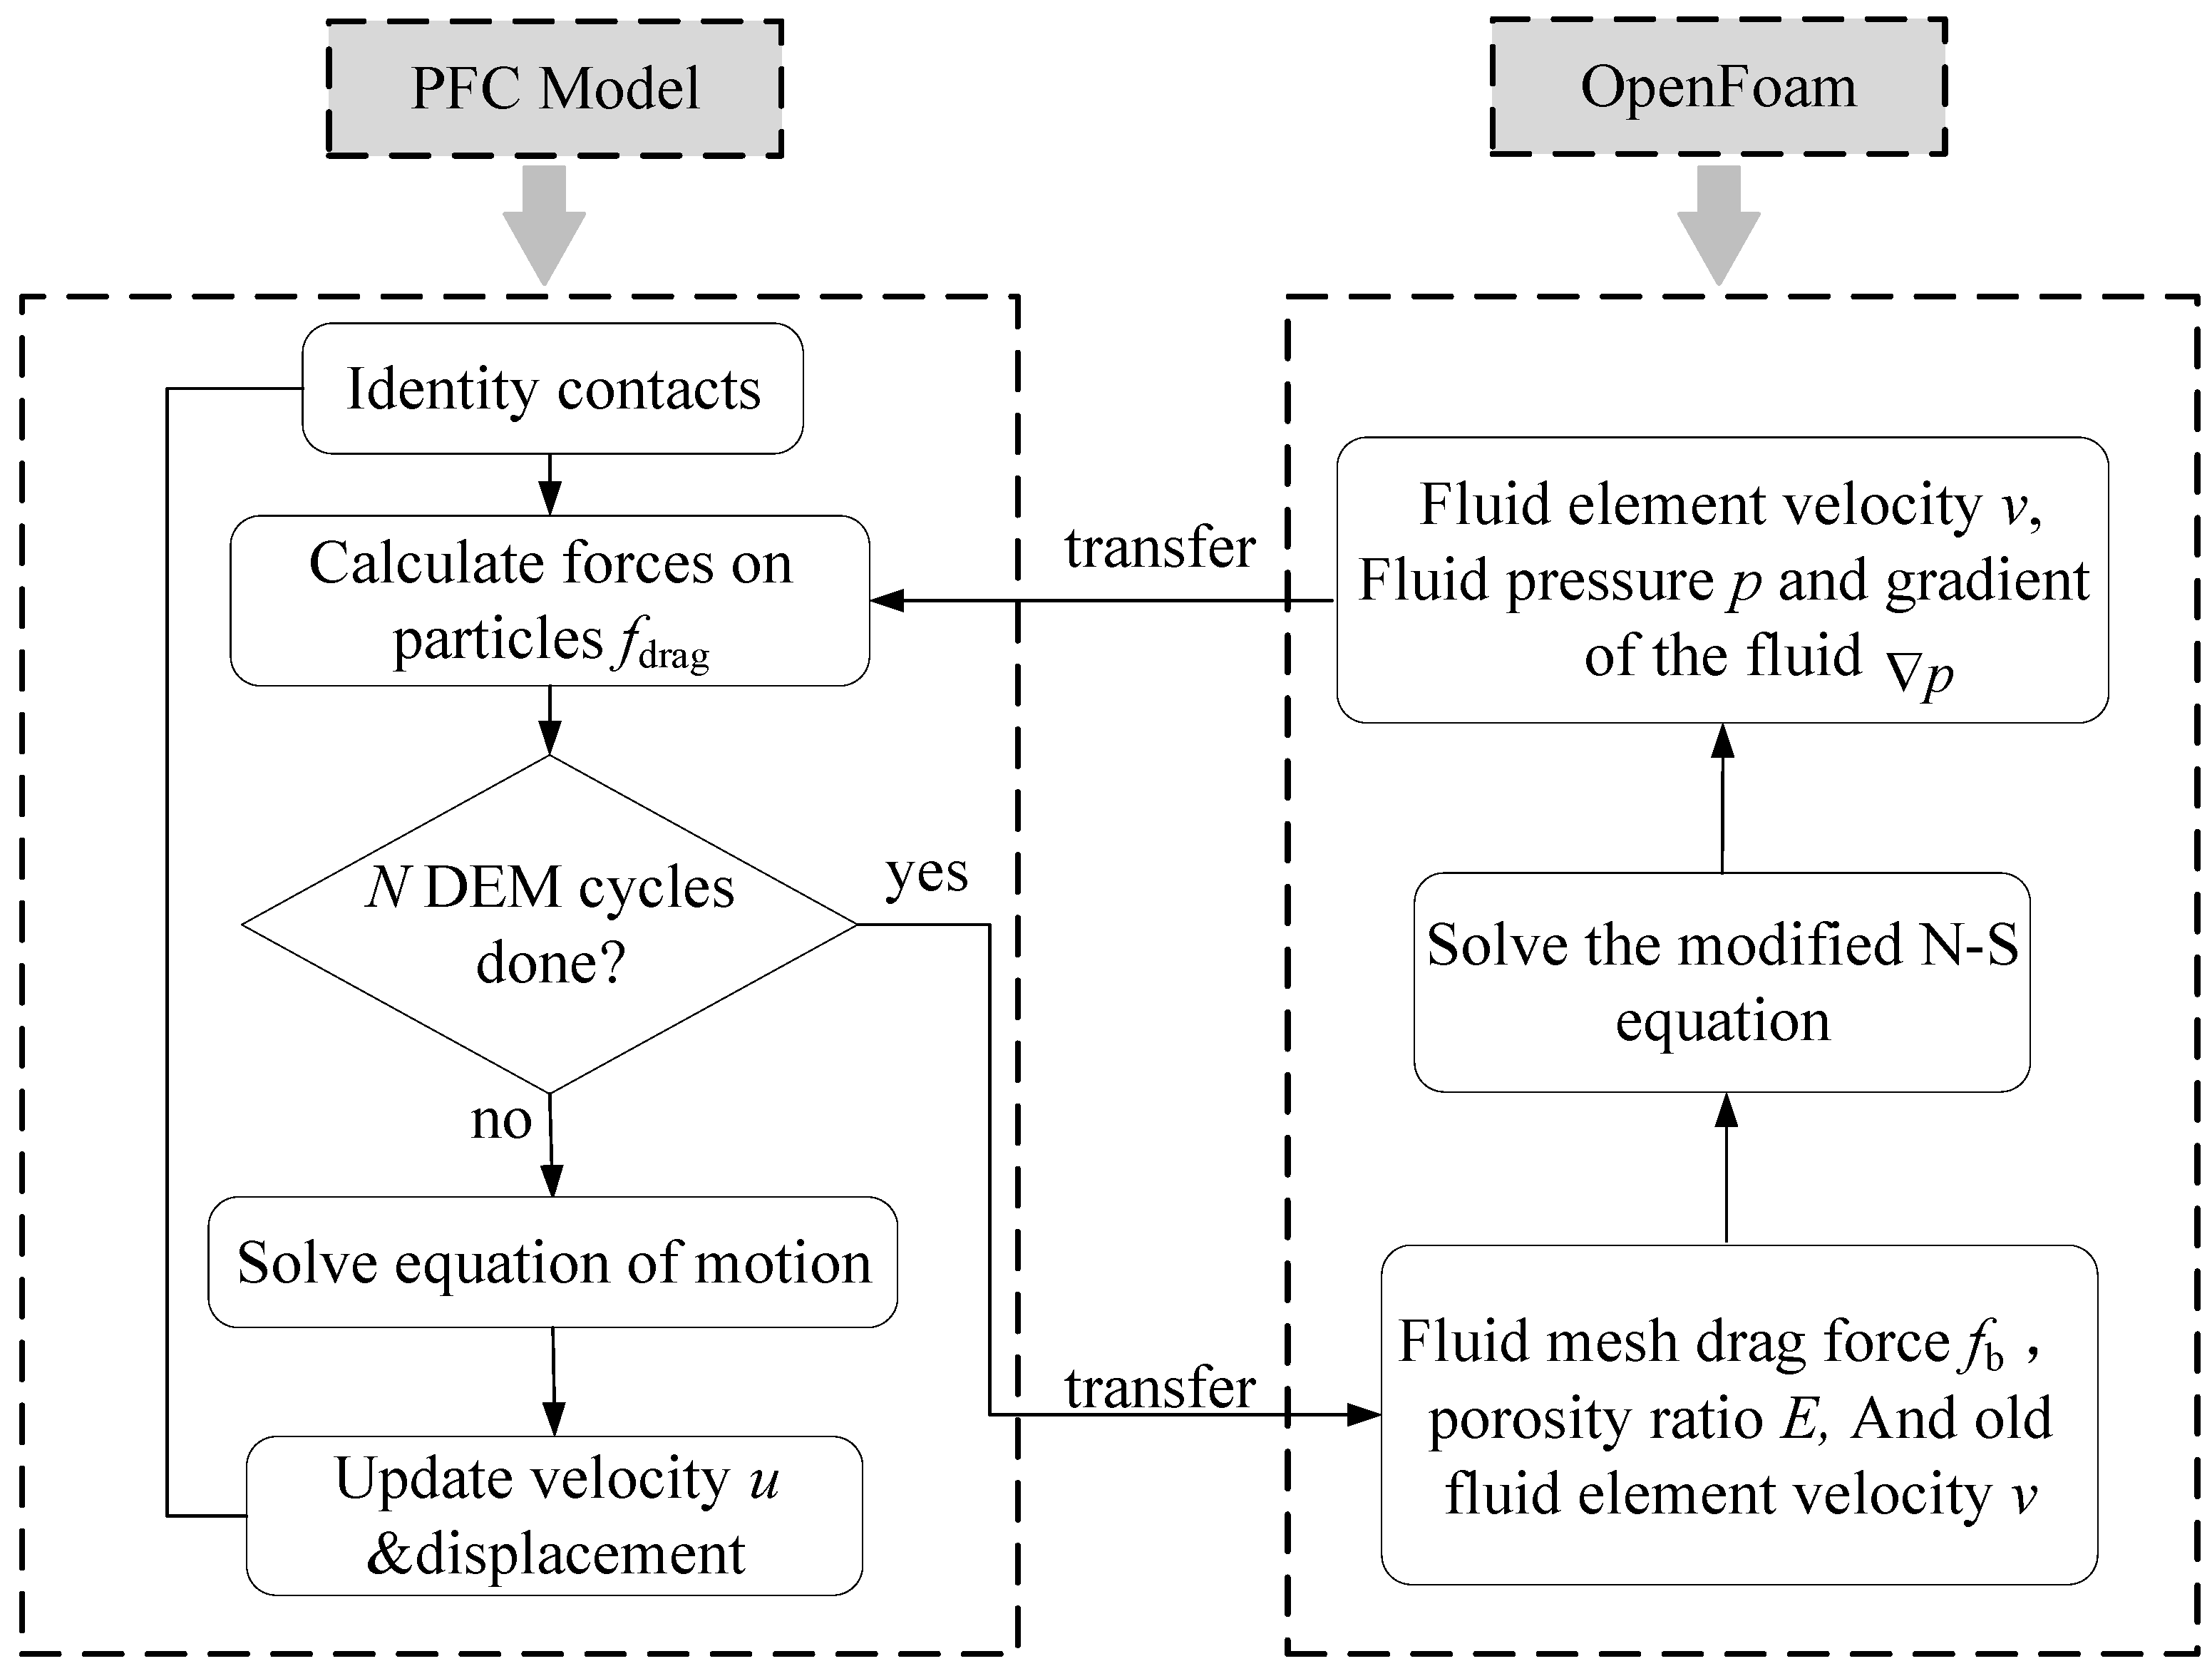
The flowchart of the Openfoam-PFC
3D coupling simulation is shown in
Figure 1. As shown in
Figure 1, a pit model is established by PFC
3D. By recognizing the connections between particles, PFC
3D automatically calculates the particle drag force
fdrag. After activating PFC
3D’s built-in CFD module, coarse fluid meshes are created, and the average porosity
ε, average velocity
, and volume force
fb of the fluid elements are automatically calculated. The time step of PFC
3D Δ
tDEM during the simulation process is usually smaller than the time step of CFD Δ
tCFD, and
N Δ
tDEM typically needs to meet a Δ
tCFD. Once
N time steps of PFC
3D are completed, the information automatically calculated by the CFD module will be transmitted to Openfoam.
Openfoam calculates fluid element velocity v, fluid element pressure p, and fluid element pressure gradient , based on the continuity equation of fluid motion and the modified N-S equation, and then sends this information to PFC3D. The CFD module of PFC3D updates the relevant information, and the particles in the fluid mesh implement information iteration based on the force–displacement law. The realization of fluid–structure coupling is achieved through the cycle of the above process.
2.2. Generalization of Engineering Phenomena
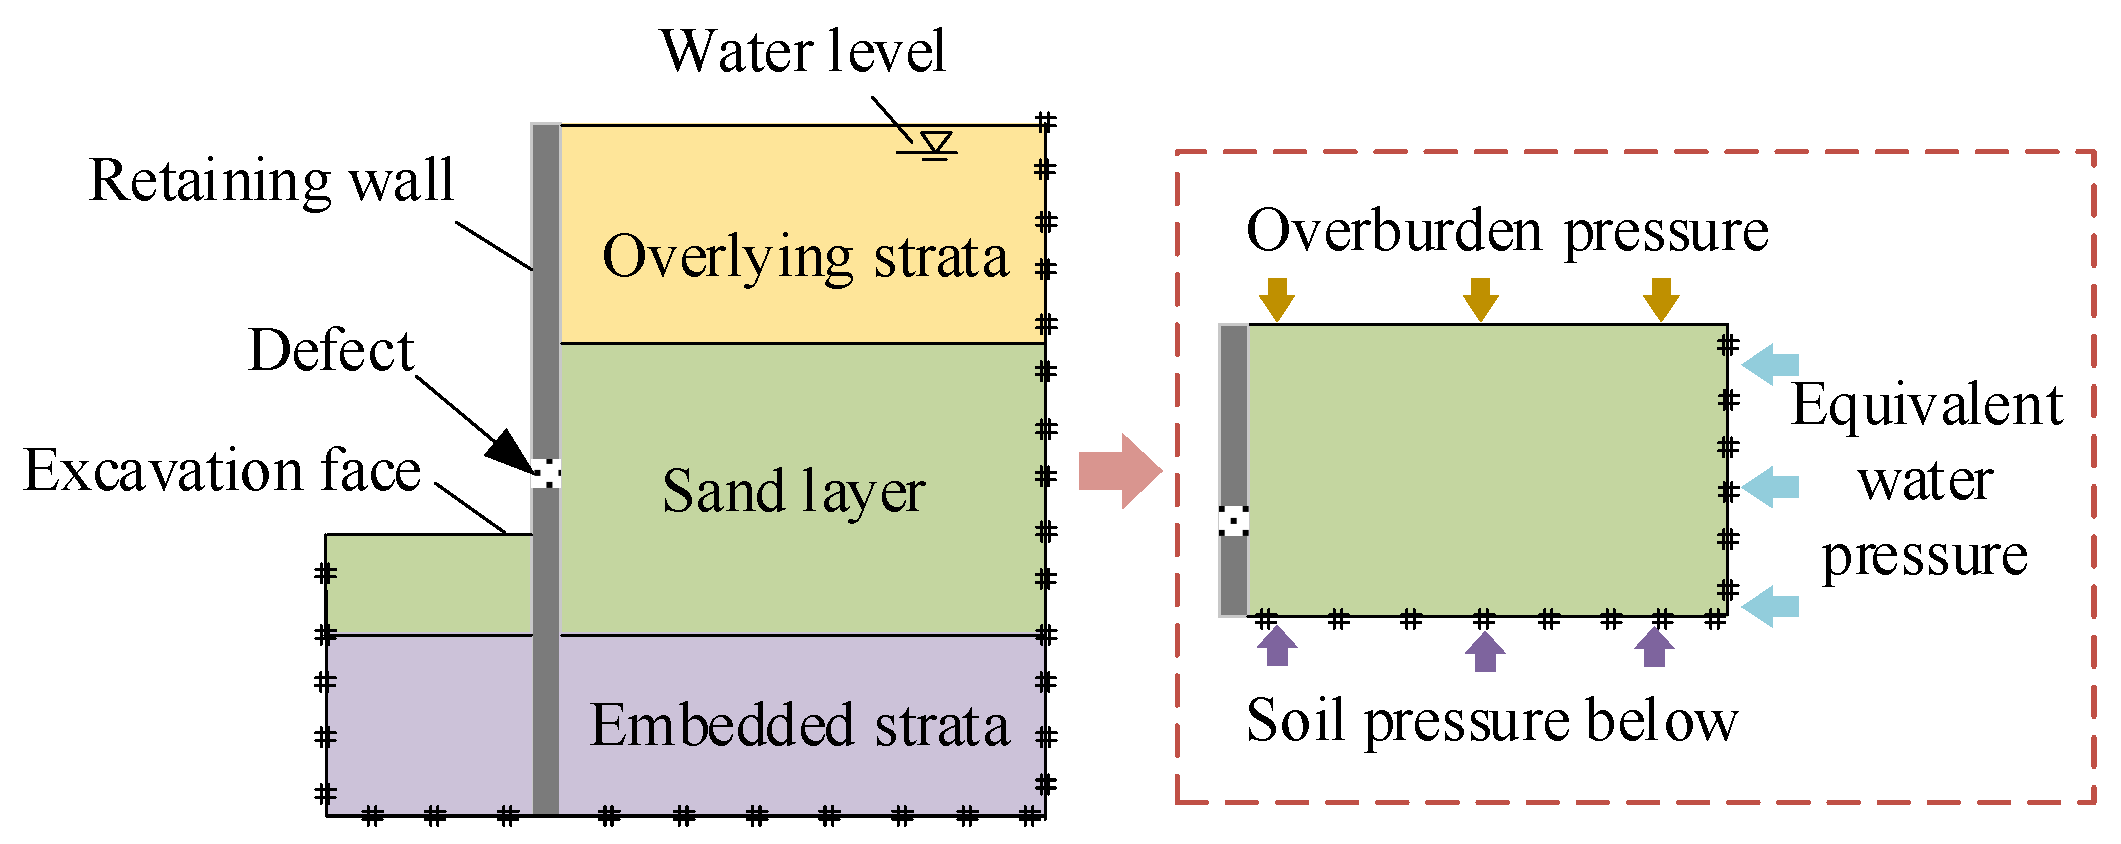
The previous cases were investigated to summarize the boundary of the water–sand loss, as shown in
Figure 2. Taking the metro pit project in China as a case study, the water supply outside the foundation pit originates from the river and the sea, with a constant water level; the stratum consists of silt and medium sand. Due to poor construction quality, there is a weak zone in the diaphragm wall [
8].
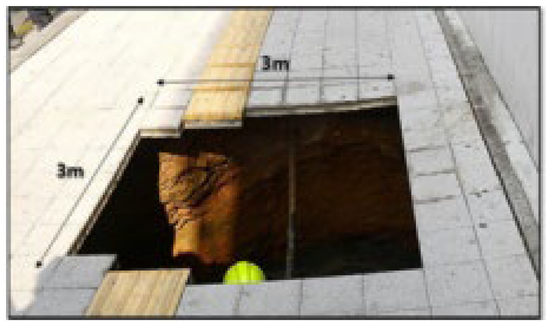
The above-mentioned water and sand loss disasters all involve a sudden and gradual process. The excavation causes a water level difference between the inside and outside of the pit, allowing groundwater to easily pass through the weak area of the diaphragm wall; thus, the water leakage abruptly changes into water–sand leakage. During water and sand leakages, the process is relatively gradual. Sand particles are quickly carried due to their high pore ratio and permeability, resulting in a substantial amount of gushing water and sand in a short period of time, which causes surface subsidence. For example, during the excavation of a 38-meter-deep pit in Seoul, South Korea, water and sand leakage through the retaining structure caused the collapse of a 3 m × 3 m sinkhole outside the pit, resulting in a substantial loss of life and property safety [
6]. This study utilizes PFC
3D and Openfoam to conduct fluid–solid coupling simulation studies, qualitatively exploring the mechanisms of the aforementioned processes.
3. Pit Water and Sand Leakage Analytical Model
3.1. Model Establishment
Based on the boundary condition analysis in
Figure 1, the seepage model is shown in
Figure 3.
Figure 3 shows that the water level is at the ground surface, and the thicknesses of the overlying stratum, aquifer, and buried stratum are 1.5 m, 12 m, and 3 m, respectively. Taking solely the support function of the diaphragm wall into account, the width of the pit is 10.5 m, which is buried at a depth of 15 m and has a thickness of 1 m. The foundation pit’s outer stratum is 15 m long. The main focus of this study is the change in the stress field, displacement field, and fluid energy of the sand layer. Meanwhile, the geological conditions of the above strata and the underlain strata are complex; therefore, it is reasonable to treat the underlain strata as a sand layer.
Following the research methods of scaling the model [
12,
22], the numerical model is set with a gravitational acceleration of 100 g to resemble test conditions with a similarity ratio of 100. According to the similarity ratio, the non-dimensionalized quantity of the real length is
where
L is the actual length, m;
H is the height from the surface to the bottom of the defect, m.
A rectangular DEM sample of 24 cm (length) × 15 cm (height) × 10.5 cm (width) is established using the layered compression method. The model is run for 100,000 load steps to generate an initial stress state in the stratum before the pit is excavated. Following that, the rigid diaphragm wall and excavation are finished, with an excavation depth of 11.5 cm. The abovementioned engineering cases demonstrate that joint cracks are prone to appearing at the connection of each pair of diaphragm walls due to construction quality and other factors [
4,
5]. The soils are eroded along the defects, resulting in water and sand leakage. In order to improve the simulation run rate and ensure the simulation accuracy, the defects of the diaphragm wall are equivalent to a narrow rectangle of 1.5 cm (length) × 3.0 cm (height), and the bottom of the defect is buried at a depth of 9 cm.
3.2. Establishment of the Simulation Parameters and Analysis Settings Model
Based on the previous research on two-dimensional sand leakage simulation [
26], the particle size range of the sand layer is 3.5~4.1 mm, and PFC
3D is used to randomly generate particles within the aforementioned particle size range. Sand particle cohesiveness is poor; thus, the linear contact model is adopted. Based on the parameter values used in the discrete element simulation research of the sand layer [
9,
12], the friction coefficient between particles is assumed to be 0.3. The normal and tangential contact stiffnesses are taken to be 5 × 10
6 N·m
−1. The contact parameters of the particles and wall are shown in
Table 2.
To ensure the continuity of the fluid domain [
23], the CFD domain range is shown in
Figure 3. The fluid mesh is made up of 1.5-cm-wide squares. To prevent particles from escaping, rigid walls are established in the CFD domain. The model’s inlet is defined as the horizontal constant pressure boundary to simulate an infinite supply of water, the water pressure of half of the output boundary is set to 0, and the remaining boundaries are non-slip. The water’s viscosity
u is set to 0.001 Pa·s, and the density
ρf is set to 1000 kg/m
3 in Openfoam. To ensure that particles can exchange coupling information multiple times when moving in the fluid grid, the particle coupling interval of PFC
3D should be small enough. According to the user manual of PFC
3D, the ratio between the width of the fluid mesh and the product of fluid velocity
v and PFC
3D time step Δ
tDEM should exceed 3 [
27]. Meanwhile, in order to ensure the convergence of the numerical model, Δ
tDEM = 8 × 10
−8 s is determined through trials. Combining the coupling principles of Openfoam and PFC
3D mentioned above, 100 Δ
tDEM is set to meet a Δ
tCFD, and Δ
tCFD is 8 × 10
−6 s.
The total running time of the numerical model is 0.13 s, and the model is saved every 0.01 s. By means of monitoring balls and value extraction, the stress field and displacement field analyses of the stored model are completed. In the following analyses of this paper, the origin of the model and the directions of
x,
y, and
z are shown in
Figure 3, where
x is the direction of continuous water pressure,
z is the direction of gravity, and
y is the direction perpendicular to
x and
z. x = 5.25 and y = 14.8 represent the vertical slices of the model at the corresponding coordinates.
3.3. Model Validation Analysis
3.3.1. Drop Test
The accuracy of the CFD-DEM calculation method has been verified in numerous studies [
28,
29,
30,
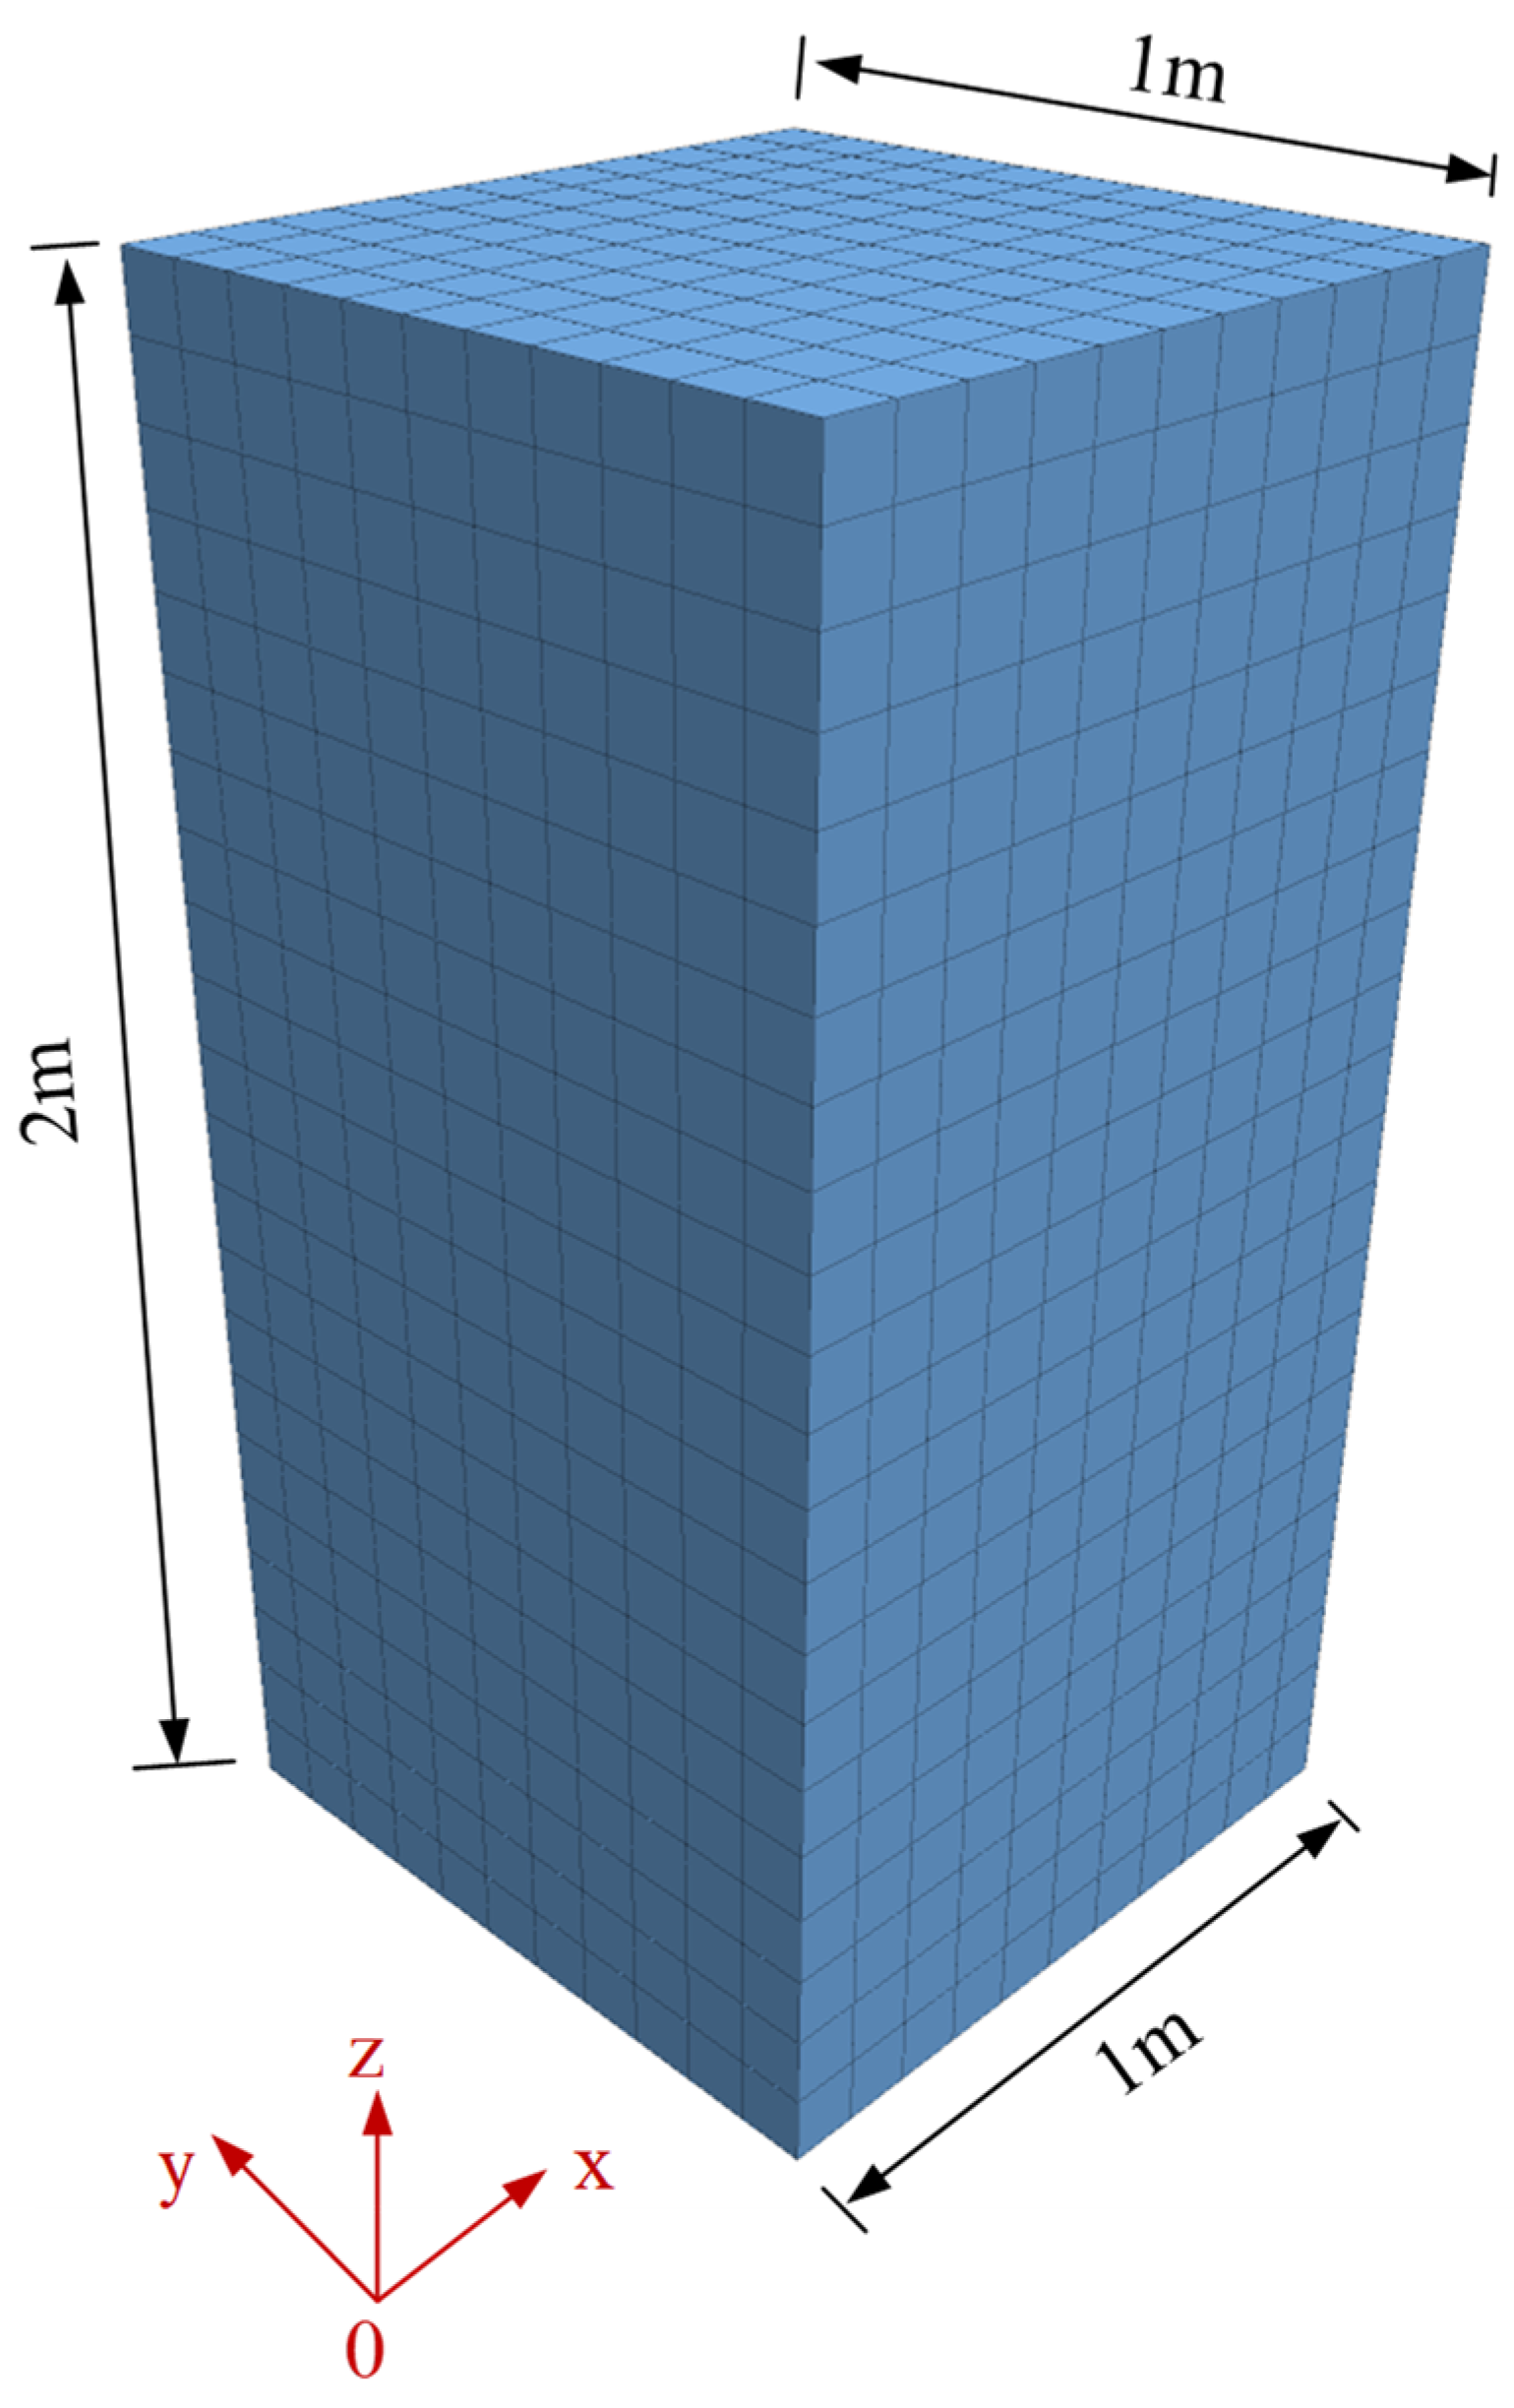
31]. To verify the accuracy of the PFC–Openfoam simulation method, the free release of underwater particles is simulated and analyzed [
29]. The simulation domain is set up as a water-filled vessel with a size of 1 m × 1 m × 2 m. Additionally, a particle with a radius of 0.0020 m is set up to settle freely in water. The numerical model of the drop test is shown in
Figure 4.
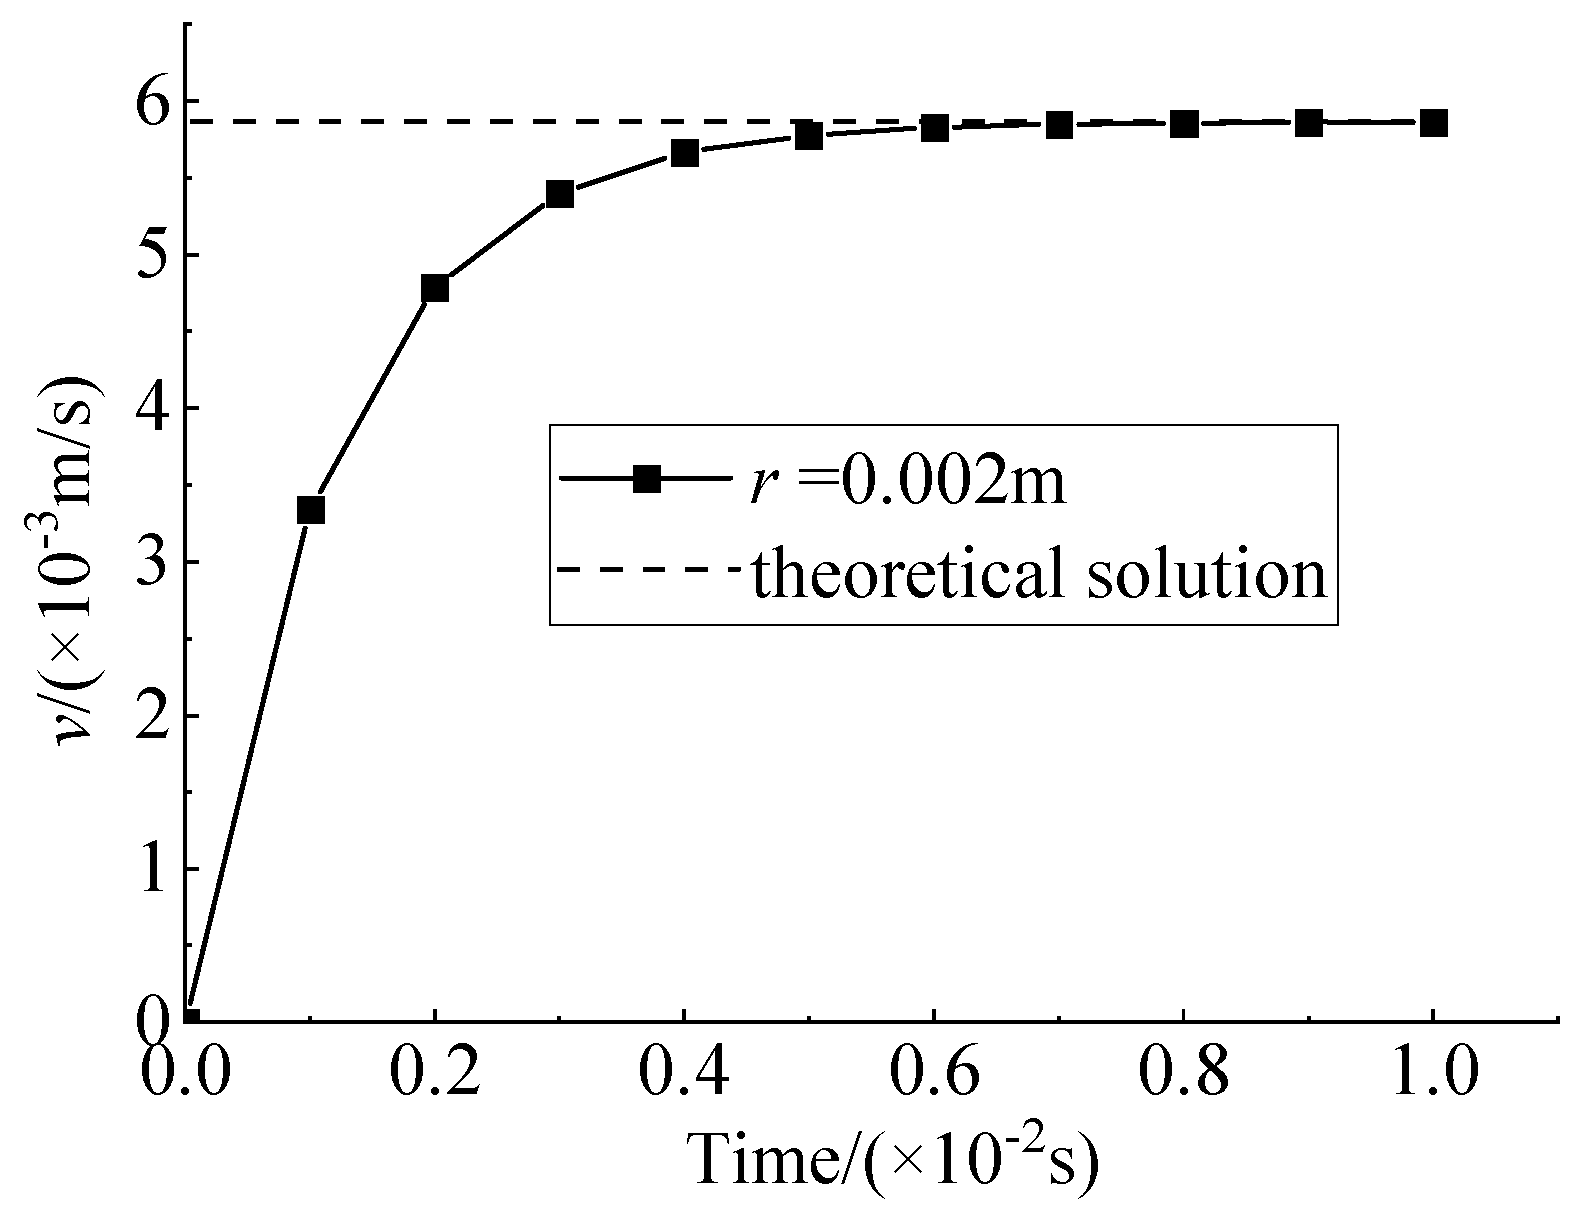
In this numerical test, the particle will eventually sink at a steady velocity due to the fluid resistance. The theoretical analytical equations for their steady velocities are given in Equations (10) and (11) [
32]. The velocity-versus-time curve during the numerical simulation is shown in
Figure 5.
where
uz is the relative velocity between the particle and the fluid,
ρp is the density of the particle, and
ρf is the density of the fluid.
The terminal velocity (
uz) of the particle in the water is
where
uf is the viscosity of the fluid.
The linear contact model is used to simulate the interaction between the particles, and the density of the particle is 2000 kg/m
3. Based on the values taken from the references, the linear contact stiffness is 1.5 × 10
6, and the friction coefficient is 0.3 [
33,
34].
Figure 5 shows that the theoretical solution of the final velocity of the particles is consistent with the numerical simulation value, thus verifying the accuracy of the PFC–Openfoam coupling method.
3.3.2. Surface Displacement Analysis
In order to further verify the engineering applicability of the above numerical model, the subsidence pattern at the top of the sand layer is analyzed. We define the formation loss rate,
MLR, as [
10]
where
γd is the dry density of the soil, N/m
3;
H is the buried depth of the defect, m;
L is the length of the stratum outside of the pit, m;
B is the width of the stratum, m; and
m is the weight of the lost sands, kg.
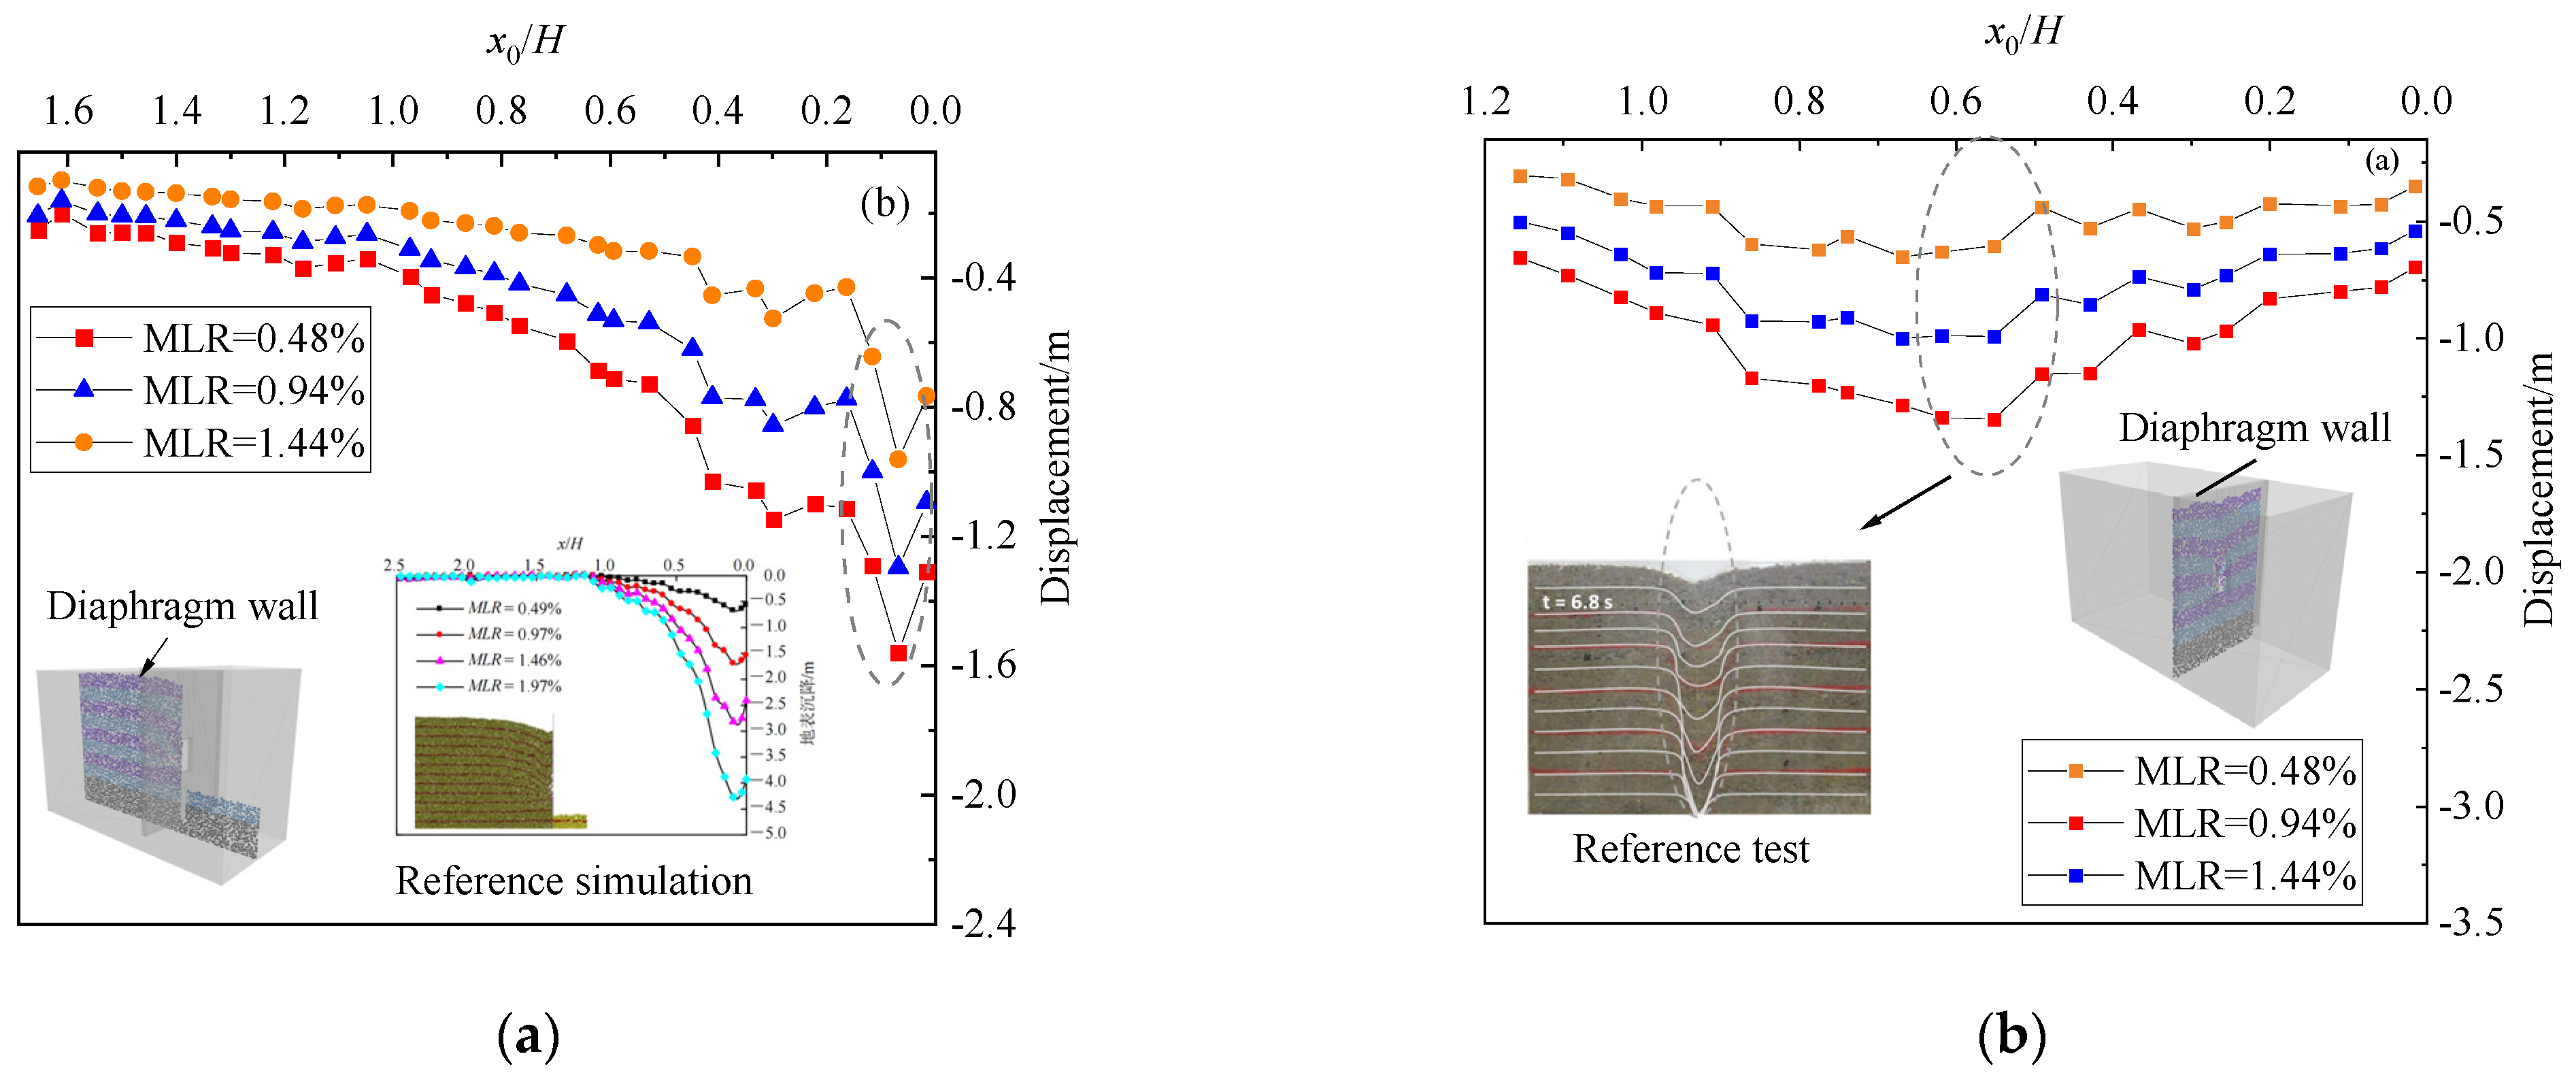
According to equation (11), the top subsidence of the x = 14.8 and y = 5.125 sand slices (
MLR = 0.48%, 0.96%, and 1.44%) is shown in
Figure 4.
As shown in
Figure 6, the subsidence curve in the
y-direction presents large values in the middle and small values on both sides. This phenomenon indicates that the surface subsidence displacement directly above the defect is the largest, which is consistent with Zheng’s experimental results [
10]. The settlement curve in the
x-direction indicates that the maximum settlement value occurs at a distance of 0.1
H from the defect. This is due to the high friction between the sand layer and the diaphragm wall, which limits the settlement of the sand layer near the wall. This finding is consistent with the stratum subsidence law of the two-dimensional water and sand leakage model [
26]. The above stratum subsidence laws remain unchanged, while the
MLR increases from 0.48% to 1.44% and the maximum subsidence value increases from 0.96 m to 1.58 m. The model reflects the surface settlement law caused by water and sand loss well, so the model can be further used to analyze the flow field distribution and stress field changes during water and sand leakage.
4. Pit Water and Sand Leakage Analytical Model
4.1. Flow Field and Displacement Distribution
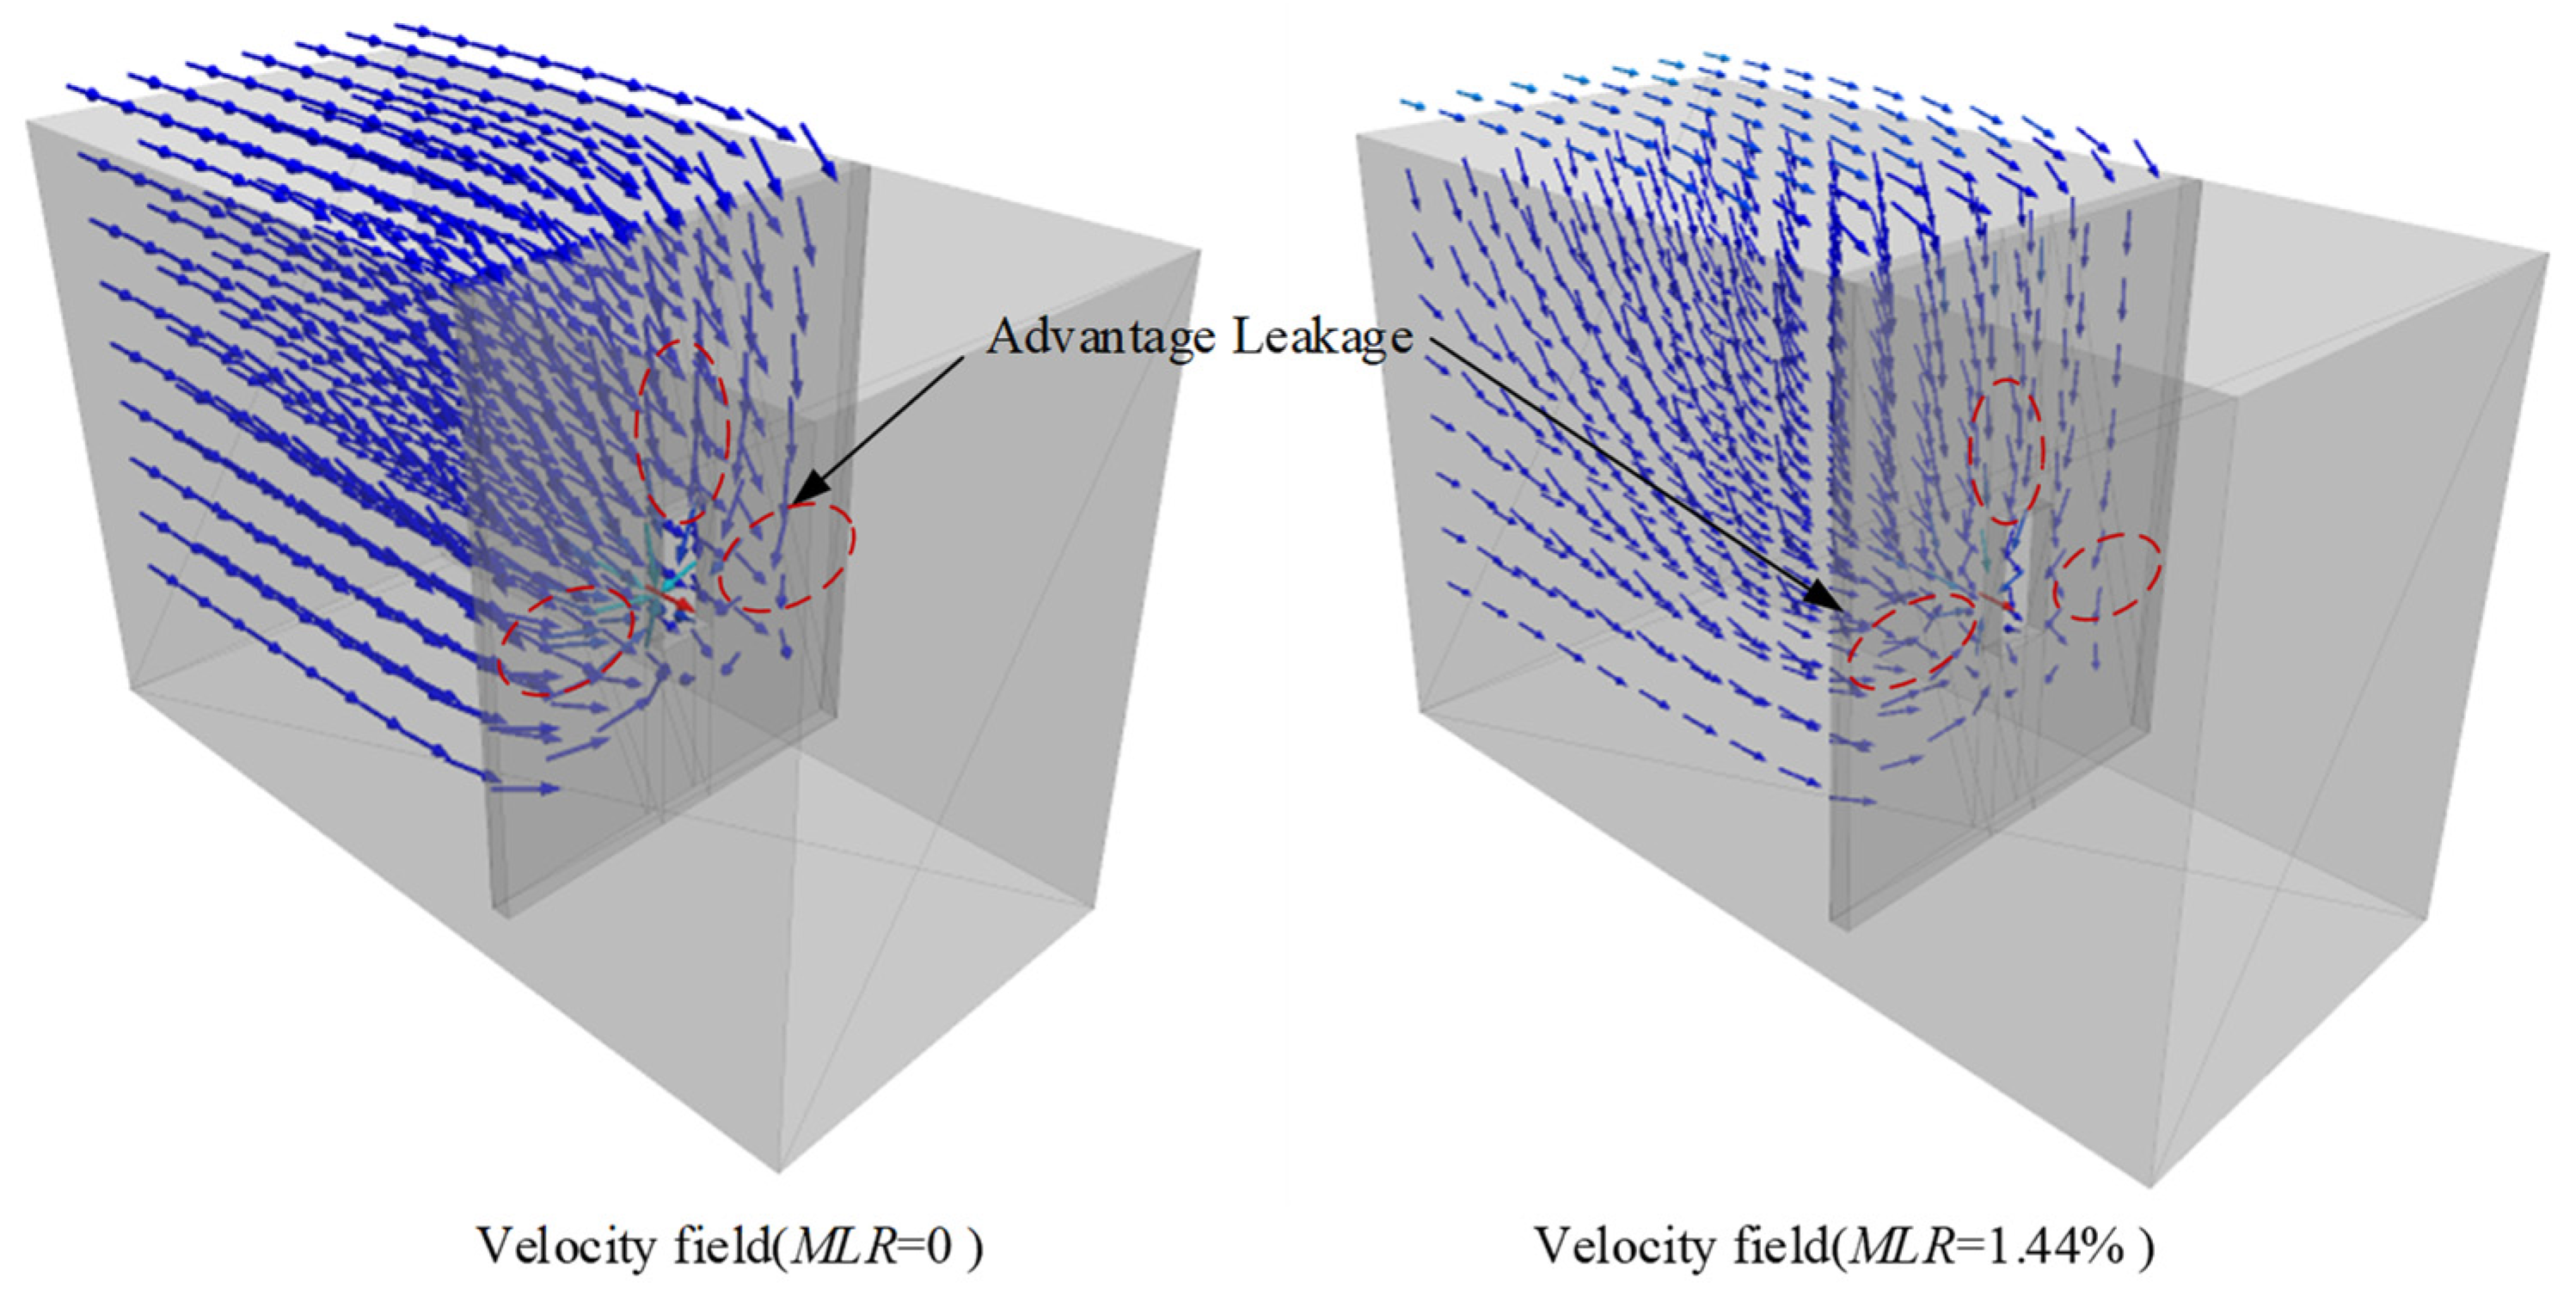
The velocity field in the CFD domain for
MLR = 0 and
MLR = 1.44% is shown in
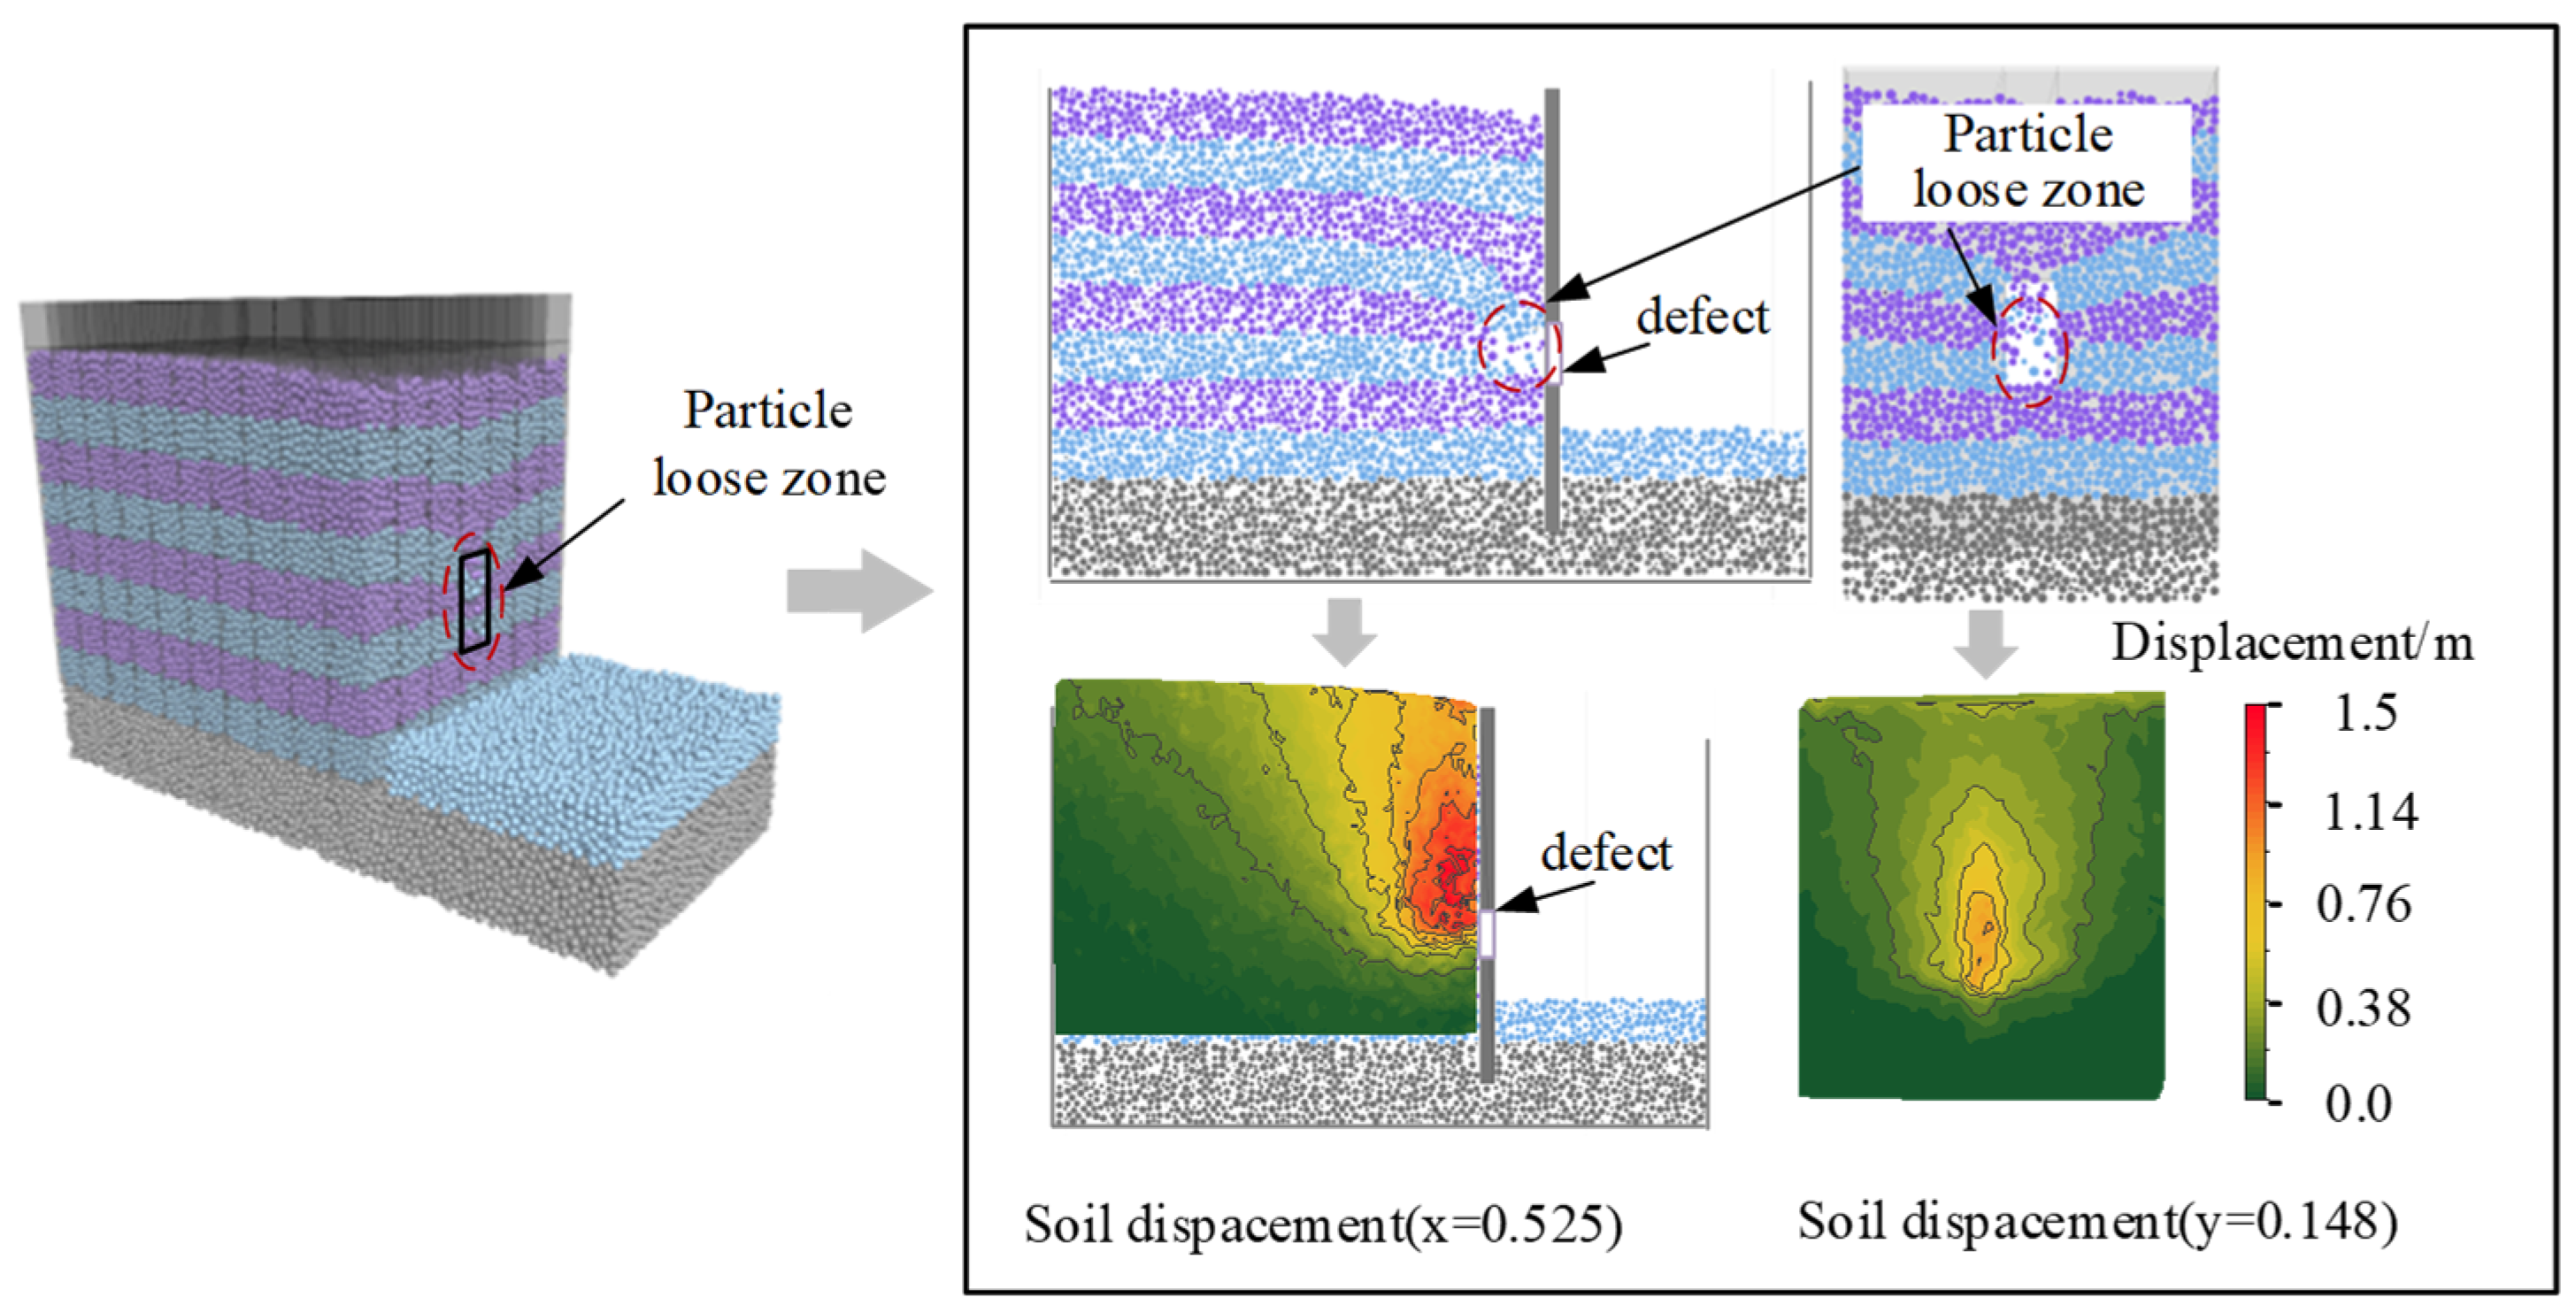
Figure 7. The stratum displacement for y = 5.2 and x = 14.8 slices with
MLR = 1.44% is shown in
Figure 8.
Figure 7 shows that a high-speed flow field region is formed around the defect. This is due to the geometric constraint of the defect as well as the combined effects of gravity and seepage force, resulting in high-speed seepage paths on the surface of the diaphragm wall around the defect. With the continuous loss of water and sand, the vector direction of the flow field tends towards the direction of gravity.
As shown in
Figure 8, the larger the distance from the defect, the smaller the trend of particle motion. At the same depth, the displacement of the stratum near the defect is 3–5 times that of the distant stratum. The deep displacement directly above the defect is 3–4 times that of the shallow stratum. At the same time, significant displacement occurred in the stratum below the defect. This is due to the fluid–solid coupling force exceeding the effective stress of the stratum, resulting in particle uplift, which is similar to the numerical simulation law in the reference [
26].
4.2. Stratum Stress Field Analysis
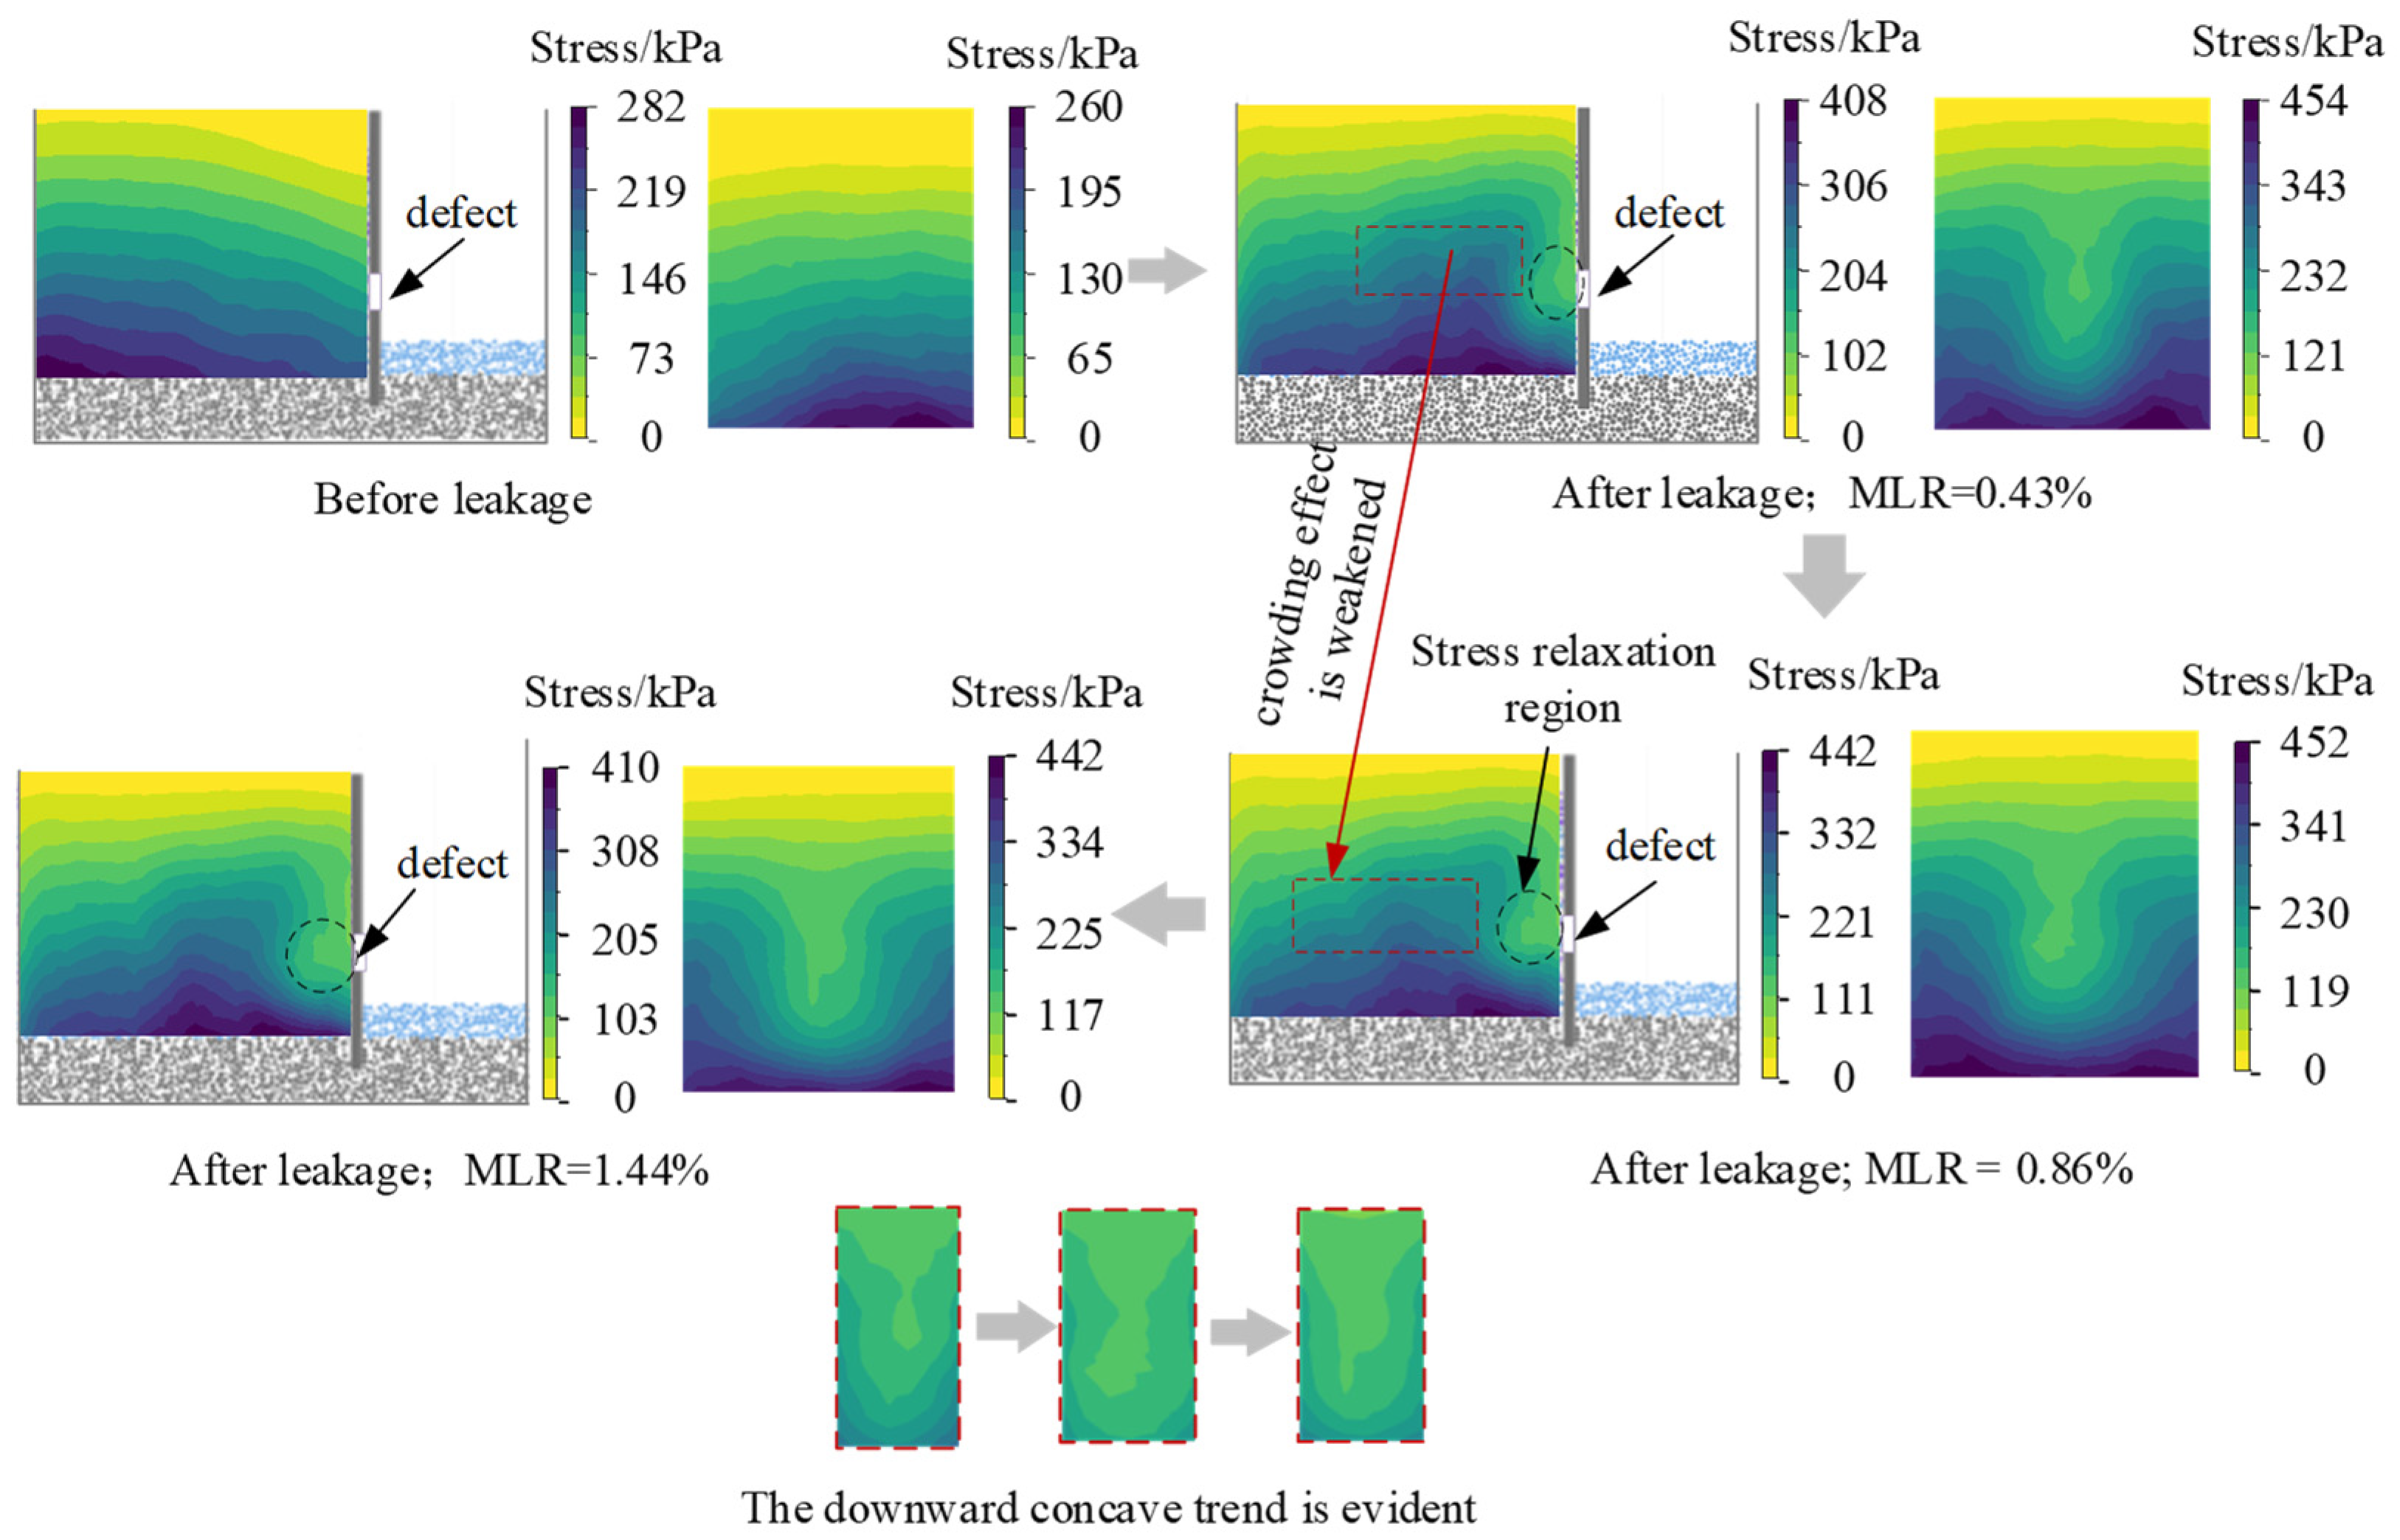
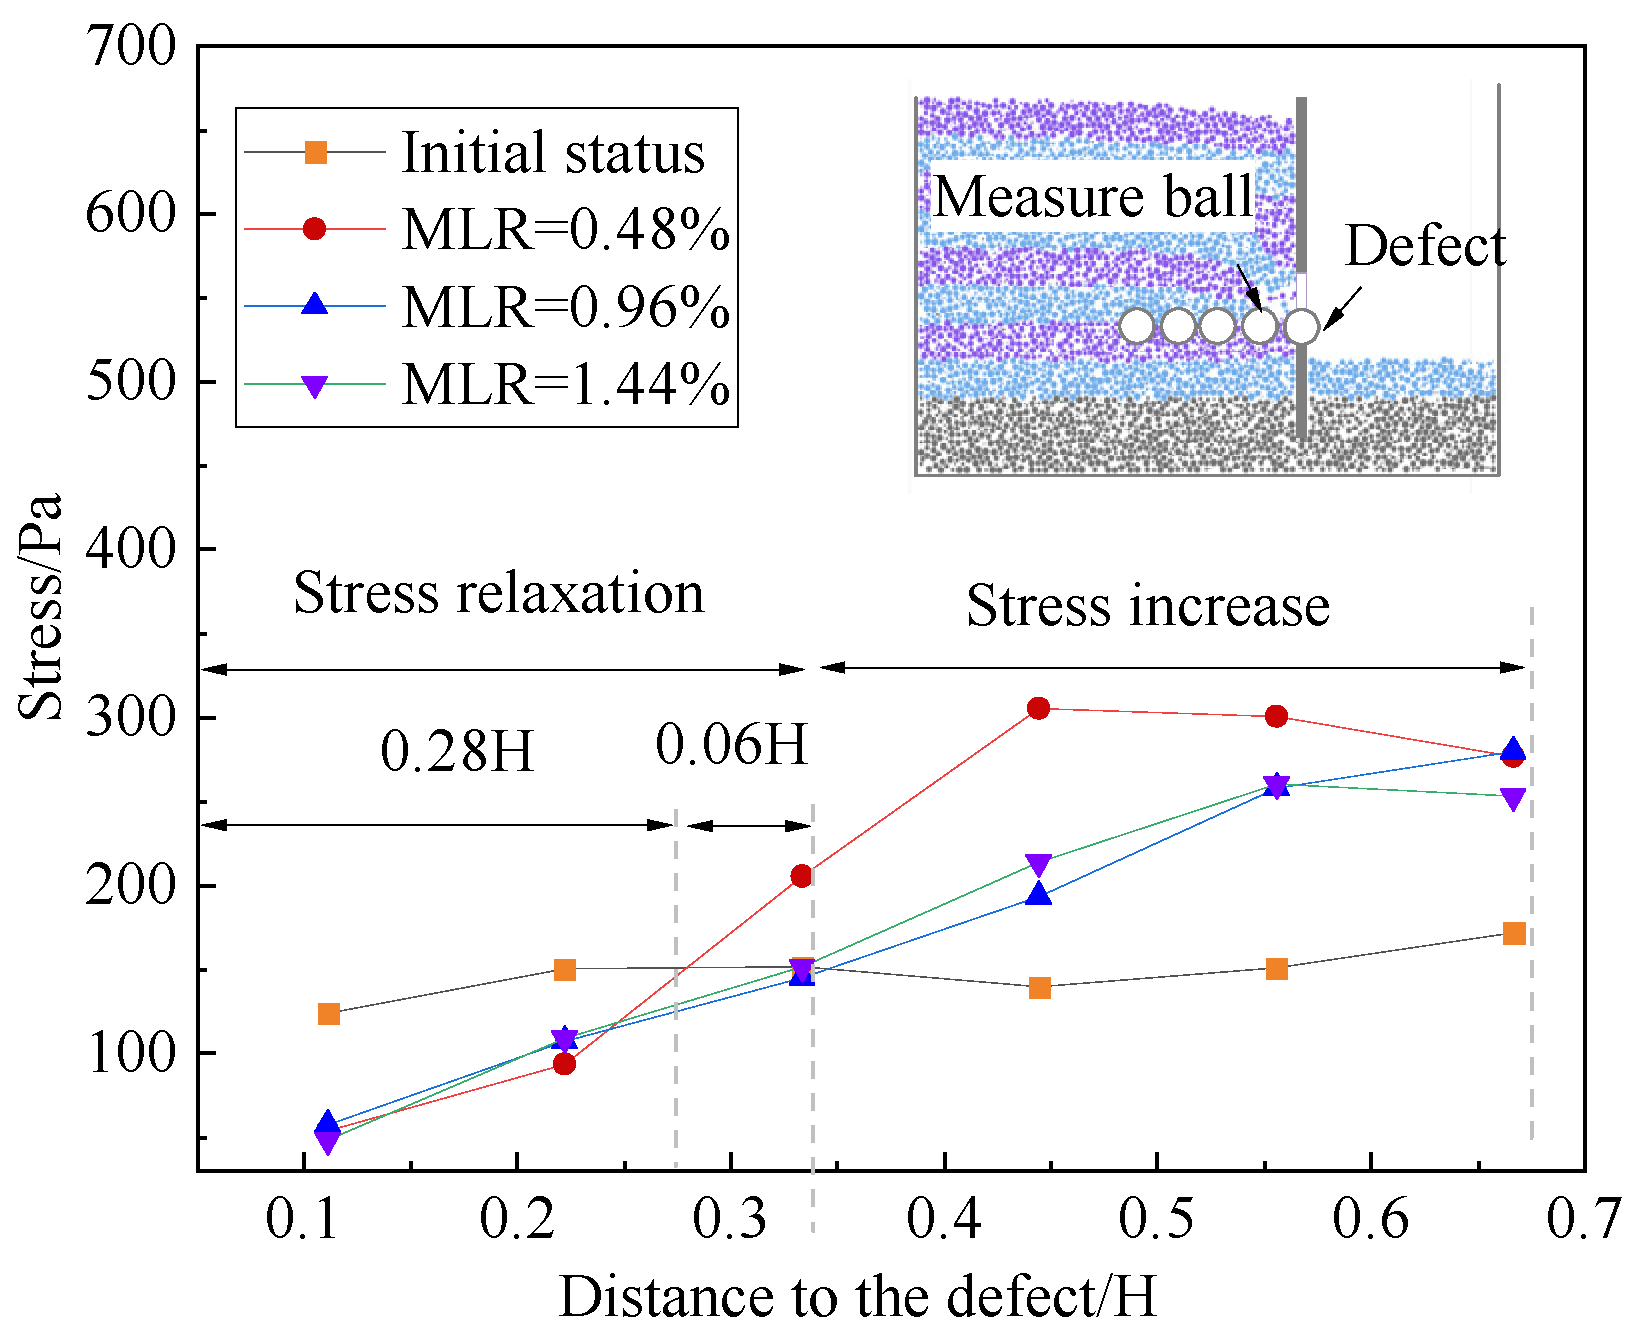
The distribution of the soil stress field is influenced by water–sand loss. By extracting the particle stress of y = 5.2 and x = 14.8 slices and processing them with ORIGIN 2022 mapping software, the stratum stress field is shown in
Figure 9. Since the stratum near the defect is most influenced, five measured balls with a radius of 2.5 cm are set on the y = 5.2 slice at equal intervals of 1 cm. In order to easily identify the sand layer displacement, the sand layer was stained in layers, and the change in the stratum stress field is depicted in
Figure 10.
As shown in
Figure 9 and
Figure 10, after excavation of the foundation pit, the stratum stress field near the diaphragm wall relaxes, and the contour lines of the stratum stress tilt downward. When
MLR = 0.48%, the
x-direction stress field distribution indicates that the cloud profile near the defect is elliptical, and the
y-direction stress field distribution indicates that a concave shaped stress relaxation zone occurs near the defect, and thus the stratum stress within a range of (0~0.28)
H from the defect is less than the initial stratum stress of the model. Since the diaphragm wall defect is a narrow rectangle, under the effect of its geometric constraint, the stratum stresses beyond a certain distance from the defect are redistributed, resulting in a soil arch blockage effect. Therefore, the stress within the range of (0.45~0.55)
H from the defect is at a high level, with an average value of about 290 kPa, which is 1.82 times the initial stress of the model.
When the MLR is 0.48–1.44%, the relaxation effect of stratum stress is enhanced; the range of the stress relaxation zone in the x-direction extends to the distance of (0–0.34)H from the defect, and the downward concave feature of the stress release zone in the y-direction becomes more obvious. During the water–sand loss process, the above stress arch blockage effect decreases gradually, and the blockage zone is far away from the defect. For example, when MLR = 1.44%, the maximum stress value at the monitoring points is reduced to 250 kPa, with a reduction rate of 20%, while the range of the blockage zone is far away from the distance of (0.55~0.65)H from the defect.
4.3. Stress Anisotropy Analysis
The effect of anisotropic changes in the stress field is defined by
where
i represents the three stress directions
x,
y, and
z;
j is the particle labeling; and an individual particle is considered a geometrical mass to extract its stress.
N represents the total number of particles in the monitoring area, and
represents the stress anisotropy coefficient in the
i direction for particle
j, which is defined as
where
Fij represents the value of the stress in the
i-direction for the particle labeled
j.
represents the average stress of individual particles in the monitoring area, which is defined as
where
represents the sum of the principal stresses at the mass point of the particle
j;
Fxxj,
Fyyj, and
Fzzj express the stresses in the
x,
y, and
z directions of particle
j, respectively.
The above scale factor
Ti represents the average of the stress coefficients in the
i direction for all particles in the monitoring area, thus characterizing the anisotropic variation of the stress field. The largest scale factor
Ti in the
x,
y, and
z directions indicates that the particles have a strong tendency to move in the
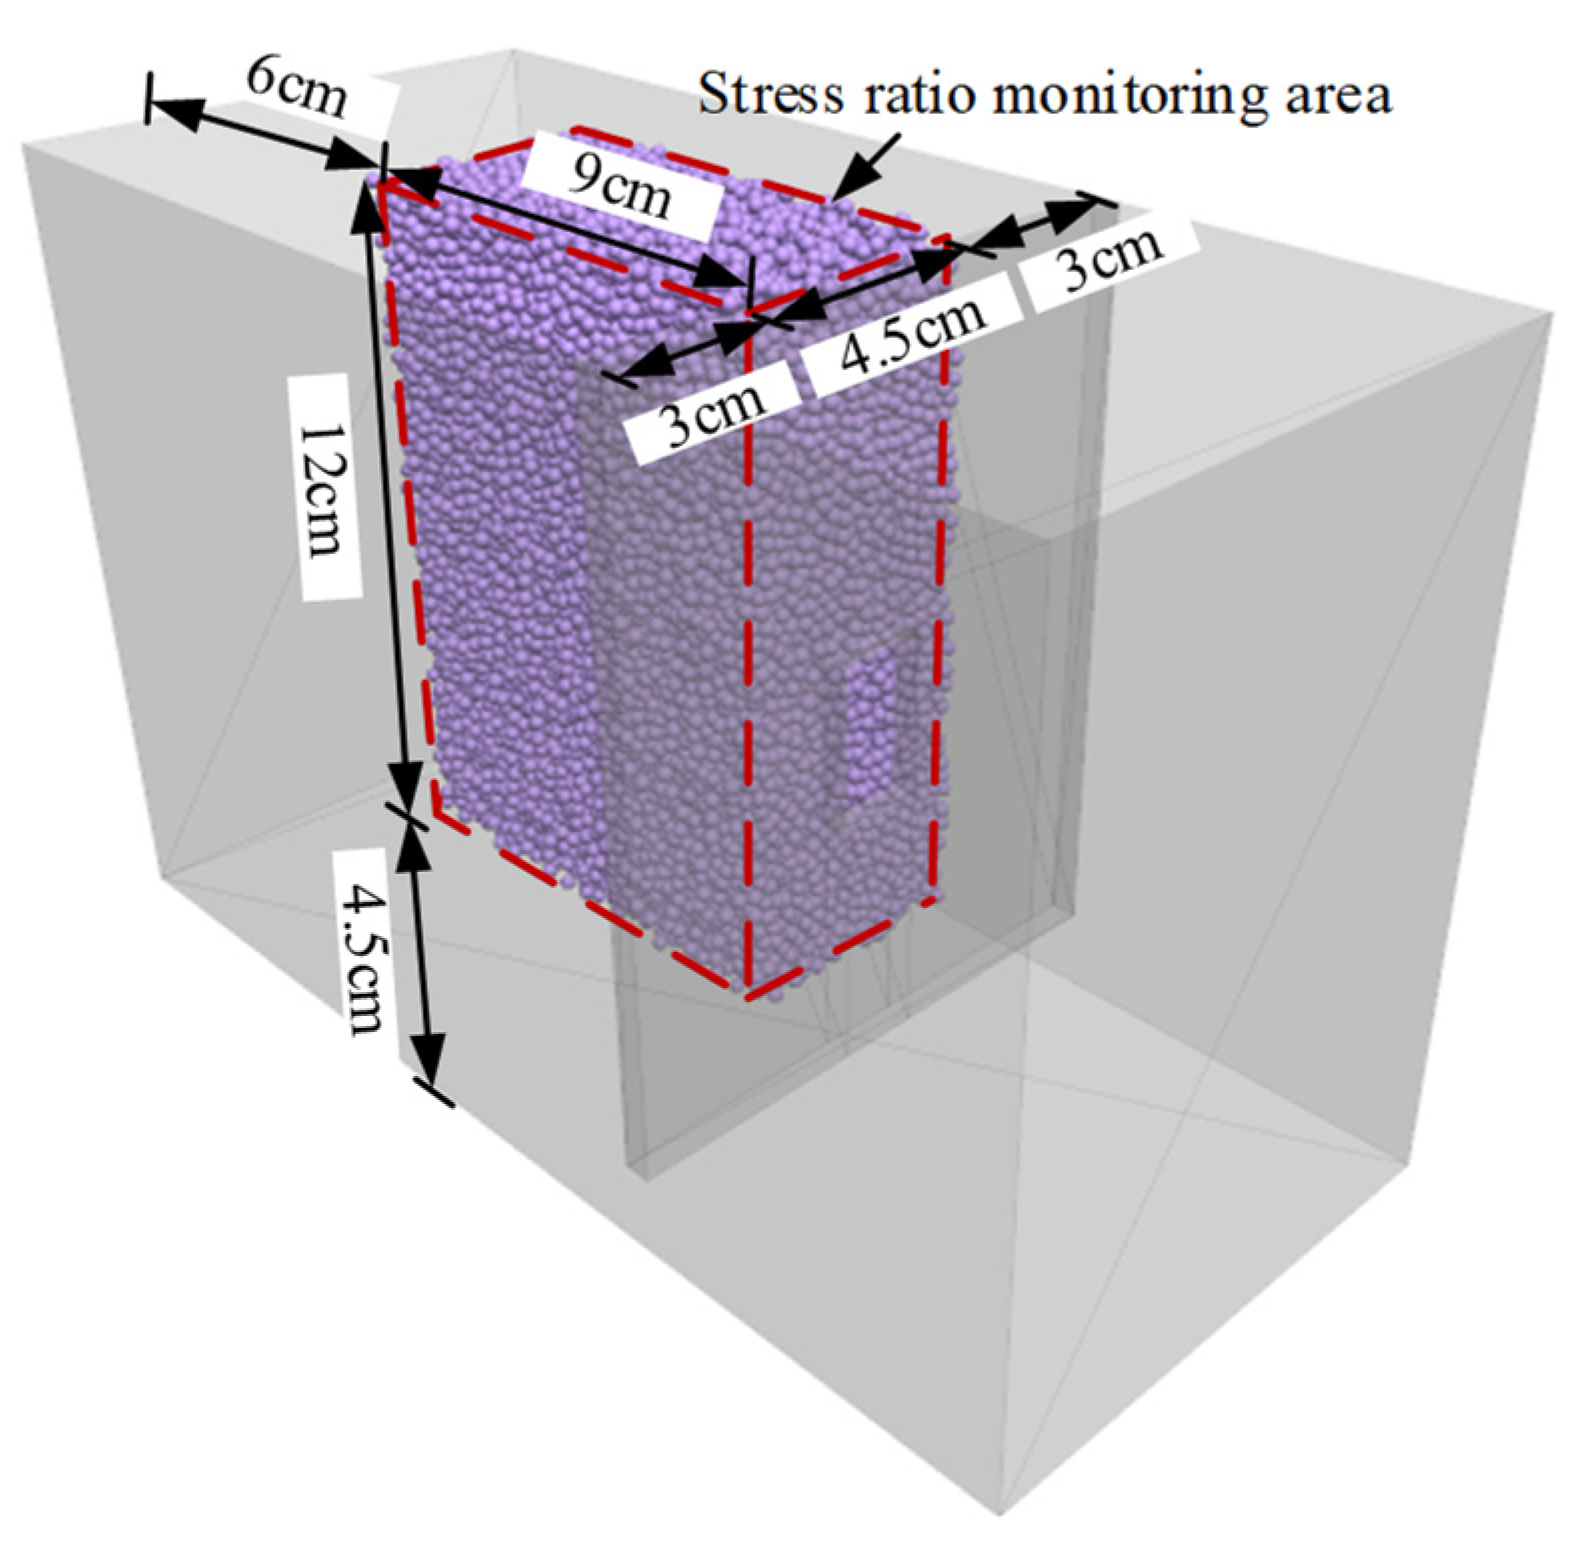
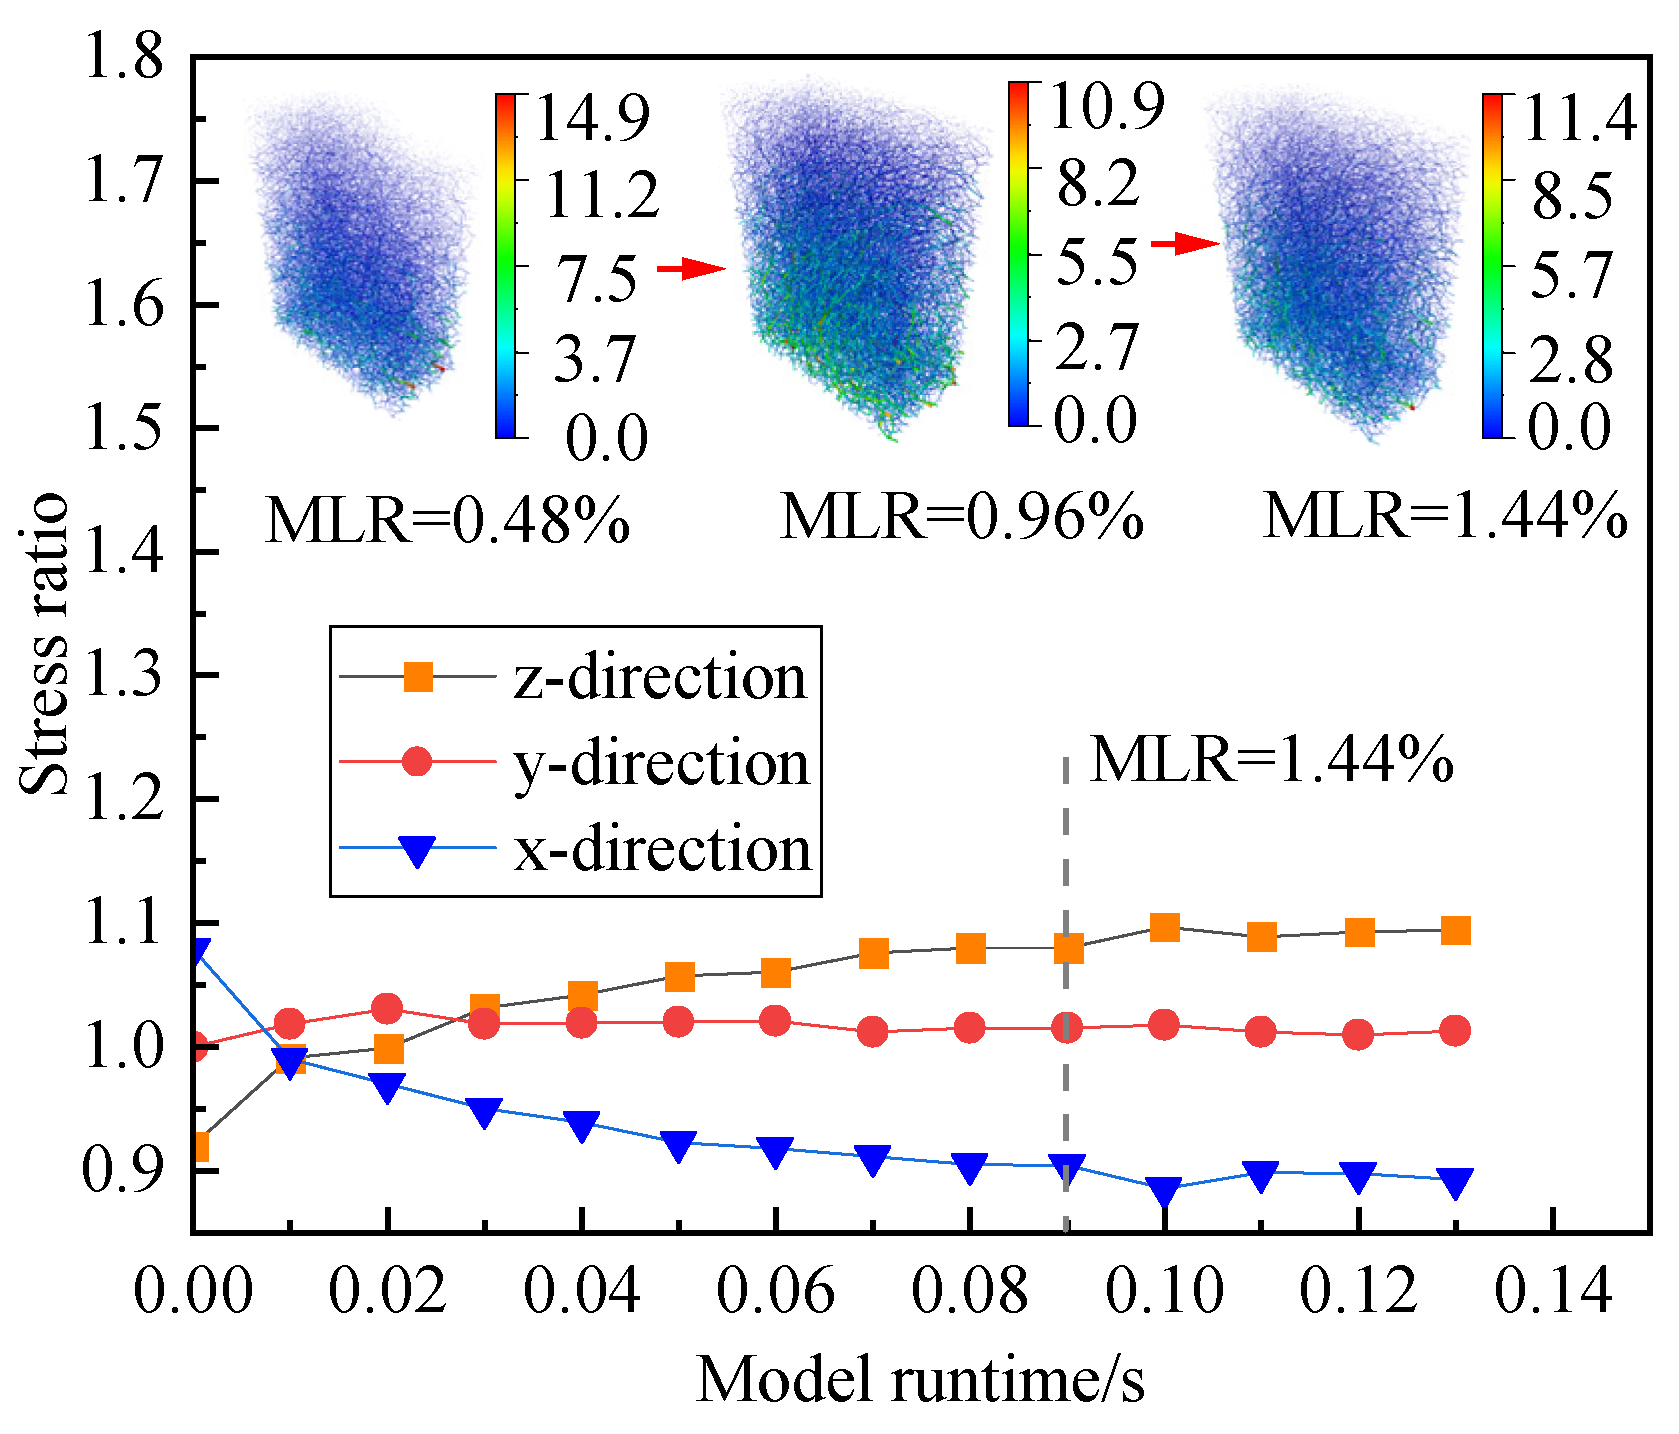
i direction. The stress monitoring region is shown in
Figure 11. The variation of the stress coefficients in each direction in the monitoring area is shown in
Figure 12.
As shown in
Figure 12, when
t =0~0.11 s,
Tx,
Ty, and
Tz demonstrate a gradual decrease, basically keeping unchanged, and a gradual increase, respectively. When
t = 0.11~0.13 s,
Tx,
Ty, and
Tz are stable at 0.9, 1.0, and 1.1, respectively. The above analyses show that the vector direction of the flow field in the process of water and sand leakage tends to be in the direction of gravity, so there is a coupling between the
z-direction component of the seepage force and gravity. At the same time, the horizontal constant water pressure on the particles is weakened, and the transport trend of the particles shows the relationship of z > y > x.
The above-mentioned stratum stress and displacement field can be well explained by the law of particle transport trend direction. Since particles have the dominant transport tendency in the z-direction when MLR = 0~1.44%, the stratum displacement map near the defects is elliptical, and the stress relaxation zone near the defect has a steady downward tendency. Because the particle transport tendency in the x direction is diminished, the stress blockage effect is weakened beyond a certain distance from the defect, and therefore the stress blockage zone seems to be far away from the defect.
4.4. Displacement Based on Fluid Energy Analysis
The main forces acting on particles are gravity, friction between particles, and fluid forces, and the literature [
35] characterizes fluid forces in terms of the erosion energy
Pe:
where
γw is the water gravity, N/m
3; Δ
z is the vertical height difference between a point in the CFD domain and the bottom of the defect;
p is the pressure of the fluid mesh in the CFD domain, N/m
2; and
Q is the water flow rate, m
3/s.
When
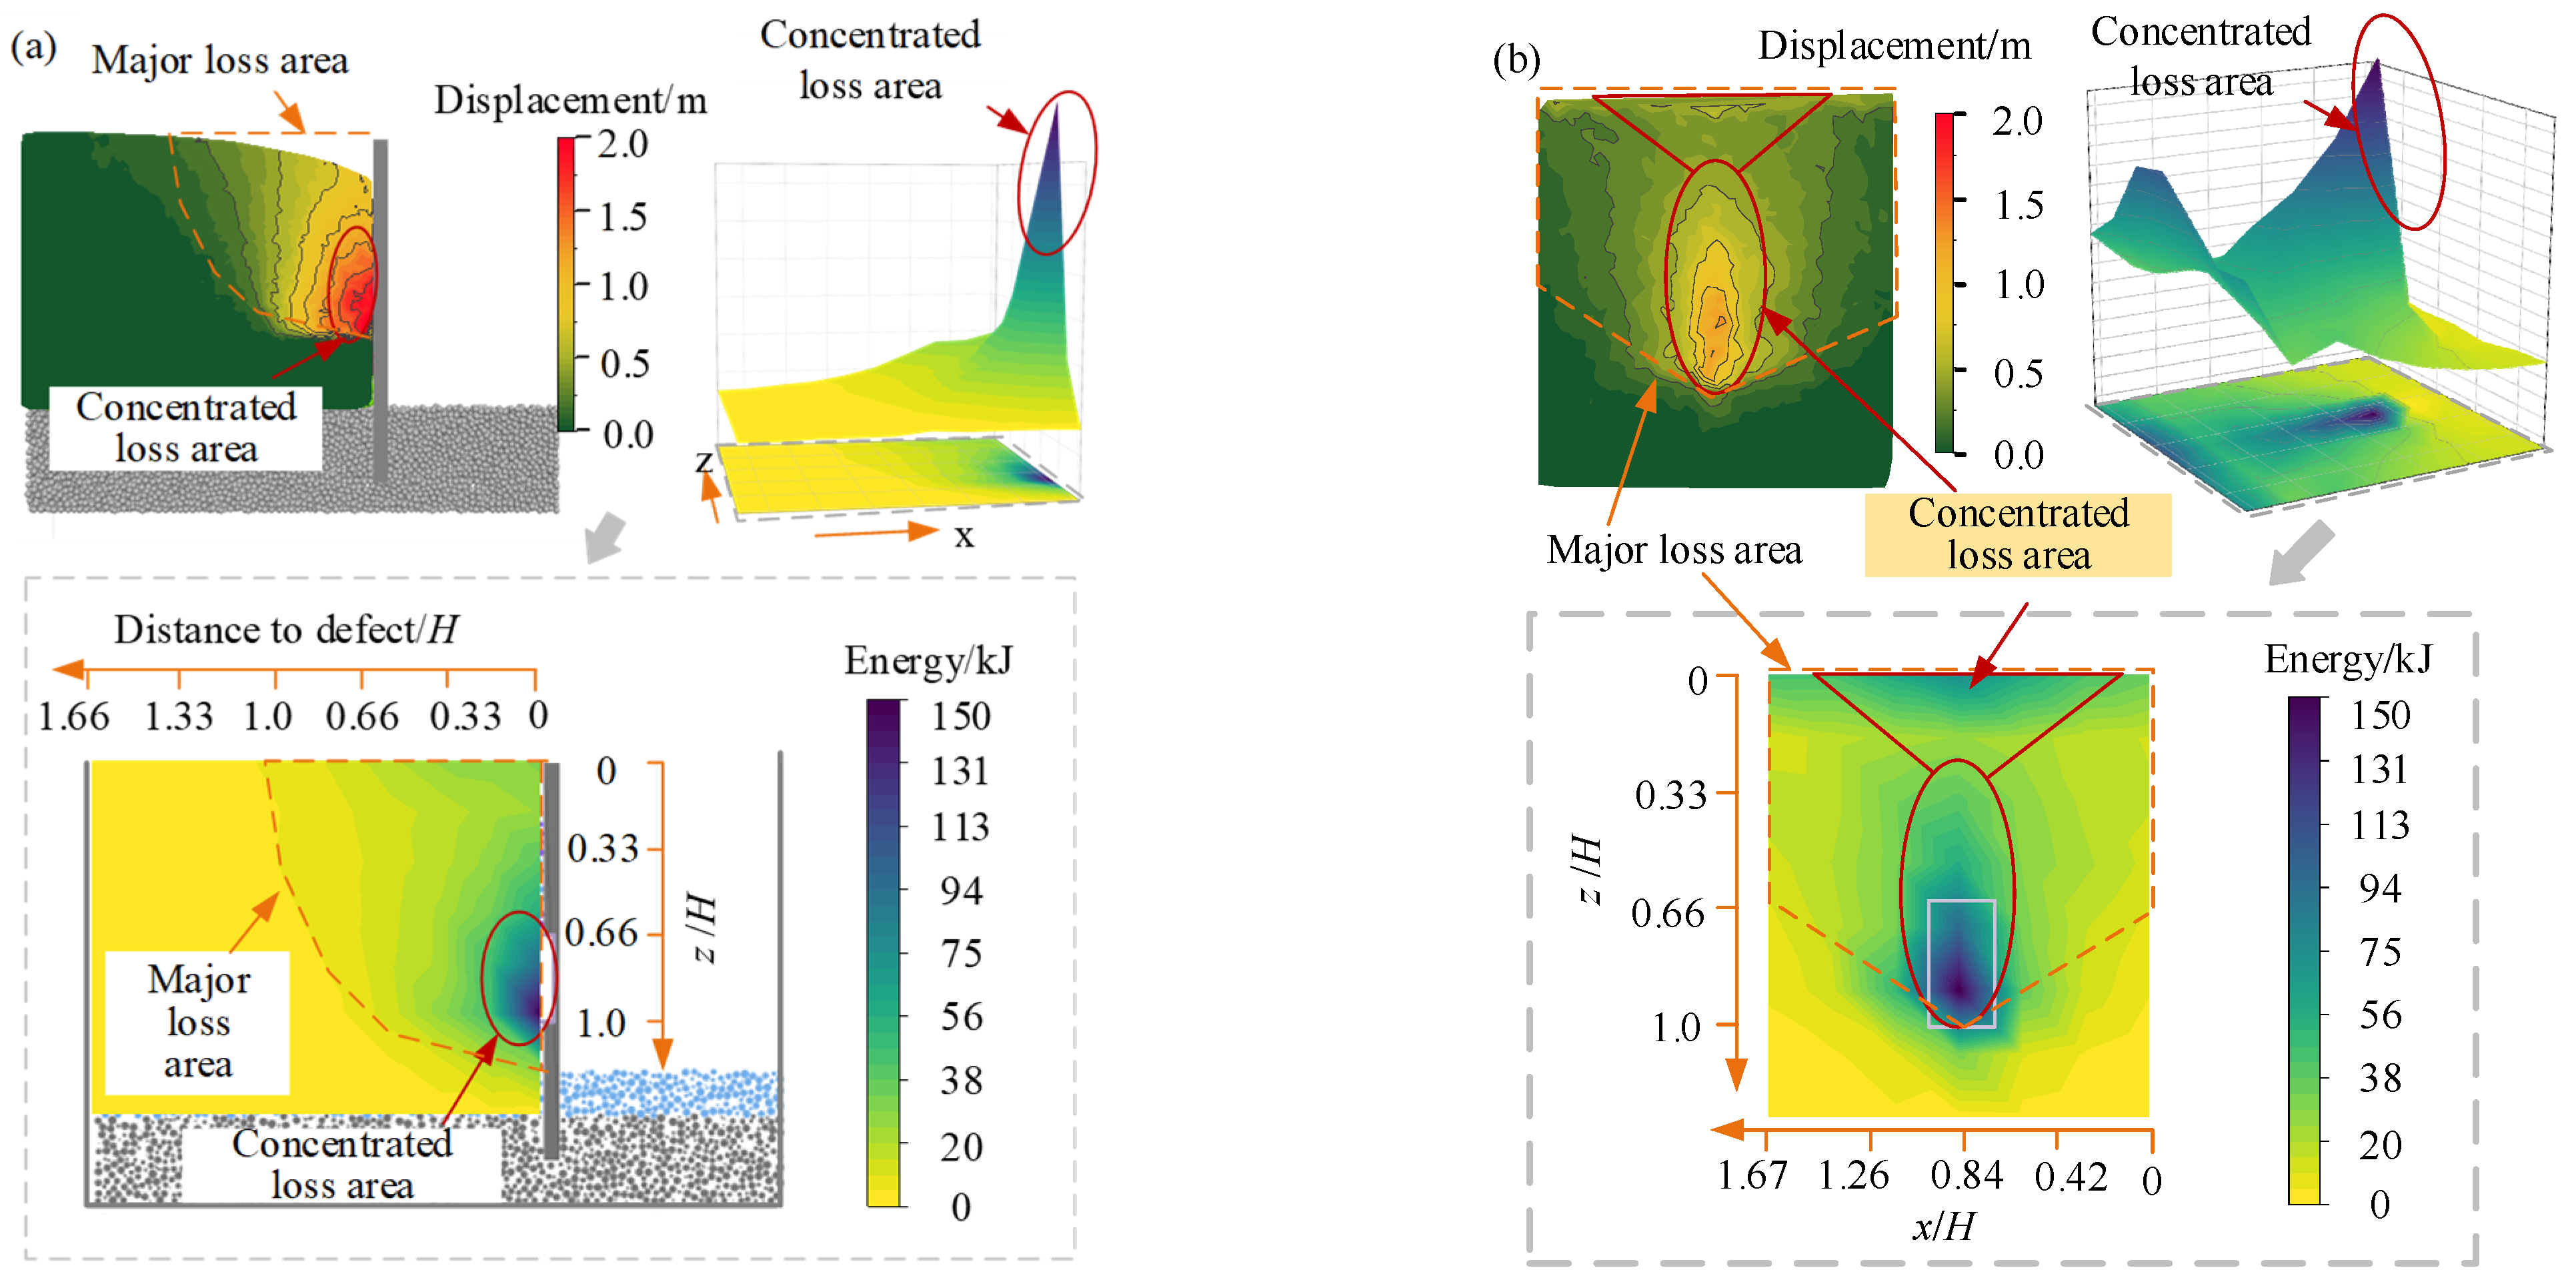
MLR = 1.44%, based on the pore pressure and flow velocity data of the fluid mesh, the gravitational potential energy of the fluid is calculated at the center of the fluid mesh, and the fluid energy map is plotted as shown in
Figure 13 to reflect the spatial variation characteristics of the energy of the flow field.
As shown in
Figure 13, the fluid energy centered on the defect presents a tendency to decrease in all directions. The contours of both the fluid energy map and the sand displacement map are elliptical near the defect, and in general, the contours of their
x-direction cloud maps and
y-direction cloud maps are half-arch and arch, respectively. It can be seen that the fluid energy maps and sand layer displacement maps show similar characteristics, indicating that the fluid loading force on the soil is the main factor influencing the particle displacement trend.
The concentrated loss area and the major loss areas are classified on the basis of fluid energy. The loss zone is located in the soil area directly above the defect and in contact with the diaphragm wall. This means that the fluid energy is highest near the defect, and therefore the strong hydraulic force on the particles contributes to the transport of the stratum in this area. The gray dashed line is the boundary of the main particle loss zone, indicating significant stratum displacement in this area. The flow field analysis in
Figure 7 shows that the vector direction of the flow field directly above the defect tends to be in the direction of gravity, and the concentrated loss area is elliptical in shape. This indicates that the fluid force on the sand particles in this region has a vertically dominant direction, explaining the phenomenon of the vertical transport trend of the soil.
5. Discussion
The water flow that vertically impacts the surface of the diaphragm wall will undergo a change in momentum, resulting in an impact force on the structure’s surface. By modifying Equation (17), the water flow velocity only retains the x-component perpendicular to the diaphragm wall, which is given by Equation (18). Therefore, the fluid impact kinetic energy represented by Equation (18) can be used to qualitatively represent the impact force received by the diaphragm wall.
where
γw is the heaviness of water, N/m
3; Δ
z is the vertical height difference between a point and the defect in the CFD domain;
p is the pressure of the fluid mesh in the CFD domain, N/m
2; and
Qx is the velocity of fluid mesh perpendicular to the ground-connected wall, m
3/s.
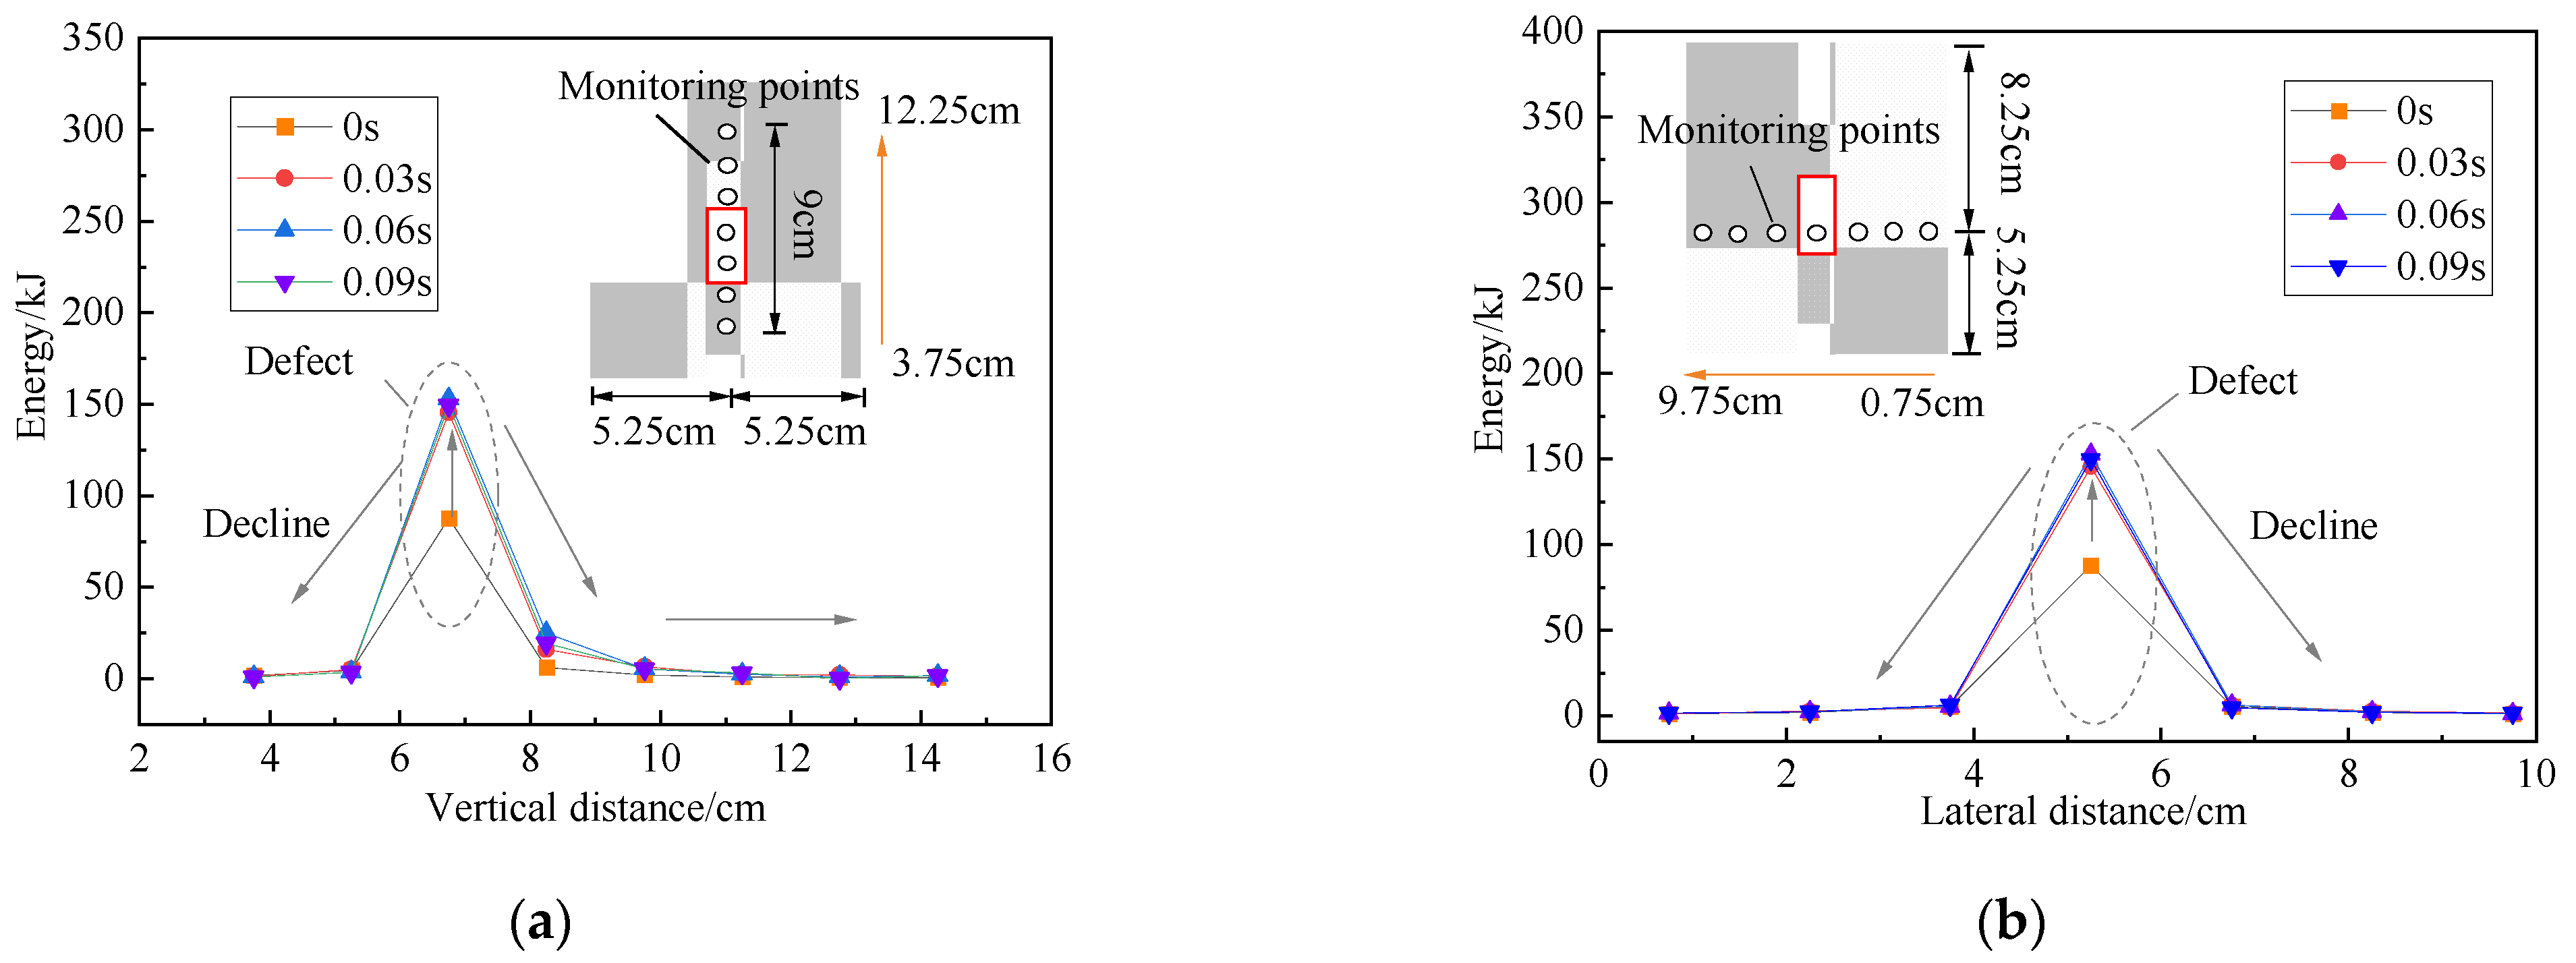
To further investigate the mechanism of disaster development, combined with the engineering example of the pit excavation [
9], the process of the abrupt and gradual change in the sand leakage is studied based on the analysis of the impact kinetic energy of the fluid. The impact kinetic energy of the fluid grid adjacent to the diaphragm wall is shown in
Figure 13.
Figure 14 shows that sand loss through the diaphragm wall’s defect has not yet happened when
MLR = 0. The water pressure within and outside the pit differs significantly at this time. The aforementioned flow field analyses show that there is a high-flow-velocity leakage path on the surface of the diaphragm wall. This means that the gravitational potential energy of the fluid is mostly converted into kinetic energy during the falling process, so the impact kinetic energy of the fluid on the defects is significantly higher than that of the other monitoring points, with a value of 98 kJ. In the case of the Foshan pit project, for example, due to the insufficient brushing of the diaphragm wall, the sandbags became stuck in the diaphragm wall joints; thus, the diaphragm wall joints acted as defective areas of the structure. According to the above analysis, after the excavation of the pit, the sand bags were rushed away by the water flow with high impact kinetic energy and the sand particles started to leak along the defects, which led to the evolution of the disaster from a state of just water leakage to a state of water and sand leakage. In engineering practice, it is important to identify the defective areas of the enclosure and take repair and reinforcement measures.
The fluid impact kinetic energy values remain relatively stable when MLR = 0.48 to 1.44%. The distribution of the fluid kinetic energy in this time range is similar, with the values peaking at the defect and then decreasing sharply along both sides of the defect. With the gradual development of the particle-loosening zone around the defect, the area of water gushing is enlarged, and the increase in water gushing velocity causes the sand leakage to have a larger kinetic energy. Taking the Foshan underground pit project as an example, the water and sand spraying out along the defect are in the form of jets. The spraying distance is 7 m, and the measured water volume is about 460 m3/h. When MLR = 1.44%, the kinetic energy of water impact at the defects rises from 98 kJ to 149.7 kJ, and the growth rate is 50% compared with that of the leakage state. The diaphragm wall lacks soil support because of the presence of a loose sand layer zone around the defect. In this case, the impact force of water flow in the loose zone can be directly transferred to the diaphragm wall, which indicates the risk of further expansion of the defect. Therefore, the diaphragm walls in the vicinity of the defects should be rigidly supported, especially the upper and horizontal diaphragm walls close to the defect.
6. Conclusions
(1) Stratum stress relaxation occurs near the defect of the diaphragm wall, and the x- and y-direction soil stress relaxation zones near the defect are elliptical and concave, respectively; the soil arch blockage effect is formed in the stratum beyond a certain distance from the defect. With the water and sand loss, the y-direction stress relaxation zone is gradually concave.
(2) Fluid drag force is the main factor affecting the trend of sand layer displacement. The characteristics of the fluid energy cloud map and the formation displacement cloud map are similar, with elliptical shapes near the defect, and the contours of the cloud maps in the x- and y-directions are semi-arch-shaped and arch-shaped, respectively. Based on the fluid energy level, the sand layer is divided into a concentrated loss zone and a major loss zone.
(3) The analysis of the anisotropy coefficient of stratum stress shows that the vertical direction is the dominant direction of stratum transport during water and sand loss. This explains the elliptical shape of the stratum displacement cloud near the defect and the gradual concave of the y-direction stress relaxation zone near the defect.
(4) During water leakage, the weak structure of the diaphragm wall is penetrated, as the impact kinetic energy is highest at the defect. With the loss of water and sand, the area of loose sand layers appears near the defect, which results in the structure losing the soil’s barrier to water flow; therefore, the greater impact force of the water flow puts the defect at risk of further expansion.
(5) In practical engineering, the detection of defects in the enclosure structure should be strengthened and the defects should be repaired in time; in order to reduce the impact of water and sand disasters, the horizontal and upper diaphragm walls near the defects should be rigidly supported.
Author Contributions
Conceptualization, L.W., X.Z., S.X., C.Y., X.C., Z.L., J.Z. and L.F.; methodology, L.W., X.Z., S.X. and L.F.; software, S.X. and Z.L.; validation, L.W., X.Z. and S.X.; formal analysis, S.X.; investigation, S.X. and Z.L.; resources, L.W., X.Z., C.Y., J.Z. and X.C.; data curation, S.X.; writing—original draft preparation, S.X.; writing—review and editing, L.W., X.Z. and S.X.; visualization, S.X.; supervision, L.W., X.Z. and S.X.; project administration, S.X.; funding acquisition, L.W., X.Z., C.Y. and J.Z. All authors have read and agreed to the published version of the manuscript.
Funding
This research was funded by the Research Project of China Railway 18th Bureau Group Co., Ltd. (Grant No. G21-11) and the Research Project of China Railway 18th Bureau Group (Municipal Engineering) Co., Ltd. (Grant No. 12-JF-001).
Data Availability Statement
Data are contained within the article.
Conflicts of Interest
Authors Lichuan Wang and Jingjing Zhang were employed by the company China Railway 18th Bureau Group Co., Ltd. Authors Changcheng Yue and Xiafei Chen were employed by the company China Railway 18th Bureau Group Municipal Engineering Co., Ltd. The remaining authors declare that the research was conducted in the absence of any commercial or financial relationships that could be construed as a potential conflict of interest.
References
- Li, M.; Demeijer, O.; Chen, J. Effectiveness of servo struts in controlling excavation induced wall deflection and ground settlement. Acta Geotech. 2020, 15, 2575–2590. [Google Scholar] [CrossRef]
- Xiao, X.; Li, M.; Wang, J.; Chen, J. Numerical evaluation of control measures for tunnel deformation induced by an oversized deep excavation. J. Aerosp. Eng. 2018, 31, 04018109. [Google Scholar] [CrossRef]
- Qin, S.; Wang, H.; Ke, G. Analysis of water and sand gushing out of a foundation pit and prevention countermeasures. Rock Soil Mech. 2005, 26, 271–274. [Google Scholar]
- Feng, S.; Lu, S. Failure of a retaining structure in a metro station excavation in Nanchang city, China. J. Perform. Constr. Facil. 2016, 30, 04015097. [Google Scholar] [CrossRef]
- Tan, Y.; Lu, Y. Forensic diagnosis of a leaking accident during excavation. J. Perform. Constr. Facil. 2017, 31, 04017061. [Google Scholar] [CrossRef]
- Jo, Y.; Cho, S.; Jang, Y. Field investigation and analysis of ground sinking development in a metropolitan city, Seoul, Korea. Environ. Earth Sci. 2016, 75, 1353. [Google Scholar] [CrossRef]
- Ma, J.; Liao, Z.; Li, C. Emergency treatment technology for water and sand inrushing during excavation of ultra-deep foundation pit in water-rich sand layer. Mod. Tunn. Technol. 2021, 58, 160–164. [Google Scholar]
- Fan, D.; Liu, X.; Jing, X.; Tan, Y. Causes analysis on wall leaking of metro foundation pit in Nantong water-rich sandy stratum. Tunn. Constr. 2020, 40, 225–231. [Google Scholar]
- Zhang, D.; Gao, C.; Yin, Z. CFD-DEM modeling of seepage erosion around shield tunnels. Tunn. Undergr. Space Technol. 2019, 83, 60–72. [Google Scholar] [CrossRef]
- Zheng, G.; Dai, X.; Diao, Y.; Zeng, C. Experimental and simplified model study of the development of ground settlement under hazards induced by loss of groundwater and sand. Nat. Hazards 2016, 82, 1869–1893. [Google Scholar] [CrossRef]
- Sato, M.; Kuwano, R. Influence of buried structures on underground seepage and generation of cavities. Jpn. Geotech. J. 2015, 10, 113–125. [Google Scholar]
- Qian, J.; Li, W.; Yin, Z.; Yang, Y. Influences of buried depth and grain size distribution on seepage erosion in granular soils around tunnel by coupled CFD-DEM approach. Transp. Geotech. 2021, 29, 100574. [Google Scholar] [CrossRef]
- Ying, Y.; Yong, T. Soil arching due to leaking of tunnel buried in water-rich sand. Tunn. Undergr. Space Technol. 2020, 95, 103158. [Google Scholar]
- Midgley, T.L.; Fox, G.A.; Wilson, G.V.; Heeren, D.M.; Langendoen, E.J.; Simon, A. Seepage induced streambank erosion and instability: In situ constant-head experiments. J. Hydrol. Eng. 2012, 18, 1200–1210. [Google Scholar] [CrossRef]
- Shi, Z.; Zheng, H.; Yu, S.; Peng, M.; Jiang, T. Application of CFD-DEM to investigate seepage characteristics of landslide dam materials. Comput. Geotech. 2018, 101, 23–33. [Google Scholar] [CrossRef]
- Zhang, X.; Wang, L.; Wang, H.; Feng, C.; Shi, H.; Wu, S. Investigating impacts of deep foundation pit dewatering on land subsidence based on CFD-DEM method. Eur. J. Environ. Civ. Eng. 2022, 26, 6424–6443. [Google Scholar] [CrossRef]
- Yousefi, M.; Sedghi-Asl, M.; Parvizi, M. Seepage and boiling around a sheet pile under different experimental configuration. J. Hydrol. Eng. 2016, 21, 06016015. [Google Scholar] [CrossRef]
- Koltuk, S.; Fernandez-Steeger, T.M.; Azzam, R. A numerical study on the seepage failure by heave in sheeted excavation pits. Geomech. Eng. 2015, 9, 513–530. [Google Scholar] [CrossRef]
- Liu, T.; Xie, Y.; Feng, Z.; Luo, Y.; Wang, K.; Xu, W. Better Understanding the Failure Modes of Tunnels Excavated in the Boulder-Cobble Mixed Strata by Distinct Element Method. Eng. Fail. Anal. 2020, 116, 104712. [Google Scholar] [CrossRef]
- Jiang, M.; Yin, Z. Influence of soil conditioning on ground deformation during longitudinal tunneling. Comptes Rendus Mec. 2014, 342, 189–197. [Google Scholar] [CrossRef]
- Jiang, M.; Yin, Z. Analysis of stress redistribution in soil and earth pressure on tunnel lining using the discrete element method. Tunn. Undergr. Space Technol. 2012, 32, 251–259. [Google Scholar] [CrossRef]
- Jiang, M.; Yin, Z.; Shen, Z. Shear band formation in lunar regolith by discrete element analyses. Granul. Matter 2016, 18, 32. [Google Scholar] [CrossRef]
- Fu, Y.; Zeng, D.; Xiong, H.; Li, X.; Chen, Y. Seepage effect on failure mechanisms of the underwater tunnel face via CFD-DEM coupling. Comput. Geotech. 2022, 146, 104591. [Google Scholar] [CrossRef]
- Guo, Y.; Li, X.; Jin, D.; Liu, H.; Yang, Y.; Fang, Y.; Cui, L. Assessment on the reverse circulation performance of slurry shield pipeline system assisted with CFD-DEM modeling under sandy cobble stratum. Powder Technol. 2023, 425, 118573. [Google Scholar] [CrossRef]
- Nian, T.; Zhang, F.; Zheng, D.; Li, D.; Shen, Y.; Lei, D. Numerical simulation on the movement behavior of viscous submarine landslide based on coupled computational fluid dynamics-discrete element method. Rock Soil Mech. 2022, 43, 3174–3184. [Google Scholar]
- Dai, X.; Zheng, G.; Cheng, X.; Huo, H. Numerical simulation of ground movement induced by leakage of groundwater and sand in excavations based on the DEM-CFD method. Rock Mech. Rock Eng. 2019, 38, 396–408. [Google Scholar]
- Itasa. User’s Manual for PFC3D; Itasca Consulting Group Inc.: Minneapolis, MN, USA, 2014. [Google Scholar]
- Feng, Q.; Cha, L.; Dai, C.; Zhao, G.; Wang, S. Effect of particle size and concentration on the migration behavior in porous media by coupling computational fluid dynamics and discrete element method. Powder Technol. 2020, 360, 704–714. [Google Scholar] [CrossRef]
- Wang, P.; Ge, Y.; Wang, T.; Liu, Q.; Song, S. CFD-DEM modelling of suffusion in multi-layer soils with different fines contents and impermeable zones. J. Zhejiang Univ. Sci. A 2023, 24, 6–19. [Google Scholar] [CrossRef]
- Zou, Y.; Chen, C.; Zhang, L. Simulating progression of internal erosion in gap-graded sandy gravels using coupled CFD-DEM. Int. J. Geomech. 2020, 20, 04019135. [Google Scholar] [CrossRef]
- Nguyen, T.T.; Indraratna, B. A coupled CFD-DEM approach to examine the hydraulic critical state of soil under increasing hydraulic gradient. Int. J. Geomech. 2020, 20, 04020138. [Google Scholar] [CrossRef]
- Zhao, T.; Houlsby, G.T.; Utili, S. Investigation of granular batch sedimentation via DEM-CFD coupling. Granul. Matter 2014, 16, 921–932. [Google Scholar] [CrossRef]
- Yang, J.; Yin, Z.; Laouafa, F. Three-dimensional hydromechanical modeling of internal erosion in dikeon-foundation. Int. J. Numer. Anal. Met 2020, 44, 1200–1218. [Google Scholar] [CrossRef]
- Wang, P.; Yin, Z.; Wang, Z. Micromechanical investigation of particle-size effect of granular materials in biaxial test with the role of particle breakage. J. Eng. Mech. 2022, 148, 04021133. [Google Scholar] [CrossRef]
- Sibille, L.; Lomine, F.; Poullain, P.; Sail, Y.; Marot, D. Internal erosion in granular media: Direct numerical simulations and energy interpretation. Hydrol. Process. 2015, 29, 2149–2163. [Google Scholar] [CrossRef]
| Disclaimer/Publisher’s Note: The statements, opinions and data contained in all publications are solely those of the individual author(s) and contributor(s) and not of MDPI and/or the editor(s). MDPI and/or the editor(s) disclaim responsibility for any injury to people or property resulting from any ideas, methods, instructions or products referred to in the content. |
© 2024 by the authors. Licensee MDPI, Basel, Switzerland. This article is an open access article distributed under the terms and conditions of the Creative Commons Attribution (CC BY) license (https://creativecommons.org/licenses/by/4.0/).


