Article

Influence of Sun Shading Devices on Energy Efficiency, Thermal Comfort and Lighting Comfort in a Warm Semi-Arid Dry Mediterranean Climate

by
Carlos Pérez-Carramiñana
1,*,
Ángel Benigno González-Avilés
1,
Nuria Castilla
2 and
Antonio Galiano-Garrigós
1
1
Departamento de Construcciones Arquitectónicas, Escuela Politécnica Superior, Universidad de Alicante, 03690 Alicante, Spain
2
Centro de Investigación de Tecnología de la Edificación (CITE), Universitat Politècnica de València, Camino de Vera, s/n, 46022 Valencia, Spain
*
Author to whom correspondence should be addressed.
Buildings 2024, 14(2), 556; https://doi.org/10.3390/buildings14020556
Submission received: 29 December 2023 / Revised: 8 February 2024 / Accepted: 16 February 2024 / Published: 19 February 2024
(This article belongs to the Special Issue Advances in Indoor Environmental Quality (IEQ))

Abstract

:
The dry Mediterranean climate (BShs) is the European region with the highest number of hours of sunshine per year. The high annual solar radiation makes sun shading devices necessary to comply with current energy efficiency standards. However, these standards do not sufficiently consider their effect on the indoor lighting comfort of buildings. The objective is to qualitatively and quantitatively determine how movable sun shading devices jointly influence the energy efficiency, thermal comfort and lighting comfort of buildings in BShs climate. The scientific novelty of the work consists of demonstrating the limitations of the sun shading systems commonly used in southeastern Spain and determining the optimal technical solution in this climate to simultaneously improve thermal and lighting comfort. This research comparatively studies the influence of various movable sun shading systems on the daylighting and thermal performance of an educational building. This study conducted on-site measurements, user surveys and computer simulations to study how to improve the thermal and lighting performances of the building. This work demonstrates that interior solar shading provides little improvement in thermal comfort and reduces the cooling demand by only 25%. External movable sun shading improves thermal comfort and reduces the cooling demand by more than 60%, but only adjustable blinds or awnings achieve adequate and homogeneous illuminance values as they diffuse daylight. The paper concludes that energy efficiency standards should be modified to ensure adequate lighting comfort in buildings.

1. Introduction

The BShs climate [1] is characterised by more hours of sunshine per year than any other climate in Europe, and the trend for the temperatures [2,3] and the geographical range of this climate is expected to increase in the coming years due to climate change [4,5,6]. In very sunny climates, the high annual insolation heats the enclosures and glazing a lot. Consequently, heat from the indoor surfaces of the enclosures and glazing raises the mean radiant temperatures (MRT) inside the building. Previous investigations have analysed the influence of mean radiant temperatures on the mean operating temperatures [7,8], thermal comfort [9,10,11] and energy efficiency in buildings [12,13,14] in the BShs climate. Earlier works have also concluded the need for sun shading systems to control mean radiant temperatures and daily operating temperatures inside buildings in this type of climate [15,16], especially in highly glazed buildings [17].
Sun shading systems can be fixed or movable and can be located outside or inside façades. Movable sun shading systems are more versatile than fixed sun shading systems because they allow the user to adjust and reorient (manually or mechanically) the sun shading. Most of these systems rotate along the X-axis (horizontal rotating slats), rotate along the Y-axis (vertical rotating slats), move and fold horizontally (curtains), or roll up and fold vertically (awnings). There are also systems that combine several of these movements, such as external or internal venetian blinds, or the traditional mallorquinas widely used in the Spanish Mediterranean coast. However, their limited displacement or rotational movements along these axes prevent them from fully adapting to the parabolic movement of the sun. This feature makes it difficult to control and optimise adequate natural light in the interior spaces of buildings.
Several studies have considered movable sun shading devices such as roller blinds [18,19], Venetian blinds [20,21,22] and louvres [23,24]. The effect of these systems is much greater if they are outside the glazing in both energy demand [25,26,27] and thermal comfort [28], as previous research has shown. Mobile devices are also more beneficial than fixed devices because they can be retracted in the winter so as not to penalise heating [18,29] and to adapt to outdoor environmental parameters [30] and occupants’ preferences [31,32]. Benefits are even greater if they are automatically controlled through domotic systems [33] and if they are controlled simultaneously with the artificial lighting and air conditioning systems [34]. Other less common types of devices have also been studied, such as rotating panels [35,36,37], folding panels [38,39,40], movable cantilevers [38,41], movable lattices [42] and dynamic sunlight redirection systems [43].
All these types of movable shading devices significantly affect the building’s overall thermal performance and its energy efficiency. Spanish [44] and European standards [45,46,47] apply very different values of total solar transmittance in openings depending on the solar transmittance factor of the shading device and the type of glass. The standards also consider whether the location of the solar shading device is outside of the façade or inside the building and that the reflection factor depends on the colour of the material in the device. The standards consider that external devices with a high reflection factor provide much better protection against solar radiation.
The total solar transmittance values of the openings are considered in the Spanish standard for the energy efficiency of buildings [48,49] and in the official computer programmes for energy certification [50]. These values affect the calculation of solar heat gains to determine the annual energy demand of the building. In high annual insolation climates, such as the BShs, the total solar energy transmittance of the openings strongly influences the total energy calculation of the building. Heat loads caused by solar gains through glazing can be very high if solar shading devices are not applied, greatly increasing the cooling demand in the summer. High annual insolation in these climates also greatly influences the indoor lighting comfort of buildings, allowing many hours of natural daylight, but also causing glare or excessive lighting contrast on surfaces within the visual field. Therefore, movable sun shading devices that can be used in the summer and later retracted in the winter are desirable in these climates.
On the other hand, previous research has shown the complexity of achieving adequate thermal and lighting comfort in educational buildings, especially in hot and sunny climates, because they simultaneously require good natural lighting but avoid excessive solar gains [51,52]. These works recommend complex multi-objective calculations from the earliest stages of building design and the use of automatic and domotic systems to achieve a balanced response of the building to these two objectives [53]. They also recommend the predominant use of natural light [54] and a consideration of glare and illuminance uniformity as criteria for assessing visual comfort [55], in addition to the level of illumination [56]. However, there is no research focused on the characteristics of the BShs climate or based on the current stringent Spanish and European energy saving regulations.
The adequate treatment of the visual environment contributes to safety, comfort, and productivity in the workplace [57]. Improving visual comfort requires an appropriate lighting level, avoiding glare and achieving a balance of luminance (luminous intensity of illuminated surfaces). All this must be achieved with adequate natural light. In this sense, Spanish standards advocate for the predominance of natural light in workplaces, which should be supplemented with artificial light when visibility is not sufficient [58,59], and emphasise the benefits of natural light [60]. Also, the standards set minimum values for artificial lighting for some types of work [61]. They determine an illuminance (lighting level) of 300 lux for general office work, and 500 to 1000 lux for work with office machines and artistic or line drawing. However, they do not set maximum values. The standards do not require uniformity in the illuminance in daylight because the intensity and distribution of light changes continuously [62], but they do advocate for protection against disturbing glare from daylight [46,62,63].
However, neither energy efficiency standards nor building energy calculations in Spain consider the influence of these solar control devices on the indoor lighting comfort of buildings. Consequently, the influence of solar shading systems on the energy efficiency, thermal comfort and indoor lighting comfort of buildings has not been jointly analysed. The energy performance calculations of buildings that incorporate movable sun shading devices to comply with the standards do not consider their impact on the lighting comfort for the occupants. The consequence is very negative because buildings are theoretically calculated considering movable sun shading devices, but users use these systems in a different way due to the lack of lighting comfort. In other cases, sun shading devices are added to reduce cooling costs and to improve lighting comfort, but they do not achieve the expected comfort and energy efficiency. On the other hand, there are no studies about the influence of these devices on thermal comfort and lighting comfort considering the specific characteristics of the BShs climate.
This research comparatively analysed the influence of several movable sun shading systems on the thermal comfort, lighting comfort and energy efficiency of an educational building with high glazing in the BSHS climate. This work compares the thermal and lighting performances without movable sun shading with movable sun shading using exterior louvres, with indoor venetian blinds and with outdoor venetian blinds. The work included on-site measurements, user surveys and computer simulations to study how to optimise the thermal and lighting performances of the building. The results of the thermal comfort surveys were also compared with thermal comfort prediction calculations made using the Fanger analytical method. This method estimates the indoor thermal comfort of buildings using a combination of parameters [64,65] including metabolic rate [66,67], but this system does not consider personal factors such as the individual’s specific mood [68], age and gender [69]. Nor is it a particularised method for each type of climate [70].
The aim of this work was to qualitatively and quantitatively determine the influence of movable sun shading systems on the energy efficiency, thermal comfort and lighting comfort of buildings in a BSH climate. The significance of this study is in demonstrating the limitations of the sun shading systems usually considered in southeastern Spain and in determining the optimal technical solution for this climate.
The results and conclusions of this work can be extrapolated to many other educational, administrative and residential buildings in very sunny climates such as the BShs climate. It should be noted that high solar radiation will affect more European regions over the next few decades because of climate change [4,5,6].

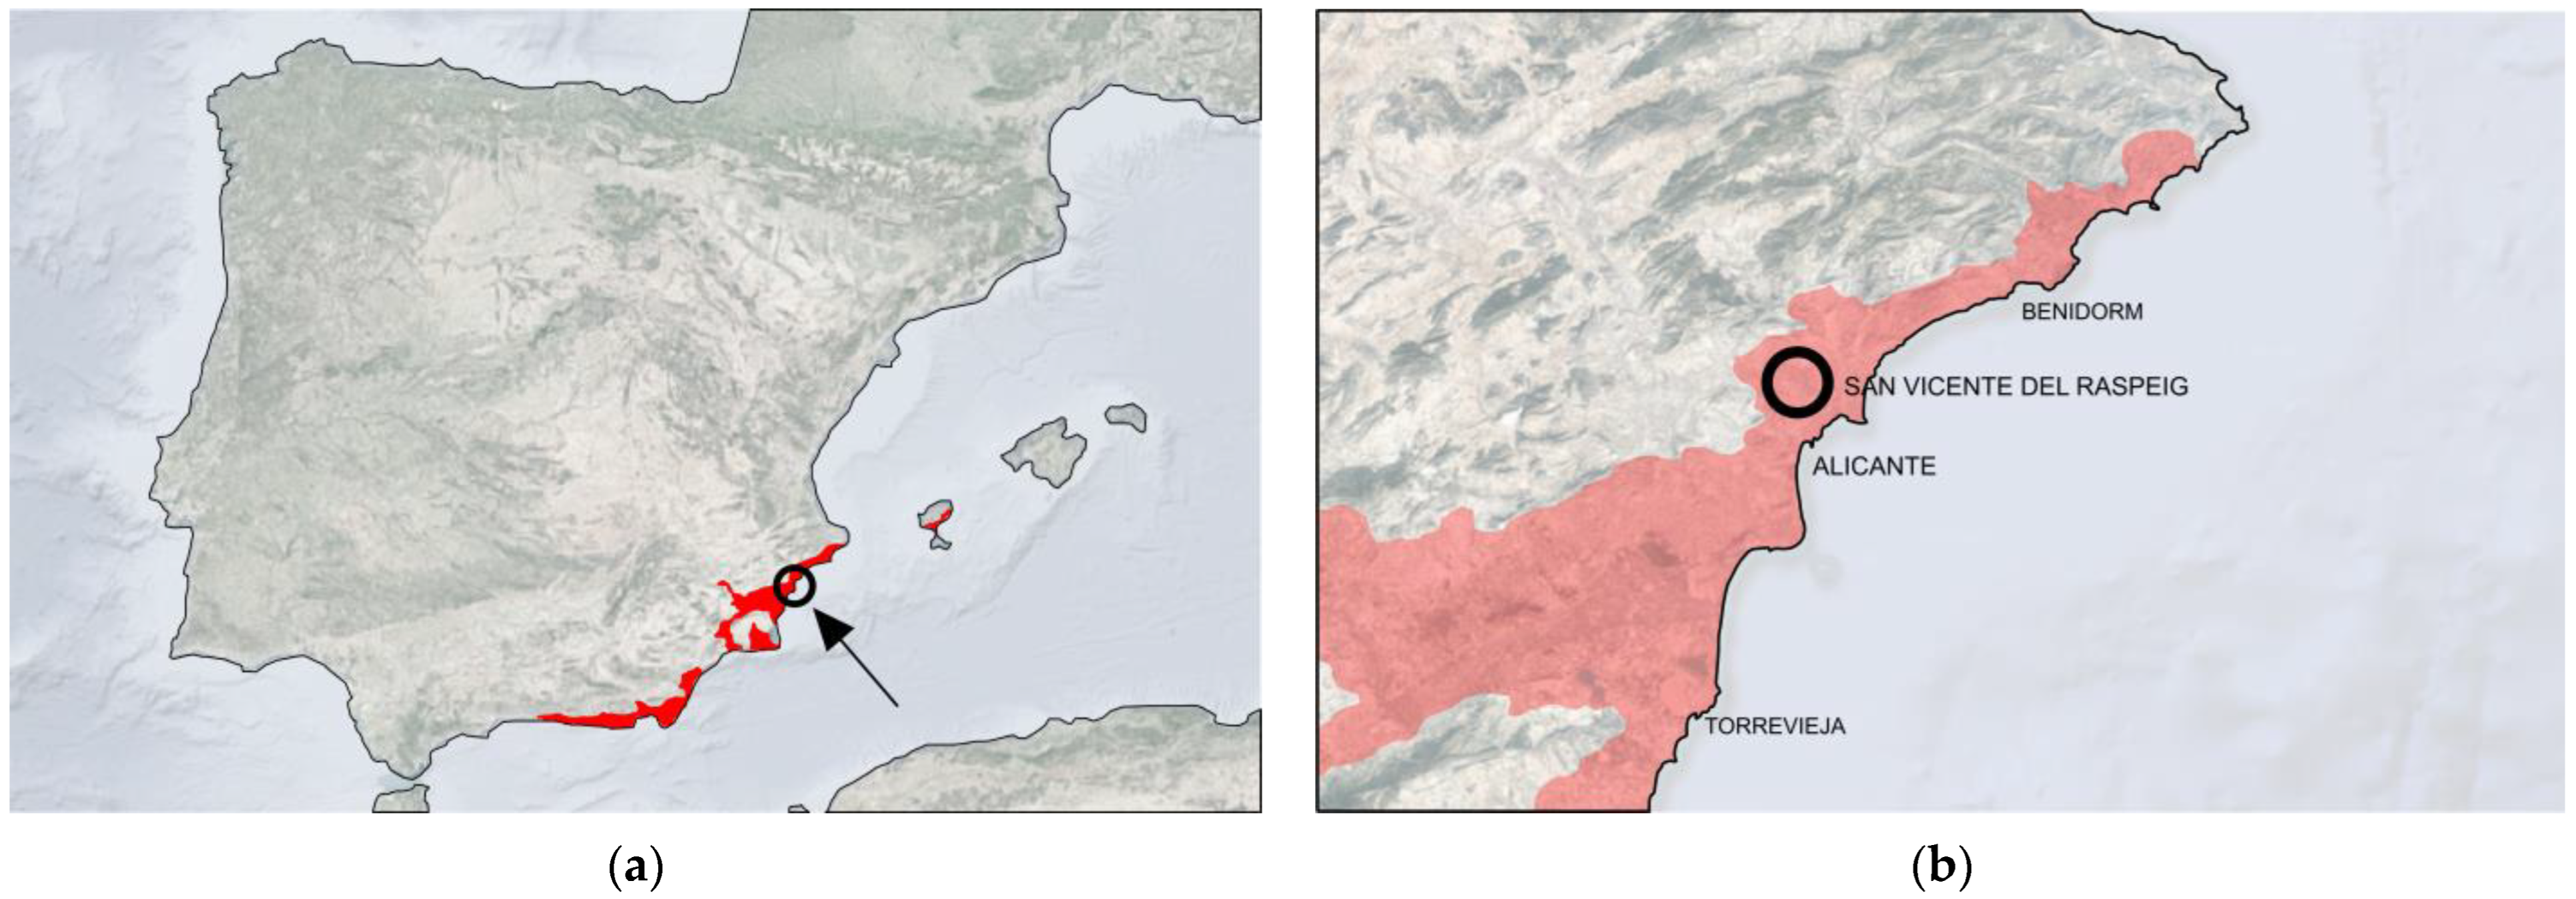
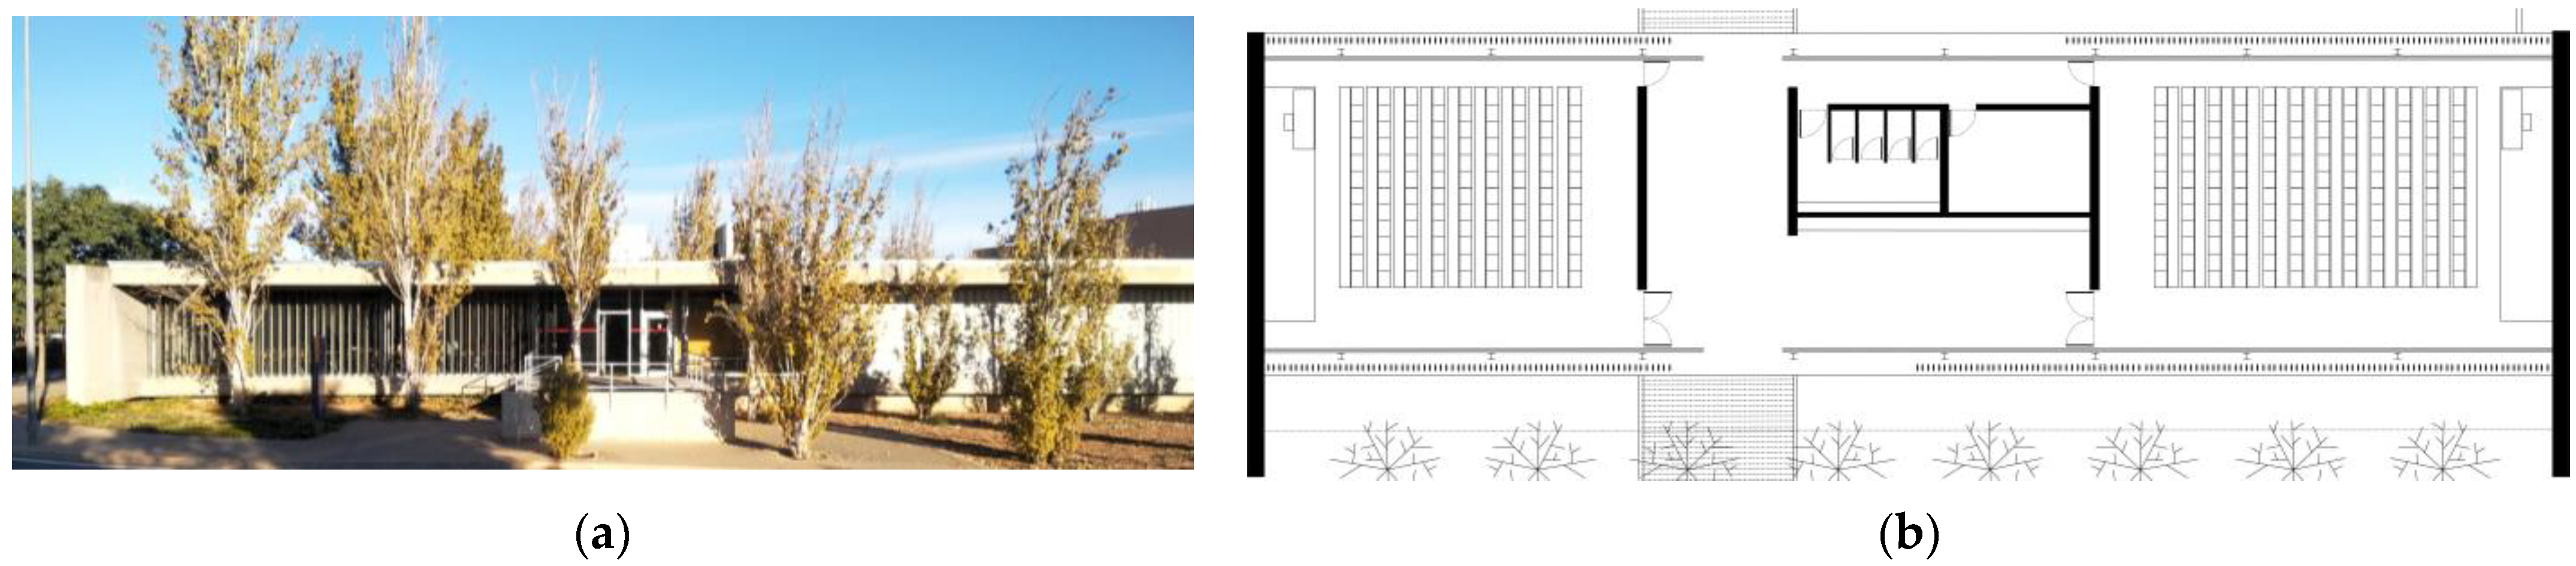
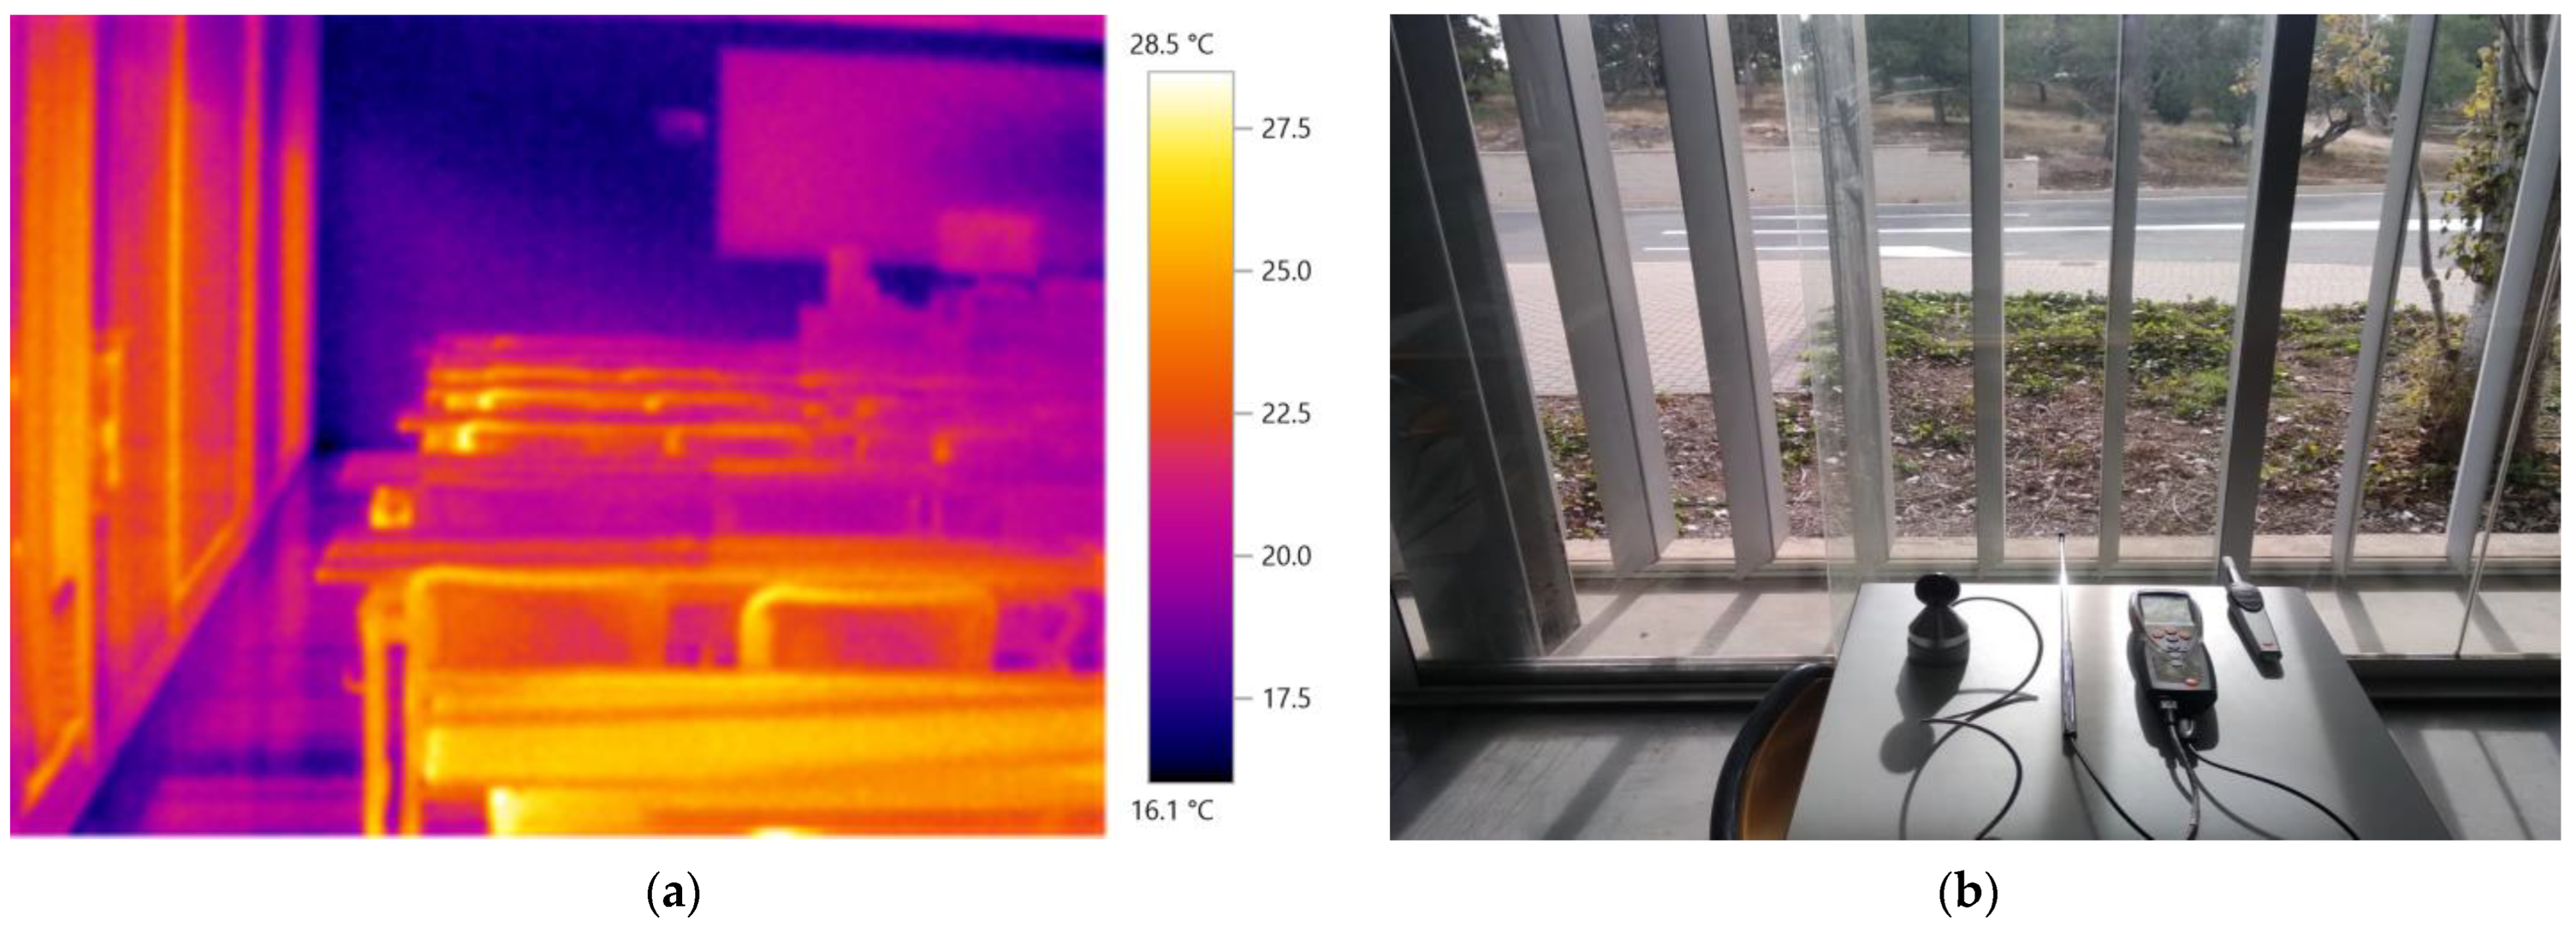
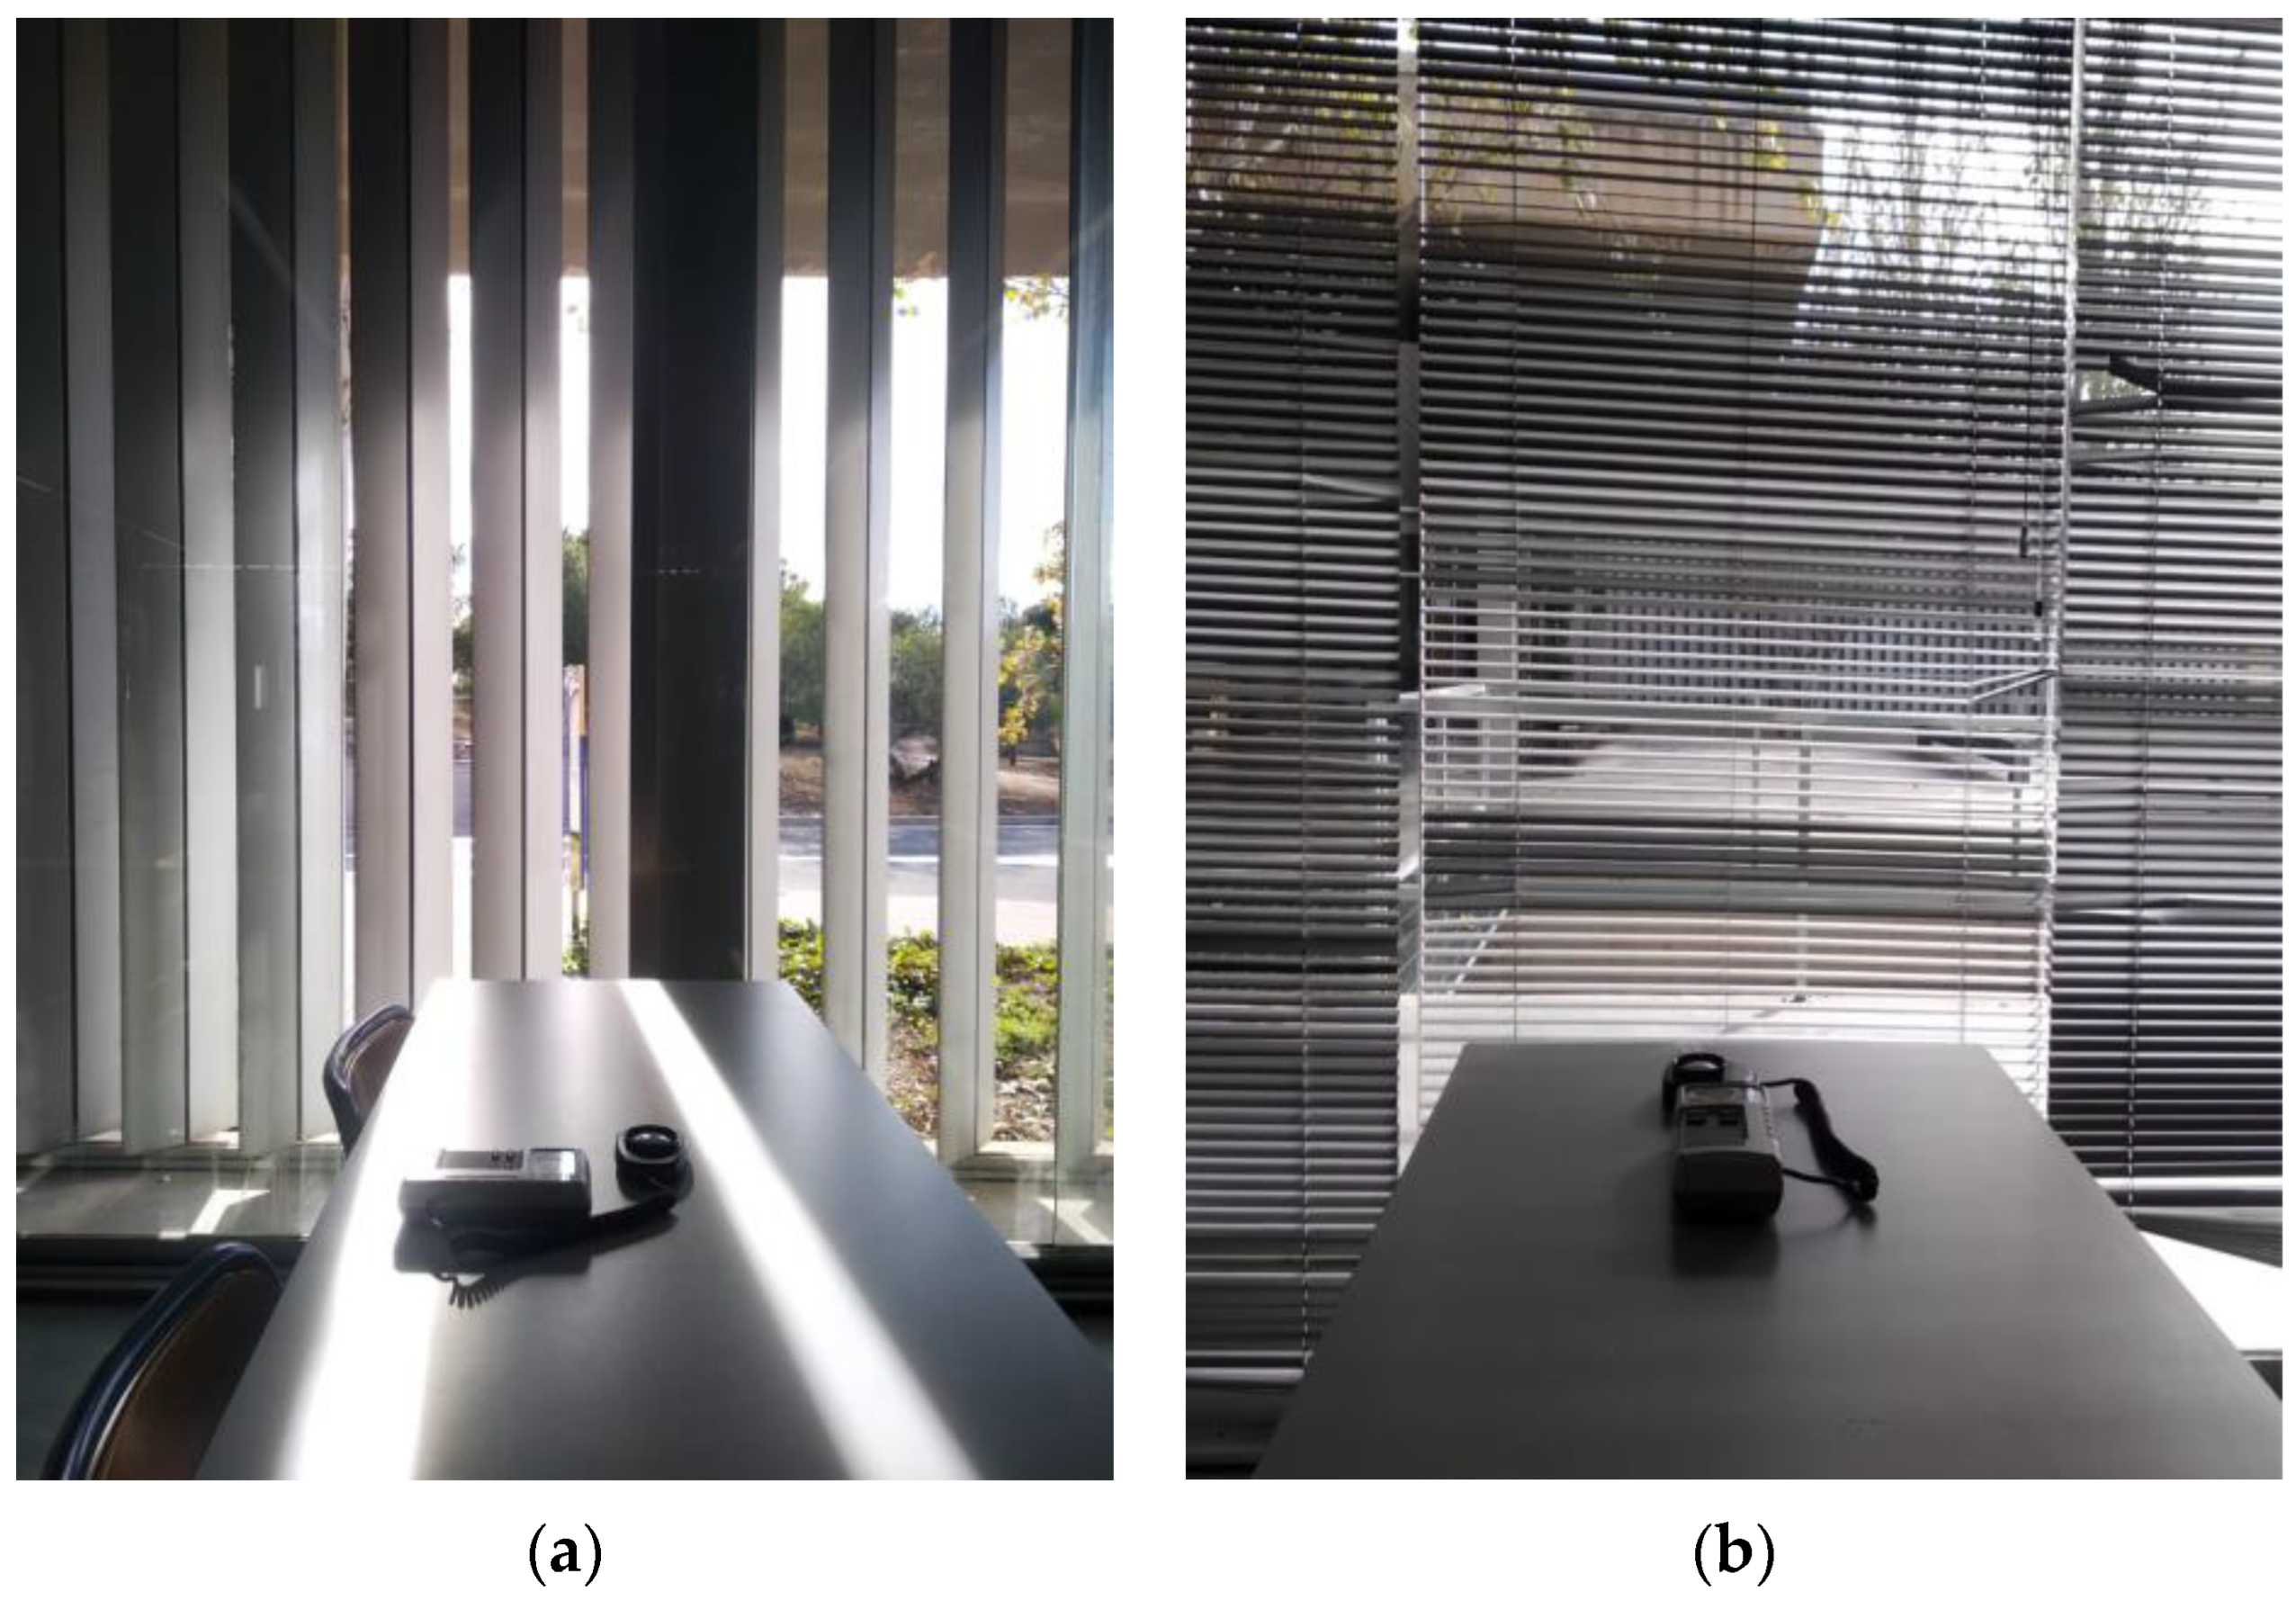
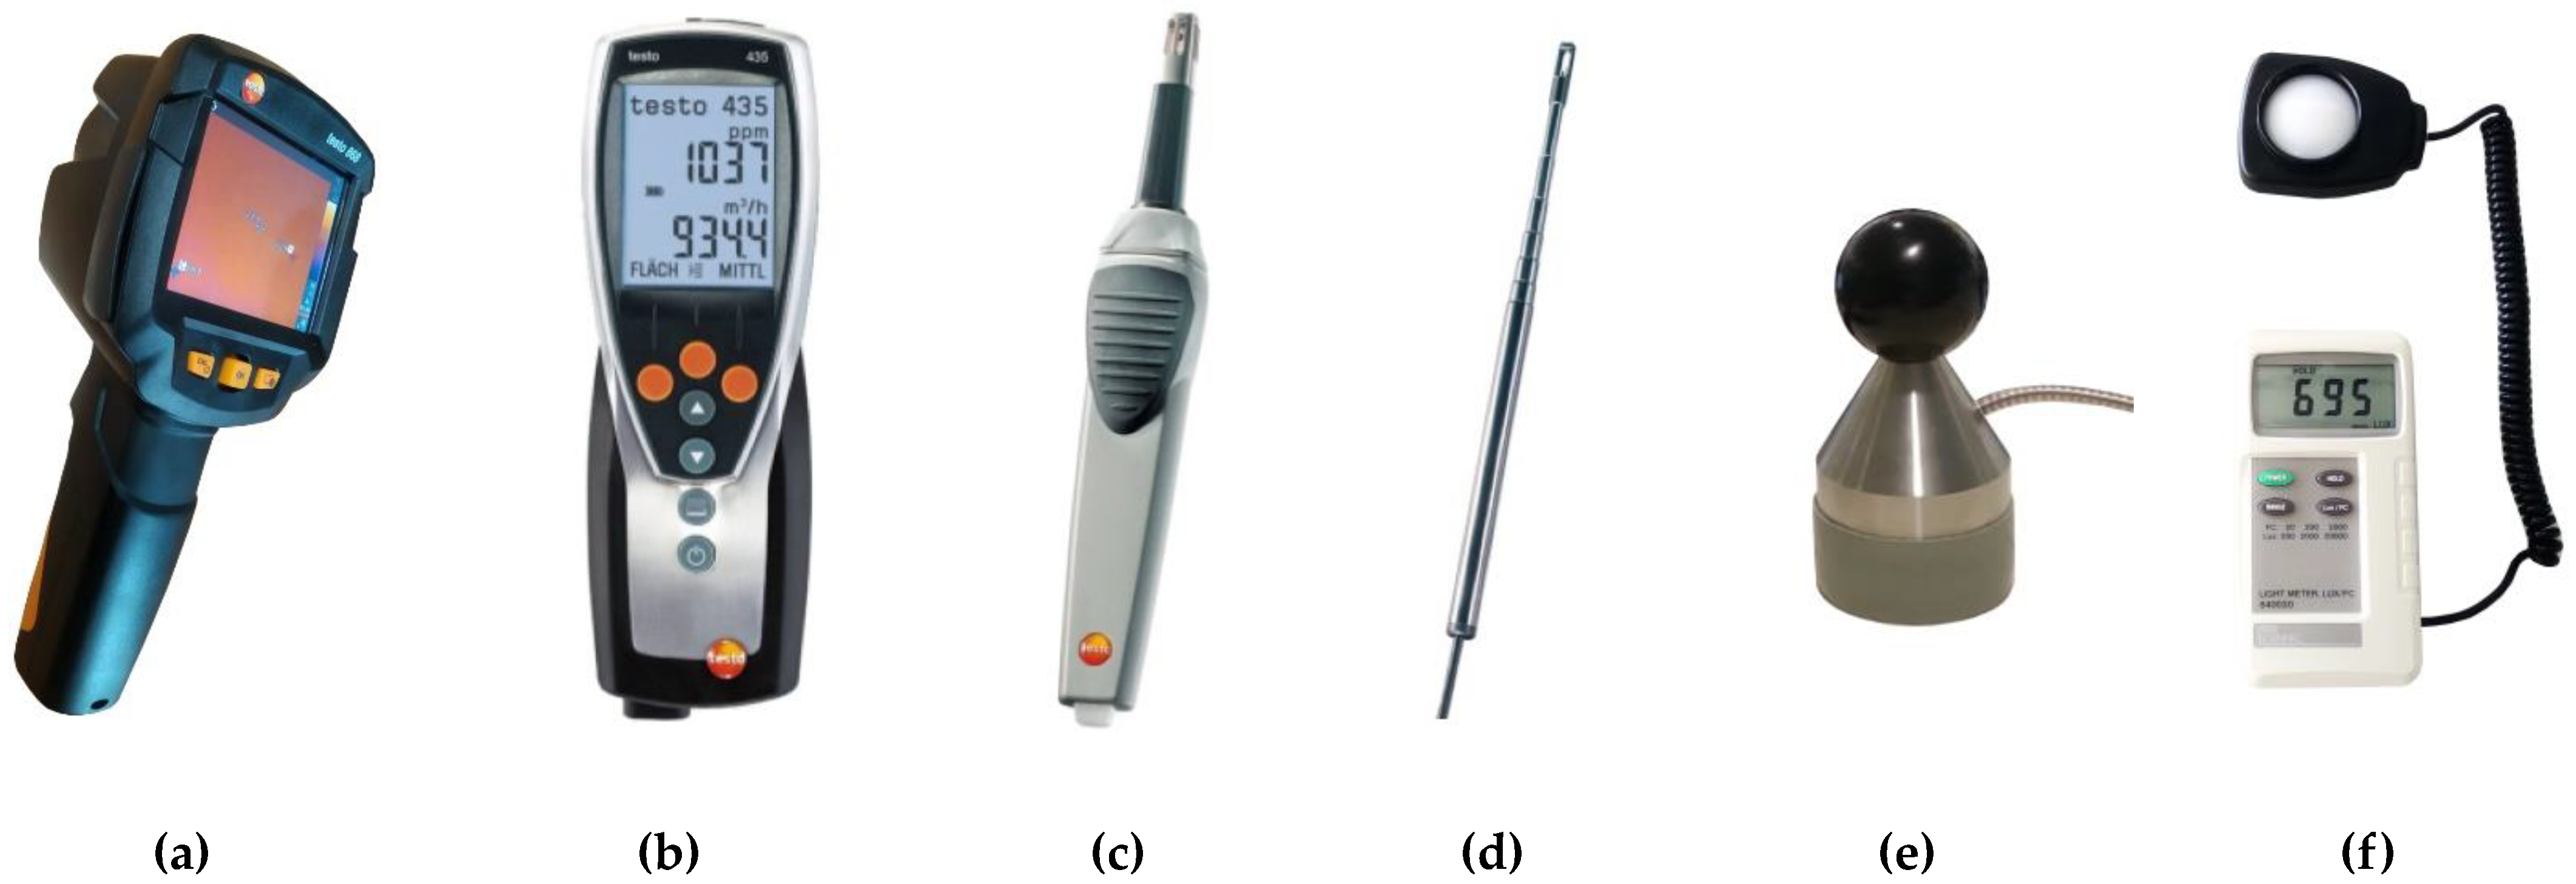
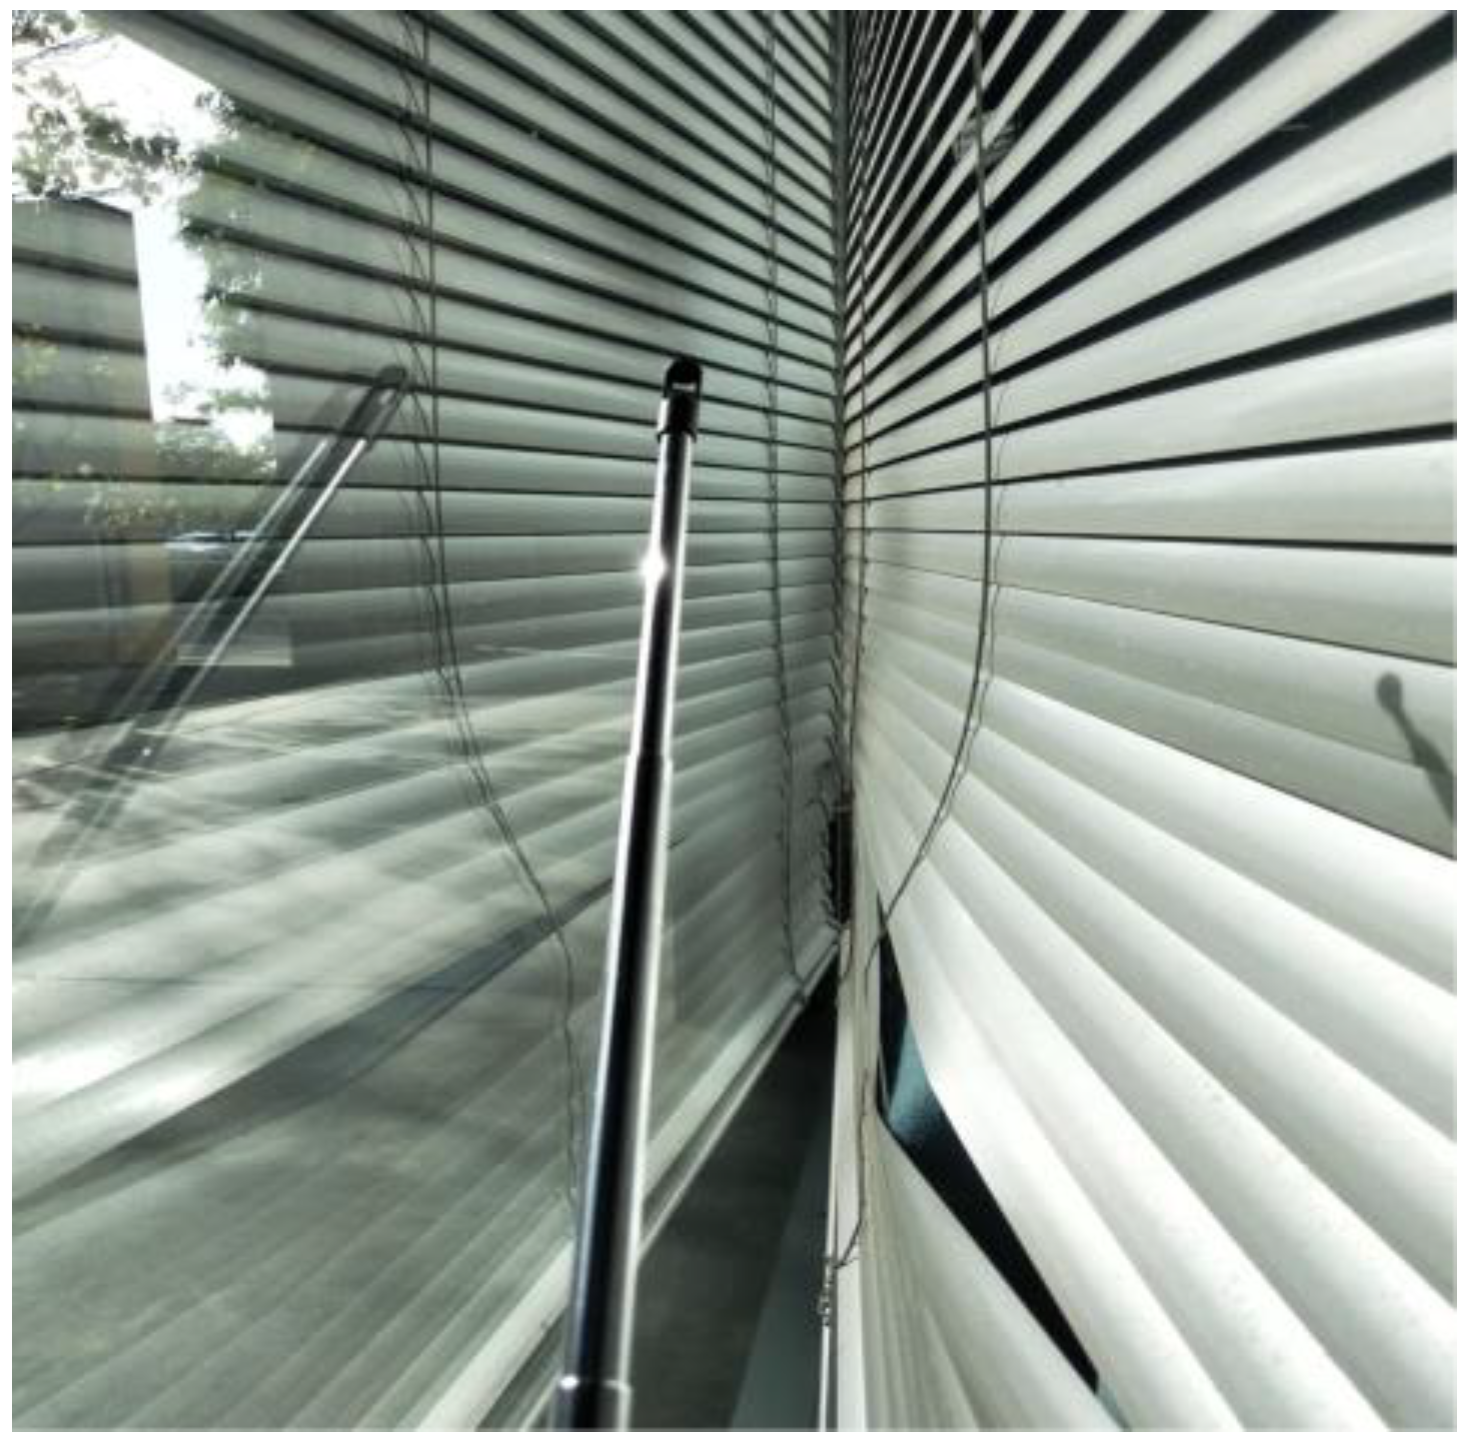
2. Materials and Methods

The case study was situated in San Vicente del Raspeig, Alicante (Spain). This area has a dry Mediterranean climate (BShs) within a BSh climate according to the Köppen–Geiger classification (Figure 1). This climate is characterised by more hours of sunshine per year than any other climate in Europe, with more than 3000 h per year.
The case study is an educational building located at the University of Alicante. It was built in 1999. It consists of 7 single-storey rectangular modules linked by walkways. The longitudinal façades are fully glazed, and the transversal façades are reinforced concrete walls (Figure 2a). The main façades face approximately south and north. Each module measures 45 × 13 m and has two classrooms and toilets (Figure 2b).
This building was selected because it can be considered the classroom building with the highest proportion of glazed surface area in the region, with a window–wall ratio (WWR) of 77%. It has movable sun shading systems with external vertical louvres. It also has some areas with indoor sun shading devices (venetian blinds). This makes it possible to compare the thermal behaviour and lighting comfort according to the solar shading system used. In addition, it is a very representative building of modern Spanish architecture, awarded and recognised by the Official Architects Association and published in many architectural journals.
The methodology includes the analysis of the thermal performance, thermal comfort, lighting comfort and energy needs. The methodology had four phases. First, the building was studied without solar control systems. Second, a classroom was studied with outdoor movable sun shading devices: vertical louvres. Third, the same classroom was studied with an interior mobile solar control system: venetians blinds. In phases I, II and III, on-site measurements were carried out and supplemented by computer simulations. Thermal and lighting comfort were studied using the on-site measurements of the indoor mean radiant temperatures, indoor dry-bulb temperatures, indoor mean operating temperatures, indoor light intensity and user surveys. The surveys were conducted by 72 users of the classroom. They valued thermal comfort from −3 (cold) to +3 (too hot), lighting level from −3 (too low) to +3 (too high) and whether there was too much light contrast. Monthly and annual energy needs were calculated from current daily energy consumption records. Finally, a proposal for an external solar control system with external venetian blinds to improve thermal comfort, lighting comfort and energy efficiency was studied by means of computer simulations (Table 1).
This research considered the shading devices retracted in the winter so as not to impair the building’s thermal performance in line with the recommendations of previous research [12,17].
This methodology allowed qualitative and quantitative comparisons of the thermal and lighting performances by analysing four different solutions.
Phase 1. On-site measurements and user surveys were carried out in the classroom without considering any movable sun shading system. For this purpose, the existing louvres were oriented so as not to interfere with incident solar radiation and the thermal behaviour of the building.
Phase 2. On-site measurements and user surveys were carried out in the classroom considering the current outdoor movable sun shading system of vertical louvres. The louvres were optimally oriented to reduce the incident solar radiation and to improve the thermal behaviour of the building. The louvres had to be partially opened to allow sufficient daylight into the classroom.
Phase 3. On-site measurements and user surveys were carried out in the classroom considering the current interior movable sun shading system of indoor venetian blinds. These blinds were graduated to allow a similar overall light intensity as in the other classroom.
On-site temperature measurements were taken during class hours, between 09:00 h and 14:00 h, every week for one year. (Figure 3). The measuring devices were switched on at least 5 min beforehand to adjust them to the ambient conditions. The operating temperature was considered an average of the dry-bulb air temperature and mean radiant temperature, considering indoor building air speeds (less than 0.2 m/s) in accordance with the standards [71]. The HVAC system kept indoor dry-bulb temperatures within the comfort ranges established by the Spanish standards. On-site surveys of classroom users were also conducted to study thermal comfort.
The on-site measurements of light intensity were carried out during teaching hours, between 09:00 h and 14:00 h, in the two different classrooms tested with different movable shading devices (Figure 4). The students were distributed equally in the two classrooms to compare lighting comfort. The two types of movable shading devices let in enough daylight to obtain a similar average light intensity in the centre of the two classrooms studied. Surveys of classroom occupants were conducted to study lighting comfort.
The thermal imaging analysis was conducted with a Testo 868 camera (Testo SE & Co. KGaA, Titisee, Germany). Measurements of thermal transmittance, indoor and outdoor dry-bulb temperatures, indoor mean radiant temperatures and humidity were carried out by using a Testo 435-2 multifunctional instrument (Testo SE & Co. KGaA, Titisee, Germany) calibrated to standard settings (Figure 5 and Table 2). Luminous intensity measurements were made with a Sper Scienttific Lux/FC PCS-100 840020C luxmeter (Sper Scientific Ltd., Hoffman Engineering Corp., Scottsdale, AZ, USA) calibrated using standards traceable to the U.S. National Institute of Standards and Technology.
Phase 4. Computer simulations were carried out to calculate thermal behaviour and light comfort by means of an outdoor movable sun shading system with outdoor venetian blinds. Before calculating the new proposals, the calculations made with the energy simulation tool were adjusted and validated. For this purpose, thermal computer simulations were compared with current measurements obtained from the building studied. The results of the thermal comfort surveys were compared with the thermal comfort calculations of Fanger’s method. This method calculates the predicted mean vote (PMV) and predicted percentage of dissatisfied users (PPD). The PMV values are between −3 (cold) and +3 (very hot). Values between −1 (slightly cool) and +1 (slightly warm) are considered appropriate according to the adaptive method defined by the ASRAHE 55 standard [72].
Design Builder software (version v.7.0.1.006, DesignBuilder Software Limited, Stroud, UK) was used for the computer calculations. This software is based on the EnergyPlus calculation engine [73]. This software simulates indoor daily temperatures, thermal comfort and energy needs. This programme also calculates thermal comfort and lighting comfort in the various areas of the classroom using computational fluid dynamics (CFD).
For the computer simulations, the thermal transmittances of the current building envelopes and glazing measured in situ, air permeability and the absorptivity of the frames were considered. Consideration was also given to the geometry and orientation of the building, the distribution of opaque enclosures and glazing, and fixed shadow elements such as the cantilevers of the structure. Outdoor temperature and relative humidity data recorded on the same days of the on-site readings were also considered (Table 3).
To simulate the effect of movable sun shading devices, solar transmittance factors, reflection factors and shading factors for external obstacles were considered in accordance with Spanish [41] and European [42] standards. The considered data are as follows (Table 4).
Computer calculations considered the occupancy, characteristics of HVAC units and mechanical ventilation, setpoint temperatures and usage schedules and internal lighting loads (Table 5).

3. Results

First, this section considers the thermal comfort results. Secondly, the lighting comfort results are shown. Thirdly, the energy efficiency results are displayed. In each of the three sections, the results are distinctively shown for the building without any movable solar control system, with the current movable solar control system using external vertical louvres, with the internal movable solar control system using indoor venetian blinds and with the proposed external movable solar control system using outdoor venetian blinds.

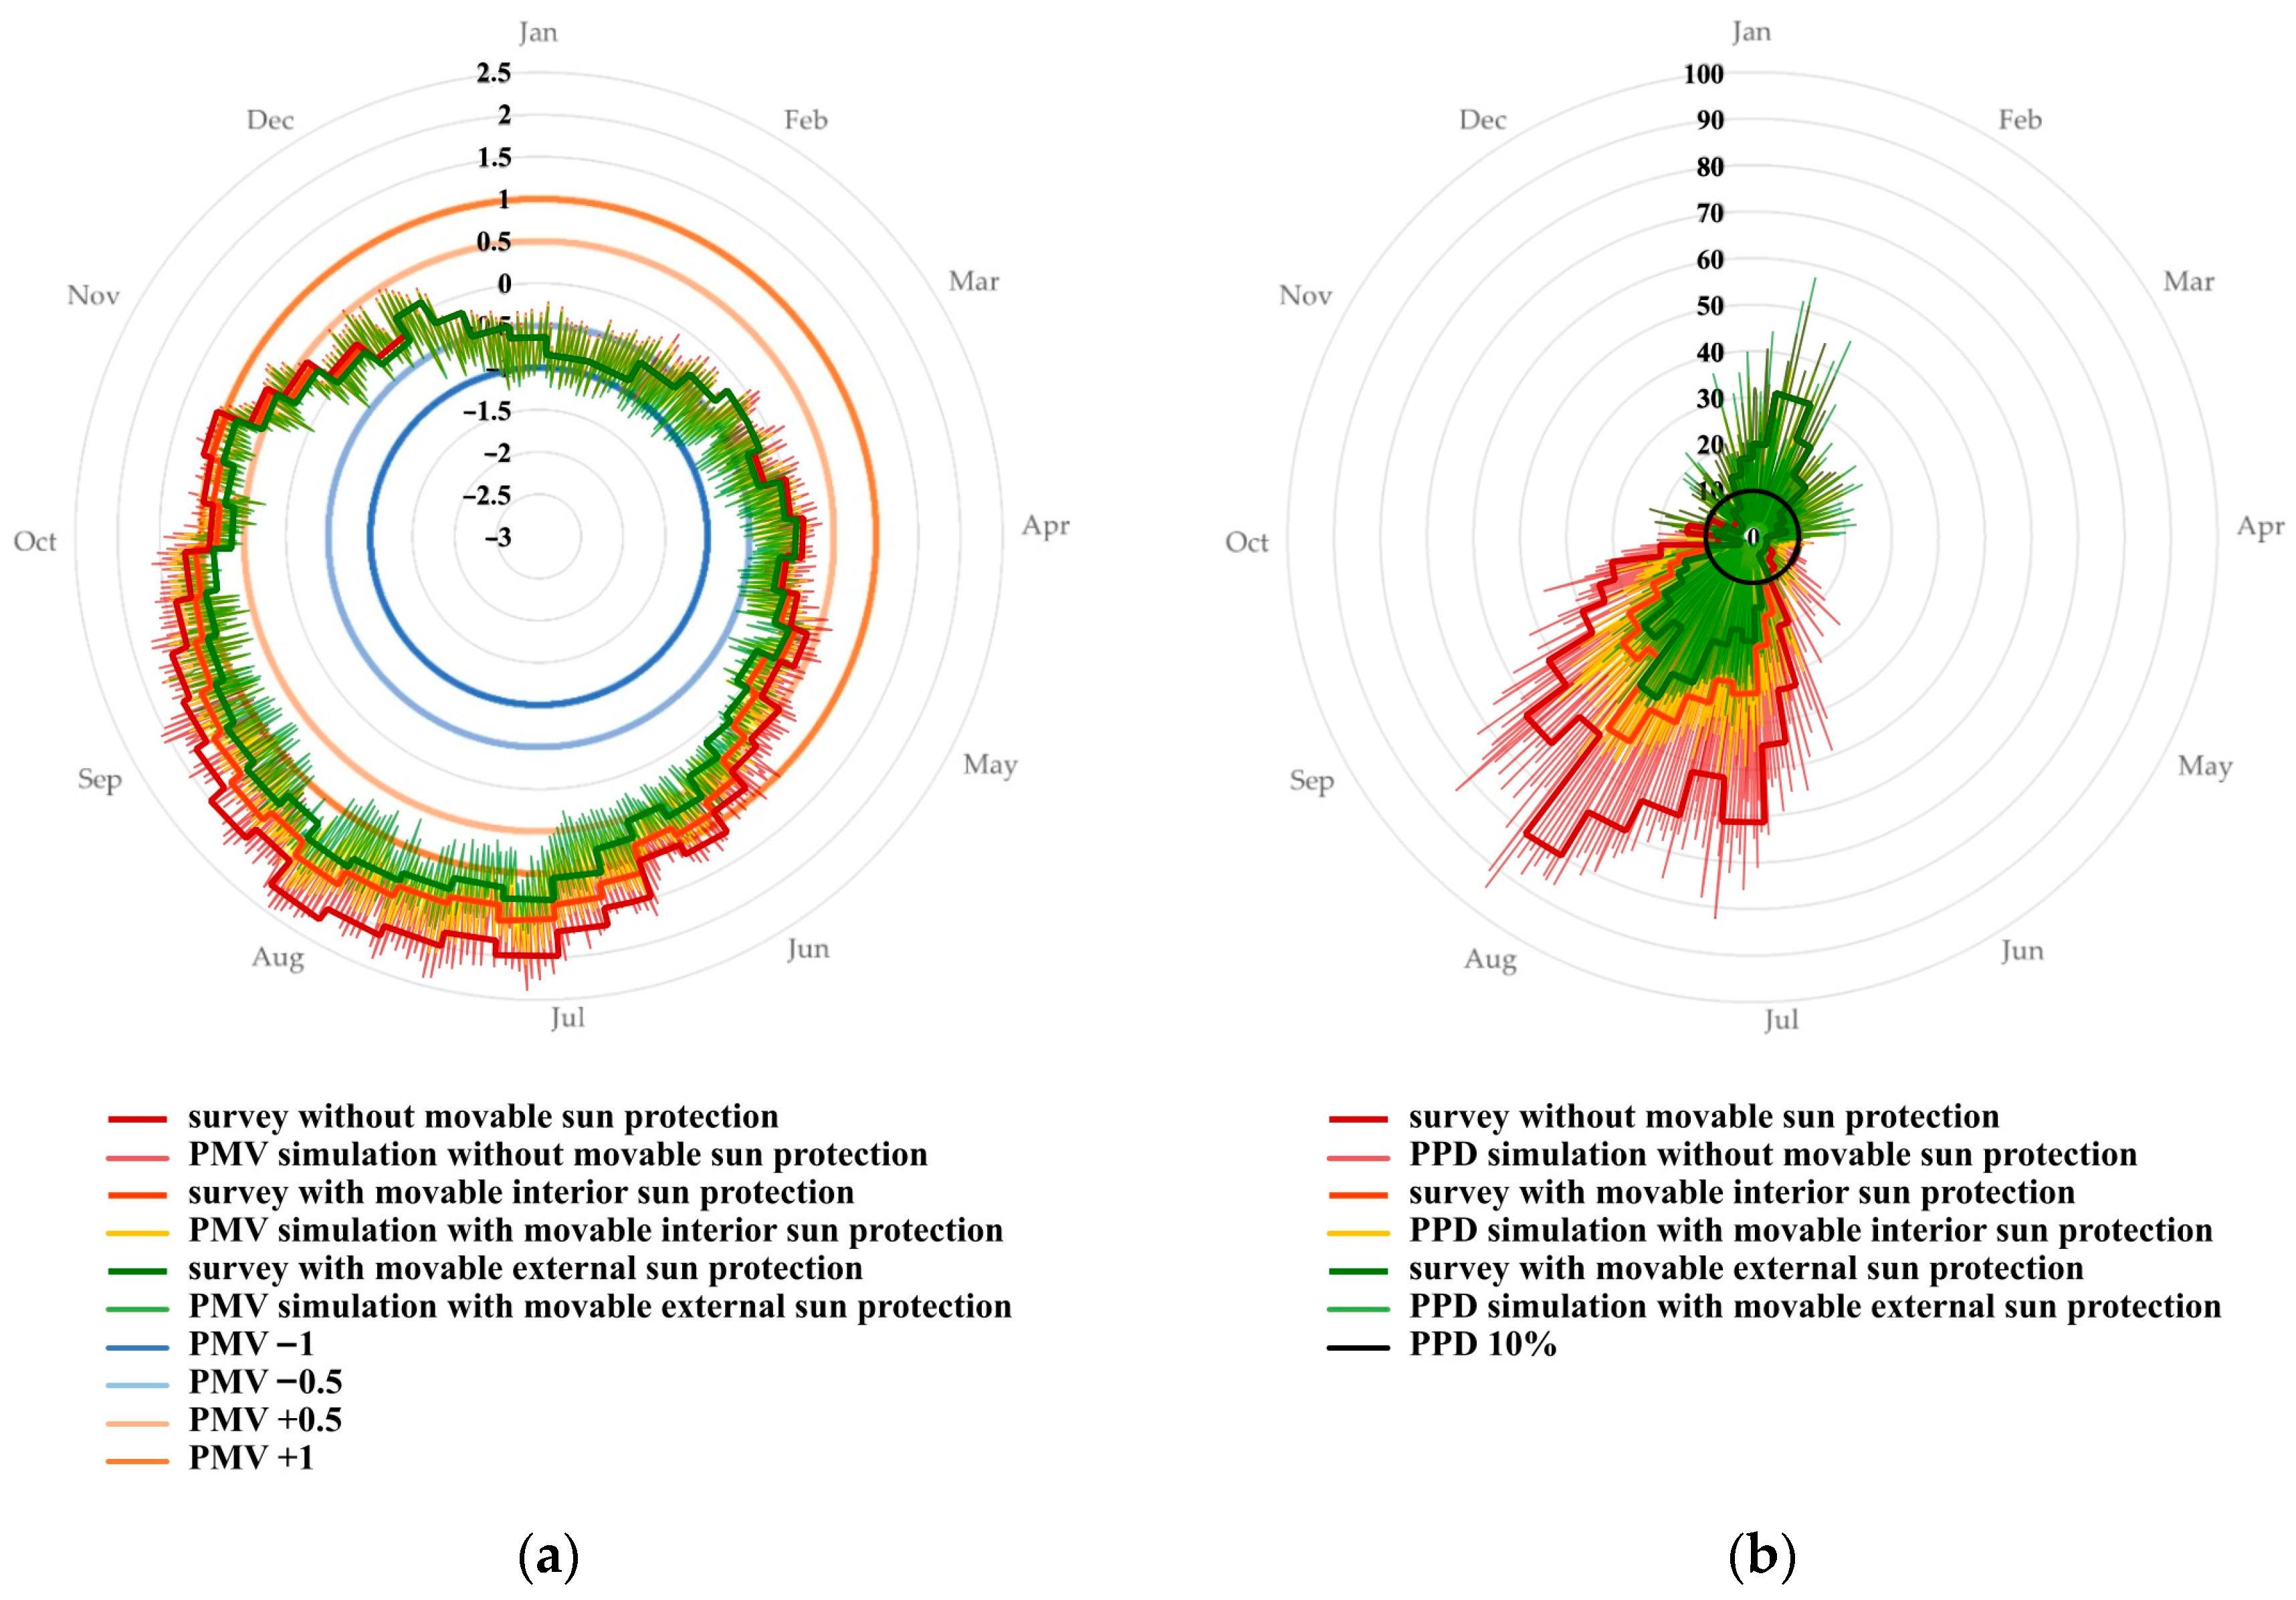
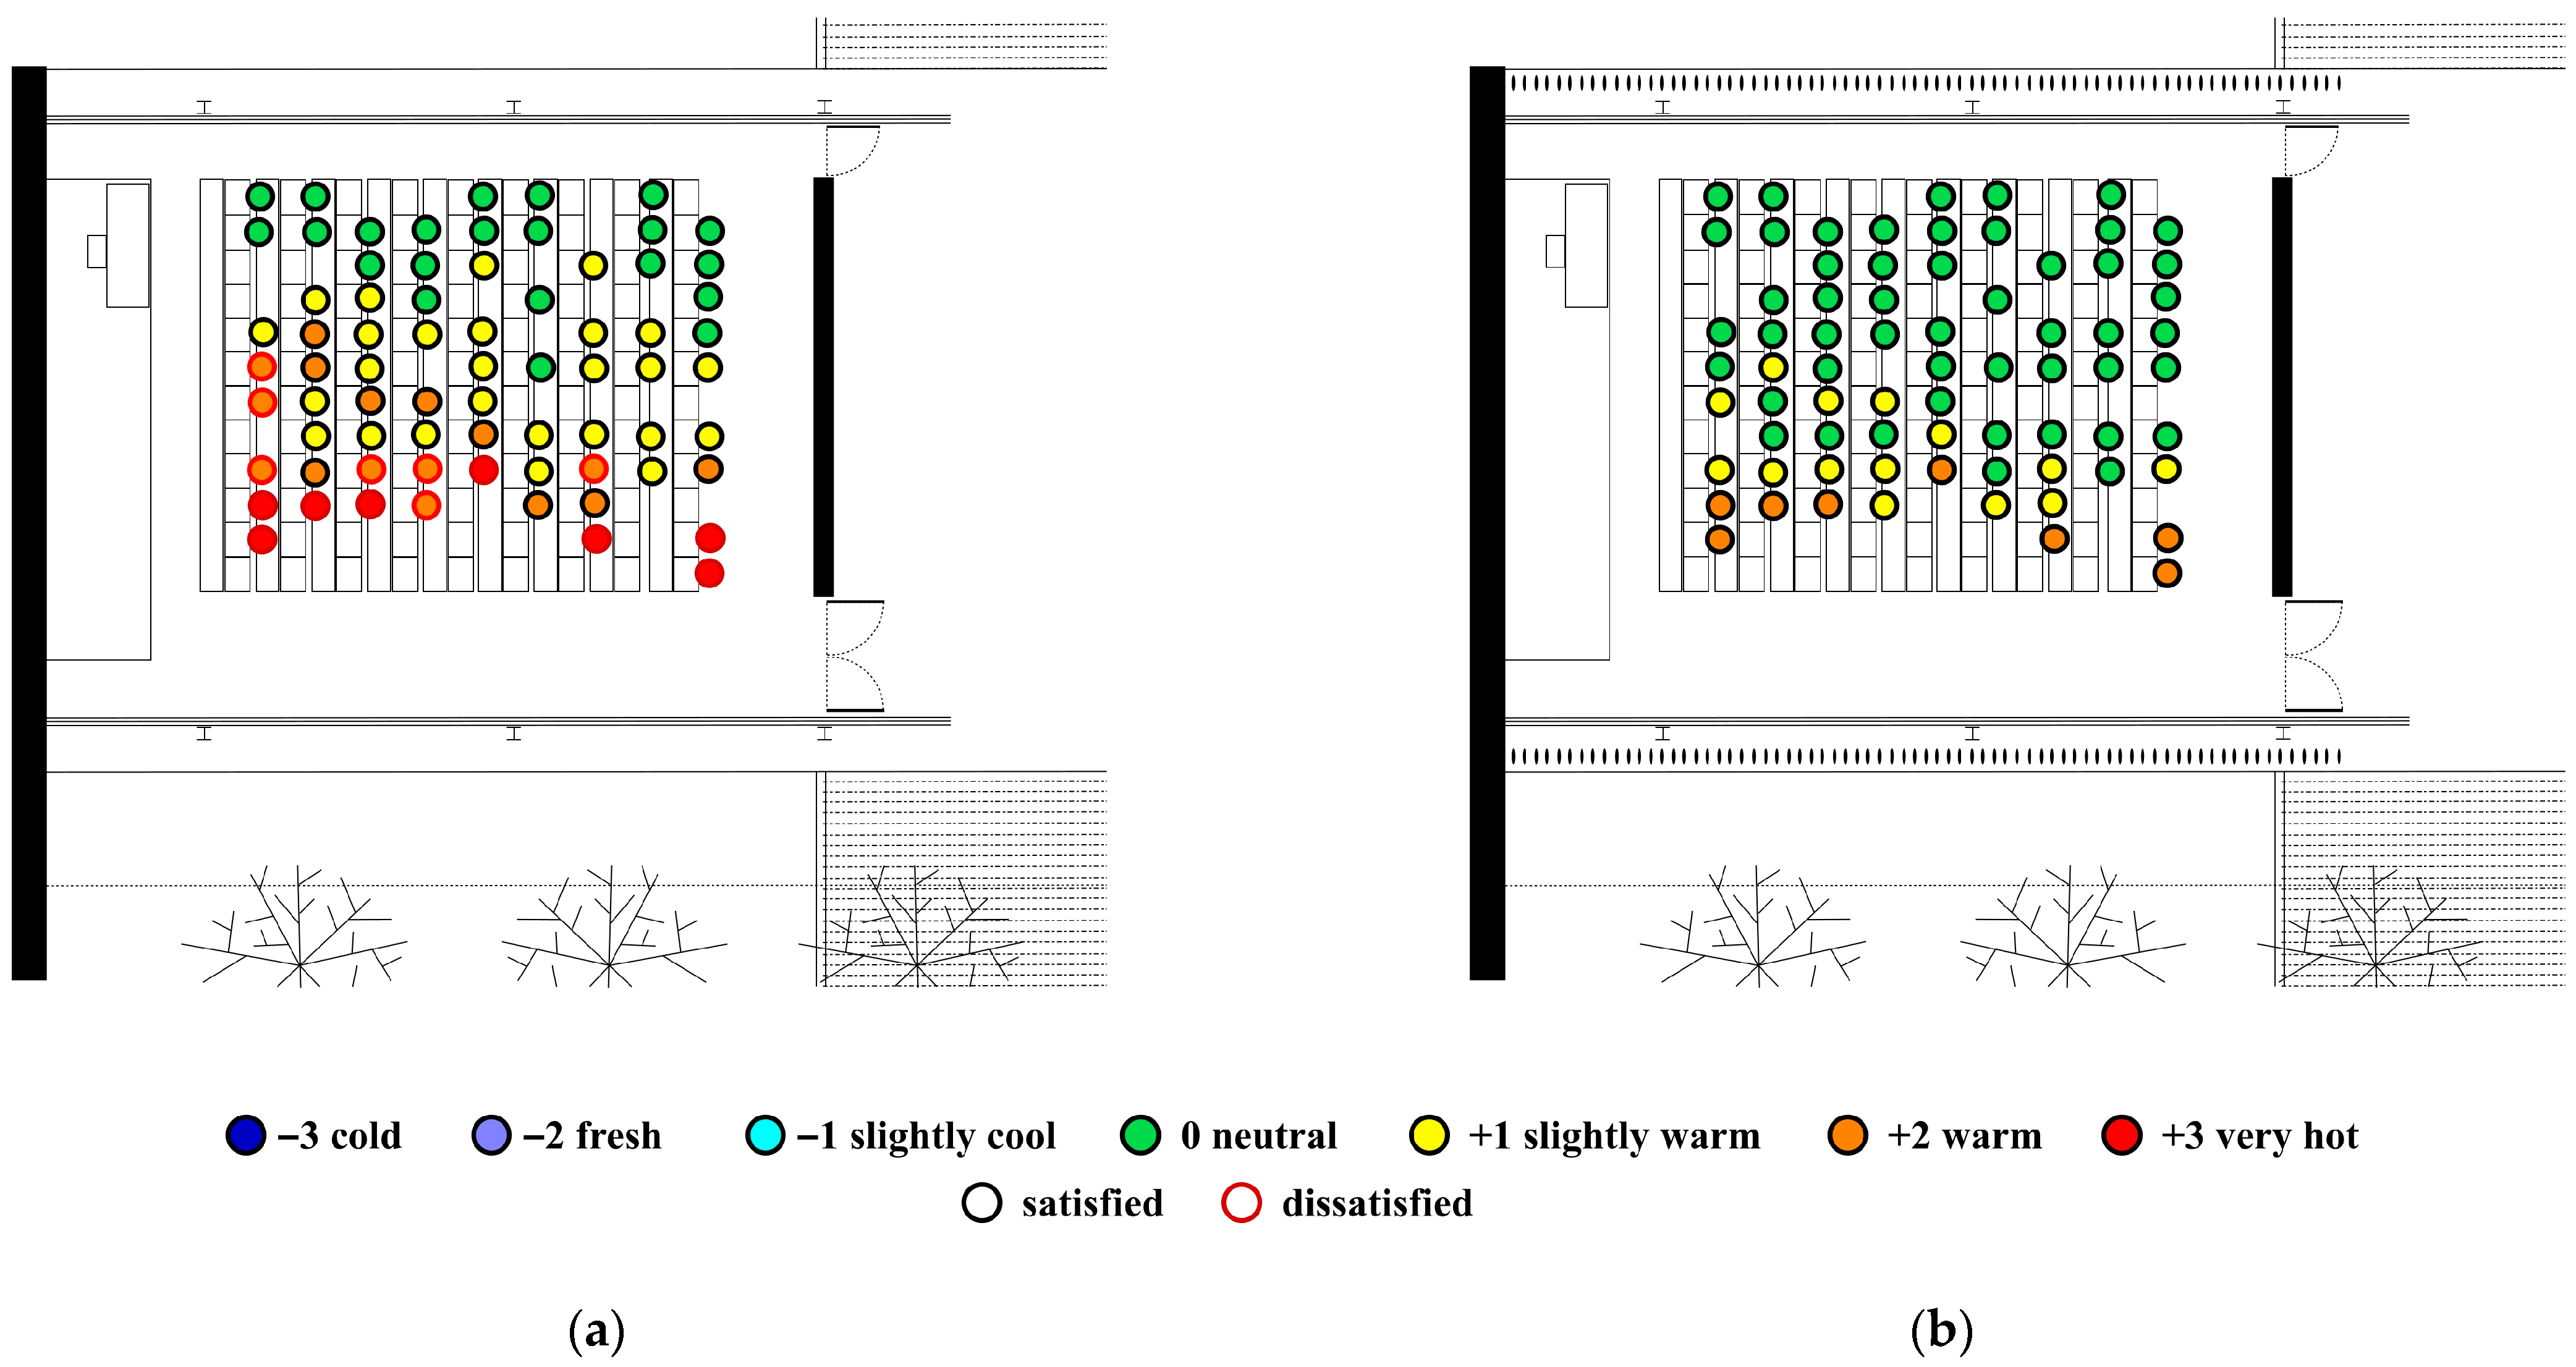
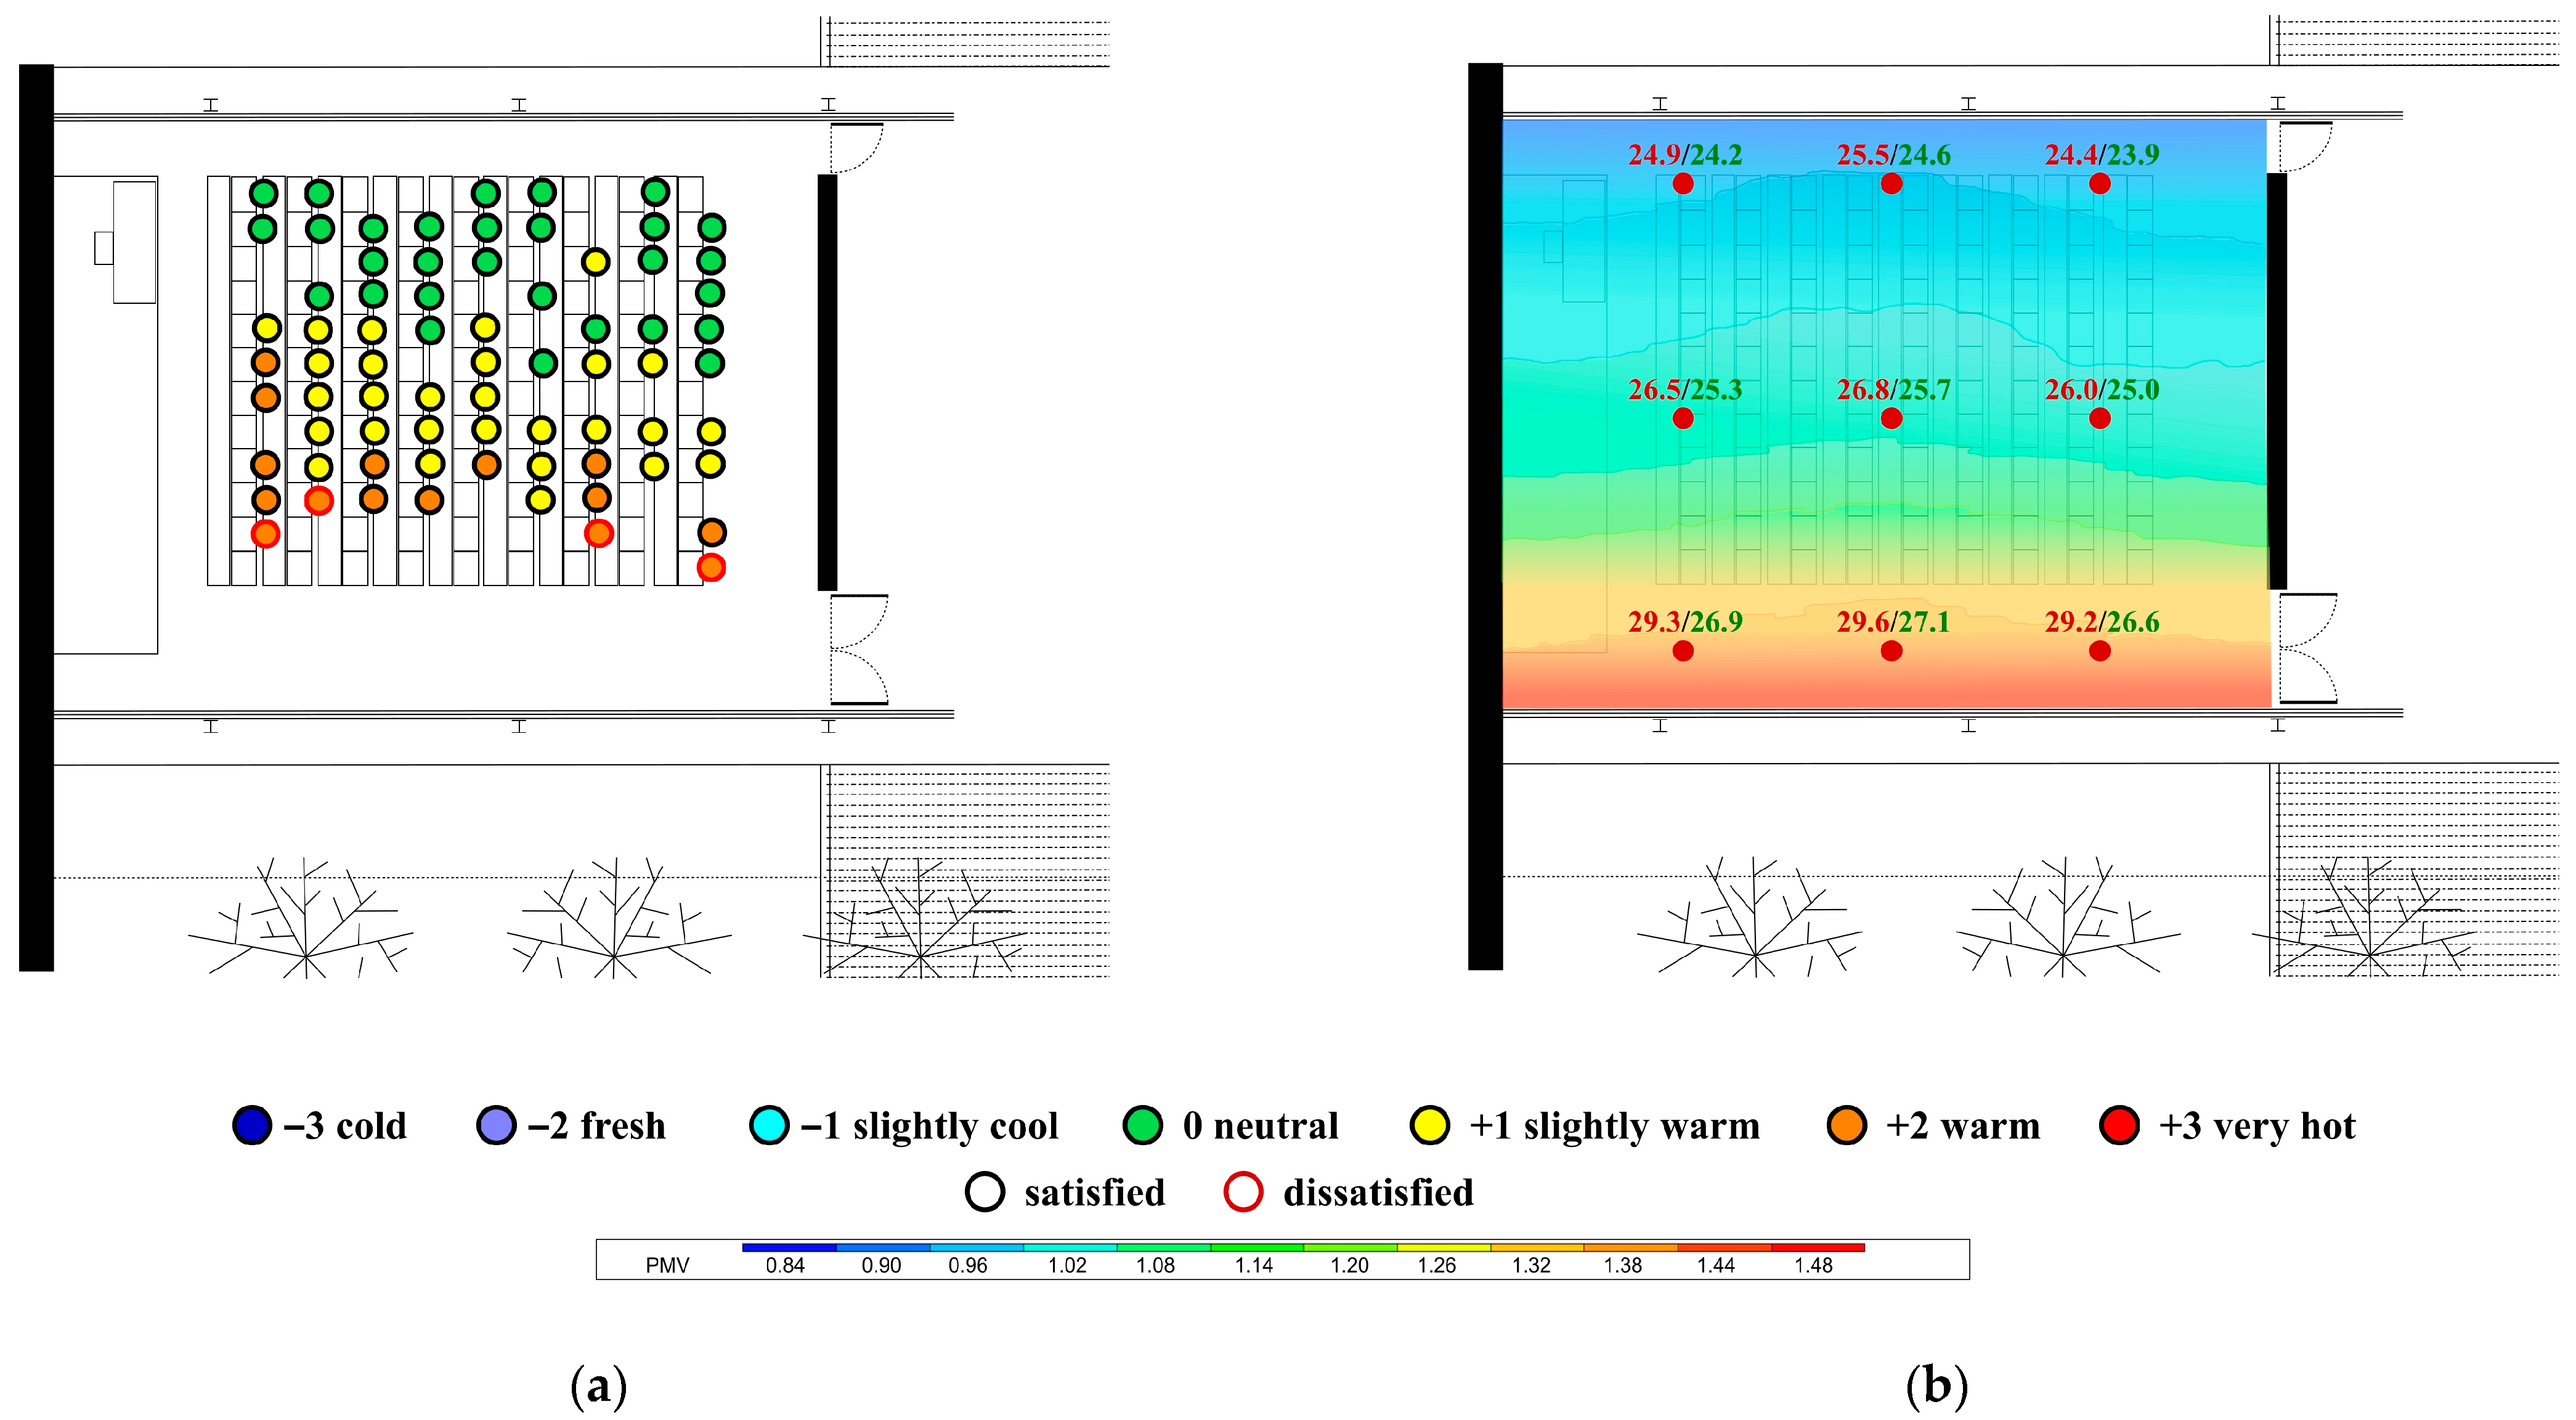
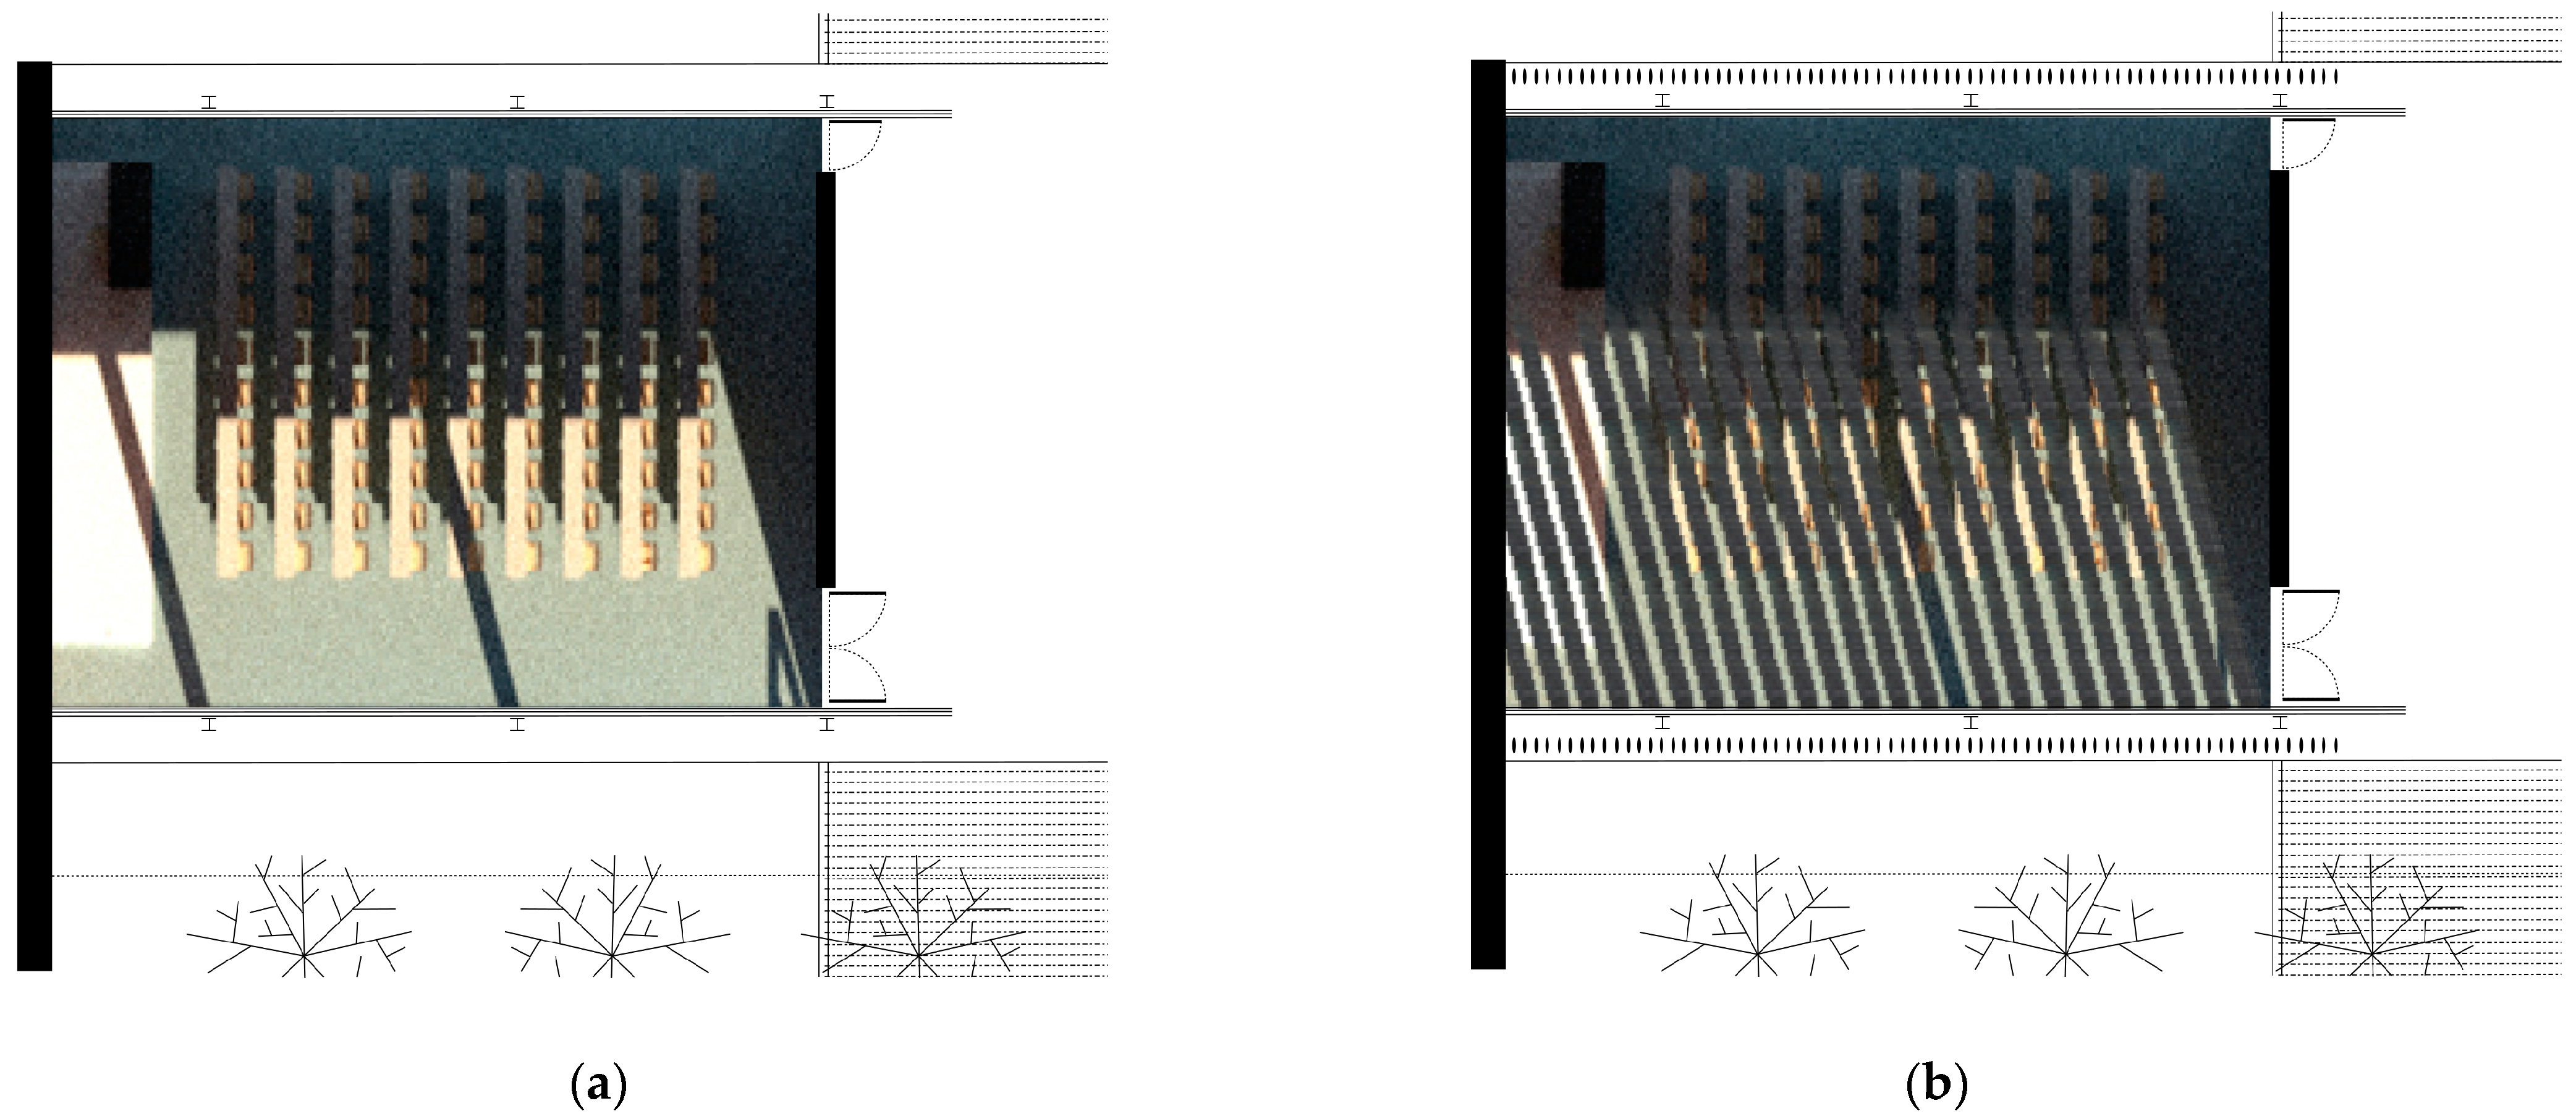
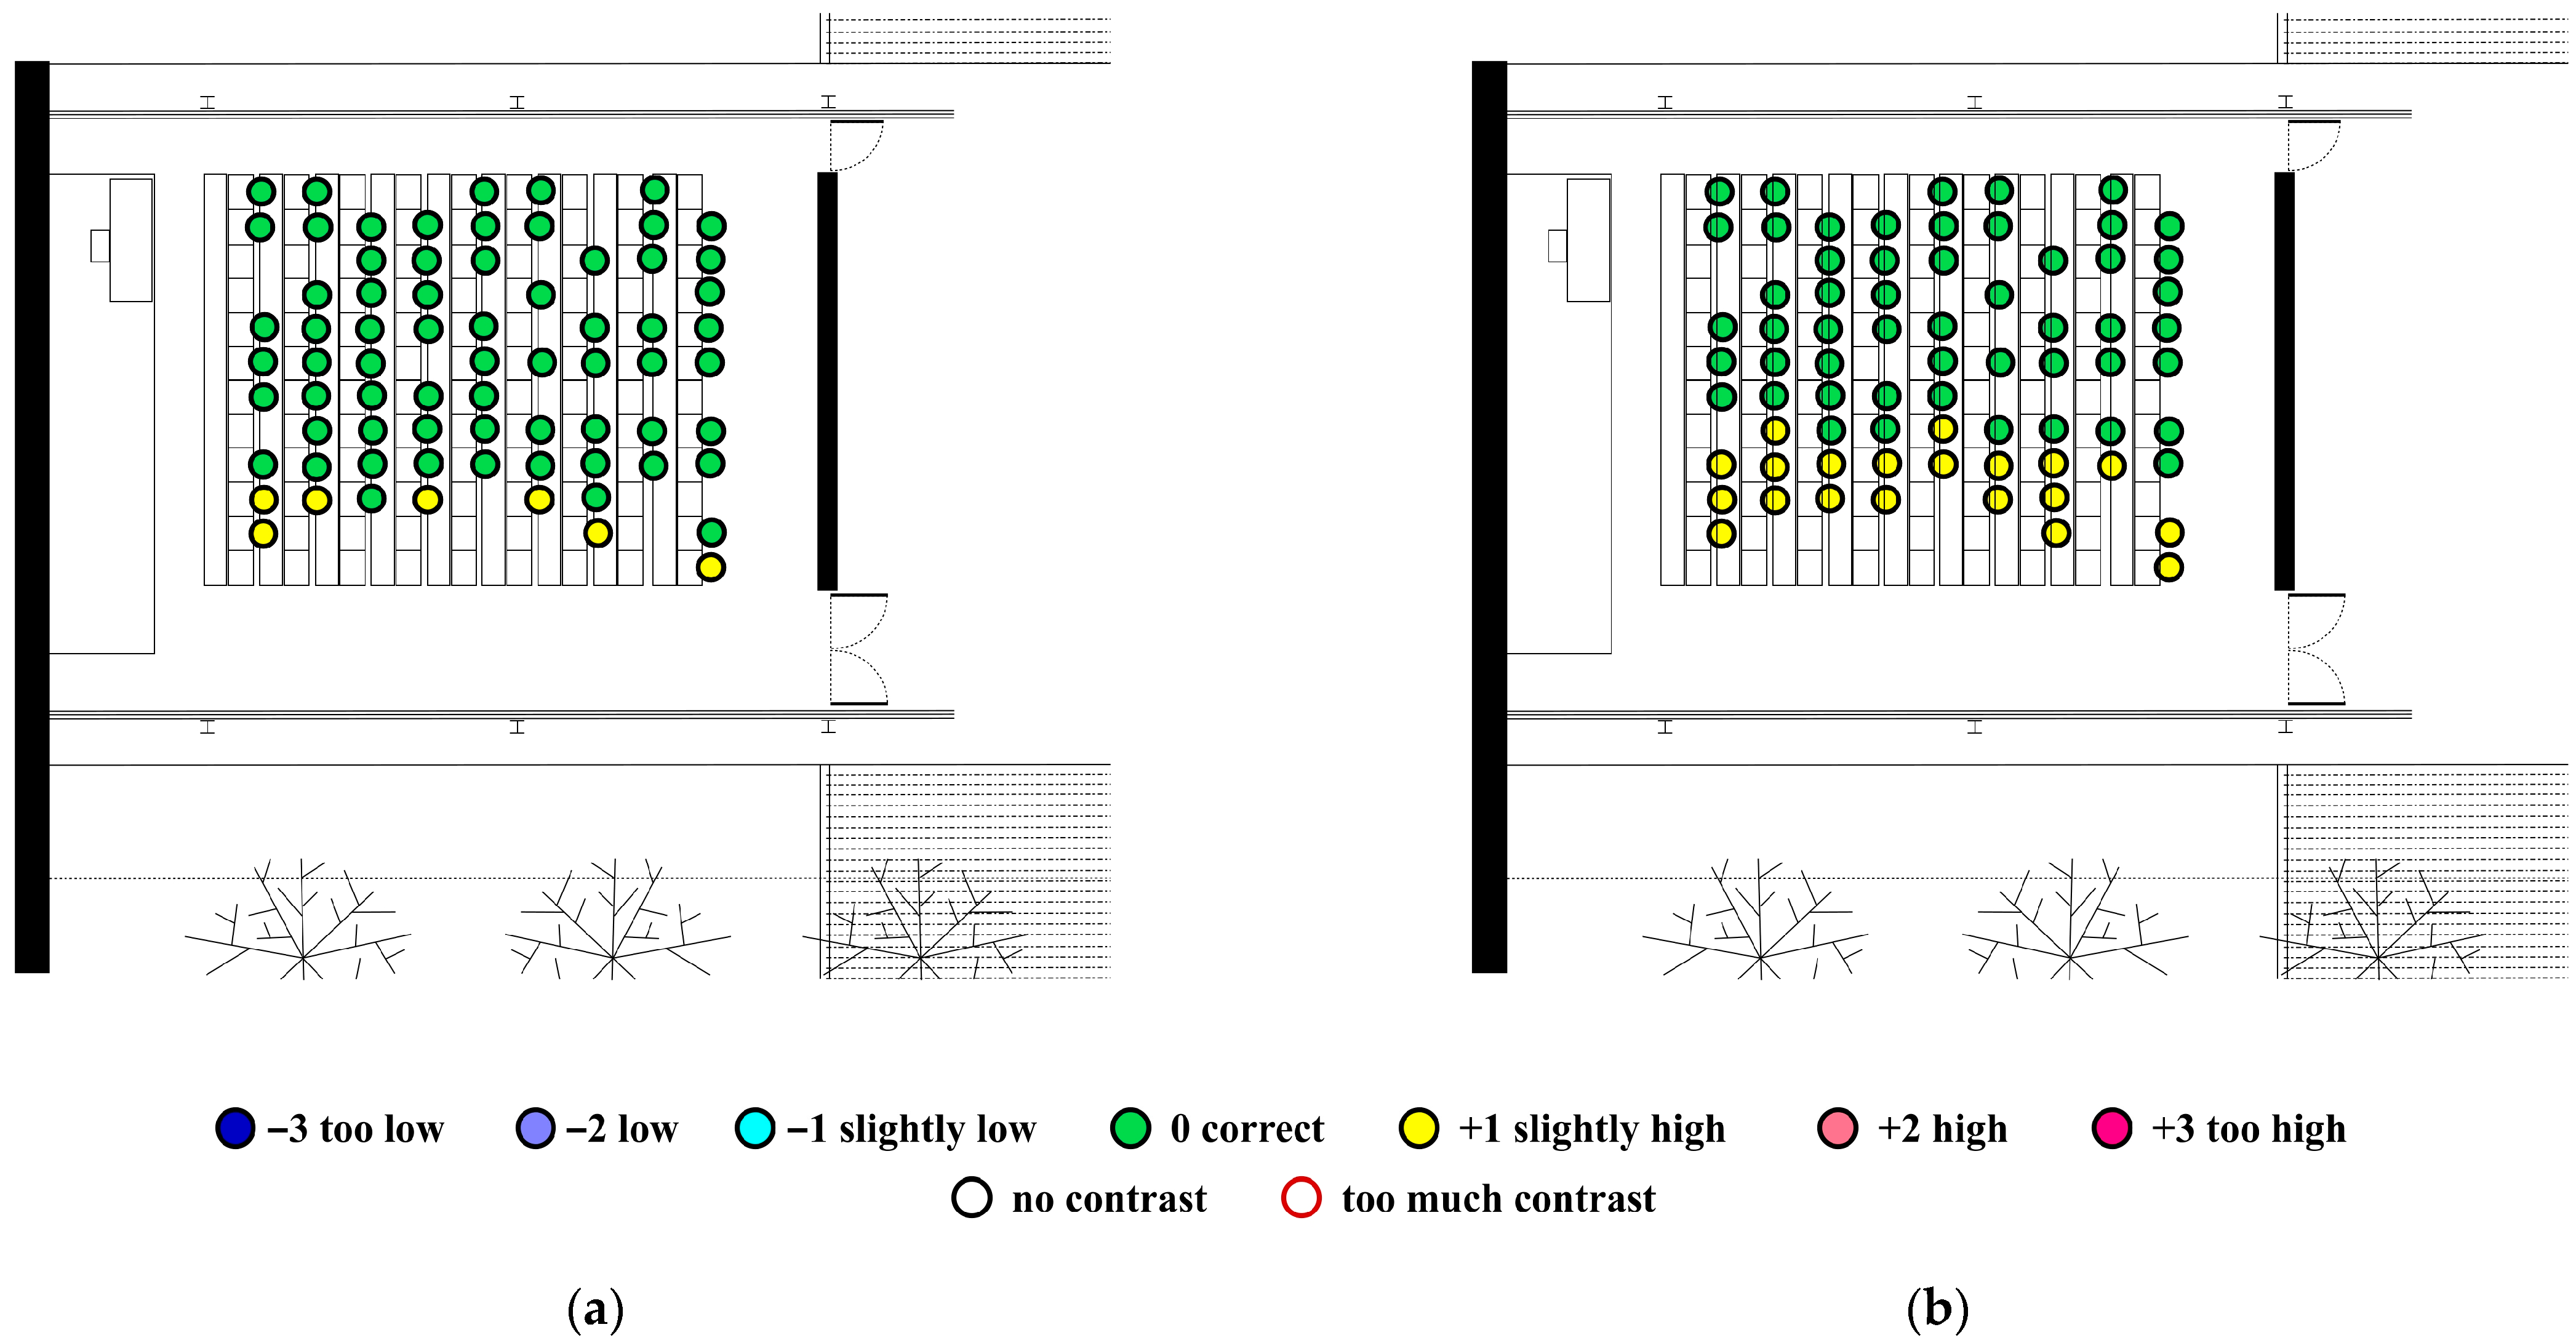
3.1. Thermal Confort

The results show that removing the solar shading from the outdoor louvres greatly worsens the thermal performance of the building. On-site measurements show mean radiant temperatures above 34 °C in the areas close to the glazing exposed to the sun. This produces operating temperatures above 30 °C in these areas (Figure 6a). In the areas far from the sun-exposed glazing, mean radiant temperatures are lower than 27 °C and mean operative temperatures are around 26.5 °C. As a result, there is a thermal difference of up to 7.6 °C between mean radiant temperatures and 3.8 °C between mean operative temperatures in different areas of the classroom.
Using outdoor vertical louvres oriented to protect from solar radiation greatly improved the thermal performance of the building. On-site measurements show more homogeneous temperatures throughout the classroom, with mean radiant temperatures between 28.6 °C and 26.1 °C and mean operative temperatures between 27.3 °C and 26.1 °C (Figure 6b). As a result, there is a maximum thermal difference of 2.5 °C between mean radiant temperatures and 1.2 °C between mean operative temperatures in different areas of the classroom.
On-site measurements show that an interior solar control system of indoor venetian blinds retains solar radiation, but accumulates heat between the glass and the curtain, creating a hot air pocket in the area close to the façade. As a result, air temperatures exceed 37 °C in this area (Figure 7).
In accordance with this, measurements show that this system reduces mean radiant temperatures especially in the areas close to the glazing but does not greatly reduce mean operating temperatures throughout the classroom. The mean radiant temperatures were between 31.6 °C and 26.4 °C, and the mean operating temperatures were between 28.8 °C and 26.2 °C (Figure 8a). As a result, there is a maximum thermal difference of 5.2 °C between mean radiant temperatures and 2.6 °C between mean operative temperatures in different areas of the classroom. A statistical analysis for the validation of the energy model considered 432 on-site measurements of the mean temperatures inside the classroom, distributed over nine measuring points in the classroom. The actual on-site measurements were compared with the results of the computer simulations for the same measuring points in the classroom. The obtained Mean Bias Error (MBE) was 1.47. The Normalised Mean Bias Error (NMBE) was 4.87%. This value is less than the ±10% upper limit set by ASHRAE Guideline 14 [78] in hourly calibration criteria. The Root Mean Square Error (RMSE) was 3.24, and the Coefficient of Variant of Root Mean Square Error (CV(RMSE)) was 5.98%. This value is lower than the 30% upper limit set by ASHRAE Guide 14. These results allow the computer calculations to be validated.
In the colder months (December–February), the indoor mean dry-bulb temperature remained around 19 °C, and in the warmer months (June–September), around 27 °C according to the setpoint temperatures of the HVAC system defined in Table 5. The HVAC system kept dry-bulb temperature fluctuations small, around ±1 °C, during occupied hours (09:00–20:00). In the months of March–May and October–November, the outdoor and indoor dry-bulb temperatures were within the comfort range (21–26 °C) during occupied hours and hardly any air conditioning systems were activated.
Computer simulations show that the proposed outdoor solar control system allowed for reduced temperatures throughout the classroom, with mean radiant temperatures between 29.0 °C and 26.2 °C and mean operating temperatures between 27.5 °C and 26.1 °C (Figure 8b). As a result, there was a maximum thermal difference of 2.8 °C between mean radiant temperatures and 1.4 °C between daily operating temperatures in different areas of the classroom.
The results show that the elimination of solar shading using external louvres significantly worsens the thermal comfort of the building. The surveys showed an average thermal sensation between slightly warm (+1) and warm (+2) from June to the end of October (Figure 9a), with more than 60% of dissatisfied people in the hottest summer weeks (Figure 9b). The surveys show that the use of external vertical louvres keeps the average thermal sensation at adequate thermal comfort levels. Thermal sensation is considered slightly warm (+1) exclusively from the end of June to the end of September. In total, 20% of people were dissatisfied during part of the summer, and this occasionally exceeded 30% in the hottest weeks.
The surveys show that an indoor solar control system of venetian blinds kept the thermal sensation slightly warm (+1) from the beginning of June to mid-October. In total, 30% of people were dissatisfied most of the summer, and this exceeded 40% in the hottest weeks. Computer simulations show PMV and PPD values similar to the survey results, although they show larger oscillations because they calculated every hour of the day throughout the year. Therefore, the computer calculations are validly considered. The computer simulations show that the proposed external solar control system obtains very similar PMV and PPD values for the existing external vertical louvre system. The PMV values are between +0.5 (neutral) and +1.5 (slightly warm) all summer (Figure 9a), and the PPD values are less than 20% almost all summer (Figure 9b).
The surveys show that the removal of solar protection from the exterior louvers worsens thermal comfort, especially in areas close to sun-exposed glazing. In these areas, the thermal sensation was perceived as between hot (+2) and very hot (+3) and the percentage of dissatisfied people exceeded 68%. In the rest of the classroom, thermal sensation was mostly perceived as between neutral (0) and slightly warm (+1), with 4% of dissatisfied people (Figure 10a). With outdoor vertical louvers protecting from solar radiation, the thermal sensation was much more homogeneous throughout the classroom, and the degree of dissatisfaction was greatly reduced. Near the glazing, it was perceived as slightly warm (+1) to warm (+2) with 0% of dissatisfied people. In the rest of the classroom, it was perceived as neutral (0) by 91% of the users and slightly warm (+1) by 9% (Figure 10b).
Thermal sensation was also quite homogeneous but warmer in most of the classroom with an indoor solar control system of venetian blinds. Near the windows, it was perceived between slightly warm (+1) and warm (+2) with 16% of dissatisfied people. In the rest of the classroom, it was perceived as neutral (0) by 55% of the users and slightly warm (+1) by 45% (Figure 11a). Finally, the proposed system of external venetian blinds homogenised the thermal sensation throughout the classroom and cooled the thermal sensation. The PMV values were between +1.32 and +1.44 (slightly warm) near the glazing. In the rest of the classroom, the thermal sensation was between neutral and slightly warm, with PMV values between +0.90 and +1.26 (Figure 11b).

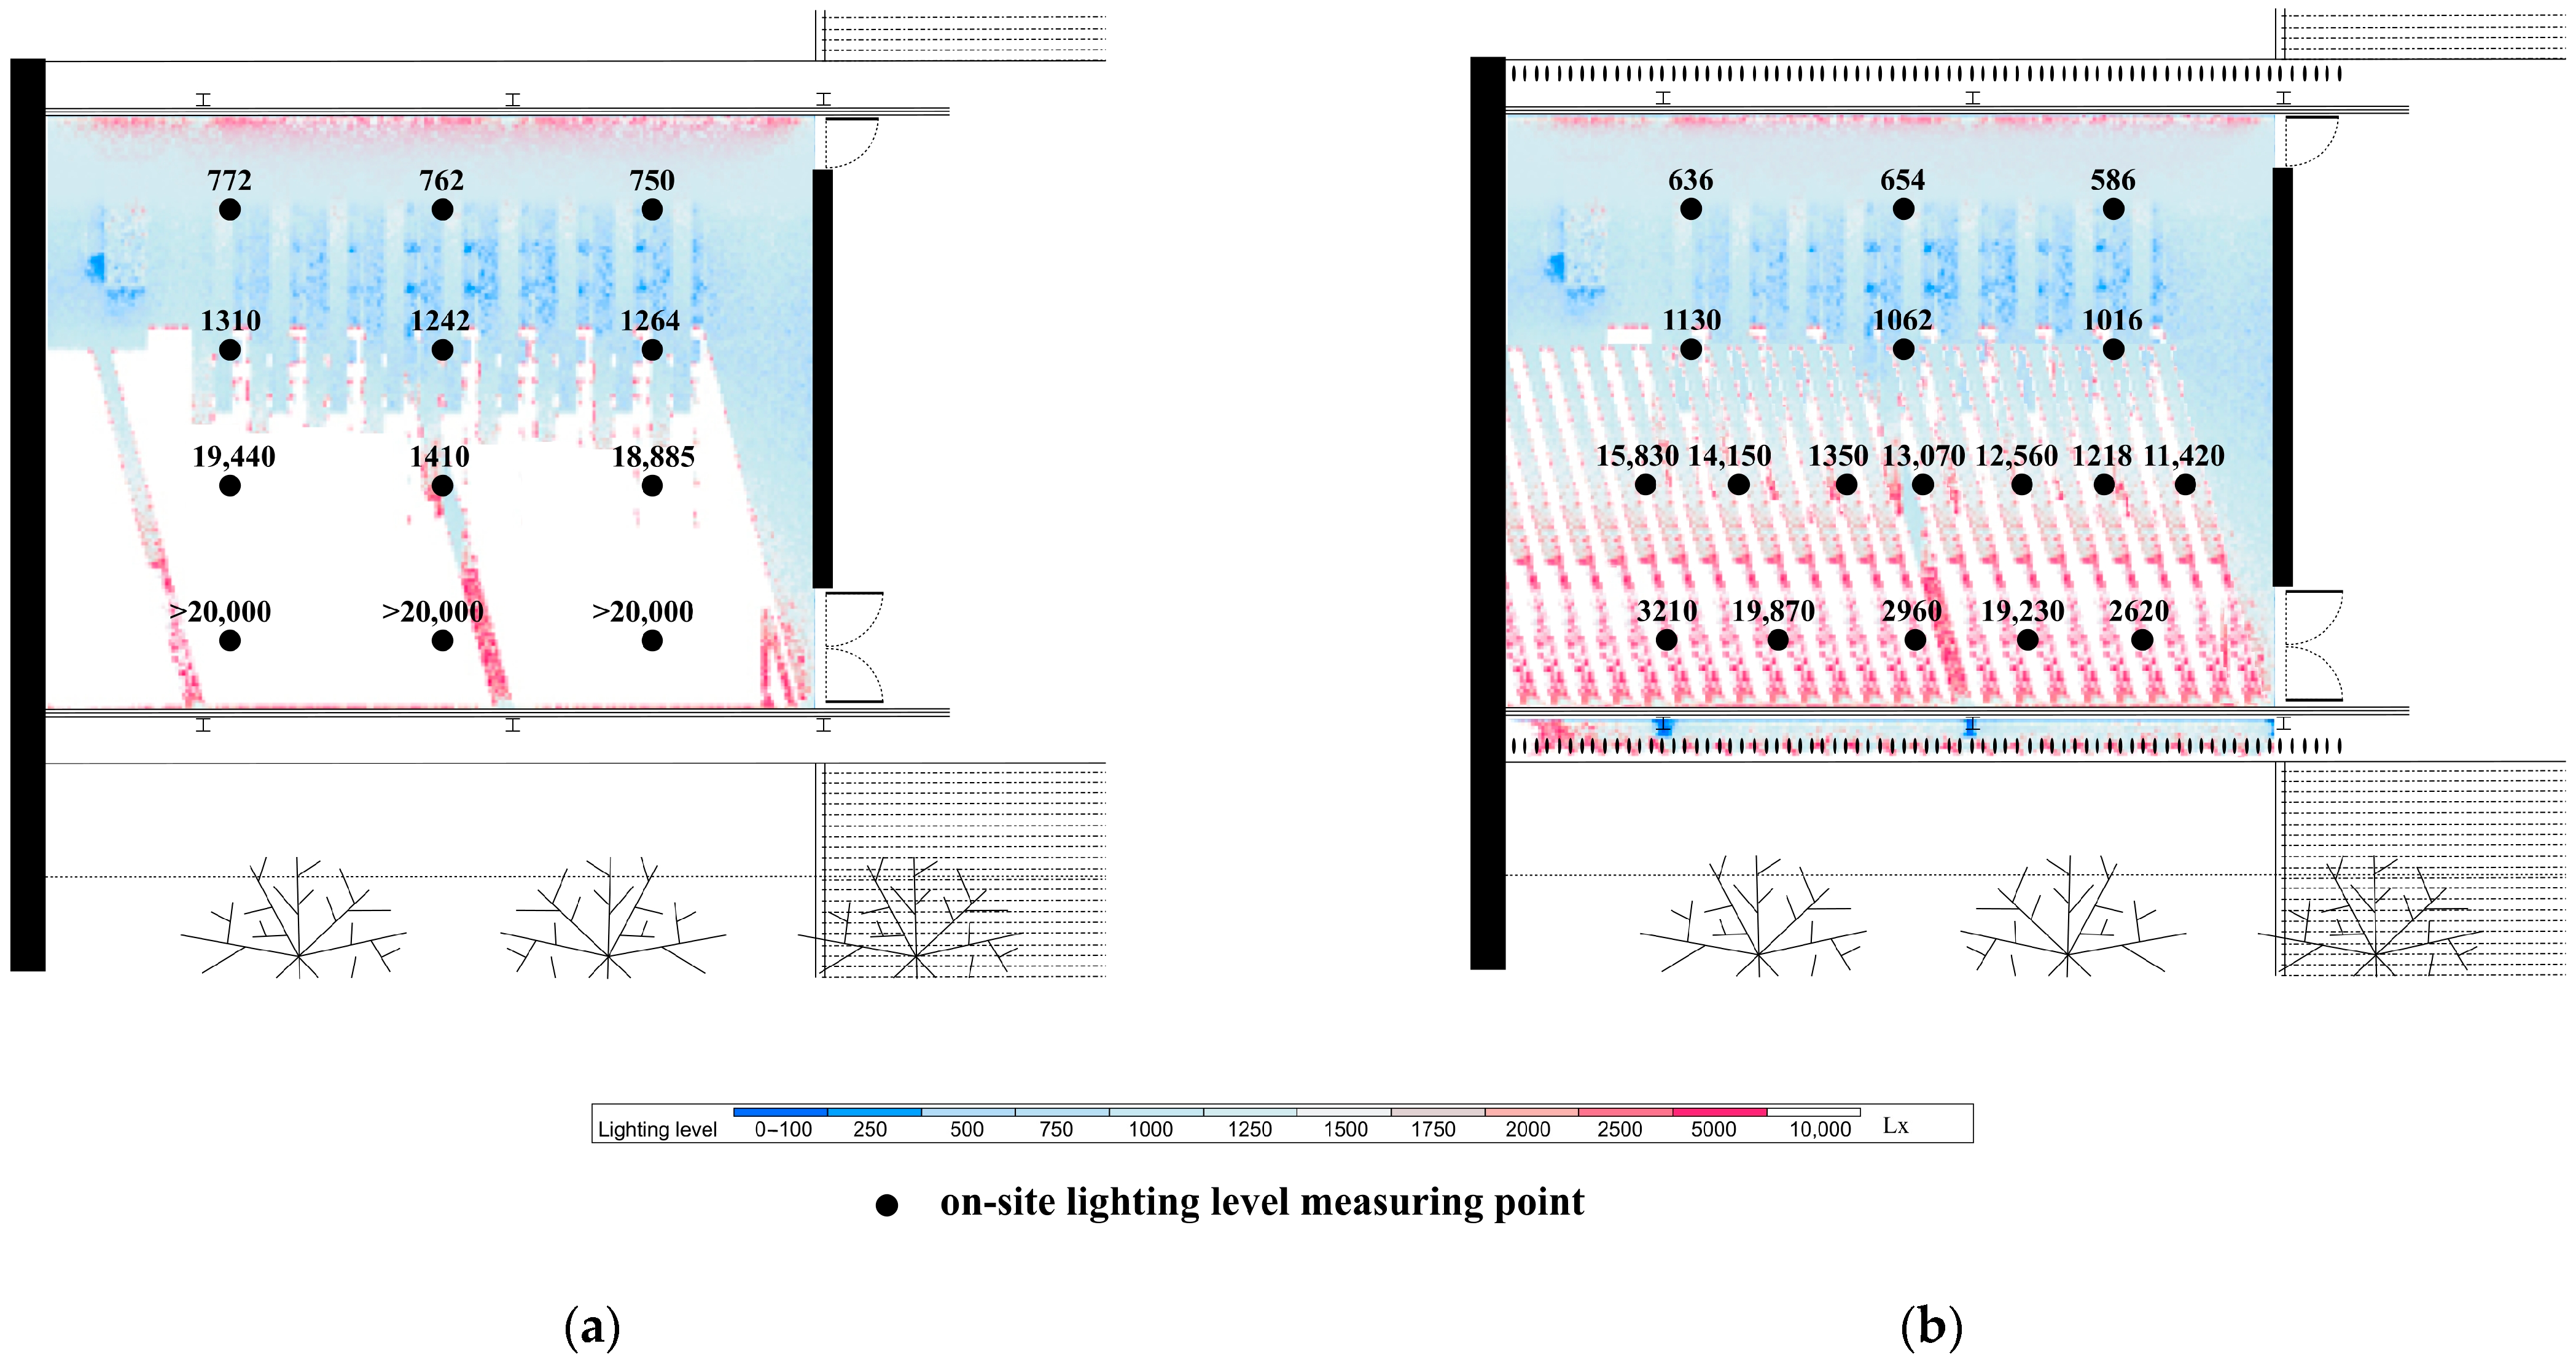
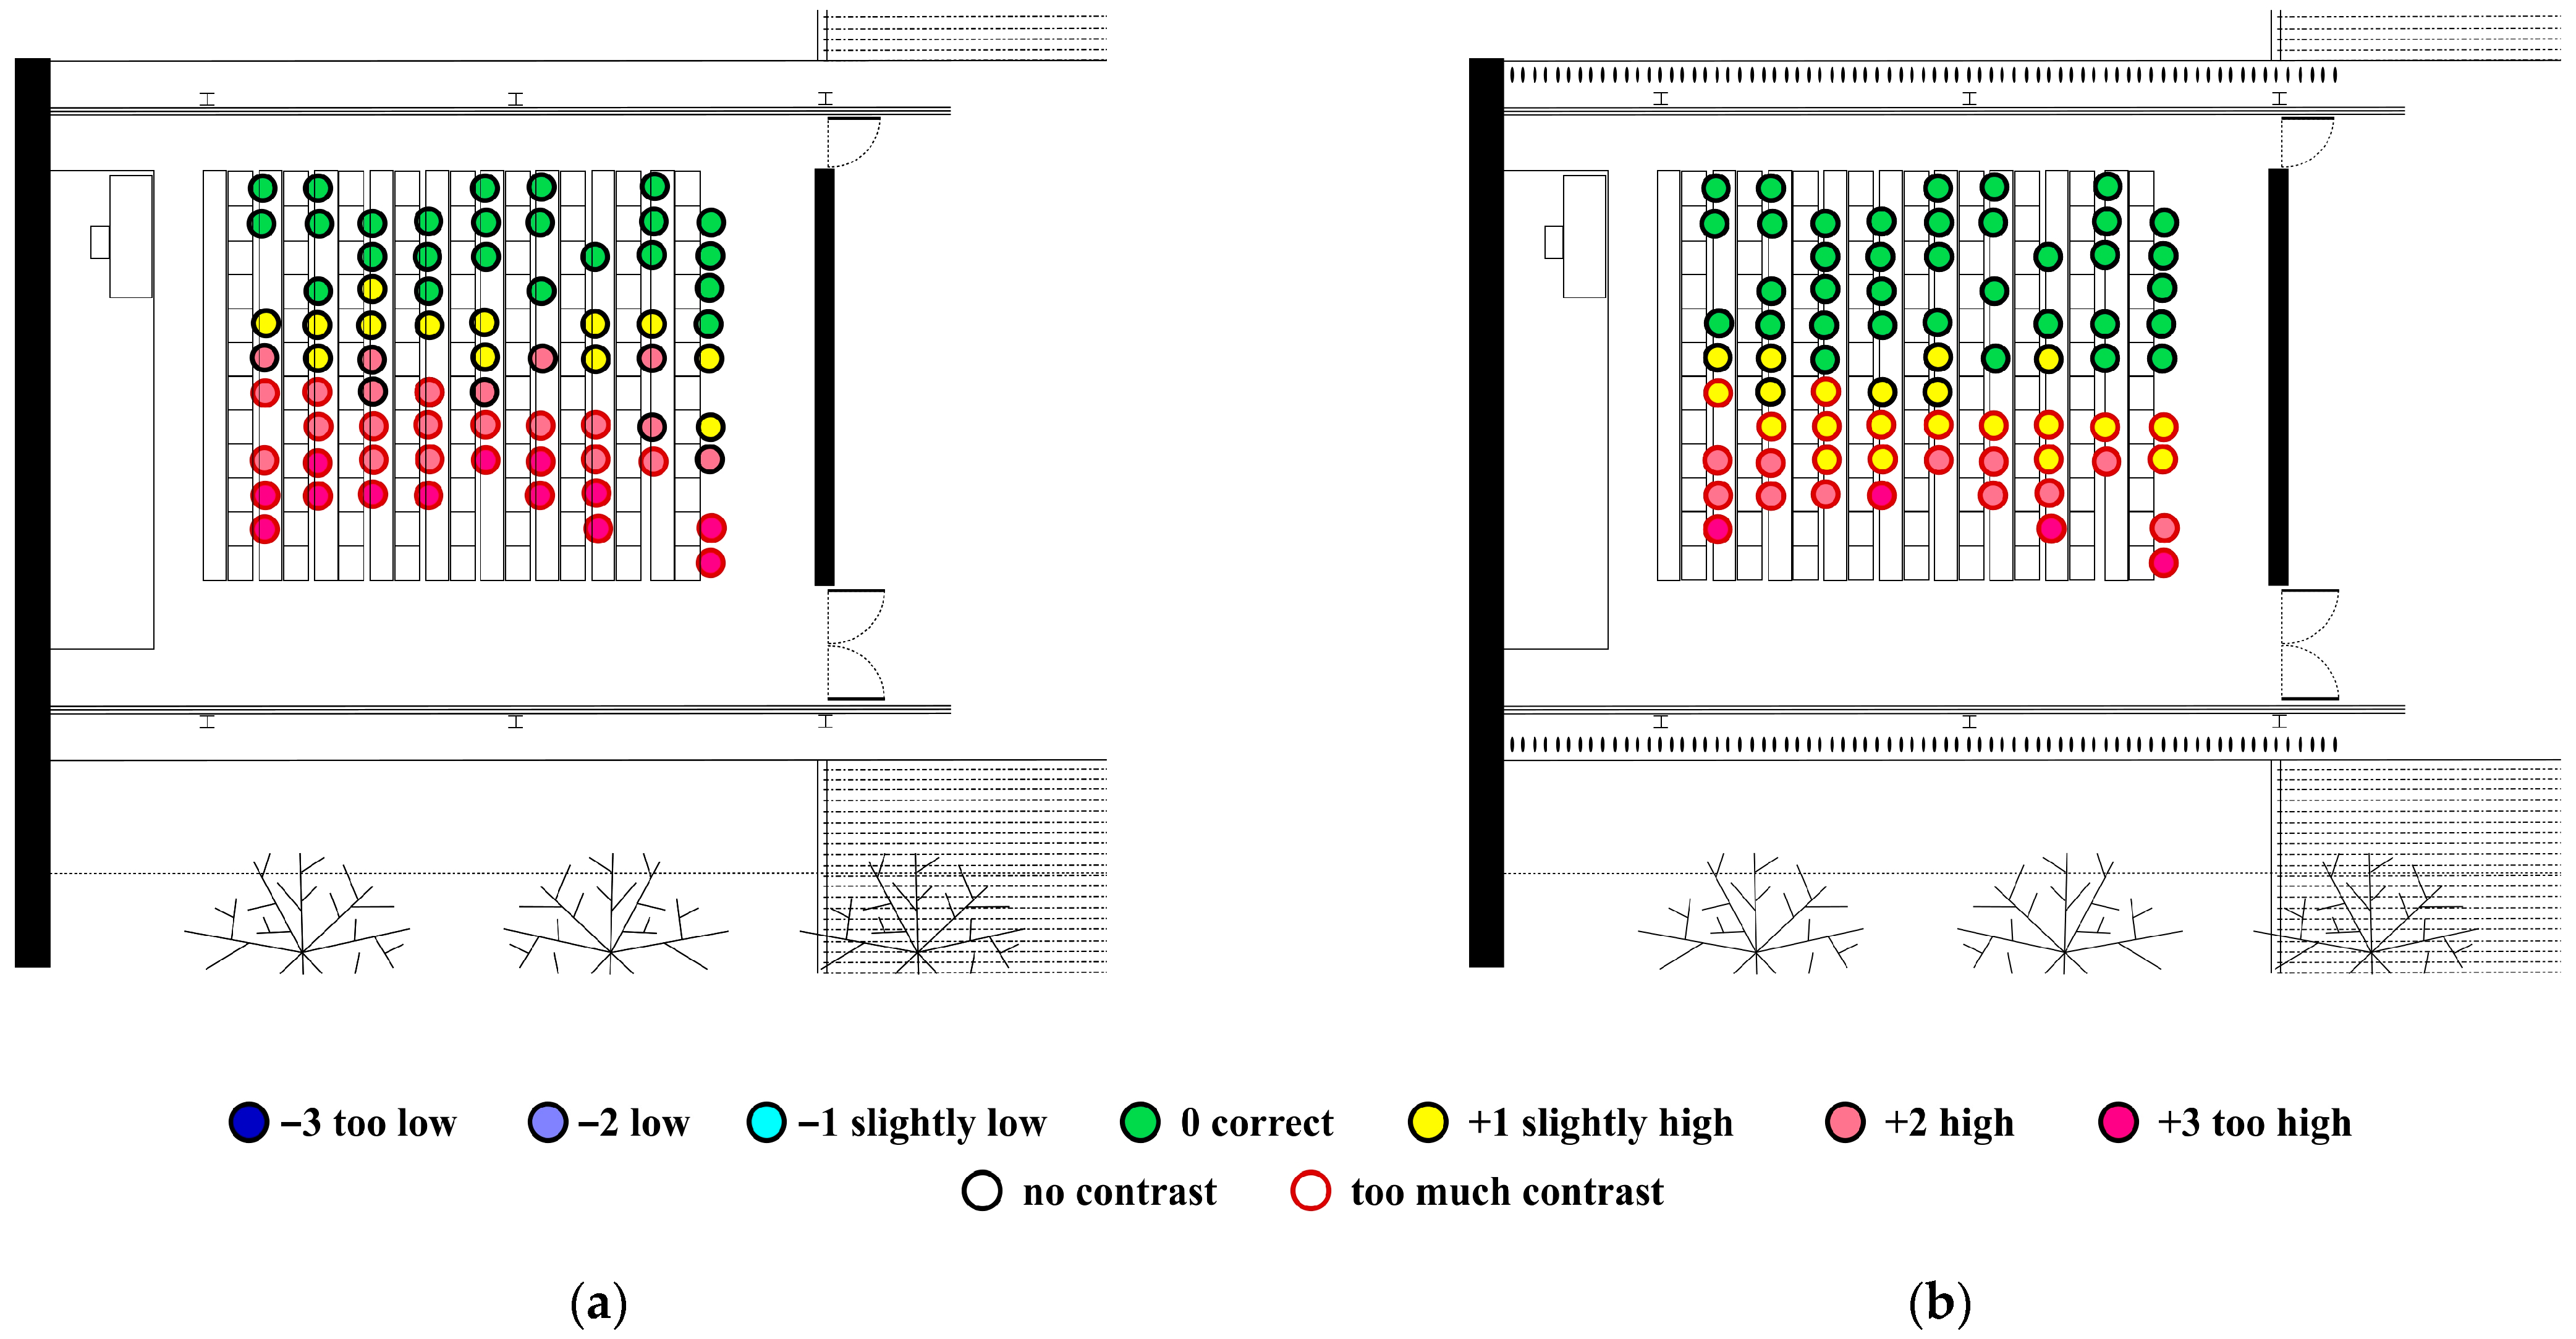
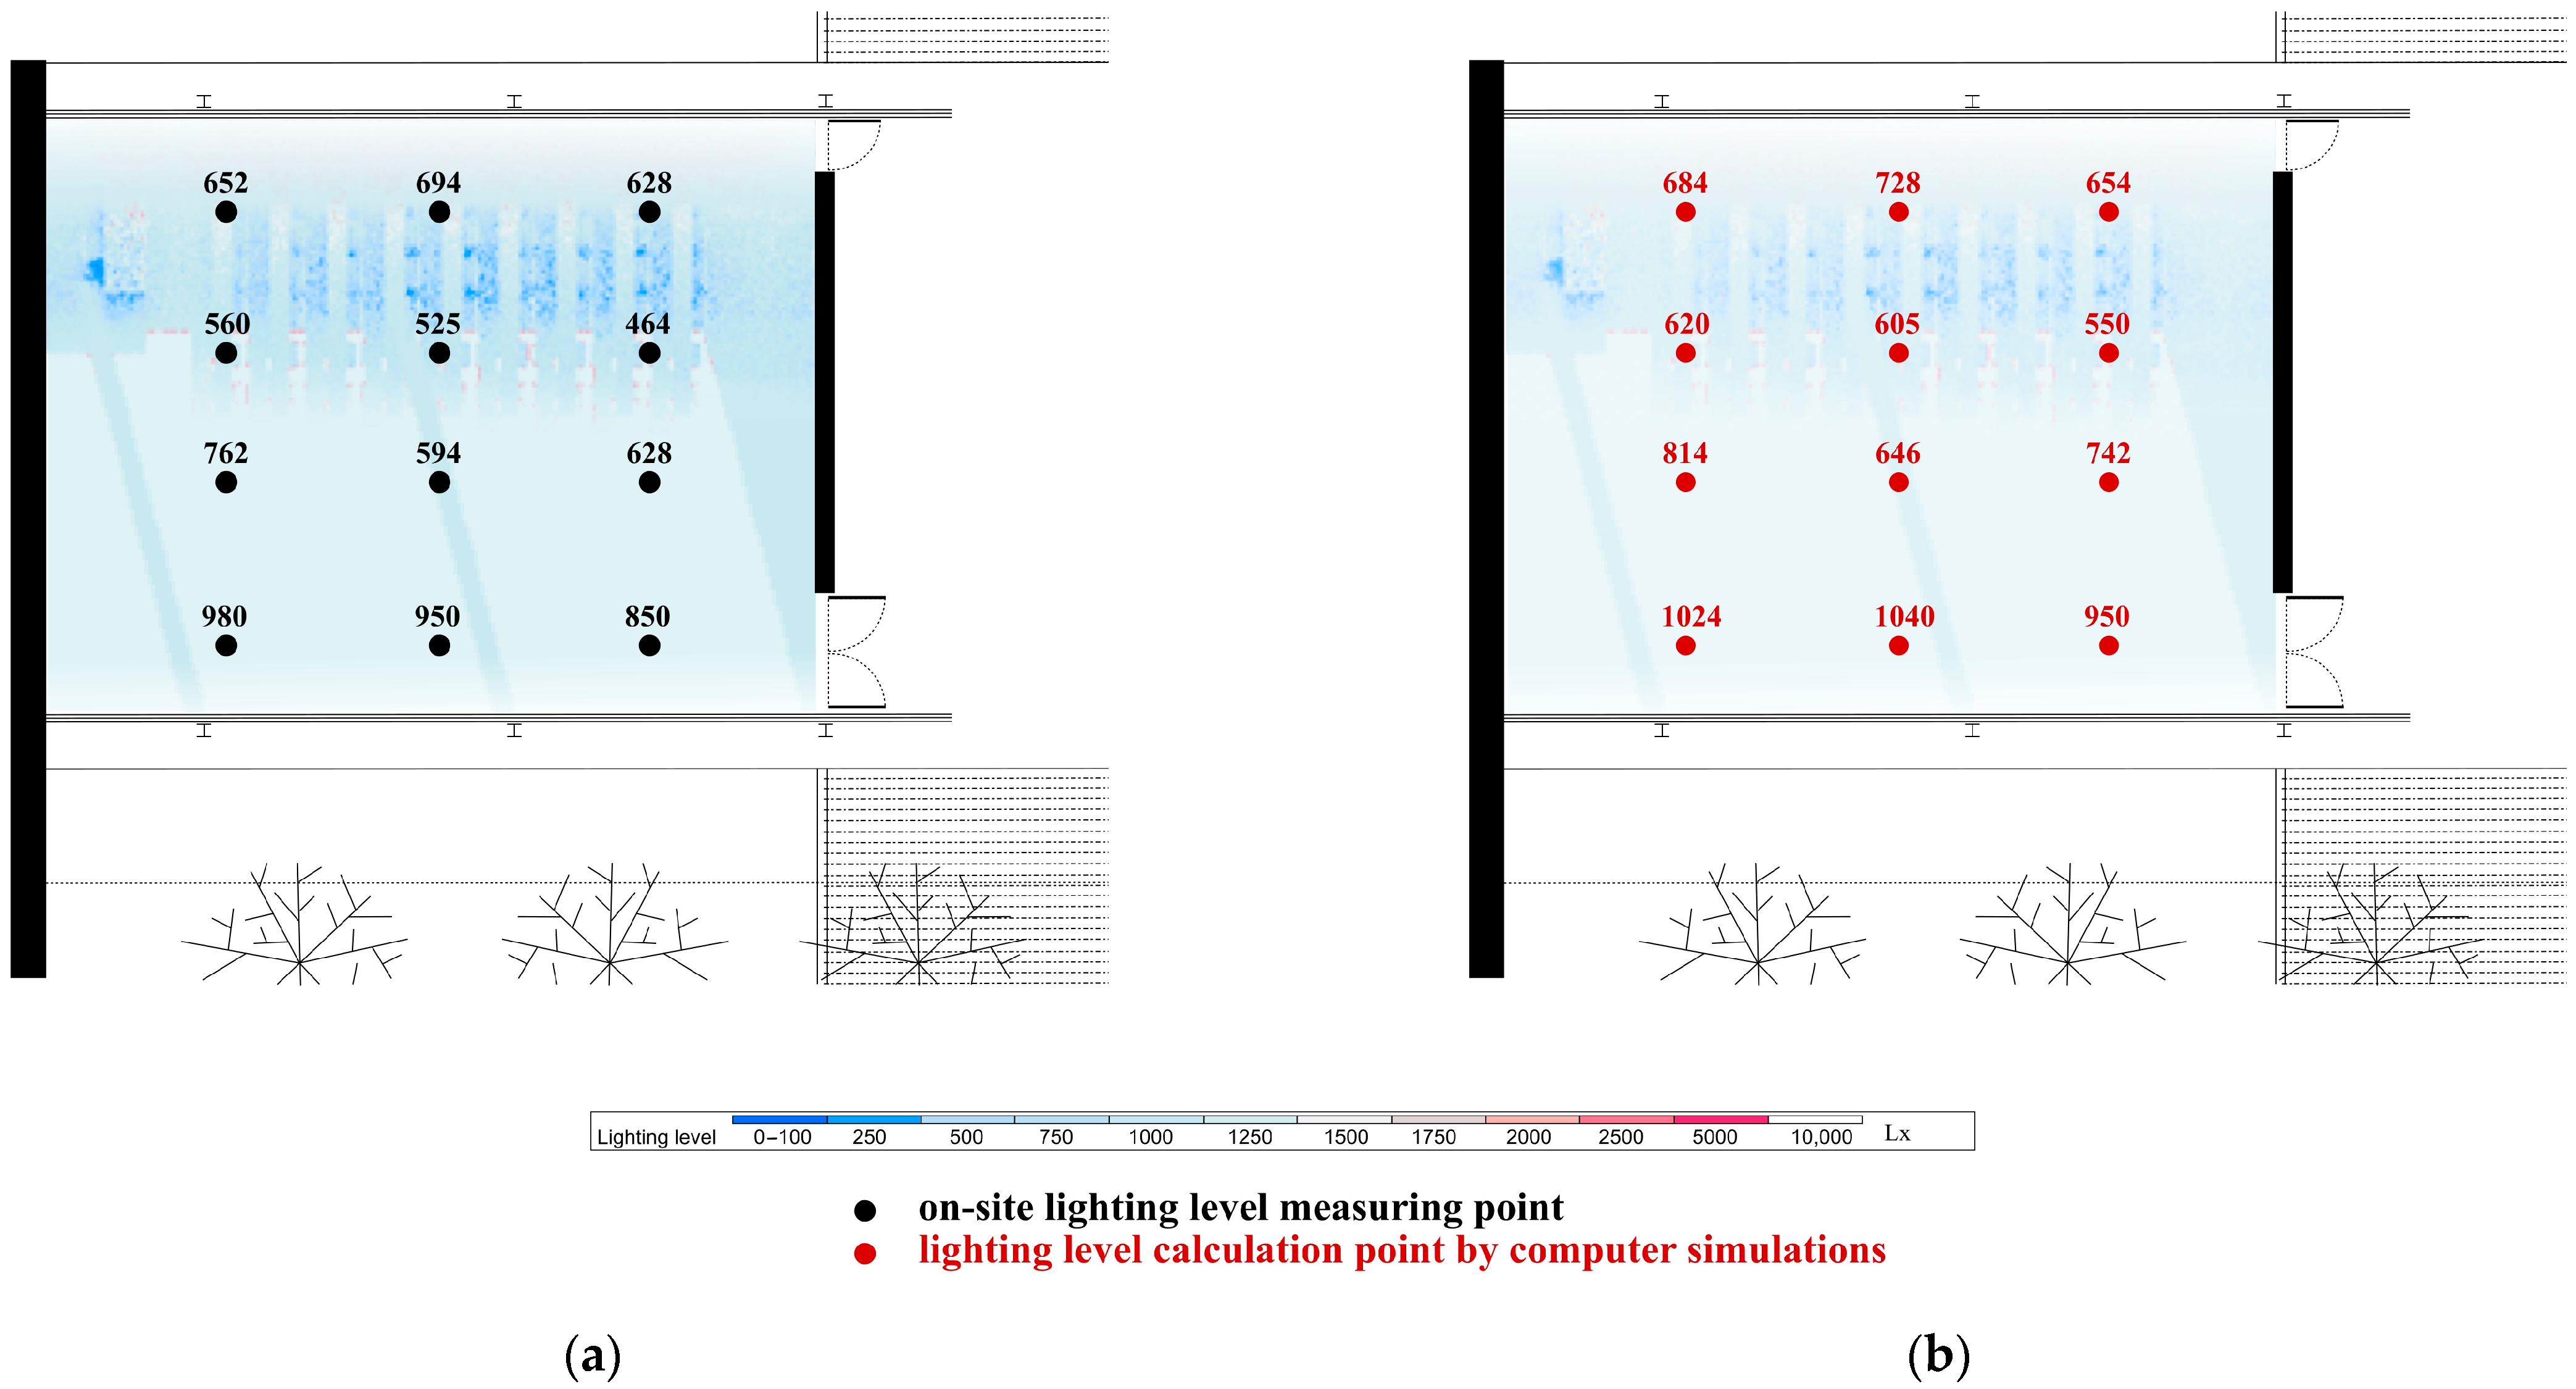
3.2. Lighting Comfort

On-site measurements show that the removal of the solar protection of the exterior louvers excessively increased illuminance in a large part of the classroom (Figure 12a). Illuminance values were close to 750 lux in one third of the classroom, exceeded 1200 lux in the central area and exceeded 10,000 lux in the half near the southeast façade (Figure 13a). Using exterior vertical louvers to protect from solar radiation by 50–75% reduced the average illuminance (Figure 12b). Illuminance values were around 650 lux in one third of the classroom and around 1000 lux in the central area. In the half near the southeast façade there were surfaces shaded by the louvers with values between 1200–3000 lux, and unshaded surfaces exceeding 10,000 lux (Figure 13b). This results in a large contrast in light intensity between the shaded and unshaded surfaces. A statistical analysis for the validation of the computer model considered 576 on-site measurements of the lighting level inside the classroom, distributed over 12 measuring points in the classroom. The actual on-site measurements were compared with the results of the computer simulations for the same measuring points in the classroom. The obtained Mean Bias Error (MBE) was 502.92. The Normalised Mean Bias Error (NMBE) was 5.70%. The Root Mean Square Error (RMSE) was 500,551.08, and the Coefficient of Variant of Root Mean Square Error (CV(RMSE)) was 8.02%. These results allow the computer calculations to be validated. The results show illuminance values of 500–1000 lux in the shaded half of the classroom, values around 2500 lux in the shaded areas and over 10,000 lux on the surfaces exposed to direct solar radiation.
The results show that removing the solar shading from the exterior louvers greatly worsened lighting comfort for building occupants. The surveys show that 51% of people were dissatisfied throughout the classroom, and 100% near the sunny glazing (Figure 14a). The surveys also show that the lighting discomfort was due to excessive illuminance in the classroom. Visual comfort was good because the visual field to the outside was high. Using external vertical louvers oriented to protect from solar radiation by 50–75% reduced the feeling of light intensity, but 54% of people were dissatisfied throughout the classroom, and 100% near the sunny glazing (Figure 14b). The surveys show that lighting discomfort was increased by the luminous contrast between shaded surfaces and other surfaces that received direct solar radiation penetrating between the louvers. Visual comfort was worsened by reducing the visual field from the outside. It was not considered to completely close the vertical louvers because the classroom would be illuminated only with artificial light. This caused the illuminance to decrease to 270–300 lux, and visual comfort was greatly worsened by eliminating the field of vision from the outside.
On-site measurements show that the indoor solar control system of venetian blinds achieved a more homogeneous illuminance throughout the classroom (Figure 15a), with illuminance values between 500 and 1000 lux (Figure 16a). Computer simulations results show that the proposed external venetian blind system would also allow a very homogeneous illuminance throughout the classroom (Figure 15b), with illuminance values between 550 and 1000 lux (Figure 16b).
The results show that an indoor solar control system of venetian blinds greatly improved the lighting comfort for building occupants. The surveys show that there were no dissatisfied people in the entire classroom (Figure 17a). However, these systems eliminate the visual field from the outside and greatly worsen visual comfort. The proposed outdoor venetian blind system would improve the occupants’ lighting comfort due to the homogeneity of illuminance throughout the classroom and would better maintain the exterior visual field and improve visual comfort (Figure 17b).

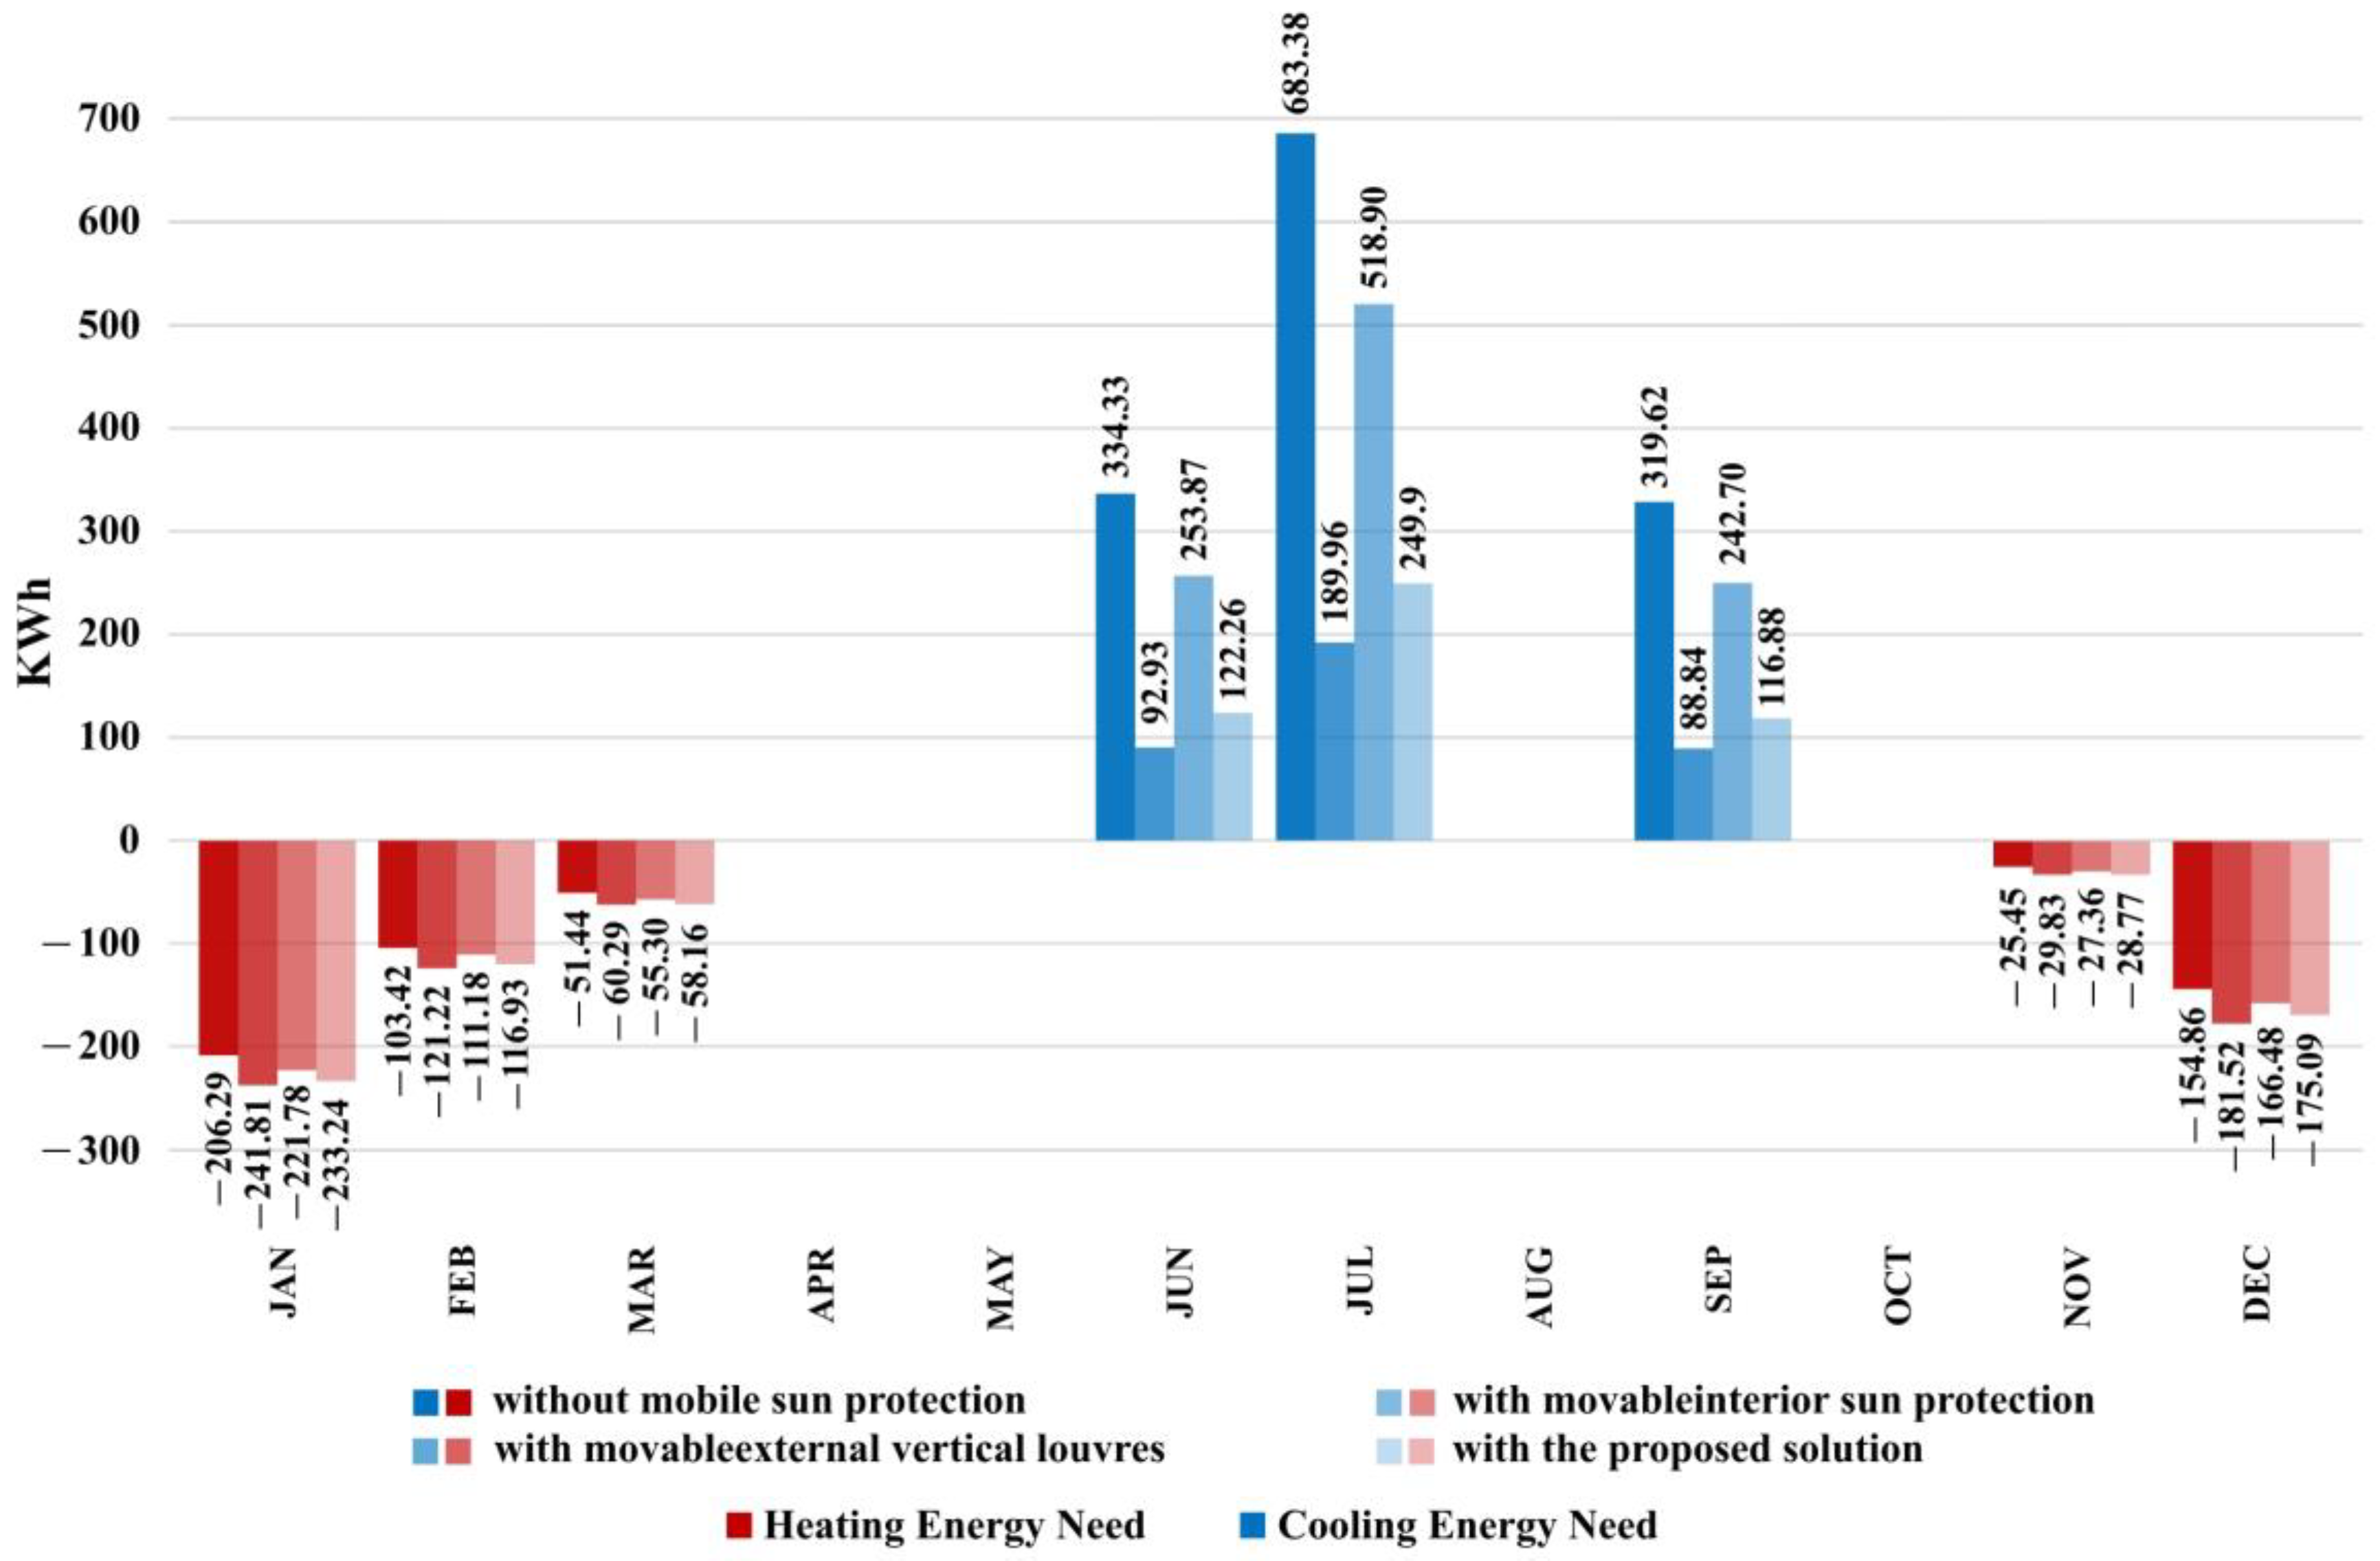
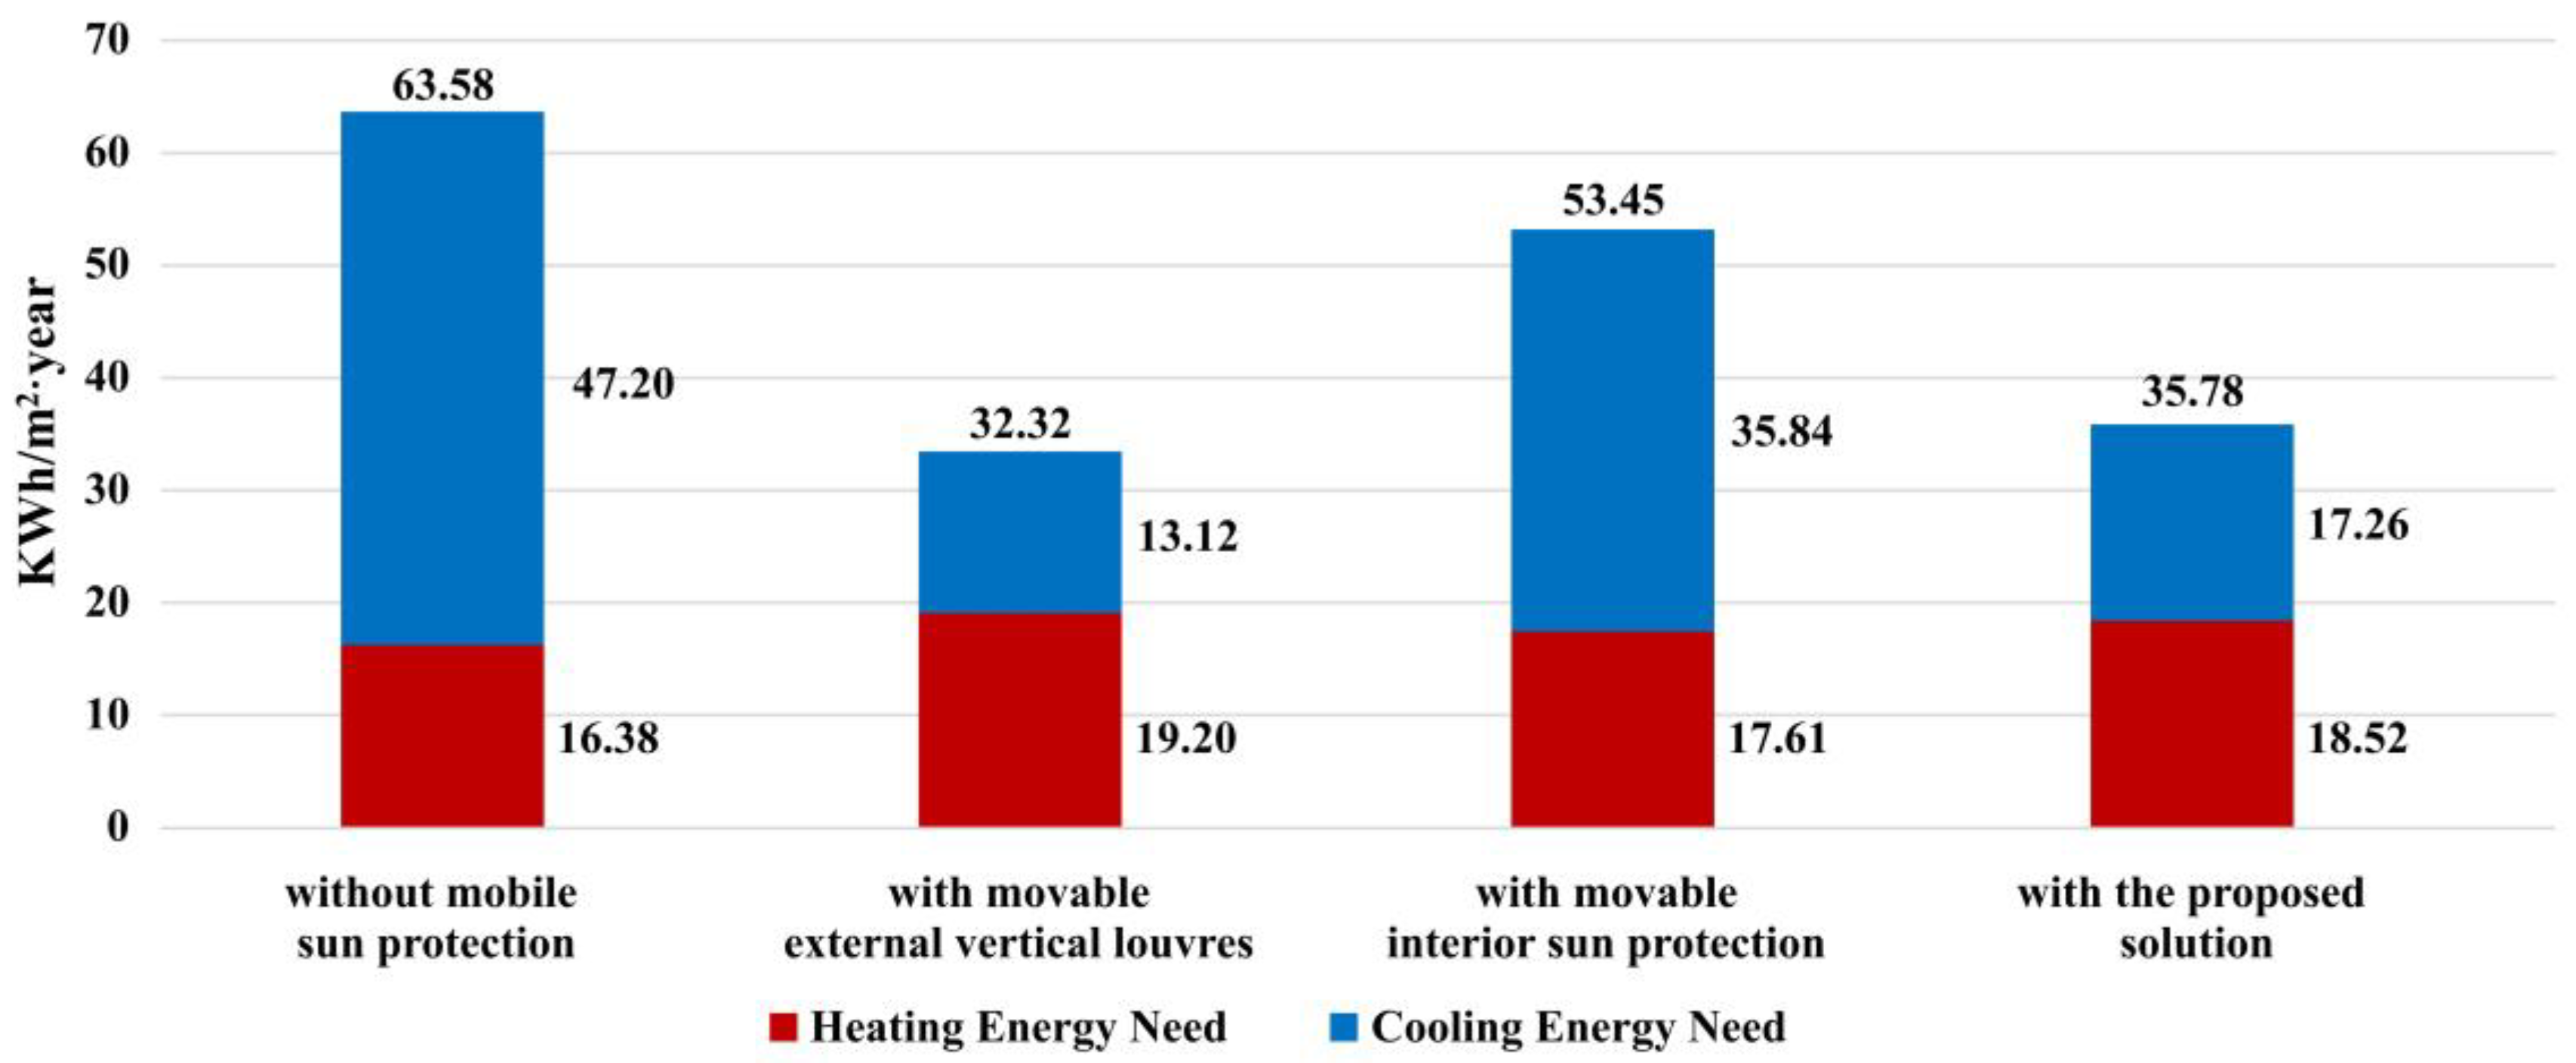
3.3. Energy Efficiency

Energy consumption records on summer days show that cooling needs are much higher if the building does not have solar protection through exterior louvers. Using exterior vertical louvers reduced summer cooling needs by 72.2%. Using an interior solar control system with adjustable louvers reduced cooling needs by only 24.1%. Finally, computer simulations showed that the proposed exterior solar control system achieves a 63.43% reduction in cooling needs. Heating needs in the winter are very similar in all cases because the solar control system are retracted as much as possible. The building is closed in August (Figure 18).
As a result, using exterior vertical louvers reduces annual energy needs by 49.20%, an interior solar control system with adjustable louvers reduces annual energy needs by only 15.9% and the proposed exterior solar control system achieves a 43.72% reduction in annual energy needs (Figure 19). The statistical analysis for the validation of the computer model considered 48 energy consumption records. The actual on-site measurements were compared with the results of the computer simulations for the same days. The Normalised Mean Bias Error (NMBE) was 6.10%, and the Coefficient of Variant of Root Mean Square Error (CV(RMSE)) was 9.15%. These values are lower than the upper limits set by ASHRAE Guide 14 [78]. These results allow the computer calculations to be validated.

4. Discussion

This section comparatively analyses the results of thermal comfort, lighting comfort and energy efficiency for the four studied solutions. Finally, the comparative analysis of the four solutions concludes the optimal solution considering the studied variables.
The HVAC system maintains the indoor dry-bulb temperatures within the comfort ranges and setpoint temperatures. The influence of solar radiation on the indoor dry-bulb temperature is automatically compensated by the HVAC system and leads to more energy consumption. But the HVAC system does not prevent thermal discomfort caused by increased indoor mean radiant temperatures and indoor mean operating temperatures. This allows for the analysis of how different sun shading devices influence thermal comfort and energy consumption.

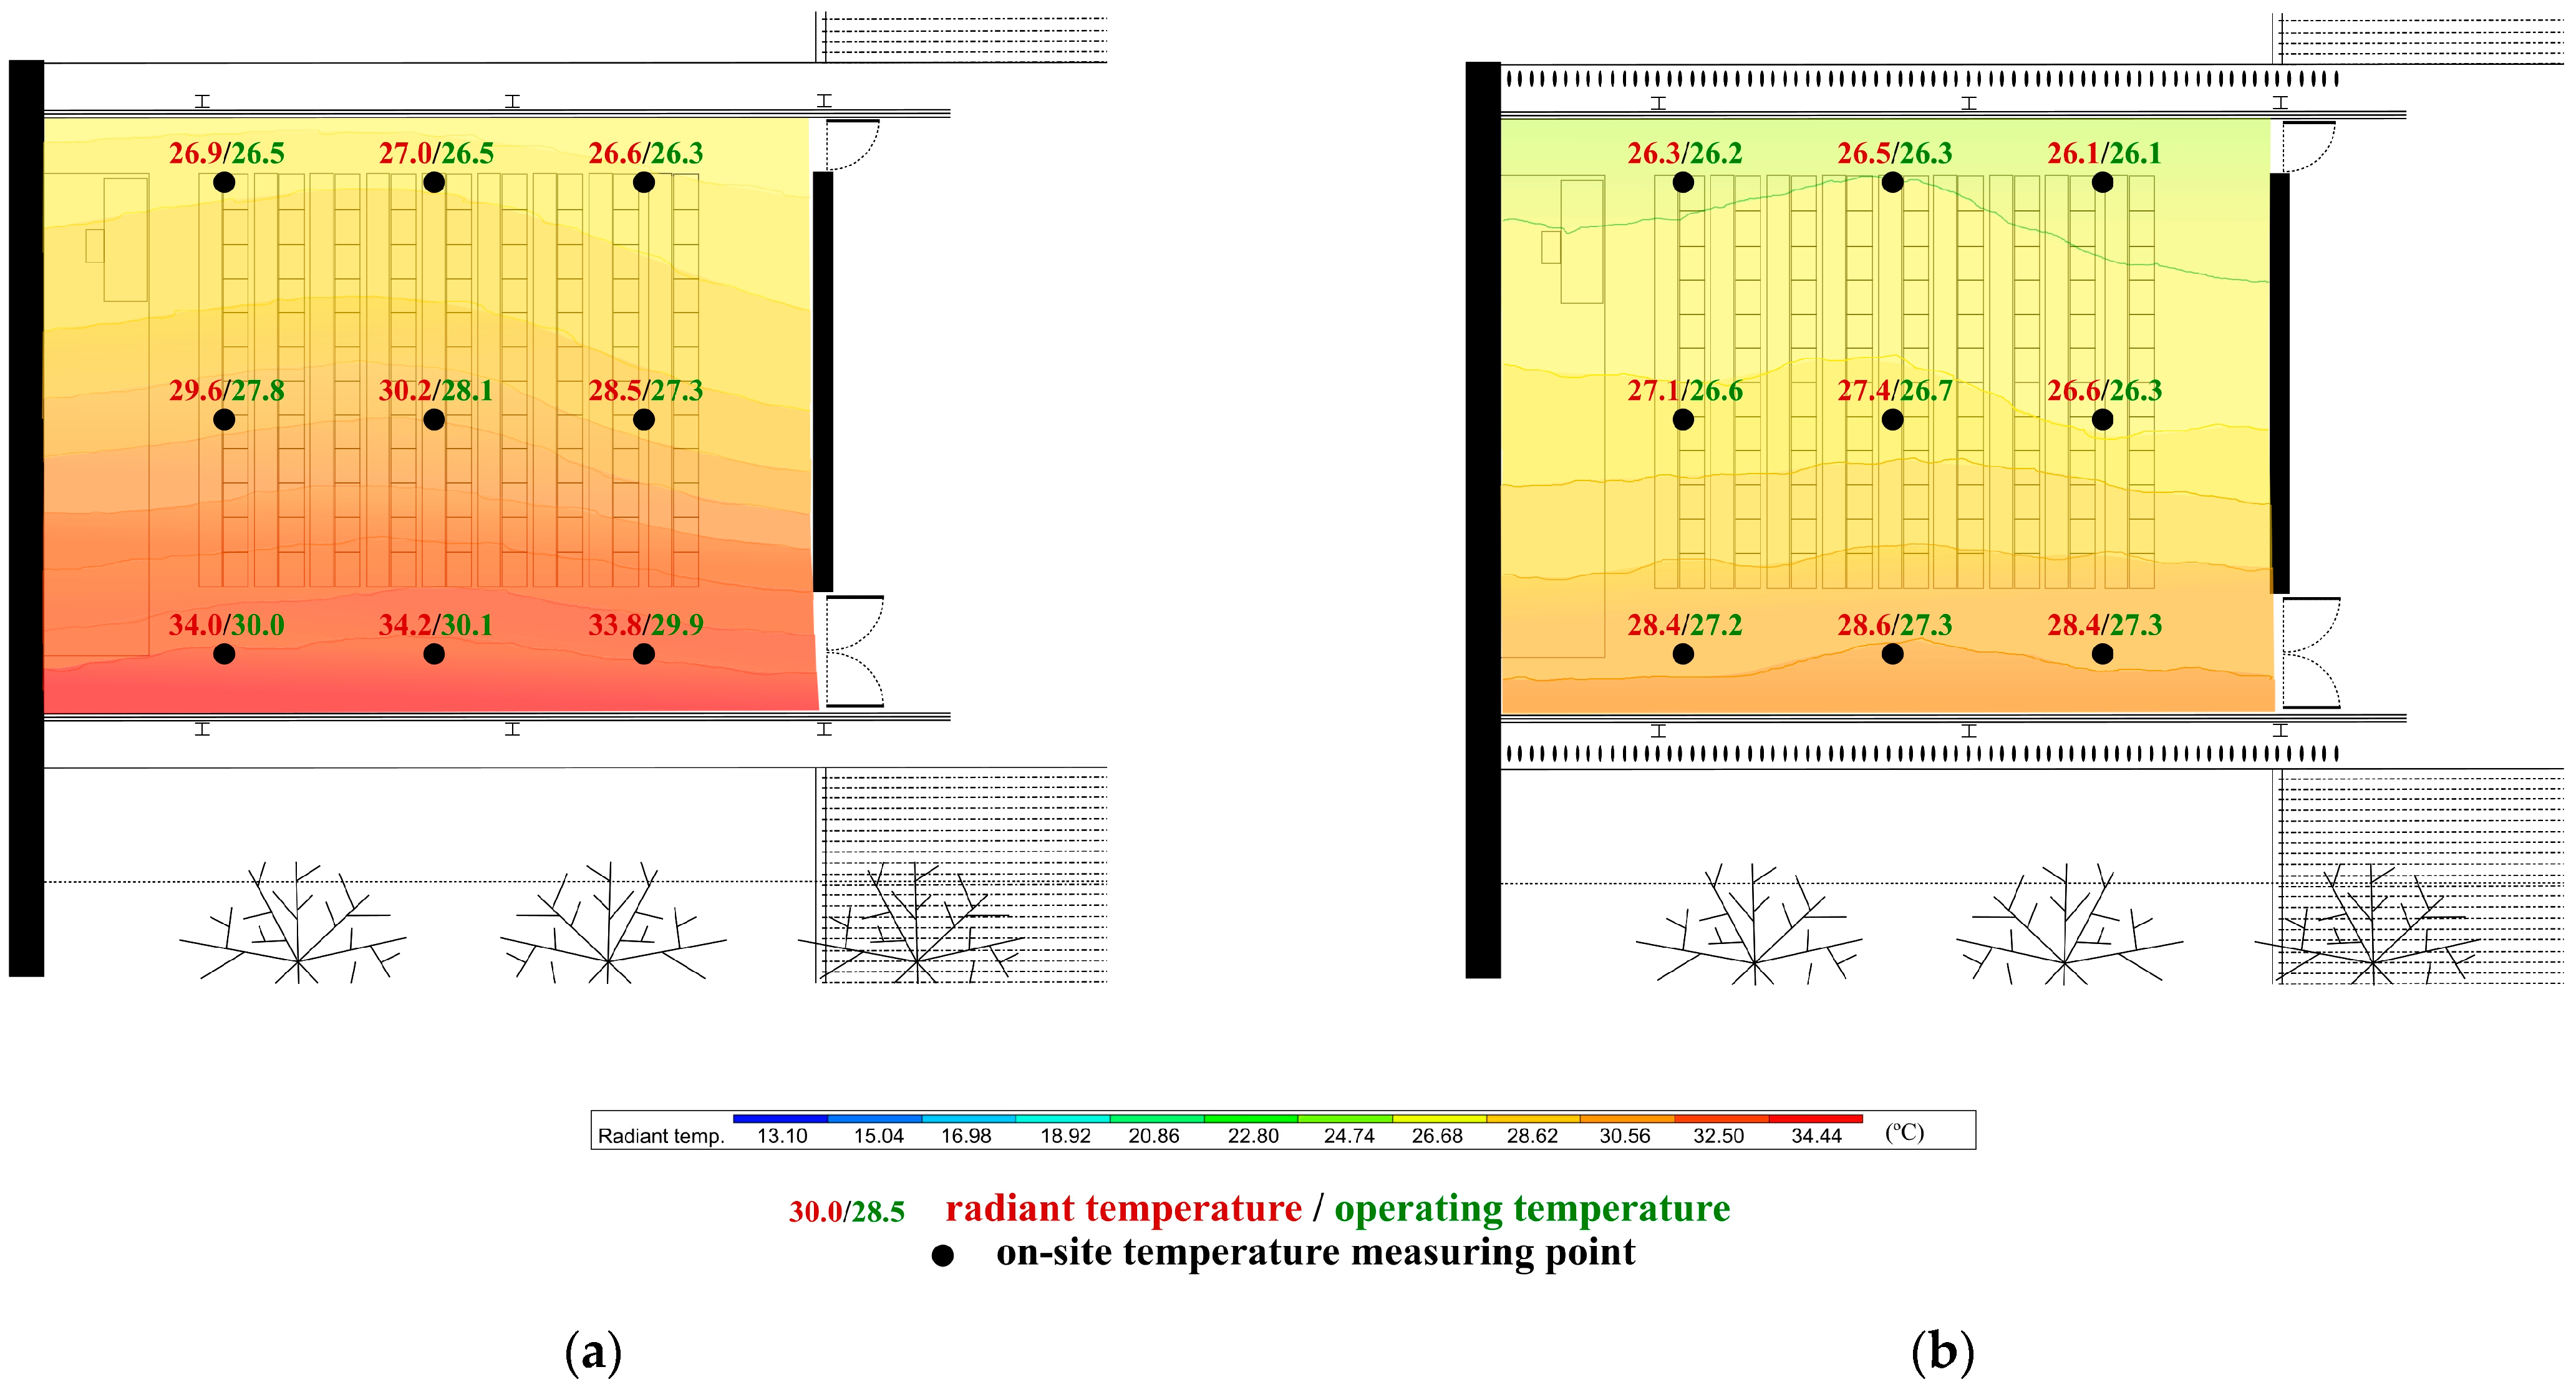
4.1. Building Study without Movable Sun Shading Devices

After analysing the results, it is clear that the building without movable sun shading devices had the worst thermal comfort and the highest cooling energy demand of the four cases studied, and the lighting comfort and visual comfort were regular. This is explained because solar radiation directly affects the glazing, increasing the temperatures of the building interior surfaces and mean radiant temperatures. As a result, the mean operating temperatures of the indoor environment were also increased. Consequently, thermal gains increase, as well as the hours of thermal discomfort due to heat excess, and the operating hours of air conditioning equipment also increase to reduce and maintain indoor temperatures in accordance with the regulations. This causes the percentage of unsatisfied people to be very high during a significant portion of the summer, exceeding 60%. On the other hand, high levels of direct solar radiation cause excessive illuminance, resulting in lighting discomfort for more than 50% of classroom users and for all users in the area that receives radiation. The visual field from the outside is at the maximum, but with glare.

4.2. Building Study with an Existing Movable Sun Shading Device of Vertical Exterior Louvers

Using exterior vertical louvers oriented to protect from solar radiation had the best thermal comfort and the lowest cooling energy needs of the four cases studied but had the worst lighting comfort and fair visual comfort. This is because the movable exterior louvers can stop a lot of solar radiation, reducing the mean radiant temperatures by more than 5 °C near the glazing and by an average of 3 °C throughout the classroom compared to the building without solar shading. As a result, the mean indoor operating temperatures were also reduced by almost 3 °C near the glazing and by an average of 1.5 °C throughout the classroom. This reduced thermal gains through the glazing, the hours of thermal discomfort due to heat excess, the operating hours of the air conditioning equipment and 72% of the cooling needs in the summer. In addition, indoor temperatures were homogenised within the appropriate thermal comfort levels in accordance with the standards throughout the classroom all year round. Consequently, the percentage of unsatisfied people was drastically reduced to below 20% for most of the summer. Regarding lighting comfort, this system made it possible to completely close the exterior louvers, but it eliminated natural lighting and the outside view, clearly damaging visual comfort for users. Therefore, under normal conditions, the exterior louvers were only partially closed to maintain visual comfort. This reduced the illuminance to adequate values in one part of the classroom but produced sunny and shaded bands on the indoor surfaces of the classroom, including the worktables. Sunny strips had clearly excessive illuminance values. In addition, this led to too high luminous intensity contrasts that greatly damaged lighting comfort. As a result, there was still lighting discomfort for more than 50% of classroom users and for all users in the area with sunny and shaded strips. Visual comfort was highly dependent on the opening degree of the louvers, which severely limited the inside–outside visual field.

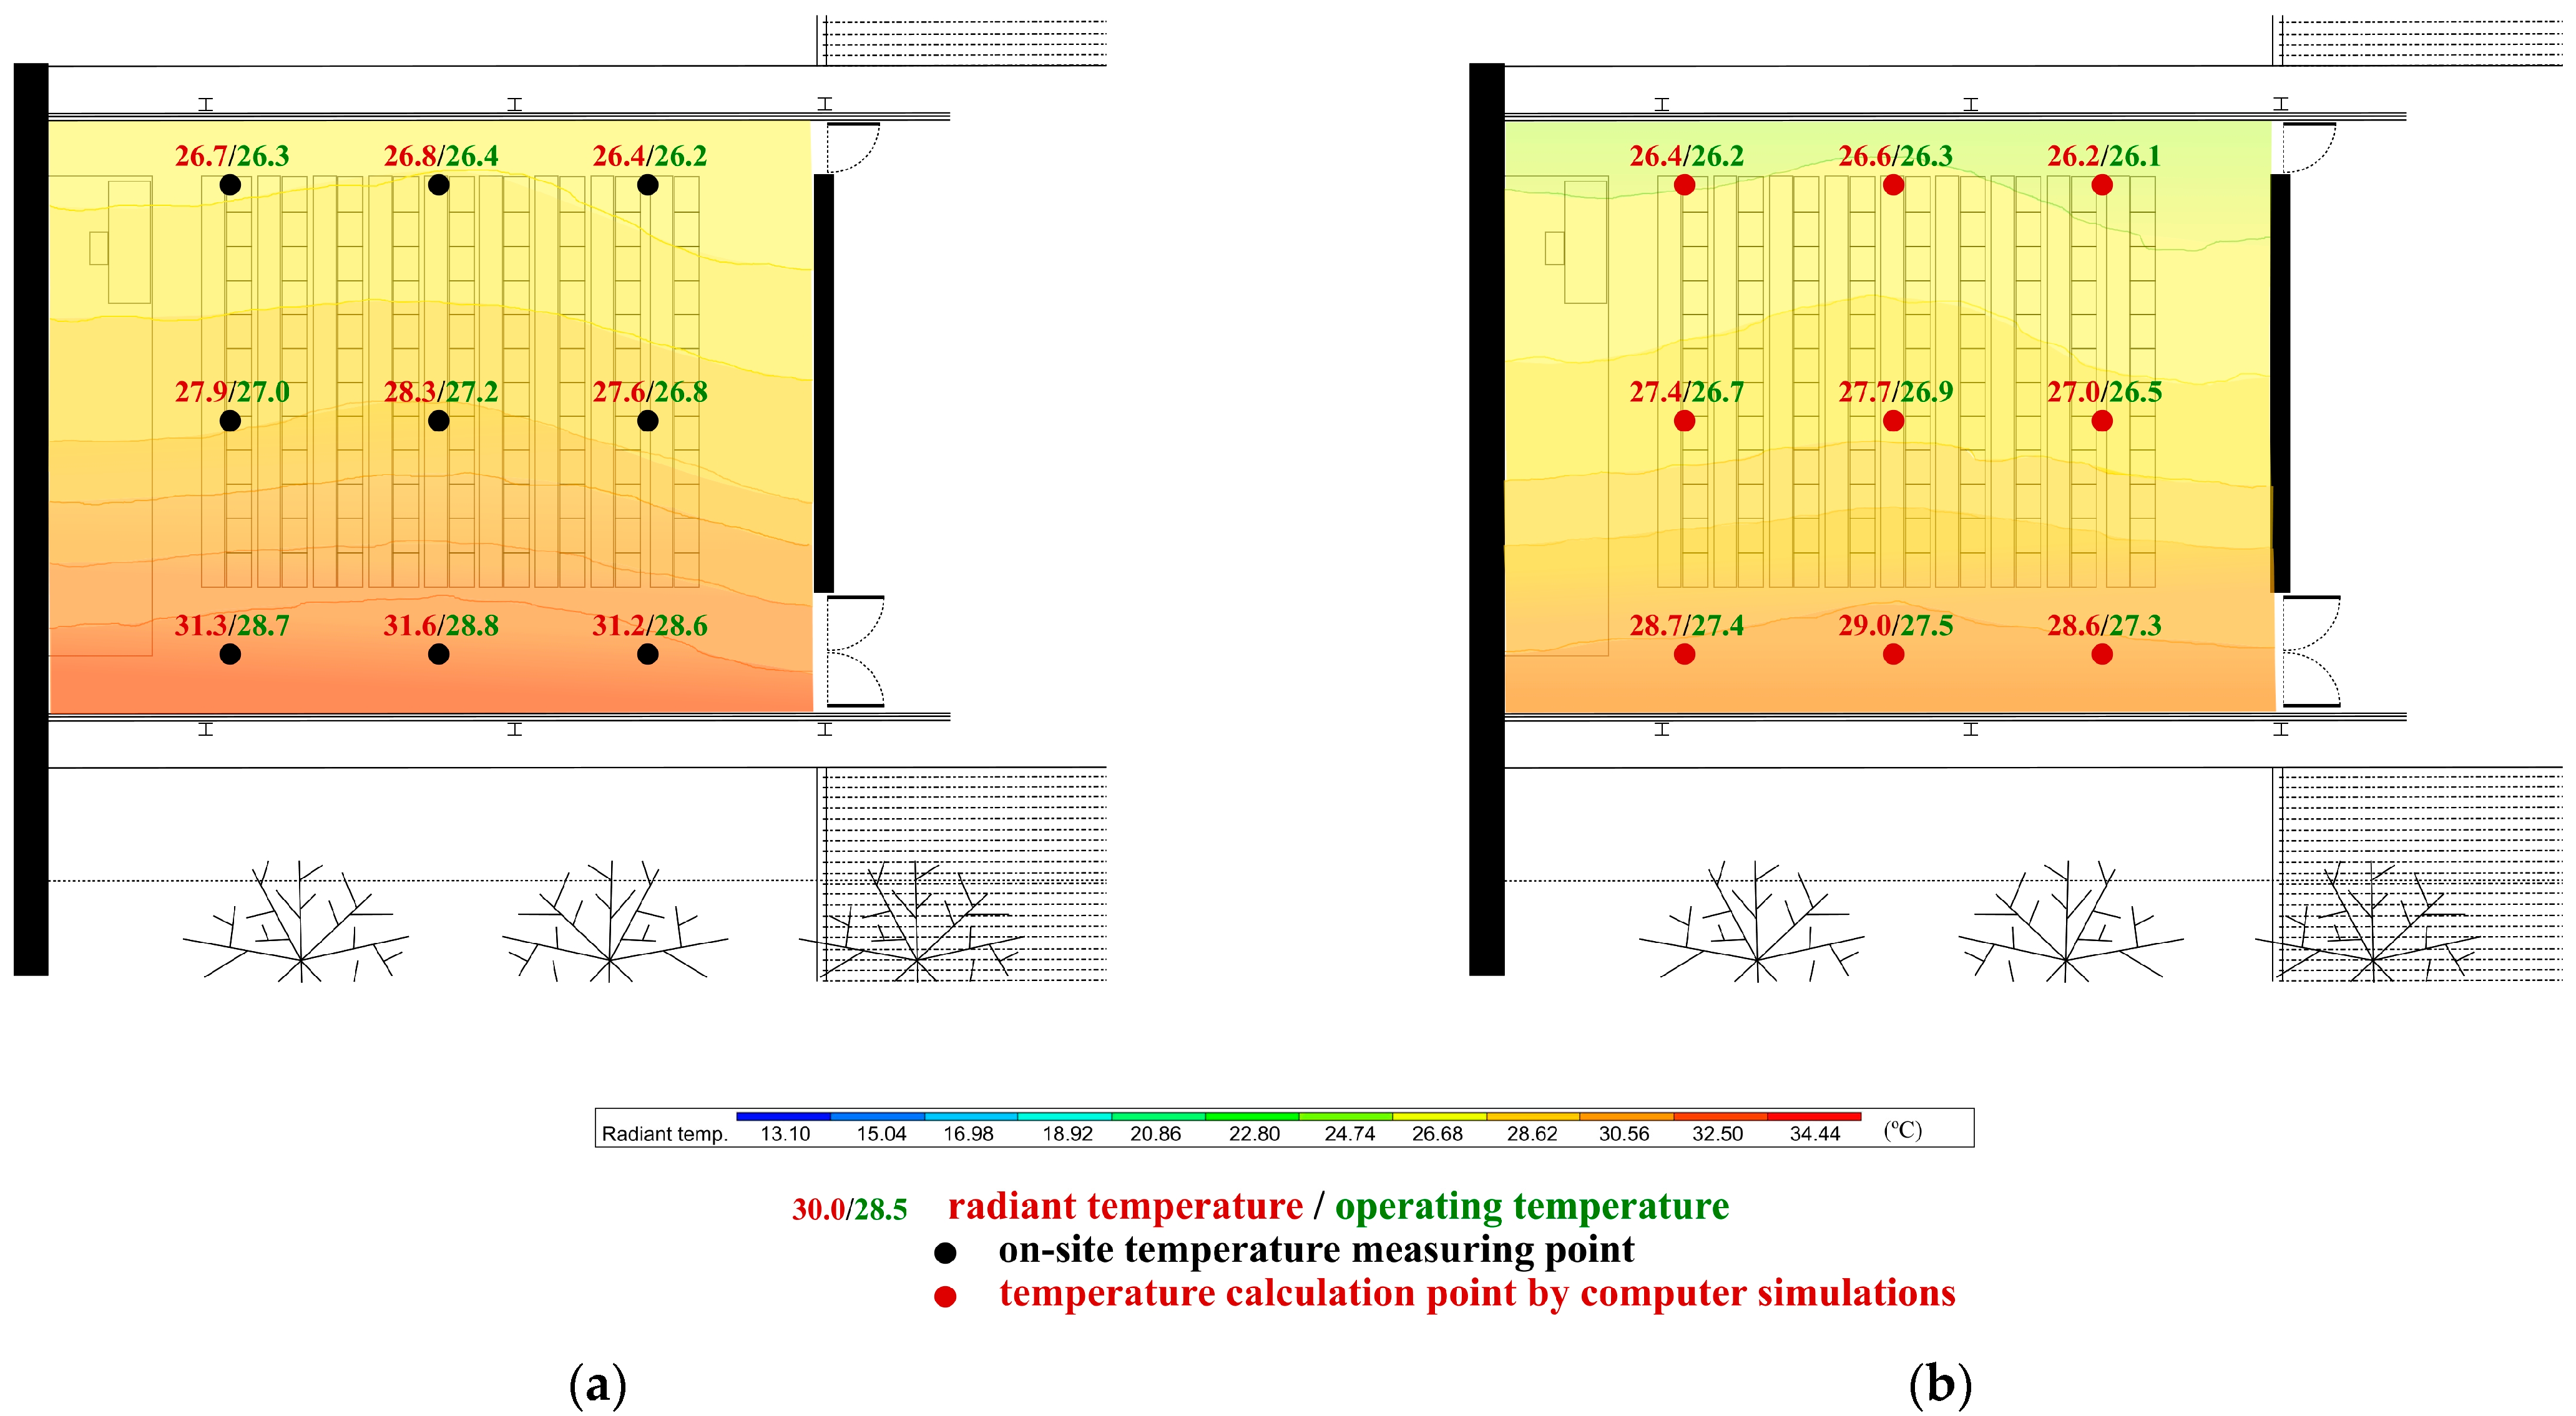
4.3. Building Study with an Existing Indoor Movable Sun Shading Device of Indoor Venetian Blinds

The use of an interior solar control system with adjustable louvers showed little improvement in the overall thermal comfort of the classroom and cooling energy needs, greatly improved lighting comfort and greatly impaired visual comfort by reducing the indoor–outdoor visual field. This is because indoor solar control systems do not prevent solar radiation from entering through the glazing. Indoor venetian blinds or curtains partially retain direct solar radiation toward the centre of the room, but the surface temperature of the glazing and venetian blinds rises sharply, emitting infrared radiation. This generates a greenhouse effect that greatly warms the air between the curtain and the glass. As a result, a hot air pocket is generated in the area near the façade and it is distributed to the rest of the room interior. Consequently, the mean radiant temperatures were reduced by almost 3 °C in the areas close to the glazing compared to the building without solar shading. This significantly improved thermal comfort for users near the glazing. However, it reduced the mean operating temperature of the entire building by less than 1 °C. As a result, cooling needs in the summer were reduced by only 24%. The percentage of unsatisfied people during the summer was also slightly reduced, exceeding 30% of unsatisfied people. Regarding lighting comfort, this system achieved a much more homogeneous illuminance throughout the classroom and with adequate illuminance values, greatly improving the lighting comfort of the occupants (100% of satisfied people). On the other hand, this system was very detrimental to visual comfort because it eliminated the outside view.

4.4. Study of the Building with an Outdoor Movable Sun Shading Device of Outdoor Venetian Blinds

The proposed exterior solar control system provided similar thermal comfort and energy efficiency to the existing outdoor vertical louvre system and achieved the best results in terms of lighting comfort while maintaining good visual comfort. This is explained because the proposed system reduces the solar radiation reaching the glazing from the outside. This reduces solar radiation that passes through the glazing and the temperature of the glazing, reducing the mean radiant temperatures inside the classroom by more than 5 °C in the areas close to the glazing compared to the building without solar shading. As a result, the indoor mean operating temperatures were reduced by almost 1.5 °C throughout the classroom. This reduced thermal discomfort hours due to heat, the operating hours of air conditioning equipment and 63% of cooling needs in the summer. More homogeneous indoor temperatures were achieved throughout the classroom, and within the thermal comfort ranges established by standards throughout the year. Consequently, the percentage of unsatisfied people was drastically reduced to below 20% for most of the summer, like in the current exterior louvre system. In addition, this system achieved a good lighting comfort for 100% of the users because it obtained a homogeneous illuminance throughout the classroom and with adequate illuminance values. This type of system reduces direct solar incidence on the glass, blurring the illuminated and shaded surfaces inside the classroom, and avoiding excessive light contrasts that may have impaired lighting comfort. Finally, this type of protection reduces visual impact from the outside while maintaining a correct degree of visual comfort.

4.5. Comparative Analysis

The comparative analysis between the four case studies shows large differences in thermal performance and daylight control depending on the selected sun shading device. Not using movable sun shading devices greatly impairs the thermal comfort, lighting comfort and energy efficiency of the building. Using exterior solar control systems with rotating louvers greatly improves thermal comfort and energy efficiency but worsens lighting comfort by causing large light contrasts. Indoor movable sun control devices improve lighting comfort but do little to improve thermal comfort and energy efficiency. And the proposed exterior movable sun shading system of exterior venetian blinds achieved good results in terms of thermal comfort, energy efficiency and lighting comfort. This type of system improves the thermal performance of the building by reducing direct radiation on the exterior of the façade and contributes to interior lighting comfort because it diffuses natural light without affecting visual comfort. This makes it the optimal system to improve the three analysed aspects (Table 6).
However, current Spanish energy efficiency and thermal comfort standards and official calculation software do not sufficiently specify the characteristics of the sun shading devices used in the building. Consequently, they do not consider their influence on the lighting and visual comfort of buildings. This causes the energy efficiency calculations of buildings to consider parameters for reducing the incidence of solar radiation that do not correspond to the solar protection systems currently used in the building. Furthermore, it does not consider how the lack of lighting and visual comfort makes users manipulate the solar control systems, significantly changing the parameters considered in the energy calculations of the building. This leads to a lack of accuracy and consistency between the energy calculations and current thermal behaviours of the buildings, which invalidates design criteria and energy certifications.
On the other hand, it should be noted that solar shading devices have a strong influence on the aesthetics of the external building envelope. Consequently, the use of different types of solar protections is highly conditioned to the architectural design, and usually, the optimal sun shading devices for the energy efficiency of a building are not used. In addition, current standards do not sufficiently consider how these devices affect users’ thermal and lighting comfort. Therefore, it is very important to better understand the influence of each device and to promote research and development of new construction solutions that are better adapted to different architectural designs.
This study has some limitations. It would be useful to complete the research with other outdoor and indoor solar control systems, in different architectural typologies, different orientations and with different types of glass in order to analyse in more detail how they affect the thermal and lighting comforts. This study was used as the basis for further research currently in progress. This new work increases the number of on-site measurements and the resolutions of calculations with computer simulations to more accurately analyse new construction solutions for outdoor movable sun shading devices.

5. Conclusions

(1) This work demonstrates that outdoor movable sun shading devices (louvres, venetian blinds, canopies, etc.) can reduce summer cooling needs by more than 60% in climates with high annual insolation, such as the BShs. However, indoor solar control systems such as indoor venetian blinds or curtains hardly reduce cooling needs.
(2) Outdoor movable sun shading devices were shown to significantly improve indoor thermal comfort. These systems reduced the mean operating temperatures in the classroom, especially near the glazing. They also homogenised temperatures throughout the classroom by reducing thermal differences between zones. This greatly improved the indoor thermal comfort by reducing the number of unsatisfied people. However, indoor solar shading devices improved the thermal comfort of people close to the glazing, but hardly improved the overall thermal comfort in the rest of the classroom. These systems reduced the mean operating temperature and the percentage of dissatisfied people only slightly.
(3) Using movable sun shading devices also had a major impact on lighting and visual comfort inside buildings. The absence of solar control greatly impaired lighting comfort due to excessive illuminance. Outdoor louvres caused lighting discomfort due to the high light contrast between shaded surfaces and illuminated surfaces. Indoor venetian blinds and curtains greatly reduce the exterior visual field. Outdoor movable sun shading devices composed of venetian blinds or canopies can achieve adequate and homogeneous illuminance values throughout a classroom.
(4) This work demonstrates the suitability of using outdoor movable sun shading systems that diffuse light to control the intensity of natural light inside a building. External adjustable louvres or similar devices achieve good results in terms of thermal comfort, energy efficiency and lighting comfort.
(5) Current Spanish energy efficiency and thermal comfort standards and official calculation software do not sufficiently specify the characteristics of the sun shading devices used in the building. They also do not consider their influence on lighting and visual comfort, which causes occupants to manipulate these devices. Consequently, energy calculations differ greatly from the current thermal performance of the building in sunny climates. The results of this study demonstrate the need to modify and complete current energy efficiency standards to ensure adequate lighting comfort in buildings.

Author Contributions

Conceptualisation, C.P.-C. and Á.B.G.-A.; methodology, C.P.-C., Á.B.G.-A. and A.G.-G.; software, C.P.-C. and N.C.; validation, C.P.-C., Á.B.G.-A., N.C. and A.G.-G.; formal analysis, C.P.-C. and Á.B.G.-A.; investigation, C.P.-C., Á.B.G.-A., N.C. and A.G.-G.; resources, C.P.-C.; data curation, C.P.-C. and Á.B.G.-A.; writing—original draft preparation, C.P.-C., Á.B.G.-A. and A.G.-G.; writing—review and editing, C.P.-C., Á.B.G.-A., N.C. and A.G.-G.; visualisation, C.P.-C. and Á.B.G.-A.; supervision, C.P.-C., Á.B.G.-A., N.C. and A.G.-G.; project administration, C.P.-C., Á.B.G.-A. and A.G.-G.; funding acquisition, C.P.-C. All authors have read and agreed to the published version of the manuscript.

Funding

This research did not receive any external grant.

Data Availability Statement

The data presented in this study are available upon request from the corresponding author.

Acknowledgments

The authors acknowledge the origin of this research through the final degree work of Rafael Muñoz Cervantes directed by professors Antonio Galiano Garrigós and Ángel Benigno González Avilés.

Conflicts of Interest

The authors declare no conflicts of interest.

References

  1. Kottek, M.; Grieser, J.; Beck, C.; Rudolfm, B.; Rubel, F. World Map of the Köppen-Geiger climate classification updated. Meteorol. Z. 2006, 15, 259–263. [Google Scholar] [CrossRef]
  2. Olcina, J.; Serrano-Notivolit, R.; Miró, J.; Meseguer-Ruiz, O. Tropical nights in the Spanish Mediterranean coast: Recent evolution (1950–2014). Clim. Res. 2019, 78, 225–236. [Google Scholar] [CrossRef]
  3. Miró, J.; Olcina, J. Cambio climático y confort térmico. Efectos en el turismo de la Comunidad Valenciana. Rev. Investig. Turísticas 2020, 20, 1–30. [Google Scholar]
  4. Ministerio para la Transición Ecológica y el Reto Demográfica. Climate Projections for the 21st Century (In Spanish: Proyecciones Climáticas para el Siglo XXI); Ministerio para la Transición Ecológica y el Reto Demográfica, Agencia Estatal de Meteorología: Madrid, Spain, 2023. [Google Scholar]
  5. Beck, H.; Zimmermann, N.; McVicar, T.; Vergopolan, N.; Berg, A.; Wood, E.F. Present and future Köppen-Geiger climate classification maps at 1-km resolution. Sci. Data 2018, 5, 180214. [Google Scholar] [CrossRef]
  6. Kriticos, D.; Webber, B.; Leriche, A.; Ota, N.; Macadam, I.; Bathols, J.; Scott, J. CliMond: Global hihg-resolution historical and future scenario climate surfaces for bioclimatic modelling. Methods Ecol. Evol. 2012, 3, 53–64. [Google Scholar] [CrossRef]
  7. Foster, J.; Smallcombe, J.W.; Hodder, S.; Jay, O.; Flouris, A.D.; Nybo, L. Quantifying the impacto of heat on human physical work capacity; part III: The impact of solar radiation varies with air temperature, humidity, and clothing coverage. Int. J. Biometeorol. 2022, 66, 175–188. [Google Scholar] [CrossRef]
  8. Kazkaz, M.; Pavelek, M. Operative temperature and globe temperature. Eng. Mech. 2013, 20, 319–325. [Google Scholar]
  9. Atmaca, I.; Kaynakli, O.; Yigit, A. Effects of radiant temperature on thermal comfort. Build. Environ. 2007, 42, 3210–3220. [Google Scholar] [CrossRef]
  10. Song, B.; Bai, L.; Yang, L. Analysis of the long-term effects of solar radiation on the indoor thermal comfort in office buildings. Energy 2022, 247, 123499. [Google Scholar] [CrossRef]
  11. Arens, E.; Hoyt, T.; Zhou, X.; Huang, L.; Zhang, H.; Schiavon, S. Modeling the comfort effects of short-wave solar radiation indoors. Build. Environ. 2015, 88, 3–9. [Google Scholar] [CrossRef]
  12. Sabatell-Canales, S.; Pérez-Carramiñana, C.; González-Avilés, Á.B.; Galiano-Garrigós, A. Influence of Balcony Glazing on Energy Efficiency and Thermal Comfort of Dwellings in a Dry Mediterranean Climate within a Warm Semi-Arid Climate. Buildings 2023, 13, 1741. [Google Scholar] [CrossRef]
  13. Pérez-Carramiñana, C.; Sabatell-Canales, S.; González-Avilés, Á.B.; Galiano-Garrigós, A. Use of “Glass Curtain” Systems to Improve the Energy Efficiency and Thermal Comfort of Dwellings in a Warm Semi-Arid Mediterranean Climate. Appl. Sci. 2023, 12, 13082. [Google Scholar] [CrossRef]
  14. Halawa, E.; Van Hoof, J.; Soebarto, V. The impacts of the thermal radiation field on thermal comfort, energy consumption and control—A critical overview. Renew. Sustain. Energy Rev. 2014, 37, 907–918. [Google Scholar] [CrossRef]
  15. Zhang, H.; Duan, D.; Yang, X.; Zheng, W. Application of CPMV for improving the indoor thermal environment under global solar radiation. Indoor Built. Environ. 2023, 32, 797–814. [Google Scholar] [CrossRef]
  16. Chan, Y.H.; Zhang, Y.; Tennakoon, T.; Fu, S.C.; Chan, K.C.; Tso, C.Y.; Yu, K.M.; Wan, M.P.; Huang, B.L.; Yao, S.; et al. Potential passive cooling methods based on radiation controls in buildings. Energy Convers. Manag. 2022, 272, 116342. [Google Scholar] [CrossRef]
  17. Pérez-Carramiñana, C.; Sabatell-Canales, S.; González-Avilés, Á.B.; Galiano-Garrigós, A. Influence of Spanish Energy-Saving Standard on Thermal Comfort and Energy Efficiency Owing to the War in Ukraine: Case Study of an Office Building in a Dry Mediterranean Climate. Buildings 2023, 13, 2102. [Google Scholar] [CrossRef]
  18. Yao, J. An investigation into the impact of movable solar shades on energy, indoor thermal and visual comfort improvements. Build. Environ. 2014, 71, 24–32. [Google Scholar] [CrossRef]
  19. Kunwar, N.; Cetin, K.S.; Passe, U.; Zhou, X.; Li, Y. Full-scale experimental testing of integrated dynamically-operated roller shades and lighting in perimeter office spaces. Sol. Energy 2019, 186, 17–28. [Google Scholar] [CrossRef]
  20. Goovaerts, C.; Descamps, F.; Jacobs, V.A. Shading control strategy to avoid visual discomfort by using a low-cost camera: A field study of two cases. Build. Environ. 2017, 125, 26–38. [Google Scholar] [CrossRef]
  21. Lee, K.H.; Song, Y.H.; Kim, H.-Y.; Lee, J.H. A study of optimal energy consumption measures for building façades with a parametric combination of blinds, lighting and HVAC systems. J. Asian Archit. Build. Eng. 2016, 15, 319–326. [Google Scholar] [CrossRef]
  22. Huang, K.T.; Liu, K.F.R.; Liang, H.H. Design and energy performance of a buoyancy driven exterior shading device for building application in Taiwan. Energies 2015, 8, 2358–2380. [Google Scholar] [CrossRef]
  23. Uribe, D.; Vera, S.; Bustamante, W.; McNeil, A.; Flamant, G. Impact of different control strategies of perforated curved louvers on the visual comfort and energy consumption of office buildings in different climates. Sol. Energy 2019, 190, 495–510. [Google Scholar] [CrossRef]
  24. Grobman, Y.J.; Capeluto, I.G.; Austern, G. External shading in buildings: Comparative analysis of daylighting performance in static and kinetic operation scenarios. Archit. Sci. Rev. 2017, 60, 126–136. [Google Scholar] [CrossRef]
  25. Kim, D.; Cox, S.J.; Cho, H.; Yoon, J. Comparative investigation on building energy performance of double skin façade (DSF) with interior or exterior slat blinds. J. Build. Eng. 2018, 20, 411–423. [Google Scholar] [CrossRef]
  26. Bellia, L.; De Falco, F.; Minichiello, F. Effects of solar shading devices on energy requirements of standalone office buildings for Italian climates. Appl. Therm. Eng. 2013, 54, 190–201. [Google Scholar] [CrossRef]
  27. Koç, S.G.; Maçka Kalfa, S. The effects of shading devices on office building energy performance in Mediterranean climate regions. J. Build. Eng. 2021, 44, 102653. [Google Scholar] [CrossRef]
  28. Al-Tamimi, N.A.; Fadzil, S.F.S. The potential of shading devices for temperature reduction in high-rise residential buildings in the tropics. Procedia Eng. 2011, 21, 273–282. [Google Scholar] [CrossRef]
  29. Lai, K.; Wang, W.; Giles, H. Solar shading performance of window with constant and dynamic shading function in different climate zones. Solar Energy 2017, 147, 113–125. [Google Scholar] [CrossRef]
  30. Al-Masrani, S.M.; Al-Obaidi, K.M. Dynamic shading systems: A review of design parameters, platforms and evaluation strategies. Autom. Constr. 2019, 102, 195–216. [Google Scholar] [CrossRef]
  31. De Luca, F.; Voll, H.; Thalfeldt, M. Comparison of static and dynamic shading systems for office building energy consumption and cooling load assessment. Manag. Environ. Qual. Int. J. 2018, 29, 978–998. [Google Scholar] [CrossRef]
  32. Xiong, J.; Tzempelikos, A.; Bilionis, I.; Karava, P. A personalized daylighting control approach to dynamically optimize visual satisfaction and lighting energy use. Energy Build. 2019, 193, 111–126. [Google Scholar] [CrossRef]
  33. de Vries, S.B.; Loonen, R.C.G.M.; Hensen, J.L.M. Multi-state vertical-blinds solar shading—Performance assessment and recommended development directions. J. Build. Eng. 2021, 40, 16–21. [Google Scholar] [CrossRef]
  34. Tzempelikos, A.; Athienitis, A.K. The impact of shading design and control on building cooling and lighting demand. Sol. Energy 2007, 81, 369–382. [Google Scholar] [CrossRef]
  35. Mahmoud, A.H.A.; Elghazi, Y. Parametric-based designs for kinetic facades to optimize daylight performance: Comparing rotation and translation kinetic motion for hexagonal facade patterns. Sol. Energy 2016, 126, 111–127. [Google Scholar] [CrossRef]
  36. Choi, S.J.; Lee, D.S.; Jo, J.H. Lighting and cooling energy assessment of multipurpose control strategies for external movable shading devices by using shaded fraction. Energy Build. 2017, 150, 328–338. [Google Scholar] [CrossRef]
  37. Powell, D.; Hischier, I.; Jayathissa, P.; Svetozarevic, B.; Schlüter, A. A reflective adaptive solar façade for multi-building energy and comfort management. Energy Build. 2018, 177, 303–315. [Google Scholar] [CrossRef]
  38. Lee, D.S.; Koo, S.H.; Seong, Y.B.; Jo, J.H. Evaluating thermal and lighting energy performance of shading devices on kinetic façades. Sustainability 2016, 8, 883. [Google Scholar] [CrossRef]
  39. Ahmed, M.M.S.; Abdel-Rahman, A.K.; Bady, M.; Mahrous, E.K. The thermal performance of residential building integrated with adaptive kinetic shading system. Int. Energy J. 2016, 16, 97–106. [Google Scholar]
  40. Sheikh, W.T.; Asghar, Q. Adaptive biomimetic facades: Enhancing energy efficiency of highly glazed buildings. Front. Archit. Res. 2019, 8, 319–331. [Google Scholar] [CrossRef]
  41. Kim, H.; Yang, C.; Moon, H.J. A study on multi-objective parametric design tool for surround-type movable shading device. Sustainbility 2019, 11, 7096. [Google Scholar] [CrossRef]
  42. Giovannini, L.; Lo Verso, V.R.M.; Karamata, B.; Andersen, M. Lighting and energy performance of an adaptive shading and daylighting system for arid climates. Energy Procedia 2015, 78, 370–375. [Google Scholar] [CrossRef]
  43. Antonis, K.; Aris, T. The impacts of a dynamic sunlight redirection system on the energy balance of office buildings. Energy Procedia 2017, 122, 38–43. [Google Scholar] [CrossRef]
  44. Ministerio de Transporte, Movilidad y Agenda Urbana. DA DB-HE/1, Documento de Apoyo al Documento Básico, DB-HE Ahorro de energía, Código Técnico de la Edificación; Ministerio de Transporte, Movilidad y Agenda Urbana: Madrid, Spain, 2020. [Google Scholar]
  45. UNE-EN ISO 52022-3:2017; Energy Performance of Buildings—Thermal, Solar and Daylight Properties of Building Components and Elements—Part 3: Detailed Calculation Method of the Solar and Daylight Characteristics for Solar Protection Devices Combined with Glazing (ISO 52022-3:2017). AENOR, Agencia Española de Normalización y Certificación: Madrid, Spain, 2017.
  46. UNE-EN 14501:2021; Blinds and Shutters. Thermal and Visual Comfort. Performance Characteristics and Classification (EN 14501:2021). AENOR, Agencia Española de Normalización y Certificación: Madrid, Spain, 2021.
  47. UNE-EN ISO 52016-1:2017; Energy Performance of Buildings—Energy Needs for Heating and Cooling, Internal Temperatures and Sensible and Latent Heat Loads—Part 1: Calculation Procedures (ISO 52016-1:2017). AENOR, Agencia Española de Normalización y Certificación: Madrid, Spain, 2017.
  48. Agencia Estatal Boletín Oficial del Estado. Real Decreto 732/2019, de 20 de Diciembre, Por el Que se Modifica el Código Técnico de la Edificación, Aprobado por el Real Decreto 314/2006, de 17 de marzo; Agencia Estatal Boletín Oficial del Estado: Madrid, Spain, 2019. [Google Scholar]
  49. Agencia Estatal Boletín Oficial del Estado. Real Decreto 390/2021, de 1 de Junio, Por el Que se Aprueba el Procedimiento Básico para la Certificación de la Eficiencia Energética de los Edificios; Agencia Estatal Boletín Oficial del Estado: Madrid, Spain, 2021. [Google Scholar]
  50. AICIA. Líder-Calener Unified Tool Software, v2.0.2253.1167; Dirección General de Arquitectura, Vivienda y Suelo del Ministerio de Transportes, Movilidad y Agenda Urbana y por el Instituto para la Diversificación y Ahorro de la Energía (IDEA): Madrid, Spain, 2021; Available online: https://www.codigotecnico.org/Programas/HerramientaUnificadaLIDERCALENER.html (accessed on 18 December 2021).
  51. Lakhdari, K.; Sriti, L.; Painter, B. Parametric optimization of daylight, thermal and energy performance of middle school classrooms, case of hot and dry regions. Build. Environ. 2021, 201, 108173. [Google Scholar] [CrossRef]
  52. Sadick, A.M.; Issa, M.H. Assessing physical conditions of indoor space enclosing elements in schools in relation to their indoor environmental quality. J. Build. Eng. 2018, 20, 520–530. [Google Scholar] [CrossRef]
  53. Alwetaishi, M.; Al-Khatri, H.; Benjeddou, O.; Shamseldin, A.; Alsehli, M.; Alghamdi, S.; Shrahily, R. An investigation of shading devices in a hot region: A case study in a school building. Ain Shams Eng. J. 2021, 12, 3229–3239. [Google Scholar] [CrossRef]
  54. Winterbottom, M.; Wilkins, A. Lighting and discomfort in the classroom. J. Environ. Psychol. 2009, 29, 63–75. [Google Scholar] [CrossRef]
  55. Ochoa, C.E.; Aries, M.B.C.; van Loenen, E.J.; Hensen, J.L.M. Considerations on design optimization criteria for windows providing low energy consumption and high visual comfort. Appl. Energy 2012, 95, 238–245. [Google Scholar] [CrossRef]
  56. Nabil, A.; Mardaljevic, J. Useful daylight illuminances: A replacement for daylight factors. Energy Build. 2006, 38, 905–913. [Google Scholar] [CrossRef]
  57. NTP 211: Iluminación de los Centros de Trabajo; Instituto Nacional de Seguridad de Higiene en el Trabajo, Ministerio de Trabajo y Asuntos Sociales: Madrid, Spain, 1989.
  58. Agencia Estatal Boletín Oficial del Estado. Real Decreto 486/1997, de 14 de Abril, Por el Que se Establecen Las Disposiciones Mínimas de Seguridad y Salud en Los Lugares de Trabajo; Agencia Estatal Boletín Oficial del Estado: Madrid, Spain, 1997. [Google Scholar]
  59. Agencia Estatal Boletín Oficial del Estado. Real Decreto 488/1997, de 14 de Abril, Sobre Disposiciones Mínimas de Seguridad y Salud Relativas al Trabajo Con Equipos Que Incluyen Pantallas de Visualización; Agencia Estatal Boletín Oficial del Estado: Madrid, Spain, 1997. [Google Scholar]
  60. UNE-EN 12464-1:2022; Light and Lighting. Lighting of Work Places. Part 1: Indoor Work Places. AENOR, Agencia Española de Normalización y Certificación: Madrid, Spain, 2022.
  61. Agencia Estatal Boletín Oficial del Estado. Orden de 9 de Marzo de 1971 Por la Que se Aprueba la Ordenanza General de Seguridad e Higiene en el Trabajo; Agencia Estatal Boletín Oficial del Estado: Madrid, Spain, 1971. [Google Scholar]
  62. UNE-EN 17037:2020+A1; Daylight in Buildings. AENOR, Agencia Española de Normalización y Certificación: Madrid, Spain, 2020.
  63. UNE-EN 17037:2020/AC.; Daylight in Buildings. AENOR, Agencia Española de Normalización y Certificación: Madrid, Spain, 2020.
  64. Fanger, P.O. Thermal Confort; Mc Graw Hill: New York, NY, USA, 1972. [Google Scholar]
  65. Castejón, E. NTP 74: Thermal Comfort-Fanger’s Method of Assessment; Ministerio de Trabajo y Asuntos Sociales: Madrid, Spain, 1983. [Google Scholar]
  66. Luo, M.; Wang, Z.; Kec, K.; Caod, B.; Zhaib, Y.; Zhoue, X. Human metabolic rate and thermal comfort in buildings: The problem and Challenge. Build. Environ. 2018, 131, 44–52. [Google Scholar] [CrossRef]
  67. Yang, C.; Yin, T.; Fu, M. Study on the allowable fluctuation ranges of human metabolic rate and thermal environment parameters under the condition of thermal comfort. Build. Environ. 2016, 103, 155–164. [Google Scholar] [CrossRef]
  68. Ege Çeter, A.; Furkan Ozbey, M.; Turhan, C. Gender inequity in thermal sensation based on emotional intensity for participants in a warm mediterranean climate zone. Int. J. Therm. Sci. 2023, 185, 108089. [Google Scholar] [CrossRef]
  69. Kalmár, F. An indoor environment evaluation by gender and age using an advanced personalized ventilation system. Build. Serv. Eng. Res. Technol. 2017, 38, 505–521. [Google Scholar] [CrossRef]
  70. Duan1, Q.; Wang, J. A review on predicted mean vote and adaptive thermal comfort models. Build. Serv. Eng. Res. Technol. 2024, 35, 23–35. [Google Scholar] [CrossRef]
  71. UNE-EN ISO 7730:2006; Ergonomics of the Thermal Environment-Analytical Determination and Interpretation of Thermal Comfort Using Calculation of the PMV and PPD Indices and Local Thermal Comfort Criteria (ISO 7730:2005). AENOR, Agencia Española de Normalización y Certifiación: Madrid, Spain, 2006.
  72. ASHRAE Standard-55; Thermal Environment Conditions for Human Occupancy. American Society of Heating, Refrigerating and Air-Conditioning Engineers: Peachtree Corners, GA, USA, 2020.
  73. DesignBuilder v.7.0.1.006; DesignBuilder Software Ltd.: Stroud, UK, 2021.
  74. Ministerio de Transportes; Burke, R.V.; Gil, M.S.; González, D.J.; Rodríguez, J.S. DB-HE Application Guide 2019 (In Spanish: Guía de Aplicación DB-HE 2019); Ministerio de Transportes, Movilidad y Agenda Urbana. Gobierno de España: Madrid, Spain, 2019. [Google Scholar]
  75. Agencia Estatal Boletín Oficial del Estado. Order FOM/588/2017, of 15 June, Amending Basic Document DB-HE 975 “Energy Saving” and Basic Document DB-HS “Health” of the Technical Building Code, Approved by Royal Decree 976 314/2006, of 17 March, 2017 (In Spanish: Orden FOM/588/2017, de 15 de Junio, por la Que se Modifican el Documento Básico DB-HE 975 “Ahorro de Energía” y El Documento Básico DB-HS “Salubridad”, del Código Técnico de la Edificación, Aprobado por Real Decreto 976 314/2006, de 17 de Marzo, 2017); Agencia Estatal Boletín Oficial del Estado: Madrid, Spain, 2017. [Google Scholar]
  76. Agencia Estatal Boletín Oficial del Estado. Royal Decree 1826/2009 Amending the Regulation on Thermal Installations in Buildings, Approved by Royal Decree 1027/2007 of 20 July 2007 (In Spanish: Real Decreto 1826/2009 Por el Que se Modifica el Reglamento de Instalaciones Térmicas en los Edificios, Aprobado por Real Decreto 1027/2007, de 20 de Julio); Agencia Estatal Boletín Oficial del Estado: Madrid, Spain, 2009; Available online: https://www.boe.es/eli/es/rd/2009/11/27/1826 (accessed on 15 July 2023).
  77. Agencia Estatal Boletín Oficial del Estado. Royal Decree Law 14/2022, of 1 August, Measures Economic Sustainability in the Scope of the Transport, in the Field of Scholarships and Helps the Study, as Well as Saving Measures, Energetic Efficiency and Reduction of Natural Gas Energetic Dependence (In Spanish: Real Decreto Ley 14/2022, de 1 de Agosto, de Medidas de Sostenibilidad Económica en el ámbito del Transporte, en Materia de Becas y Ayudas al Estudio, así Como de Medidas de Ahorro, Eficiencia Energética y Reducción de la Dependencia Energética del Gas Natural); Agencia Estatal Boletín Oficial del Estado: Madrid, Spain, 2022; Available online: https://www.boe.es/eli/es/rdl/2022/08/01/14/con (accessed on 15 July 2023).
  78. American Society of Heating, Ventilating, and Air Conditioning Engineers (ASHRAE). Guideline 14-2014, Measurement of Energy and Demand Savings; Technical Report; American Society of Heating, Ventilating, and Air Conditioning Engineers: Atlanta, GA, USA, 2014. [Google Scholar]
Figure 1. (a) Geographical area of BShs climate in Spain (red); (b) building location.
Buildings 14 00556 g001
Figure 2. Case study: (a) external image of the building; (b) floor plan of the analysed building.
Buildings 14 00556 g002
Figure 3. On-site temperature measurements of the building: (a) thermographic photograph; (b) thermal transmittance measurement.
Buildings 14 00556 g003
Figure 4. On-site measurements of light intensity of the studied building enclosures with luxmeter: (a) classroom with an exterior solar control system of vertical louvres; (b) classroom with an interior solar control system of venetian blinds.
Buildings 14 00556 g004
Figure 5. Instruments and measuring equipment used: (a) Testo 868 thermal imaging camera; (b) thermal transmittance flowmeter Testo 435-2; (c) humidity/temperature probe with wireless handle; (d) surface probe; hot wire probe; (e) black balloon probe; (f) luxmeter.
Buildings 14 00556 g005
Figure 6. Mean indoor temperatures inside the classroom, at 12:00 h in the summer’s hottest week (18–22 July): (a) on-site measurements and simulations without a movable sun protection system; (b) on-site measurements and simulations with an outdoor movable sun shading system of vertical louvres.
Buildings 14 00556 g006
Figure 7. On-site measurements of the indoor dry-bulb temperatures between the glass and the curtain, at 13:00 h in the summer’s hottest week (18–22 July).
Buildings 14 00556 g007
Figure 8. Mean indoor temperatures inside the classroom, at 12:00 h in the summer’s hottest week (18–22 July): (a) on-site measurements and simulations of the indoor movable sun protection system; (b) simulation measurements of the proposed outdoor movable sun protection system.
Buildings 14 00556 g008
Figure 9. Results of thermal comfort surveys and simulations on applying the case studies: (a) occupants’ thermal sensation and PMV; (b) percentage of dissatisfied users and PPD.
Buildings 14 00556 g009
Figure 10. Results of thermal comfort surveys at 12:00 h in the summer’s hottest week (18–22 July): (a) without a movable sun protection system; (b) with an external movable sun shading system of vertical louvres.
Buildings 14 00556 g010
Figure 11. Results of thermal comfort surveys and simulation predictions at 12:00 h in the summer’s hottest week (18–22 July): (a) thermal comfort surveys with the indoor movable sun protection system; (b) simulation predictions with the proposed outdoor movable sun protection system.
Buildings 14 00556 g011
Figure 12. Lighting study via computer simulation at 12:00 h in the summer’s hottest week (18–22 July): (a) without a movable sun protection system; (b) with an external movable sun shading system of vertical louvres.
Buildings 14 00556 g012
Figure 13. Lighting level inside the classroom at 12:00 h in the summer’s hottest week (18–22 July): (a) on-site measurements and simulations without a movable sun protection system; (b) on-site measurements and simulations with an external movable sun shading system of vertical louvres.
Buildings 14 00556 g013
Figure 14. Results of lighting comfort surveys at 12:00 h in the summer’s hottest week (18–22 July): (a) without a movable sun protection system; (b) with an external movable sun shading system of vertical louvres.
Buildings 14 00556 g014
Figure 15. Lighting study via computer simulation at 12:00 h in the summer’s hottest week (18–22 July): (a) with an indoor movable sun protection system; (b) simulation predictions with the proposed outdoor movable sun protection system.
Buildings 14 00556 g015
Figure 16. Lighting levels inside the classroom at 12:00 h in the summer’s hottest week (18–22 July): (a) on-site measurements and simulations with the indoor movable sun protection system; (b) simulations with the proposed outdoor movable sun protection system.
Buildings 14 00556 g016
Figure 17. Results of lighting comfort surveys and predictions at 12:00 h in the summer’s hottest week (18–22 July): (a) results of surveys with the indoor movable sun protection system; (b) predictions with the proposed outdoor movable sun protection system.
Buildings 14 00556 g017
Figure 18. Monthly cooling and heating energy needs depending on the case studies analysed.
Buildings 14 00556 g018
Figure 19. Annual cooling and heating energy needs depending on the case studies.
Buildings 14 00556 g019
Table 1. Summary of proposed case studies.
Case StudyFeatures
1Without movable sun shading devices
2With existing movable sun shading devices: vertical exterior louvers
3With existing indoor movable sun shading devices: indoor venetian blinds
4With outdoor movable sun shading devices: outdoor venetian blinds
Table 2. Characteristics of measuring equipment used.
ModelMeasuring RangeAccuracy
Thermographic cameraTesto 868−15–+50 °C±2 °C/±2%
+10–+95% HR±2% HR
Thermal transmittance flowmeterTesto 435-2−20–+50 °C-
Humidity/temperature probeTesto−20–+70 °C±0.3 °C
+10–+100% HR±2% HR
Surface probeTesto−20–+70 °C±0.1 °C
Hot wire probeTesto−20–+70 °C±0.3 °C
±0.3 m/s
Black globe temperature probeTesto+0–+120 °CClass 1 (EN 60584-1)
LuxmeterPCS-100 840020C+0–+20,000 Lux±2%
Table 3. Building façade thermal properties based on on-site measurements.
Thermal PropertiesThickness
(cm)
U
(W/m2·K)
gAbsorptivityAir Permeability
m3/h·m2
Thermally insulated concrete wall façades50 U = 0.52
Thermally insulated OSB cladding façades10 U = 0.48
Glass (82% of the window)2.0Ug = 3.2400.75
(double glazing with air gap)(without solar control)
Frames (18% of the window)7.0Uf = 4.752 0.4050.00
Floor50.0U = 0.71
Roof55.0U = 0.62
Air change rates by natural ventilation = 1.2 ren/h
Frame air permeability = 50.00 m3/h·m2
Table 4. Summary of properties of movable solar shading devices.
Movable Solar Protection DeviceParameterFeaturesValue
External louvresShading factor for obstacles outside the openingOrientation: SE
Inclination angle: +60°
0.30
Internal venetian blindsSolar transmittance factor-0
Reflection factorColour: grey0.5
Total solar energy
Aperture transmittance
-0.43
External adjustable blindsSolar transmittance factor-0
Reflection factorColour: grey0.5
Total solar energy
Aperture transmittance
-0.08
Table 5. Computer calculation parameters.
Parameter Applicable Standards
People/m2Metabolic rateScheduleDB-HE
Occupation 0.61.309:00–20:00
working
Application Guide 2019 [74]
CopMonthsScheduleDB-HE Annex D
Cooling equipment4.26/7/909:00–20:00 27 °COperational conditions and
Heating equipment3.61/2/3/4/5/10/11/1209:00–20:00 19 °Cuse profiles [75]
dm3/s ScheduleRD1826/2009 [76]
Mechanical ventilation270 09:00–20:00RDL14/2022 [77]
Average illuminationPower
Internal lightning loads400 lux5 W/m209:00–14:00 100%Royal Decree 486/1997
14:00–15:00 20%Annex IV [58]
15:00–20:00 100%
Table 6. Comparative summary table of case study results.
Case StudyThermal ComfortLighting ComfortEnergy Efficiency
1. Without movable sun shading devicesVery badVery badVery bad
2. With the existing movable sun shading devices of vertical exterior louversVery goodRegularVery good
3. With the existing indoor movable sun shading devices of indoor venetian blindsRegularVery goodBad
4. With an outdoor movable sun shading devices of outdoor venetian blindsVery goodVery goodVery good
Disclaimer/Publisher’s Note: The statements, opinions and data contained in all publications are solely those of the individual author(s) and contributor(s) and not of MDPI and/or the editor(s). MDPI and/or the editor(s) disclaim responsibility for any injury to people or property resulting from any ideas, methods, instructions or products referred to in the content.

