Article

Research on the Influence of Open Underground Space Entrance Forms on the Microclimate: A Case Study in Xuzhou, China

1
School of Architecture and Engineering, Huaiyin Institute of Technology, Huaian 223001, China
2
School of Mechanics and Civil Engineering, China University of Mining and Technology, Xuzhou 221116, China
3
School of Architecture and Design, China University of Mining and Technology, Xuzhou 221116, China
*
Author to whom correspondence should be addressed.
Buildings 2024, 14(2), 554; https://doi.org/10.3390/buildings14020554
Submission received: 12 January 2024 / Revised: 8 February 2024 / Accepted: 17 February 2024 / Published: 19 February 2024

Abstract

:
With urban development and renewal, underground space is becoming more utilized. The design and use of open underground public space entrances and exits have become more and more frequent. As a pedestrian passage connecting indoors and outdoors, the wind and thermal environment of open entrances have a great impact on human comfort. This paper investigates the open underground space entrances and exits in Xuzhou. Physical environments such as temperature and wind speed were measured. Through numerical simulation, the influence relationships between the spatial form elements of open entrances and exits and microclimate and thermal comfort were investigated. This study showed that there are four common spatial morphological elements of open entrances and exits. The physiologicafl equivalent temperature (PET) of the outdoor part of the entrance is the highest in summer, and the lowest in winter, and the PET is most affected by the shape of the opening plane and the aspect ratio, which are linearly related. The trends of the spatial morphology elements were not consistent when seeking the optimal situation of PET in summer and winter, respectively. The relationship between the spatial form elements of entrances and PET established in this study provides technical guidance for the design of open entrances, which can help improve environmental quality and enhance human comfort.

1. Introduction

With the development of cities and the increase in population density, urban land is gradually strained. Underground space has a huge development prospect as urban stock land [1,2]. According to statistics, the cumulative floor area of urban underground space in China is 2.962 billion square meters, and the average per capita size of underground space is 3.8 square meters. Japan has built at least 146 underground streets in 26 cities, and the number of people entering and leaving the underground streets has reached 12 million. The New York City subway in the United States has the longest operating line in the world (443 km), the largest number of stations (504), and receives 5.1 million daily trips, or nearly 2 billion trips per year. As urban underground spaces are being further utilized, it is becoming increasingly important to study the thermal environment of underground spaces, considering people’s health and comfort [3].
As a pedestrian passage connecting indoors and outdoors, the entrance of the underground space can interact with the outdoor environment and, thus, change the physical environment of the indoor. Their morphological design and physical environment are essential. Some scholars have studied the relationship between PM10 concentration in parking lots, underground hotels’ spatial depth, and the surrounding thermal and humid environments [4,5]. This kind of underground space is deeper and has a weaker correlation with the outdoor environment. Other scholars have investigated the relationship between atrium morphology, spatial form proportions, materials and vents, and underground spaces’ thermal and humid environments [6,7,8]. Their studies take advantage of the characteristics of underground buildings interacting with the ground and the outdoors and naturally regulate them by changing the spatial forms, materials, systems, or other passive facilities at the entrances and exits. In addition, many scholars have studied the relationship between the morphology of entrances and exits of subway spaces such as subways and commercial exhibition buildings and human comforts, such as ventilation, temperature, air quality, and visual preference, with regard to the national conditions and climatic conditions of each country [9,10,11,12,13]. With underground space development, the form of entrances also tends to diversify gradually. The spatial form is divided into three forms: open entrance and exit, independent foyer-type entrance and exit, and sunken plaza-type entrance and exit. Since underground space construction is later than the general urban development, the newly developed underground space is subject to the limitations of norms, land use rights, and existing building protection, and only open entrances and exits can be used in some areas. In addition, the short construction period and lower impact on the surrounding environment are also advantages of open entrances and exits.
There is no transition space as open entrances differ from separate foyer and sunken plaza entrances. This situation leads to a direct connection between indoor and outdoor environments, which has a greater impact on human thermal comfort. Many scholars have extensively researched underground space environments for different space types. Wen Yueming et al. proposed design strategies to enhance comfort and health based on solar radiation and air pollution to retrofit sunken plaza-type entrances and exits in underground spaces [14]. Guo Haoxu et al. found that the choice of the orientation of a sunken plaza has a significant influence on the thermal environment and human comfort of underground space [15]. The above studies mainly focused on sunken plaza-type entrances and exits. Liu Yanan et al. investigated the effects of outdoor wind speed, flow resistance of the subway station, height and length of the shelter, and other parameters on the airflow at the entrance of the subway station through numerical simulation of the horizontal entrance of the subway station [16]. Guan Bowen et al. found that the larger the entrance opening, the better the indoor air quality [17]. These studies explored the effects of wind and thermal environments on comfort. It provides a theoretical basis for the design of entrances and exits. Therefore, studying the microclimate and human comfort of open entrances and exits is important. However, these studies have certain limitations. On the one hand, few studies have focused on field measurements; on the other hand, few studies have determined the spatial morphology elements of underground space entrances and exits through a large amount of research, as well as few studies have quantified the effects of multiple morphology features of entrances and exits on the thermal environment and human comfort in underground spaces.
Therefore, this study aims to explore the effects of spatial morphological changes of open entrances and exits on microclimate and human comfort. The spatial morphology characteristics of general open underground space entrances and exits were collected and organized through field research. A representative open underground space entrance in Xuzhou, China, was selected. The microclimate physical environment and wind speed of the entrance and exit were measured. The relationship between spatial morphology parameters and PET was mathematically modeled by modeling various spatial patterns of entrances and exits and software simulation, and the general pattern of the influence of spatial patterns of open entrances and exits on microclimate was finally derived. Finally, the general rule of the influence of open entrance space pattern on microclimate was found, and the optimization design strategy of entrance space pattern for human comfort was proposed. The results of this study provide data support and technical guidance for the design of open entrances and exits in underground spaces, which can help improve the environmental quality of underground entrances and exits and enhance human comfort.

2. Materials and Methods

2.1. Overview

In order to explore the influence of underground public entrances and exits on the surrounding wind and thermal environment, this study selected the open underground public space entrances and exits and applied the response surface method (RSM). This statistical method uses reasonable experimental design methods and obtains certain data through experiments, adopts multiple quadratic regression equations to fit the functional relationship between factors and response values, and seeks the optimal parameters through the analysis of regression equations to solve the multivariable problem [18]. The response surface method finds the relationship between the output response value and the input design parameter by conducting a limited number of experiments or simulations [19,20]. This type of relational model is called the response surface model. It reveals the effect of design parameters on the response value. In this way, according to the influence relationship shown by the model, the design parameters can be adjusted to optimize and even achieve the best response effect, significantly reducing the experiment and repetitive work [21]. In addition, the response surface method has been applied to the design of indoor air quality and thermal comfort in the built environment. In 2010, Tomas Norton conducted a quantitative study on the spatial form and eave opening conditions of livestock farms and improved the uniformity of the indoor wind environment of livestock farms by changing these design variables [22]. Xiong Shen used different DOE experimental design methods in 2012 to explore the relationship between wind speed and wind direction changes in buildings and ventilation rates [23]. All of them have explored ways to improve the natural ventilation performance of buildings. Zhou Liang studied the distribution of underfloor air distribution (UFAD) in 2008 and used response surface design to establish appropriate experimental simulation, aiming to improve thermal comfort and indoor air quality without increasing the energy consumption of mechanical ventilation [24]. In 2013, Chen Huijuan used a response surface method and CFD to study the influence of different configurations and flow parameters of impact jet ventilation on local thermal discomfort [25]. Both of them have explored ways to improve the mechanical properties of buildings. There are other studies on thermal comfort [26]. In order to analyze and explore the relationship between the underground public space entrance and exit forms that interact with the ground and outdoor climate and the surrounding microclimate environment, this paper generates a polynomial relationship model through RSM to describe the relationship between multiple parameterized architectural features and climate environment.
The research process is shown in Figure 1. Firstly, the paper conducts a field investigation on the open entrance and exit, summarizes the spatial characteristics of the open underground public space entrance and exit, and selects the corresponding quantitative and categorical form elements. Secondly, the current wind and thermal environment of typical entrances and exits is measured to clarify the characteristics of urban wind and thermal environment of the entrances and exits of open underground public Spaces. The typical inlet and outlet air thermal environment is simulated and verified with the actual situation. Thirdly, the response surface method was used to set the simulation experimental group and simulate the experimental group with the obtained quantitative spatial morphological elements as the design parameters. Fourthly, the regression analysis and data verification of the simulation results are carried out to obtain the prediction model. Finally, the corresponding design optimization method of the entrance and exit space form is proposed.

2.2. Measurement Method

2.2.1. Measured Time

Xuzhou is located in the cold area of China’s building thermal engineering zone, but its climate is both hot in summer and cold in winter [27]. In the process of outdoor climate design, it is necessary not only to consider the contradiction of winter cold protection but also to pay attention to summer heat protection and ventilation [28]. Therefore, this study fully considered the above conditions in the field measurement process, selected the more typical natural days in summer and winter, and observed the seasonal characteristics of the thermal environment at the entrances and exits of urban underground public Spaces. In addition, considering the influence of rainfall and direct sunlight on the measured results, a cloudy natural day with no rainfall was selected [29]. The specific time of summer measurement is from 20 August to 26 August 2021; The actual time of winter measurement was from 20 December to 26 December.
For the selection of actual time, it is necessary to consider the opening time of public places and the high frequency of people’s use time. The venue is open from 6 a.m. to 11 p.m., which overlaps with the residents’ main travel and outdoor activities [30,31]; 7:00–10:00 and 16:00–19:00 are the rush hours, and the main dining, shopping, and leisure hours, which can better represent the main usage feelings of the population. Therefore, it is of great significance to pay attention to the environmental comfort of this period. Therefore, the specific recording time is set to 7:00–10:00 and 16:00–19:00.

2.2.2. Tool Selection

The actual measuring instrument is JT2020(Beijing Shijijiantong Technology, Beijing, China) multifunctional environmental tester. The environmental tester can simultaneously collect air temperature, black globe temperature, relative humidity, wind speed, and other climatic environment data. The physical parameters to be collected in this paper are air temperature, black globe temperature, relative humidity, and breeze wind speed, and the measuring instruments all meet the measurement accuracy and error requirements specified in the literature.

2.2.3. Measured Site

The test site is located in Pengcheng Square, Xuzhou City, Jiangsu Province. Firstly, Xuzhou is located in the “cold region” in China’s building climate zoning and building thermal design zoning, which has certain special climate characteristics. Secondly, Xuzhou has abundant underground space. Moreover, this area is located in the center of Xuzhou city, which is the largest city center square in the province, with huge underground space. Covering a variety of functions such as shopping malls, pedestrian streets, museums, subways, and underground passages, the flow of people is large. Finally, the case has a rich type of underground space entrances and exits. There is a certain amount of urban construction, and there is a rich urban neighborhood form [32]. The surrounding climate and environmental conditions are more consistent, which is conducive to actual measurement and analysis and comparison. Therefore, the two open underground public space entrances and exits with the largest flow of people among them are selected [31]. They are Exit 5 of Pengcheng Square Station of Metro Line 1 (Case 1) and the West Entrance of Golden Eagle Underground Supermarket (Case 2). In Case 1, the material is ordinary concrete; in Case 2, the structural part of the opening baffle is ordinary concrete with a layer of perforated aluminum plate, and the rest is the same as in Case 1. The specific actual measurement points are shown in Figure 2. The measurement points are located at the edges of the entrance and the walkway, avoiding the middle part where people move around as much as possible. Measurement points are located at the edges of entrances and walkways, avoiding the middle part where people move frequently. The effect of crowd flow on the actual results will be taken into account, and the measurement error will be corrected in the following statistics.

2.2.4. Measured Process

The measurement follows three parts: outdoor slow walking, transition space slow walking, and indoor slow walking. The outdoor preparation stage is mainly for the installation preparation of the instrument, and the instrument is used to collect data every 15 s in the three parts of the outdoor, transition, and indoor space.

2.3. Design Experiment Method

In order to judge the influence of the spatial form index of the entrance and exit of underground public space on the wind and thermal environment around the entrance and exit, effectively control the shape parameters with greater influence and maximize the comfort level of the wind and thermal environment of the entrance and exit. Therefore, the response surface method (RSM) was used to analyze the correlation between the quantitative indicators of the spatial morphology of the entrance and exit and the existing wind thermal physical environment data, and the main influencing indicators were found. The response surface method is a statistical method that uses a reasonable experimental design method and obtains certain data through experiments, adopts multiple quadratic regression equations to fit the functional relationship between factors and response values, and seeks the optimal parameters through the analysis of regression equation to solve the multivariable problem [33]. The experimental design of the response surface method includes central composite design CCD, Box-Behnken Design BBD, Doptimality, orthogonal design OA, uniform design UN, etc. [34]. This study will use Design Expert as the main test design and result analysis output software to complete the main body of test design, sample extraction, data result fitting, equation establishment, trend analysis, target optimization, and other work. Select the Box-Behnken Design BBD method in the response surface method module to operate [35]. Through the correlation and regression analysis of different elements, the influence of the spatial form elements of the entrance and exit on the air and thermal environment of the underground public space is determined.

2.4. CFD Software Simulation Process

The CFD simulation software used in this article is FLUENT 2020 R2. The main steps of CFD software simulation are divided into three parts. The first part is to import the completed block model into the preprocessor, set the border inspection conditions and calculation conditions, and divide the calculation grid. The second part is to simulate the existing model, load the model and data of the previous part, and calculate and output the calculation result. The third part is to generate the corresponding simulation analysis results and output them in the form of visualization. The specific basic flow of numerical simulation of wind and thermal environment is shown in Figure 3.
Two of the most important aspects are the setting of external conditions and the physical modeling of the simulated area. The setting of boundary conditions is mainly to determine the simulated wind and thermal environment [36]. Meteorological data, including temperature, humidity, wind speed, etc., are determined by actual measurement, and the corresponding data parameters are set as boundary conditions according to software requirements. For simulation area modeling, the key morphological features of the model should be retained first, and the hardware requirements of the computer should be taken into account to reduce irregular model details, reduce the modeling workload, and the complexity of calculation and solution so as to reduce the problem of increasing calculation time or calculation errors due to too small grid-scale [37,38]. Therefore, targeted deletion should be carried out, integrated, and simplified into regular spatial models.

3. Results

3.1. Analysis of Measured Results

3.1.1. Field Research

The types of entrances and exits of underground public Spaces are rich, and the design of space forms are also different. Therefore, the author conducted an in-depth investigation of the existing open underground public space entrances and exits, totaling 10. It covers the entrances and exits of underground public Spaces around Xuzhou Suning Square, Sanpower Square, Yunlong Campus of Normal University, Nanhu Campus of China University of Mining and Technology, and City Wall Museum.
Research site 1: The entrance and exit of the underground public space is located at the north side of Huaihai East Road and the west side of Pengcheng Road, Gulou District, Xuzhou City, Jiangsu Province, at the intersection of the two roads, which is the exit 5 of Pengcheng Square Station of Xuzhou Metro Line 1. From the ground, directly through the steps into the underground space, there is no shelter roof above.
Research site 2: The entrance and exit of the underground public space are located on the north side of Heqing Road and the west side of Pengcheng Road, Gulou District, Xuzhou City, Jiangsu Province. It is the entrance of the underground supermarket of Golden Eagle International Shopping Center and also exit 19 of Pengcheng Square Station of Metro Line 1. From the ground, directly through the steps into the underground space, there is no shelter roof above.
Research site 3: The entrance and exit of the underground public space is located at the north side of Heqing Road and the west side of Pengcheng Road, Gulou District, Xuzhou City, Jiangsu Province. It is the entrance and exit of the central Fashion Avenue and the underground pedestrian corridor at the intersection of the two roads. From the ground directly through the steps into the underground space, there is a semishielded roof above.
Research site 4: The entrance of the underground public space is located north of Huaihai East Road, Gulou District, Xuzhou City, Jiangsu Province, and south of Suning Square B1 south entrance. There is no shelter roof above from the ground directly through the steps into the underground space.
Research site 5: The entrance and exit of the underground public space are located near Sanpower Square, Tongshan District, Xuzhou City, Jiangsu Province, and the southwest entrance of the underground Food Street of Hi Street. From the ground through the steps, experience two turns into the underground food city, with no shelter above.
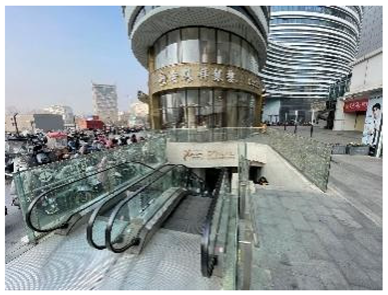
Research site 6: The entrance and exit of the underground public space are located near Sanpower Square, Tongshan District, Xuzhou City, Jiangsu Province, and the north entrance of the underground Food Street, Hi Street. There is an escalator above the shelter from the ground directly through the steps into the underground food city.
Research site 7: The entrance and exit of the underground public space is located at the north side of Heqing Road and the west side of Pengcheng Road, Gulou District, Xuzhou City, Jiangsu Province, at the intersection of the two roads, and is exit No. 18 in Pengcheng Square Station, Metro Line 1. There is no shelter roof above the ground directly through the steps into the underground space.
Research site 8: The entrance and exit of the underground public space is located in the underground city site Museum, Gulou District, Xuzhou City, Jiangsu Province. It is the north exit of the downtown Museum. There is no shelter roof above the ground directly through the steps into the underground space.
Research site 9: The entrance and exit of the underground public space is located in the City Wall Museum, Yunlong District, Xuzhou City, Jiangsu Province. It is the east exit of the City Wall Museum. There is no shelter roof above from the ground directly through the steps into the underground space.
Research site 10: The entrance and exit of the underground public space is located opposite the west gate of Wenchang Campus, Tongshan District, Xuzhou City, Jiangsu Province. Mine West Food City south entrance. There is no shelter roof above from the ground directly through the steps into the underground space.
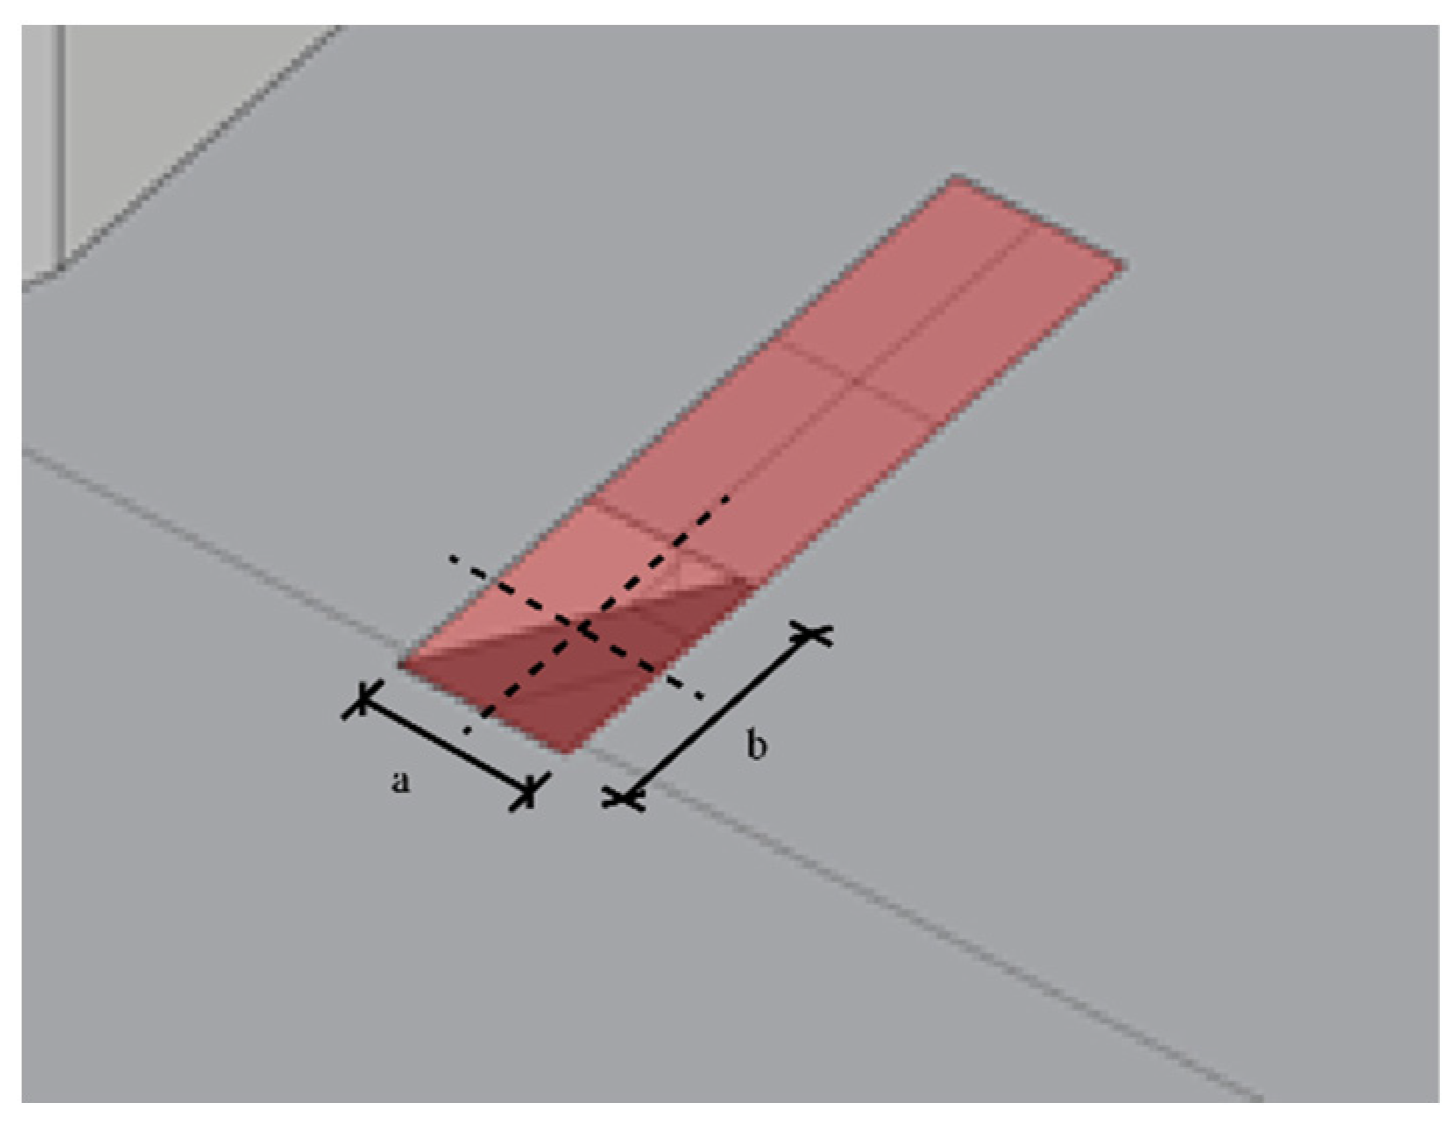
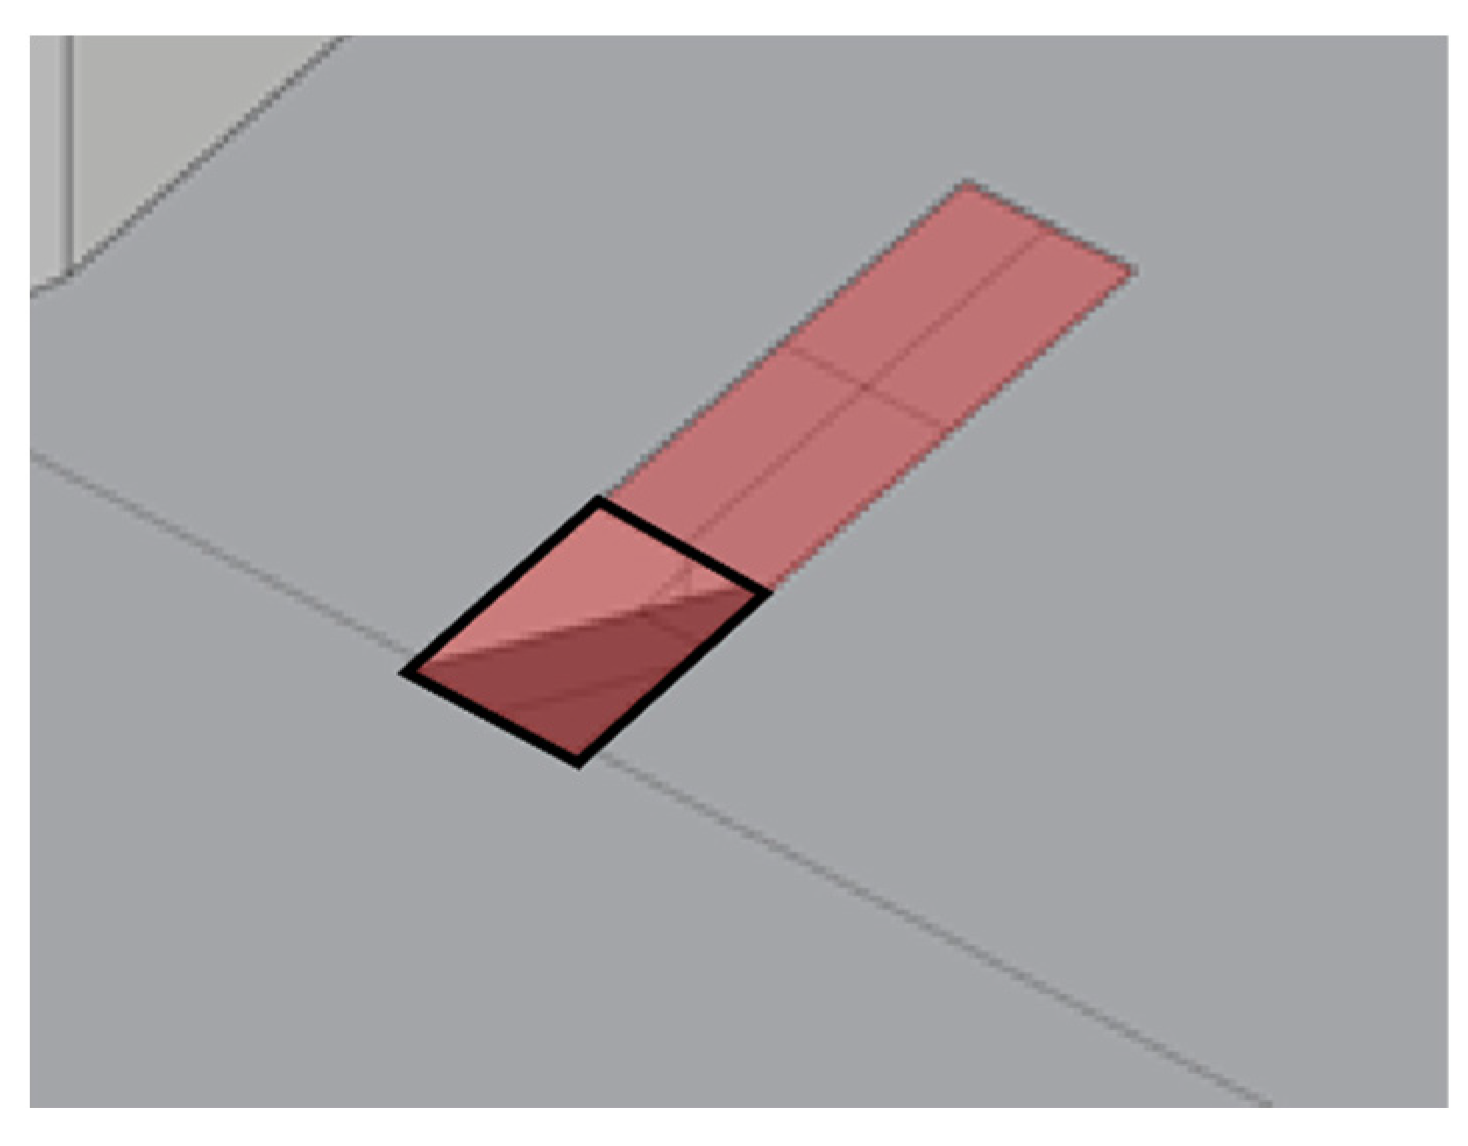
According to the basic spatial characteristics of the research objects above, the entrances and exits of open underground public spaces are classified as shown in Table 1. The following table lists the profile types of each open entrance and exit investigated and summarizes its basic spatial prototype.

3.1.2. Typical Inlet and Outlet Air Thermal Environment Measurement

(1) Summer
The environmental and physical parameters of the outdoor part, the transition part, and the indoor part in the three stages of the first group of open inlet and outlet conditions 1 and 2 in summer are shown in Table 2. You can see from the table.
In condition 1, compared with the air temperature and the black globe temperature, the black globe temperature is generally higher than the air temperature, and the outdoor to indoor air temperature drops from 35.49 °C to 29.05 °C, with a more obvious drop.
The standard deviation of relative humidity in outdoor, indoor, and transitional parts is 1.12, 1.06, and 1.56, respectively, which are all higher than 1 and significantly higher than the standard deviation of other groups of data. In addition, the maximum and minimum relative humidity values of the three parts from outdoor to transition and then to indoor are 61.33 and 58.06%, 78.1 and 71.6%, 67.73 and 63.63%, respectively, and the fluctuation is also relatively obvious, indicating that the overall relative humidity of the underground public space entrance part of the working condition 1 has a large change range.
In terms of breeze wind speed, the outdoor wind speed fluctuates between 0.22 and 4.03 m/s, with an average of about 1.11 m/s; the indoor wind speed fluctuates between 0.46 and 1.65 m/s, with an average of about 0.91 m/s; the maximum wind speed in the transition part is 0.53 m/s, the minimum is 0 m/s, and the standard deviation is 0.12. It is possible that due to the relatively stable space of the transition part and the human environment, the wind speed is too small to be measured, and the overall wind speed change is not large.
Condition 2 is slightly different from condition 1. The overall black globe temperature is higher than the air temperature, and the outdoor to indoor air temperature drops from 34.44 °C to 30.92 °C. Compared with the same type of working condition 1, the temperature drop is small, and the temperature difference is more moderate. The standard deviation of the overall physical environment of the outdoor, transition, and indoor parts is 85% below 0.5, and only the relative humidity of the outdoor part is, with a maximum value of 64.36%, a minimum value of 58.63% and the standard deviation of 1.11, indicating a large overall fluctuation. Considering that there are some factors in the outdoor part of the working condition 2 that will change with changes in the outside world, it has an impact on the overall humidity.
In terms of breeze wind speed, the outdoor wind speed fluctuates between 0.1 and 0.53m/s, with an average of about 0.24m/s, and the indoor wind speed fluctuates between 0.12 and 0.63 m/s, with an average of about 0.24 m/s. The maximum wind speed in the transition part is 3.11 m/s, the minimum wind speed is 0.1 m/s, and the standard deviation is 0.57. The difference between the maximum wind speed and the minimum wind speed is large, but the standard deviation is not too high compared with the overall data, so it can be judged that the measured maximum wind speed should be an individual case.
Figure 4 shows the whole process change trend of working conditions 1 and 2 in summer. The data in the figure is the data change record of the whole process on a certain day under different working conditions in the same season. In the figure, 1–5 min represents the outdoor part, 6–10 min represents the transition part, and 11–15 min represents the indoor part. Combined with the above chart comprehensive analysis.
From the point of view of air temperature, the overall air temperature of working condition 1 and working condition 2 is relatively stable in each part, especially in working condition 2, there is almost no change. Compared with working condition 2, working condition 1 has a gradual upward trend in the transition part, and there are small fluctuations in the room within a certain range.
From the perspective of relative humidity, in the process of turning from the outdoor part to the transition part and then to the indoor part, the humidity of working conditions 1 and 2 showed a completely opposite trend; the humidity of working condition 1 showed an upward trend, while the humidity of working condition 2 showed a significant downward trend from the outdoor part to the transition part, and the overall average relative humidity from the transition part to the indoor part began to rise.
From the point of view of air velocity, the air velocity of working conditions 1 and 2 has the largest fluctuation in the outdoor part, and the overall wind environment is unstable, especially in working condition 1, which has great fluctuation. Not only that, the air velocity in the indoor part of working condition 1 also has a large fluctuation. Working condition 2 is generally smooth, and the wind environment is relatively stable, while working condition 1 only shows little fluctuation of the measured data in the transition part, and the wind environment is relatively stable.
Through the calculation of software, the PET values of the environment around the underground public space entrance and exit conditions 1 and 2 are obtained. It can be seen from the change of PET value with the slow walking process (Figure 5) that the PET value in the outdoor part of working condition 1 is about 37.14 °C on average; when entering the transition part, the PET value drops to 34.92 °C; when entering the indoor part, the PET value drops to 29.88 °C and tends to be stable. The PET value of working condition 2 is about 30.58 °C on average; when entering the transition part, the PET value drops to 27.87 °C; when entering the indoor part, the PET value drops to 26.39 °C and tends to be stable. In the space from outdoor to indoor, the outdoor part has the highest PET.
(2) Winter
The environmental physical parameters of the outdoor part, the transition part, and the indoor part of the working conditions 1 and 2 in winter are shown in Table 3. You can see from the table.
In condition 1, compared with the air temperature and the black globe temperature, the black globe temperature is generally higher than the air temperature, and the outdoor to indoor air temperature rises from 5.18 to 8.61 °C, with a significant increase.
The standard deviations of outdoor and indoor relative humidity are 0.26 and 0.62, respectively, while the standard deviation of the transition part is 1.47, which is much higher than the other two sets of data. In addition, the maximum and minimum values of relative humidity from the transition part are 34.8 and 30.6%, respectively, and the fluctuation is also relatively obvious, indicating that the relative humidity of the underground public space entrance and exit of the working condition 1 changes greatly in the transition part, and the environmental performance of the other two parts is relatively stable.
In terms of breeze wind speed, the outdoor wind speed fluctuates between 0.34 and 1.81 m/s, with an average of about 0.79 m/s; the indoor wind speed fluctuates between 0.28 and 0.48 m/s, with an average of about 0.36 m/s; the maximum wind speed in the transition part is 0.35 m/s, the minimum wind speed is 0.12 m/s, and the standard deviation is 0.06. Considering that the space of the transition part and the man-made environment are relatively stable, the overall wind speed changes little.
Condition 2 is slightly different from condition 1. Except that the overall black globe temperature is higher than the air temperature, the outdoor to indoor air temperature rises from 6.3 to 9.04 °C, which is smaller than the same type of working condition 1, and the temperature change is more moderate. The standard deviation of the physical environment of the overall relative humidity of outdoor, transition, and indoor parts is almost below 0.2, and the highest is only 0.19. Considering that the space and external environment of working condition 2 are relatively stable, the overall impact on relative humidity is small.
In terms of wind speed, the outdoor wind speed fluctuates between 0.3 and 3.66 m/s, with an average of about 1.45 m/s, and the indoor wind speed fluctuates between 0.39 and 1.18 m/s, with an average of about 0.66 m/s. The maximum wind speed in the transition part is 1.26 m/s, the minimum wind speed is 0.21 m/s, and the standard deviation is 0.25. The maximum wind speed differs greatly from the minimum wind speed, but the standard deviation is not too high compared to the overall data.
Figure 6 shows the whole process change trend of operating conditions 1 and 2 in winter. The data in the figure is the change record of the whole process on a certain day under different working conditions in the same season. In the figure, 1–5 min represent the outdoor part, 6–10 min represent the transition part, and 11–15 min represent the indoor part. Combined with the above chart comprehensive analysis.
From the point of view of air temperature, the overall air temperature of working conditions 1 and 2 in winter from indoors to outdoors is contrary to that in summer, showing a gradual upward trend. The temperature is relatively stable in each part, especially in working condition 2, where there is almost no big change. Compared with condition 2, condition 1 has a slight gradual upward trend in the transition part and the indoor part, and there are slight fluctuations within a certain range. In addition, compared with the transition part to the indoor part, the air temperature drop from the outdoor part to the transition part in condition 1 is larger and more sudden.
The blacksphere temperature is generally consistent with the air temperature, but there are differences. In condition 1, the outdoor black globe temperature is significantly higher than the air temperature, and the black globe temperature is almost the same as the air temperature after entering the transition part and the indoor part, with a difference of about 0.2 °C.
From the perspective of relative humidity, in the process of turning from the outdoor part to the transition part and then to the indoor part, the humidity of working conditions 1 and 2 is still the same as in summer, showing a completely opposite trend. The humidity of working condition 1 shows an overall upward trend, while the humidity of working condition 2 shows a significant downward trend from outdoor to indoor part.
From the point of view of air velocity, the air velocity of working conditions 1 and 2 has the largest fluctuation in the outdoor part, and the overall wind environment is unstable, especially in working condition 1, which has great fluctuation. Compared with the outdoor part, the other two parts change less. Working condition 2 is generally smooth, and the wind environment is stable.
Through the calculation of software, the PET values of the environment around the underground public space entrance and exit conditions 1 and 2 are obtained. It can be seen from the changes in PET value with the slow walking process (Figure 7) that the physiological equivalent temperature PET of the outdoor part of working conditions 1 and 2 is not particularly stable, and the change is large. After entering the transition and indoor part, the physiologically equivalent temperature PET of both conditions has a great increase, with an increase of about 5–7 °C. In addition, the PET value of the outdoor part of working condition 1 is about 2 °C on average. When entering the transition part, the PET value rises to 8.61 °C, and when entering the indoor part, the PET value drops to 8.55 °C and tends to be stable. The PET value of working condition 2 is about 2 °C on average; when entering the transition part, the PET value rises to 4.73 °C; when entering the indoor part, the PET rises to 5.24 °C and tends to be stable. In the space from outdoor to indoor, the outdoor part has the lowest PET.

3.2. Test and Simulation Results Verify

In practical applications, the accuracy of simulation software parameter Settings is very important because the different values of these parameters will have a huge impact on the final simulation results. Therefore, verifying the reliability of simulation software parameter Settings is an essential step before the wind and thermal environment simulation. Two groups of adjacent open underground public space entrances are measured, analyzed, and compared. The built environment model of 1km around Pengcheng Square was established.

3.2.1. Construction of Measurement Model

The simulation object of this part is Exit 5 of Pengcheng Square Station of Xuzhou Metro Line 1. By surveying and mapping with the laser rangefinder, the author established the overall model of the entrance and exit space of No. 5. The red part in the figure is the entire entrance and exit space. In addition, due to the complexity of the entrance and exit, the modeling will be difficult, and the Mesh mesh division in Fluent will deteriorate the value of the minimum orthogonal quantity in the later stage. Too fine mesh division of the entire model will also lead to poor computer operation, and the interior of the entrance and exit will be controlled by the underground ventilation system. Therefore, the model of the entrance and exit will be simplified [34]; the underground part also only involves an extension of 2 m behind the groundwater level. The simplified model retains the main influencing factors, such as the depth of the entrance and exit, the area of the opening, and the size of the section of the channel, as shown in Figure 8. The actual location distribution of measuring points is consistent with the measured position.

3.2.2. Air Temperature, Breeze Wind Speed Simulation and PET Calculation

Meteorological data of temperature and wind speed in Gulou District, Xuzhou City, from 20 August to 26 August, were collected and input into Fluent for solving. Fluent software was used to simulate the physical environment at a height of 1.5 m in the outdoor part, the transition part, and the indoor part of Gate No.5 [39], The temperature and wind speed of the corresponding seven days are obtained, as shown in the following table: Table 4 shows the cloud image of computer-simulated air temperature and breeze wind speed.
Through the above-simulated air temperature and breeze wind speed, the software Rayman 1.2 can directly calculate the corresponding measurement point Tmrt and PET values [40]. Thus, the inlet and outlet air thermal environment can be compared and analyzed.

3.2.3. Simulation Verification Analysis

As shown in Figure 9, Figure 10 and Figure 11, PET measured and simulated data analysis of air temperature, breeze wind speed, and physiological equivalent temperature at a height of 1.5m from outdoors to indoors. After comparing the measured daily average values with simulated values, it is found that the temperature changes from the 20th to the 26th are not large, indicating that the weather conditions are stable. The difference between the measured temperature and the simulated temperature is basically controlled around 0.1–0.2 °C, and the general trend is that the measured temperature is higher than the simulated temperature. Considering that other surrounding green plants and ground texture materials are not added, certain errors will be caused. The variation of breeze wind speed fluctuates obviously, but the difference between the actual and simulated wind speed is also controlled at about 0.2 m/s on average. Physiological equivalent temperature PET is the same as air temperature.
In the analysis process, it was found that there are some deviations between the simulation results and the measured data of the underground public space entrance of Pengcheng Square, and the overall thermal environment has a high degree of fitting, while the wind environment is low.
In the actual situation, part of the wind and thermal environment in the entrance and exit room of underground public space is affected by many factors, such as pedestrians and air conditioning equipment, and the above situation is not truthfully considered in the simulation. However, after comparing the measured data with the simulation results, it can be found that there is still a high consistency between the two. Therefore, it can be considered that using Fluent software to simulate the wind and thermal environment of the underground public space entrance and exit is reliable.

3.3. Design and Determination of Simulated Experimental Group

In order to quantitatively analyze the influence of the spatial shape characteristics of the entrance and exit on the wind and thermal environment of the entrance and exit space, the shape characteristics of the entrance and exit are described from three aspects as follows: plane form, section form, and interface form, and various index elements are sorted out and selected. The spatial form index elements of the entrance and exit of the open underground public space are shown in Table 5. See Appendix A for the nomenclature and explanation of the indicators.
In order to judge the influence of the spatial form index of the entrance and exit of underground public space on the wind and thermal environment around the entrance and exit, one must effectively control the shape parameters with greater influence, and maximize the comfort level of the wind and thermal environment of the entrance and exit. Therefore, the correlation analysis between the quantitative indicators of the spatial form of the entrance and exit and the existing wind thermal physical environment data is carried out to find the main influencing indicators. Through the correlation and regression analysis of different elements, the influence of the spatial form elements of the entrance and exit on the air and thermal environment of the underground public space is determined. It mainly uses software Design-Expert [41].
After determining the value range of single-factor variables, with wind speed, temperature, and physiological equivalent temperature PET as response values, the Box-Behnken four-factor and four-level response surface Design was carried out by Design-Expert10 software with plane form, section form, and interface form as influencing factors for the open entrance and exit. The actual variable model is selected by response surface analysis. Based on the above research and analysis, the single-factor value range of each influencing factor of the spatial form of the entrance and exit is selected, as shown in Table 6 below.
A total of 29 groups of open entrance and exit experiments were designed, of which 5 groups had the same factors and conditions, and repeated group experiments were needed to reduce the error of experimental results. Since the same boundary conditions were used in the simulation experiments, the final results of the same experiments were consistent, so the number of simulations could be reduced. According to the response surface analysis requirements of the experimental group, 25 groups of experimental models under different working conditions were established (Table 7). When determining the parameter variables, the width of each outlet is controlled to be 6m unchanged, and the length of the outlet varies according to the proportion of the parameters. In addition to the differences in the shape of the opening plane, the ratio of length to width of the opening, the depth of the opening and the height of the baffle, the length of the ground part around the underground opening, and the length of the extension part into the underground plane remain the same when the model is built.
The comparison and verification of the measured and simulated data of Fluent software are carried out above, and it is believed that the software simulation has a certain degree of reliability. Therefore, the experimental method of software simulation was adopted for 25 groups of experiments.
The core of numerical simulation is to set up accurate boundary conditions. ANSYS FLUENT 2020 R2 provides several types of boundary conditions. This study conducted detailed field tests on the physical environment around Pengcheng Square and combined them with the obtained network data, including air temperature, black ball temperature, site breeze wind speed, and relative humidity. Considering the difference between numerical simulation and actual measurement, only part of the measured data was used as numerical calculation parameters.

3.4. Analysis of Experimental Group Simulation Results

3.4.1. Summer Design Experiment Simulation

Under summer conditions, the main research is to study the changes in wind speed, temperature, and physiological equivalent temperature PET value at the same position under different spatial shape factors of open inlet and outlet. According to the above-measured data, the size of the outflow field is set to 200 m × 100 m × 50 m, the velocity is set to 1.5m/s, and the wind field temperature is set to 36 °C. The entrance and exit of the open underground public space are set as free-flow boundary conditions.
According to the above analysis of changes in physiological equivalent temperature PET data, for the entrance and exit of open underground public space, the value of PET shows a downward trend with the change of outdoor to indoor space. Therefore, it is necessary to control the physiologically equivalent temperature of PET outdoors within a reasonable range. Therefore, in this paper, only the distribution of wind speed and temperature in the outdoor part at a height of 1.5 m is captured.
Model building and significance analysis: PET value was calculated by Rayman. In the experimental design, the plane shape of the opening, the aspect ratio of the opening, the depth, and the opening baffle’s height are set as the horizontal factors, and the horizontal factors are independent of each other. The response values are set to the physiologically equivalent temperature PET, temperature, and wind speed. Combined with the temperature and wind speed of the measuring point, the response surface experiment results were obtained, and the response surface design was carried out according to them, as shown in Table 8 below:
Using the Design-Expert 10 software, variance analysis was performed on the PET simulation experiment results of wind speed, temperature, and physiological equivalent temperature at the entrance and exit of open underground public space in summer. The PET fitting function of physiological equivalent temperature at the entrance and exit was obtained as a first-order function, and the first-order polynomial regression equations were, respectively, as follows:
Y = 40.95 0.28 A 0.18 B 0.058 C 8.33 10 3 D
In the formula:
  • Y—PET
  • A—Open plane shape
  • B—Opening aspect ratio
  • C—Opening depth
  • D—Open baffle height
The results of variance analysis of regression model are shown in Table 9.
As can be seen from Table 9, p < 0.01 indicates that the model is extremely significant. The missing item was not significant (p = 0.6762 > 0.05), indicating that the repeated test results were reasonable. R2 = 0.4903, indicating the degree of equation fitting is not very good [42]. However, after comparing Linear, 2FI, Quadratic and Cubic, it is found that Linear’s R2Adj is positive and has higher predictability than the other three fitting methods, so Linear is selected for fitting. In addition, the difference between R2Pred and R2Adj is less than 0.2, indicating a high correlation between the actual and predicted values. Therefore, the model can properly reflect the relationship between various form factors and response value PET during the use of open underground public space entrances and exits in summer, and predict the best design form factors.
According to the p value, the PET value of the entrance and exit of the open underground public space in summer was significantly affected by the plane shape of the opening (p < 0.01), and significantly affected by the aspect ratio of the opening (p > 0.05). According to the F value, the order of influence of four factors on the PET value of the entrance and exit of the open underground public space in summer is as follows: A > B > C > D, that is, the plane shape of the opening > the aspect ratio of the opening > the depth of the opening > the height of the opening baffle (Figure 12). The single factor opening plane shape has the most obvious influence on the outdoor PET value, followed by the opening length-width ratio, and the other two factors have little influence. In addition, the interaction relationship among the four factors A, B, C and D had little effect on PET outside the entrance and exit.
In addition, according to Figure 13, the trend relationship of the influence of single factors on PET values can be found. The physiological equivalent temperature PET has a linear negative correlation with the opening plane shape. The more the opening plane shape edges, the smaller the PET value. There is also a linear negative correlation with the opening length-width ratio. The larger the opening length-width ratio, the smaller the PET value. With the change of the depth of the opening and the height of the opening baffle, the difference between the maximum and the minimum value of the physiological equivalent temperature PET is small, indicating that these two factors have little influence on the PET value.

3.4.2. Winter Design Experiment Simulation

Under winter conditions, the main research is also the change law of wind speed, temperature, and physiological equivalent temperature PET value at the same position under different spatial shapes influencing factors of open inlet and outlet. The size of the outflow field is set to 200 m × 100 m × 50 m, the velocity is set to 1.5 m/s, and the wind field temperature is set to 6.3 °C. The entrance and exit of the open underground public space are set as free-flow boundary conditions.
According to the above analysis of changes in physiological equivalent temperature PET data, for the entrance and exit of open underground public space, the value of PET shows an upward trend with the change of outdoor to indoor space. Therefore, it is necessary to control the physiologically equivalent temperature of PET outdoors within a reasonable range. Therefore, in this paper, only the distribution of wind speed and temperature in the outdoor part at a height of 1.5 m is captured.
Model establishment and significance analysis: The value of PET was calculated by Rayman, and the response surface experimental results were obtained by combining the temperature and wind speed of the measuring point, and the response surface design was carried out according to it, as shown in Table 10 below:
Using Design-Expert 10 software, variance analysis was performed on the PET simulation experiment results of wind speed, temperature, and physiological equivalent temperature at the entrance and exit of open underground public space in summer. The PET fitting function of physiological equivalent temperature at the entrance and exit was obtained as a first-order function, and the first-order polynomial regression equations were, respectively, as follows:
Y = 4.66 0.62 A + B 0.033 C 0.13 D
In the formula:
  • Y—PET
  • A—Open plane shape
  • B—Opening aspect ratio
  • C—Opening depth
  • D—Open baffle height
The results of variance analysis of regression model are shown in Table 11.
As can be seen from Table 11, p < 0.01 indicates that the model is extremely significant. The missing item was not significant (p = 0.0694 > 0.05), indicating that the repeated test results were reasonable. R2 = 0.5981, although the fit is not excellent, after comparing Linear, 2FI, Quadratic, and Cubic, it is found that Linear’s R2Adj is positive, and its value is higher than the other three, and the fitting degree is better. Therefore, Linear is selected for fitting. In addition, the difference between R2Pred and R2Adj is less than 0.2, indicating a high correlation between the actual and predicted values. Therefore, the model can properly reflect the relationship between various form factors and response value PET during the use of open underground public space entrances and exits in winter and predict the best design form factors.
According to the P value, the PET value of the open underground public space in winter was significantly affected by the opening plane shape A and the opening aspect ratio (p < 0.01). According to the F value, the influencing sequence of four factors on the PET value of the entrance and exit of the open underground public space in winter is as follows: B > A > D > C, that is, the aspect ratio of the opening > the plane shape of the opening > the height of the opening baffle > the depth of the opening (Figure 14). Among the single factors, the ratio of opening length to width has the most obvious effect on PET value, followed by the opening plane shape, and the other two factors have little effect. In addition, the interaction relationship among the four factors A, B, C, and D had little effect on PET outside the entrance and exit.
In addition, according to Figure 15, the trend relationship of the influence of single factors on PET values can be found. The physiological equivalent temperature PET has a linear negative correlation with the opening plane shape. The more the opening plane shape edges, the smaller the PET value. The linear relationship with the opening aspect ratio is positive. The larger the opening aspect ratio is, the larger the PET value is. With the change of the opening depth and the height of the opening baffle, the physiologically equivalent temperature PET in its value range changes little, indicating that these two factors have little influence on the PET value.

4. Discussion

4.1. Air Thermal Environment Characteristics of Inlet and Outlet of Xuzhou Underground Public Space

In the summer, the entrance and exit of the open underground public space, from the outdoor part through the transition part to the indoor of this complete stage, the relative temperature, black globe temperature, and physiological equivalent temperature PET values are constantly decreasing; the relative temperature, black globe temperature, and PET values of the outdoor part are the highest. From outdoor to indoor, the relative humidity of working condition 1 shows an increasing trend, the humidity of the outdoor part is the highest, the relative humidity of working condition 2 shows a decreasing trend, and the humidity of the outdoor part is the lowest. The data variations of relative temperature, black sphere temperature, and humidity for Case 1 agree with Liu Xiaobin et al. [31]. Compared with condition 2, the air temperature in condition 1 drops more sharply and suddenly from the transition part to the indoor part. The wind speed of the breeze is more unstable in the outdoor and indoor parts, and the transition part is more stable.
In winter, from outdoor to indoor, the relative temperature, black globe temperature, and physiologically equivalent temperature PET values continue to rise, and the outdoor relative temperature, black globe temperature, and PET values are the lowest. The trend of relative humidity change in condition 1 and condition 2 is opposite to that in summer. The outdoor part of the breeze wind speed is the most unstable. In contrast, Liu Yanan [16] et al. found that the airflow in the outdoor portion of an open entrance was more stable. Their findings are not consistent with the results obtained in this study. This may be due to the fact that the wind tunnel tests did not consider the effects of buildings, vegetation, air-conditioning equipment, and pedestrians at the site.
Consider the situation of summer and winter. The trend of relative humidity change in condition 1 and condition 2 is not consistent, which is related to the adjustment function of the air conditioning system [43,44]. Working condition 1 is the subway entrance with an air conditioning system in summer, while working condition 2 is the Golden Eagle underground supermarket entrance without an air conditioning system to adjust the entrance. In addition, the indoor part and outdoor parts of working condition 1 are in a state of no door, no curtain, and no shelter indoor and outdoor connectivity, which is different from working condition 2. In addition, the number of users of working condition 1 during the test is larger, which may have a certain impact on the results of the measured data [12]. The variation of outdoor breeze wind speed in winter is larger than that in summer, the overall wind environment is unstable, and the overall wind speed is higher than that in summer. The preliminary speculation may be due to the withered plants around the entrance and exit, which do not have the functions of blocking the urban wind, shading and cooling [45].

4.2. Optimal Design of Human Thermal Comfort at the Entrance and Exit of Open Underground Public Space

4.2.1. Summer

In order to meet the thermal comfort requirements of the underground public space entrance and exit in summer, the physiologically equivalent temperature PET value of the outdoor part needs to reach a reasonable range, and the minimum value of physiological equivalent temperature PET should be selected. Through the multi-factor coupling model established above, the simulation data is optimized and predicted. When all factors are within the range and PET is the lowest, the plane shape of the opening is 8 sides, the aspect ratio of the opening is 3, the depth of the opening is 5.1 m, and the height of the opening baffle is 2.937 m. Under this condition, the physiologically equivalent temperature PET of the outdoor part of the entrance and exit of the open underground public space in summer is 40.415 °C. According to the actual achievable situation, the plane shape of the opening is 8 sides, the aspect ratio of the opening is 3, the depth of the opening is 5.1 m, and the height of the opening baffle is 2.95 m. Finally, the PET of the outdoor part of the open entrance and exit in summer is 40.4 ± 0.2 °C, which is close to the predicted value of the model, indicating that the model can be used to optimize the shape design of the open underground public space entrance and exit in summer.

4.2.2. Winter

In order to meet the human thermal comfort requirements of the underground public space entrance and exit in winter, the physiologically equivalent temperature PET value of the outdoor part needs to reach a reasonable range, and the maximum physiological equivalent temperature PET should be selected. Through the multi-factor coupling model established above, the simulation data is optimized and predicted. When all factors are within the range, and PET is the largest, the plane shape of the opening is 4 sides, the aspect ratio of the opening is 2.999, the depth of the opening is 2.2 m, and the height of the opening baffle is 0.006 m. In this case, the physiologically equivalent temperature PET of the outdoor part of the entrance and exit of the open underground public space in winter is 6.441 °C. According to the practical situation, the plane shape of the opening is 4 sides, the aspect ratio of the opening is 3, the depth of the opening is 2.2, the height of the opening baffle is 0m, and the model is simulated again. Finally, the PET of the outdoor part of the open entrance and exit in winter is 6.4 ± 0.2 °C, which is close to the predicted value of the model, indicating that the model can be used to optimize the shape design of the open underground public space entrance and exit in winter.

4.2.3. Combine Summer and Winter

In order to meet the most suitable physiological equivalent temperature PET in both winter and summer, the four single-factor variables of the opening plane shape, opening aspect ratio, opening depth, and opening baffle height cannot be agreed upon. Combined with the relationship model established in summer and winter, when the physiologically equivalent temperature PET in the two seasons is in the most suitable condition, the plane shape of the opening is 5.330 sides, the opening aspect ratio is 2.959, the opening depth is 5.1 m, and the opening baffle height is 0m. In this case, the physiologically equivalent temperature PET of the outdoor part of the entrance and exit in summer is 40.817 °C, and the physiologically equivalent temperature PET of the outdoor part of the entrance and exit in winter is 5.924 °C. According to the actual situation, the plane shape of the opening is 5 sides, the aspect ratio of the opening is 3, the depth of the opening is 5.1 m, the height of the opening baffle is 0m, and the model is simulated again. Finally, the PET of the outdoor part of the entrance and exit in summer is 40.8 ± 0.2 °C, and the breeze wind speed is 0.354 ± 0.02 m/s. The PET of the outdoor part of the entrance and exit in winter is 5.9 ± 0.2 °C, and the breeze wind speed is 0.152 ± 0.02 m/s, which is close to the predicted value of the model. The average wind speed ratio in summer is 0.4, and the average wind speed ratio in winter is 0.1, which is within the range of 0.1–1.2, meeting the specification “Standard for Wind Tunnel Experiment Method of Construction Engineering”, and can achieve a better wind environment comfort. At this time, it is the optimal design target for the open underground public space entrance and exit form.
The four factors influencing the PET value in summer are the plane shape of the opening, the ratio of length to width of the opening, the depth of the opening, and the height of the baffle. The order of influence in winter is opening length-width ratio > opening plane shape > opening baffle height > opening depth. In summer and winter, single-factor opening plane shape and opening aspect ratio have the most obvious influence on the outdoor PET value of the entrance and exit, while the other two factors have little influence. The interaction relationship between A, B, C, and D has almost no influence on the outdoor PET value of the entrance and exit.
The regression model of the spatial morphological characteristics of the open inlet and outlet in summer and winter and the physiologically equivalent temperature PET is established. The specific relationship equation is as follows.
In the formula:
Y = 40.95 0.28 A 0.18 B 0.058 C 8.33 10 3 D
Y = 4.66 0.62 A + B 0.033 C 0.13 D
  • Y—PET
  • A—Open plane shape
  • B—Opening aspect ratio
  • C—Opening depth
  • D—Open baffle height

5. Conclusions

This study first measured the wind and thermal environment characteristics of typical open underground public space entrances and exits in Xuzhou city, then sorted out the basic spatial form characteristics of open underground public space entrances and exits through investigation, and finally explored the relationship between the spatial form of underground public space entrances and exits, wind and thermal environment and human comfort. The research shows the following:
  • The air temperature, black globe temperature, and physiological equivalent temperature PET values of the outdoor part of the entrance and exit of the underground public space in summer are higher than those of the transition part and indoor part of the entrance and exit space of the entire underground public space, and the relative humidity is lower than the other two parts; In winter, the air temperature, black globe temperature and physiologically equivalent temperature PET values of the outdoor part are lower than the transition part, and the indoor part of the whole underground public space entrance and exit space, and the relative humidity is higher than the other two parts.
  • There are four main quantitative spatial form elements of the entrance and exit of Xuzhou open underground public space: the plane shape of the opening, the aspect ratio of the opening, the depth of the opening, and the height of the baffle at the opening.
  • In Xuzhou and other cold areas of Jiangsu Province, the human thermal comfort of the open entrance is most affected by the plane shape of the opening, followed by the aspect ratio of the opening, while the influence of the depth of the opening and the height of the baffle at the opening can be ignored.
  • The relationship model between the spatial form of open underground public space and physiological equivalent temperature PET in cold regions of Jiangsu, such as Xuzhou, was established, respectively, in summer and winter. The planar shape of the opening and the length-width ratio of the opening is linear with the physiologically equivalent temperature.
Generally speaking, in cold areas, the shape design of underground public space entrances and exits greatly affects the thermal comfort of the human body. The relationship between each factor and thermal comfort is not simply a single variable relationship. On the contrary, human thermal comfort and multiple spatial morphologic variables interact. In addition, when seeking the optimal physiological equivalent temperature in summer and winter, the changing trend of some spatial form elements with great influence is not consistent. Therefore, when designing for the human comfort of the entrance and exit, the situation of summer and winter should be considered comprehensively. Architects should mainly focus on the physical environment data and human comfort of the outdoor part when designing. In the design of spatial form, more attention should be paid to the opening plane shape and the opening length-width ratio.
This study still has some limitations. On the one hand, we cannot guarantee that all parameters of the simulation are exactly the same as reality. The effects of equipment and pedestrians were not considered. On the other hand, we only built a limited number of 25 sets of experimental models for simulation. There is a certain bias in modeling the mathematical relationship with the results of this simulation. Therefore, in our future work we will consider more factors comprehensively and use more data results for analysis and generalization. Currently, underground space is developing rapidly. In addition to open entrances and exits, there are separate foyers and sunken plaza entrances and exits. Their physical environment and human comfort are also future research directions.

Author Contributions

Conceptualization, H.L. and L.N.; methodology, H.L.; software, H.L.; validation, H.L., J.K., P.C. and L.N.; formal analysis, P.C. and H.L.; investigation, H.L., P.C. and L.N.; resources, P.C.; data curation, J.K.; writing—original draft preparation, H.L.; writing—review and editing, P.C. and J.K.; visualization, H.L., P.C. and J.K.; supervision, P.C.; project administration, J.K.; funding acquisition, J.K. All authors have read and agreed to the published version of the manuscript.

Funding

Multi-factor coupling mechanism and regulation method of heat and humid environment in underground atrium space of the National Natural Science Foundation of China, grant number 51778611, Jiangsu Social Science Foundation Provincial City Collaboration Project: Research on Huai’an Village Residential Model and Renewal Strategies Based on Rural Revitalization, grant number 22XZB020 and the Assistance Program for Future Outstanding Talents of China University of Mining and Technology Research on the Optimal Design of Wind Environment at the Entrance and Exit of Underground Public Space—Taking Xuzhou City as an Example, grant number 2022WLJCRCZL314.

Data Availability Statement

The data presented in this study are available on request from the corresponding author. The data are not publicly available due to the large amount of data, it is inconvenient to upload.

Acknowledgments

We would like to express our gratitude to those who helped us while writing this article. Our most profound appreciation goes to Ji Xiang, from the China University of Mining and Technology in China, for his encouragement and inspiration.

Conflicts of Interest

The authors declare no conflicts of interest.

Appendix A

PET: Physiological Equivalent Temperature. It is an indicator of thermal comfort. It is defined as the temperature at which the human skin and body temperatures in an indoor or outdoor environment reach a thermal state equivalent to that of a typical indoor environment.
Air temperature (°C): The physical quantity of how hot or cold the air is called the air temperature.
Black globe temperature (°C): Indicates the actual sensory temperature expressed in terms of temperature when a person or object in a radiant heat environment is subjected to the combined effects of radiant heat and convective heat.
Relative humidity (%): Refers to the water vapor pressure in air as a percentage of the saturated water vapor pressure at the same temperature.
Breeze speed (m/s): Rate of airflow.
RSM: Response Surface Method. This method is a statistical method that uses reasonable experimental design methods and obtains certain data through experiments, adopts multiple quadratic regression equations to fit the functional relationship between factors and response values, and seeks the optimal parameters through the analysis of regression equations to solve the multivariable problem.
Opening aspect ratio: It means the ratio of the lengths of the long and short axes of an open plane. Opening aspect ratio = b/a (Figure A1).
Open plane shape: It means the number of sides that is the shape of the open plane (Figure A2).
Opening orientation: It means the angle between the normal to the long axis of the open plane and the direction due to the south.
Opening depth: It means the vertical distance of the opening from the level at which it is located, below that elevation, to the next stabilizing level (Figure A3).
Open baffle height: It means the height of the baffle at the opening (Figure A4).
Figure A1. Opening aspect ratio.
Buildings 14 00554 g0a1
Figure A2. Open plane shape.
Buildings 14 00554 g0a2
Figure A3. Opening depth.
Buildings 14 00554 g0a3
Figure A4. Open baffle height.
Buildings 14 00554 g0a4

References

  1. Cao, S.; Leng, J.; Qi, D.; Kumar, P.; Chen, T. Sustainable underground spaces: Design, environmental control and energy conservation. Energy Build. 2022, 257, 111779. [Google Scholar] [CrossRef]
  2. Peng, Y.; Liu, H.; Wang, Z.; Fu, J.; Zhang, H.; Wang, J.; Yang, Q. Development of urban underground space in coastal cities in China: A review. Deep. Undergr. Sci. Eng. 2023, 2, 148–172. [Google Scholar] [CrossRef]
  3. Besner, J. Cities Think Underground—Underground Space (also) for People. Procedia Eng. 2017, 209, 49–55. [Google Scholar] [CrossRef]
  4. Hwang, S.; Park, W.M. Radon and PM10 concentrations in underground parking lots and subway stations with health risks in South Korea. Environ. Sci. Pollut. Res. 2018, 25, 35242–35248. [Google Scholar] [CrossRef]
  5. Xueyuan, H.; Yu, S. The urban underground space environment and human performance. Tunn. Under-Ground Space Technol. 1988, 3, 193–200. [Google Scholar] [CrossRef]
  6. Shafiei Fini, A.; Moosavi, A. Effects of “wall angularity of atrium” on “buildings natural ventilation and thermal performance” and CFD model. Energy Build. 2016, 121, 265–283. [Google Scholar] [CrossRef]
  7. Vaccarini, M.; Giretti, A.; Tolve, L.C.; Casals, M. Model predictive energy control of ventilation for underground stations. Energy Build. 2016, 116, 326–340. [Google Scholar] [CrossRef]
  8. Samant, S. Atrium and its adjoining spaces: A study of the influence of atrium façade design. Archit. Sci. Rev. 2011, 54, 316–328. [Google Scholar] [CrossRef]
  9. Liang, X.; Lu, Z.; Ye, F.; Zhang, W. Investigation of design of independent metro station entrances in China. Proc. Inst. Civ. Eng.—Munic. Eng. 2023, 176, 10–31. [Google Scholar] [CrossRef]
  10. Afshin, M.; Sohankar, A.; Manshadi, M.D.; Esfeh, M.K. An experimental study on the evaluation of natural ventilation performance of a two-sided wind-catcher for various wind angles. Renew. Energy 2016, 85, 1068–1078. [Google Scholar] [CrossRef]
  11. Choi, C.; Morita, M. Characteristics of Universal Design Environmental Installation in Subways’ Exits and Entrances in Osaka City (1). Des. Stud. 2002, 49, 19–28. [Google Scholar] [CrossRef]
  12. Chen, T.; Cao, S.; Wang, J.; Nizamani, A.G.; Feng, Z.; Kumar, P. Influences of the optimized air curtain at subway entrance to reduce the ingress of outdoor airborne particles. Energy Build. 2021, 244, 111028. [Google Scholar] [CrossRef]
  13. Li, G.; Han, C.; Shen, J.; Wang, X.; Gu, T.; Yang, Z.; Zhang, L. A Demographic Characteristics-Based Study on the Visual Impact Assessment of the External Form of Entrance Pavilions to the Underground Stations of China’s Subway. Appl. Sci. 2023, 13, 4030. [Google Scholar] [CrossRef]
  14. Han, G.; Wen, Y.; Leng, J.; Sun, L. Improving Comfort and Health: Green Retrofit Designs for Sunken Courtyards during the Summer Period in a Subtropical Climate. Buildings 2021, 11, 413. [Google Scholar] [CrossRef]
  15. Guo, H.; Deng, M.; Li, Y. Influence of sunken plaza on ventilation performance of underground commercial space. J. South China Univ. Technol. (Nat. Sci. Ed.) 2014, 42, 114–120. [Google Scholar]
  16. Liu, Y.; Hu, Y.; Xiao, Y.; Chen, J.; Huang, H. Effects of different types of entrances on natural ventilation in a subway station. Tunn. Undergr. Space Technol. 2020, 105, 103578. [Google Scholar] [CrossRef]
  17. Guan, B.; Zhang, T.; Liu, X. Performance investigation of outdoor air supply and indoor environment related to energy consumption in two subway stations. Sustain. Cities Soc. 2018, 41, 513–524. [Google Scholar] [CrossRef]
  18. Simpson, T.W.; Peplinski, J.D.; Koch, P.N.; Allen, J.K. Metamodels for Computer-based Engineering Design: Survey and recommendations. Eng. Comput. 2001, 17, 129–150. [Google Scholar] [CrossRef]
  19. Shen, X.; Zhang, G.; Bjerg, B. Assessments of experimental designs in response surface modelling process: Estimating ventilation rate in naturally ventilated livestock buildings. Energy Build. 2013, 62, 570–580. [Google Scholar] [CrossRef]
  20. Geyer, P.; Schlüter, A. Automated metamodel generation for Design Space Exploration and decision-making—A novel method supporting performance-oriented building design and retrofitting. Appl. Energy 2014, 119, 537–556. [Google Scholar] [CrossRef]
  21. Yu, F.; Leng, J. Multivariable interactions in simulation-based energy-saving glass roof designs. Sol. Energy 2020, 201, 760–772. [Google Scholar] [CrossRef]
  22. Norton, T.; Grant, J.; Fallon, R.; Sun, D. Optimising the ventilation configuration of naturally ventilated livestock buildings for improved indoor environmental homogeneity. Build. Environ. 2010, 45, 983–995. [Google Scholar] [CrossRef]
  23. Shen, X.; Zhang, G.; Bjerg, B. Investigation of response surface methodology for modelling ventilation rate of a naturally ventilated building. Build. Environ. 2012, 54, 174–185. [Google Scholar] [CrossRef]
  24. Zhou, L.; Haghighat, F. Optimization of ventilation system design and operation in office environment, Part I: Methodology. Build. Environ. 2009, 44, 651–656. [Google Scholar] [CrossRef]
  25. Chen, H.; Moshfegh, B.; Cehlin, M. Computational investigation on the factors influencing thermal comfort for impinging jet ventilation. Build. Environ. 2013, 66, 29–41. [Google Scholar] [CrossRef]
  26. Cetin, K.S.; Manuel, L.; Novoselac, A. Thermal comfort evaluation for mechanically conditioned buildings using response surfaces in an uncertainty analysis framework. Sci. Technol. Built Environ. 2016, 22, 140–152. [Google Scholar] [CrossRef]
  27. Cetin, K.S.; Manuel, L.; Novoselac, A. Effect of technology-enabled time-of-use energy pricing on thermal comfort and energy use in mechanically-conditioned residential buildings in cooling dominated climates. Build. Environ. 2016, 96, 118–130. [Google Scholar] [CrossRef]
  28. Zhou, H.; Tao, G.; Nie, Y.; Yan, X.; Sun, J. Outdoor thermal environment on road and its influencing factors in hot, humid weather: A case study in Xuzhou City, China. Build. Environ. 2022, 207, 108460. [Google Scholar] [CrossRef]
  29. Liu, H.; Liu, X.; Nie, L.; Hong, X.; Ji, X. Research Progress of Urban Wind and Thermal Environment Based on CiteSpace and China National Knowledge Infrastructure Database. Sustainability 2022, 14, 13108. [Google Scholar] [CrossRef]
  30. Medeiros, B.; Clement, A.C.; Benedict, J.J.; Zhang, B. Investigating the impact of cloud-radiative feedbacks on tropical precipitation extremes. npj Clim. Atmos. Sci. 2021, 4, 18. [Google Scholar] [CrossRef]
  31. Liu, X. Research on Thermal Comfort Optimization of Subway Entrance Transition Space Based on Measured and Simulat-Ed.; China University of Mining and Technology: Beijing, China, 2022. [Google Scholar] [CrossRef]
  32. Liu, Q.; Liu, B.T. Sustainable Urban Revitalization in Historic Districts: A Case Study of Huilongwo Area in Xuzhou. Adv. Mater. Res. 2014, 919–921, 1567–1572. [Google Scholar] [CrossRef]
  33. Cheng, J.; Cai, C.S.; Xiao, R.-C. Probabilistic shear-lag analysis of structures using Systematic RSM. Struct. Eng. Mech. 2005, 21, 507–518. [Google Scholar] [CrossRef]
  34. Ge, Y. Experimental Design Method and Design-Expert Software Application; Harbin Institute of Technology Press: Harbin, China, 2015. [Google Scholar]
  35. Kuznik, F.; Brau, J.; Rusaouen, G. A RSM Model for the Prediction of Heat and Mass Transfer in a Ventilated Room. In Proceedings of the Building Simulation 2007, Beijing, China, 3–6 September 2007. [Google Scholar]
  36. Gao, X.; Wang, S.; Wang, P. The evaluation method of PID controller parameter tuning based on Fluent. In Proceedings of the 27th Chinese Control and Decision Conference (2015 CCDC), Qingdao, China, 23–25 May 2015; pp. 4850–4854. [Google Scholar]
  37. Li, L.; Zhang, L.J.; Zhang, N.; Hu, F.; Jiang, Y.; Xuan, C.Y.; Jiang, W.M. Study on the micro-scale simulation of wind field over complex terrain by rams/fluent modeling system. Wind Struct. Int. J. 2010, 13, 519–528. [Google Scholar] [CrossRef]
  38. Zhang, T. Study on Coupling of Wind Environment and Spatial Morphology in Urban Central Area. Master’s Thesis, Southeast University, Nanjing, China, 2015. [Google Scholar]
  39. Han, J.; Liao, L.; Zhang, G. Review and trend prospect of the development process of China’s green building evaluation standard system. Constr. Sci. Technol. 2017, 10–13. [Google Scholar] [CrossRef]
  40. Lee, H.; Mayer, H. Validation of the mean radiant temperature simulated by the RayMan software in urban environments. Int. J. Biometeorol. 2016, 60, 1775–1785. [Google Scholar] [CrossRef]
  41. Uddin, A.; Khan, M.K.; Campean, F. Function-Based Conceptual Design Expert (CDE) Systems: Development Trend and Gaps Identification. Appl. Mech. Mater. 2014, 564, 590–596. [Google Scholar] [CrossRef]
  42. Ozili, P.K. The Acceptable R-Square in Empirical Modelling for Social Science Research. SSRN Electron. J. 2022. [Google Scholar] [CrossRef]
  43. Zhang, Y.; Li, X. Numerical analysis on the condenser inlet air temperature of train-mounted air conditioner when a train stops in subway station tunnel. Sustain. Cities Soc. 2021, 69, 102793. [Google Scholar] [CrossRef]
  44. Wang, C.; Li, X. Measurement-based investigation of subway station tunnel thermal environment. J. Build. Eng. 2022, 57, 104757. [Google Scholar] [CrossRef]
  45. Wu, L. Research on the Influence Mechanism and Evaluation of Built Environment Characteristics on the Design of Subway Station Transfer Space. Ph.D. Thesis, Beijing Jiaotong University, Beijing, China, 2021. [Google Scholar] [CrossRef]
Figure 1. Research framework of influence of entrance and exit shape on wind and thermal environment.
Buildings 14 00554 g001
Figure 2. Open entrance and exit measured point arrangement.
Buildings 14 00554 g002
Figure 3. The basic process of numerical simulation of the urban wind-heat environment.
Buildings 14 00554 g003
Figure 4. Analysis of air temperature, black ball temperature, relative humidity and breeze velocity in the whole process of summer condition 1 and condition 2.
Buildings 14 00554 g004aBuildings 14 00554 g004b
Figure 5. Analysis of the change of physiological equivalent temperature PET value with time in summer conditions 1 and 2.
Buildings 14 00554 g005
Figure 6. Analysis of air temperature, black ball temperature, relative humidity and breeze velocity in the whole process of winter condition 1 and condition 2.
Buildings 14 00554 g006aBuildings 14 00554 g006b
Figure 7. Analysis of the change of physiological equivalent temperature PET value with time in winter conditions 1 and 2.
Buildings 14 00554 g007
Figure 8. Simplified model of Exit 5 of Pengcheng Square Station on Xuzhou Metro Line 1.
Buildings 14 00554 g008
Figure 9. Correlation analysis of measured and simulated air temperature.
Buildings 14 00554 g009
Figure 10. Correlation analysis of measured and simulated breeze speed.
Buildings 14 00554 g010
Figure 11. Correlation analysis between measured and simulated PET.
Buildings 14 00554 g011aBuildings 14 00554 g011b
Figure 12. Importance of factors for open entrances and exits in summer.
Buildings 14 00554 g012
Figure 13. The influence of single factor on the open entrance and exit relationship in summer.
Buildings 14 00554 g013
Figure 14. Importance of factors for open entrances and exits in winter.
Buildings 14 00554 g014
Figure 15. The influence of single factor on the open entrance and exit relationship.
Buildings 14 00554 g015aBuildings 14 00554 g015b
Table 1. Open underground public space entrances and exits.
Research SiteLocationSite PhotoProfile Prototype
Research site 1Xuzhou Metro Line 1 Pengcheng Square Station, Exit 5Buildings 14 00554 i001Buildings 14 00554 i002
Research site 2Xuzhou Metro Line 1 Pengcheng Square Station, Exit 19Buildings 14 00554 i003Buildings 14 00554 i004
Research site 3Xuzhou city center fashion Avenue and underground walkway north entranceBuildings 14 00554 i005Buildings 14 00554 i006
Research site 4Xuzhou Suning Plaza B1 south entranceBuildings 14 00554 i007Buildings 14 00554 i008
Research site 5Sanpower Square hi Street underground food street southwest entranceBuildings 14 00554 i009Buildings 14 00554 i010
Research site 6Sanpower Square hi Street underground food street north entranceBuildings 14 00554 i011Buildings 14 00554 i012
Research site 7Xuzhou Metro Line 1 Pengcheng Square Station, Exit 18Buildings 14 00554 i013Buildings 14 00554 i014
Research site 8Xuzhou underground city site Museum north exitBuildings 14 00554 i015Buildings 14 00554 i016
Research site 9Xuzhou City wall Museum east entranceBuildings 14 00554 i017Buildings 14 00554 i018
Research site 10Xuzhou mineral west food cityBuildings 14 00554 i019Buildings 14 00554 i020
Table 2. Environmental physical parameters in each stage of summer conditions 1 and 2.
Working condition 1LocationIndexMean ValueStandard DeviationMaximum ValueMinimum Value
Outdoor partAir temperature (°C)35.490.0735.5935.31
Black globe temperature (°C)35.950.0736.0635.81
Relative humidity (%)59.481.1261.3358.06
Breeze speed (m/s)1.110.874.030.22
Transition partAir temperature (°C)33.270.3533.7232.49
Black globe temperature (°C)33.680.2834.1333.25
Relative humidity (%)65.781.0667.7363.63
Breeze speed (m/s)0.180.120.530.00
Interior partAir temperature (°C)29.050.2829.8028.60
Black globe temperature (°C)29.470.5230.9029.00
Relative humidity (%)75.291.5678.1071.60
Breeze speed (m/s)0.910.291.650.46
Working condition 2LocationIndexMean ValueStandard DeviationMaximum ValueMinimum Value
Outdoor partAir temperature (°C)34.440.0534.5434.36
Black globe temperature (°C)34.530.0434.6334.44
Relative humidity (%)63.011.1164.3658.63
Breeze speed (m/s)0.240.040.530.10
Transition partAir temperature (°C)32.640.2133.0632.40
Black globe temperature (°C)32.940.2633.4432.63
Relative humidity (%)51.610.3452.6351.05
Breeze speed (m/s)0.180.573.110.01
Interior partAir temperature (°C)30.920.2531.4030.60
Black globe temperature (°C)31.180.3331.9030.80
Relative humidity (%)52.470.3153.0051.90
Breeze speed (m/s)0.240.100.630.12
Table 3. Environmental, physical parameters in each stage of winter conditions 1 and 2.
Working condition 1LocationIndexMean ValueStandard DeviationMaximum ValueMinimum Value
Outdoor partAir temperature (°C)5.18 0.08 5.30 5.10
Black globe temperature (°C)5.97 0.07 6.10 5.90
Relative humidity (%)30.14 0.26 30.70 29.70
Breeze speed (m/s)0.79 0.41 1.81 0.34
Transition partAir temperature (°C)9.46 0.26 9.70 9.00
Black globe temperature (°C)9.43 0.41 9.90 8.60
Relative humidity (%)33.12 1.47 34.80 30.60
Breeze speed (m/s)0.19 0.06 0.35 0.12
Interior partAir temperature (°C)10.39 0.19 10.70 10.00
Black globe temperature (°C)10.46 0.27 10.80 10.00
Relative humidity (%)33.28 0.62 34.20 32.30
Breeze speed (m/s)0.36 0.05 0.48 0.28
Working condition 2LocationIndexMean ValueStandard DeviationMaximum ValueMinimum Value
Outdoor partAir temperature (°C)6.30 0.09 6.40 6.10
Black globe temperature (°C)7.20 0.09 7.30 7.10
Relative humidity (%)28.07 0.11 28.30 27.90
Breeze speed (m/s)1.45 1.01 3.66 0.30
Transition partAir temperature (°C)7.63 0.13 7.80 7.40
Black globe temperature (°C)8.28 0.18 8.60 8.00
Relative humidity (%)24.89 0.19 25.20 24.70
Breeze speed (m/s)0.53 0.25 1.26 0.21
Interior partAir temperature (°C)8.61 0.04 8.70 8.50
Black globe temperature (°C)9.04 0.05 9.10 9.00
Relative humidity (%)23.36 0.08 23.50 23.20
Breeze speed (m/s)0.66 0.18 1.18 0.39
Table 4. Simulate air temperature cloud chart.
DateAir Temperature Cloud MapWind Speed Cloud Picture
8.20Buildings 14 00554 i021Buildings 14 00554 i022
8.21Buildings 14 00554 i023Buildings 14 00554 i024
8.22Buildings 14 00554 i025Buildings 14 00554 i026
8.23Buildings 14 00554 i027Buildings 14 00554 i028
8.24Buildings 14 00554 i029Buildings 14 00554 i030
8.25Buildings 14 00554 i031Buildings 14 00554 i032
8.26Buildings 14 00554 i033Buildings 14 00554 i034
Table 5. Open underground public space entrance space form factor index.
SortSpatial Form Index NameUnitsData NatureData Source and Method of Determination
Import and export indexPlanar formOpening aspect ratio QuantificationField investigation
Open plane shape QuantificationField investigation
Opening orientation CategorizationField investigation
Profile formOpening depthMQuantificationField investigation
Open baffle heightMQuantificationField investigation
Table 6. Selection of boundary range of each element of open underground public space entrance and exit space form.
NameUnitsMinimum ValueMaximum Value
Open plane shapeedge48
Opening aspect ratio 13
Opening depthm2.25.1
Open baffle heightm03
Table 7. 25 groups of experimental models of open underground public space entrance and exit conditions.
Serial NumberOpen Plane Shape (Edge)Opening Aspect RatioOpening Depth (m)Open Baffle Height (m)
1413.651.5
2422.21.5
3423.653
4425.11.5
5423.650
6433.651.5
7615.11.5
8612.21.5
9613.653
10613.650
11625.13
12622.20
13625.10
14622.23
15623.651.5
16633.653
17635.11.5
18632.21.5
19633.650
20813.651.5
21825.11.5
22823.653
23823.650
24822.21.5
25833.651.5
Table 8. Correlation analysis table of quantitative spatial morphology index with wind speed, temperature, and PET value in summer.
NumberHorizontal FactorResponse Value
Open Plane Shape (Number of Plane Edges)Opening Aspect RatioOpening Depth (m)Open Baffle Height (m)PET (°C)Temperature (°C)Wind Speed (m/s)
ABCD
1413.651.541.735.11 0.12
2422.21.541.435.11 0.18
3423.65341.435.13 0.20
4425.11.541.135.03 0.28
5423.65041.235.13 0.26
6433.651.540.934.98 0.44
7615.11.541.334.66 0.10
8612.21.541.434.07 0.03
9613.65340.835.28 0.61
10613.65040.734.95 0.52
11623.651.540.934.82 0.31
12625.1340.934.80 0.31
13622.2041.134.97 0.27
14625.1041.334.95 0.25
15623.651.540.735.00 0.32
16623.651.541.234.47 0.29
17623.651.54134.24 0.28
18622.234134.89 0.30
19623.651.540.535.25 0.33
20633.65340.834.74 0.30
21635.11.540.333.64 0.40
22632.21.540.834.52 0.16
23633.65040.834.73 0.28
24813.651.540.733.90 0.22
25825.11.540.635.92 1.51
26823.65340.935.07 0.30
27823.65040.834.54 0.25
28822.21.540.535.33 0.87
29833.651.540.834.71 0.27
Table 9. Regression model analysis of variance in summer.
Source Sum of SquaresdfMean SquareF Valuep ValueSignificance
Model1.4140.355.770.0021**
A0.9610.9615.790.0006**
B0.4010.406.610.0168*
C0.04110.0410.670.4213
D8.333 × 10−418.333 × 10−40.0140.9079
Residual1.46240.061
Lack of fit1.17200.0590.800.6762
Pure error0.2940.073
Cor Total2.8728
R20.4903
R2Adj0.4053
R2Pred0.2582
Note: * was significant difference (p < 0.05); ** was very significant difference (p < 0.01).
Table 10. Correlation analysis table of quantitative spatial morphology index with wind speed, temperature, and PET value in winter.
NumberHorizontal FactorResponse Value
Open Plane Shape (Number of Plane Edges)Opening Aspect RatioOpening Depth (m)Open Baffle Height (m)PET (°C)Temperature (°C)Wind Speed (m/s)
ABCD
1413.651.54.86.75 0.15
2422.21.55.46.76 0.23
3423.6534.86.77 0.26
4425.11.55.46.81 0.24
5423.6504.86.76 0.26
6433.651.57.86.60 0.04
7615.11.53.16.42 0.80
8612.21.53.26.44 1.38
9613.65336.32 1.31
10613.6503.26.32 0.63
11623.651.54.46.91 0.31
12625.134.96.91 0.33
13622.204.86.84 0.26
14625.104.86.84 0.25
15623.651.54.96.91 0.33
16623.651.55.16.91 0.33
17623.651.55.26.91 0.33
18622.234.96.88 0.30
19623.651.54.66.91 0.33
20633.6534.96.95 0.32
21635.11.556.96 0.32
22632.21.55.57.01 0.20
23633.65056.95 0.30
24813.651.53.96.80 0.18
25825.11.53.46.30 0.74
26823.6534.37.13 0.11
27823.6505.87.31 0.15
28822.21.53.26.39 1.30
29833.651.556.97 0.27
Table 11. Regression model analysis of variance in winter.
Source Sum of SquaresdfMean SquareF Valuep ValueSignificance
Model16.7944.208.930.0001**
A4.5614.569.710.0047**
B12.00112.0025.53<0.0001*
C0.01310.0130.0280.8677
D0.2110.210.450.5069
Residual11.28240.47
Lack of fit10.83200.544.790.0694
Pure error0.4540.11
Cor Total28.0728
R20.5981
R2Adj0.5312
R2Pred0.3811
Note: * was significant difference (p < 0.05); ** was very significant difference (p < 0.01).
Disclaimer/Publisher’s Note: The statements, opinions and data contained in all publications are solely those of the individual author(s) and contributor(s) and not of MDPI and/or the editor(s). MDPI and/or the editor(s) disclaim responsibility for any injury to people or property resulting from any ideas, methods, instructions or products referred to in the content.

