Article

Formulation of Separation Distance to Mitigate Wind-Induced Pounding of Tall Buildings

1
Department of Civil Engineering, Faculty of Engineering, Lakehead University, Thunder Bay, ON P7B 5E1, Canada
2
Department of Civil and Environmental Engineering, United Arab Emirates University, Abu Dhabi 15551, United Arab Emirates
*
Author to whom correspondence should be addressed.
Buildings 2024, 14(2), 479; https://doi.org/10.3390/buildings14020479
Submission received: 8 January 2024 / Revised: 1 February 2024 / Accepted: 5 February 2024 / Published: 8 February 2024

Abstract

:
Structures in proximity subjected to a substantial lateral load (e.g., wind and earthquakes) can lead to a significant hazard known as structural pounding. If not properly mitigated, such impacts can lead to local and global damage (i.e., structural failure). Mitigation approaches can include providing a suitable separation gap distance between structures, installing adequate shock absorbers, or designing the structure for the additional pounding impact loads. Wind-induced pounding of structures can be of higher risk to buildings due to large deflections developed during wind events. The current study develops various mathematical formulas to determine the suitable separation distance between structures in proximity to avoid pounding. The developed procedure relies first on wind-load evaluations using Large Eddy Simulation (LES) models. Then, the extracted wind loads from the LES are applied to finite element method models to determine the building deflections. Various building heights, wind velocities, and flexibility levels are examined to prepare a training database for developing the mathematical formulas. A genetic algorithm is utilised to correlate the required separation gap distance to the varying parameters of the tall buildings. It was found that more complex formulas can achieve better mapping to the training database.

1. Introduction

Buildings are constructed within dense metropolitan locations, ultimately in proximity to surrounding structures due to limited available land space and the increase in population. With the design of new, tall, and slender buildings, the term pounding has become an important objective when a structure is built within proximity. Pounding of structures has been defined by past scholars [1,2,3,4,5] as the interaction between two or more adjacent structures in proximity, causing a collision resulting from a lateral load. Furthermore, pounding can increase in probability due to the structures in proximity conducting out-of-phase vibrating due to the difference in their dynamic properties (e.g., stiffness and mass) [6], which can occur during high-velocity wind events [7]. Pounding can be considered a major risk to tall structures; for instance, Rosenblueth and Meli [8] explored a historical earthquake event resulting in many structural pounding occurrences. They concluded that pounding damages can range from minor to major structural damages and to the extent of global structural failures. A method for reducing structural pounding can include dampers (e.g., friction dampers) [9]. Structural dampers can be adopted in the structures’ braced frames and shear walls, including low-rise structures to mitigate large deformations caused by earthquakes and wind [10,11,12,13,14]. Most recorded pounding events have been initiated during earthquake appearances due to the induced ground motion transferring to the structures [3,5,6,8,15,16,17,18]. Many historical structural pounding events have been identified and studied from past earthquakes (i.e., 1971 San Fernando earthquake [6], 1985 Mexico earthquake [8,19], 1988 Saguenay earthquake [20], 1989 Loma Prieta earthquake [3], 1991 Cairo earthquake [21], 2011 Christchurch earthquake [22,23]). A pounding occurrence can also be produced when the structures involved are subjected to extreme wind events [14,24]. Extensive literature reviews on structural pounding have been presented by Brown and Elshaer [14] and Miari et al. [25].
As tall structures are increasing in height, flexibility, and slenderness, buildings are becoming more sensitive to wind load [24,26,27], as wind is typically the governing load for the new generation of tall buildings [28,29,30,31,32]. It was also indicated that there is a need to lower the building weight to ultimately reduce the gravity loads to control the inertial forces from earthquake events. This further contributes to an enlargement in the wind-induced forces and motions, resulting in wind-induced loads and motions becoming the typically governed applied load for the design of the lateral-load-resisting systems in tall structures [29,30,33] compared to seismic loads, since the forces are inertial due to ground motion [34]. A further examination from Aly and Abburu [35] used tall structures under multi-hazard events (i.e., wind and earthquakes) with similarities in structural properties and geological location to compare the dynamic responses of the structure investigated (i.e., lateral deflection, inter-storey drift, acceleration). In comparison to an earthquake, the same structure under wind loading can develop a more considerable lateral deflection and inter-storey drift magnitudes within an exact geological location (e.g., eight times larger in lateral deflection and 2.5 times more prominent in inter-storey drifts). Smith and Coull [36] stated that such a lateral load could develop intensive structural sway and strong vibrations throughout the structure. Over time, it is becoming more challenging to meet the serviceability requirements (i.e., maintain an adequate lateral deflection or control the extensive vibrations on tall structures) compared to meeting the strength and capacity requirements within a structure [28,37,38,39]. Due to structural sway in tall buildings, lateral deflection can damage the non-structural elements (i.e., cladding and partition) and main structural components to the extent of damaging possible adjacent structures [34,40,41]. Large levels of deflection in tall structures can be mitigated appropriately through structural design measures or by introducing external deflection-mitigation systems (e.g., dampers) [13,42,43,44,45].
Thorough studies have been performed to improve safety precautions to avoid pounding risk. Such precautions evaluated and developed an adequate separation distance between possible pounding structures to prevent contact during potential extensive lateral-load occurrences [46,47,48,49,50,51,52,53]. Additionally, when designing and planning for newly constructed structures, pounding risk can be assessed for existing structures to avoid the occurrence of structural pounding. However, many pre-existing structures already in proximity have been built with an insufficient separation distance due to old design codes and previsions, leading to pounding damage [54,55]. The majority of structural building codes identify the requirements for building deflections. A limited selection of structural building codes fails to identify a required minimum separation distance for possible structures located in proximity during hazardous wind events. Alternatively, other mitigations can be justified to limit damages from structural pounding if insufficient or no separation distance between such adjacent structures can be enabled. Despite rigorous research from scholars relating to structural pounding, an adequate separation distance was not correlated to the adjacent structures’ dynamic properties or the lateral loads [56]. Such deflections depend on the structure’s height, modal period, and the applied lateral load. The applied lateral load (e.g., wind events) can lead to out-of-phase vibrations arising from the possible structural pounding.
Accordingly, this study aims to examine a case study of two structures in proximity with varying wind intensity, height, and flexibility. The primary objective of this study is to systematically assess the required minimum Separation Gap Distance (dg,min) necessary to mitigate the potential risks of damages and failures arising from wind-induced structural pounding. The novelty of this research lies in its comprehensive approach, incorporating computational fluid dynamic (CFD) simulations while altering the applied mean wind velocities to determine wind forces acting on two adjacent tall structures. The extracted wind forces are then applied to structures using finite element method (FEM) models to determine the developed deflections for the two adjacent structures. After that, the responses of each structure are then used to determine its lateral deflections while maintaining a large enough dg,min between structures not to conduct possible structural pounding. Finally, once results are conducted and recorded, a genetic algorithm (GA) is then utilised to formulate the most accurate mathematical formula for estimating the required dg,min based on the structural natural frequency, building heights, and the applied wind.
This study is divided into five major sections. The first section (current section) introduces the terms and components of structural pounding and the possible arising mitigations, along with the most relevant literature about structural pounding. Section 2 presents the adopted methodology used to generate the training data for the developed mathematical formula. Section 2.1 establishes the numerical Large Eddy Simulation (LES) produced in the adopted CFD wind analysis. To determine the structural response when subjected to wind loads, an FEM model is developed and validated in Section 2.2. In Section 2.3, a description of the developed mathematical formula is presented to determine an adequate dg,min. Wind forces are then collected and produced in an FEM model to determine the dynamic response of the adjacent structures based on their structural properties and applied mean wind velocities. These lateral results enabled the determination of lateral deflections of tall structures for various building heights, building flexibilities, and wind speeds, which are described in Section 3 (Results and Discussion). Section 4 correlates the lateral deflections using mathematical formulas to determine the sufficient minimum separation-gap distance (dg,min) for the building parameters controlling the lateral deflection. Lastly, Section 5 is presented to conclude the study’s findings.

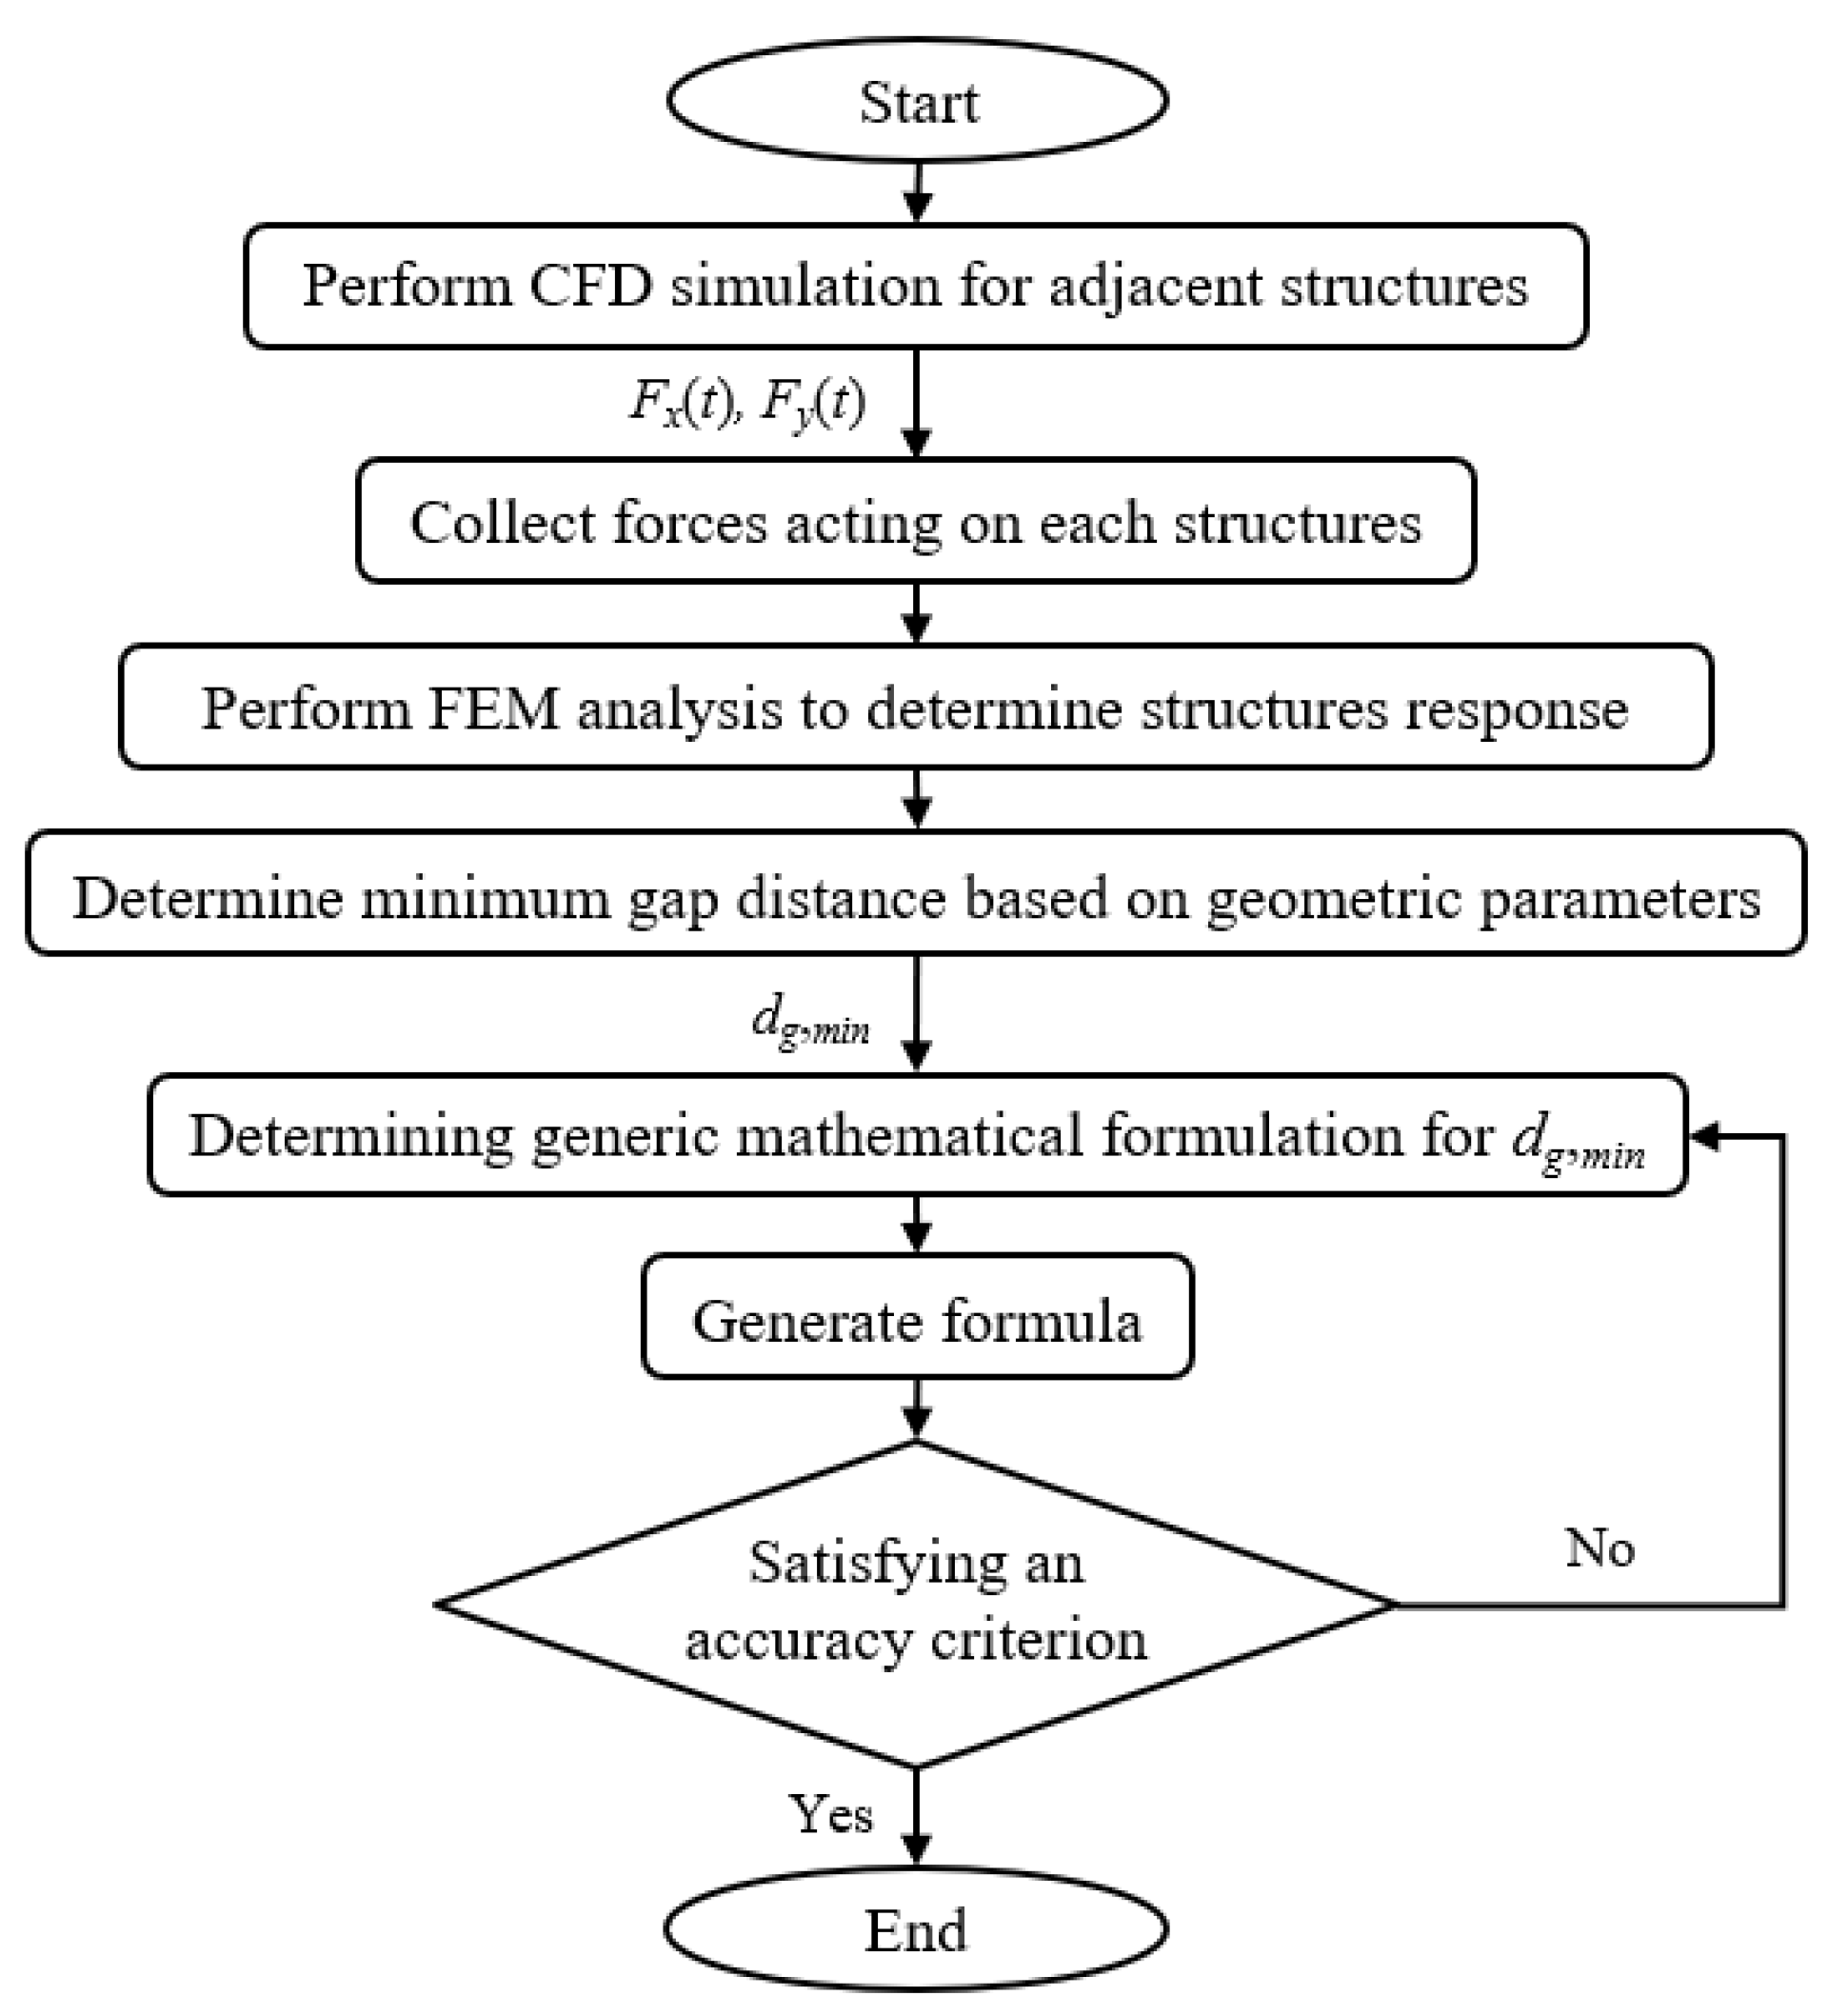
2. Mathematical Estimation for Required Minimum Separation-Gap Distance (dg,min)

The current study aims at deriving a mathematical formulation to determine the required minimum separation-gap distance (dg,min) between two tall adjacent structures, in proximity and subjected to wind, to avoid structural pounding. The adjacent structures will vary in height, natural frequencies, and applied wind loads. The study first conducts a series of LES to determine the applied wind forces acting on the adjacent two structures. Once all wind forces are evaluated, an FEM analysis is performed and validated to determine the dynamic responses of the simulated structures. The deflection time–histories for both adjacent structures are recorded throughout the applied wind. An adequate dg,min is determined where no structural pounding occurs. Once identified, the smallest dg,min is determined through FEM analysis based on the structure’s height, natural frequency, and applied mean wind velocity. These input values are used with a GA to formulate a reliable mathematical formula for determining an adequate dg,min between two structures in proximity. Figure 1 summarises the procedure for determining the required dg,min.

2.1. Extracting Wind-Load Time–History Using Computational Fluid Dynamics

In order to accurately model a required dg,min to avoid structural pounding between two adjacent tall structures in proximity, a numerical model must be precisely developed. A high-fidelity CFD model is generated while considering all required fluid properties and structural details. Some of the fluid properties include the density of air equal to 1.2929 kg/m3 and terrain exposure considered as urban, where the inflow generator, the boundary conditions, turbulence intensities, and turbulence length scales are discussed in the following section (Section 2.1.1), which are adopted from Aboshosha et al. [57] and Elshaer et al. [58]. The current study’s initial structure considered is the Commonwealth Advisory Aeronautical Research Council (CAARC) structure. The CAARC structure has been an optimal ongoing benchmark in many experimental and numerical wind-related studies [59,60]. The structural properties validated in the CFD model are considered as non-slip wall boundaries, with the model scaled height set to 456.2 mm, along with wind width at 76.2 mm, and across wind width of 114.3 mm. The structural properties utilised in the FEM analysis are described in Section 2.2.1, and adopted from Chan et al. [61] and Huang [62]. Once adequately modelled in the numerical FEM, various building heights are simulated (e.g., 180 m, 140 m, 100 m, and 60 m) while adjusting the sizes of the utilised steel sections (see Section 2.2) to maintain an accurate design according to the AISC steel code [38,62], for the purpose of determining the required dg,min.
As mentioned, the tallest height of 180 m was selected as it represents the benchmark model in both the CFD and FEM analysis. Steel properties are validated and utilised based on the CAARC structure. Moreover, the shortest structure height that was selected was 60 m, as this is the smallest height that is still considered dynamically sensitive to wind, as per the NBCC 2020 [63]. The remaining structural heights of 100 m and 140 m were then considered for a consistent increase in height intervals while not producing redundancy through little height change. The structure’s full-scale geometric shape is 180 m in height, 45 m in width, and 30 m in length. In the CFD simulation, all aerodynamic characteristics are adopted as per Elshaer et al. [58] (i.e., exposure, mean wind velocity, turbulent intensity, turbulent spectra, density of air, mesh discretization, computational domain). Then, the FEM analysis uses specific structural attributes in accordance with the studies of Chan et al. [61] and Huang [62] (i.e., structural dimensions, material properties, steel columns and beam sizes, damping ratio, density of steel, Young’s modulus, and Poison’s ratio). The most unfavourable incident wind direction is considered, acting on the longer side of the structures (i.e., zero wind angle of attack along the y-axis), which was considered in the dynamic response from past studies [61,62].

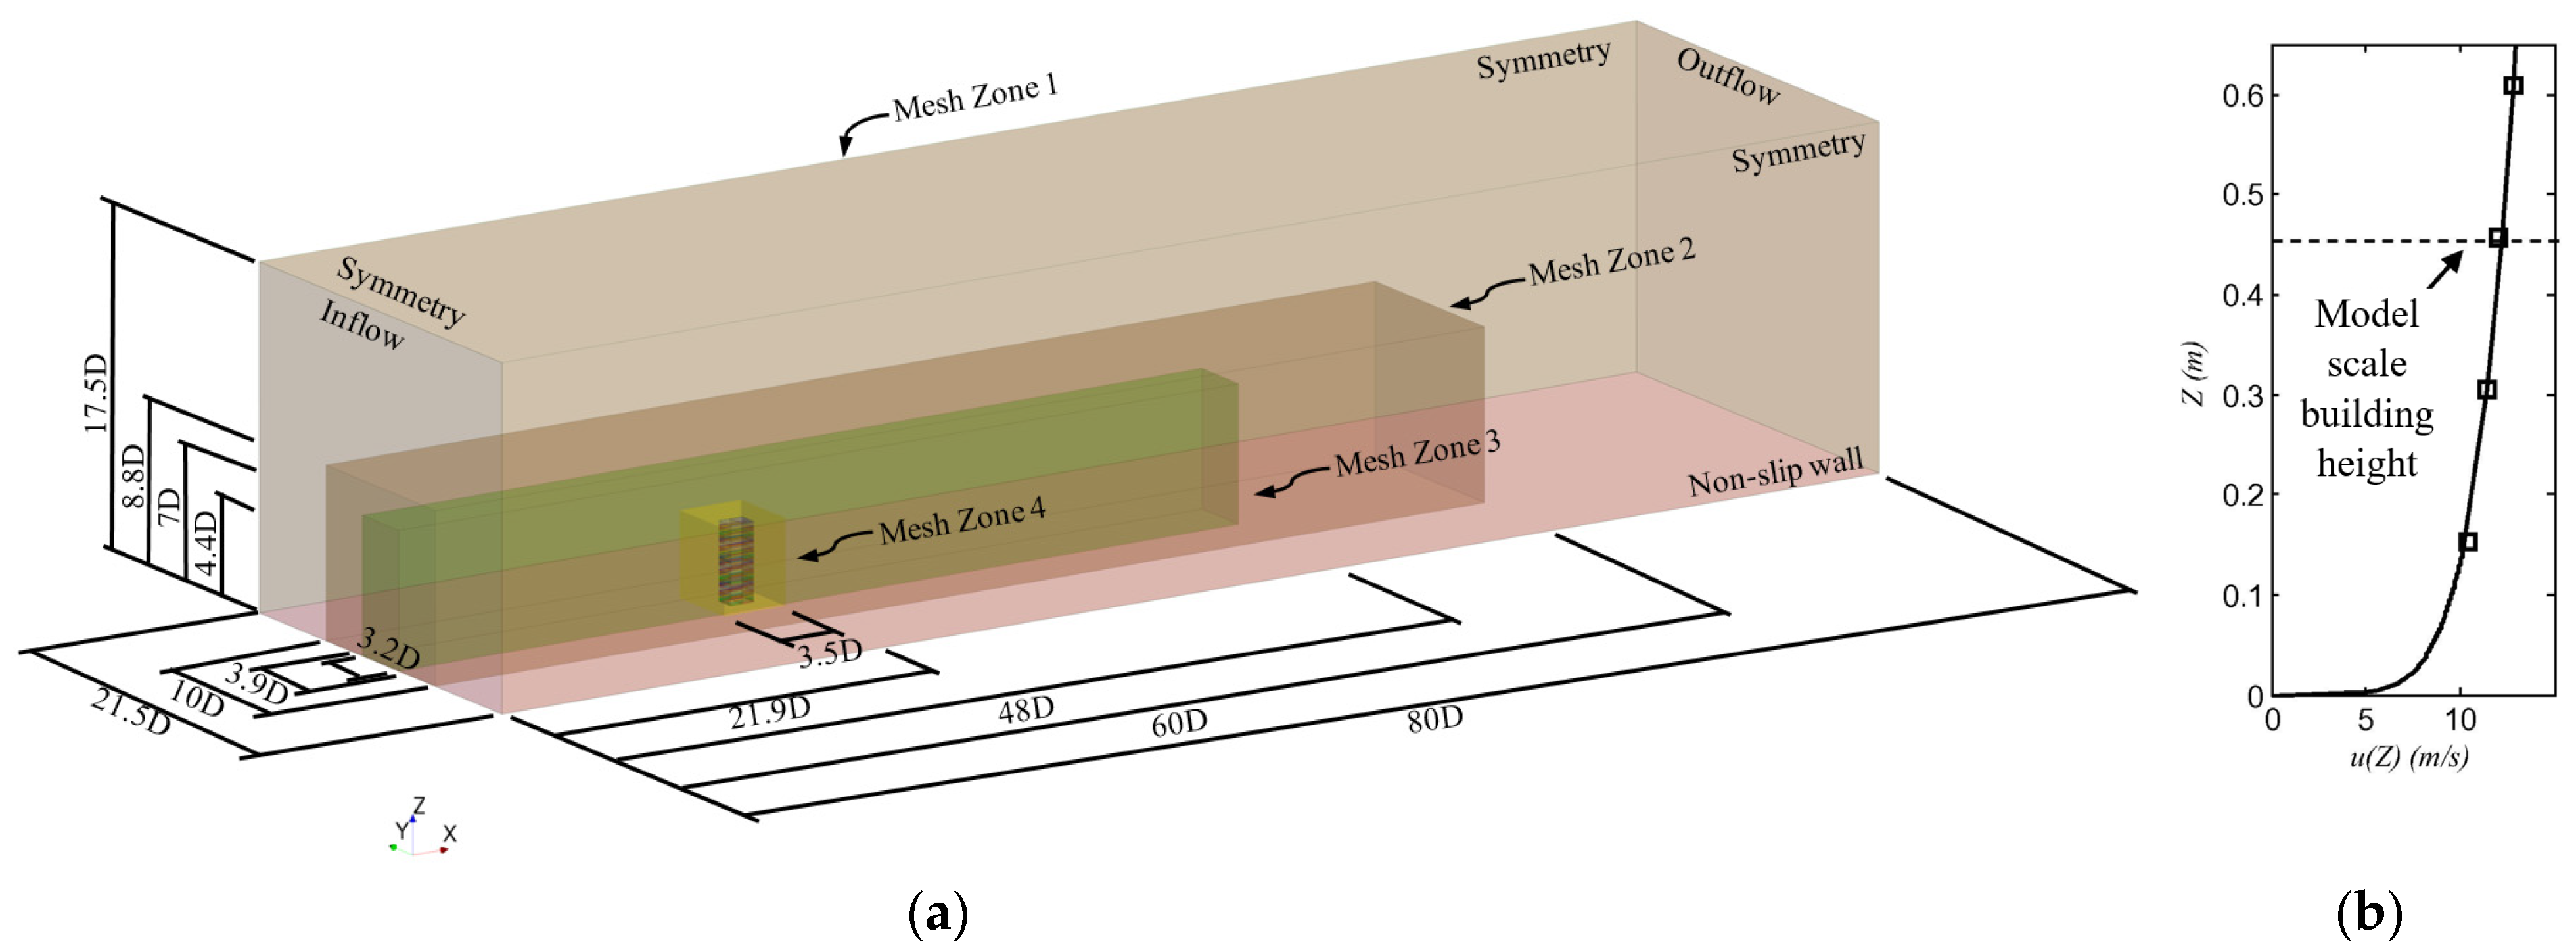
2.1.1. Description of CFD Physics and Boundary Conditions

A CFD simulation [64,65,66] employs an LES model with computational domain dimensions shown in Figure 2a. The computational domain consists of four different types of boundary conditions, which are as follows. The non-slip wall boundary condition is assigned to all ground and walls of the studied structure. Symmetry boundary conditions are considered for the sides and top faces of the computational domain to mirror velocities and pressure characteristics across these surfaces. The inflow boundary condition is located at the front surface of the computational domain to utilise a database for each velocity component depending on both its location and time (e.g.,   u x (x, y, z, and t)). This has been previously generated using a Consistent Discrete Random Flow Generator (CDRFG) technique developed in past studied [57,58,67]. The outlet is the rear surface of the computational domain to model the outflow, consistent with the CDRFG inflow shown in Figure 2b [57], which is represented as the mean wind velocity ( U a v ) distribution, illustrated in Equation (1).
U a v = U a v r e f z z r e f α
where U a v r e f is the mean wind velocity at reference height z r e f , equal to 10 m/s and 0.364 m, respectively; z is the height; and α is the empirically derived coefficient representing the stability of the atmosphere.
The conducted LES uses a dynamic sub-grid scale with a commercial CFD package (STAR-CCM+ v.15.04.008) [68,69]. The structure’s reference height is 0.4562 m in the model scale with an exposure factor of an open terrain environment. The study uses a length and time scale of 1:400 and 1:100, respectively. Each simulation is a total of 14,000 time steps to represent a total time of 7.0 s in the model scale (i.e., 11.5 min full-scale); a time step equal to 5 milliseconds allows the Courant Friedrichs-Lewy (CFL) to be maintained at less than 1.0 to ensure the wind solution’s accuracy and convergence (i.e., maximum CFL = 0.5 at the top of the studied structure). The turbulence intensity reference in the x, y, and z directions are 0.197, 0.167, and 0.145, respectively. The turbulence length scale in the x, y, and z directions are 0.563 m, 0.147 m, and 0.186 m, respectively. Turbulence intensities and length scales within the computational domain are examined and validated with the CAARC structure model, following the methodology presented by Aboshosha et al. [57] and Elshaer et al. [58]. These studies thoroughly demonstrated the self-maintenance of the turbulence characteristics throughout the computational domain, confirming their consistent behaviour until reaching the analysed structure. To conduct the CFD simulations, simulations are performed using the high-performance computer (HPC) facility [70]. The duration required for performing one CFD simulation was sixty hours, which took place using ninety-six processors.

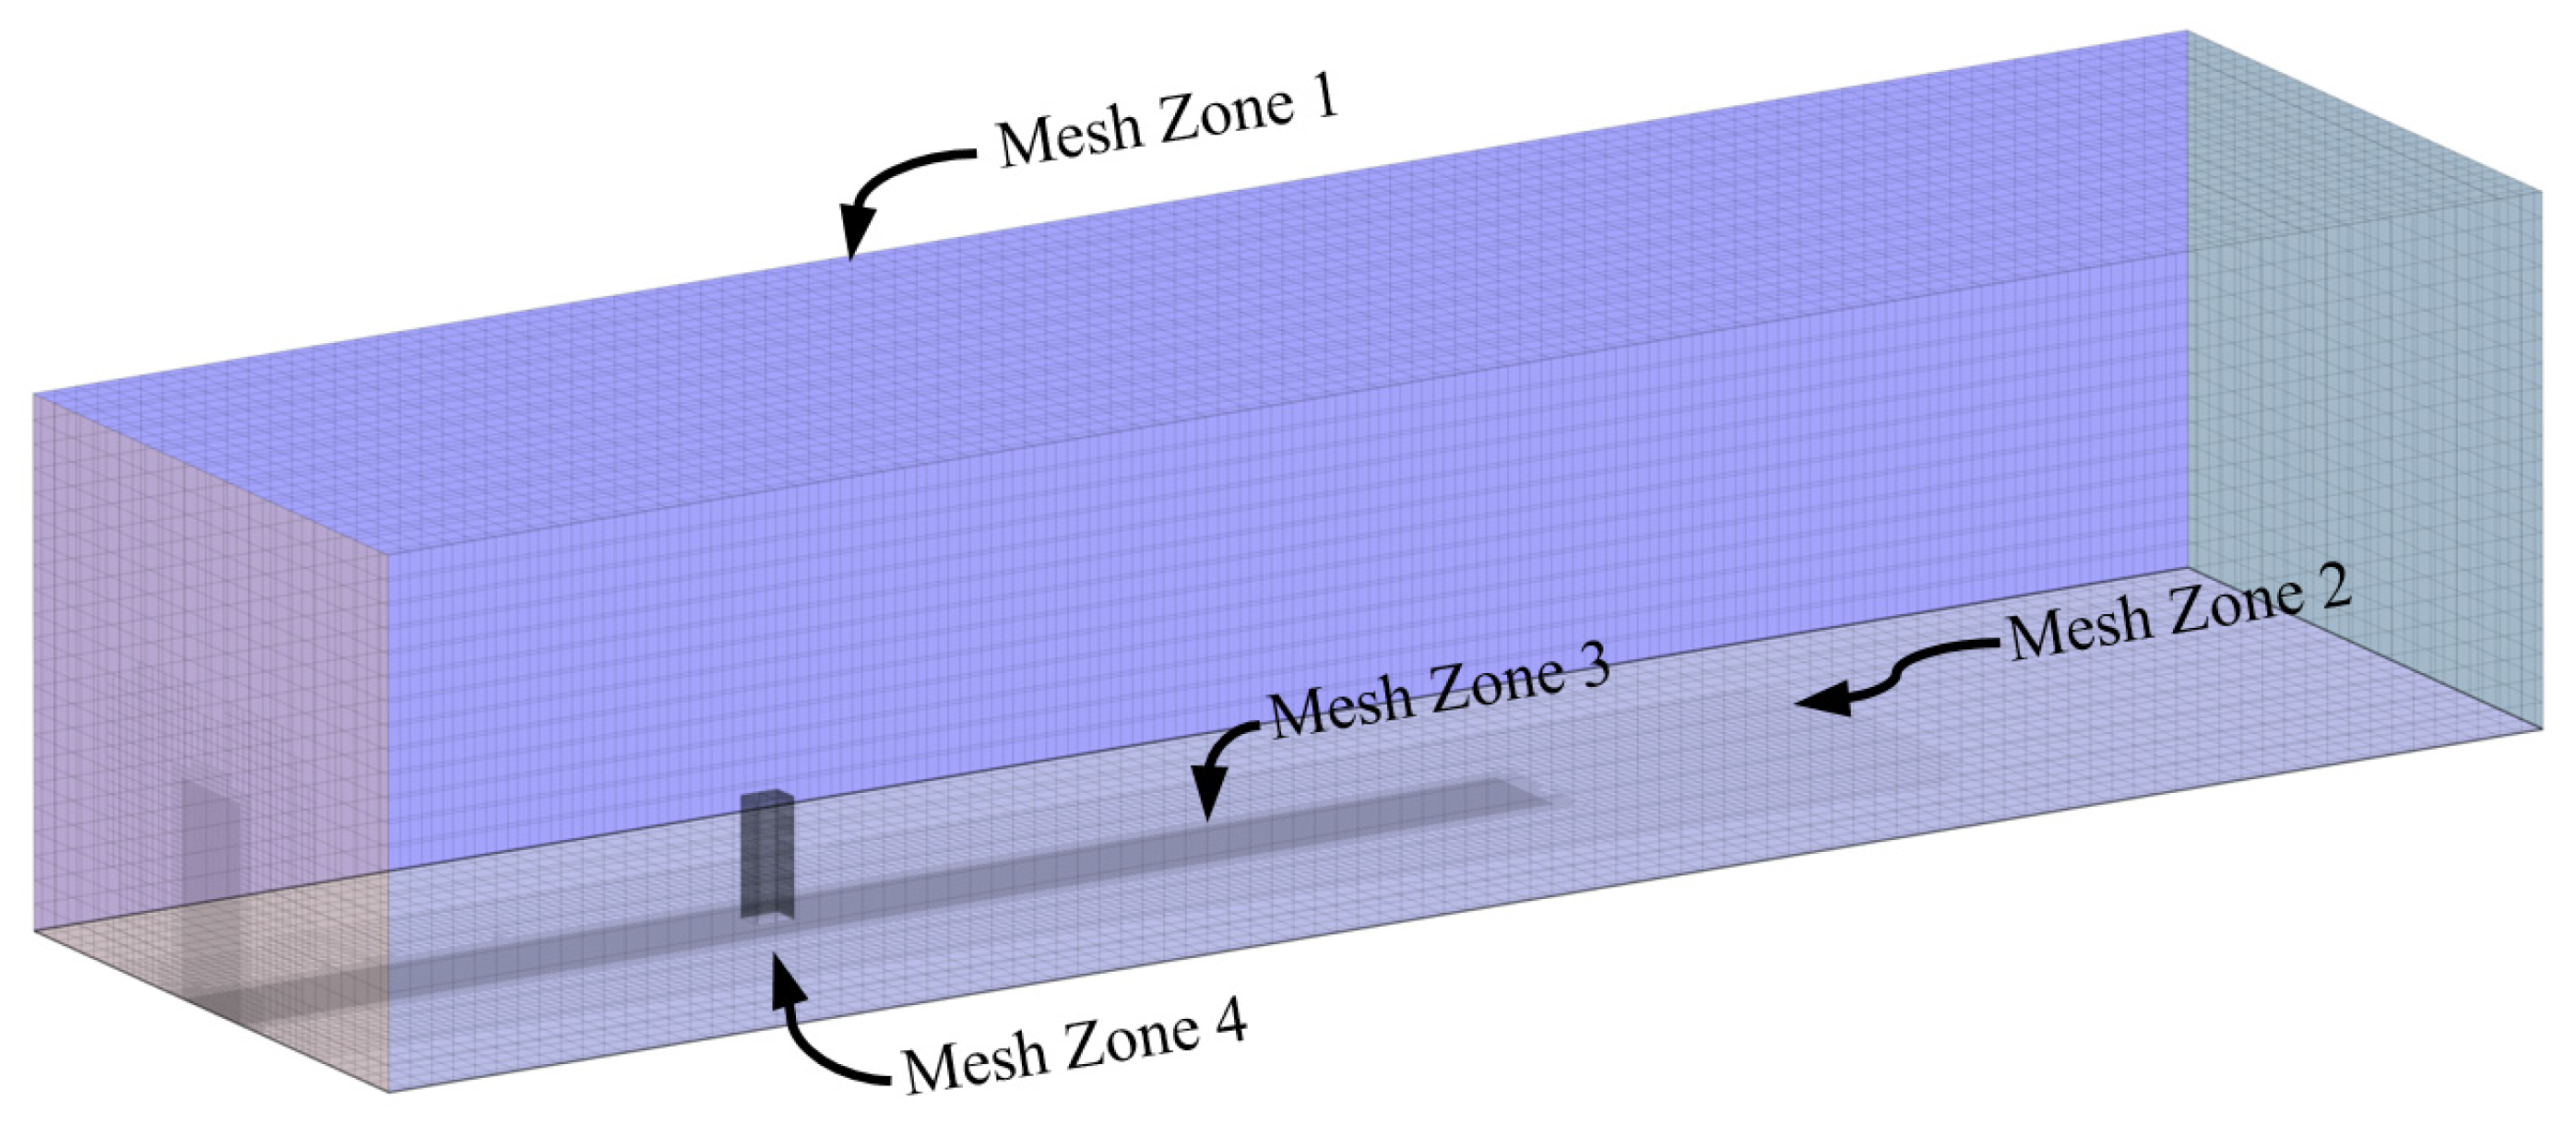
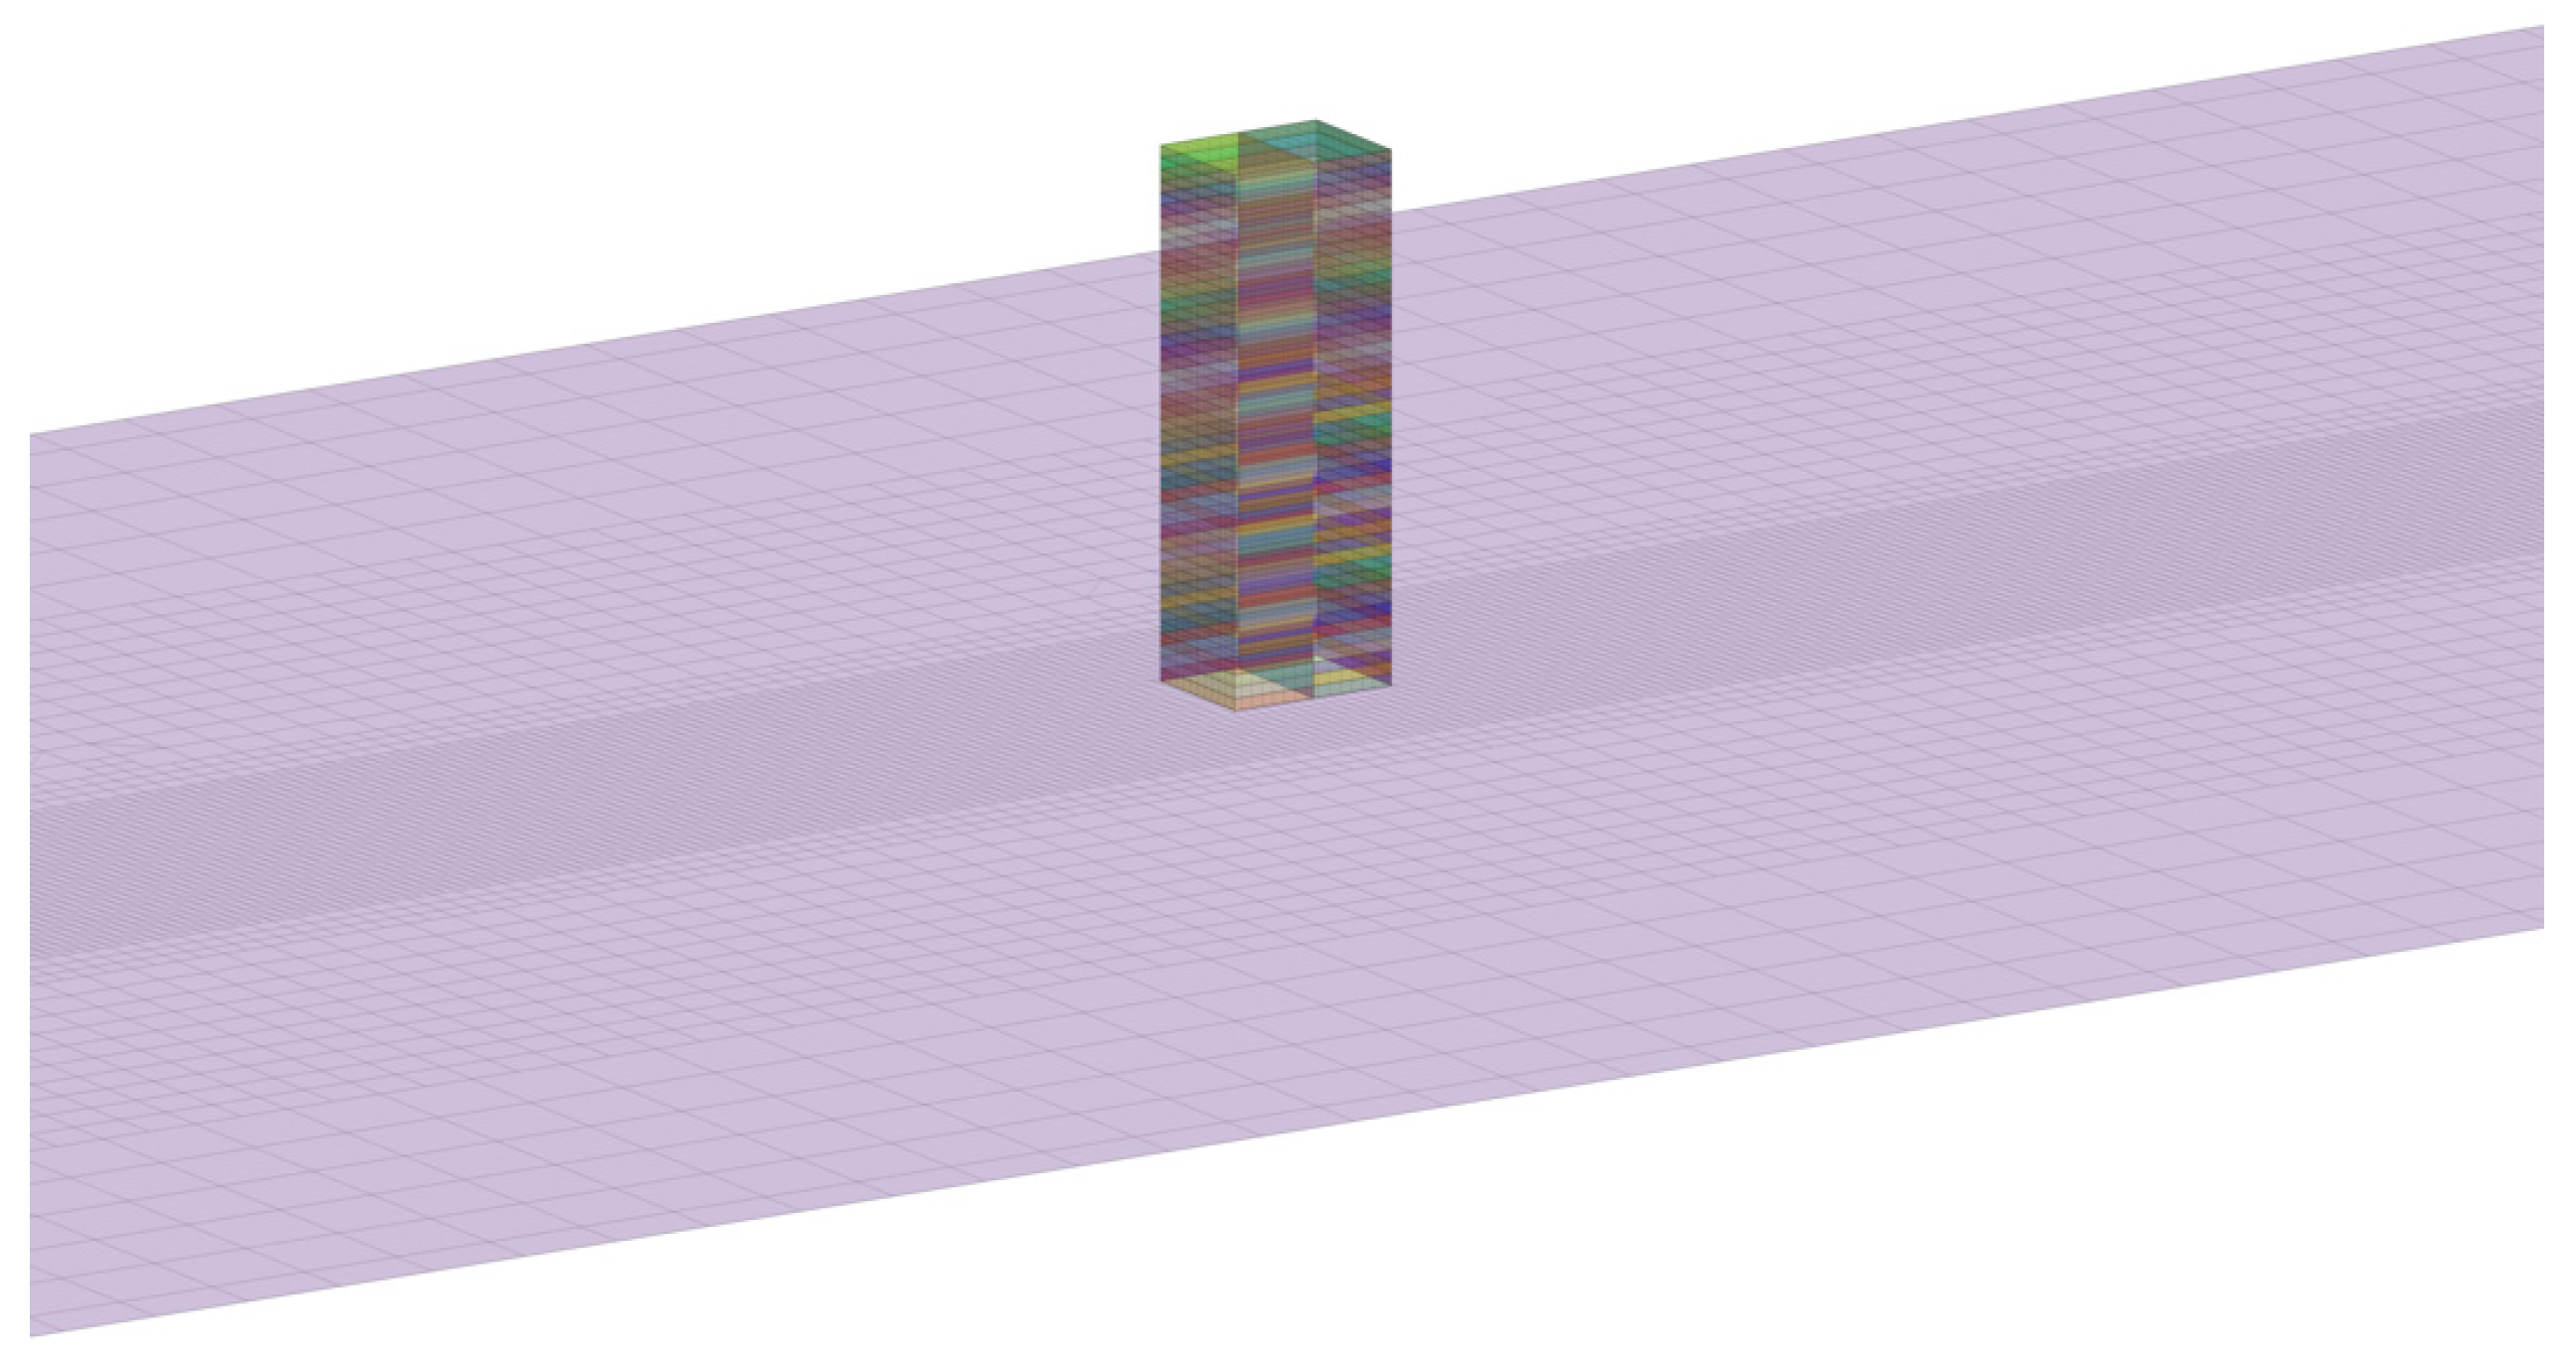
2.1.2. Computational Domain Discretization

Within the computational domain, a grid discretization must be considered where hexahedral meshes are used. Table 1 summarises the grid resolution and properties for the isolated CAARC structure. The grid used in the computational domain is divided into four zones, as indicated in Figure 3. Starting from the furthest away from the structure of interest, Zone 1 is considered the largest grid. Closer to the structure, Zone 2 and Zone 3 are deemed to have medium-sized grids. The last zone, Zone 4, is considered closest to the building of interest, with the smallest grid size. Compared to the other three grid zones, a decrease in grid size will capture essential flow details around the structure in the wake zone and from the zones between the inflow boundary condition (as previously mentioned) and the structure of interest. Grid zones are chosen based on Aboshosha et al. [57] and Elshaer et al. [58] and are validated with similar comparisons shown in Figure 4a,b. With the validated grid zones, a total number of 1.75 × 10 6 mesh cells are counted. The mesh count considered was refined in a study by Elshaer et al. [58] and was found to be adequate for their analysis.

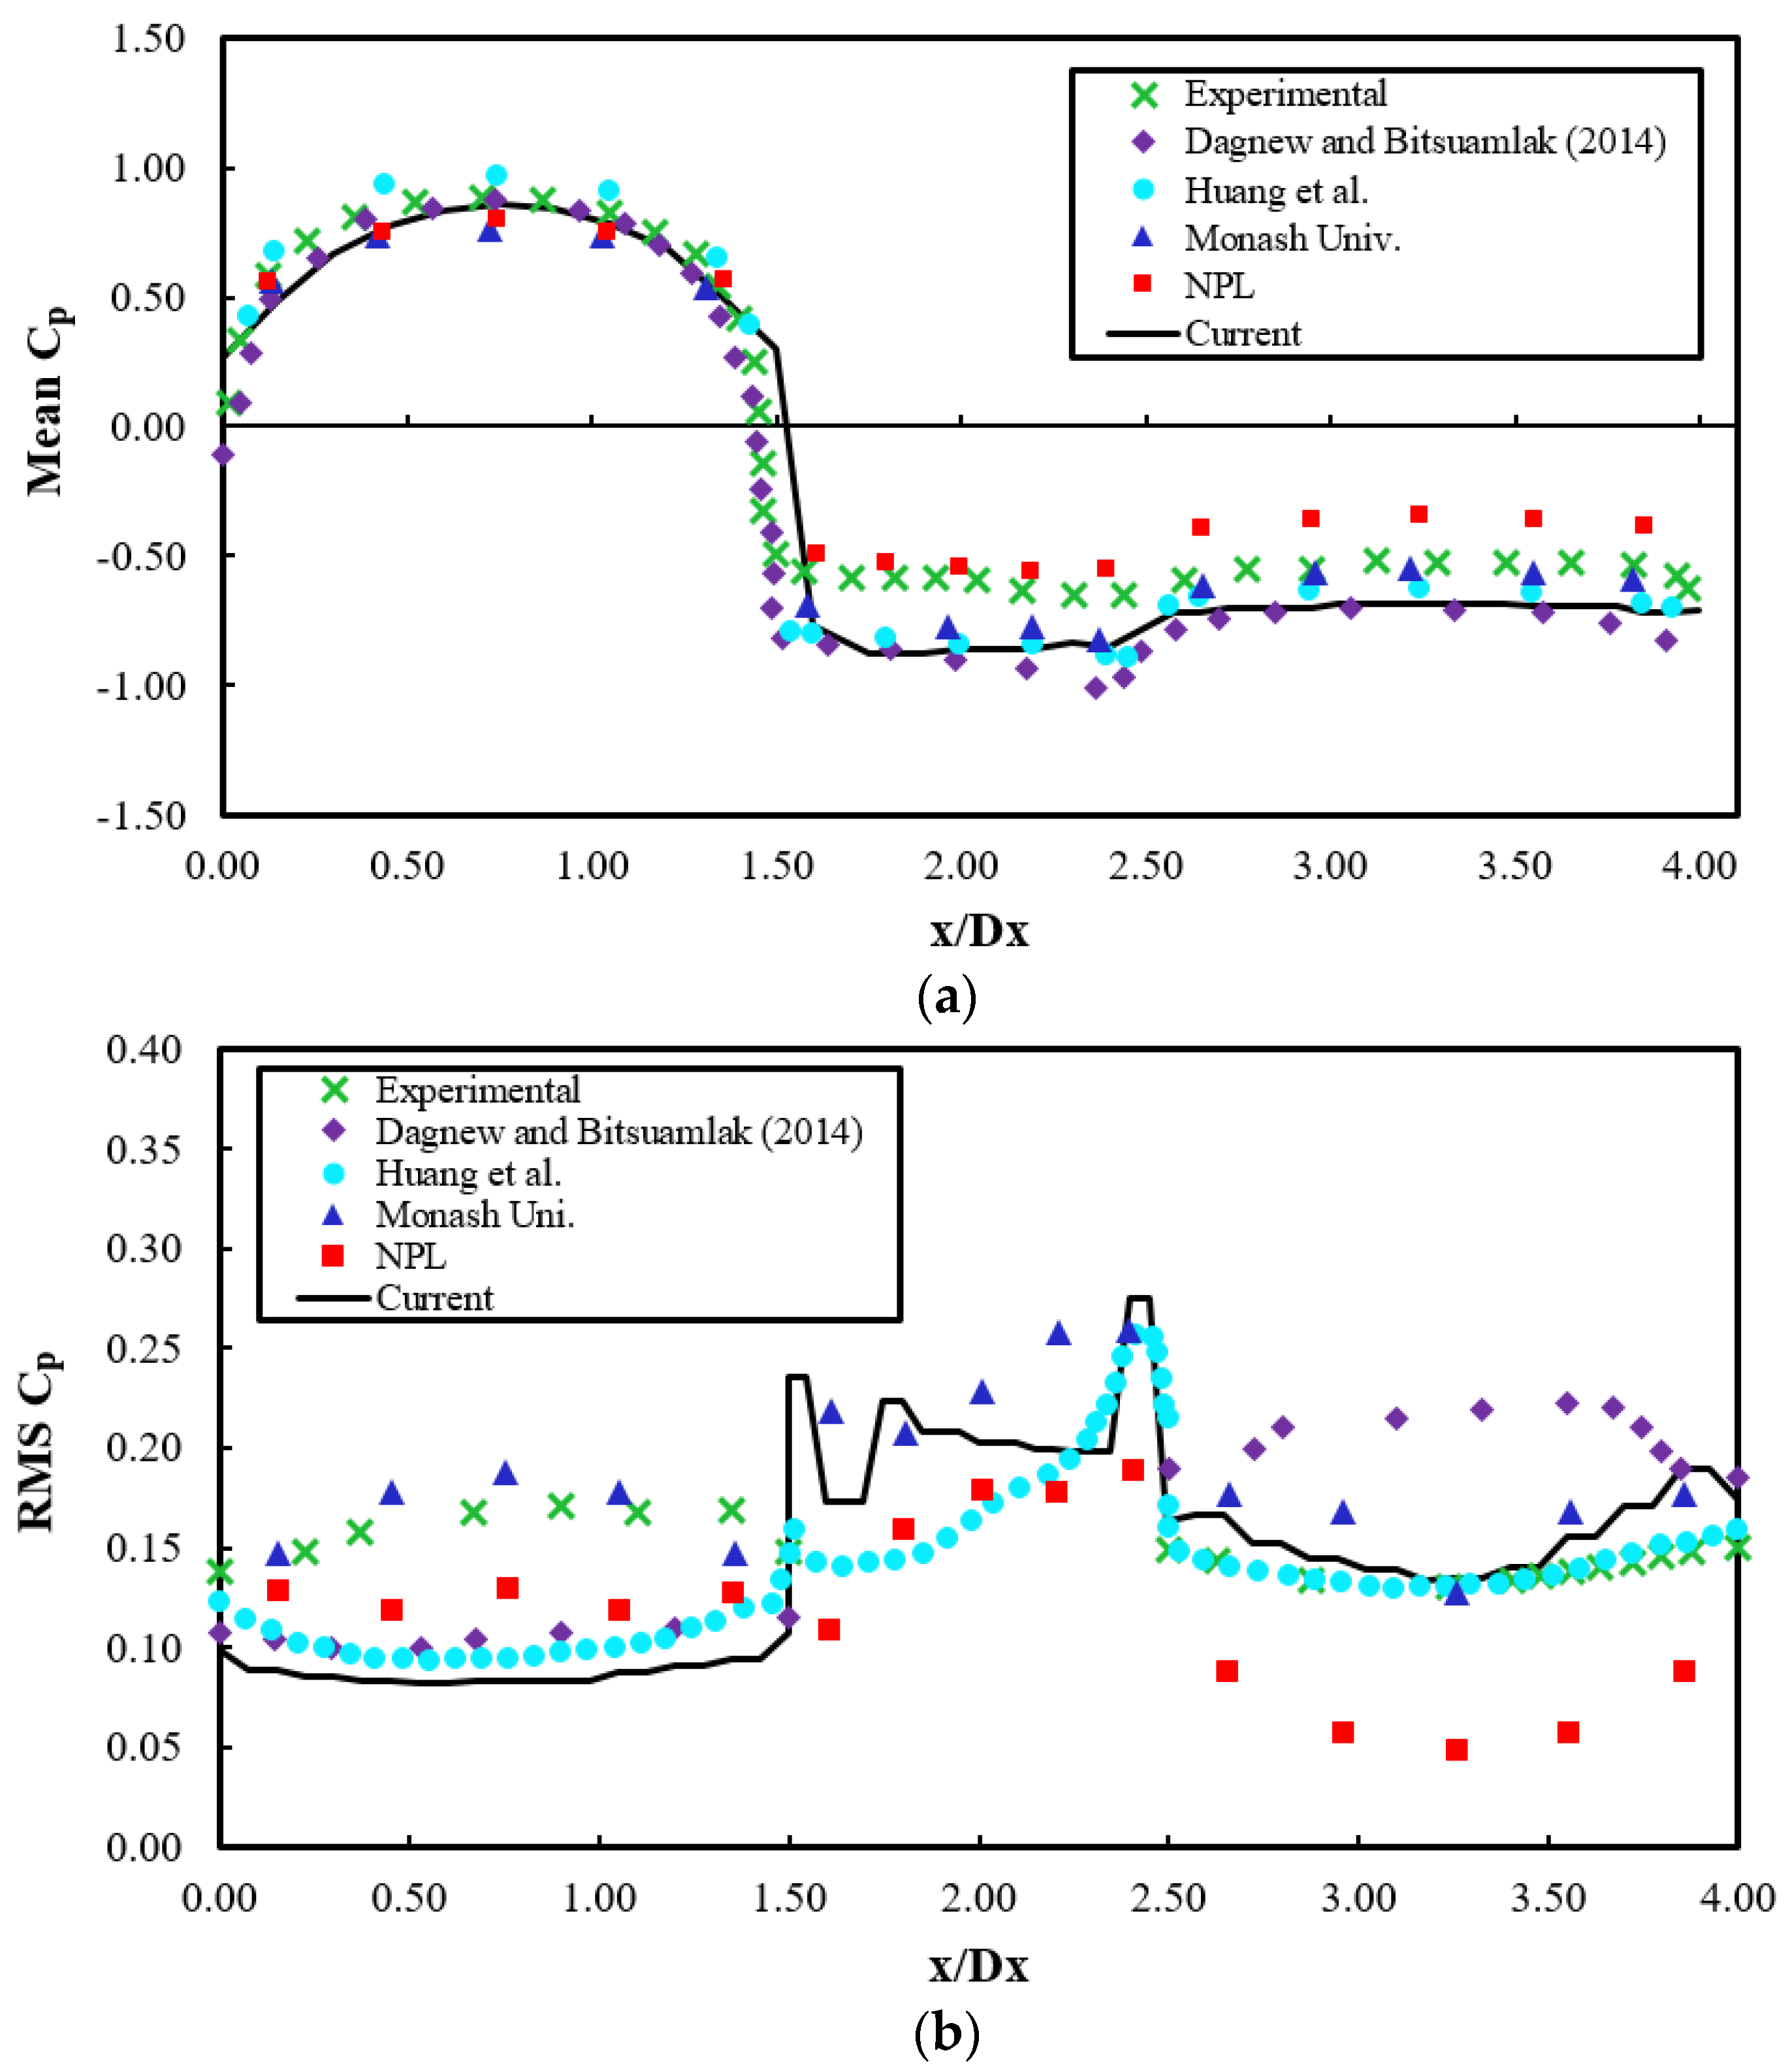
2.1.3. CFD Model Validation

An experimental wind tunnel study by Dragoiescu et al. [73] is used as a validation benchmark for the CFD simulation in the current study. Figure 4a shows the comparison of the mean Pressure Coefficient (Cp) from the developed LES model simulation to those from previous wind tunnels and numerical simulations [60]. Similar comparisons for the Root Mean Squared (RMS) Cp are shown in Figure 4b. Computational error can be attributed due to the difference in the nature of experimental versus numerical testing. Additionally, the causes of error can also be associated with the need for longer fluid duration to ensure conversions. The CFD model was validated based on Aboshosha et al. [57] and Elshaer et al.’s [58] computational domain analysis, providing satisfactory comparisons in accuracy. The current CFD model showed comparable results to the wind tunnel and numerical simulations [73].

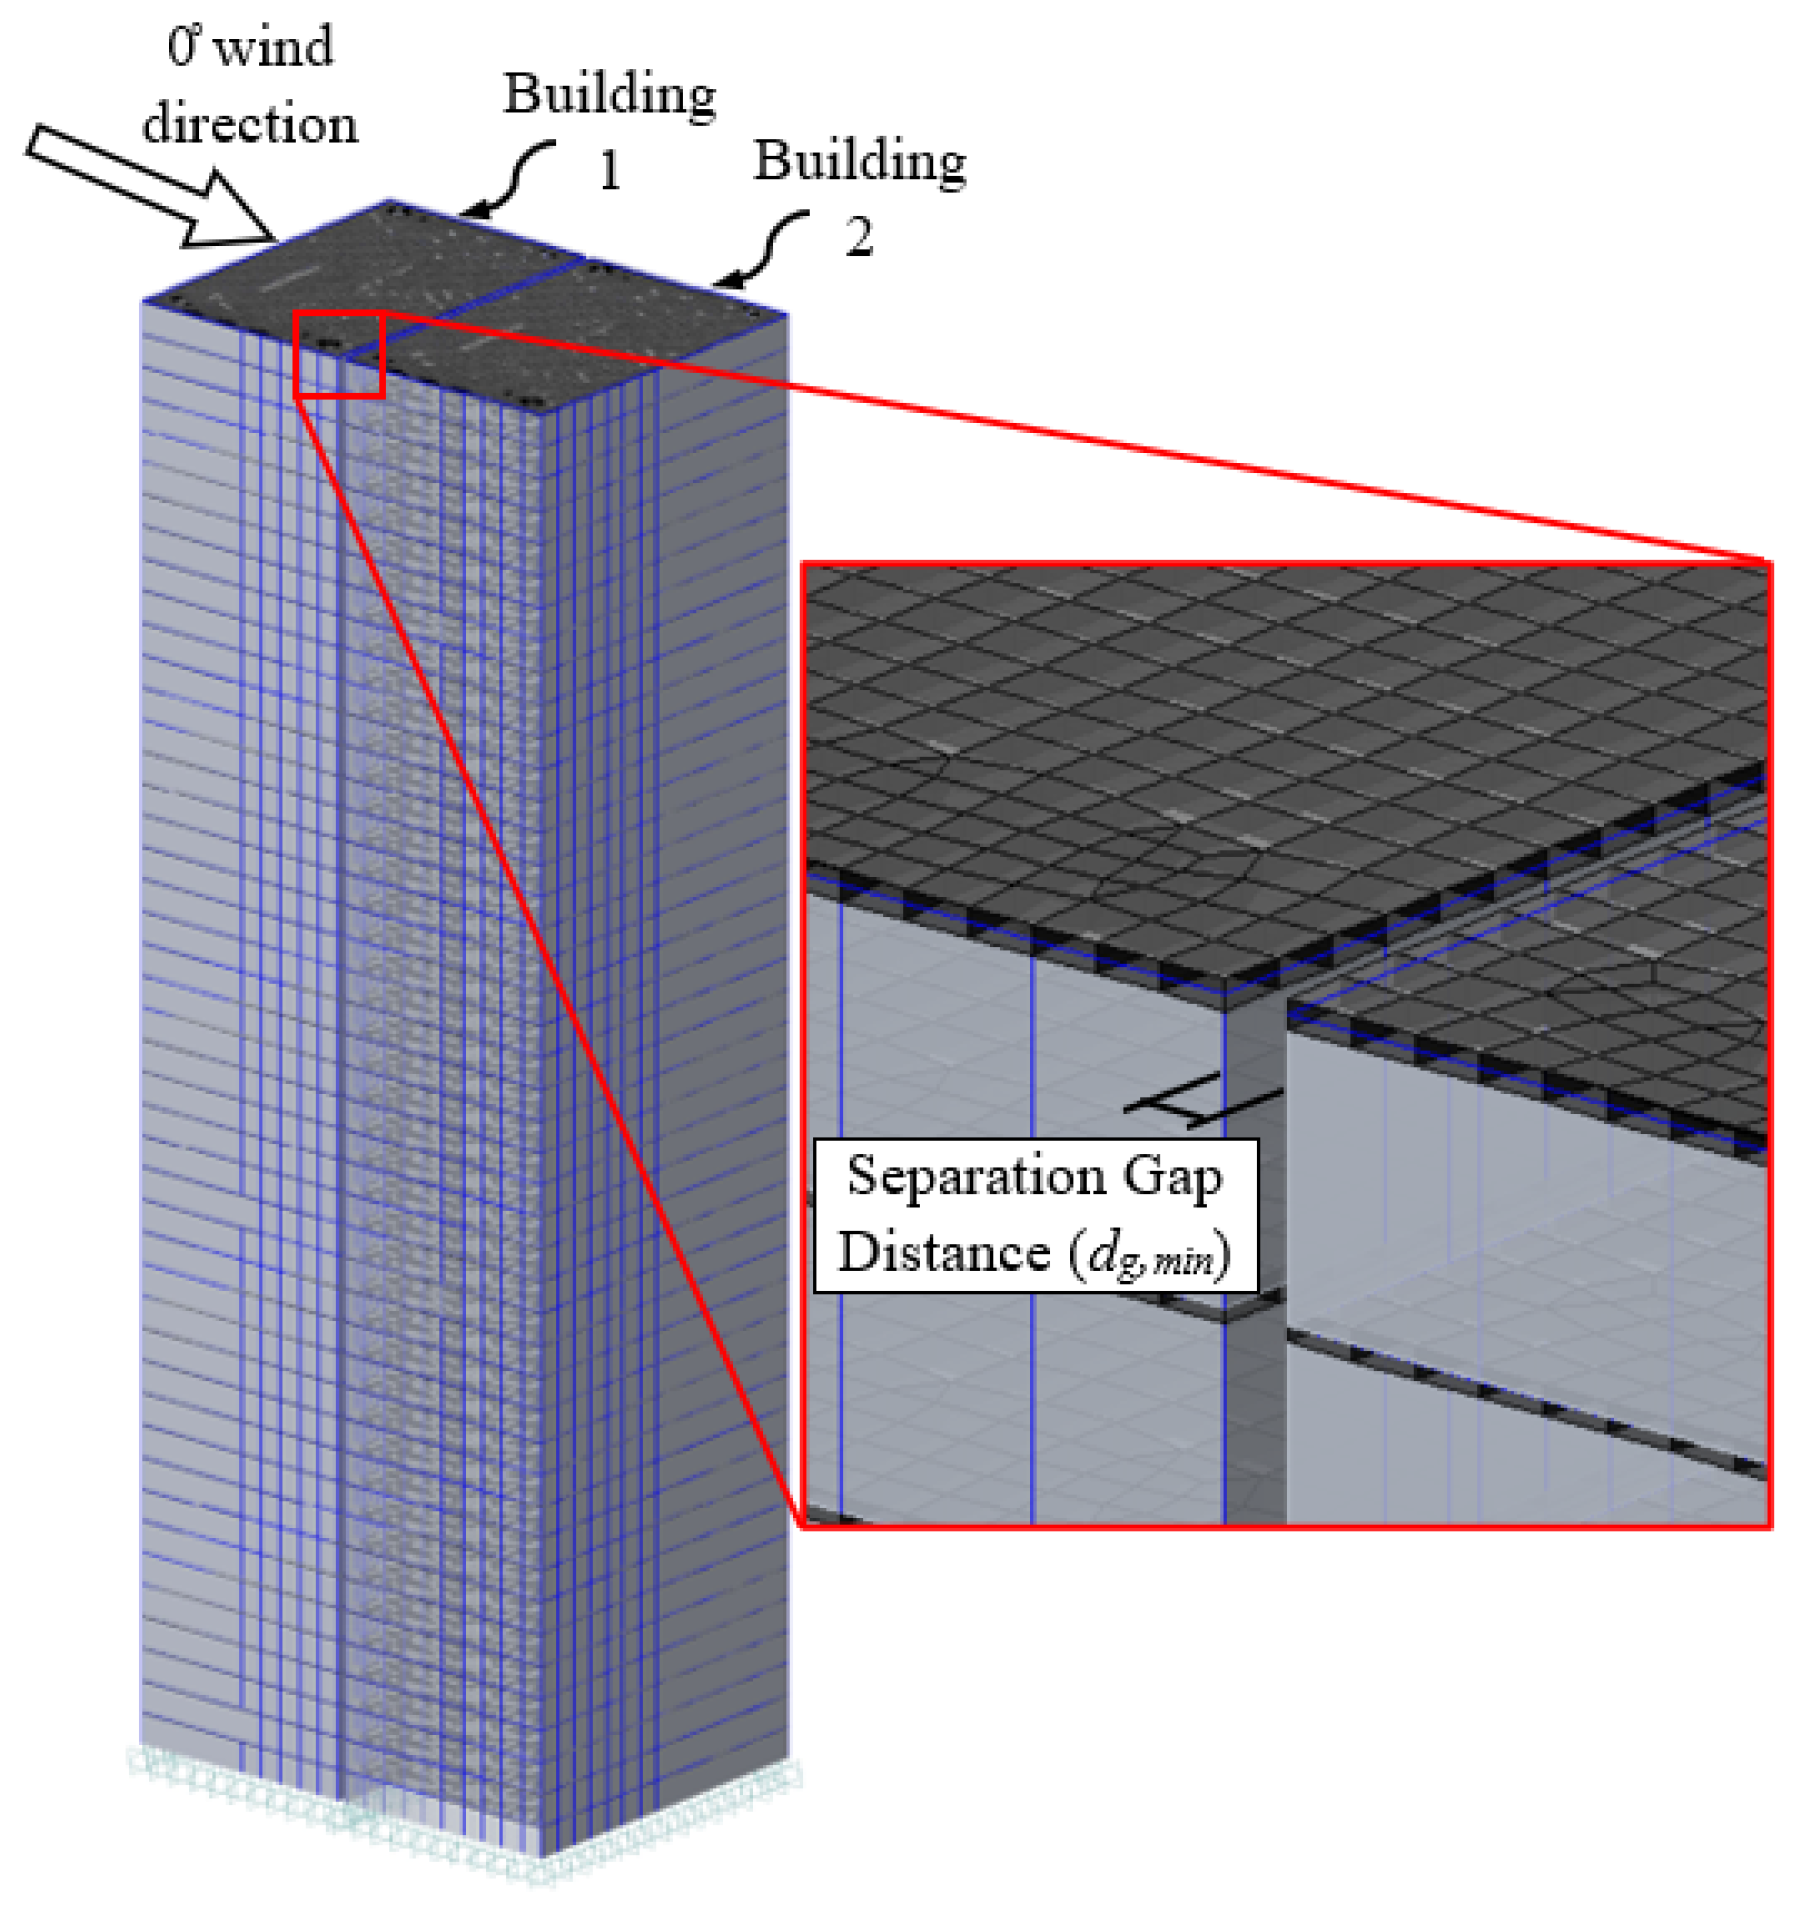
2.1.4. Computational Domain of Two Adjacent Structures in Proximity

Two adjacent model–scale CAARC structures were introduced into the computational domain, maintaining consistency with the validated single CAARC structure in terms of domain properties and mesh grid sized outlined in the previous sections. To prevent computational errors stemming from extremely small eddies, the adjacent structures were analysed completely flush between each structure, eliminating fluid properties and meshing interactions between the two structures. Figure 5 illustrates the mesh grid resolution for the two adjacent structures.

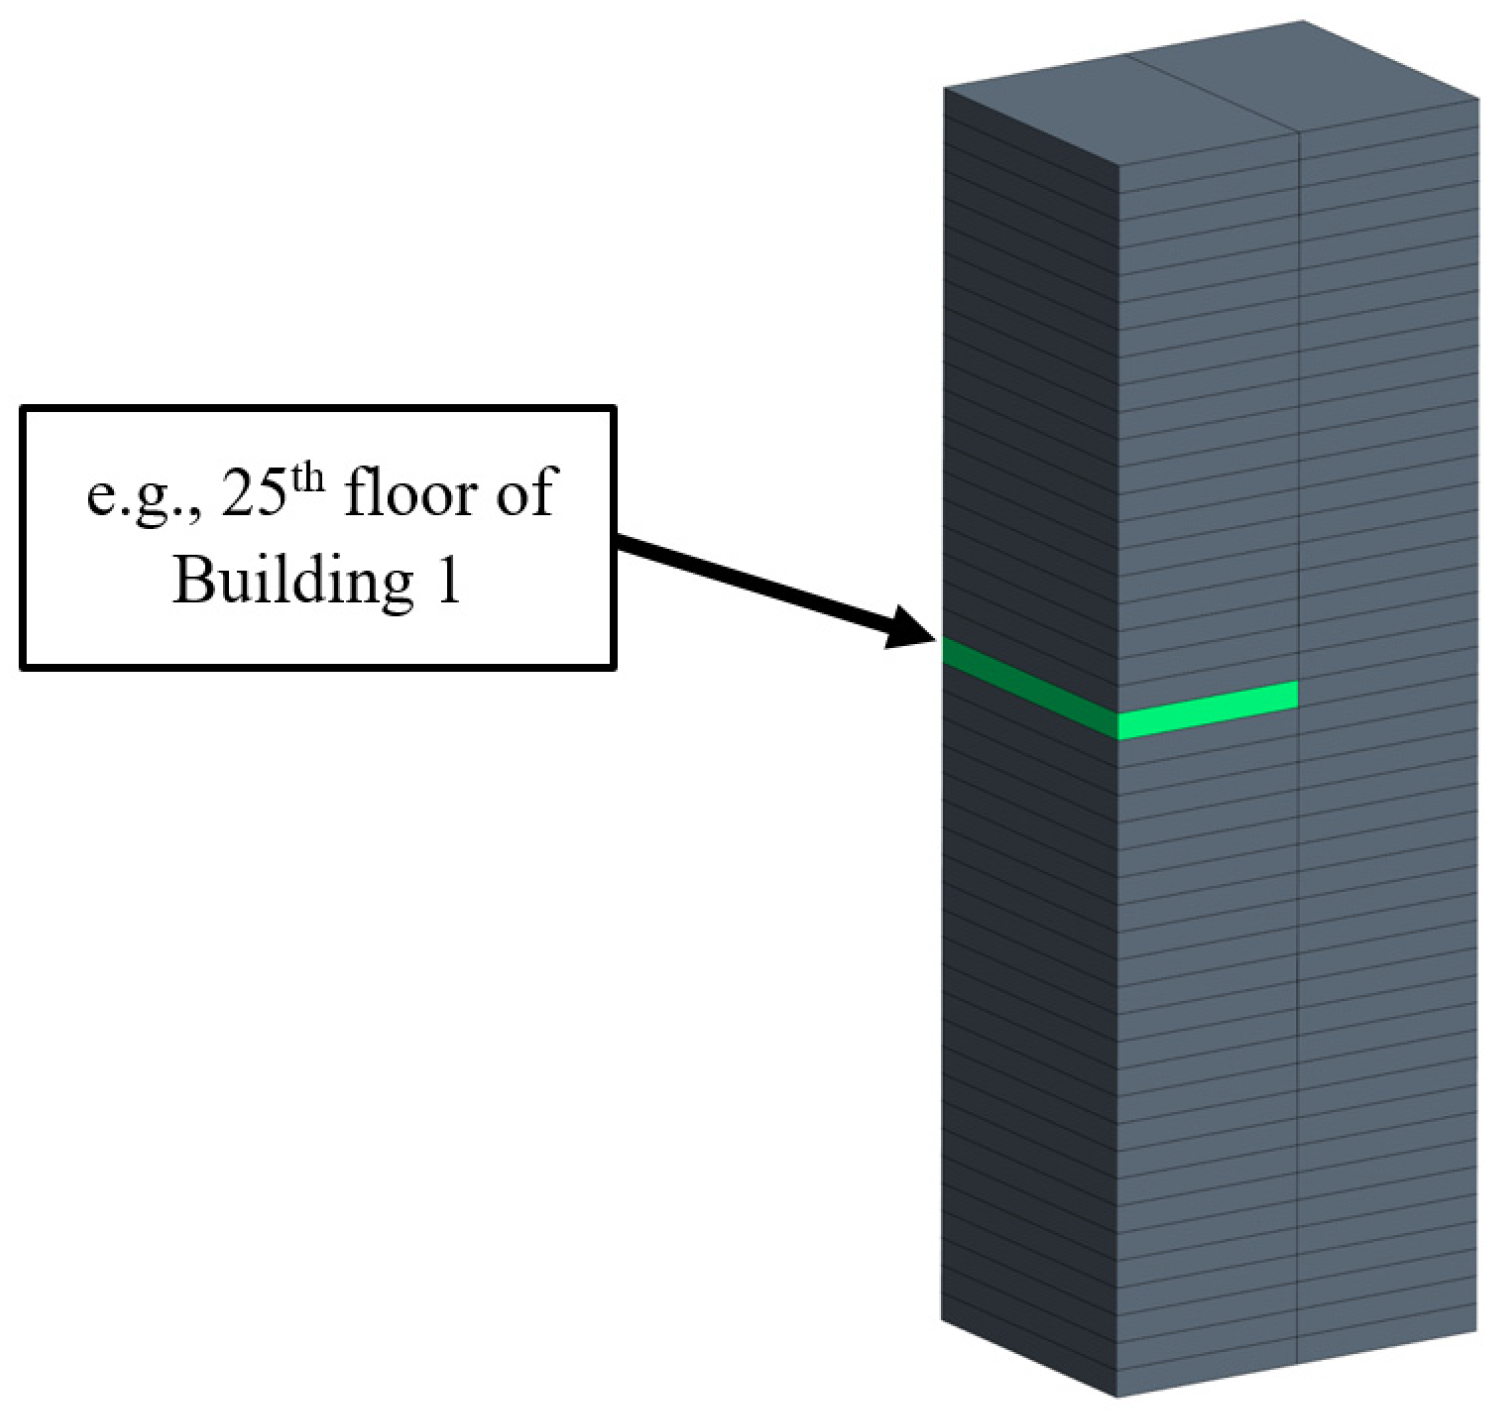
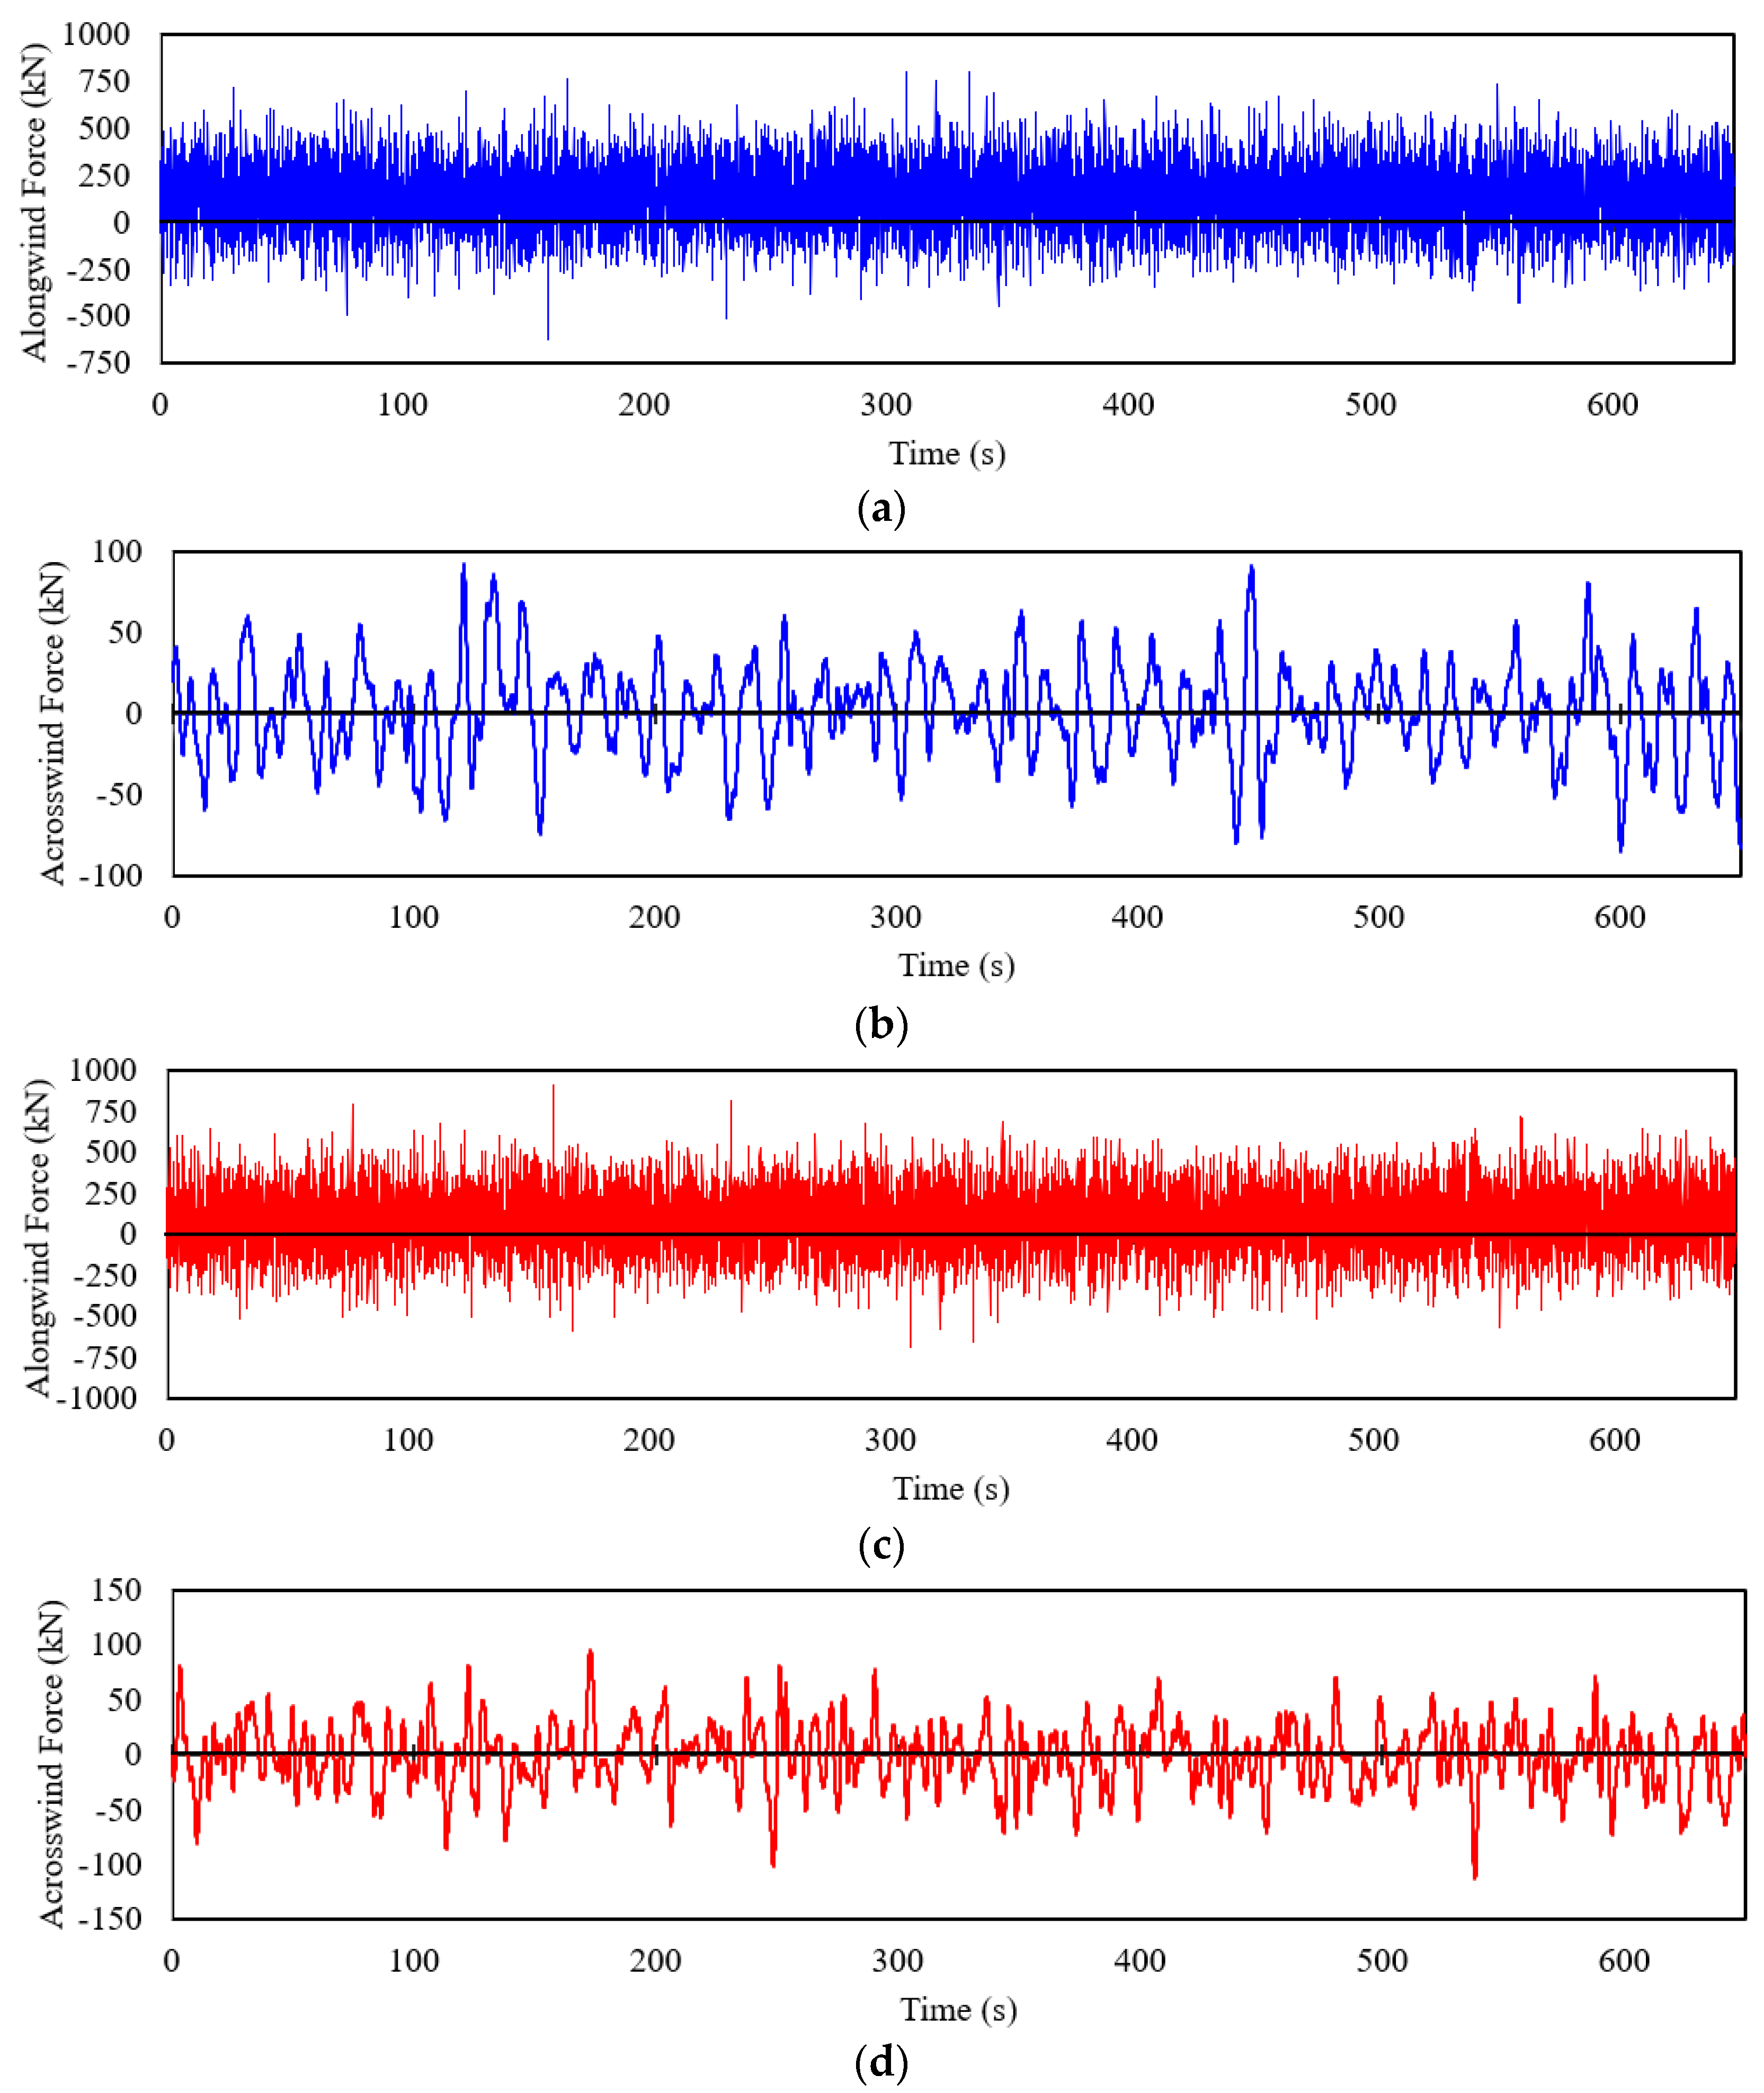
2.1.5. Determination of Wind Forces on the Studied Structure

A time–history of forces acting on each storey of the structure is obtained from the LES simulation in order to be used for determining the structural response using FEM simulations. Using LES, two equal-sized buildings are examined to represent two CAARC structures. Each structure is divided into 45 equal levels to represent the 45 storeys. Figure 6 shows all the divided storeys (highlighting the 25th storey on the upstream (first) building) of both structures. The forces in the x, y, and z directions in each storey are integrated over their surfaces and monitored over time. Individual time–history wind forces in the x and y direction are captured to perform the structure’s dynamic responses for two adjacent tall structures. Wind forces are monitored individually per storey, per structure as the sum of the force from all surfaces on each storey. The applied wind force time–history will act at each structure’s centre diaphragm of each storey in the FEM model. A scale factor is then magnified for each time–history force to full-scale, based on the applied mean wind velocity (i.e., 20 m/s has a scale factor of 640, 30 m/s has a scale factor of 1440, 40 m/s has a scale factor of 2560, 50 m/s has a scale factor of 4000). Figure 7a–d show samples of the wind force’s time–history acting on the 45th storey for each structure in the x and y directions in full-scale. Similar time–history forces are conducted for buildings with heights of 140 m, 100 m, and 60 m. Similar simulations are performed for different inflow with mean along-wind velocities of 20, 30, 40 and 50 m/s, which will be further discussed in Section 2.2.2. The first 50 s are not captured in the CFD analysis to allow for the initial converging of wind flows.

2.2. Modelling of Structural Response of the Colliding Buildings Using FEM

A 180 m, 45-storey-tall steel rectangular skeletal structure (i.e., 30 m by 45 m long, respectively) is used as the initial validated structure for the FEM analysis (i.e., CAARC structure). The computer program used in this work is the program package from ETABS [74], v.18. The steel frame members (i.e., beams and columns) were modelled as frame elements with wide flange cross-sections as detailed by Chan et al. [61] and Huang [62]. Each frame element has its own specific start and end node within its element. The floors are modelled as shell elements and act as a single diaphragm per storey. The connections throughout the overall structure are considered to all be rigid, including the foundation of the structure. Once the simulated steel skeletal structure is in good agreement with the validation model, other simulations (e.g., 140 m, 100 m, and 60 m tall buildings) are then calculated in accordance with the preliminary strength check for the AISC. The gathered time–history wind loads from the numerical LES modelled analysis are then scaled to full-scale and applied to the two adjacent steel structures in proximity using the FEM model. The identical adjacent tall structures in proximity are examined to determine an adequate dg,min where no structural pounding occurs. This dg,min will be used in the later sections to determine mathematical equations for mitigating wind-induced pounding.

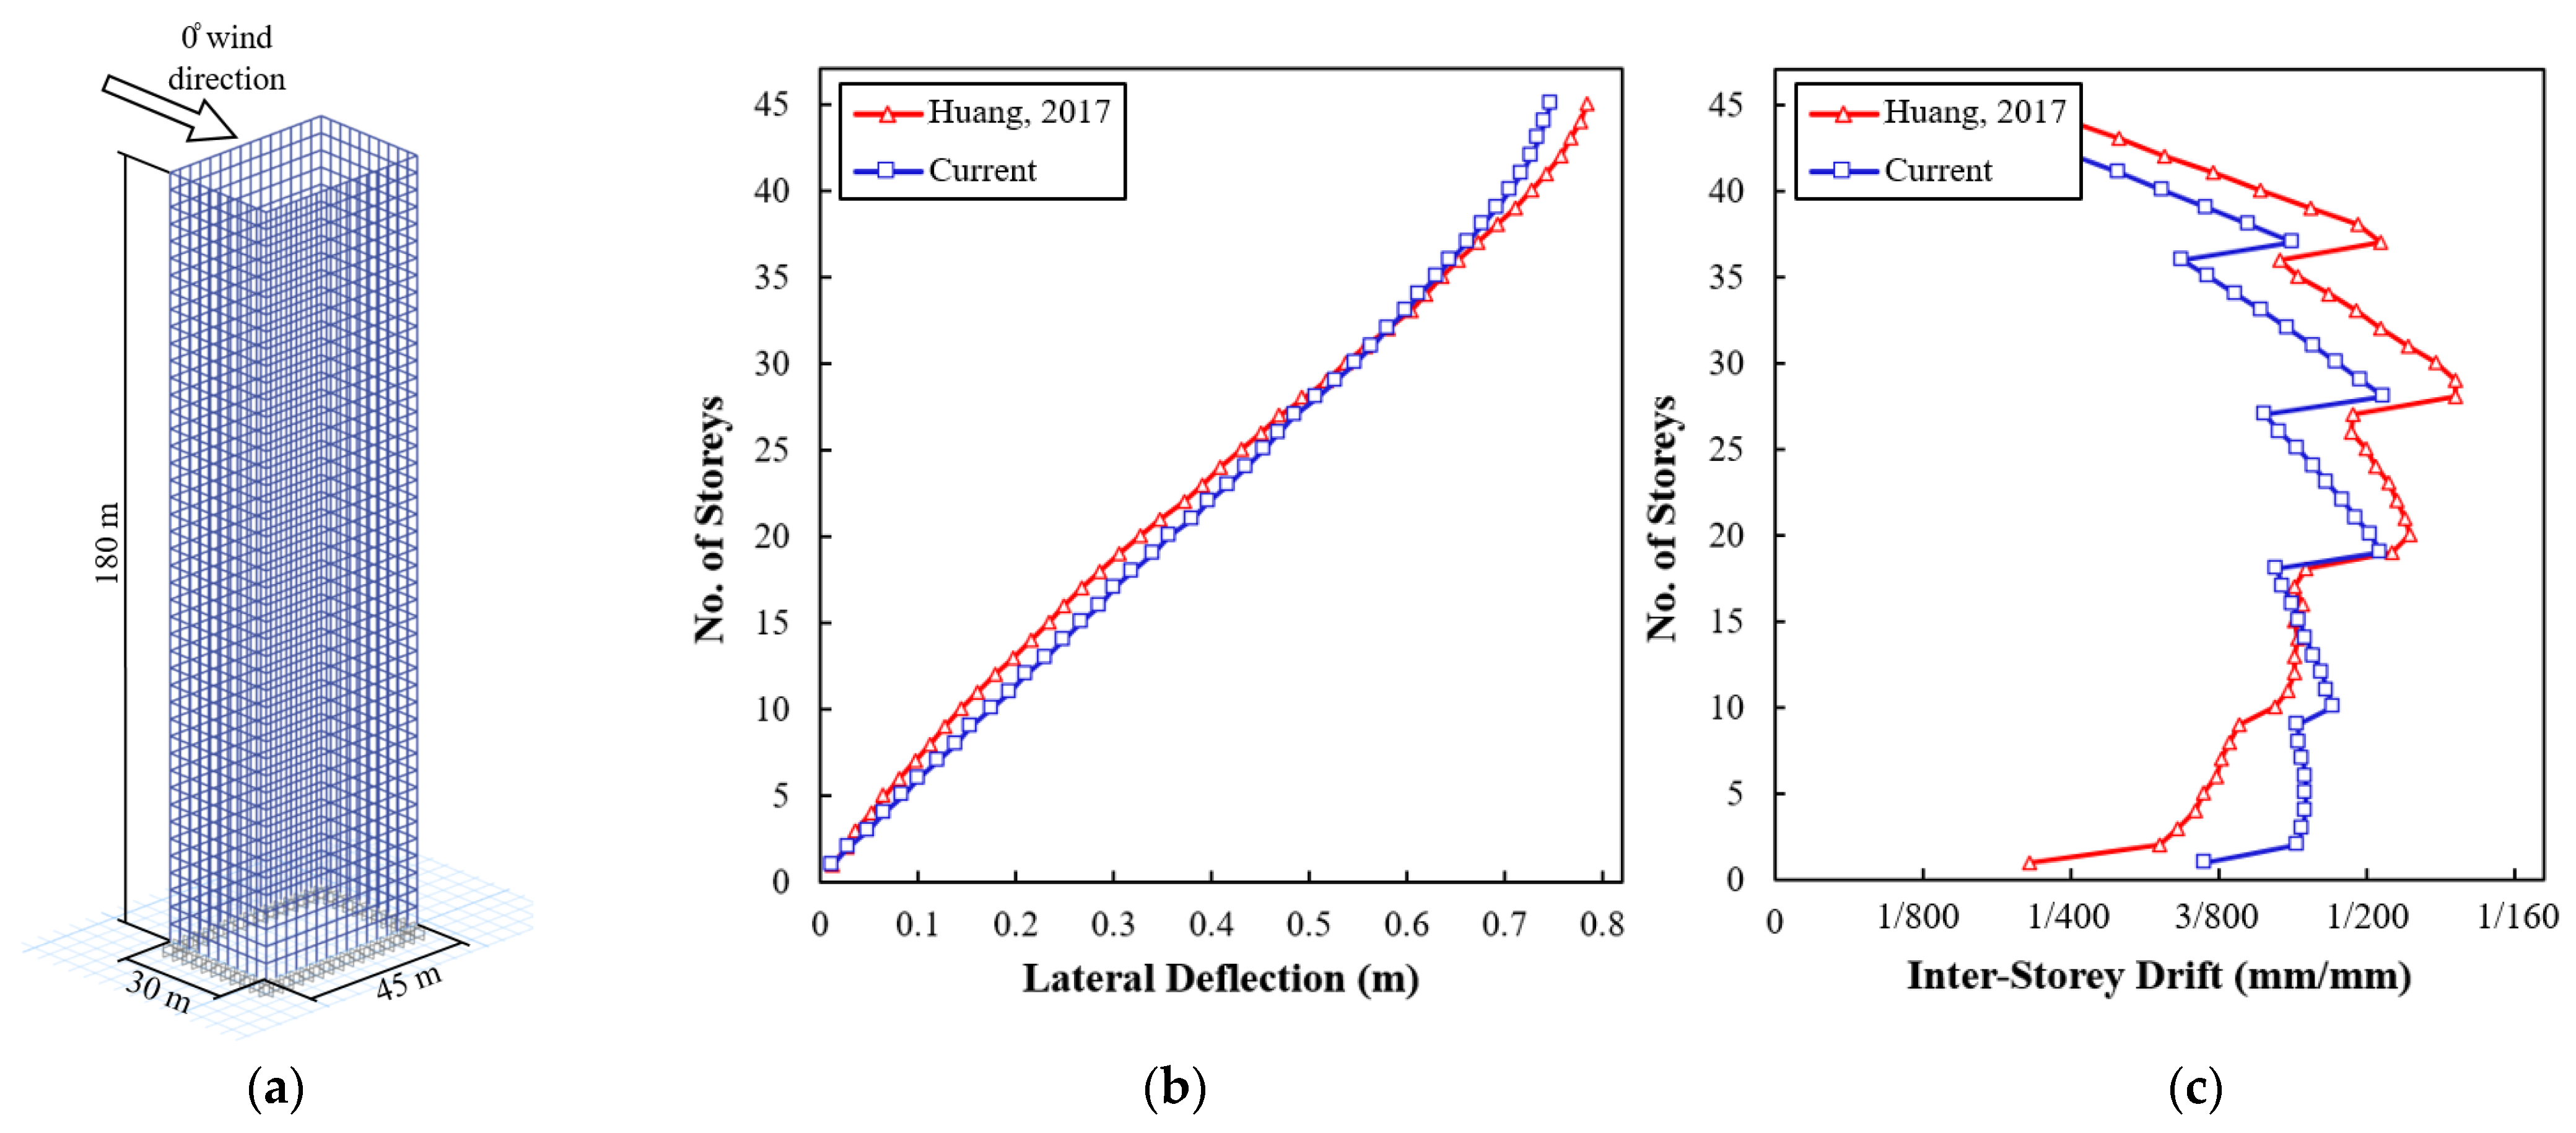
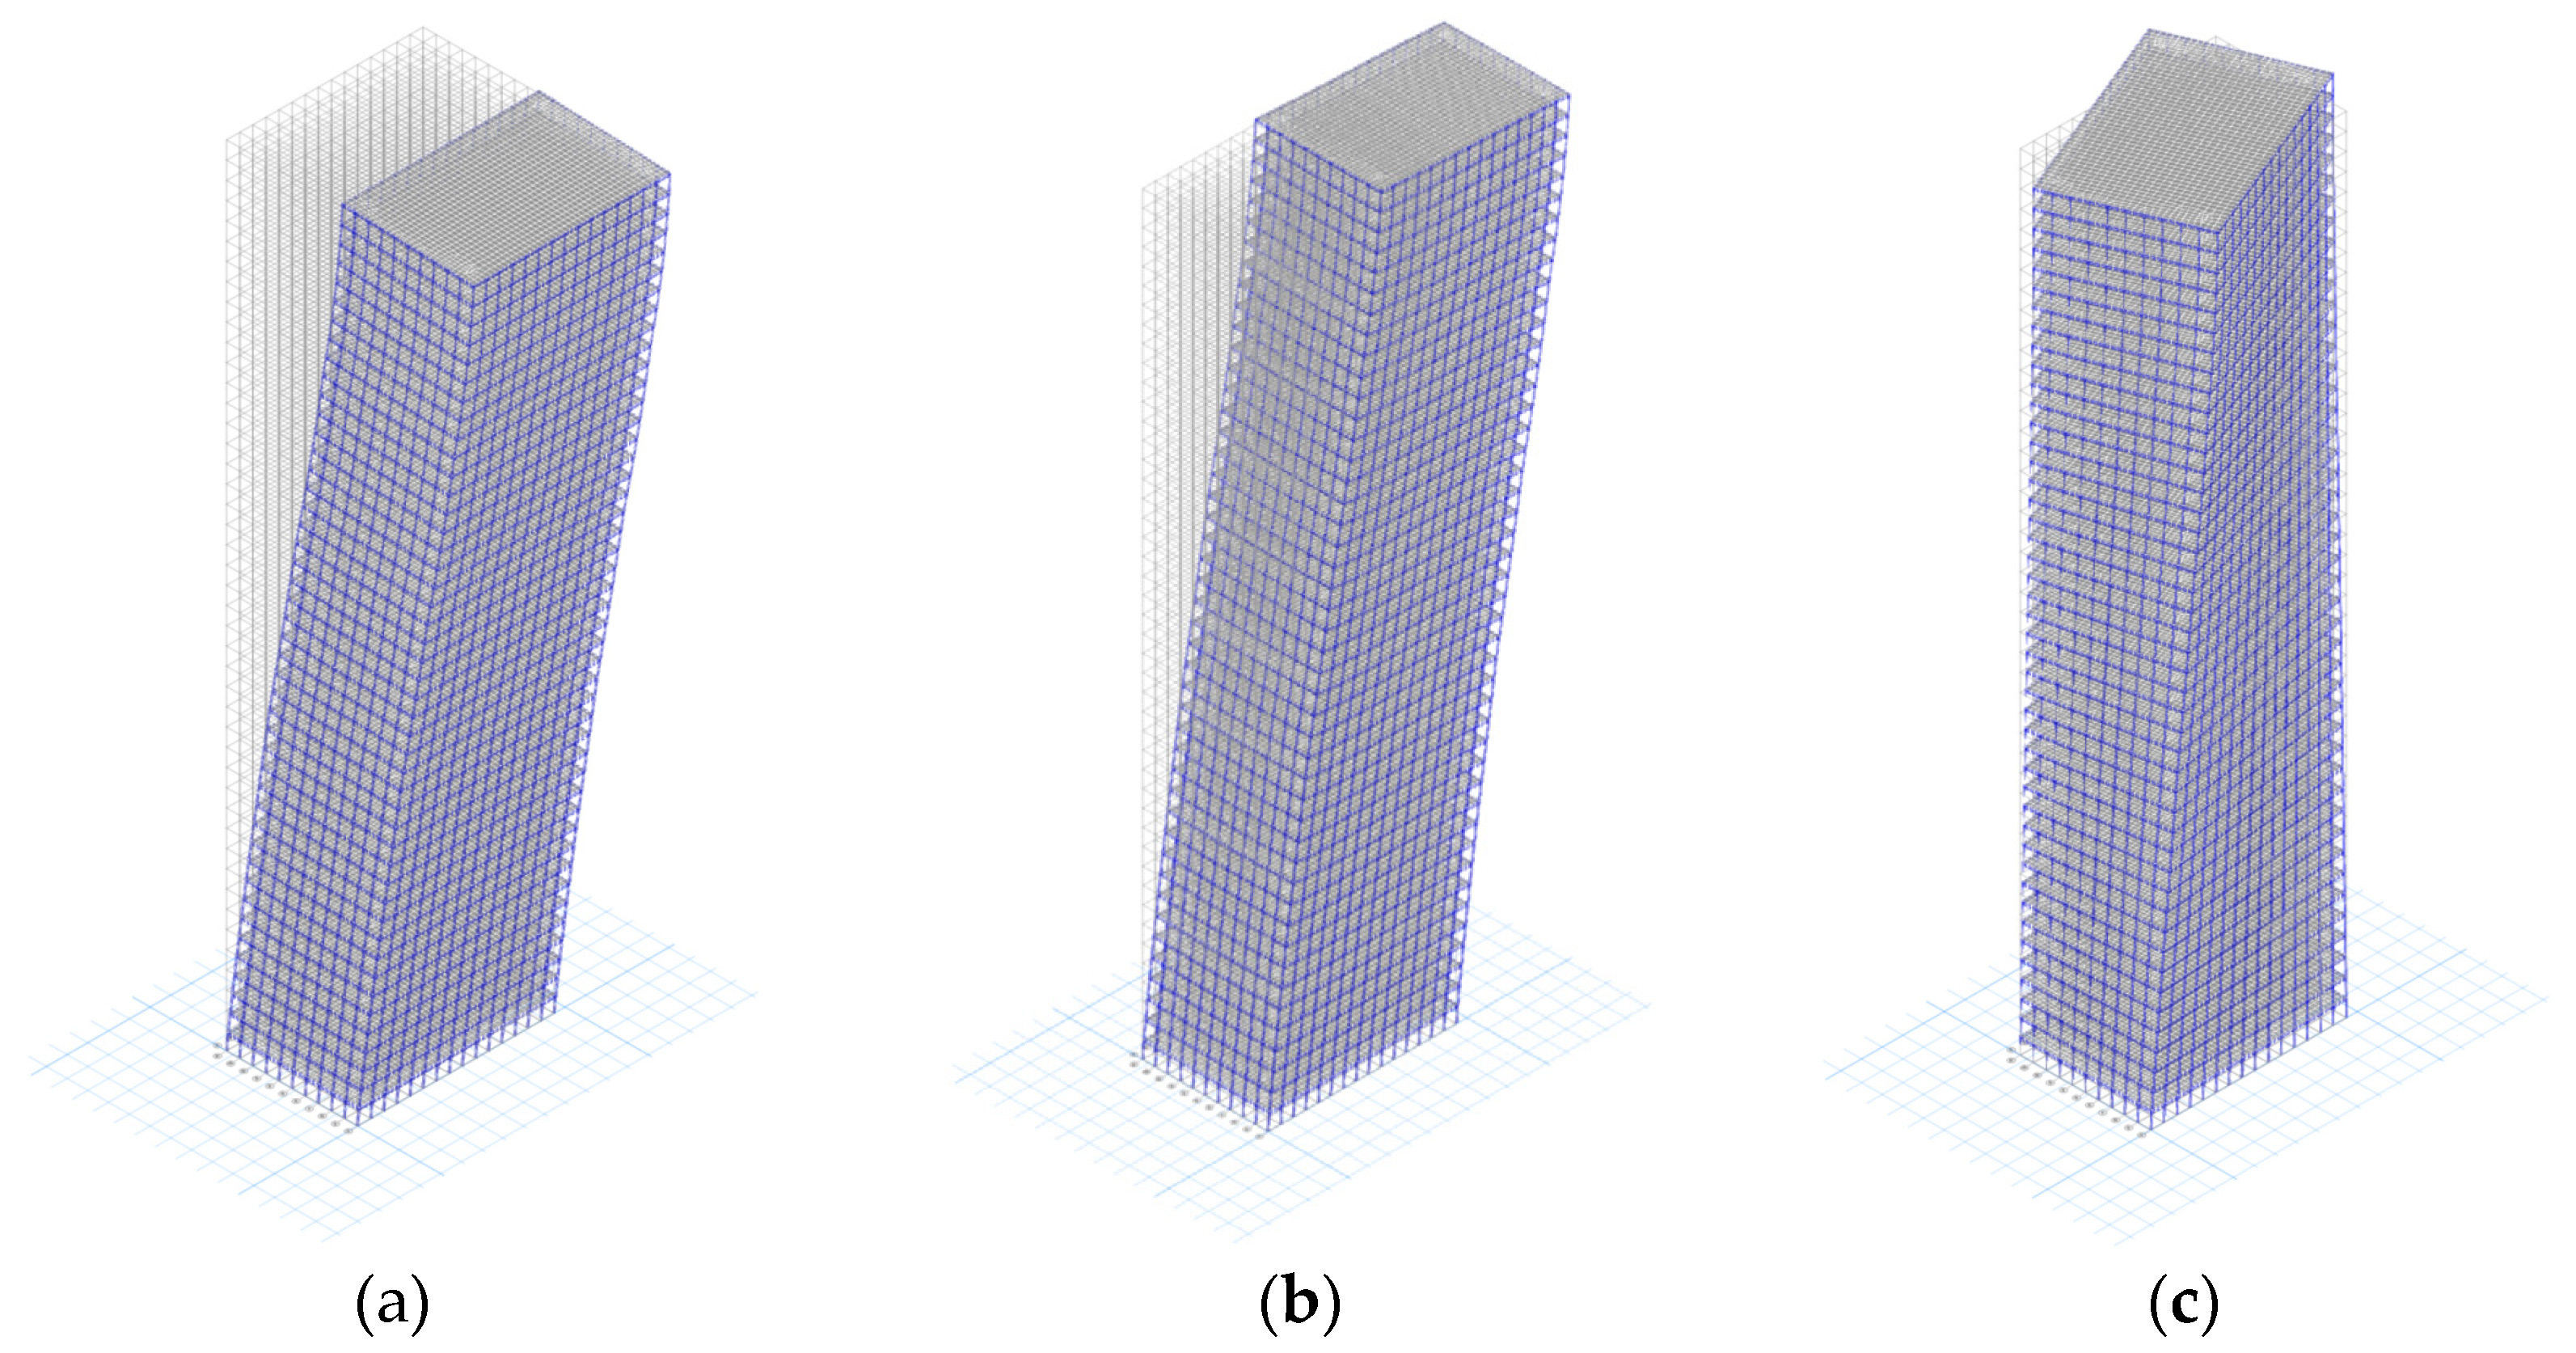
2.2.1. Finite Element Model Validation of CAARC Building

The full-scale CAARC structure is 180 m tall, with 45 similar storeys (each storey is 4 m in height), with a 10-bay-by-15-bay steel rectangular skeletal framework, as seen in Figure 8a. Each bay is 3 m wide. The validated CAARC structure’s steel size members are based on the work of past scholars [61,62], and designed based on a preliminary strength check according to the AISC steel code (2001) to accurately replicate the validated model, as previously mentioned in Section 2.1. The steel columns and beams are selected based on the W14 and W30 sizes, respectively. The remaining structures (e.g., 140 m, 100 m, and 60 m) will be designed similarly to maintain the preliminary strength check (see Table 2). A fixed ground connection is considered to give the overall building a rigid floor connection. The structure acts as a moment-resisting frame, transposing forces from the beams to the columns and to the fixed ground connections. The steel structures’ modal damping ratios are at 2% to calculate the dynamic drift responses, as the damping ratio was utilised and validated based on the work of Chan et al. [61] and Huang [62]. The density of steel is considered to be 7850 kg/m3, with a Young’s modulus and Poison’s ratio of 200,000 MPa and 0.25, respectively. The first, second, and third modes are found to be at 0.198, 0.281, and 0.361 Hz, respectively, and they were validated with acceptable frequencies based on the work of Huang [62]. This can be visualised in Figure 9, representing the first three mode frequencies of the standard CAARC structure. Based on their height and applied time–history mean wind velocity, all examined structures produced different natural frequencies.
Twelve additional structures were also included in the analysis, mirroring the same structural properties (natural frequency and steel sections) of the reference structure exposed to a mean wind velocity of 40 m/s at each height (i.e., 180 m, 140 m, 100 m, and 60 m). These structures utilised the same beams and columns selected as the referenced structure. For each height, two structures with distinct properties were examined under wind velocities of 50 m/s, 30 m/s, and 20 m/s, while one structure were analysed under a mean wind velocity of 40 m/s. This comprehensive approach, totalling twenty-eight structures, allowed us to explore the dynamic responses of the examined structures across a spectrum of wind velocities, providing valuable insights into their behaviour under varying conditions. Table 3 presents the design for an along-wind and across-wind base shear force, and the torsional base torque from the wind-induced structural loads at a velocity of 40 m/s acting on a CAARC structure of 180 m, 140 m, 100 m, and 60 m height. The provided base shear forces for both the along- and across-wind directions were computed through combining all forces acting on each storey level from the cumulative impact of the applied wind loads acting on the overall structure. This was numerically derived thoroughly using a validated FEM analysis.
In the FEM analysis, the structure considered is in a dense, metropolitan location with multiple structures in proximity. As previously mentioned in Section 2.1.3, the overall applied wind loading was acquired using the numerical LES analysis. The across-wind direction (x-direction) of the analysed structure is found to have a more significant displacement and drift than the along-wind direction (y-direction) response of the structure under a 0° wind angle of attack; see Figure 8a–c for a comparison of the maximum top lateral deflection and inter-storey drift along the x-direction at the most critical moment, respectively. Chan et al. [61] and Huang’s [62] studies concluded that the initial member sizes chosen for their analyses exceeded the maximum deflection and inter-storey drift limit ratios of H/400 and 1/400, respectively. This is considered, since the initial member sizes are initially based on the preliminary strength check and are evaluated in an optimization study to maintain drift and deflection strains.

2.2.2. FEM Modelling of Time–History Wind Load and Determination of the Adequate Separation Distance

As mentioned in Section 2.1.5, the two adjacent structures are numerically modelled using the CFD wind simulation to capture forces acting on each structure, and they are then applied to a full-scale FEM model using a time–history analysis to determine the dynamic responses of both adjacent structures. The applied wind load and adjacent structures can be seen in Figure 10. The applied wind forces acting on the structure function as a singular wind force, in x and y directions, are located at the centre of each floor’s diaphragm, as mentioned in Section 2.1.5. All wind forces are scaled to the full-scale mean wind velocity, varying from 20 m/s to 50 m/s in the along-wind direction. The total duration of the FEM simulation is 11.5 min. The results for the validated CAARC adjacent structures are as shown in Figure 11a–c, representing the displacement, moment, and shear force time–history for both building 1 and building 2, respectively.
After simulating the structures in proximity using FEM, the dg,min between structures can be determined. If the dg,min between the two adjacent structures is exceeded by both the building’s lateral deflections, an interaction (pounding) will occur. This interaction will be discussed in the following section, Section 2.2.3. In order to accurately simulate the interaction between two adjacent structures when subjected to extreme winds, each building is considered independent and acts self-standing. Nonetheless, each structure has its own individual dynamic responses and vibrations based on the applied wind forces at a specific time frame. Each structure is modelled as an elastic, multi-degree-of-freedom system and will act as a moment-resisting frame. If pounding occurs, both longitudinal and transverse forces will be captured. The influence of the dg,min on the pounding effect from the two colliding structures is parametrically examined in this investigation. The point of contact if pounding occurs will occur between the stories’ floor diaphragms (among the storey masses). This assumption is believed to be suitable because the studied structures have identical storey heights and overall building heights.

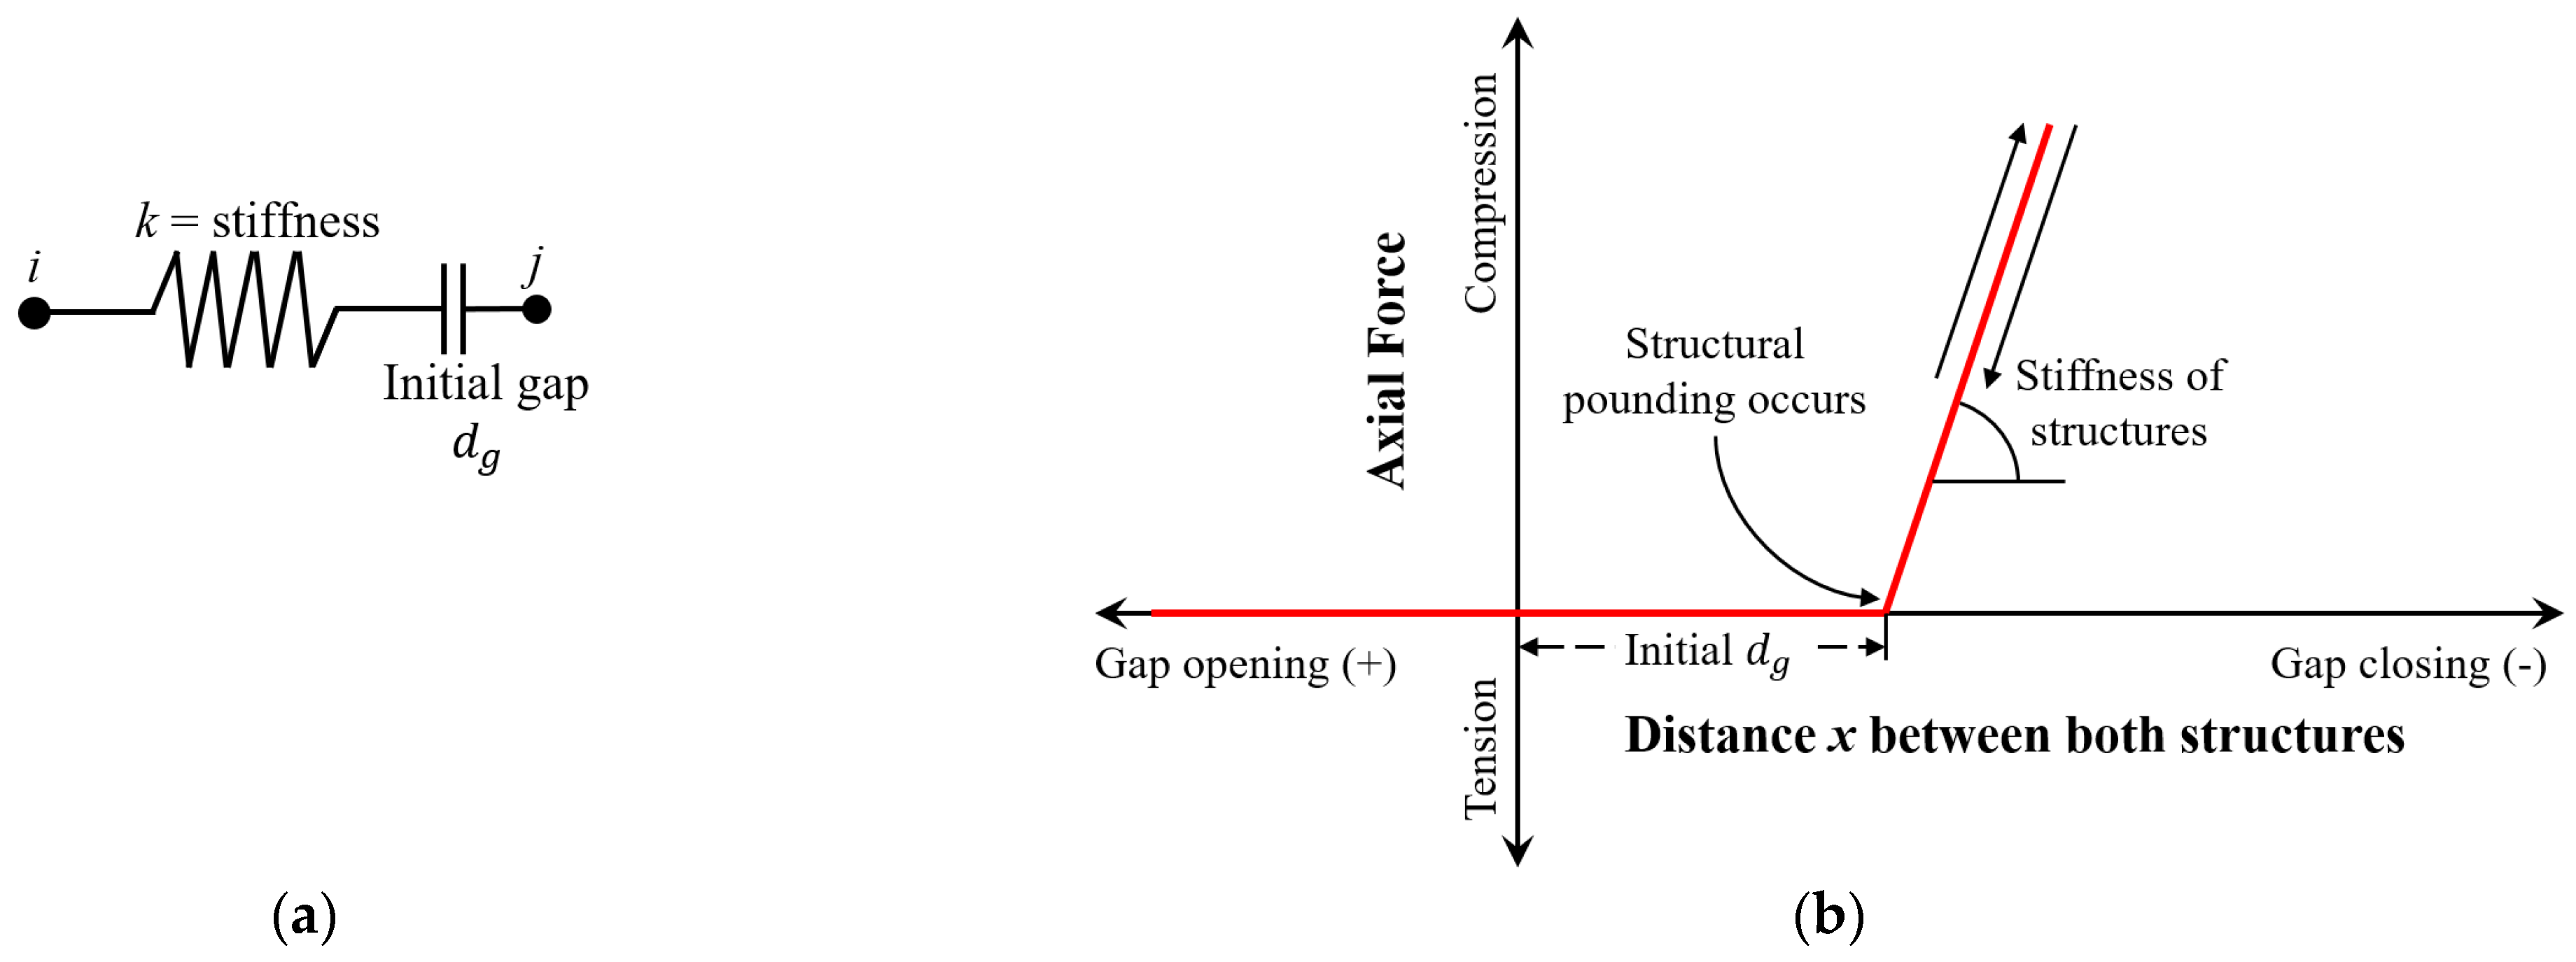
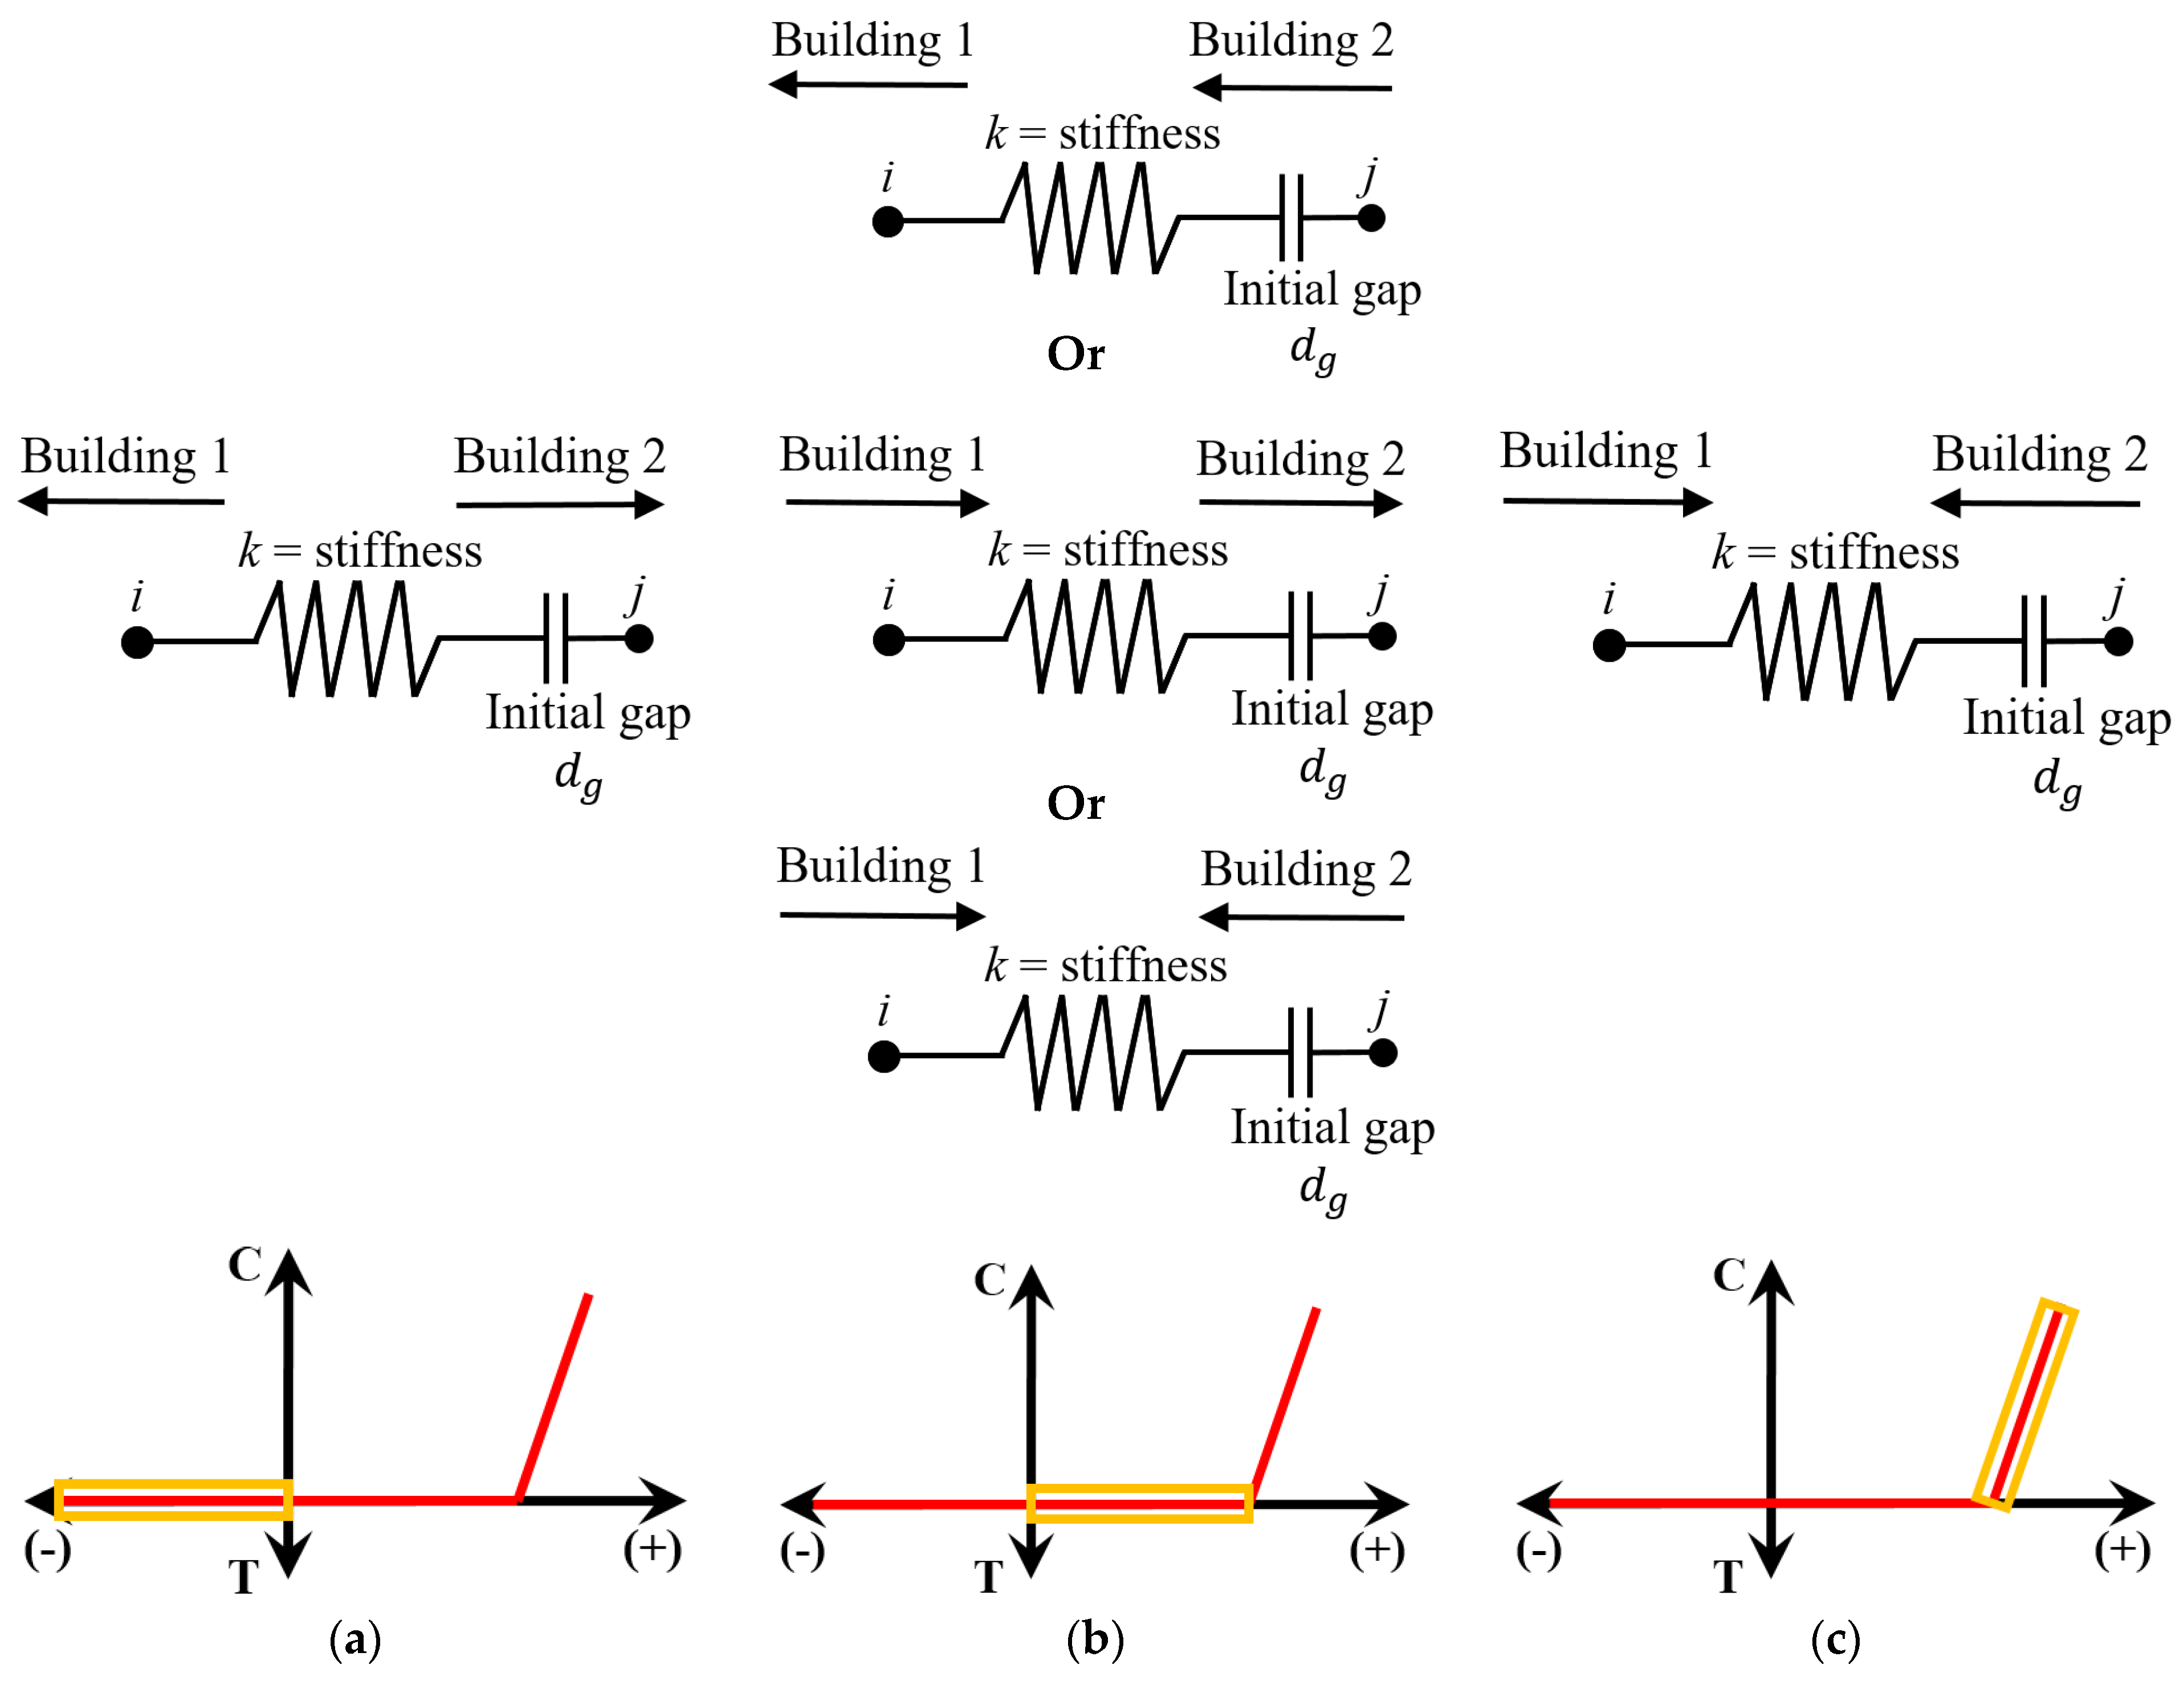
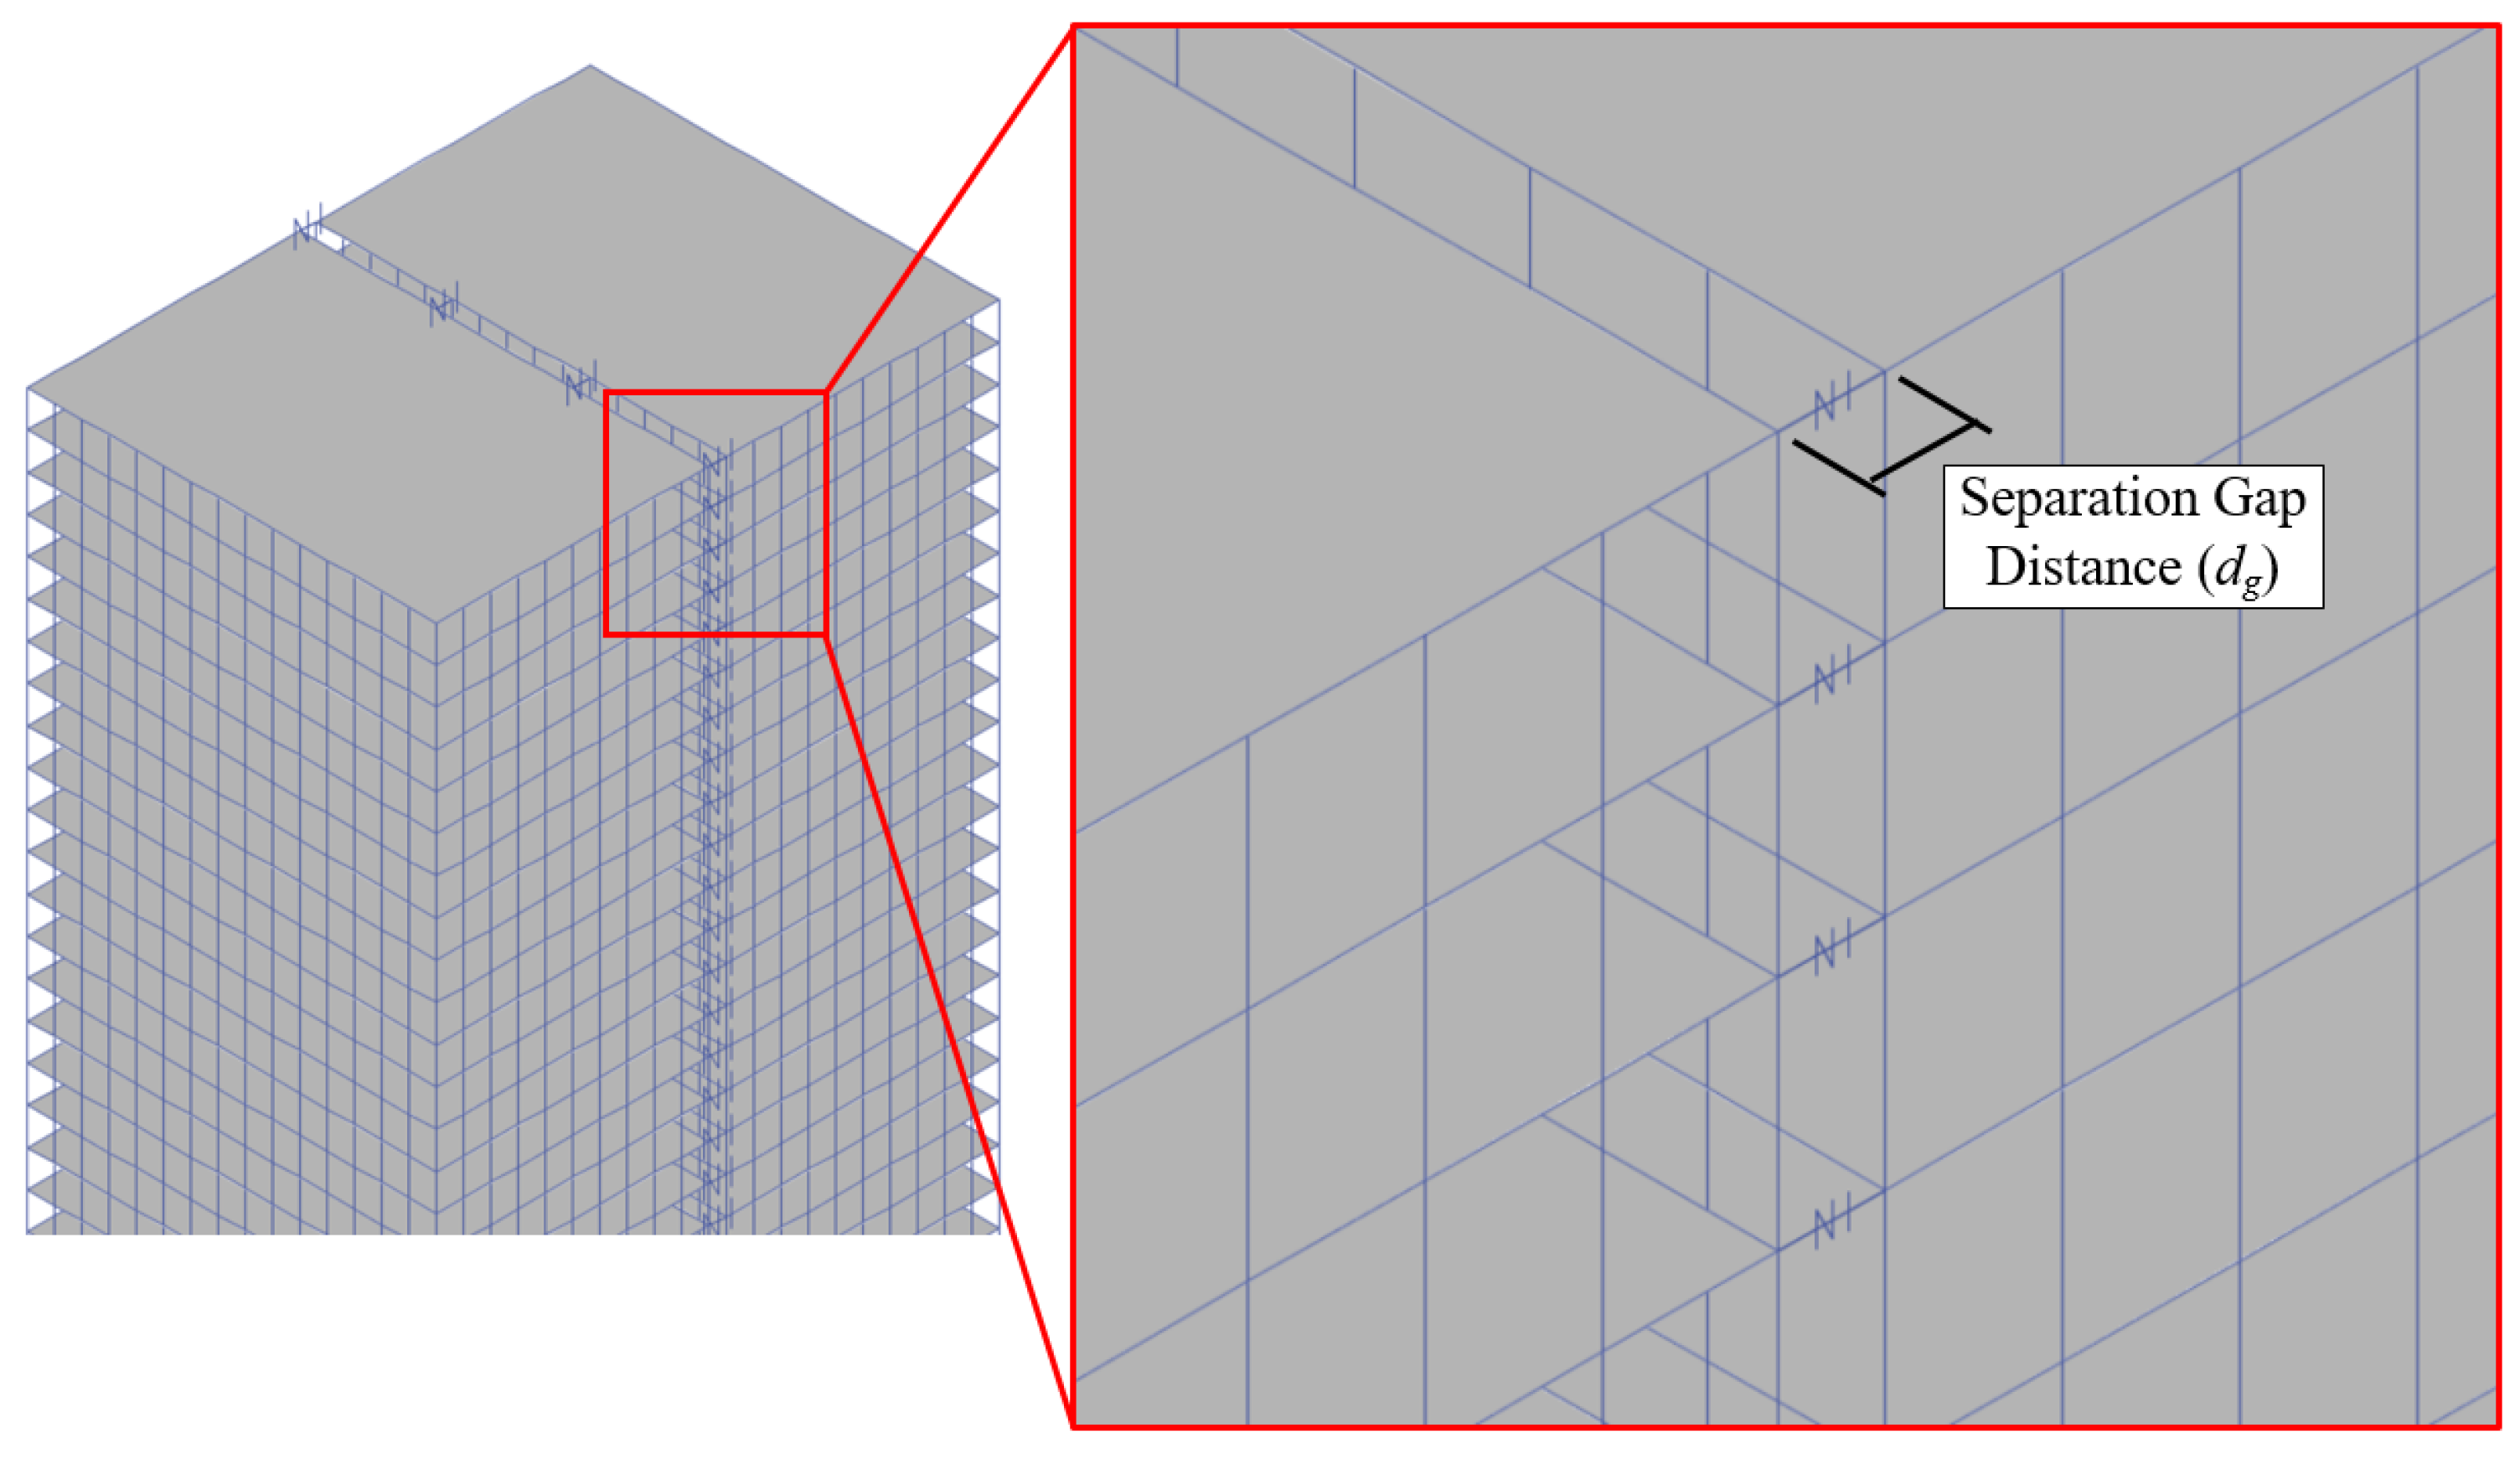
2.2.3. FEM Modelling of the Compression Gap Element

In order to accurately capture forces of the two adjacent structures during pounding, a compression-only gap element in the FEM analysis is considered, see Figure 12a. The compression gap element considers a specified “gap distance”, resembling the separation distance between the two adjacent structures. When this specified gap distance reaches a value of zero, only then will the gap element act as a compression spring. This will record the compression values throughout the applied time–history wind analysis and monitor each structure if any part of the structure comes into contact with the adjacent building (i.e., beams, columns, or slabs) [75,76], as shown in Figure 12b. As this study examines the necessary dg,min required to mitigate pounding, the local effects and progressive collapse of the structure’s columns, beams, and slabs are not considered for this modelled analysis, as it only affects the performance of the structure during and after the pounding effects.
When examining the adjacent structures in proximity subjected to a time–history wind analysis, the contact gap elements will apply in three scenarios. The first instance considers when the first (upstream) structure is either stationary (structurally stable) or laterally deflecting in a negative x-axis direction. In contrast, the second (downstream) structure is either stationary (structurally stable), laterally deflecting in a positive x-axis (opposite of the first structure), or laterally deflecting in a negative x-axis direction that is lesser than the separation gap distance (dg) and the first structure’s lateral deflection combined. The gap element in this scenario will act as an opposing compression force (tension), making the gap element inactive as no contact (pounding) between the two structures has occurred (see Figure 13a). The second scenario consists of the first structure laterally deflecting in a positive x-axis direction. The second structure is either stationary (laterally stable), deflects in a more significant positive x-axis direction than the first structure, or deflects in a negative x-axis direction where the summation of both structures’ lateral deflections is lesser than the dg between both adjacent structures. In this scenario, the gap element will consist of a positive compression value; however, since the dg is not exceeded, the gap element will remain inactive as no contact (pounding) between the two adjacent structures has occurred (see Figure 13b). The third scenario occurs when the summation of both structures’ lateral deflection exceeds the dg between the adjacent buildings. This will produce a positive compression value from the contact (i.e., structural pounding) between the examined structures, ultimately leading to an active compression spring force, allowing the gap element to monitor the pounding forces over the allocated period (see Figure 13c).
To monitor the compression forces when pounding occurs, the spring stiffness (k) in the gap elements must be chosen appropriately. It was reported that k is considered relatively large when pounding transpires [15,77,78]. A constant value of k is uncertain due to the unknown geometric impact surface, materials involved during pounding impact from uncertain structural properties, despite variable impact velocities. A study by Ghandil and Aldaikh [79] found that when the k values are more significant than 1010 N/m, the pounding-involved response is insensitive to the impact stiffness. On the other hand, the impact stiffness coefficient should be between 50 and 100 times larger than the lateral stiffness of the structure involved in pounding [80]. These values cannot be generalised, since they are applicable to the specific numerical and experimental studies [81]. However, the past literature [1,5,78,82] mentions that the structural response is not remarkably sensitive to the alteration of k when considered at relatively high values (i.e., amplifying by a factor of one hundred). Therefore, a pounding stiffness model is implemented in this studied model as a linear elastic model [46,81,83,84]. Once the gap element is activated (i.e., pounding occurs), a pounding force impact ( F I ) is captured at the location of impact, which is expressed in Equation (2):
  F I = k δ f o r δ = u i u j d g
where δ is defined as the relative displacement between the pounding structural elements. The spring stiffness ( k ) is only activated when pounding of adjacent structures occurs in Scenario 3 (see Figure 13c). u i , u j are the displacement of the element nodes i and j, respectively.
To determine k for the gap element, the examined models’ structural stiffness need to be evaluated [80]. Therefore, the structure’s stiffness (kT) is obtained from determining a shear force (V) from an applied load acting on the examined structure, as per Equation (3).
V = k T × u
where V is defined as the structure’s shear force, which represents the summation of applied forces in a given direction. kT and u are defined as the overall structural stiffness and lateral displacement of the structure, respectively.
V, kT and u are shown in Figure 14 to represent a 10-storey skeletal frame structure with applied wind force, V. Equation (3) is then rearranged to determine kT in order to determine k for the gap element. Once kT is defined, a multiplication factor of 50–100 times is applied [80]. Therefore, a single applied force, V, of 106 N is considered to act only on the top storey diaphragm of the 45-storey structure, perpendicular to the longest side of the building (i.e., 45 m long side). This is equivalent to the base shear force of the structure. A maximum lateral displacement ( u ) of 82.64 mm was determined, meaning the overall stiffness of the structure (kT) is approximately 12.1 × 10 6 N/m. A compression gap element stiffness (k) per storey of 12 10 8 N/m was determined from k T × 100 . To assure that the acquired k is sufficient for all examined structures, a comparison with altering k (i.e., 6.6k, 5k, 3k, 2k, 1.66k, 1.33k, k, 0.66k, and 0.33k) was performed. It is found that the FEM captures an average pounding force of 12,800 kN for various gap element stiffnesses, k, as shown in Figure 15. Therefore, a k = 12 × 10 8 N/m is determined to adequately capture the average pounding force for all the examined models.
A sensitivity analysis is performed to determine the required number of gap elements. In the examined pounding model, results have shown pounding to occur only in the top three floors, depending on the separation gap distance. Therefore, a total of ten floors are modelled with gap elements. Since there are a total of fifteen bays in the longitudinal direction of the structures (e.g., 45 m long side), a total of sixteen column-to-beam connection locations would be used for locations of the gap elements. A compared analysis of 1, 4, 9, and 16 gap elements is studied, as shown in Figure 16, with the sum of FI at the time instant of impact. Altering the number of gap elements to capture the total FI, the most considerable difference in FI is between one and nine gap elements per storey, with a difference of 2.42%. It is determined to accurately capture and monitor the pounding of structures; four gap elements were evenly spaced out among the longest side of the adjacent structures were considered. The value k is considered to be equal to 3 × 10 8 N/m per compression gap element throughout all the examined structures. Each storey consists of four gap elements, with a total of 40 gap elements monitoring the pounding forces acting on the colliding structures. Figure 17 shows the locations of the gap elements on the adjacent structures.

2.3. Development of Mathematical Formulas to Determine Minimum Separation-Gap Distance (dg,min)

The mathematical formulation can be determined for the required dg,min by examining various input properties relating to the structure’s lateral deflection. Such parameters can include the structure’s natural frequency (Fn), building height (H), and applied mean wind velocity (v). The mathematical formula aims to determine the required dg,min between two adjacent structures in proximity to mitigate the pounding interaction. A genetic algorithm (GA) is adopted in this study to optimise the numerical formulation. The adopted GA [85,86] was developed at the Computational Synthesis Lab at Cornell University [87] from a numerical package called “Eureqa”. The GA technique involved many numerical simulations of the objective function association to several initial entries (i.e., a combination of different variables over multiple generations) [33]. The process of directly evaluating the objective function (i.e., minimum separation-gap distance), involving CFD and FEM analysis, can ultimately become costly. Conducting CFD simulations to obtain wind loads and subsequently employing FEM analysis for the structural responses demands a substantial computational effort. Utilizing GA not only reduces computational costs, but also streamlines the process, enabling a more practical and feasible determination of the objective function. This optimization ensures a balance between computational efficiency and achieving accurate and reliable results.
The GA uses design variables, which are coded as real numbers, and is adopted for the optimizing formulation. For detecting equations and hidden mathematical relationships in raw data, the GA uses a symbolic regression [88]. One key advantage of GA is its ability to find the global extreme value without being confined to a local extreme value (i.e., maximum or minimum extreme value). The GA process initiates from a search process, including multiple raw data points in the search space. In addition, it will include mutation operators that will generate search points away from the high fitness region. This will help avoid any search points being trapped within a local extreme value [33]. The GA has been reported by past scholars [33,89,90] to be efficient in determining the optimal solution in similar complex engineering optimization problems, and more information regarding the GA can be seen in past studies [91,92].
Genetic programming (GP) is a branch of genetic algorithms (GA) known for its evolutionary approach, generating a population represented by tress structures [93,94]. Inspired by fundamental genetic algorithm operators such as selection, crossover, and mutation, GP derives an intuitive methodology basis from GA [95]. The program represents an operation or numerical value (e.g., addition, subtraction, multiplication, or division, etc.) for each corresponding node. Each program is evaluated by running a test set, with the best suited programs selected for producing the next generation through crossover and mutation [94,95,96,97,98]. Similarly, a GA initiates with a predetermined number of individuals forming an initial, which each are a possible solution to the problem [99]. The GA then forms a set of selection, crossover, and mutation, based on the initial population.
The GA used in this analysis uses a combinations of different design parameters labelled as the “candidate” and represents other dynamic variables. The GA starts its optimizing process by initiating the search using the initial candidate, also known as the “initial population.” Within the initial population, the objective function is evaluated for each candidate. This will sort the candidates according to their own suitability (i.e., lowering or elevating the value objective function). To produce better candidates (offspring), the crossover and mutation operators must be applied to the current population. The crossover operators will be applied to the candidates (parents) with higher suitability to seek better performing offspring. Additionally, the mutation operators are applied to the parents with lower suitability to explore the possible different regions within the search space and help avoid any stagnation in local extreme values [33,100]. The GA process of applying the operators and producing new generations will maintain optimization until there are no substantial improvements over generations. Therefore, the last generation for the best suited candidate is considered the GA optimal solution.
In the current study, the GA will aim to find the dg,min needed to mitigate structural pounding from two adjacent structures in proximity. The objective function is set to be the minimum separation-gap distance (dg,min). For each combination of design variables (candidate), the objective function is evaluated for four increments of mean along-wind velocities (v) at the reference building height (i.e., 20 m/s, 30 m/s, 40 m/s, and 50 m/s). The design variables, H and Fn, represent the structural height and its overall mass and stiffness, respectively, where Fn is defined in Equation (4). Table 4 summarises all the examined training samples used to train the mathematical formulas. In the presented study, the lower and upper bounds are set to 60 m and 180 m for H, respectively, while the lower and upper bounds for Fn are set to 0.148 Hz and 0.416 Hz, respectively. These parameters are applied throughout the FEM analysis.
F n = 1 2 π k m   ( H z )   .
where m is the mass (kg) and k is the stiffness (N/m) of the structure.

3. Results of the Performed Parametric Study

Twenty-eight examined structures in proximity with equal height involved in an extreme wind-induced occurrence to determine the required dg,min are examined and discussed.
The parametric study used FEM analysis to calculate the lateral deflections of two adjacent tall structures in order to determine the adequate dg,min to avoid wind-induced pounding. A graphical comparison of the two adjacent structures is shown in the following figures, representing their lateral displacement responses (sufficient dg,min for preventing a pounding event). Figure 18 shows the time–history of the two adjacent 180 m tall structures (acting on the 45th storey for their lateral deflection) subjected to a synoptic wind with a mean velocity of 40 m/s at a building height with a dg at 2000 mm. The dg,min required to prevent a collision for this scenario at the top of both structures is 1898.64 mm. It can be noted from Figure 18 that at the time instant of 628 s, both structures have a significant spike in their lateral sway. Such lateral deflection based on the structure can occur due to the natural sway frequency of a building with a similar natural frequency of vortex shedding acting on the specific structure as the applied mean wind velocity. This will cause the structure to have a dramatic spike in its sway with a lower mean wind velocity than the deflection of a structure with higher applied mean wind velocities. Figure 19a shows the collision (i.e., pounding) of the two 180 m tall adjacent structures with a dg equal to 1800 mm. As shown in Figure 18, the dg between structures is 2000 mm and came into proximity at 628.17 s; however, no collision of the structures occurred. Since the gap elements are not activated, no forces were produced because the structures did not come into contact. Therefore, Figure 19a came into contact at the same time, since the dg reduced to 1800 mm, even though the required dg,min was concluded to be 1898.54 mm. Figure 19b,c display the pounding forces acting on the two structures when a collision occurs (t = 628.17 s). Figure 19c compares the forces applied at storeys 45, 44, and 43 when the pounding of structures occurs.
For a pounding force where the sufficient dg,min is inadequate, a similar mathematical formula can be developed to estimate the expected pounding force as a function based on certain preliminary factors (i.e., H, v, Fn, and dg,min). The pounding force in this scenario is recorded with the compression gap element, as described in Section 2.2.3. In Figure 20, Figure 21, Figure 22 and Figure 23, a similar time–history comparison was conducted, as shown in Figure 18. The applied time–history velocity in Figure 20 is 50 m/s on two adjacent 180 m tall structures. Figure 21, Figure 22 and Figure 23 show that the applied mean wind velocity is 40 m/s on two adjacent 140 m, 100 m, and 60 m tall structures, respectively. The initial separation distance utilised in Figure 20, Figure 21, Figure 22 and Figure 23 are stated in the figures (i.e., 3000 mm, 1000 mm, 500 mm, and 400 mm, respectively). Figure 24 compares all twenty-eight models to determine the dg,min required, depending on the structure’s height, natural frequency, and applied mean wind velocities. As noted, tall and slender structures are more susceptible to more significant structural sway, even with a lower applied lateral load.
Figure 24 shows that dependent on the two adjacent structures’ heights, an increase in separation distance is required under the applied mean wind velocity to achieve a dg,min to mitigate a pounding event. However, a drastic increase in the required dg,min for the 180 m structures at an applied mean wind velocity of 30 m/s is recorded. This can be due to the structures’ natural sway frequency having a similar natural frequency of the vortex shedding on the specific structure from the applied wind force at an instant of time. A more significant lateral deflection can then occur for the structure subjected to wind. This can also be seen on the 100 m tall structure for the applied 30 m/s mean wind velocity but for a smaller lateral deflection. As can see in Figure 24, comparing the dg,min required for all structures subjected to the applied mean wind velocity from 40 m/s to 50 m/s, the smallest change increases by 15.45% for the 180 m tall structures; however, it decreases from the 30 m/s to 40 m/s at −15.08%. For comparing the applied mean wind velocity from 20 m/s to 30 m/s on the height of each structure, the smallest change for the required dg,min increases by 48.71% on the 100 m tall structures. Thus, the dg,min required for the 100 m tall structures subjected to a mean wind velocity of 20 m/s is 229 mm compared to a dg,min required for a similar structure’s height subjected to a mean wind velocity of 30 m/s which is 446 mm. The most remarkable change in required dg,min appeared for the 180 m structures from 20 m/s to 30 m/s with a change of 67.61%.
When evaluating the determined minimum gap distance, dg,min, based on the structure’s height, applied mean wind velocity, and structure’s natural frequency, a comparison with existing building codes, such as the Eurocode 8 and ASCE 7-16 [101,102], becomes critical. These codes stipulate that the total separation distance between adjacent structures should exceed the Gap Distance (G.D.), calculated as Equation (5). The maximum inelastic deformation of each structure is based on the critical locations with considerations for all translational and torsional displacements of the structure, including its torsional amplifications.
G . D . = 1 2 + 2 2
where 1 and 2 represent the maximum displacements of adjacent buildings at the same level in the first structure. However, it is important to note that adherence to these guidelines may not always guarantee pounding mitigation in the presence of significant ground motions or intense wind phenomena [14,103].
For instance, in the case of a 180 m tall structure subjected to a mean wind velocity of 40 m/s, the calculated dg,min was equal to 1898.62 mm. In comparison, assuming the maximum lateral displacement of each structure was 900 mm, simultaneously, the calculated G.D. using Equation (5) would be 1272.8 mm. This result indicated that the prescribed gap distance would not be sufficient to mitigate structural pounding under these conditions. Consequently, Section 4 outlines the need for further investigation to develop formulations for a reliable separation gap distance specifically tailored to address wind-induced structural pounding.
Figure 25 shows a comparison between the deflection time–history of the upstream structure (building 1) when an adequate gap distance is provided (dg = 2000 mm) to a similar structure with an insufficient gap distance (dg = 1800 mm). It can be noted that a drop in deflection happens at the instant when pounding occurs (t = 628.17 s). However, the deflection of building 1 alters after pounding happens, but not substantially. After numerically analysing the required dg,min to mitigate structural pounding, results indicated that the most critical pounding occurrence (and deflection) occurs at the tallest point of the structure due to its most considerable lateral deflection (i.e., 45th storey for the 180 m tall structure), and decreases when analysing lower stories of the structure. From the parametric examination of an adequate dg,min from wind-induced structural pounding, outcomes can conclude that a dg,min will vary depending on the structure’s height, modal period, and the applied wind forces. For all structures, the dg,min will increase when the natural frequency decreases, mean wind velocity increases, and structural height increases. This correlation will be discussed in the next section of the manuscript (Section 4).

4. Formulated Minimum Separation-Gap Distance (dg,min)

This section aims at developing mathematical formulas to determine the required minimum separation-gap distance (dg,min) to avoid structural pounding based on the building height, natural frequency, and the applied wind. To select the best model that provides the most reliable evaluation for the objective function, a variety of mathematical models need to be examined (i.e., polynomial, trigonometric, exponential, and logarithmic functions). As mentioned in Section 2.3, the GA used different combinations of geometric parameters (i.e., building height, natural frequency, and mean wind velocity) with twenty-eight samples to determine the required dg,min. More than 2.1 × 10¹² formulas were evaluated and then ranked based on their correlation coefficient (r). The correlation coefficient is considered as the Pearsons correlation coefficient for the GA and can be shown in Equation (6).
r = 1 n i = 1 n f x i f x ¯ s f x y i y ¯ s y .
where n is the number of same samples, f x i and f x ¯ are the function of sample x i and mean values of x-variable, respectively; y i and y ¯ are the y-variables in a sample and mean value of the y-variable, respectively; and s f x and s y are the uncorrected sample standard deviations of the model and target variable, respectively. The most applicable analytical models and their formulas for evaluating the objective function can be seen in Table 5. The highest correlation coefficient obtained is 0.9987 with a mean absolute error of 22.34 mm. Figure 26 shows the regression plot for different trained GA models dependent on their generated ranking.
The optimised GA procedure is conducted to determine the dg,min between two adjacent structures until the optimal solutions are obtained after 154 generations, in a total of 24 h on an 11th Gen Intel(R) i7-11700K, 32 GB RAM, GeForce RTX 3070. Figure 27 shows the fitness curve for the optimal GA formula where the objective function (required dg,min) of the best fitness candidate accuracy is plotted versus the generation number. The plotted illustration displays the improvement of the objective function (dg,min required) over the optimised GA formula. As mentioned previously, the maximum error recorded is 22.34.
After the best candidates were generated and a GA formula was conducted and identified to determine the required dg,min, a FEM analysis was produced with modifications toward all the geometric parameters. This is to verify the GA formulation to confirm the dg,min to be acceptable for preventing a wind-induced pounding event. Since all twenty-eight examined samples took into consideration the limits of the preliminary strength check according to the AISC steel code [104], therefore, the Fn ultimately reached the smallest threshold based on the applied mean wind velocity. Namely, each structure with the most considerable lateral deflection is concluded based on its building height and applied wind force. All FEM simulations with altered geometric parameters compared to the highest rank GA formula concluded to have a lower required dg,min, since the considered GA formulation for the dg,min relied on having the maximum lateral deflection on both structures, based on the applied mean wind velocities, structural heights, and the governing natural frequencies. Therefore, to adequately design for tall structures in proximity in extremely high-wind locations, the GA formulation for designing a sufficient dg,min overestimates the required dg,min, eliminating any possible wind-induced structural pounding.

5. Conclusions

The current study conducted a parametric analysis to develop a mathematical formulation for estimating the required separation distance between two adjacent structures in proximity and of equal heights subjected to wind. The study used an LES model to determine the applied time–history wind forces acting on the two adjacent structures. The forces were then applied to a non-linear FEM simulation to predict the structure’s response. Twenty-eight modelled buildings were considered as inelastic multi-degree-of-freedom skeletal steel structures. Once developed, a genetic algorithm is then developed to optimise a mathematical formula to determine the required separation distance between the two adjacent structures in proximity, based on the building height and natural frequency along with the applied wind. The developed mathematical formula are then compared to alter their geometric parameters using FEM numerical analysis. Throughout the process of the study, various detailed conclusions are deduced as follows:
  • Introducing a required separation gap distance between two adjacent structures in proximity from wind-induced events can ultimately mitigate any additional lateral forces causing a collision.
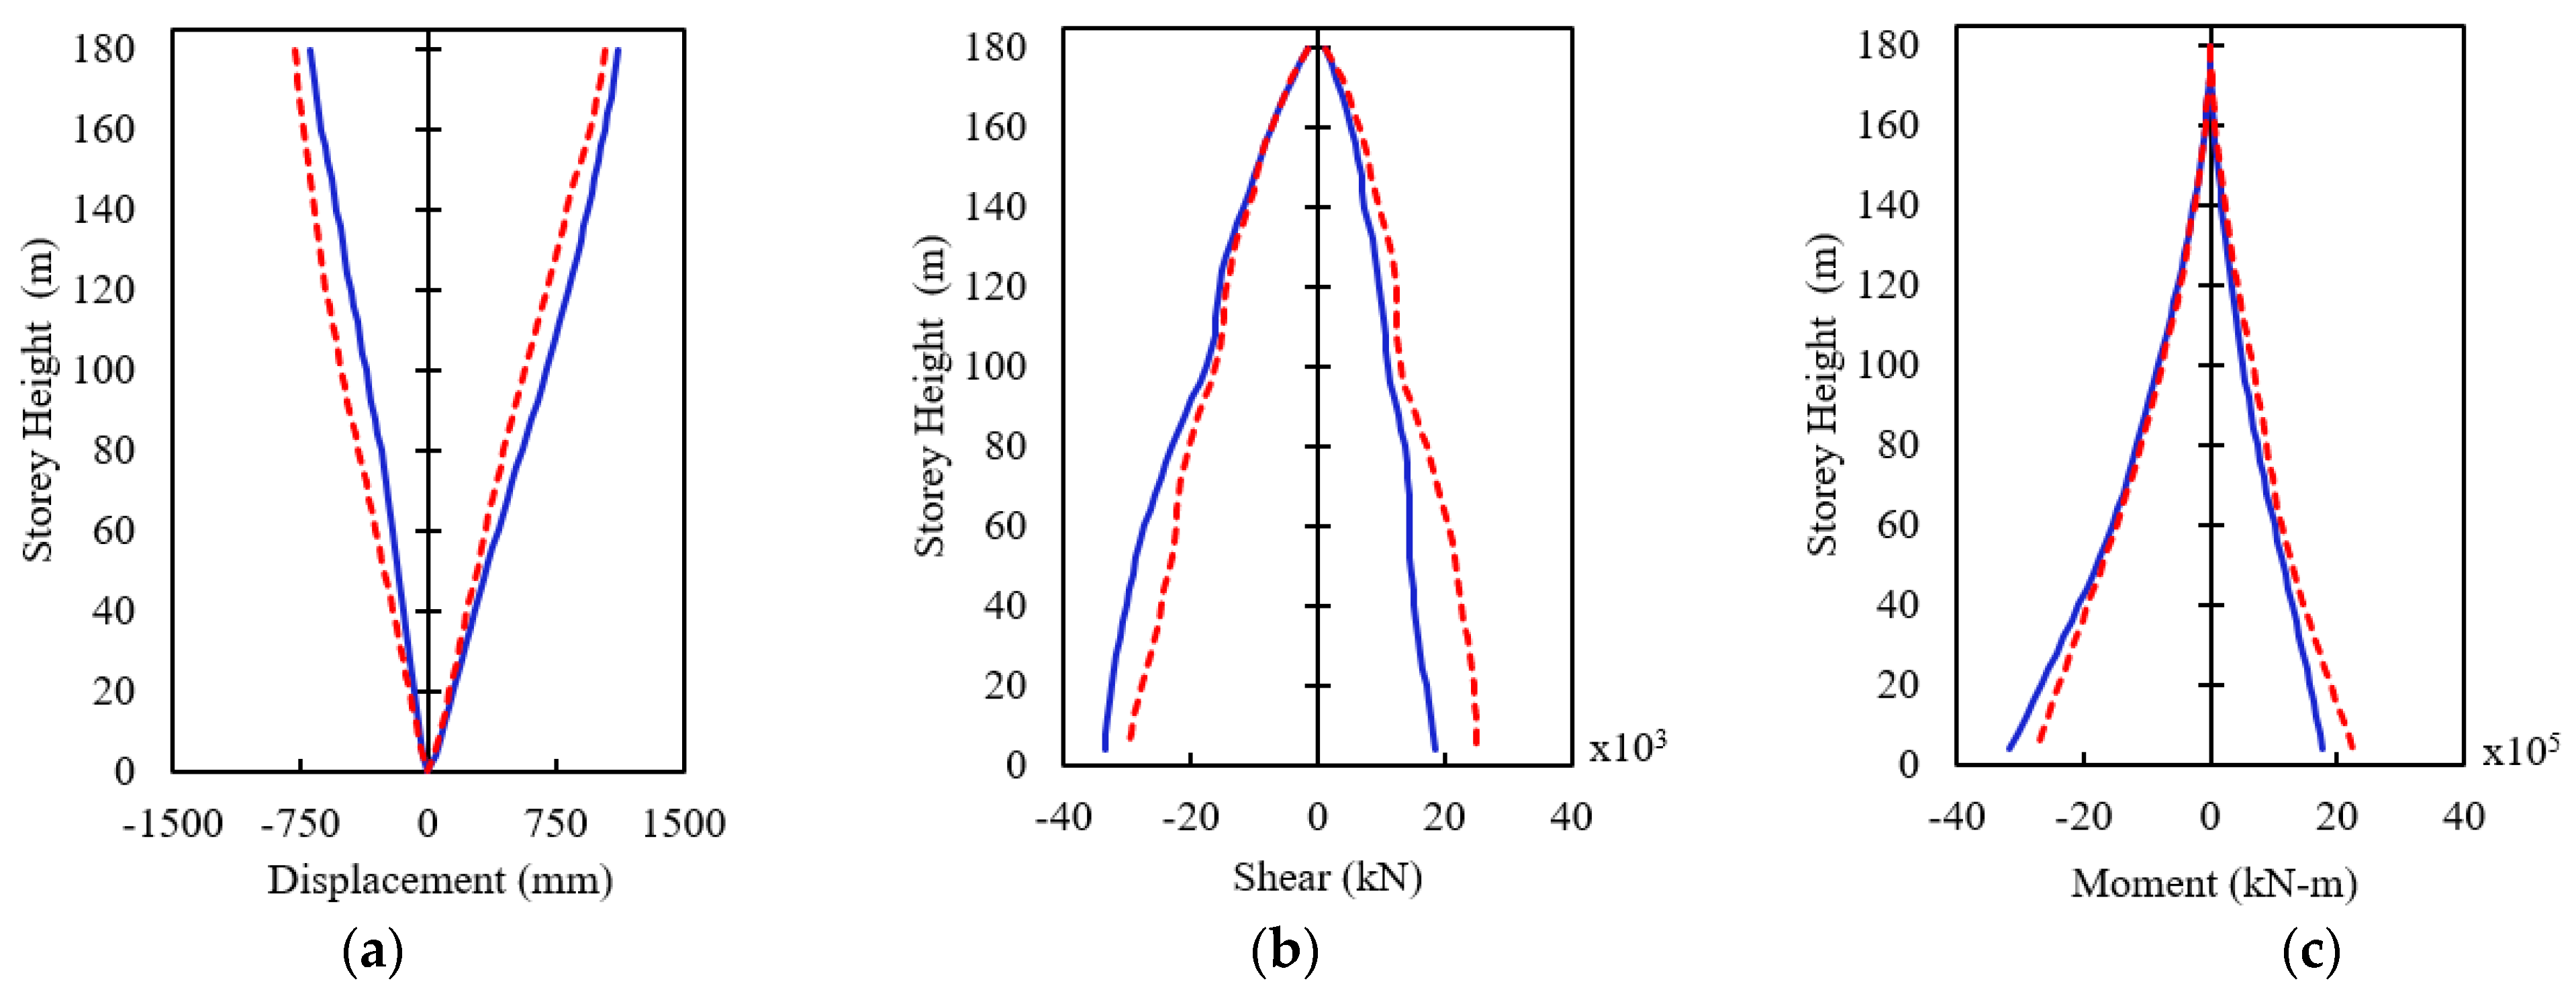
  • The majority of the upstream structures subjected to wind and in proximity based on their height, dynamic responses, and applied mean wind velocities have a more significant peak lateral deflection than the following adjacent structure.
  • A similar trend in the required separation distance is noticed compared to structures of a similar height with altering natural frequencies and applied mean wind velocities. The lowest change in the required separation distance is at the 180 m structure from an applied mean wind velocity of 40 m/s to 50 m/s with a change of 15.46%. The most significant change in required separation distance is at the 180 m structure from an applied mean wind velocity of 20 m/s to 30 m/s with a change of 67.61%.
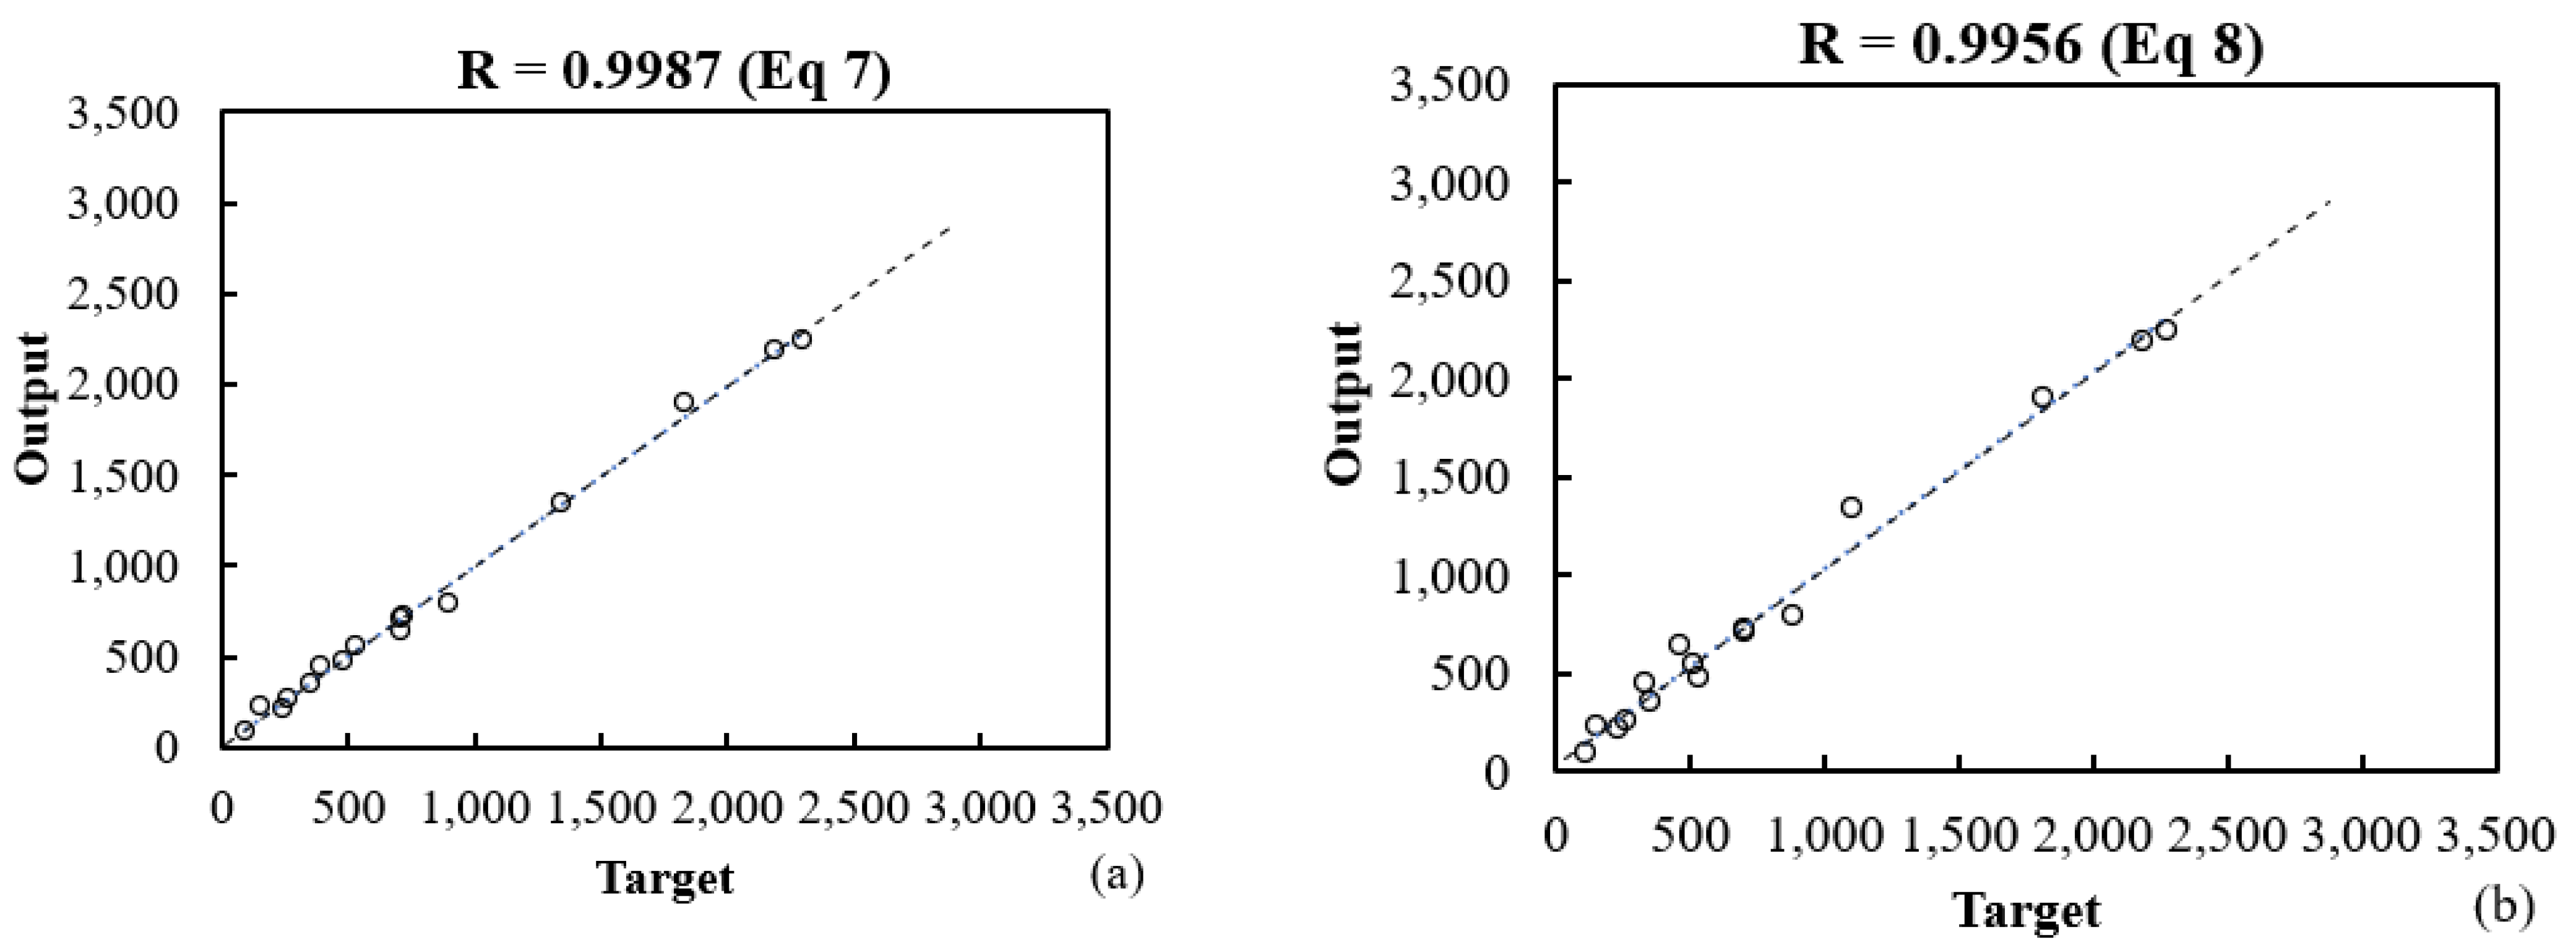
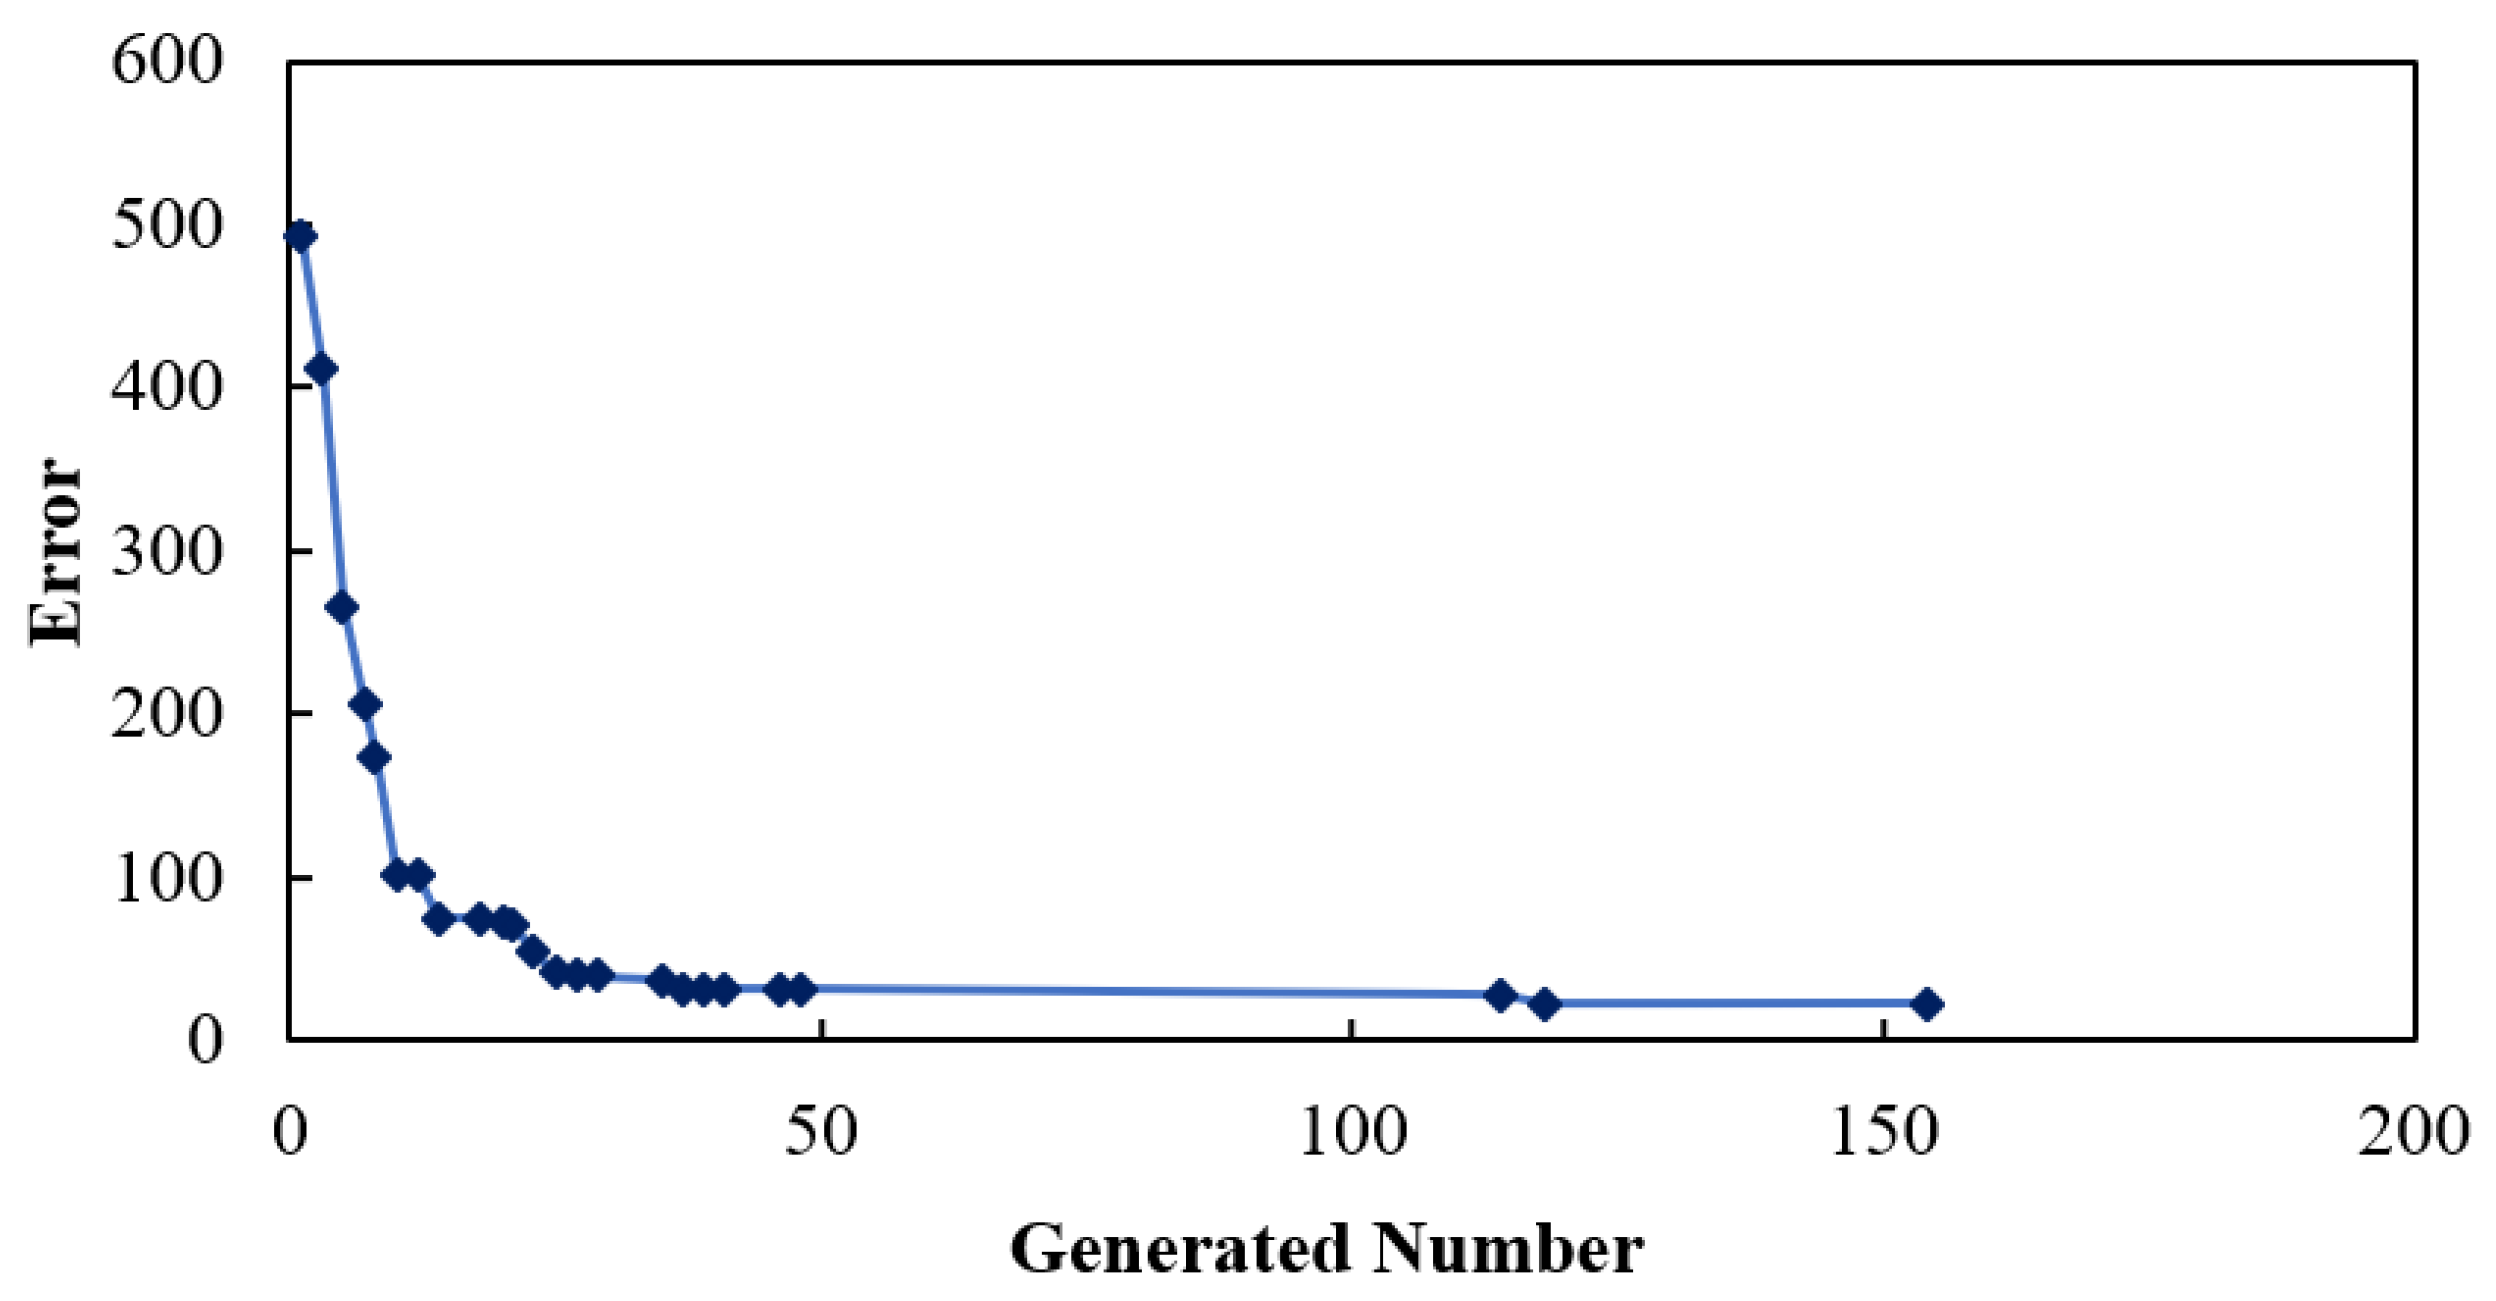
  • Determined mathematical formulas for the required separation distance can become complex. Nevertheless, the developed mathematical formulas accurately captured the expected required separation distance. Including all parameters in a genetic algorithm that are most consistent when such parameters are altered (i.e., building height, natural frequency, applied mean wind velocity).
  • The best-suited genetic algorithm determined can acquire complex variations in the objective function and fit the trained database with a correlation coefficient of 0.9987. This has accelerated the mathematical optimization process substantially.
  • While the developed formulations to achieve a minimum separation-gap distance are tailored for a generic building shape, including also high natural frequency for the examined structures which can lead to conservative estimates of dg,min when subjected to extreme wind velocities. Notably, when extrapolating the derived formulations for other structures with varying geometries and stiffer properties, overestimated gap distances could be considered.
  • A wind-induced pounding force from adjacent structures in proximity can be considered in upcoming research. Such forces can increase when the desired dg,min is insufficient for the adjacent structures in proximity. Therefore, a similar mathematical formula can be developed to estimate the expected pounding force as a function of structural height, wind velocity, natural frequency, and minimum separation-gap distance.

Author Contributions

Conceptualization, T.B., A.E. and A.I.; methodology, T.B. and A.E.; software, T.B. and M.A.; validation, T.B., M.A. and A.E.; investigation, T.B. and A.E.; resources, T.B.; writing—original draft preparation, T.B.; writing—review and editing, T.B., A.E. and A.I.; supervision, A.E. and A.I.; funding acquisition, A.E. All authors have read and agreed to the published version of the manuscript.

Funding

This research was funded by the Natural Science and Engineering Research Council of Canada (NSERC), RGPIN-2022-04755.

Data Availability Statement

The data presented in this study are contained within the article.

Acknowledgments

The authors would like to thank the financial support from the Natural Science and Engineering Research Council of Canada (NSERC). The authors would also like to acknowledge the Digital Research Alliance of Canada for providing access to their high-performance computation facility and Siemens Digital Industries Software for the computational fluid dynamic (CFD) simulation.

Conflicts of Interest

The authors declare no conflicts of interest. The funders had no role in the design of the study; in the collection, analyses, or interpretation of data; in the writing of the manuscript; or in the decision to publish the results.

References

  1. Anagnostopoulos, S.A.; Spiliopoulos, K.V. An Investigation of Earthquake Induced Pounding between Adjacent Buildings. Earthq. Eng. Struct. Dyn. 1992, 21, 289–302. [Google Scholar] [CrossRef]
  2. Efraimiadou, S.; Hatzigeorgiou, G.D.; Beskos, D.E. Structural Pounding between Adjacent Buildings Subjected to Strong Ground Motions. Part I: The Effect of Different Structures Arrangement. Earthq. Eng. Struct. Dyn. 2013, 42, 1509–1528. [Google Scholar] [CrossRef]
  3. Kasai, K.; Maison, B.F. Building Pounding Damage during the 1989 Loma Prieta Earthquake. Eng. Struct. 1997, 19, 195–207. [Google Scholar] [CrossRef]
  4. Maison, B.F.; Kasai, K. Analysis for a Type of Structural Pounding. J. Struct. Eng. 1990, 116, 957–977. [Google Scholar] [CrossRef]
  5. Maison, B.F.; Kasai, K. Dynamics of Pounding When Two Buildings Collide. Earthq. Eng. Struct. Dyn. 1992, 21, 771–786. [Google Scholar] [CrossRef]
  6. Jankowski, R. Non-Linear FEM Analysis of Earthquake-Induced Pounding between the Main Building and the Stairway Tower of the Olive View Hospital. Eng. Struct. 2009, 31, 1851–1864. [Google Scholar] [CrossRef]
  7. Abdullah, M.M.; Hanif, J.H.; Richardson, A.; Sobanjo, J. Use of a Shared Tuned Mass Damper (STMD) to Reduce Vibration and Pounding in Adjacent Structures. Earthq. Eng. Struct. Dyn. 2001, 30, 1185–1201. [Google Scholar] [CrossRef]
  8. Rosenblueth, E.; Meli, R. The 1985 Mexico Earthquake. Concr. Int. 1986, 8, 23–34. [Google Scholar]
  9. Patel, C.C.; Jangid, R.S. Dynamic Response of Adjacent Structures Connected by Friction Damper. Earthq. Struct. 2011, 2, 149–169. [Google Scholar] [CrossRef]
  10. Chung, H.S.; Moon, B.W.; Lee, S.K.; Park, J.H.; Min, K.W. Seismic Performance of Friction Dampers Using Flexure of RC Shear Wall System. Struct. Des. Tall Spec. Build. 2009, 18, 807–822. [Google Scholar] [CrossRef]
  11. Colajanni, P.; Papia, M. Seismic Response of Braced Frames with and without Friction Dampers. Eng. Struct. 1995, 17, 129–140. [Google Scholar] [CrossRef]
  12. Pall, A.S.; Marsh, C. Friction-Damped Concrete Shearwalls. J. Proc. 1981, 78, 187–193. [Google Scholar] [CrossRef]
  13. Malhotra, A.; Roy, T.; Matsagar, V. Effectiveness of Friction Dampers in Seismic and Wind Response Control of Connected Adjacent Steel Buildings. Shock Vib. 2020, 2020, 8304359. [Google Scholar] [CrossRef]
  14. Brown, T.; Elshaer, A. Pounding of Structures at Proximity: A State-of-the-Art Review. J. Build. Eng. 2022, 48, 103991. [Google Scholar] [CrossRef]
  15. Anagnostopoulos, S.A. Pounding of Buildings in Series during Earthquakes. Earthq. Eng. Struct. Dyn. 1988, 16, 443–456. [Google Scholar] [CrossRef]
  16. Anagnostopoulos, S.A. Earthquake Induced Pounding: State of the Art. In Proceedings of the 10th European Conference on Earthquake Engineering, Vienna, Austria, 28 August–2 September 1994; Balkema: Rotterdam, The Netherlands, 1995; Volume 2, pp. 897–905. [Google Scholar]
  17. Jankowski, R. Non-Linear FEM Analysis of Pounding-Involved Response of Buildings under Non-Uniform Earthquake Excitation. Eng. Struct. 2012, 37, 99–105. [Google Scholar] [CrossRef]
  18. Kaushik, H.B.; Dasgupta, K.; Sahoo, D.R.; Kharel, G. Performance of Structures during the Sikkim Earthquake of 14 February 2006. Curr. Sci. 2006, 91, 449–455. [Google Scholar]
  19. Stone, W.C.; Yokel, F.Y.; Celebi, M.; Hanks, T.; Leyendecker, E.V. Engineering Aspects of the September 19, 1985 Mexico Earthquake; National Institute of Standards and Technology: Gaithersburg, MD, USA, 1987; Volume 1. [Google Scholar]
  20. Filiatrault, A.; Cervantes, M.; Folz, B.; Prion, H. Pounding of Buildings during Earthquakes: A Canadian Perspective. Can. J. Civ. Eng. 1994, 21, 251–265. [Google Scholar] [CrossRef]
  21. Ehab, M.; Salem, H.; Mostafa, H. Earthquake Pounding Effect on Adjacent Reinforced Concrete Buildings. Int. J. Comput. Appl. 2014, 106, 27–34. [Google Scholar]
  22. Cole, G.L.; Dhakal, R.P.; Turner, F.M. Building Pounding Damage Observed in the 2011 Christchurch Earthquake. Earthq. Eng. Struct. Dyn. 2012, 41, 893–913. [Google Scholar] [CrossRef]
  23. Chouw, N.; Hao, H. Pounding Damage to Buildings and Bridges in the 22 February 2011 Christchurch Earthquake. Int. J. Prot. Struct. 2012, 3, 123–140. [Google Scholar] [CrossRef]
  24. Huang, M.F.; Chan, C.M.; Lou, W.J. Optimal Performance-Based Design of Wind Sensitive Tall Buildings Considering Uncertainties. Comput. Struct. 2012, 98–99, 7–16. [Google Scholar] [CrossRef]
  25. Miari, M.; Choong, K.K.; Jankowski, R. Seismic Pounding Between Bridge Segments: A State-of-the-Art Review. Arch. Comput. Methods Eng. 2021, 28, 495–504. [Google Scholar] [CrossRef]
  26. Lam, K.M.; Wong, S.Y.; To, A.P. Dynamic Wind Loading of H-Shaped Tall Buildings. In Proceedings of 7th the Asia-Pacific Conference on Wind Engineering, Taipei, Taiwan, 8–12 November 2009. [Google Scholar]
  27. Zhao, S.; Zhang, C.; Dai, X.; Yan, Z. Review of Wind-Induced Effects Estimation through Nonlinear Analysis of Tall Buildings, High-Rise Structures, Flexible Bridges and Transmission Lines. Buildings 2023, 13, 2033. [Google Scholar] [CrossRef]
  28. Elshaer, A.; Bitsuamlak, G. Multiobjective Aerodynamic Optimization of Tall Building Openings for Wind-Induced Load Reduction. J. Struct. Eng. 2018, 144, 1–11. [Google Scholar] [CrossRef]
  29. Irwin, P.; Kilpatrick, J.; Robinson, J.; Frisque, A. Wind and Tall Buildings: Negatives and Positives. Struct. Des. Tall Spec. Build. 2008, 17, 915–928. [Google Scholar] [CrossRef]
  30. Irwin, P.A. Wind Engineering Challenges of the New Generation of Super-Tall Buildings. J. Wind Eng. Ind. Aerodyn. 2009, 97, 328–334. [Google Scholar] [CrossRef]
  31. Bobby, S.; Spence, S.M.J.; Bernardini, E.; Kareem, A. Performance-Based Topology Optimization for Wind-Excited Tall Buildings: A Framework. Eng. Struct. 2014, 74, 242–255. [Google Scholar] [CrossRef]
  32. Ding, F.; Kareem, A.; Wan, J. Aerodynamic Tailoring of Structures Using Computational Fluid Dynamics. Struct. Eng. Int. 2019, 29, 26–39. [Google Scholar] [CrossRef]
  33. Elshaer, A.; Bitsuamlak, G.; El Damatty, A. Enhancing Wind Performance of Tall Buildings Using Corner Aerodynamic Optimization. Eng. Struct. 2017, 136, 133–148. [Google Scholar] [CrossRef]
  34. Rahman, A.; Fancy, S.F.; Bobby, S.A. Analysis of Drift Due to Wind Loads and Earthquake Loads on Tall Structures by Programming Language C. Int. J. Sci. Eng. Res. 2012, 3, 6–9. [Google Scholar]
  35. Aly, A.M.; Abburu, S. On the Design of High-Rise Buildings for Multihazard: Fundamental Differences between Wind and Earthquake Demand. Shock Vib. 2015, 2015, 148681. [Google Scholar] [CrossRef]
  36. Stafford Smith, B.; Coull, A. Tall Building Structures: Analysis and Design; John Wiley: New York, NY, USA, 1991; ISBN 978-0-471-51237-0. [Google Scholar]
  37. Kwon, D.K.; Kareem, A. Comparative Study of Major International Wind Codes and Standards for Wind Effects on Tall Buildings. Eng. Struct. 2013, 51, 23–35. [Google Scholar] [CrossRef]
  38. Chan, C.M.; Huang, M.F.; Kwok, K.C.S. Stiffness Optimization for Wind-Induced Dynamic Serviceability Design of Tall Buildings. J. Struct. Eng. 2009, 135, 985–997. [Google Scholar] [CrossRef]
  39. Bernardini, E.; Spence, S.M.J.; Wei, D.; Kareem, A. Aerodynamic Shape Optimization of Civil Structures: A CFD-Enabled Kriging-Based Approach. J. Wind Eng. Ind. Aerodyn. 2015, 144, 154–164. [Google Scholar] [CrossRef]
  40. Chenna, R.; Ramancharla, P.K. Damage Assessment Due to Pounding between Adjacent Structures with Equal and Unequal Heights. J. Civ. Struct. Health Monit. 2018, 8, 635–648. [Google Scholar] [CrossRef]
  41. Wolfgang, S. High-Rise Building Structures; John Wiley & Sons Inc.: Hoboken, NJ, USA, 1977. [Google Scholar]
  42. Tse, K.T.; Kwok, K.C.S.; Tamura, Y. Performance and Cost Evaluation of a Smart Tuned Mass Damper for Suppressing Wind-Induced Lateral-Torsional Motion of Tall Structures. J. Struct. Eng. 2012, 138, 514–525. [Google Scholar] [CrossRef]
  43. Tse, K.T.; Kwok, K.C.S.; Hitchcock, P.A.; Samali, B.; Huang, M.F. Vibration Control of a Wind-Excited Benchmark Tall Building with Complex Lateral-Torsional Modes of Vibration. Adv. Struct. Eng. 2007, 10, 283–304. [Google Scholar] [CrossRef]
  44. Kang, X.; Li, S.; Yan, C.; Jiang, X.; Hou, H.; Fan, Z.; Mao, D.; Huang, Q. Enhancing the Seismic Performance of Adjacent Building Structures Based on TVMD and NSAD. Buildings 2023, 13, 2049. [Google Scholar] [CrossRef]
  45. Majdi, A.; Sadeghi-Movahhed, A.; Mashayekhi, M.; Zardari, S.; Benjeddou, O.; De Domenico, D. On the Influence of Unexpected Earthquake Severity and Dampers Placement on Isolated Structures Subjected to Pounding Using the Modified Endurance Time Method. Buildings 2023, 13, 1278. [Google Scholar] [CrossRef]
  46. Jankowski, R. Non-Linear Viscoelastic Modelling of Earthquake-Induced Structural Pounding. Earthq. Eng. Struct. Dyn. 2005, 34, 595–611. [Google Scholar] [CrossRef]
  47. Jankowski, R.; Mahmoud, S. Mitigation of Pounding Effects. In Earthquake-Induced Structural Pounding; Springer: Cham, Switzerland, 2015; pp. 103–132. [Google Scholar]
  48. Penzien, J. Evaluation of Building Separation Distance Required to Prevent Pounding during Strong Earthquakes. Earthq. Eng. Struct. Dyn. 1997, 26, 849–858. [Google Scholar] [CrossRef]
  49. Favvata, M.J. Minimum Required Separation Gap for Adjacent RC Frames with Potential Inter-Story Seismic Pounding. Eng. Struct. 2017, 152, 643–659. [Google Scholar] [CrossRef]
  50. Lopez-Garcia, D.; Soong, T.T. Assessment of the Separation Necessary to Prevent Seismic Pounding between Linear Structural Systems. Probabilistic Eng. Mech. 2009, 24, 210–223. [Google Scholar] [CrossRef]
  51. Van, J.; Kasai, K.; Maison, B.F. A Spectral Difference Method to Estimate Building Separations to Avoid Pounding. Earthq. Spectra 1992, 8, 201–223. [Google Scholar] [CrossRef]
  52. Flenga, M.G.; Favvata, M.J. The Effect of Magnitude Mw and Distance Rrup on the Fragility Assessment of a Multistory RC Frame Due to Earthquake-Induced Structural Pounding. Buildings 2023, 13, 1832. [Google Scholar] [CrossRef]
  53. Hubballi, S.S.; Jangid, R.S. Experimental Investigation of Pounding Responses in Base-Isolated Frame Structures at Expansion Gap. Buildings 2023, 13, 445. [Google Scholar] [CrossRef]
  54. Jeng, V.; Tzeng, W. Assessment of Seismic Pounding Hazard for Taipei City. Eng. Struct. 2000, 22, 459–471. [Google Scholar] [CrossRef]
  55. Kazemi, F.; Mohebi, B.; Jankowski, R. Predicting the Seismic Collapse Capacity of Adjacent SMRFs Retrofitted with Fluid Viscous Dampers in Pounding Condition. Mech. Syst. Signal Process. 2021, 161, 107939. [Google Scholar] [CrossRef]
  56. Chau, K.T.; Wei, X.X. Pounding of Structures Modelled as Non-Linear Impacts of Two Oscillators. Earthq. Eng. Struct. Dyn. 2001, 30, 633–651. [Google Scholar] [CrossRef]
  57. Aboshosha, H.; Elshaer, A.; Bitsuamlak, G.T.; El Damatty, A. Consistent Inflow Turbulence Generator for LES Evaluation of Wind-Induced Responses for Tall Buildings. J. Wind Eng. Ind. Aerodyn. 2015, 142, 198–216. [Google Scholar] [CrossRef]
  58. Elshaer, A.; Aboshosha, H.; Bitsuamlak, G.; El Damatty, A.; Dagnew, A. LES Evaluation of Wind-Induced Responses for an Isolated and a Surrounded Tall Building. Eng. Struct. 2016, 115, 179–195. [Google Scholar] [CrossRef]
  59. Braun, A.L.; Awruch, A.M. Aerodynamic and Aeroelastic Analyses on the CAARC Standard Tall Building Model Using Numerical Simulation. Comput. Struct. 2009, 87, 564–581. [Google Scholar] [CrossRef]
  60. Melbourne, W.H. Comparison of Measurements on the CAARC Standard Tall Building Model in Simulated Model Wind Flows. J. Wind Eng. Ind. Aerodyn. 1980, 6, 73–88. [Google Scholar] [CrossRef]
  61. Chan, C.M.; Chui, J.K.L.; Huang, M.F. Integrated Aerodynamic Load Determination and Stiffness Design Optimization of Tall Buildings. Struct. Des. Tall Spec. Build. 2009, 18, 59–80. [Google Scholar] [CrossRef]
  62. Huang, M. High-Rise Buildings under Multi-Hazard Environment; Springer: Singapore, 2017; ISBN 978-981-10-1743-8. [Google Scholar]
  63. Canadian Commission on Building and Fire Codes. National Building Code of Canada: 2020; National Research Council of Canada: Ottawa, ON, Canada, 2020. Available online: https://nrc-publications.canada.ca/eng/view/object/?id=515340b5-f4e0-4798-be69-692e4ec423e8 (accessed on 4 February 2024).
  64. Dagnew, A.K.; Bitsuamlak, G.T. Computational Evaluation of Wind Loads on Buildings: A Review. Wind Struct. Int. J. 2013, 16, 629–660. [Google Scholar] [CrossRef]
  65. Franke, J. Recommendations of the COST Action C14 on the Use of CFD in Predicting Pedestrian Wind Environment. In The Fourth International Symposium on Computational Wind Engineering; Citeseer: Yokohama, Japan, 2006; pp. 529–532. [Google Scholar]
  66. Franke, J.; Hellsten, A.; Schlunzen, K.H.; Carissimo, B. The COST 732 Best Practice Guideline for CFD Simulation of Flows in the Urban Environment: A Summary. Int. J. Environ. Pollut. 2011, 44, 419–427. [Google Scholar] [CrossRef]
  67. Khaled, M.F.; Aly, A.M.; Elshaer, A. Computational Efficiency of CFD Modeling for Building Engineering: An Empty Domain Study. J. Build. Eng. 2021, 42, 102792. [Google Scholar] [CrossRef]
  68. Germano, M.; Piomelli, U.; Moin, P.; Cabot, W.H. A Dynamic Subgrid-Scale Eddy Viscosity Model. Phys. Fluids A 1991, 3, 1760–1765. [Google Scholar] [CrossRef]
  69. Smagorinsky, J. General circulation experiments with the primitive equations. Mon. Weather Rev. 1963, 91, 99–164. [Google Scholar] [CrossRef]
  70. SharcNet. Available online: https://www.sharcnet.ca/ (accessed on 4 February 2024).
  71. Dagnew, A.K.; Bitsuamlak, G.T. Computational Evaluation of Wind Loads on a Standard Tall Building Using Les. Wind Struct. An Int. J. 2014, 18, 567–598. [Google Scholar] [CrossRef]
  72. Tanaka, H.; Lawen, N. Test on the CAARC Standard Tall Building Model with a Length Scale of 1:1000. J. Wind Eng. Ind. Aerodyn. 1986, 25, 15–29. [Google Scholar] [CrossRef]
  73. Dragoiescu, C.; Garber, J.; Kumar, K.S. A Comparison of Force Balance and Pressure Integration Techniques for Predicting Wind-Induced Responses of Tall Buildings. Proc. Struct. Congr. Expo. 2006, 2006, 14. [Google Scholar] [CrossRef]
  74. ETABS 2018. Available online: https://www.csiamerica.com/products/etabs/enhancement/18 (accessed on 4 February 2024).
  75. Karayannis, C.G.; Favvata, M.J. Inter-Story Pounding between Multistory Reinforced Concrete Structures. Struct. Eng. Mech. 2005, 20, 505–526. [Google Scholar] [CrossRef]
  76. Karayannis, C.G.; Favvata, M.J. Earthquake-Induced Interaction between Adjacent Reinforced Concrete Structures with Non-Equal Heights. Earthq. Eng. Struct. Dyn. 2005, 34, 1–20. [Google Scholar] [CrossRef]
  77. Mahmoud, S.; Abd-Elhamed, A.; Jankowski, R. Earthquake-Induced Pounding between Equal Height Multi-Storey Buildings Considering Soil-Structure Interaction. Bull. Earthq. Eng. 2013, 11, 1021–1048. [Google Scholar] [CrossRef]
  78. Karayannis, C.G.; Naoum, M.C. Torsional Behavior of Multistory RC Frame Structures Due to Asymmetric Seismic Interaction. Eng. Struct. 2018, 163, 93–111. [Google Scholar] [CrossRef]
  79. Ghandil, M.; Aldaikh, H. Damage-Based Seismic Planar Pounding Analysis of Adjacent Symmetric Buildings Considering Inelastic Structure-Soil-Structure Interaction. Earthq. Eng. Struct. Dyn. 2017, 46, 1141–1159. [Google Scholar] [CrossRef]
  80. Naserkhaki, S.; Abdul Aziz, F.N.A.; Pourmohammad, H. Parametric Study on Earthquake Induced Pounding between Adjacent Buildings. Struct. Eng. Mech. 2012, 43, 503–526. [Google Scholar] [CrossRef]
  81. Miari, M.; Choong, K.K.; Jankowski, R. Seismic Pounding between Adjacent Buildings: Identification of Parameters, Soil Interaction Issues and Mitigation Measures. Soil Dyn. Earthq. Eng. 2019, 121, 135–150. [Google Scholar] [CrossRef]
  82. Kim, S.-H.; Lee, S.-W.; Mha, H.-S. Dynamic Behaviors of the Bridge Considering Pounding and Friction Effects under Seismic Excitations. Struct. Eng. Mech. 2000, 10, 621–633. [Google Scholar] [CrossRef]
  83. Jankowski, R. Pounding Force Response Spectrum under Earthquake Excitation. Eng. Struct. 2006, 28, 1149–1161. [Google Scholar] [CrossRef]
  84. Jankowski, R. Comparison of Numerical Models of Impact Force for Simulation of Earthquake-Induced Structural Pounding. In Computational Science—ICCS 2008, Proceedings of the 8th International Conference, Kraków, Poland, 23–25 June 2008; Lecture Notes in Computer Science (Including Subseries Lecture Notes in Artificial Intelligence and Lecture Notes in Bioinformatics); Springer: Berlin, Heidelberg, 2008; Volume 5101, pp. 710–717. ISBN 3540693831. [Google Scholar]
  85. Edwards, L. Eureqa, the Robot Scientist. 2009. Available online: https://phys.org/news/2009-12-eureqa-robot-scientist-video.html (accessed on 15 March 2022).
  86. Keim, B. Download Your Own Robot Scientist. 2009. Available online: https://www.wired.com/2009/12/download-robot-scientist/ (accessed on 15 March 2022).
  87. Schmidt, M.; Lipson, H. Distilling Free-Form Natural Laws from Experimental Data. Science 2009, 324, 81–85. [Google Scholar] [CrossRef]
  88. Dubčáková, R. Eureqa: Software Review. Genet. Program. Evolvable Mach. 2011, 12, 173–178. [Google Scholar] [CrossRef]
  89. Zhou, L.; Haghighat, F. Optimization of Ventilation System Design and Operation in Office Environment, Part I: Methodology. Build. Environ. 2009, 44, 651–656. [Google Scholar] [CrossRef]
  90. El Ansary, A.; El Damatty, A.; Nassef, A. Optimum Shape and Design of Cooling Towers. World Acad. Sci. Eng. Technol. 2011, 5, 12–21. [Google Scholar]
  91. Goldberg, D.E. Genetic Algorithms; Pearson Education India: Bengaluru, India, 2013. [Google Scholar]
  92. Davis, L. Handbook of Genetic Algorithms; Van Nostrand Reinhold: New York, NY, USA, 1991. [Google Scholar]
  93. Affenzeller, M.; Wagner, S.; Winkler, S.; Beham, A. Genetic Algorithms and Genetic Programming; Taylor & Francis Ltd.: London, UK, 2009. [Google Scholar] [CrossRef]
  94. Bekdaş, G.; Cakiroglu, C.; Kim, S.; Geem, Z.W. Optimal Dimensions of Post-Tensioned Concrete Cylindrical Walls Using Harmony Search and Ensemble Learning with SHAP. Sustainability 2023, 15, 7890. [Google Scholar] [CrossRef]
  95. Demirbas, M.D.; Çakır, D.; Ozturk, C.; Arslan, S. Stress Analysis of 2D-FG Rectangular Plates with Multi-Gene Genetic Programming. Appl. Sci. 2022, 12, 8198. [Google Scholar] [CrossRef]
  96. Gandomi, A.H.; Roke, D.A. Assessment of Artificial Neural Network and Genetic Programming as Predictive Tools. Adv. Eng. Softw. 2015, 88, 63–72. [Google Scholar] [CrossRef]
  97. Madár, J.; Abonyi, J.; Szeifert, F. Genetic Programming for the Identification of Nonlinear Input-Output Models. Ind. Eng. Chem. Res. 2005, 44, 3178–3186. [Google Scholar] [CrossRef]
  98. Gondia, A.; Ezzeldin, M.; El-Dakhakhni, W. Mechanics-Guided Genetic Programming Expression for Shear-Strength Prediction of Squat Reinforced Concrete Walls with Boundary Elements. J. Struct. Eng. 2020, 146, 04020223. [Google Scholar] [CrossRef]
  99. Narques, T.V.N.; Carvalho, R.C.; Christoforo, A.L.; Mascarenhas, F.J.R.; Arroyo, F.N.; Bomfim Junior, F.C.; Santos, H.F. dos Use of Real Coded Genetic Algorithm as a Pre-Dimensioning Tool for Prestressed Concrete Beams. Buildings 2023, 13, 819. [Google Scholar] [CrossRef]
  100. Mengistu, T.; Ghaly, W. Aerodynamic Optimization of Turbomachinery Blades Using Evolutionary Methods and ANN-Based Surrogate Models. Optim. Eng. 2008, 9, 239–255. [Google Scholar] [CrossRef]
  101. European Commission. Eurocode 8 Design of Structures for Earthquake Resistance—Part 1: General Rules, Seismic Actions and Rules for Buildings. In CEC, Report EUR 12266EN; European Commission: Brussels, Belgium; Available online: https://eurocodes.jrc.ec.europa.eu/EN-Eurocodes/eurocode-8-design-structures-earthquake-resistance (accessed on 4 February 2024).
  102. American Society of Civil Engineers. Minimum Design Loads and Associated Criteria for Buildings and Other Structures; American Society of Civil Engineers: Reston, VA, USA, 2017; ISBN 9780784414248. [Google Scholar]
  103. Langlade, T.; Bertrand, D.; Grange, S.; Candia, G.; de la Llera, J.C. Modelling of Earthquake-Induced Pounding between Adjacent Structures with a Non-Smooth Contact Dynamics Method. Eng. Struct. 2021, 241, 112426. [Google Scholar] [CrossRef]
  104. American Institute of Steel Construction. Manual of Steel Construction: Load and Resistance Factor Design; American Institute of Steel Construction: Chicago, IL, USA, 2001. [Google Scholar]
Figure 1. Flowchart of the procedure to determine the required minimum separation-gap distance (dg,min).
Buildings 14 00479 g001
Figure 2. (a) Computational domain dimensions and boundary conditions; (b) velocity profile in model scale at the building location.
Buildings 14 00479 g002
Figure 3. Mesh grid resolution utilised in the CFD simulation.
Buildings 14 00479 g003
Figure 4. (a) Mean and (b) RMS Pressure Coefficient at 2/3 of the reference height of the CAARC building [61,71,72].
Buildings 14 00479 g004
Figure 5. Mesh grid resolution of two adjacent CAARC structures in proximity.
Buildings 14 00479 g005
Figure 6. Tributary areas used for wind-load time–history determination.
Buildings 14 00479 g006
Figure 7. Forces’ time–history on the 45th storey of structure for (a) along-wind (x-direction) upstream building, (b) across-wind (y-direction) upstream building, (c) along-wind downstream building, and (d) across-wind downstream building (full scale).
Buildings 14 00479 g007
Figure 8. (a) FEM CAARC model dimensions, (b) maximum deflection of storeys, and (c) maximum inter-storey drift in the along-wind direction [62].
Buildings 14 00479 g008
Figure 9. (a) First model frequency, (b) second mode frequency, and (c) third mode frequency of CAARC structure.
Buildings 14 00479 g009
Figure 10. Three-dimensional view of the two CAARC structures with a separation distance of dg,min.
Buildings 14 00479 g010
Figure 11. Maximum (a) displacement, (b) base shear force, and (c) base moment for building 1 (blue solid line) and building 2 (red dotted line).
Buildings 14 00479 g011
Figure 12. (a) Replicated gap element, and (b) response of gap element.
Buildings 14 00479 g012
Figure 13. Response of compression gap element in all pounding scenarios for (a) Scenario 1 ( 1 + 2   d g ), (b) Scenario 2 ( 1 + 2 < d g ), and (c) Scenario 3 ( 1 + 2   d g ).
Buildings 14 00479 g013
Figure 14. Deformation of structure from applied force (V).
Buildings 14 00479 g014
Figure 15. Pounding force of structures for different gap element stiffness (k).
Buildings 14 00479 g015
Figure 16. Pounding force with alteration of the number of gap elements.
Buildings 14 00479 g016
Figure 17. Gap element locations on CAARC structure.
Buildings 14 00479 g017
Figure 18. Time–history displacement of 180 m structures with initial gap distance at 2500 mm.
Buildings 14 00479 g018
Figure 19. Time–history for (a) 45th storey displacement, (b) pounding force at impact, and (c) pounding forces on 45th, 44th, and 43rd storey.
Buildings 14 00479 g019
Figure 20. Time–history displacement of 180 m structures with initial gap distance at 3000 mm.
Buildings 14 00479 g020
Figure 21. Time–history displacement of 140 m structures with initial gap distance at 1000 mm.
Buildings 14 00479 g021
Figure 22. Time–history displacement of 100 m structures with initial gap distance at 500 mm.
Buildings 14 00479 g022
Figure 23. Time–history displacement of 60 m structures with initial gap distance at 400 mm.
Buildings 14 00479 g023
Figure 24. dg,min required to mitigate structural pounding.
Buildings 14 00479 g024
Figure 25. Building 1’s deflection during pounding versus non-pounding.
Buildings 14 00479 g025
Figure 26. Regression plot (a) Equation (7), (b) Equation (8), (c) Equation (9), and (d) Equation (10).
Buildings 14 00479 g026aBuildings 14 00479 g026b
Figure 27. Fitness curve for optimal GA formula.
Buildings 14 00479 g027
Table 1. Parameters for the generated wind flow velocity field.
Mesh ZoneZone 1Zone 2Zone 3Zone 4
Mesh Size91.2 mm (H/5)45.6 mm (H/10)18.2 mm (H/25)6.91 mm (H/65)
Table 2. Steel sections for all the examined structures.
180 m tall CAARC structure
Storey levelsBeam sizeColumn size
v = 20 m/sv = 30 m/sv = 40 m/sv = 50 m/s
1–9W30 × 357W14 × 342W14 × 398W14 × 550W14 × 730
10–18W30 × 326W14 × 283W14 × 342W14 × 500W14 × 550
19–27W30 × 292W14 × 193W14 × 233W14 × 370W14 × 398
28–36W30 × 261W14 × 132W14 × 159W14 × 257W14 × 283
37–45W30 × 211W14 × 82W14 × 99W14 × 159W14 × 176
140 m tall structure
Storey levelsBeam sizeColumn size
v = 20 m/sv = 30 m/sv = 40 m/sv = 50 m/s
1–9W30 × 235W14 × 233W14 × 311W14 × 398W14 × 500
10–18W30 × 211W14 × 159W14 × 211W14 × 283W14 × 370
19–27W30 × 191W14 × 109W14 × 145W14 × 193W14 × 257
28–35W30 × 148W14 × 68W14 × 90W14 × 120W14 × 159
100 m tall structure
Storey levelsBeam sizeColumn size
v = 20 m/sv = 30 m/sv = 40 m/sv = 50 m/s
1–9W30 × 132W14 × 159W14 × 193W14 × 257W14 × 311
10–18W30 × 124W14 × 109W14 × 132W14 × 176W14 × 211
19–25W30 × 116W14 × 74W14 × 90W14 × 120W14 × 145
60 m tall structure
Storey levelsBeam sizeColumn size
v = 20 m/sv = 30 m/sv = 40 m/sv = 50 m/s
1–9W30 × 99W14 × 99W14 × 120W14 × 145W14 × 176
10–15W30 × 90W14 × 68W14 × 82W14 × 99W14 × 120
Table 3. Design wind loads for building 1 subjected to a design mean wind velocity of 40 m/s.
Structure Height (m)Along-Wind Base Shear (kN)Across-Wind Base Shear (kN)Torsional Base Torque (kN.m)
180 (CAARC)18,82628,238688,307
14013,56920,354496,129
100875213,128319,986
6044956742164,333
Table 4. Initial design variables.
Building Height (H) (m)Applied Mean Wind Velocity (v) (m/s)Natural Frequency (Fn) (Hz)
180500.211
500.198 a
400.198
300.166
300.198 a
200.148
200.198 a
140500.249
500.222 b
400.222
300.197
300.222 b
200.195
200.222 b
100500.302
500.277 c
400.277
300.239
300.277 c
200.209
200.277 c
60500.416
500.381 d
400.381
300.308
300.381 d
200.281
200.381 d
a Properties from 180 m structure for v = 40 m/s. b Properties from 140 m structure for v = 40 m/s. c Properties from 100 m structure for v = 40 m/s. d Properties from 60 m structure for v = 40 m/s.
Table 5. Ranked correlation coefficient GA formula for the analytical models.
RankCorrelation CoefficientMean Absolute Error (mm)Mathematical Formula *
Equation (7)0.998722.34 d g , m i n m m = ( 48,280 3378 × v ) / ( H 149.49 393.25 × F n ) + 0.8274 / c o s ( ( 48,280 3378 × v ) / ( H 149.49 393.25 × F n ) ) + ( 149.49 2226 × F n ^ 2 ) / ( 149.49 × F n + 0.1956 × H v H × F n ) + c o s ( ( 48,280 3378 v ) / ( H 149.49 393.26 F n ) )
Equation (8)0.995641.16 d g , m i n m m = 84.7 / ( 35.6 v 215.2 × F n ) + ( 48,383 3358 × v ) / ( H 146.92 404.3 × F n )
Equation (9)0.980673.25 d g , m i n m m = 0.022 v ^ 2 + ( 45,127 3137 × v ) / ( H 144.4 408.75 × F n )
Equation (10)0.979874.58 d g , m i n m m = ( 47,476 3323 × v ) / ( H 147.67 399.64 × F n )
* v, H, and Fn are in m/s, m, and Hz, respectively.
Disclaimer/Publisher’s Note: The statements, opinions and data contained in all publications are solely those of the individual author(s) and contributor(s) and not of MDPI and/or the editor(s). MDPI and/or the editor(s) disclaim responsibility for any injury to people or property resulting from any ideas, methods, instructions or products referred to in the content.

