Abstract
Due to their weight, the seismic response control of buildings needs a large-scale damper. To reduce the consumption of shape memory alloys (SMAs), this study proposed a dual self-centering pattern accomplished by the coil springs and SMA, which could drive the energy dissipation device to recenter. Combined with the friction energy dissipation device (FD), the dual self-centering friction damper (D-SCFD) was designed, and the motivation and parameters were described. The mechanical properties of D-SCFD, including the simplified D-SCFD mechanical model, theoretical index calculations of recentering, and energy dissipation performance, were then investigated. The seismic response mitigation of the steel frame adopting the D-SCFDs under consecutive strong earthquakes was finally analyzed. The results showed that a decrease in the consumption of SMA by the dual self-centering pattern was feasible, especially in the case of low demand for the recentering performance. Reducing the D-SCFD’s recentering performance hardly affected the steel frame’s residual inter-story drift ratios when the residual deformation rate was less than 50%, which can help strengthen the controls on the steel frame’s peak seismic responses. It is recommended to utilize the D-SCFD with not too high a recentering performance to mitigate the seismic response of the structure.
1. Introduction
Passive energy dissipation devices can provide additional stiffness and damping for buildings, which improves the safety of buildings by reducing earthquake responses [1,2]. Engineers choose displacement-dependent dampers because of their consistent mechanical performance and inexpensive production costs [3]. Therefore, displacement-dependent dampers have been widely used in the construction and seismic strengthening of buildings located in earthquake-prone areas, such as buckling restrained braces (BRBs), friction energy dissipation devices (FDs), metallic yielding dampers (MYDs), etc. [4,5,6]. Traditional displacement-dependent dampers, on the other hand, run the risk of causing higher post-earthquake residual deformations of buildings, which can easily raise the economic cost and technological problems of post-earthquake rehabilitation [7]. In this regard, many scholars have developed a series of self-centering dampers to improve the recentering performance of dampers and reduce the post-earthquake residual deformations of buildings [8].
In past research, a kind of self-centering damper simultaneously composed of prestressed tendons and energy dissipation devices has been designed. The prestressed tendons, which mainly include steel strands, basalt fiber tendons, aramid fiber bundles, etc. [9,10,11,12,13,14,15,16]. During the unloading process, the prestressed tendons drive energy dissipation devices to recenter. The self-centering dampers with prestressed tendons often have significant demands for prestressing force to obtain the appropriate recentering effect. However, the demands for high prestressing force will increase the difficulties of manufacturing the dampers and cause a series of problems, such as tension, anchorage, relaxation of the prestressed tendons, etc. In addition, it will lead to excessive elastic deformations of prestressed tendons, and the maximum deformations of dampers will be limited. Concurrently, there is significant worry over another type of self-centering damper. These dampers use mechanisms that compress disc springs or ring springs to drive them to recenter. Research about its mechanical behavior and the performance of shock absorption has been carried out. Xu and Fan et al. [17,18,19] combined the pre-pressed disc springs and FD into a self-centering energy dissipation brace, conducted the experiments, and established an axial force formula. Filiatrault et al. [20] proposed a self-centering friction energy dissipation device for reducing the earthquake responses of buildings based on the friction hysteresis of ring springs and conducted prototype tests of dampers to observe their practical mechanical behavior. Khoo et al. [21,22] used ring springs to reduce the residual deformations of sliding hinge joints and conducted prototype tests of self-centering joints.
A shape memory alloy (SMA) has the good performance of self-centering and energy dissipation simultaneously, and its plastic deformation caused by external loads will rapidly dissipate after unloading [23]. Under cyclic load, SMA can also disperse the input energy, which is suitable for the advancement of self-centering energy dissipation devices. Qian et al. [24] proposed a self-centering damper-based SMA wire and investigated how the pre-strain of SMA affects the hysteretic performance of the damper through tests. Shi et al. [25,26,27,28] developed a self-centering energy dissipation brace based on SMA cables and proved that its hysteretic performance and mitigation for structural seismic responses were, respectively, researched through mechanical experiments and finite element analysis. The FD can effectively dissipate the energy input from an earthquake and protect the components of buildings [29]. Thus, the means of developing self-centering dampers by combining SMA with FD has attracted much attention. Li et al. [30] proposed a self-centering FD by connecting the SMA rods in parallel with the FD, and then the corresponding mechanical tests and parameter analysis were conducted. Chen and Qiu et al. [31,32] developed a self-centering variable FD in which the SMA elements provided the pre-tightening force for variable FD and drove the damper to recenter simultaneously. Zheng et al. [33,34] proposed a self-centering isolator with SMA to mitigate the seismic response of bridges.
In February 2023, earthquakes with a magnitude of 7.8 and 7.6 occurred in southeast Turkey successively, just nine hours apart [35]. Multiple aftershocks are frequently felt in response to a mainshock, and mainshock–aftershock sequences (MS-AS) can cause structural damage to accumulate and quickly put the structure in a more risky state. For that reason, lots of scholars have considered MS-AS when investigating the seismic performance of structures. Lu et al. [36] proposed a method for the seismic damage prediction of regional buildings that took into account MS-AS. Raghunandan et al. [37] analyzed the aftershock vulnerability of reinforced concrete (RC) frames and found that the collapse resistance capacities of buildings would decrease with the strength of MS increasing. Wen et al. [38] proposed MS-AS damage spectra at soft soil sites. Yu et al. [39] found that the AS reduced the collapse resistance capacity through the MS-AS vulnerability analysis of inelastic single-degree-of-freedom systems. Zhou et al. [40] established a seismic demand model for RC structures and the corresponding formula for estimation of earthquake fragilities, which showed that the MS-AS would improve the exceedance probability of buildings.
To achieve the recentering effect, the traditional self-centering damper-based SMAs need a large consumption of SMA, which leads to a high cost. Thus, this study suggested using coil springs and SMA in a dual self-centering (D-SC) drive mode with a low cost. A novel dual self-centering friction damper (D-SCFD) design was put into practice. Through small-scale mechanical testing, the impacts of pre-tightening force and loading displacement amplitudes on D-SCFD’s energy dissipation and recentering performance were examined. The parameter study was conducted using the simplified mechanical model of D-SCFD as well as existing index formulas for energy dissipation performance and recentering. Lastly, the seismic response control impacts of D-SCFD with variable recentering performance on SF under MS-AS were examined using a multi-story steel frame (SF) as the analytical object.
2. Design of D-SCFD
2.1. Configuration of D-SCFD
The main functional elements of D-SCFD are coil springs, SMA rods, and FD with two sliding surfaces. The D-SC was formed after the connection of coil springs in parallel with SMA rods. The components of the D-SCFD were as follows: an internal panel, asbestos friction sheets, external panels with coil spring anchor plates, high-strength bolts, high-strength nuts, SMA rods, coil springs, guide bars, and a connection block for connecting the two external panels. The configuration of the D-SCFD is shown in Figure 1.
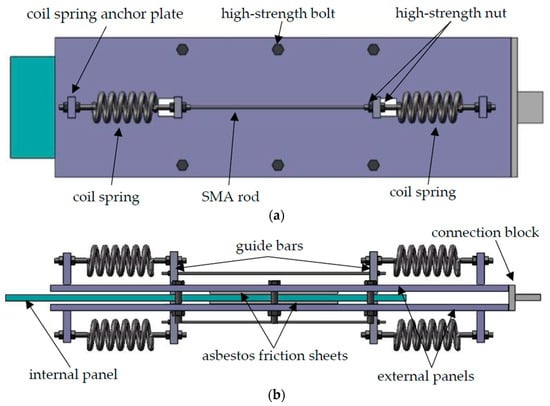
Figure 1.
Configuration of D-SCFD: (a) planform and (b) side view.
During the assembly process of the FD, two asbestos friction sheets were, respectively, fixed on the upper and lower surfaces of the internal panel and kept sliding with the external panels. Screw holes were saved on both sides of the external panels, and the friction sheets were pre-tightened using high-strength bolts. For the D-SC, the two ends of the guide bars had reserved holes for the anchorages of the SMA rods and the coil springs. After the two guide bars, respectively, passed through the corresponding slots reserved at both ends of the three panels, the two guide bars were connected by SMA rods. The two ends of the SMA rods were anchored to the guide bars by high-strength nuts. Each guide bar was attached to the matching anchor plate on the external panels by two pairs of coil springs. High-strength nuts were also used to secure the ends of coil springs. Finally, the connection block was welded to one end of the external panels to complete the D-SCFD system.
2.2. Working Principle of D-SCFD
In the process of the reciprocating motion of the D-SCFD, the SMA rods were always alternately in two states of tension and recentering. Meanwhile, the coil springs on one side were alternately in two states of compression and recentering. The axial force response of D-SC inhibited the deformation of D-SCFD during loading. In the unloading process, the restoring force of D-SC was composed of the elastic force of coil springs and the transformation stress of SMA rods, which drove the D-SCFD to recenter by overcoming the frictional force generated by the FD.
The working principle of D-SCFD is shown in Figure 2. When the external excitation caused the tensile deformation of the damper, the relative displacement between the internal panel and the external panels occurred. It also caused sliding friction between the friction sheets and the external panels, dissipating the energy intake from seismic excitation. The internal panel simultaneously pushed the guide bar on one side while the guide bar on the other side was stationary relative to the external panels, stretching the SMA rods and compressing the coil springs on one side. When the D-SCFD was compressed, the guide bar on one side remained motionless in relation to the external panels, while that on the other was pushed by the internal panel. It compressed the coil springs on the other side while stretching the SMA rods. The force for the recentering of the damper was provided by coil springs and SMA rods, reducing the consumption of SMA rods.
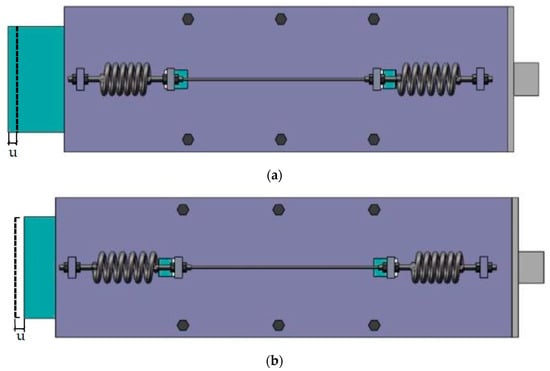
Figure 2.
Working principle of D-SCFD: (a) tension state and (b) compression state, where u denotes the axial deformation.
3. Test
3.1. Tensile Test of SMA
According to the literature [32], the mechanical properties of SMA tend to be stable after cyclic tensile loading. Therefore, before the test of D-SCFD, the SMA rod with a diameter of 4 mm was trained 20 times under equal-amplitude cyclic tensile loading, which made the mechanical properties of the SMA rod stable. The contents of nickel and titanium in the SMA rod were 50.1% and 49.9%, respectively. Meanwhile, the transformation stress and strain of SMA rods were obtained by the cyclic tensile test under variable amplitude loading. The loading rate of the tensile tests was set to 5 mm/min, and the ambient temperature was 15 °C. The parameters of the tensile test conditions are shown in Table 1, and the corresponding loading equipment is shown in Figure 3.

Table 1.
Tensile test conditions of the SMA rod.
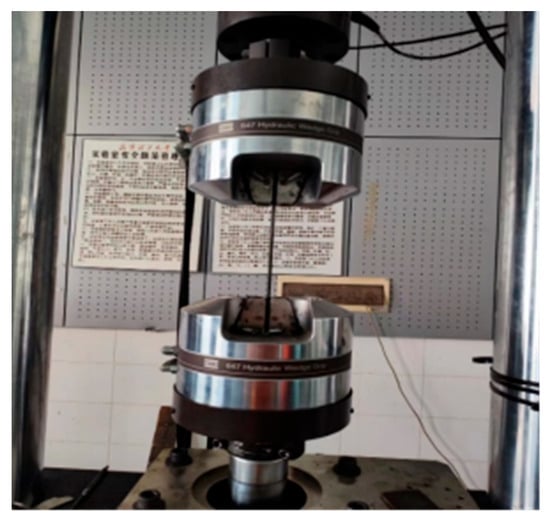
Figure 3.
Loading equipment of the SMA rod.
As shown in Figure 4, the constitutive curves from the results of the tensile test revealed that the residual strain of the SMA rod reached 1.98% after the first tension. In the subsequent cyclic tensile test under equal amplitude loading, the residual strain became small, indicating that the SMA rod had a good capacity for self-centering. With the increase in the number of loading cycles, the SMA stress gradually decreased and tended to be stable. The maximum stresses of SMA rods in the 14th and 20th tensile tests were 452.38 MPa and 446.46 MPa, respectively. The relative difference between both was only 1.33%, and the amplitude of the fluctuations was small. The stress of the SMA rod increased linearly with the strain increases in the cyclic tensile test under varying amplitude loadings, and subsequently, the stress increased at a slower rate when the martensitic transformation occurred. In the unloading process, the SMA rod with a different initial strain had stress–strain curves with three different kinds of slopes, and the descent rate of stress was lowest during the reverse martensitic transformation of SMA. The stress–strain curves from the tensile tests showed that the SMA rod had good superelastic properties, and the mechanical properties after tensile training were less affected by the loading times. The transformation stress and strain of SMA with the maximum tensile strain of 7% are shown in Table 2.
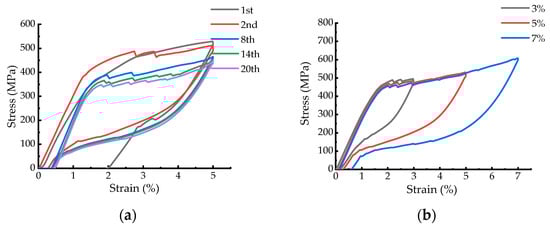
Figure 4.
Stress–strain curves from the tensile test of the SMA rod: (a) under equal amplitude loading and (b) under variable amplitude loading.
Table 2.
Transformation stress and strain of the SMA rod.
3.2. Mechanical Test of D-SCFD
To study the effects of the loading displacement amplitude and FD’s pre-tightening force on the mechanical properties of D-SCFD, a small-scale specimen with the maximum permissible deformation of 21 mm was fabricated according to the configuration described earlier, and the mechanical tests of FD and D-SCFD were conducted under low-reversed cyclic loading. The material of the friction sheets was composed of asbestos and brass wires in FD. The SMA rods after tensile training were installed in D-SCFD, whose working length was 300 mm. For the coil springs, the diameter of the spring wire was 8 mm, the outer diameter was 50 mm, and the axial stiffness was 145 N/mm. The material of the coil springs was Mn-Cr Alloy (Mn 1.02%, Cr 0.29%). The tensile strength of the high-strength bolts and nuts was 1200 MPa, and the diameter of the screw was 10 mm. The rest of D-SCFD adopted the steel with a yield strength of 235 MPa. The specimen, test conditions, and test device are shown in Figure 5, Table 3, and Figure 6, respectively. The ambient temperature was 15 °C.
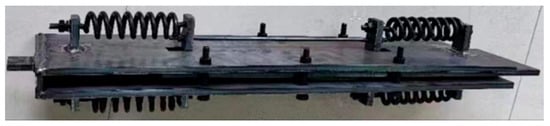
Figure 5.
Specimen of D-SCFD.
Table 3.
Test conditions of D-SCFD.
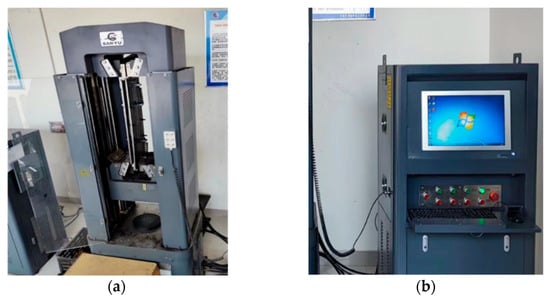
Figure 6.
Test devices of D-SCFD: (a) loading device and (b) data acquisition device.
The hysteretic curves of FD with a pre-tightening force of 7 kN are shown in Figure 7. The axial force generated by FD was stable, and the hysteretic curves under different loading displacement amplitudes were rectangular in shape. The areas of hysteretic curves increased with the increase in the axial deformation of FD. According to the results from the tests of FD and the configuration with two sliding surfaces, the coefficient of sliding friction was 0.50, which was denoted by μ. As shown in Figure 8, the shapes of the hysteretic curves of D-SCFD were similar to those of the stress–strain curves of SMA, both of which are “flag-shape”. The axial force of D-SCFD fluctuated slightly at the start of the martensitic transformation of SMA rods during loading and became stable gradually with the increase in the axial deformation. The areas of the hysteretic curves of D-SCFD also increased while the pre-tightening force of FD increased, and they were positively correlated with the axial deformation. After the pre-tightening force of FD was magnified, the horizontal coordinates of hysteretic curves with an axial force of 0 kN increased during unloading, indicating that the residual deformation of D-SCFD increased. The hysteretic curves from the test of D-SCFD reflected that the performance of energy dissipation could be improved by magnifying the axial force responses of FD, but the performance of recentering would be adversely affected.
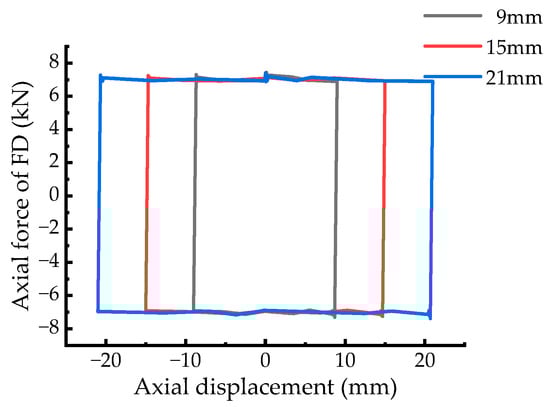
Figure 7.
Hysteretic curves of FD.
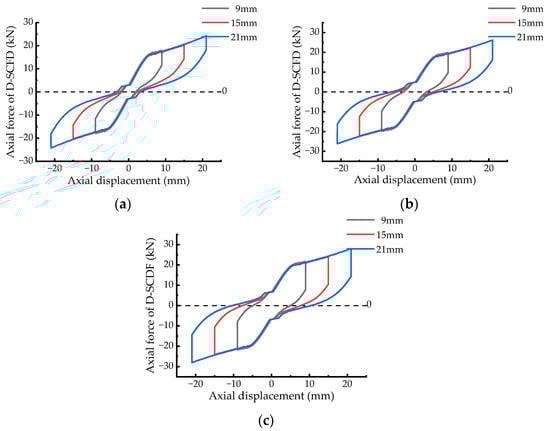
Figure 8.
Hysteretic curves of D-SCFD: (a) pre-tightening force of FD is 3 kN, (b) pre-tightening force of FD is 5 kN, and (c) pre-tightening force of FD is 7 kN.
The mechanical property parameters, such as dissipated energy, secant stiffness, equivalent viscous damping, and the rate of residual deformation, denoted by W, K, ξeq, and Rdr, respectively, were used to measure the performance of D-SCFD in this study. The mechanical property parameters of D-SCFD are shown in Figure 9. The ξeq of D-SCFD fluctuated with the increase in axial deformation, the maximum variation of which only reached 2.37%. Thus, the ξeq of D-SCFD was less affected by the loading displacement amplitude. The relative increment of W was close to that of the strain energy, which was caused by the increase in the axial deformation of D-SCFD. That was the main reason why the ξeq of D-SCFD was less affected by the loading displacement amplitude. Wherein, the strain energy of D-SCFD is KD2/2, and D denotes the axial deformation of D-SCFD. The ξeq of D-SCFD increased with the magnification of the pre-tightening force of FD, indicating that the relative increment of W caused by magnifying the pre-tightening force of FD was greater than that of strain energy.
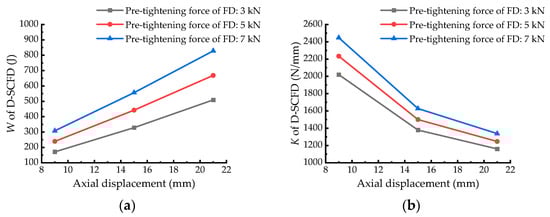
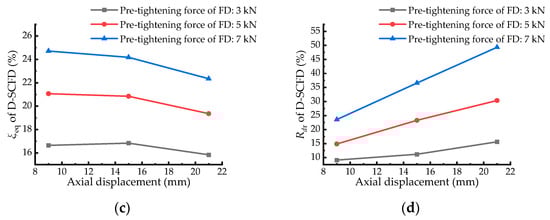
Figure 9.
Mechanical property parameters of D-SCFD: (a) dissipated energy, (b) secant stiffness, (c) equivalent viscous damping, and (d) rate of residual deformation.
The Rdr of D-SCFD increased after magnifying the pre-tightening force of FD, and the maximum value of Rdr reached 49.35%. The slope of each force–deformation curve of D-SCFD decreased with the increase in axial deformation when SMA underwent reverse martensitic transformation. This indicates that the amplification of Rdr was positively correlated with the axial deformation. The experimental results of D-SCFD showed that the performance of energy dissipation was less affected by the axial deformation after the martensitic transformation of SMA happened but more affected by the pre-tightening force of FD. Meanwhile, the recentering performance of D-SCFD was negatively correlated with the pre-tightening force of FD, whose reduction caused by magnifying the pre-tightening force of FD became more obvious with the increase in axial deformation.
4. Simplified Mechanical Model and Parameter Analysis
4.1. Verification of Simplified Mechanical Model
A simplified mechanical model of D-SCFD was established to analyze the influence of coil springs, SMA rods, and FD on the performance of recentering and energy dissipation. In the model, the relations of restoring force provided by those elements could be acquired, which meet the requirements related to different performance objectives of recentering. Meanwhile, the accuracy of the simplified mechanical model was verified according to the experimental results. The simplified analysis model is shown in Figure 10. D-SCFD was generated in parallel by coil springs, SMAs, and FD, and the axial force response was the sum of that provided by each element.
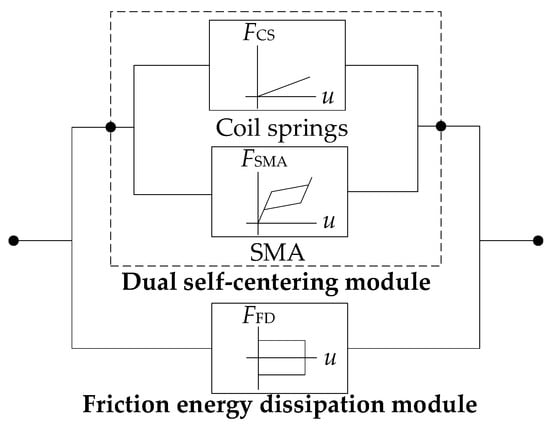
Figure 10.
Schematic diagram of D-SCFD simplified analysis model.
Referring to the previous study [41], the axial force of SMA rods is calculated by a piecewise linear algorithm here. In addition, we ignored the difference in the elastic modulus between the austenitic and martensitic phases of SMA rods. Compared with the SMA mechanical model proposed by Brinson and Auricchio [42,43], the suggested model in this study needs a lower computational cost. The convenient calculations of Rdr and ξeq can be derived from this model, too. The axial force of D-SCFD can be calculated by the following:
where FD-SCFD is the axial force response of D-SCFD; kCS denotes the total stiffness of the coil springs; u is the axial deformation of D-SCFD; t denotes the time; P and μ are the pre-tightening force and sliding friction coefficient of FD, respectively; sgn(x) is a symbolic function that returns either 1 or −1, depending on the positivity or negativity of x; FSMA is the axial force of the SMA rods, and the value can be derived from the following:
where ε(x) is a step function and returns 0, 1/2, or 1 according to the relationship between x and 0; and are the axial force responses of SMA rods during loading and unloading, respectively, which can be calculated by the following:
where kSMA,1 and kSMA,2 denote the linear stiffness of SMA rods before and after martensitic transformation, respectively; uMs and FMs are the axial deformation and force of SMA rods at the start of martensitic transformation, respectively. uMf denotes the axial deformation of SMA rods at the end of martensitic transformation. uAf and FAf are the axial deformation and force at the end of the reverse martensitic transformation of SMA rods, respectively. and are the axial deformation and force of SMA rods at the beginning of unloading, respectively, which can be calculated by way of . represents the axial deformation of SMA rods at the point of where reverse martensitic transformation begins, whose calculation is given as below:
When the axial deformation of D-SCFD reaches the maximum permissible value, the rate of residual deformation and equivalent viscous damping derived from the simplified mechanical model are expressed as below:
where α denotes the ratio of the axial force of the coil springs to that of SMA rods when the axial deformation of D-SCFD reaches the maximum permissible value; β is the ratio of the axial force of FD to that of SMA rods in the same situation. FCS represents the maximum axial force of the coil springs.
Combined with the tensile test results of SMA, the hysteretic curves of D-SCFD were predicted using the simplified mechanical model outlined here. The comparison of hysteretic curves between the predicted and experimental results is shown in Figure 11. The main parameters of the simplified mechanical model are listed in Table 4. The axial force responses with the double lines computed by the simplified model during loading fit well with the test findings. In the unloading, there were small differences in FD-SCFD between the predicted and experimental values. The simplified model ignored the distinction of elastic modulus between the austenitic and martensitic phases of SMA and did not consider that the stress–strain curves had the characteristics of “smooth transition” at the start of reverse martensitic transformation. That was the main reason behind the prediction of FD-SCFD deviating from the experimental results during unloading.
Figure 11.
Comparison of hysteretic curves between the predicted and experimental results: (a) pre-tightening force of FD is 3 kN, (b) pre-tightening force of FD is 5 kN, and (c) pre-tightening force of FD is 7 kN.
Table 4.
Parameters of the mechanical model.
The maximum difference in FD-SCFD between the predicted and the experimental values was only 2.93 kN, which is acceptable. When the axial deformation of D-SCFD reached the maximum permissible value, a comparative analysis of the theoretical and experimental values of Rdr and ξeq was conducted, as presented in Table 5. The corresponding maximum absolute error was only 10.27% and 0.81%, respectively. Therefore, the calculation methods of Rdr and ξeq derived from the simplified mechanical model can describe the recentering and energy dissipation performance of D-SCFD.
Table 5.
Comparison of theoretical and experimental values of Rdr and ξeq.
4.2. Parameter Analysis
The methods introduced earlier were used to calculate the Rdr and ξeq with different α and β. The α was used to describe the ratio of axial force provided by coil springs and SMA rods. The β measured the ratio of axial force provided by the FD and SMA rods. While the total force of the damper is constant, the consumption of SMA can decrease with an increase in α and β. Based on that, the variation trends of recentering and energy dissipation performance of D-SCFD were further analyzed, which are shown in Figure 12. The value of α ranged from 0 to 100%. When the α was 0, the variation trend of Rdr had three different growth rates with the increase in β. This also indicated that continuing to magnify the FFD would result in a significant increase in Rdr in the absence of coil springs, especially in the case where the FFD exceeded FAf. After increasing α, the growth rate of Rdr relative to β gradually decreased, which indicated that coil springs could improve the recentering performance of D-SCFD. ξeq rose with the increase in β, and the growth rate decreased gradually. However, magnifying α led to a decrease in ξeq, the amplitude of which decreased gradually. The variation trends of Rdr and ξeq appeared, suggesting that improving the recentering performance will bring about a decrease in the energy dissipation performance, both of which are contradictory. Therefore, the proportion of restoring forces provided by coil springs, SMA, and FD is critical, as it is a requirement for D-SCFD to work optimally in terms of both recentering and energy dissipation.
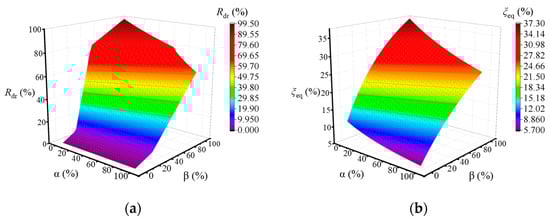
Figure 12.
Variation trends of recentering and energy dissipation performance: (a) Rdr and (b) ξeq.
Firstly, the relationship between α and β was determined by the calculation method of Rdr, which can achieve three different performance targets for recentering. Then, the influence of the corresponding α and β on the energy dissipation performance of D-SCFD was analyzed. When the Rdr was 10%, 30%, and 50%, the relationship between α and β satisfied the equation as below:
Combining the relation equation and calculation method of ξeq, the curves of ξeq with different targets of recentering performance of D-SCFD are shown in Figure 13. The ξeq of D-SCFD decreased with the increase in α and a reduction in ξeq gradually rose with the decrease in Rdr. When Rdr was 10%, 30%, and 50%, respectively, the corresponding maximum reduction in ξeq was 6.87%, 3.97%, and 1.83%, respectively. Therefore, when the high recentering performance target is taken, it is inappropriate to choose a larger ratio of axial force of coil springs to that of SMA, which can avoid a sharp decline in the energy dissipation performance of the D-SCFD. As the recentering performance target decreases, that ratio can be magnified appropriately, reducing the consumption of SMAs.
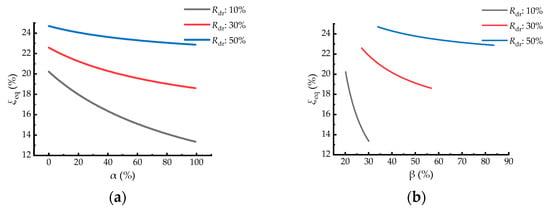
Figure 13.
Variation trends of ξeq with different performance of recentering: (a) influence of α and (b) influence of β.
5. Seismic Response Mitigation of Multi-Story SF
5.1. Overview of Structure Case
A five-story steel frame (SF) is selected as the case, which is located in Jiangsu Province, China. The control effects of D-SCFD on the seismic responses of SF were obtained by nonlinear time history analysis, considering the different recentering performances of D-SCFD. The structural plane of SF is shown in Figure 14. The members of SF adopted steel with a yield strength of 355 MPa, the design of which considered earthquake action according to the Chinese code for seismic design of buildings (GB 50011-2010) [44]. Its beams and columns will not yield after experiencing frequently occurred earthquakes (FOE). According to the Chinese code for seismic design of buildings [44], the Sa(0.74 s, 4%) and Sa(0.74 s, 5%) of the SF under FOE and maximum considered earthquake (MCE) are 0.19 g and 0.91 g, respectively. Here, Sa(T1, ξ) denotes the spectral acceleration corresponding to the first translational period of SF, and the letter g denotes the gravitational acceleration.
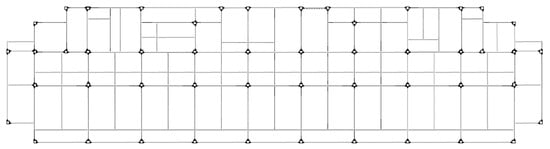
Figure 14.
Structural plane of SF.
5.2. Ground Motion Inputs
The previous studies [36,37,38,39,40] reflected that the MS-AS would lead to the accumulation of structural damage and that the AS should be considered in the control of structural seismic responses. Therefore, seven groups of MS-AS records were selected as the excitation, and the directions of inputs were the same as those of the first translational vibration mode of SF. The information about each ground motion is listed in Table 6. When compared to Sa(T1, ξ), using the peak ground acceleration (PGA) to characterize the intensities of ground motions readily makes structure responses more distinct [45]. Based on the Sa(0.74 s, 5%) being 0.91 g when SF experiences MCE, the accelerations of all ground motions were adjusted accordingly. Meanwhile, time intervals of 20 s were added between the MS and AS, and durations of 10 s were added to the ends of the AS to analyze the residual deformations of the structure. The acceleration and response spectra curves are shown in Figure 15 and Figure 16, respectively.
Table 6.
Information about ground motions.
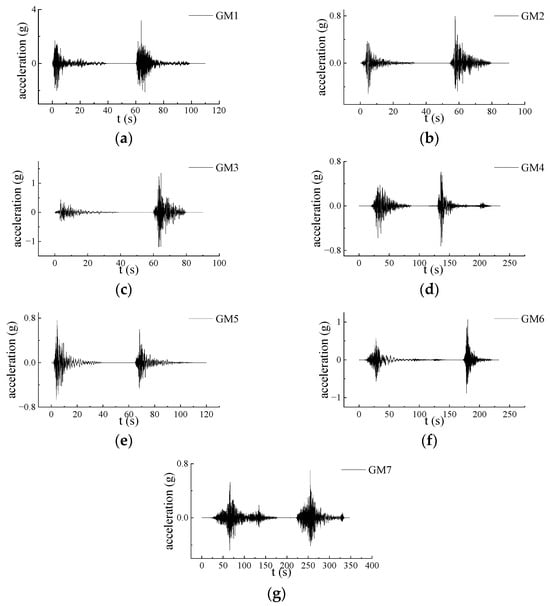
Figure 15.
Acceleration of ground motions: (a) GM1, (b) GM2, (c) GM3, (d) GM4, (e) GM5, (f) GM6, and (g) GM7.
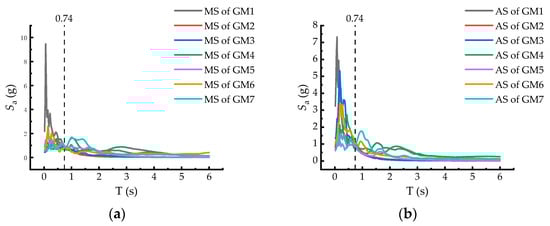
Figure 16.
Response spectra of ground motions: (a) MS and (b) AS.
5.3. D-SCFD
To analyze the seismic response control effects of D-SCFD with different recentering performances, D-SCFDs with Rdr values of 10%, 30%, and 50% were used to mitigate the seismic responses of SF, respectively. The layout of the D-SCFDs on each floor is shown in Figure 17.
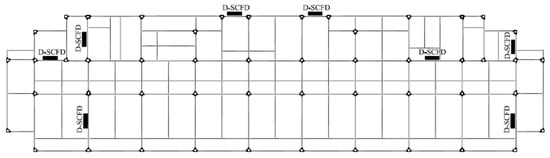
Figure 17.
Plane layout of D-SCFDs.
In addition to one damper at each corresponding plane position of the top two floors, two dampers were set on each of the other floors. The α of D-SCFD was taken as 20%, and the β corresponding to the three different recentering performances was obtained earlier using the relation equation mentioned. The maximum axial forces of all D-SCFDs were 500 kN, whose limits of deformation were 60 mm based on the maximum inter-story drift responses of SF under the MCE. The main design parameters of D-SCFD are listed in Table 7.
Table 7.
Design parameters of D-SCFD.
To simulate the D-SCFD, the three elements of linear, multi-linear elastic, and plastic (wen) in SAP2000 were connected in parallel. The axial mechanical behavior of D-SCFD was described in the numerical model. The results from the mechanical test of D-SCFD were used to validate the method of simulation above. The parameters and hysteretic curves for validation are presented in Table 8 and Figure 18, respectively. The difference in hysteretic curves between the SAP2000 model and the test is small.
Table 8.
Parameters for validation.
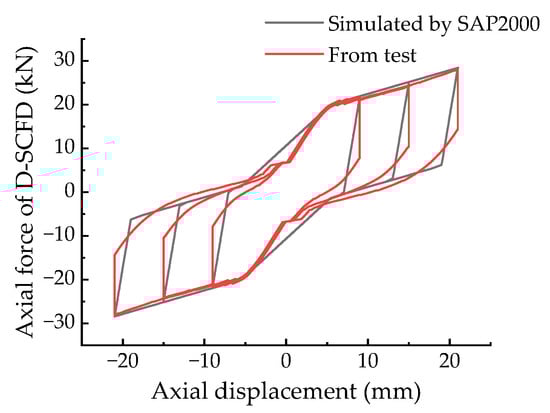
Figure 18.
Comparison of hysteretic curves between the SAP2000 model and the test.
According to Table 7, the simulation parameters are presented in Table 9, which were derived from the SMA phase transition stress and strain from the test. The hysteretic curves simulated by SAP2000 are shown in Figure 19a. The simulation results of ξeq and Rdr had small deviations from the theoretical values, and the maximum absolute errors were only 12.14% and 1.20%, respectively. The connection between the D-SCFD and the SF is shown in Figure 19b. Compared with D-SCFD-1, the maximum SMAs’ axial force of D-SCFD-2 and D-SCFD-3 decreased by 7.12% and 13.31%, respectively, which is advantageous to reduce the consumption of SMA.
Table 9.
Simulation parameters of D-SCFD.
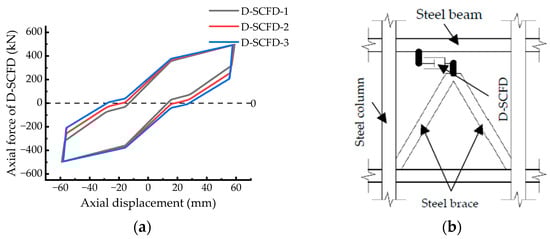
Figure 19.
(a) Simulated hysteretic curves of D-SCFDs and (b) connection between D-SCFD and SF.
5.4. Mitigation of Seismic Responses
After the nonlinear time history analysis utilizing SAP2000, the peak inter-story drift ratios (PIDRs) under each ground motion are shown in Figure 20. D-SCFDs reduced the PIDRs of SF under the earthquake, whose safety was effectively improved. With different D-SCFDs, the maximum inter-story drifts of SF were 43.60 mm, 51.69 mm, and 50.02 mm, respectively, less than the limit of deformations. The average peak inter-story drift ratios (APIDRs) and the control rates of those under seven ground motions are shown in Table 10. Wherein, the APIDRs of the second and third floors were larger than the others. For the control effects of APIDRs, the D-SCFD-3 was better than D-SCFD-2, and the D-SCFD-2 was better than D-SCFD-1. The control impacts of APIDRs revealed that lowering the recentering performance of D-SCFDs was advantageous for improving the control effect of the structure’s maximum lateral deformations, while Rdr did not surpass 50%.
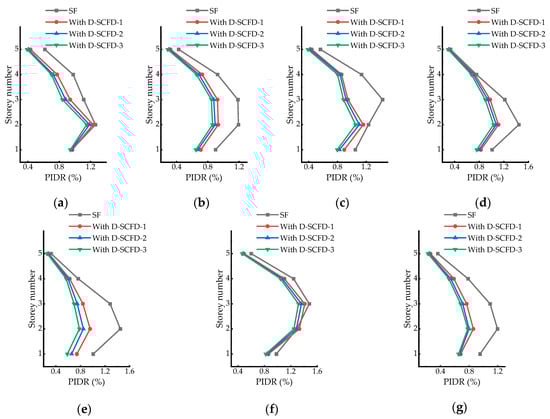
Figure 20.
PIDRs of structure under different ground motions: (a) GM1, (b) GM2, (c) GM3, (d) GM4, (e) GM5, (f) GM6, and (g) GM7.
Table 10.
APIDRs and the corresponding control rates.
The average residual inter-story drift ratios (ARIDRs) of the SF are shown in Table 11. D-SCFDs significantly reduced the ARIDRs of SF, which could reduce the post-seismic recovery costs of the structure. The differences in the control effects of ARIDRs were tiny, which were generated by the discrepancies in the recentering performances of D-SCFDs. The maximum difference was only 0.008%, and its level was micro. Therefore, when the Rdr was less than 50%, the objectives of recentering performances of D-SCFDs hardly had obvious effects on the residual deformations of the structure after an earthquake. The average peak floor accelerations (APFAs) under seven ground motions are shown in Table 12. D-SCFDs reduced the floor acceleration responses, thereby reducing the inertial forces caused by the earthquakes. Meanwhile, D-SCFD-3 had the best control effect on APFAs, followed by D-SCFD-2, and the control effect of D-SCFD-1 was relatively minimal. Differences in APFA mitigation resulted in previous variations in APIDR control rates, both of which were primarily caused by the different recentering performances of D-SCFDs. After minimizing the aims of recentering performances, the D-SCFDs had a larger value of ξeq, which had better energy consumption performance and resulted in better APIDR and APFA mitigation.
Table 11.
ARIDRs and the corresponding control rates.
Table 12.
APFAs and corresponding control rates.
6. Conclusions
In this study, a new dual self-centering damper (D-SCFD) was proposed, which was generated by connecting coil springs, SMA rods, and a friction energy dissipation device (FD) in parallel. While carrying out the mechanical tests of small-scale specimens, a simplified mechanical model was established. The theoretical index calculations of the performance of recentering and energy dissipation were derived and used to analyze the influence of coil springs, SMA rods, and FD on the performance of D-SCFD. Eventually, the seismic response control effects of D-SCFD on multi-story steel frames (SFs) were analyzed, which experienced consecutive strong earthquakes. The main conclusions are as follows:
- The recentering and energy dissipation performances of D-SCFD were contradictory. It is necessary to define the reasonable relationship between the axial force provided by coil springs, SMA, and FD, which can make the D-SCFD give play to the ideal performance of recentering and energy dissipation.
- After magnifying the axial force response of FD, the energy dissipation performance of D-SCFD increased, but the recentering performance decreased. Meanwhile, a reduction in the recentering performance was positively correlated with the loading displacement amplitude. After the martensitic transformation of SMA, the loading displacement amplitude had little effect on the energy dissipation performance of D-SCFD.
- The simplified mechanical model of D-SCFD, the theoretical index calculations of the performance of recentering, and energy dissipation could accurately describe the mechanical behaviors of D-SCFD. In the suggested model, the parameters are related to the mechanical properties of each component, which is beneficial to its serviceability. With the reduction in the recentering performance target and the increase in the axial force ratio of the coil springs, the decrease in the energy dissipation performance of D-SCFD would be slower.
- When the recentering performance of D-SCFD is required to be high, it is not appropriate to excessively increase the axial force ratio of the coil springs to avoid a rapid decline in the performance of energy dissipation. With the decrease in the recentering performance target, the proportion of axial force provided by the coil springs can be appropriately increased, thereby reducing the consumption of SMA.
- The simulations of D-SCFD utilizing SAP2000 were close to the test. Adjusting the Rdr to 50% from 10%, the section area of SMA decreased by 13.31% in D-SCFD with a α of 20%. Simultaneously, the control rate of the average peak inter-story drift ratio (APIDR) increased 7.48% in the story with the maximum APIDR. However, the maximum variation of average residual inter-story drift ratios (ARIDRs) only reached 0.008%. Therefore, when D-SCFD is used to mitigate seismic responses, the performance of recentering can be appropriately reduced.
- Compared to the existing self-centering damper-based SMA, the consumption of SMA in D-SCFD was less, which avoided the expensive cost. In the future, the combination of a dual self-centering pattern (D-SC) and other kinds of passive energy dissipation devices could be promising.
Author Contributions
Conceptualization, J.Q., X.L. and Y.B.; methodology, X.L. and Y.B.; software, X.L. and Y.B.; validation, J.Q., X.L. and Y.B.; formal analysis, W.W., Y.L. and J.P.; investigation, J.Q. and W.W.; resources, J.Q.; data curation, W.W., Y.L. and J.P.; writing—original draft preparation, X.L. and Y.B.; writing—review and editing, J.Q., X.L. and Y.B.; visualization, J.Q., J.P. and C.Z.; supervision, J.Q. and J.P.; project administration, J.Q.; funding acquisition, J.Q. All authors have read and agreed to the published version of the manuscript.
Funding
This research was funded by the National Natural Science Foundation of China (No. 41867069) and the Yunnan Provincial Department of Education Program (No. 2023Y0260).
Data Availability Statement
The data presented in this study are available from the corresponding author upon reasonable request.
Acknowledgments
The authors extend their appreciation to the technological support from School of Architecture and Planning, Yunnan University.
Conflicts of Interest
The authors declare no conflicts of interest.
Nomenclature
| SMA | Shape memory alloy |
| FD | Friction energy dissipation device |
| D-SCFD | Dual self-centering friction damper |
| BRB | Buckling restrained brace |
| MYD | Metallic yielding damper |
| MS-AS | Mainshock–aftershock sequence |
| RC | Reinforced concrete |
| D-SC | Dual self-centering |
| SF | Steel frame |
| W | Dissipated energy |
| K | Secant stiffness |
| ξeq | Equivalent viscous damping |
| Rdr | Rate of residual deformation |
| FD-SCFD | Axial force response of D-SCFD |
| kCS | Total stiffness of the coil springs |
| u | Axial deformation of D-SCFD |
| t | Time |
| P | Pre-tightening force of FD |
| μ | Sliding friction coefficient of FD |
| sgn(x) | Symbolic function |
| FSMA | Axial force of the SMA rods |
| ε(x) | Step function |
| Axial force responses of SMA rods during loading | |
| Axial force responses of SMA rods during unloading | |
| kSMA,1 | Linear stiffness of SMA rods before martensitic transformation |
| kSMA,2 | Linear stiffness of SMA rods after martensitic transformation |
| uMs | Axial deformation of SMA rods at the start of martensitic transformation |
| FMs | Axial force of SMA rods at the start of martensitic transformation |
| uMf | Axial deformation of SMA rods at the end of martensitic transformation |
| uAf | Axial deformation of SMA rods at the end of the reverse martensitic transformation |
| FAf | Axial force of SMA rods at the end of the reverse martensitic transformation |
| Axial deformation of SMA rods at the beginning of unloading | |
| Axial force of SMA rods at the beginning of unloading | |
| Axial deformation of SMA rods at the beginning of the reverse martensitic transformation | |
| α | Ratio of the maximum axial force of the coil springs to that of SMA rods |
| β | Ratio of the maximum axial force of FD to that of SMA rods |
| Sa(T1, ξ) | Spectral acceleration corresponding to the first translational period of structure |
| PIDR | Peak inter-story drift ratio |
| APIDR | Average peak inter-story drift ratio |
| ARIDR | Average residual inter-story drift ratio |
| APFA | Average peak floor acceleration |
References
- Almajhali, K.Y.M. Review on passive energy dissipation devices and techniques of installation for high rise building structures. Structures 2023, 51, 1019–1029. [Google Scholar] [CrossRef]
- Divyah, N.; Prakash, R.; Srividhya, S.; Ajay Prakash, K. Control of vibrations in high-rise structures using base isolation technology. Mater. Today Proc. 2023. [CrossRef]
- Ilbeigi, S.; Jahanpour, J.; Farshidianfar, A. A novel scheme for nonlinear displacement-dependent dampers. Nonlinear Dyn. 2012, 70, 421–434. [Google Scholar] [CrossRef]
- Hussain, H.; Kim, D.-K.; Zhao, W. Advancements and Future Prospects of Buckling Restrained Braces for Corrosive-Environments: A Comprehensive Literature Review. Buildings 2023, 13, 2156. [Google Scholar] [CrossRef]
- Amiri, J.V.; Navayinia, B.; Navaei, S. Evaluation of performance of eccentric braced frame with friction damper. Struct. Eng. Mech. 2011, 39, 717–732. [Google Scholar] [CrossRef]
- Wang, J.; Men, J.; Zhang, Q.; Fan, D.; Zhang, Z.; Huang, C.-H. Seismic performance evaluation of a novel shape-optimized composite metallic yielding damper. Eng. Struct. 2022, 268, 114714. [Google Scholar] [CrossRef]
- Sabelli, R.; Mahin, S.; Chang, C. Seismic demands on steel braced frame buildings with buckling-restrained braces. Eng. Struct. 2003, 25, 655–666. [Google Scholar] [CrossRef]
- Xu, G.; Guo, T.; Li, A.; Wang, S.; Zhang, R.; Zhu, R.; Xu, J. Review on self-centering damper for seismic resilient building structures. Structures 2023, 54, 58–77. [Google Scholar] [CrossRef]
- Christopoulos, C.; Tremblay, R.; Kim, H.J.; Lacerte, M. Self-centering energy dissipative bracing system for the seismic resistance of structures: Development and validation. J. Struct. Eng. 2008, 134, 96–107. [Google Scholar] [CrossRef]
- Erochko, J.; Christopoulos, C.; Tremblay, R.; Kim, H.-J. Shake table testing and numerical simulation of a self-centering energy dissipative braced frame. Earthq. Eng. Struct. Dyn. 2013, 42, 1617–1635. [Google Scholar] [CrossRef]
- Erochko, J.; Christopoulos, C.; Tremblay, R. Design and Testing of an Enhanced-Elongation Telescoping Self-Centering Energy-Dissipative Brace. J. Struct. Eng. 2015, 141, 04014163. [Google Scholar] [CrossRef]
- Chou, C.-C.; Chung, P.-T. Development of cross-anchored dual-core self-centering braces for seismic resistance. J. Constr. Steel Res. 2014, 101, 19–32. [Google Scholar] [CrossRef]
- Chou, C.-C.; Chen, Y.-C. Development of Steel Dual-Core Self-Centering Braces: Quasi-Static Cyclic Tests and Finite Element Analyses. Earthq. Spectra 2015, 31, 247–272. [Google Scholar] [CrossRef]
- Chou, C.-C.; Tsai, W.-J.; Chung, P.-T. Development and validation tests of a dual-core self-centering sandwiched buckling-restrained brace (SC-SBRB) for seismic resistance. Eng. Struct. 2016, 121, 30–41. [Google Scholar] [CrossRef]
- Wang, Y.; Zhou, Z.; Ge, H.; Yao, J.; Xie, Q. Experimental validation and numerical simulation of a dual-self-centering variable friction braced frame under strong ground motions. J. Build. Eng. 2022, 56, 104761. [Google Scholar] [CrossRef]
- Xie, Q.; Zhou, Z.; Meng, S.-P. Experimental investigation of the hysteretic performance of self-centering buckling-restrained braces with friction fuses. Eng. Struct. 2020, 203, 109865. [Google Scholar] [CrossRef]
- Xu, L.-H.; Fan, X.-W.; Li, Z.-X. Cyclic behavior and failure mechanism of self-centering energy dissipation braces with pre-pressed combination disc springs. Earthq. Eng. Struct. Dyn. 2017, 46, 1065–1080. [Google Scholar] [CrossRef]
- Xu, L.; Fan, X.; Li, Z. Experimental behavior and analysis of self-centering steel brace with pre-pressed disc springs. J. Constr. Steel Res. 2017, 139, 363–373. [Google Scholar] [CrossRef]
- Fan, X.-W.; Xu, L.-H.; Li, Z.-X. Behaviors Comparisons and Prediction of Pre-Pressed Spring Self-Centering Energy Dissipation Braces. Int. J. Struct. Stab. Dyn. 2018, 18, 1840006. [Google Scholar] [CrossRef]
- Filiatrault, A.; Tremblay, R.; Kar, R. Performance evaluation of friction spring seismic damper. J. Struct. Eng.-ASCE 2000, 126, 491–499. [Google Scholar] [CrossRef]
- Khoo, H.-H.; Clifton, C.; Butterworth, J.; MacRae, G.; Gledhill, S.; Sidwell, G. Development of the self-centering Sliding Hinge Joint with friction ring springs. J. Constr. Steel Res. 2012, 78, 201–211. [Google Scholar] [CrossRef]
- Khoo, H.-H.; Clifton, C.; Butterworth, J.; MacRae, G. Experimental Study of Full-Scale Self-Centering Sliding Hinge Joint Connections with Friction Ring Springs. J. Earthq. Eng. 2013, 17, 972–997. [Google Scholar] [CrossRef]
- Dolce, M.; Cardone, D.; Marnetto, R. Implementation and testing of passive control devices based on shape memory alloys. Earthq. Eng. Struct. Dyn. 2000, 29, 945–968. [Google Scholar] [CrossRef]
- Qian, H.; Li, H.; Song, G.; Guo, W. Recentering Shape Memory Alloy Passive Damper for Structural Vibration Control. Math. Probl. Eng. 2013, 2013, 963530. [Google Scholar] [CrossRef]
- Shi, F.; Saygili, G.; Ozbulut, O.E. Probabilistic seismic performance evaluation of SMA-braced steel frames considering SMA brace failure. Bull. Earthq. Eng. 2018, 16, 5937–5962. [Google Scholar] [CrossRef]
- Shi, F.; Ozbulut, O.E.; Zhou, Y. Influence of shape memory alloy brace design parameters on seismic performance of self-centering steel frame buildings. Struct. Control Health Monit. 2020, 27, e2462. [Google Scholar] [CrossRef]
- Shi, F.; Zhou, Y.; Ozbulut, O.E.; Cao, S. Development and experimental validation of anchorage systems for shape memory alloy cables. Eng. Struct. 2021, 228, 111611. [Google Scholar] [CrossRef]
- Shi, F.; Zhou, Y.; Ozbulut, O.E.; Ren, F. Hysteretic response and failure behavior of an SMA cable-based self-centering brace. Struct. Control Health Monit. 2022, 29, e2847. [Google Scholar] [CrossRef]
- Rayegani, A.; Soureshjani, O.K.; Alaee, S.A.M.; Mualla, I.H.; Nemati, F. Seismic Performance of Buildings Equipped with Four-Joint Rotational Friction Dampers in Mainshock–Aftershock Sequences. J. Struct. Eng. 2023, 150, 04023235. [Google Scholar] [CrossRef]
- Li, Y.; Zhang, H.; Wang, J.; Yu, H.; Ma, K.; Zhang, X.; Ji, W.; Li, R. Experimental investigation on the seismic behavior of a novel self-centering friction damper. J. Build. Eng. 2023, 76, 107384. [Google Scholar] [CrossRef]
- Chen, J.; Wang, W.; Fang, C. Manufacturing, testing and simulation of novel SMA-based variable friction dampers with enhanced deformability. J. Build. Eng. 2022, 45, 103513. [Google Scholar] [CrossRef]
- Qiu, C.; Liu, J.; Du, X. Cyclic behavior of SMA slip friction damper. Eng. Struct. 2022, 250, 113407. [Google Scholar] [CrossRef]
- Zheng, W.Z.; Tan, P.; Li, J.; Wang, H.; Liu, Y.H.; Xian, Z.B. Superelastic pendulum isolator with multi-stage variable curvature for seismic resilience enhancement of cold-regional bridges. Eng. Struct. 2023, 284, 115960. [Google Scholar] [CrossRef]
- Zheng, W.Z.; Tan, P.; Zhang, Z.H.; Wang, H.; Sun, Z. Damping enhanced novel re-centering seismic isolator incorporating superelastic SMA for response control of bridges under near-fault earthquakes. Smart Mater. Struct. 2022, 31, 065015. [Google Scholar] [CrossRef]
- Hussain, E.; Kalaycioglu, S.; Milliner, C.W.D.; Cakir, Z. Preconditioning the 2023 Kahramanmaras (Turkiye) earthquake disaster. Nat. Rev. Earth Environ. 2023, 4, 287–289. [Google Scholar] [CrossRef]
- Lu, X.; Cheng, Q.; Xu, Z.; Xiong, C. Regional seismic-damage prediction of buildings under mainshock-aftershock sequence. Front. Eng. Manag. 2021, 8, 122–134. [Google Scholar] [CrossRef]
- Raghunandan, M.; Liel, A.B.; Luco, N. Aftershock collapse vulnerability assessment of reinforced concrete frame structures. Earthq. Eng. Struct. Dyn. 2015, 44, 419–439. [Google Scholar] [CrossRef]
- Wen, W.; Ji, D.; Zhai, C.; Li, X.; Sun, P. Damage spectra of the mainshock-aftershock ground motions at soft soil sites. Soil Dyn. Earthq. Eng. 2018, 115, 815–825. [Google Scholar] [CrossRef]
- Yu, X.-H.; Li, S.; Lu, D.-G.; Tao, J. Collapse Capacity of Inelastic Single-Degree-of-Freedom Systems Subjected to Mainshock-Aftershock Earthquake Sequences. J. Earthq. Eng. 2020, 24, 803–826. [Google Scholar] [CrossRef]
- Zhou, Z.; Xu, H.; Gardoni, P.; Lu, D.; Yu, X. Probabilistic demand models and fragilities for reinforced concrete frame structures subject to mainshock-aftershock sequences. Eng. Struct. 2021, 245, 112904. [Google Scholar] [CrossRef]
- Lagoudas, D.C.; Mayes, J.J.; Khan, M.M. Simplified shape memory alloy (SMA) material model for vibration isolation. In Proceedings of the Smart Structures and Materials 2001 Conference, Newport Beach, CA, USA, 5–8 March 2001. [Google Scholar]
- Brinson, L.C. One-Dimensional Constitutive Behavior of Shape Memory Alloys: Thermomechanical Derivation with Non-Constant Material Functions and Redefined Martensite Internal Variable. J. Intell. Mater. Syst. Struct. 1993, 4, 229–242. [Google Scholar] [CrossRef]
- Auricchio, F.; Taylor, R.L.; Lubliner, J. Shape-memory alloys: Macromodelling and numerical simulations of the superelastic behavior. Comput. Methods Appl. Mech. Eng. 1997, 146, 281–312. [Google Scholar] [CrossRef]
- GB 50011-2010; Code for Seismic Design of Buildings. China Architecture and Building Press: Beijing, China, 2016.
- Vamvatsikos, D.; Cornell, C.A. Direct estimation of seismic demand and capacity of multidegree-of-freedom systems through incremental dynamic analysis of single degree of freedom approximation. J. Struct. Eng. 2005, 131, 589–599. [Google Scholar] [CrossRef]
Disclaimer/Publisher’s Note: The statements, opinions and data contained in all publications are solely those of the individual author(s) and contributor(s) and not of MDPI and/or the editor(s). MDPI and/or the editor(s) disclaim responsibility for any injury to people or property resulting from any ideas, methods, instructions or products referred to in the content. |
© 2024 by the authors. Licensee MDPI, Basel, Switzerland. This article is an open access article distributed under the terms and conditions of the Creative Commons Attribution (CC BY) license (https://creativecommons.org/licenses/by/4.0/).