Article

Prediction of Wet Area of Underwater Tunnel Lining

1
College of Civil Engineering and Architecture, Zhejiang University, Hangzhou 310058, China
2
School of Civil Engineering, Hangzhou City University, Hangzhou 310015, China
3
Yangtze River Wuhan Waterway Engineering Bureau, Wuhan 430014, China
*
Author to whom correspondence should be addressed.
Buildings 2024, 14(2), 408; https://doi.org/10.3390/buildings14020408
Submission received: 19 November 2023 / Revised: 24 January 2024 / Accepted: 30 January 2024 / Published: 2 February 2024
(This article belongs to the Section Construction Management, and Computers & Digitization)

Abstract

:
The issue of water seepage poses a significant challenge in tunnel infrastructure. Wet areas are commonly used to evaluate the degree of water seepage in tunnel projects. To investigate the feasibility for numerical simulation to predict a wet area, we selected concrete test blocks with two types of defects—holes and cracks—as the research specimens. Numerical models for various seepage conditions were constructed using TOUGH2, and the results were validated through laboratory experiments. Additionally, the Shenjiamen Subsea Tunnel was simplified into a numerical model, employing TOUGH2 to forecast its future wet area performance within the scope of national standards. The outcomes of our research revealed that point seepage and line seepage exhibited circular and elliptical morphologies, respectively. Moreover, external water pressure and defect size exerted a significant influence on the expansion of the wet area. Notably, the impact of crack width surpassed that of hole diameter. Encouragingly, the numerical models generated using TOUGH2 for unsaturated concrete demonstrated excellent agreement with laboratory test results concerning the geometry, size, and pattern of the wet area. These findings signified the potential of TOUGH2 numerical simulation as a valuable tool in predicting the lifespan of tunnels.

1. Introduction

Water leakage is a prevalent issue in tunnel engineering [1]. Leaking water serves as a primary medium for transporting corrosive ions into concrete [2]. It significantly impacts the stability of tunnel excavation faces [3,4], leading to a shortened maintenance cycle and lifespan of the tunnel [5,6,7], thereby increasing maintenance costs [8]. Tunnel joints, bolt holes, cracks, and grout holes are particularly susceptible to leakage, with field investigations of Shanghai Metro tunnels revealing that more than 80% of shield tunnel leakage occurs at joints. Specifically, hole leakage accounted for 12% and 15% of leakage in sections A and B, while circular joint leakage accounted for 68% and 54% of the respective sections [6]. With the extensive construction of tunnel projects in China, the focus is shifting from the peak construction period to the operational and maintenance phase. Therefore, the diagnosis and treatment of lining diseases represent a crucial research direction in Chinese tunnel engineering [9]. Consequently, it is essential to quantify and predict the occurrence of leakage issues in linings.
According to the manifestation of water leakage, tunnel seepage can be categorized into point leakage and line leakage [10,11]. Wet spots represent the early signs of water leakage and can be used as a metric for assessing it. The “Technical Code for Waterproofing of Underground Engineering” in China (GB50108-2008) [12] specifies the number and area of wet spots for different grades of underground engineering. Currently, the most common method for monitoring wet spots in projects is manual inspection, where the locations and areas are determined and documented after visual inspection [13]. Alternative methods include on-site detection through image processing techniques, such as camera measurement detection technology [14,15]. However, this approach may lead to confusion between wet spot patterns on linings and stains during the image recognition process. To address this, deep learning algorithms have been introduced [16,17]. In addition, infrared thermography detection technology [18,19] is a popular research direction. Infrared thermography detection technology offers fast scanning speeds and is independent of visible light illumination, but its results can be affected by external factors such as other heat sources [11]. Han et al. [20] proposed a monitoring approach based on multispectral fusion, combining the advantages of visual optics and thermal infrared sensors. However, these methods require substantial preparatory work to create extensive datasets.
Beyond on-site detection, theoretical methods can also be considered for predicting wet area, facilitating an understanding of the progression of water leakage, reducing safety risks, and minimizing economic losses. Presently, direct methods for predicting wet areas are lacking, but wet spots can be comprehended as an aggregation of water movement on the concrete surface, which can be estimated by predicting the unidirectional water penetration depth into the concrete. For instance, Wei et al. [21] established a stochastic model for lining water penetration depth based on reliability theory over time, considering the stochasticity of design variables and the properties of time variance. Li et al. [22] established predictive formulas for the relationship between pressure, average water flow velocity, depth, time, and moisture content in concrete, based on Darcy’s law and the laws governing pressure changes. However, parameters like flow velocity and moisture content are challenging to directly measure in engineering practice. Numerical simulation methods offer an alternative predictive approach. This study employed two types of concrete test blocks with defects—holes and cracks—as subjects for investigating point and line leakage issues. The influence of external water pressure and crack width on the concrete wet area were observed through laboratory experiments. Subsequently, numerical models of concrete saturation under various conditions were created using TOUGH2 V2.0 software. This study compares and analyzes the effects of external water pressure and defect size on the concrete wet area, explores the possibility of using numerical simulation to predict wet area, and conducts wet area predictions for actual underwater tunnel projects.

2. Theoretical Basis

Concrete is a porous material, and coring tests on underwater tunnels subject to prolonged high water pressure indicated that the interior of concrete remains in a partially saturated state at certain depths even after decades of service [23]. Therefore, it is more reasonable to calculate the concrete in underground engineering based on the unsaturated state. As moisture infiltrates through the pores or defects in concrete, the saturation of concrete gradually increases, eventually manifesting as wet spots on the concrete surface.
The water movement in unsaturated concrete can be expressed by Richard’s equation:
u = k s k r ( θ ) μ ψ
where u is the seepage velocity, m/s; k s is the absolute permeability coefficient at saturation, m/s; k r is the relative permeability, ranging between 0 (dry state) and 1 (saturated state); θ is the water content; μ is the coefficient of viscous momentum of water, Ρ a s ; is the Hamiltonian operator; and ψ is the total water potential driving the movement of water per unit volume, Ρ a .
k r ( θ ) is a function of water content, usually expressed in terms of the van Genuchten–Mualem model:
k r ( s ) = s 0.5 1 1 s 1 m m 2
where s is the water content, s = θ θ r θ s θ r ; θ r is the residual water content; θ s is the saturated water content; and m is an empirical parameter related to the pore distribution characteristics, determined by experimental fitting.
The total driving potential of water movement consists of pressure potential and matrix potential:
ψ = ψ p + ψ m
The pressure potential is caused by the pressure difference in the pressure field. Considering the connectivity of the capillary pores and assuming that the air in the unsaturated pores is directly connected to the external atmosphere, there is no additional hydrostatic pressure on the pore solution in the unsaturated zone. In contrast, the pore solution in the saturated zone is directly connected to external hydraulic water and is subject to additional hydrostatic pressure.
ψ p = 0 ( 0 s 1 ) ψ p ( x , t ) = P 0 exfc ( x 2 ρ w g k s E t ( s = 1 )
where ψ p ( x , t ) is the pressure potential, Pa; P0 is the hydrostatic pressure on the outer surface of the structure, Pa; erfc is the complementary error function; x is the distance from the concrete surface, m; E is the modulus of elasticity, Pa; and t is the pressure time, s.
The matrix potential ψ m can be regarded as the capillary suction of the porous material, which is generally represented by the van Genuchten–Mualem model:
ψ m = α ( s 1 m 1 ) 1 m
where α is an empirical parameter fitted from experimental data.
For concrete with cracks, the situation is different. Wang et al. [24] found that cracks with a width exceeding 50 μm significantly increase the permeability of concrete. Therefore, unlike in the previous discussion where concrete was treated as a simple porous medium, it is necessary to treat the pores and cracks separately in this case [25]. Following the dual-porosity model, hydraulic parameters are defined for both the pores and the cracks [26]. In other words, the leakage problem in cracked concrete can be regarded as a combination of moisture movement in the concrete and within the cracks.

3. Research Methods

3.1. Indoor Test

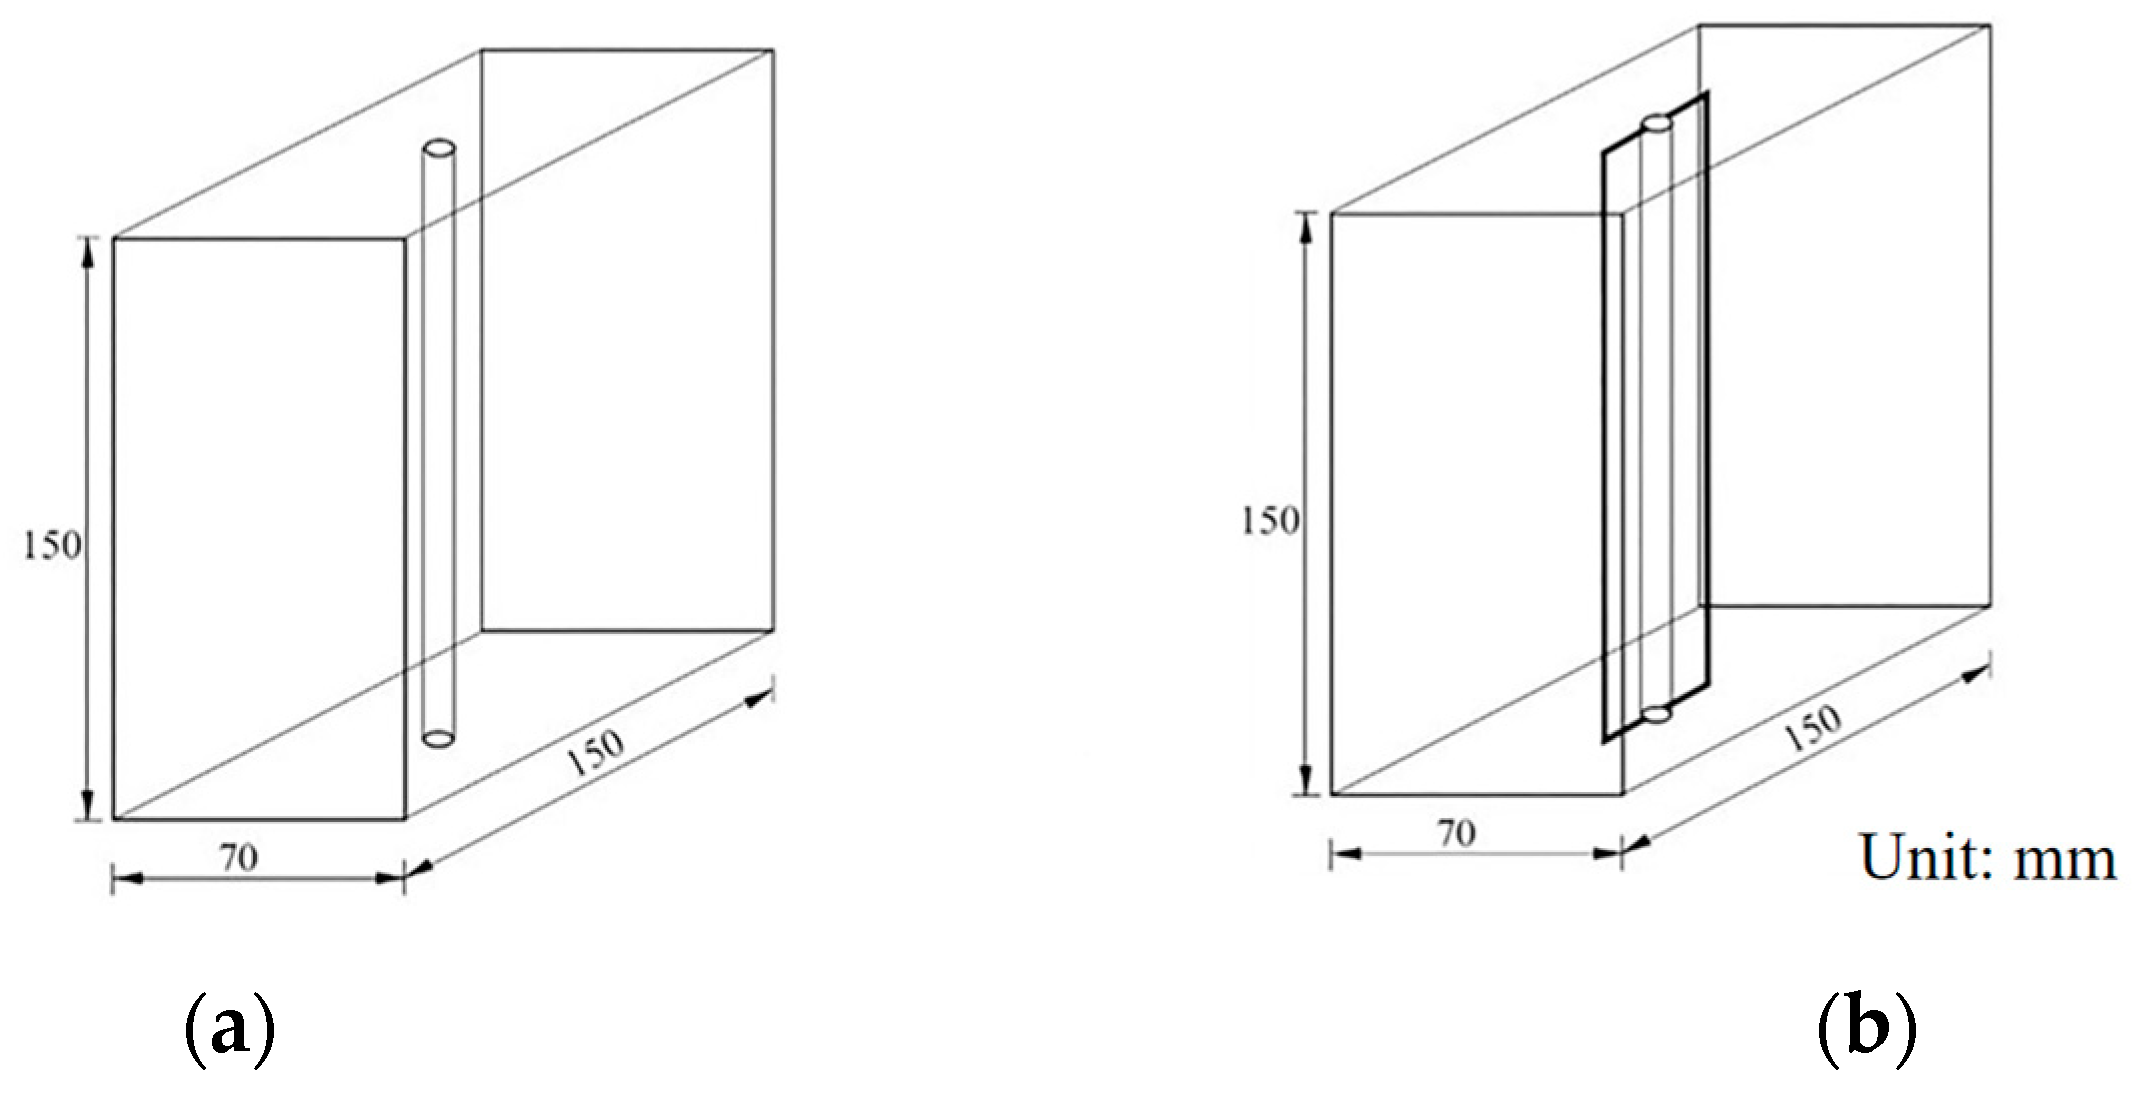
3.1.1. Test Specimens Preparation
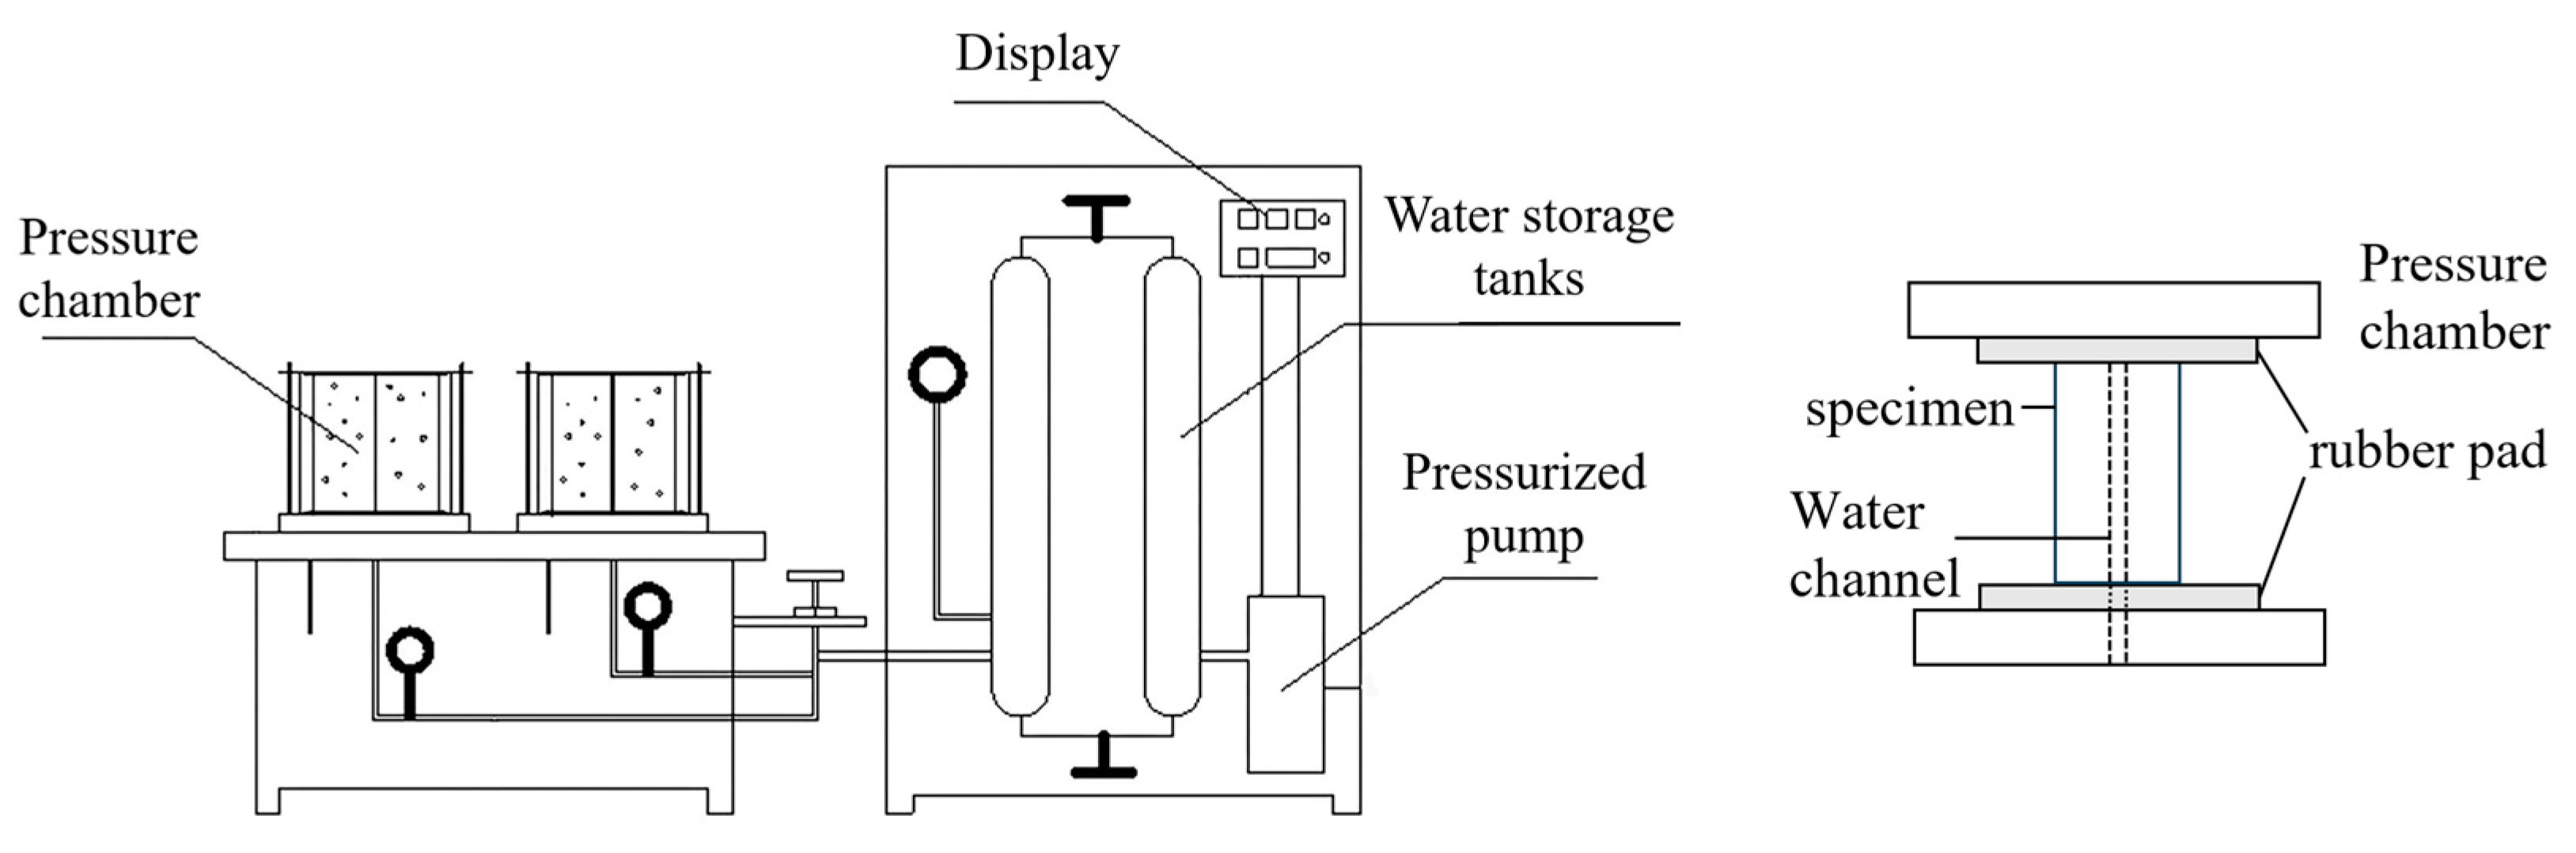
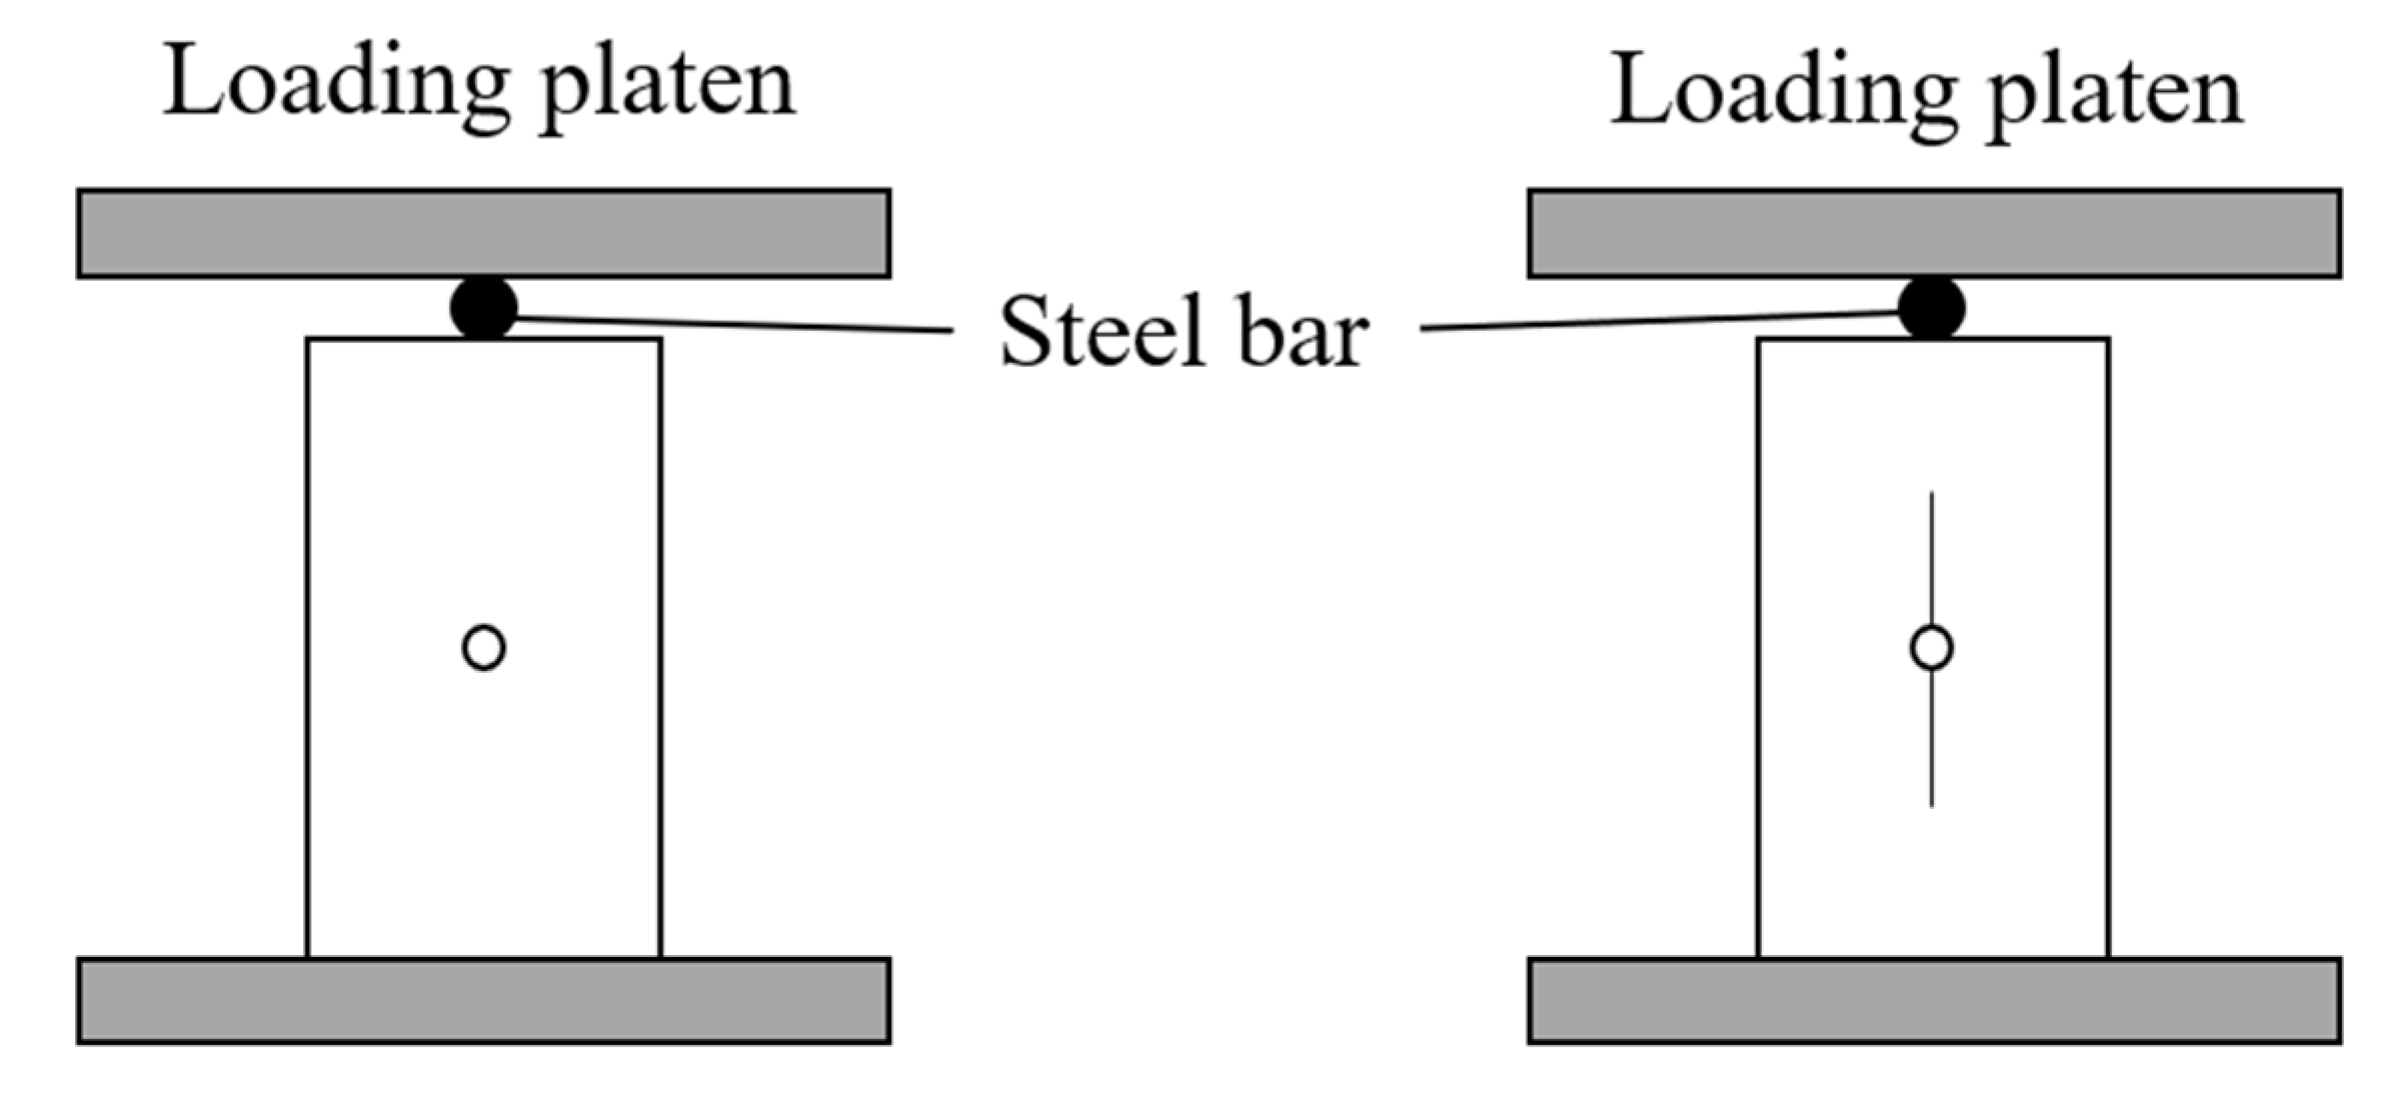
As shown in Table 1, concrete test blocks were fabricated according to the concrete mix design of the Shenjiamen Subsea Tunnel in Zhoushan, Zhejiang Province, China. To simulate two types of water seepage patterns, namely spot leakage and line leakage, two different types of test blocks were prepared following the methodology described in reference [27]. For the BI test block, a smooth ϕ6 reinforcement bar was embedded along the axis of the block to create prefabricated holes. On the other hand, the BII test block had a smooth reinforcement bar surrounded by stainless-steel plates, with varying thicknesses of 60 mm and a height of 150 mm, to create prefabricated parallel cracks (see Figure 1). Both the smooth reinforcement bar and stainless-steel plates were coated with oil in advance to prevent adhesion with the concrete. After the concrete test blocks reached initial set but before final set, the smooth reinforcement bar and stainless-steel plates were removed, and the blocks were demolded and placed in standard curing tanks for a curing period of 28 days at a temperature of 20 ± 2 °C and a relative humidity of over 95%.
The specimens were prepared in accordance with the conditions presented in Table 2. Spot leakage included 16 different conditions, while line leakage encompassed 64 conditions. To mitigate the impact of random variations in the test results, three specimens were fabricated for each condition. Furthermore, in adherence to the “Test Methods for Mechanical Properties of Concrete” (GB/T 50081-2019) [28], three standard cubic specimens with a side length of 150 mm were simultaneously created during the batch fabrication of the specimens, following identical procedures. Due to the presence of more than ten standard specimens, the assessment of strength was conducted using statistical methodologies as stipulated by the “Standard for Assessment of Compressive Strength of Concrete” (GB/T 50107-2010) [29]. Following the assessment, the compressive strength of the specimens in this study was determined to be 51.8 MPa.

3.1.2. Test Methods

Using the water permeability testing device as shown in Figure 2, the left side consisted of a pressure chamber of the concrete impermeability tester model HP-4.0, while the right side comprised a monitor, a water storage tank, and a pressurized pump. The monitor was provided by Hangzhou Keyang Electronics Co., Ltd., Hangzhou, China, and the pressurized pump was supplied by Dedong Electric Machinery Co., Ltd., Shaoxing, China, with a power of 136 W and a flow rate of 3. The experiment was conducted using specimens that were selected to have a smooth surface, compacted and free from any noticeable defects or cracks. Prior to the experiment, rubber pads were placed on both the upper and lower sides of the concrete specimen. The rubber pad located on the lower side had a reserved hole, and a stainless-steel top plate was tightened with screws to ensure a tight seal and allow water to enter only through the central hole.
At the beginning of the experiment, the water storage tank was filled with water, and we used the monitor to adjust pressure value. The pressurizing pump was activated, and the pressure gauge reading on the monitor was carefully monitored until it reached the predetermined test pressure value. Subsequently, the water inlet valve of the pressure chamber was opened to initiate the permeability test.
After reaching the designated test duration, the water inlet valve of the pressure chamber was closed, and three specimens for each condition were selected for measurement. As shown in Figure 3, a steel bar was placed at the center of the top surface of each specimen, which was then placed on the compression testing machine. Due to the presence of defects, there was a stress concentration at this location, which resulted in the splitting of the specimen along the position of the defect. As illustrated in Figure 4, five control points at 0°, 45°, 90°, 135°, and 180° were selected on the split concrete specimens, denoted by letters A-E respectively. Using a vernier caliper, the penetration depths in each direction were measured three times and averaged. The essence of water leakage geometry is the set of water movement on the concrete surface, that is, the set of anisotropic penetration depth. Therefore, the graph formed by connecting each control point of penetration depth is the leakage geometry diagram. The data were then imported into Origin for image plotting, and the wet area was calculated.

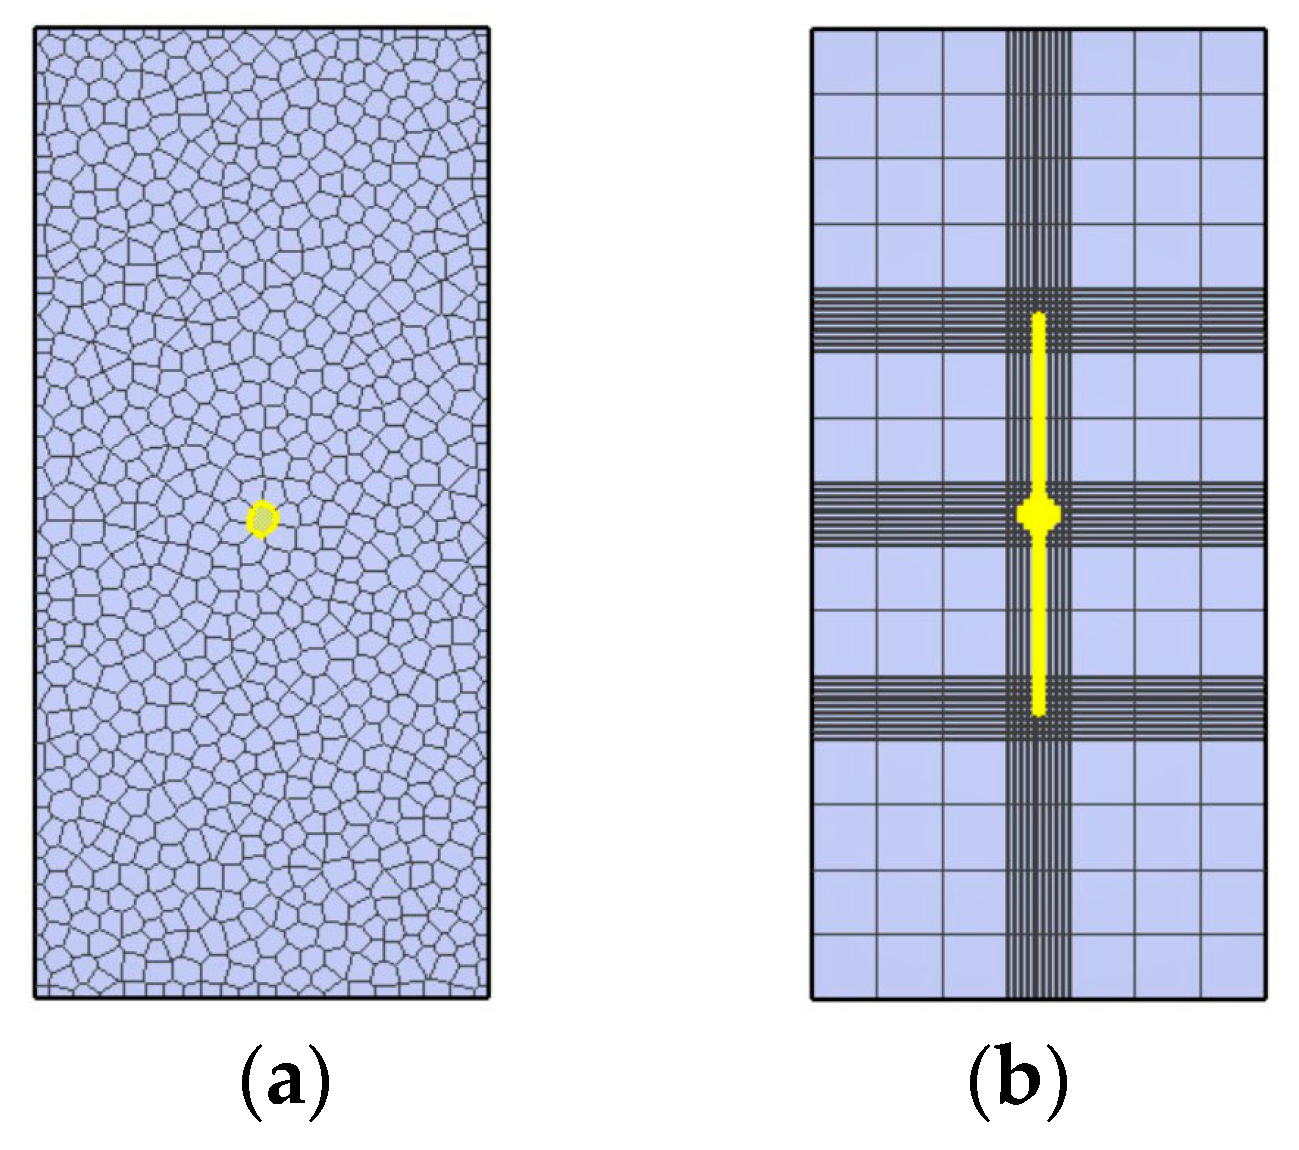
3.2. Numerical Simulation

TOUGH2 is a software developed by Lawrence Berkeley National Laboratory in the United States for analyzing the transport of unsaturated groundwater and heat in porous and fractured media. It possesses powerful modeling capabilities for fluid flow in porous and fractured media, and can simulate fluid flow in multiphase and multicomponent systems that are non-isothermal [30]. TOUGH2 simulates processes over large time and spatial scales. The time scale of simulating fluid flow processes can range from fractions of seconds to geological time scales spanning thousands of years, while the spatial scale can vary from microscale to watershed scale. TOUGH2 has flexible parameter definition and simulation functionalities, providing an interactive 3D environment where users can conveniently define model parameters, input data, and visualize results. It also supports various boundary conditions and initial value settings, allowing for flexible adjustment of simulation settings to accommodate the characteristics of water flow in unsaturated concrete. In recent years, TOUGH2 has been successfully applied in various research disciplines, including carbon storage, environmental remediation, hydrology, geothermal energy, landfilling, nuclear waste, nutrient cycling, and oil and gas, among others [31].
This study uses the EOS9 module in TOUGH2 to simulate the leakage behavior of defective concrete blocks under different conditions. As shown in Equation (1), water movement in unsaturated concrete can be represented by the Richard equation, and the EOS9 module is based on the Richard equation, suitable for simulating saturated–unsaturated single-phase flow. Each grid block only needs to solve one mass balance equation, resulting in fast computation speed. Based on the dimensions of the indoor test specimens, two models, BI and BII, with dimensions of 150 mm × 70 mm × 150 mm, were established to represent cavity defects and crack defects, respectively. TOUGH2 allows for the specification of hydraulic parameters for multiple materials. Therefore, in this model, concrete and defect materials are set, with parameters shown in Table 3. Model BI uses a Voronoi polygon mesh, while Model BII uses a rectangular mesh. Based on the size of the defects, numerical stability, and result accuracy, the area surrounding cracks and cavities is discretized more densely (Figure 5). Both models had the center inflow hole set as a Dirichlet-type boundary. The Dirichlet-type boundary condition is a fixed boundary condition in which the fluid pressure or temperature is specified as a constant value. This satisfies the requirement of constant external water pressure P at this location.

4. Results and Discussion

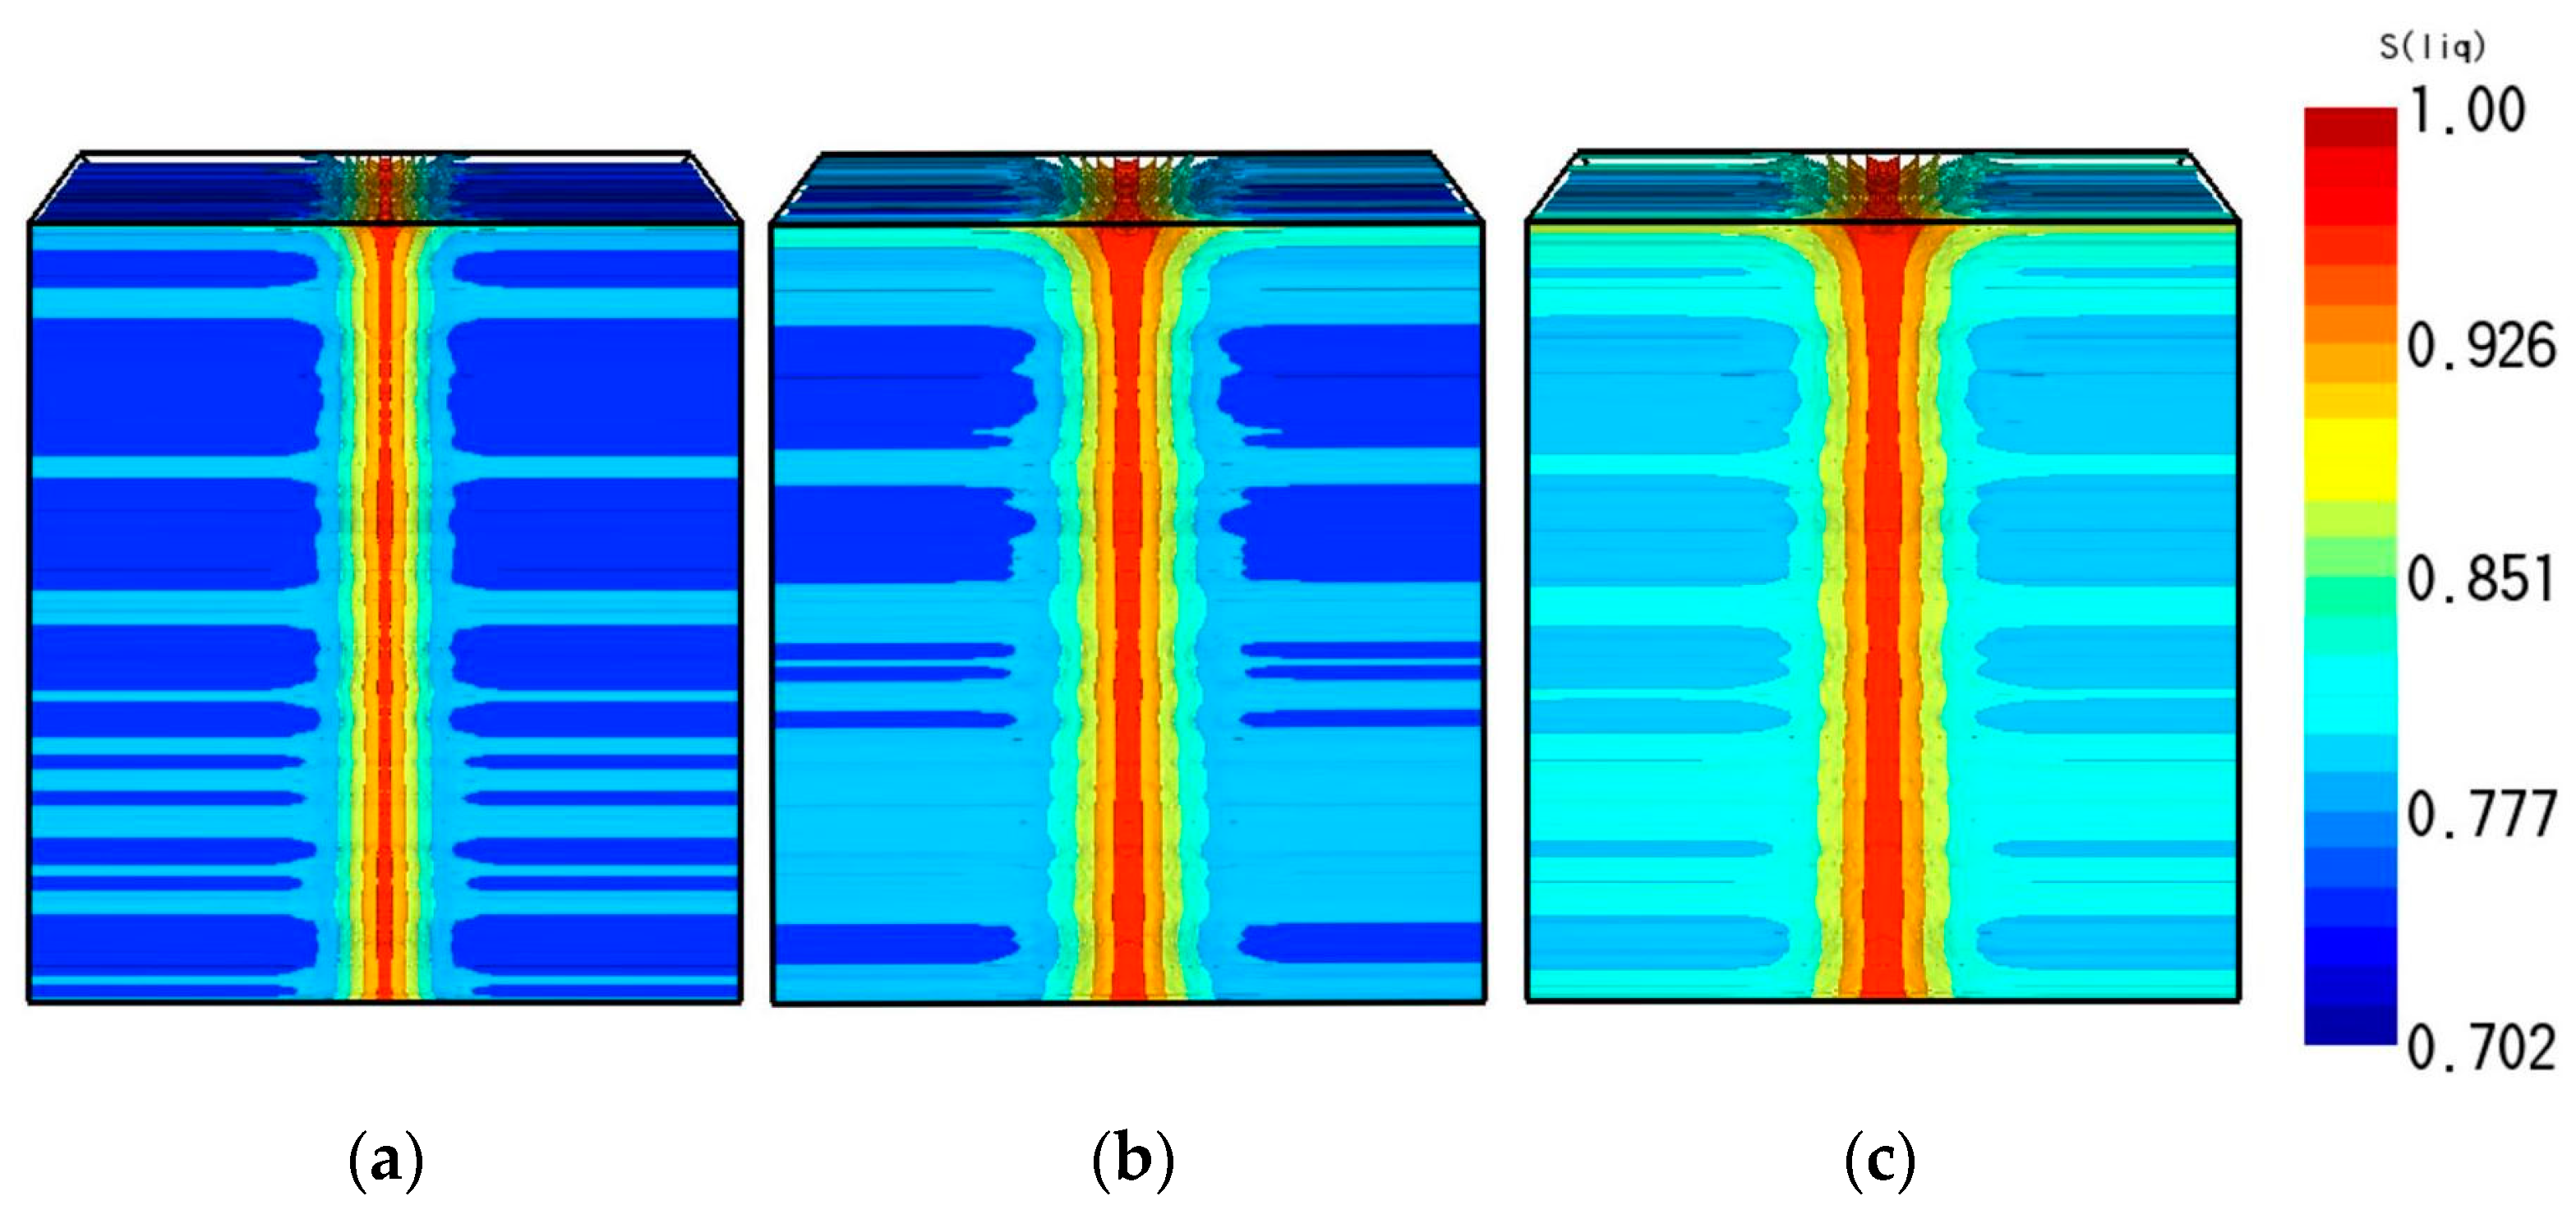
4.1. Geometry of Wet Area

The geometric patterns of moisture penetration in the two concrete specimens are illustrated in Figure 6. It can be observed that the overall moisture penetration areas exhibited a symmetrical distribution. The water infiltration pattern for the BI specimen formed a circular shape centered around the pre-existing borehole, gradually expanding uniformly in all directions over time, indicating a uniform movement of water along all directions of the borehole. In contrast, the moisture infiltration pattern for the BII specimen took on an elliptical shape around the pre-existing borehole and cracks. As time progressed, the moisture zone gradually enlarged, with the increase in moisture velocity at the crack end comparable to the increase in moisture velocity perpendicular to the direction of the crack.
Moradllo et al. [32] utilized neutron radiography to convert the moisture content in concrete profiles into water penetration depth. Based on the selected moisture content as the outer contour of the moisture zone, and considering the calculation formula for the total driving potential in water movement, it is evident that saturation is the most significant influencing factor on the driving potential in water movement within unsaturated concrete. Therefore, saturation maps are used to represent the moisture penetration area, as shown in Figure 7. The saturation map for the BI specimen uniformly expanded outward over time, while the saturation map for the BII specimen took on a spindle shape. The similarity between the saturation maps and the experimentally observed geometric patterns of moisture penetration confirmed the practical applicability of the model.

4.2. Wet Area

The wet area of the laboratory test can be calculated from the test method described in Section 3.1.2 and the tracing plot. Meanwhile, the wet area in numerical simulations was determined from saturation maps. In Origin, the contour lines of the saturation maps were outlined and calculated.
The deviation between the simulated and experimental values were calculated for the wet area of the specimens under each condition and plotted on the following graph. Figure 8 illustrates the distribution of data within different deviation ranges. The x-axis represents the absolute value of the percentage error, while the y-axis represents the quantity of data within each range. The majority of the percentage errors fall within 10%, indicating a close approximation between the simulated and experimental values. There is a higher likelihood of encountering errors between 5% and 10%. Hence, based on the magnitude of the data, the simulated values are relatively close to the experimental values.

4.2.1. Influence of External Water Pressure on Wet Area

Figure 9 shows the comparison between experimental and simulated wet areas under hydraulic conditions. Overall, the numerical values of the experimental and simulated values are relatively close, and their data trends and slopes are consistent with time and water pressure. Specifically, the experimental and simulated wet areas of specimens BI and BII both increase with the passage of time and the increase in external water pressure.
From Figure 9a, it can be observed that the wet area of specimen BI followed a linear growth trend with time under low water pressure conditions, and the simulated and experimental values are in good agreement. However, under higher water pressure conditions (0.3 MPa and 0.4 MPa), both the simulated and experimental values had relatively flat slopes before 48 h, then experienced a sudden increase after 48 h. From Figure 9b, it can be seen that the wet area of specimen BII generally increased linearly with time, except for some instability in the simulated values under the 0.3 MPa condition.
Comparing Figure 9a,b, it can be observed that under low water pressure conditions, the growth rate of the wetted area for specimen BII was about eight to nine times that of specimen BI at the same time. However, under higher water pressure conditions, the growth rate decreased significantly and was approximately two to three times that of specimen BI.

4.2.2. Influence of Defects on Wet Area

Figure 10 depicts a comparison of the wet area between concrete specimens in experimental and numerical models under different defects at an external water pressure of 0.3 MPa. Overall, the numerical values of the experimental and simulated values are close, and they both increased with the increase in crack width, with similar slopes.
Specifically, at the same time point, the wet area of specimen BI was significantly smaller than that of specimen BII. Focusing solely on the BII specimen, as the crack width increased, the wet area also increased. Moreover, the increase in wet area grew proportionally larger with the increasing crack width, with the ratio closely approximating the square of the crack width.
However, the accuracy of the TOUGH2 model depends on the accuracy of the parameters, the precision of the grid division, and the realism of the boundary conditions. The model calculations are performed based on the input hydraulic parameters and the specified boundary conditions. Regarding the grid division, insufficient or inappropriate grid resolution may result in the inability to accurately capture fine water movement details within the concrete. Therefore, potential improvements for the TOUGH2 model include more accurate measurement and estimation of hydraulic parameters for concrete materials, optimization of grid resolution and distribution, and calibration of boundary conditions based on actual circumstances.

4.3. Discussion

4.3.1. Leakage Depth Fitting

For the water pressure conditions, according to Equation (1), the moisture flow rate is linearly related to water pressure. Therefore, as the external water pressure increased, both BI and BII specimens experienced an increase in flow rate, leading to an enlargement of the wet area. Concerning the crack width conditions, since the permeability coefficient followed a cubic law with crack width, wider cracks resulted in an exponential growth of the permeability coefficient. Consequently, as the crack width increased, the flow rate of both BI and BII specimens increased, leading to a larger wet area. Overall, the experimental values of the wet area for the BI specimen exceeded the simulated values, while for the BII specimen, the opposite was true.
Based on the experiments and referring to the relationship between water penetration depth and time established by Tsuchiya et al. [33], the calculation formulas for point leakage and line leakage depth were obtained through the fitting tool in Origin:
BI :   D 1 = 3.24 × 10 5 · P · t 1.13
BII :   D 2 = 1.45 w 0.49 · D 1
where D is the concrete seepage depth, P is the water pressure, w is the joint width, and t is the seepage time.

4.3.2. Fitting of Wet Area

It can be seen from the test and model that the wet shapes of BI and BII are approximately circularity and ellipse, respectively; based on Figure 11, the wet area is established as followed:
BI :   A 1 = π · ( D 1 + r ) 2
BII :   A 2 = π · ( D 2 + a ) · D 2
where A is the wet area, D 1 and D 2 are the seepage depth of test specimens BI and BII, respectively, r is the radius of hole defects, and a is 1/2 crack length.
Figure 12 shows the comparison between fitting results and test values. Overall, the deviation between the fitted values and experimental values remained within ten percent. In comparison to point leakage, the fitting error for line leakage was even smaller, indicating that the fitting formula for line leakage performed better. Through analysis and calculations of the experimental data, the growth rates of point leakage and line leakage both linearly increased with time, with the slope of line leakage exceeding that of point leakage. In the initial stages, the wet area of line infiltration was 15–20 times that of point leakage, and as time progressed, the gap gradually narrowed, reaching 3–5 times at 72 h.
In practical engineering, point leakage is prone to occur in bolt holes and grouting holes, while line leakage is most likely to occur at the joints of pipe sections. According to the construction technical requirements of a certain underwater tunnel, the diameter of bolt holes is set at 41 mm, grouting holes at 90 mm, and the width of pipe joint seams is 0.2 mm. The “Technical Specifications for Highway Tunnel Maintenance” (JTG H12-2015) [34] classifies cracks into three levels based on length, using 5 m and 10 m as dividing points. Therefore, these values were used as calculation parameters. According to Formulas (8) and (9), point and line leakage performances are calculated for 1 day, 7 days, 30 days, and 60 days.
From Figure 11, it is evident that as time progresses, the wet area of point leakage is consistently smaller than that of line leakage, and their growth factors follow the same pattern. Moreover, compared to crack length, the diameters of void defects have a minimal impact on the wetted area. Therefore, the harm caused by line leakage is much greater than that caused by point leakage.
Using the growth rate of the wet area can more clearly show the change of the wet area, using Q to represent the growth rate:
Q = A t A 0
where A t is the wet area at time t, and A 0 is the initial leakage area.
As can be seen from Figure 13, over time, the wet area of point leakage is much smaller than that of line leakage, and the growth ratio of the two also follow the same law. Compared with the crack length, the diameter of the hole defect has little influence on the wet area. Therefore, from the perspective of water movement, the rate of increase in wet area for line leakage is much greater than that for point leakage. In addition, line leakage has a longer water flow path and higher flow velocity, which generates higher water pressure and increases the damage to the tunnel structure. The water and harmful substances introduced by line leakage can further corrode the materials at the joints, increasing the risk. The introduction of a large amount of water by line leakage can cause saturation and softening of the soil inside the tunnel structure, which may weaken the stability of the foundation and increase the risks of settlement and deformation. Therefore, the harm caused by line leakage is greater than that of point leakage.

5. Engineering Cases

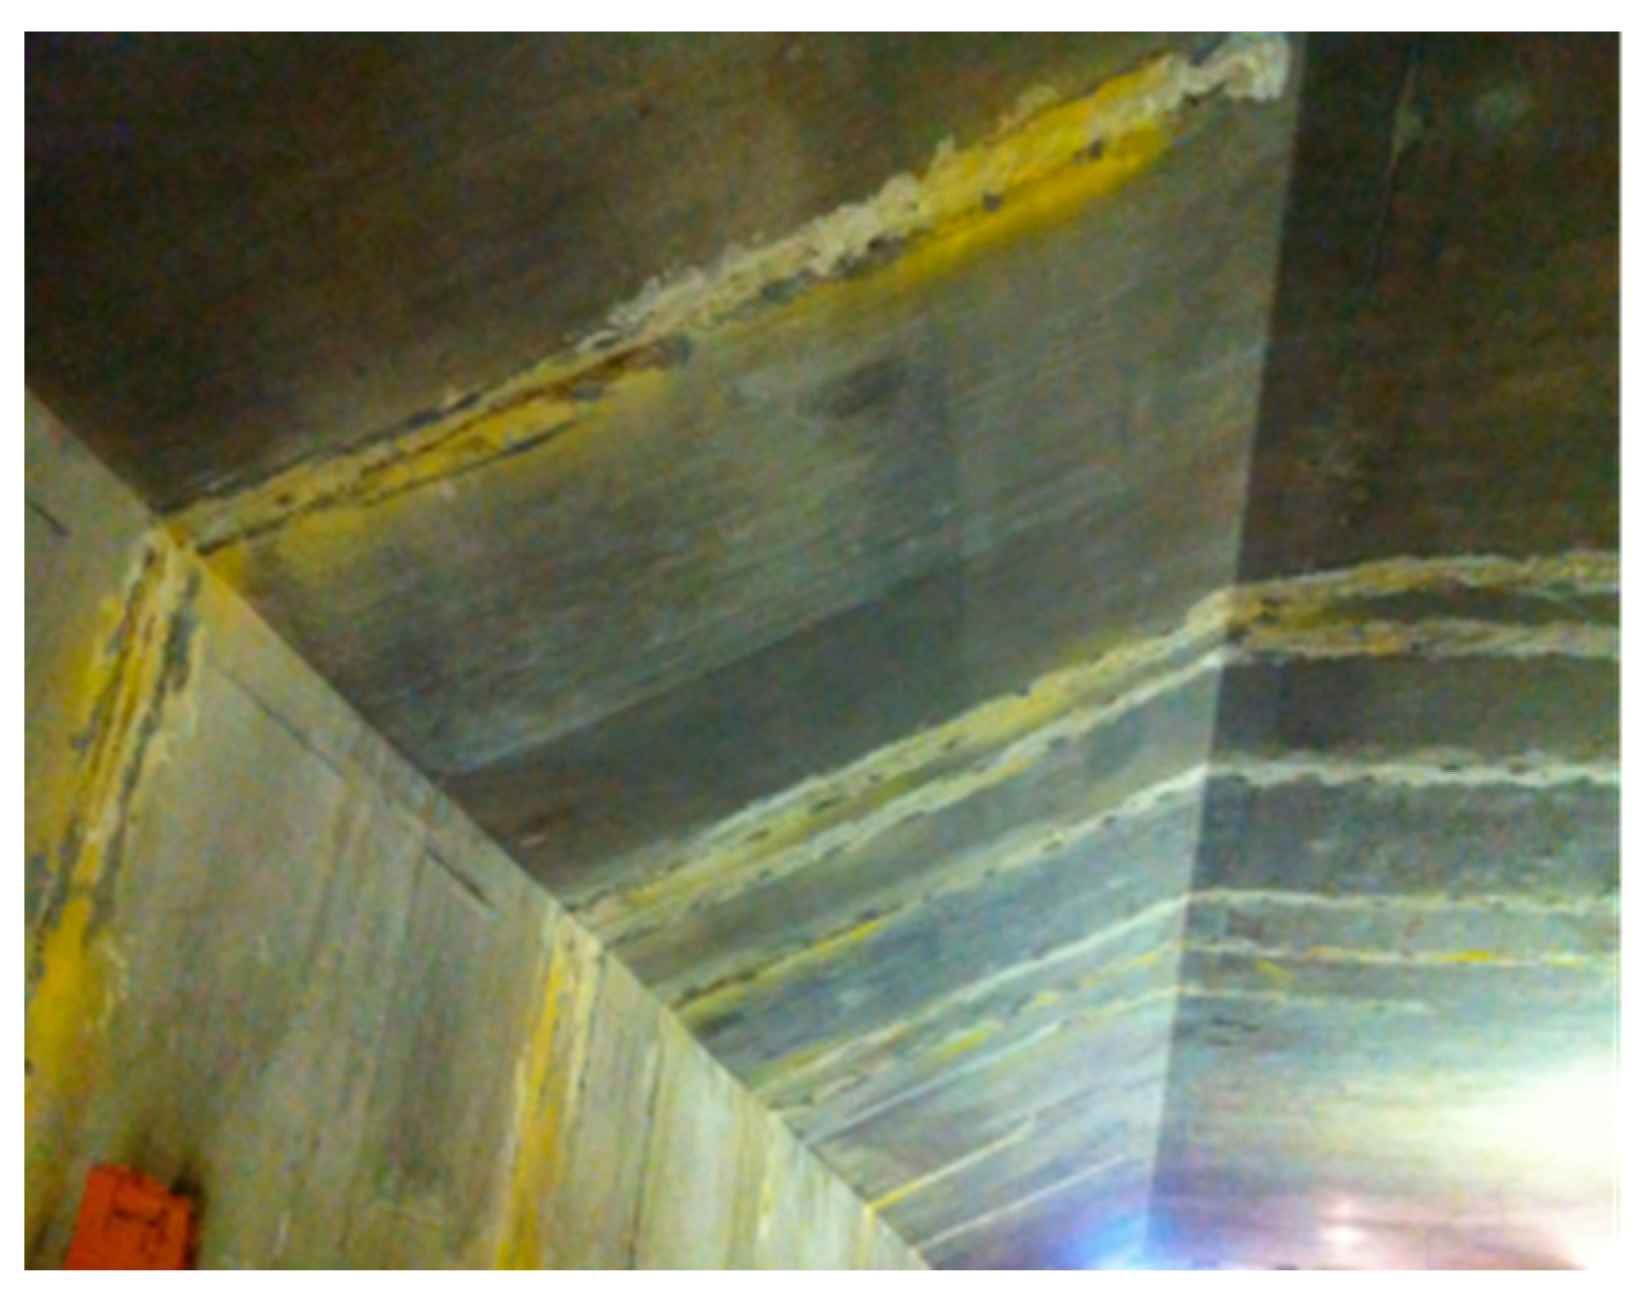
5.1. Engineering Condition

The Shenjiamen Harbor Undersea Tunnel project in Putuo District of Zhoushan City is the first highway undersea shield tunnel in Zhejiang Province, China, with a design service life of 100 years. The tunnel is made of high-performance concrete, with strength of C50, and the impermeability grade is greater than that of P12. Two waterproofing measures are adopted at the joint of the pipe section: the first waterproofing adopts a GINA waterproofing belt, and the second waterproofing adopts an Ω waterproofing belt. The cracks of the tunnel were fully patched before operation (as shown in Figure 14), and this paper discusses the problem of wet damage in case of joint leakage. The cross-section of the tunnel is shown in Figure 15.

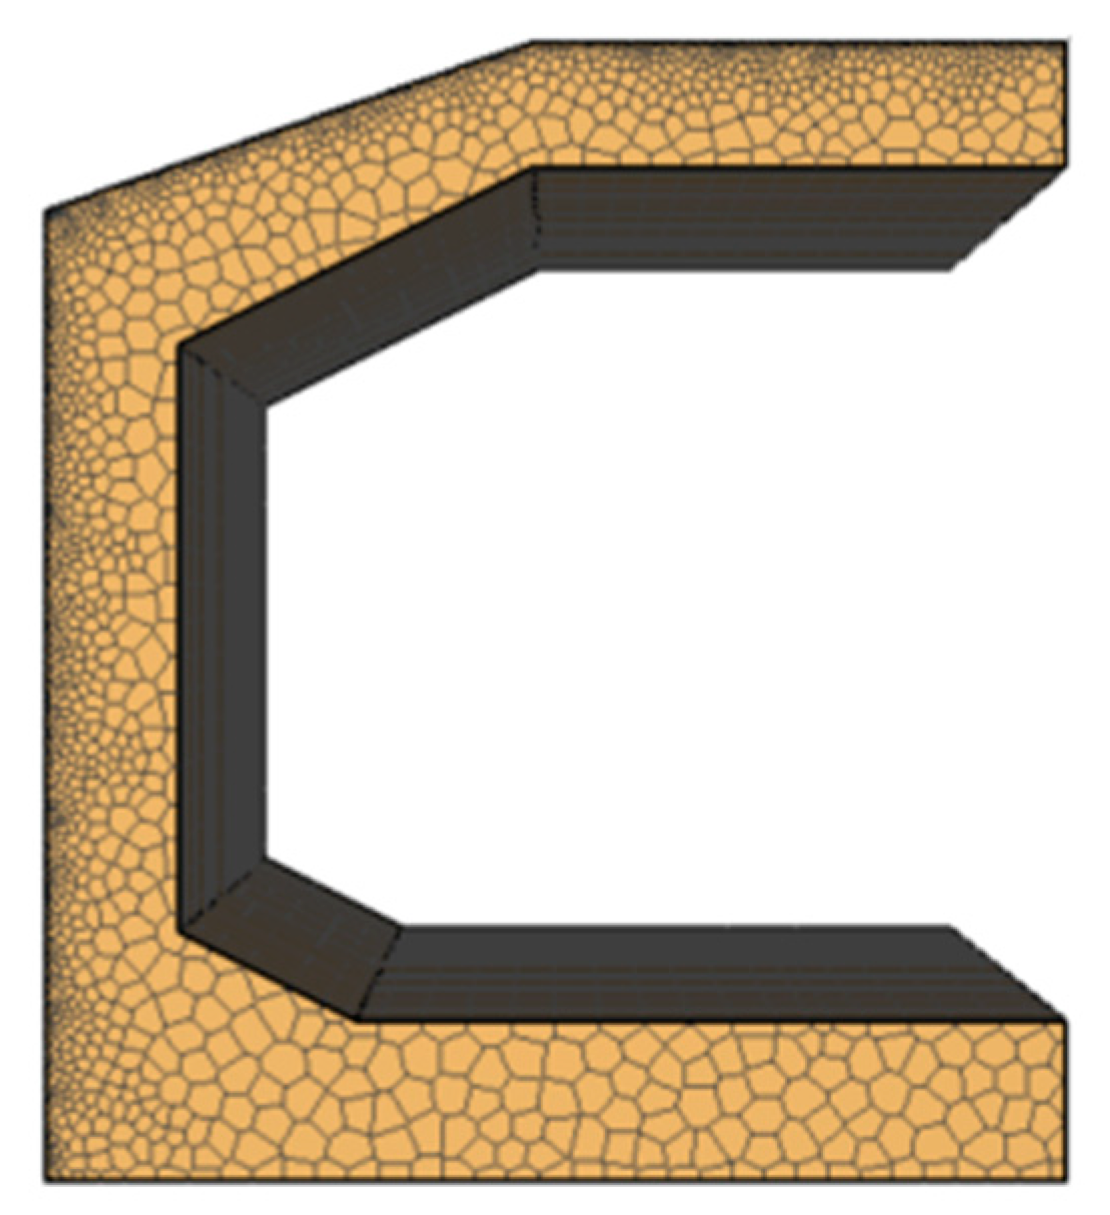
5.2. Numerical Simulation

TOUGH2 was modeled on a 5 m pipe segment as shown in Figure 16, using a ½ cross-section taking into account the symmetry of the cross-section. A joint in the form of a crack was positioned at the central axis of the outer wall of the pipe segment. In accordance with the specifications outlined in the “Technical Specifications for Waterproofing in Underground Engineering”, the crack width for waterproof concrete structures should not exceed 0.2 mm [12]. Therefore, models were developed for two scenarios with crack widths of 0.1 mm and 0.2 mm. Ten layers of grids were placed in the middle of the pipe segment, each with a width of 0.05 mm, to adjust the crack width. The external water pressure along the height of the pipe segment started from 0.15 MPa and was linearly applied. The simulation involved polygonal grid division, additional grid refinement, and followed the same steps as described in the above simulation.

5.3. Result Analysis

As shown in Figure 17, the numerical simulation results show that the saturation of concrete was highest at the crack, and the farther away from the crack, the lower the saturation. With the advance of the simulation time, the saturation at the outer wall of the tunnel increased continuously with the crack as the center, and saturation occurred first at the arch waist. Therefore, water seepage occurred there first.
The waterproofing level of tunnel engineering is Level 2. Therefore, according to the Technical Specification for Waterproofing of Underground Engineering, there can be no more than two wet spots on any 100 m2 wet area, and the maximum area of a single wet spot should be no more than 0.1 m2 [12]. As shown in Figure 18, at 0.1 mm crack width, the time for the model to reach the limit value is 9.5 × 10⁶ s, about 110 days, while at 0.2 mm seam width, the time for the model to reach the limit value is 8.21 × 10⁶ s, about 95 days.
When the wet area at a certain location of a tunnel exceeds the specified limit of 0.1 m2, there may be risks of structural damage and foundation instability, exacerbating the corrosion of concrete structures and softening of the foundation, leading to structural failure. Therefore, it is necessary to take preventative measures. Firstly, controlling the leakage source is essential to prevent further deterioration of the condition. Secondly, strengthening and maintaining the structure is crucial to enhance the impermeability and stability of the lining. Additionally, continuous monitoring of the affected area is needed for a period of time to prevent further damage.

6. Conclusions

In order to reduce the losses caused by the leakage of lining, concrete test specimens with holes and cracks were used as the research objects. The influence of external water pressure and defect form on the wet area were studied. The feasibility of simulating the leakage process of TOUGH2 was verified by the laboratory test data. According to the national standard, the wet condition of Shenjiamen Tunnel was predicted by numerical simulation. The main findings are as follows:
(1)
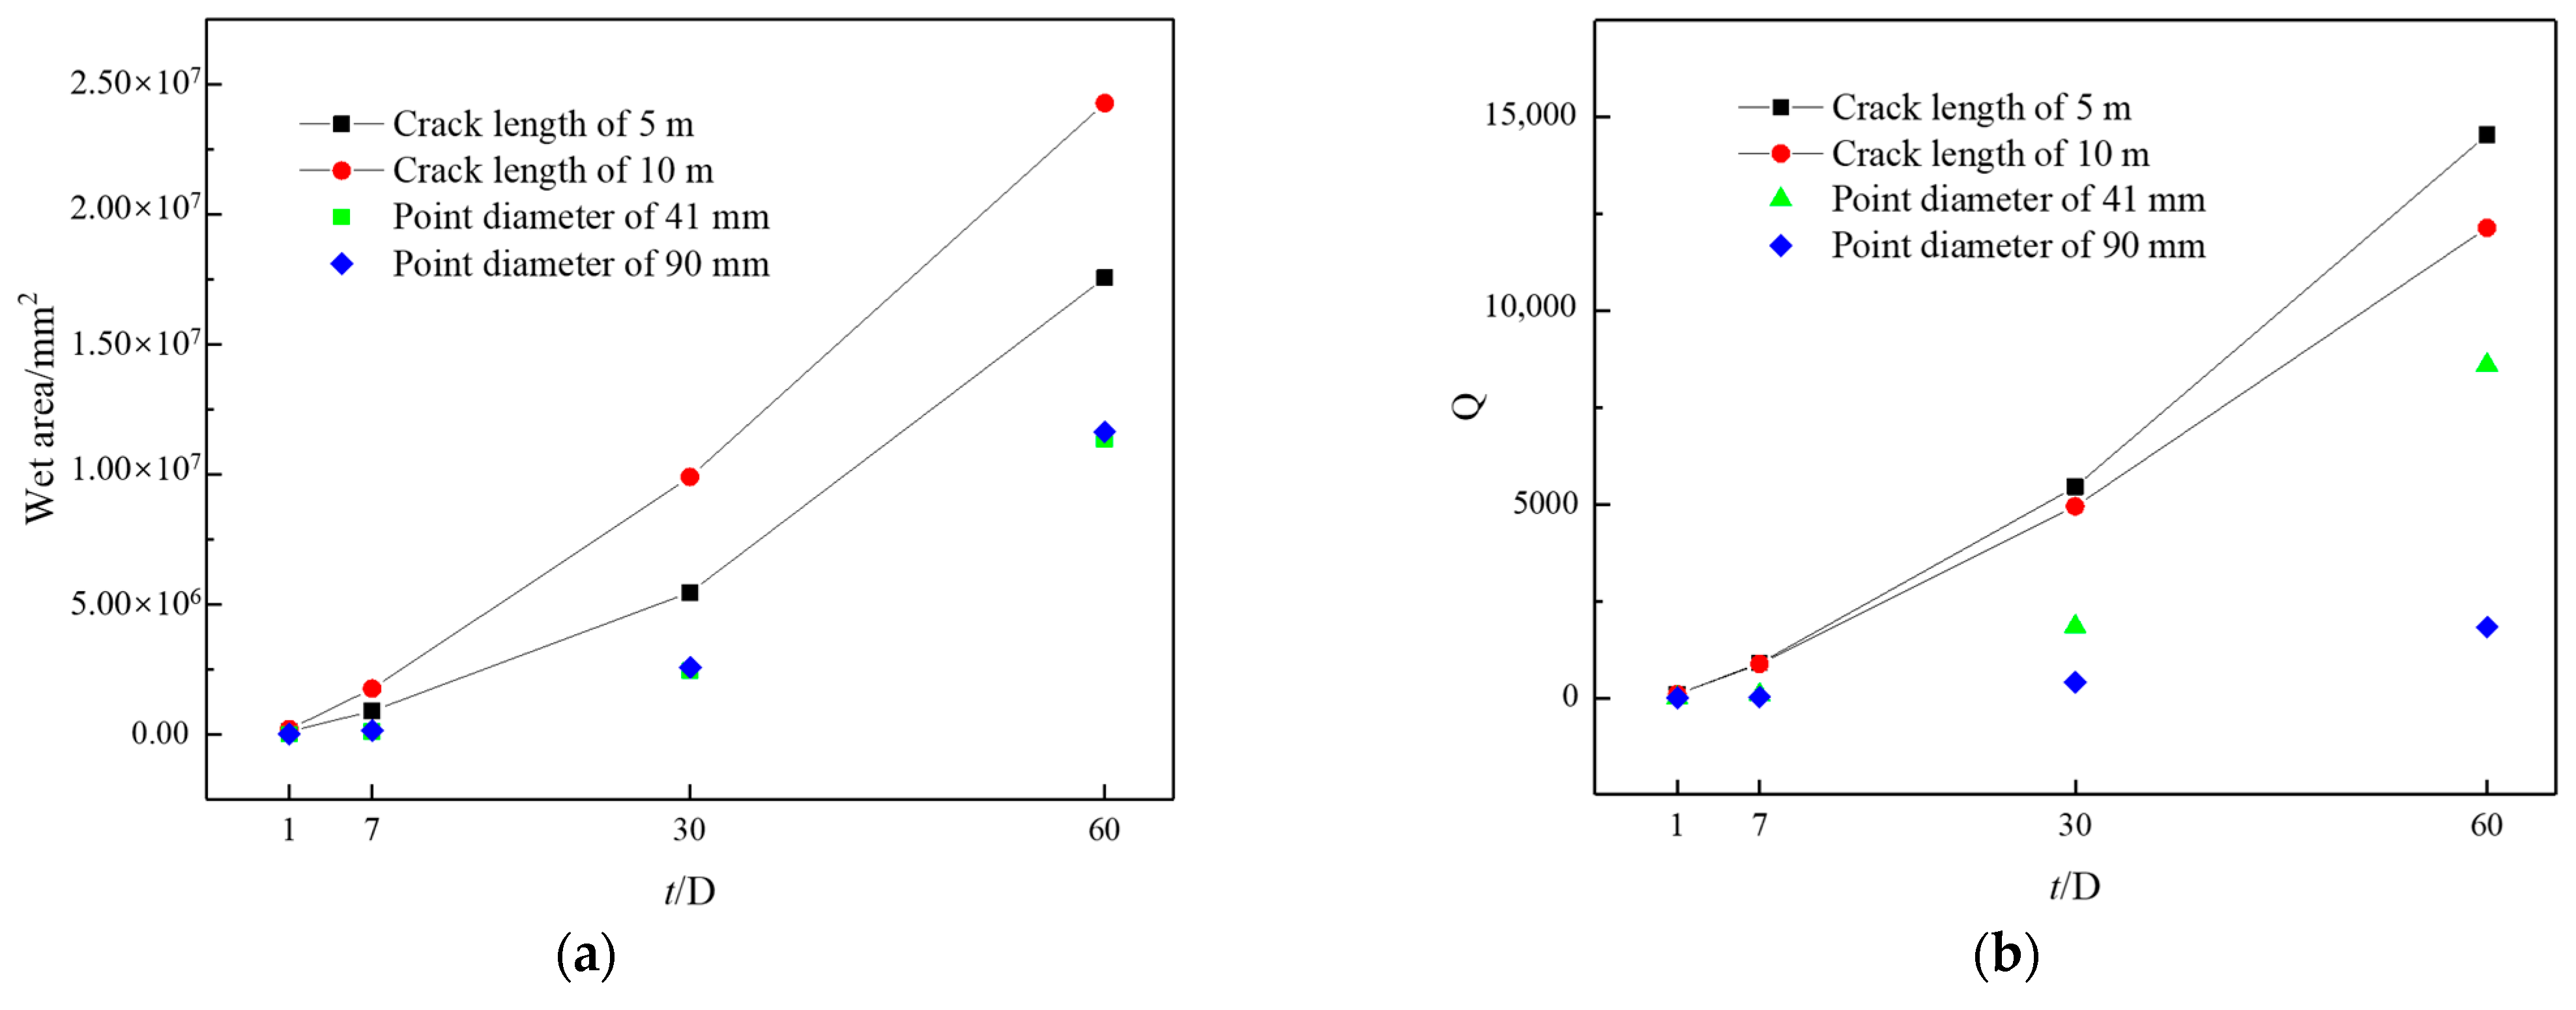
The geometric shape of water seepage is influenced by the form of defects. Both point leaks and line leaks have symmetric distributions, with the former approximating a circular shape and the latter approximating an elliptical shape. Compared to point leakage, the permeability coefficient at the crack is larger, manifested by a higher initial water flow rate at the ends of the crack. Therefore, the wet area of line leakage is larger than that of point leakage in the same time period.
(2)
Indoor experiments have shown that both external water pressure and crack width increase the permeability of concrete and the wet area of the lining. Under similar conditions, an increase in external water pressure from 0.1 MPa to 0.4 MPa can result in a 2–3 times increase in wet area, while an increase in crack width from 0.1 mm to 1 mm can lead to a 3–5 times increase in wetted area. Within 72 h, the growth of wet area over time shows a linear relationship with water pressure and follows the cubic law with crack width. The numerical model of unsaturated concrete established using TOUGH2 shows consistent trends with experimental results in terms of wetted area variation with water infiltration time, external water pressure, and crack width. Additionally, the numerical values of wet area are also close to the experimental results. Therefore, TOUGH2 numerical simulation can be used for predicting the wetted area of tunnel linings, providing assistance in assessing their durability.
(3)
The harm caused by line leakage is greater than that of point leakage. Using TOUGH2 to predict the time for the wet area of the Shenjiamen Port Subsea Tunnel project to reach critical value after cracks within engineering specifications occur, it takes about 110 days for a 0.1 mm crack width and about 95 days for a 0.2 mm crack width. Once the limit value is exceeded, remedial measures are necessary. For now, this approach is limited. The scope of water leakage prediction is limited to the defect that the evaluation system based on the wet area has a relatively regular shape under constant water pressure.
However, in real scenarios, the situation can be more complex. The anisotropy of concrete, the uncertainty in the distribution of internal defects, and various unexpected environmental conditions can all affect the generalization of the above conclusions to actual engineering projects.

Author Contributions

L.L.: Methodology, Software, Formal Analysis, Investigation, Writing—Original Draft, Visualization, Project Administration. Y.Z.: Conceptualization, Validation, Writing—Review and Editing, Supervision, Funding Acquisition. K.X.: Conceptualization, Methodology, Resources. All authors have read and agreed to the published version of the manuscript.

Funding

This research was funded by the National Natural Science Foundation of China (Grant no. 51878609) and the Natural Science Foundation of Zhejiang Province of China (Grant no. LY21E080005).

Data Availability Statement

The raw data supporting the conclusions of this article will be made available by the authors on request.

Conflicts of Interest

The authors declare that they have no known competing financial interests or personal relationships that could have appeared to influence the work reported in this paper.

References

  1. Liu, C.; Zhang, D.; Zhang, S. Characteristics and treatment measures of lining damage: A case study on a mountain tunnel. Eng. Fail. Anal. 2021, 128, 105595. [Google Scholar] [CrossRef]
  2. Chun-Qing, L.; Hassan, B.; Shangtong, Y. Probabilistic study on hydraulic conductivity of concrete at meso-scale. ACI Mater. J. 2018, 115, 717–725. [Google Scholar]
  3. Chen, J.; Zhou, M.; Zhang, D.; Huang, H.W. Quantification of water inflow in rock tunnel faces via convolutional neural network approach. Autom. Constr. 2021, 123, 103526. [Google Scholar] [CrossRef]
  4. Li, Z.; Huang, H.; Zhou, M.; Zhang, D. Failure responses of rock tunnel faces during excavation through the fault-fracture zone. Undergr. Space 2023, 10, 166–181. [Google Scholar] [CrossRef]
  5. Wang, X.; Fan, F.; Lai, J.; Xie, Y. Steel fiber reinforced concrete: A review of its material properties and usage in tunnel lining. Structures 2021, 34, 1080–1098. [Google Scholar] [CrossRef]
  6. Gong, C.; Wang, Y.; Peng, Y.; Ding, W.; Lei, M.; Da, Z.; Shi, C. Three-dimensional coupled hydromechanical analysis of localized joint leakage in segmental tunnel linings. Tunn. Undergr. Space Technol. 2022, 130, 104726. [Google Scholar] [CrossRef]
  7. Liu, D.; Wang, F.; Hu, Q.; Huang, H.; Zuo, J.; Tian, C.; Zhang, D. Structural responses and treatments of shield tunnel due to leakage: A case study. Tunn. Undergr. Space Technol. 2020, 103, 103471. [Google Scholar] [CrossRef]
  8. Gao, C.; Zhou, Z.; Yang, W.; Lin, C.-J. Model test and numerical simulation research of water leakage in operating tunnels passing through intersecting faults. Tunn. Undergr. Space Technol. 2019, 94, 103134. [Google Scholar] [CrossRef]
  9. Yang, S.; Wang, Z.; Wang, J.; Cohn, A.G. Defect segmentation: Mapping tunnel lining internal defects with ground penetrating radar data using a convolutional neural network. Constr. Build. Mater. 2022, 319, 125658. [Google Scholar] [CrossRef]
  10. Li, D.; Li, X.; Li, C.C.; Huang, B. Case studies of groundwater flow into tunnels and an innovative water-gathering system for water drainage. Tunn. Undergr. Space Technol. 2009, 24, 260–268. [Google Scholar] [CrossRef]
  11. Jiang, Y.; Lai, W.; Bo, Z.; Dai, X.; Ye, J.; Sun, B.; Liu, N.; Wang, Z.; Zhao, Y. Tunnel lining detection and retrofitting. Autom. Constr. 2023, 152, 104881. [Google Scholar] [CrossRef]
  12. GB50108-2008; Technical Specifications for Waterproofing of Underground Engineering. Ministry of Housing and Urban-Rural Development of the People’s Republic of China: Beijing, China; China Plan Press: Beijing, China, 2008.
  13. Wu, C.; Huang, H.; Zhang, L.; Chen, J.; Zhou, M.; Tong, Y. Towards automated 3D evaluation of water leakage on a tunnel face via improved GAN and self-attention DL model. Tunn. Undergr. Space Technol. 2023, 142, 105432. [Google Scholar] [CrossRef]
  14. Tan, L.; Hu, X.; Tang, T.; Yuan, D. A lightweight metro tunnel water leakage identification algorithm via machine vision. Eng. Fail. Anal. 2023, 150, 107327. [Google Scholar] [CrossRef]
  15. Huang, H.; Sun, Y.; Xue, Y.; Wang, F. Inspection equipment study for subway tunnel defects by grey-scale image processing. Adv. Eng. Inform. 2017, 32, 188–201. [Google Scholar] [CrossRef]
  16. Xue, Y.; Cai, X.; Shadabfar, M.; Shao, H. Deep learning-based automatic recognition of water leakage area in shield tunnel lining. Tunn. Undergr. Space Technol. 2020, 104, 103524. [Google Scholar] [CrossRef]
  17. Feng, S.J.; Feng, Y.; Zhang, X.L.; Chen, Y.H. Deep learning with visual explanations for leakage defect segmentation of metro shield tunnel. Tunn. Undergr. Space Technol. 2023, 136, 105107. [Google Scholar] [CrossRef]
  18. Zheng, A.C.; He, Z.Y.; Li, J.Q.; Zhang, R.L.; Tan, B.X.; Huang, F. Experimental study on infrared characteristic recognition for water leakage of tunnel cracked lining. J. Southeast Univ. Nat. Sci. Ed. 2022, 52, 109–116. [Google Scholar]
  19. Fahmy, M.; Moselhi, O. Automated Detection and Location of Leaks in Water Mains Using Infrared Photography. J. Perform. Constr. Facil. 2010, 24, 242–248. [Google Scholar] [CrossRef]
  20. Han, L.; Chen, J.; Li, H.; Liu, G.; Leng, B.; Ahmed, A.; Zhang, Z. Multispectral water leakage detection based on a one-stage anchor-free modality fusion network for metro tunnels. Autom. Constr. 2022, 140, 104345. [Google Scholar] [CrossRef]
  21. Yang, W.; Li, C.; Baji, H. Design for service life of underground space based on water seepage criterion. Tunn. Undergr. Space Technol. 2019, 93, 103066. [Google Scholar] [CrossRef]
  22. Li, X.Z.; Zhang, Y.Z. Study on the chloride permeability in non-saturated concrete of subsea tunnel. Bull. Chin. Ceram. Soc. 2014, 33, 1929–1934. [Google Scholar]
  23. Edvardsen, C.K. Deterioration Modelling Model Verification Through In-Situ Tests Great Belt Link Tunnel (Demark); International Tunnelling and Underground Space Association: Prague, Czech Republic, 2004. [Google Scholar]
  24. Wang, K.; Jansen, D.C.; Shan, S.P. Permeability study of cracked concrete. Cem. Concr. Res. 1997, 27, 381–393. [Google Scholar] [CrossRef]
  25. Wang, L.; Bao, J.; Ueda, T. Prediction of mass transport in cracked-unsaturated concrete by mesoscale lattice model. Ocean. Eng. 2016, 127, 144–157. [Google Scholar] [CrossRef]
  26. Kong, X.Y. Advanced Seepage Mechanics; University of Science and Technology of China: Hefei, China, 2020; pp. 368–369. [Google Scholar]
  27. Zhang, Y.; Zhang, S.; Wei, G.; Wei, X. Water Transport in Unsaturated Cracked Concrete under Pressure. Adv. Civ. Eng. 2019, 2019, 4504892. [Google Scholar] [CrossRef]
  28. GB/T 50081-2019; Test Methods for Mechanical Properties of Concrete. Ministry of Housing and Urban-Rural Development of the People’s Republic of China: Beijing, China; China Building Industry Press: Beijing, China, 2019.
  29. GB/T 50107-2010; Standard for Assessment of Compressive Strength of Concrete. Ministry of Housing and Urban-Rural Development of the People’s Republic of China: Beijing, China; China Building Industry Press: Beijing, China, 2010.
  30. Pruess, K.; Oldenburg, C.; Moridis, G. TOUGH2 User’s Guide, Version 2.0; Lawrence Berkeley National Laboratory: Berkeley, CA, USA, 1999. [Google Scholar]
  31. Tran, A.P.; Dafflon, B.; Hubbard, S. iMatTOUGH: An open-source Matlab-based graphical user interface for pre- and post-processing of TOUGH2 and iTOUGH2 models. Comput. Geosci. 2016, 89, 132–143. [Google Scholar] [CrossRef]
  32. Moradllo, M.K.; Qiao, C.; Keys, M.; Becker, H.H. Quantifying Fluid Absorption in Air-Entrained Concrete Using Neutron Radiography. ACI Mater. J. 2019, 116, 213–226. [Google Scholar] [CrossRef]
  33. Tsuchiya, N.; Kanematsu, M.; Noguchi, T. Quick water movement around concrete cracks under unsaturated conditions. Constr. Build. Mater. 2014, 67, 95–99. [Google Scholar] [CrossRef]
  34. JTG H12-2015; Technical Specifications for Highway Tunnel Maintenance. Ministry of Transport of the People’s Republic of China: Beijing, China; China Communications Press: Beijing, China, 2015.
Figure 1. Concrete test specimens. (a) Specimen BI. (b) Specimen BII.
Buildings 14 00408 g001
Figure 2. Instrument of concrete seepage test.
Buildings 14 00408 g002
Figure 3. Schematic diagram of the test block splitting process.
Buildings 14 00408 g003
Figure 4. Schematic diagram of the test specimen recording point. (a) Specimen BI. (b) Specimen BII.
Buildings 14 00408 g004
Figure 5. Front view of concrete model. (a) Specimen BI model. (b) Specimen BII model.
Buildings 14 00408 g005
Figure 6. Wet area of test specimens. (a) Specimen BI. (b) Specimen BII.
Buildings 14 00408 g006
Figure 7. Cloud picture of water seepage condition of concrete model. (a) Specimen BI model. (b) Specimen BII model.
Buildings 14 00408 g007
Figure 8. Deviation between the simulated and measured data.
Buildings 14 00408 g008
Figure 9. Comparison of wet area of concrete test and model under the influence of water pressure over time. (a) Specimen BI. (b) Specimen BII (w = 0.5 mm).
Buildings 14 00408 g009
Figure 10. Comparison of wet area of concrete test and model with time under the influence of crack width (P = 0.3 MPa).
Buildings 14 00408 g010
Figure 11. Calculation diagram of wet area. (a) Specimen BI. (b) Specimen BII.
Buildings 14 00408 g011
Figure 12. The comparison between fitting results and test values. (a) Specimen BI. (b) Specimen BII.
Buildings 14 00408 g012
Figure 13. The fitting formula predicts the wet area map of point and line leakage over a long period. (a) Comparison of wet area. (b) Comparison of the growth rate of wet area.
Buildings 14 00408 g013
Figure 14. Tunnel patch processing site diagram.
Buildings 14 00408 g014
Figure 15. Diagram of the tunnel cross section.
Buildings 14 00408 g015
Figure 16. Tunnel cross-section model.
Buildings 14 00408 g016
Figure 17. Saturation of the tunnel model over time. (a) t = 30D. (b) t = 60D. (c) t = 90D.
Buildings 14 00408 g017
Figure 18. Saturation cloud image when the wet area reaches the limit value. (a) 0.1 mm. (b) 0.2 mm.
Buildings 14 00408 g018
Table 1. Concrete mix ratio.
MaterialGel MaterialSandGravelWaterWater Reducing Agent
SpecificationsP.O 52.5Fly ash Grade-IIMiddle sand5~10 mm (35%)Tap waterAcid type
10~25 mm (65%)
Dosage (kg/m3)4564464012531634.6
Table 2. Test condition.
TypeSpecimenP (MPa)w (mm)t (h)
Point leakageBI0.1, 0.2, 0.3, 0.4012, 24, 48, 72
Line leakageBII0.1, 0.2, 0.3, 0.40.1, 0.3, 0.5, 1.012, 24, 48, 72
Table 3. Parameters of the numerical model.
ParameterConcreteLeakage
Triaxial permeability coefficient (m−3)1.0 × 10−191.00 × 10⁻¹³ (point leakage)
1.48 × 10⁻¹⁴ (w = 0.1 mm)
1.33 × 10⁻¹³ (w = 0.3 mm)
3.70 × 10⁻¹³ (w = 0.5 mm)
1.48 × 10⁻¹² (w = 1.0 mm)
Disclaimer/Publisher’s Note: The statements, opinions and data contained in all publications are solely those of the individual author(s) and contributor(s) and not of MDPI and/or the editor(s). MDPI and/or the editor(s) disclaim responsibility for any injury to people or property resulting from any ideas, methods, instructions or products referred to in the content.

