Abstract
There are specific construction operations that require weather forecast data to make short-term decisions regarding construction; however, most resource-related decision making and all project management plans must be carried out to anticipate weather conditions beyond the capabilities of the currently available forecasting technologies. In this study, a series of single- and multi-risk analyses were performed with ~9 km grid resolution over Türkiye using combinations of weather and climate variables and their threshold values which have an impact on the execution and performance of construction activities. These analyses will improve the predictability of potential delays, enable the project to be scheduled on a future-proof basis by considering the calculated normal and periodic predictions on the grid scale, and serve as a dispute resolution tool for related claims. A comprehensive case study showcasing the methodology and illustrating its application shows that the project duration is expected to be extended because of the impact of climate on both historical and future periods. While the original project duration was 207 days, when climate effects were considered, the optimum mean and median values increased to 255 and 238 days, respectively, for the historical period. The optimum duration mean and median change to 239 days by the end of the century, according to the SSP5-8.5 scenario, if the construction schedules consider climate change. The change in duration was mainly due to rising temperatures, which increased winter workability and reduced summer workability. However, if the historical practices are carried over to future schedules, the mean and median increase to 258 days and 244 days, respectively, which may cause unavoidable direct, indirect, or overhead costs.
1. Introduction
The construction industry has distinct characteristics due to each project’s unique structure, including the project’s category, scope, location, and resources involved [1,2,3,4,5]. Many parties are needed to be involved in the project, and one of the major goals in project management is to complete the project tasks within a defined period [5,6]. However, considerable delays can occur throughout the project lifecycle, leading to adverse consequences such as time and cost overruns, disputes, arbitration, and legal action [7,8]. Disputes that result in cost and schedule overruns are an inevitable aspect of every construction project’s life cycle due to unexpected risks and inherent uncertainties [9,10,11]. Delays in projects are often recurring challenges and generic issues in construction claims with a wide range of causes [12,13]. The loss of clients and contractors due to delay disputes leads to an increase in delay disputes [14,15] which have received significant attention in recent years [15,16]. Efforts have been made to resolve these disputes and minimize conflicts; however, most construction projects fail to resolve time-related disputes [10].
Weather and climate conditions are frequently ranked as one of the most prevalent and detrimental reasons for schedule delays [7]. Weather and climate conditions may have a variety of effects on construction projects, such as decreasing productivity and occasionally interrupting the process, damaging exposed and unprotected components, disrupting communications, and/or obstructing access to construction site areas [17,18]. Furthermore, weather has been perceived to be one of the most critical factors impacting project cash flows [19]. Therefore, disputes between contractors and project owners arise because of the weather- and climate-related claims [20,21]. It is fairly uncommon for unresolved claims to evolve into legal challenges and extensive litigation, leading to production being suspended for a longer duration than the original adverse conditions themselves [7]. When investigating the impact of weather and climate, it is mostly important to differentiate whether the condition is foreseeable or unforeseeable, as well as extreme or non-extreme [22,23].
The adverse impacts of changing climatic conditions are often a contributing factor to delays in construction projects, legal disputes, and financial losses. However, research has been conducted to incorporate the influence of weather and climate change on construction delays, which is limited and generally concentrated on a small collection of weather data that is mostly historical. On the other hand, according to the latest assessment report of the Intergovernmental Panel on Climate Change (IPCC) [24], the CO2 concentration in the atmosphere has reached its maximum in the past two million years. According to Zhang et al. [25], the global construction sector primarily imports CO2 emissions from the secondary and transportation industries and exports small amounts to other sectors, both domestically and internationally. Murtagh et al. [26] revealed that the construction industry is one of the most environmentally damaging sectors, and significant improvements in sustainability and resilience to climate change can be made. However, it is not only the construction industry but also other sectors that contribute to climate change, global warming, and other environmental concerns, primarily through the emission of greenhouse gases (GHGs), such as carbon dioxide (CO2), methane (CH4), nitrous oxide (N2O), and fluorinated gases. For example, cement manufacturing contributes to global warming and climate change by emitting carbon dioxide and consuming large amounts of energy [27]. Moreover, the maritime sector, which accounts for over 80% of global trade, emits approximately 2.7% of global carbon dioxide, thereby contributing to climate change [28]. The shipping sector also contributes to atmospheric and gaseous pollutants, impacting both health and the climate, especially in populated coastal areas [29]. Furthermore, the transport and agricultural sectors contribute to global warming and climate change by emitting CO2, CH4, and N2O and consuming large amounts of energy [27,30,31].
Changes in the climate affect land, oceans, air, and ice volumes. Mean surface temperature and water vapor content increase while permafrost extends, and sea ice volumes decrease. The melting of ice leads to an increase in sea levels and sea surface temperatures. On land, precipitation patterns change, and the length of the seasons shifts. Therefore, it is important to obtain up-to-date weather and climate data and incorporate them into construction scheduling by considering not only historical but also projected changes and analyzing the degree of predictability to allocate these risks properly.
This research combines climate change and construction scheduling which enable parties to evaluate weather and climate risks and to establish a basis for disputes and claims, considering the improved skill of predicting delays. Considering the weather-related uncertainties and adjusting the installation accordingly is a common practice among construction contractors. Wang et al. [32] states that the intricate nature of construction projects makes them open to disputes that generate high costs; thus, clear, and well-balanced meanings of responsibilities for the parties are required. Still, several authors highlight the difficulties in outlining provisions for weather-related claims and the associated issues that go through litigation [21,33,34]. Even in litigation, contractors must prove that weather delays have impacted project completion dates, increasing litigation difficulties [19].
The debate over the causes and consequences of construction delays is currently a topic of great significance and relevance. However, the analysis of climate change impacts and future changes is not usually integrated into the comprehensive process of scheduling and analyses of delays. Most analysis frameworks focus on historical data and a limited number of stations, while there is a lack of studies that explore the climate change impacts on construction scheduling in a comprehensive manner.
In addition, the concepts of climate and weather conditions are not clear in most of the studies. Researchers argue that weather risk sharing between the owner and contractor is challenging due to specific terms, making it uncertain whether the contractor can escape associated damages despite that he also shares the risk [33]. While this is true, it is also important to consider the changing climate and not just the weather. According to the European Space Agency (ESA) [35], weather changes from minute to minute, hour to hour, and day to day and shows how the atmosphere behaves. Temperature, wind, rain, hail, snow, humidity, flooding, thunderstorms, heat waves, and other factors are just a few of the many elements that make up the weather. Contrarily, climate refers to the weather in a given area over an extended period of time. Seasonal and sub-seasonal weather forecasting have shown promising results, yet forecasts of acceptable quality still just span a maximum 10-day window [7,36]. Yet, patterns or cycles of variability, such as variations in temperature, humidity, precipitation, and ocean surface temperature, are generally discussed within the context of climate [37,38,39]. This study also differs in terms of the way it handles delays, which strongly emphasizes climate change and the quantification of its impacts.
This study substantially contributes to the field of knowledge by filling the gap between short-term weather forecasting and long-term climate planning requirements in construction project management. The generation of single- and multi-risk maps with a grid resolution of approximately 9 km for Türkiye is a significant advancement as it offers a more detailed and localized comprehension of the weather and climate effects on construction activities. This level of detail is particularly beneficial for construction operations that are sensitive to climatic conditions and necessitates precise planning to mitigate potential delays. The study’s application of weather and climate variables coupled with threshold values to predict the execution and performance of construction activities introduces a novel approach for integrating climatic factors into project scheduling. This improved predictability of potential delays provides practical tools that can be utilized by project managers to optimize construction timelines and resource allocation. Furthermore, the application of these risk maps as a dispute resolution tool introduces a new dimension to contract management, potentially reducing conflicts and fostering collaboration between the contracting parties. The case study presented in this research demonstrates the practical application of the methodology, reinforcing its relevance to current industry practices. The quantification of project duration extensions owing to changing climatic conditions offers critical insights for risk assessment and contingency planning. The increase in variability in duration also emphasizes the importance of considering start dates and seasonal variations in project planning. Overall, this study contributes to both the academic understanding of the impact of climate change on construction and the practical application of this knowledge in project management. This highlights the need for future-proof scheduling in the face of climate change and provides a methodology that can be adopted by the construction industry to enhance efficiency and reduce the risk of weather- and climate-related delays.
2. Materials and Methods
2.1. Study Area
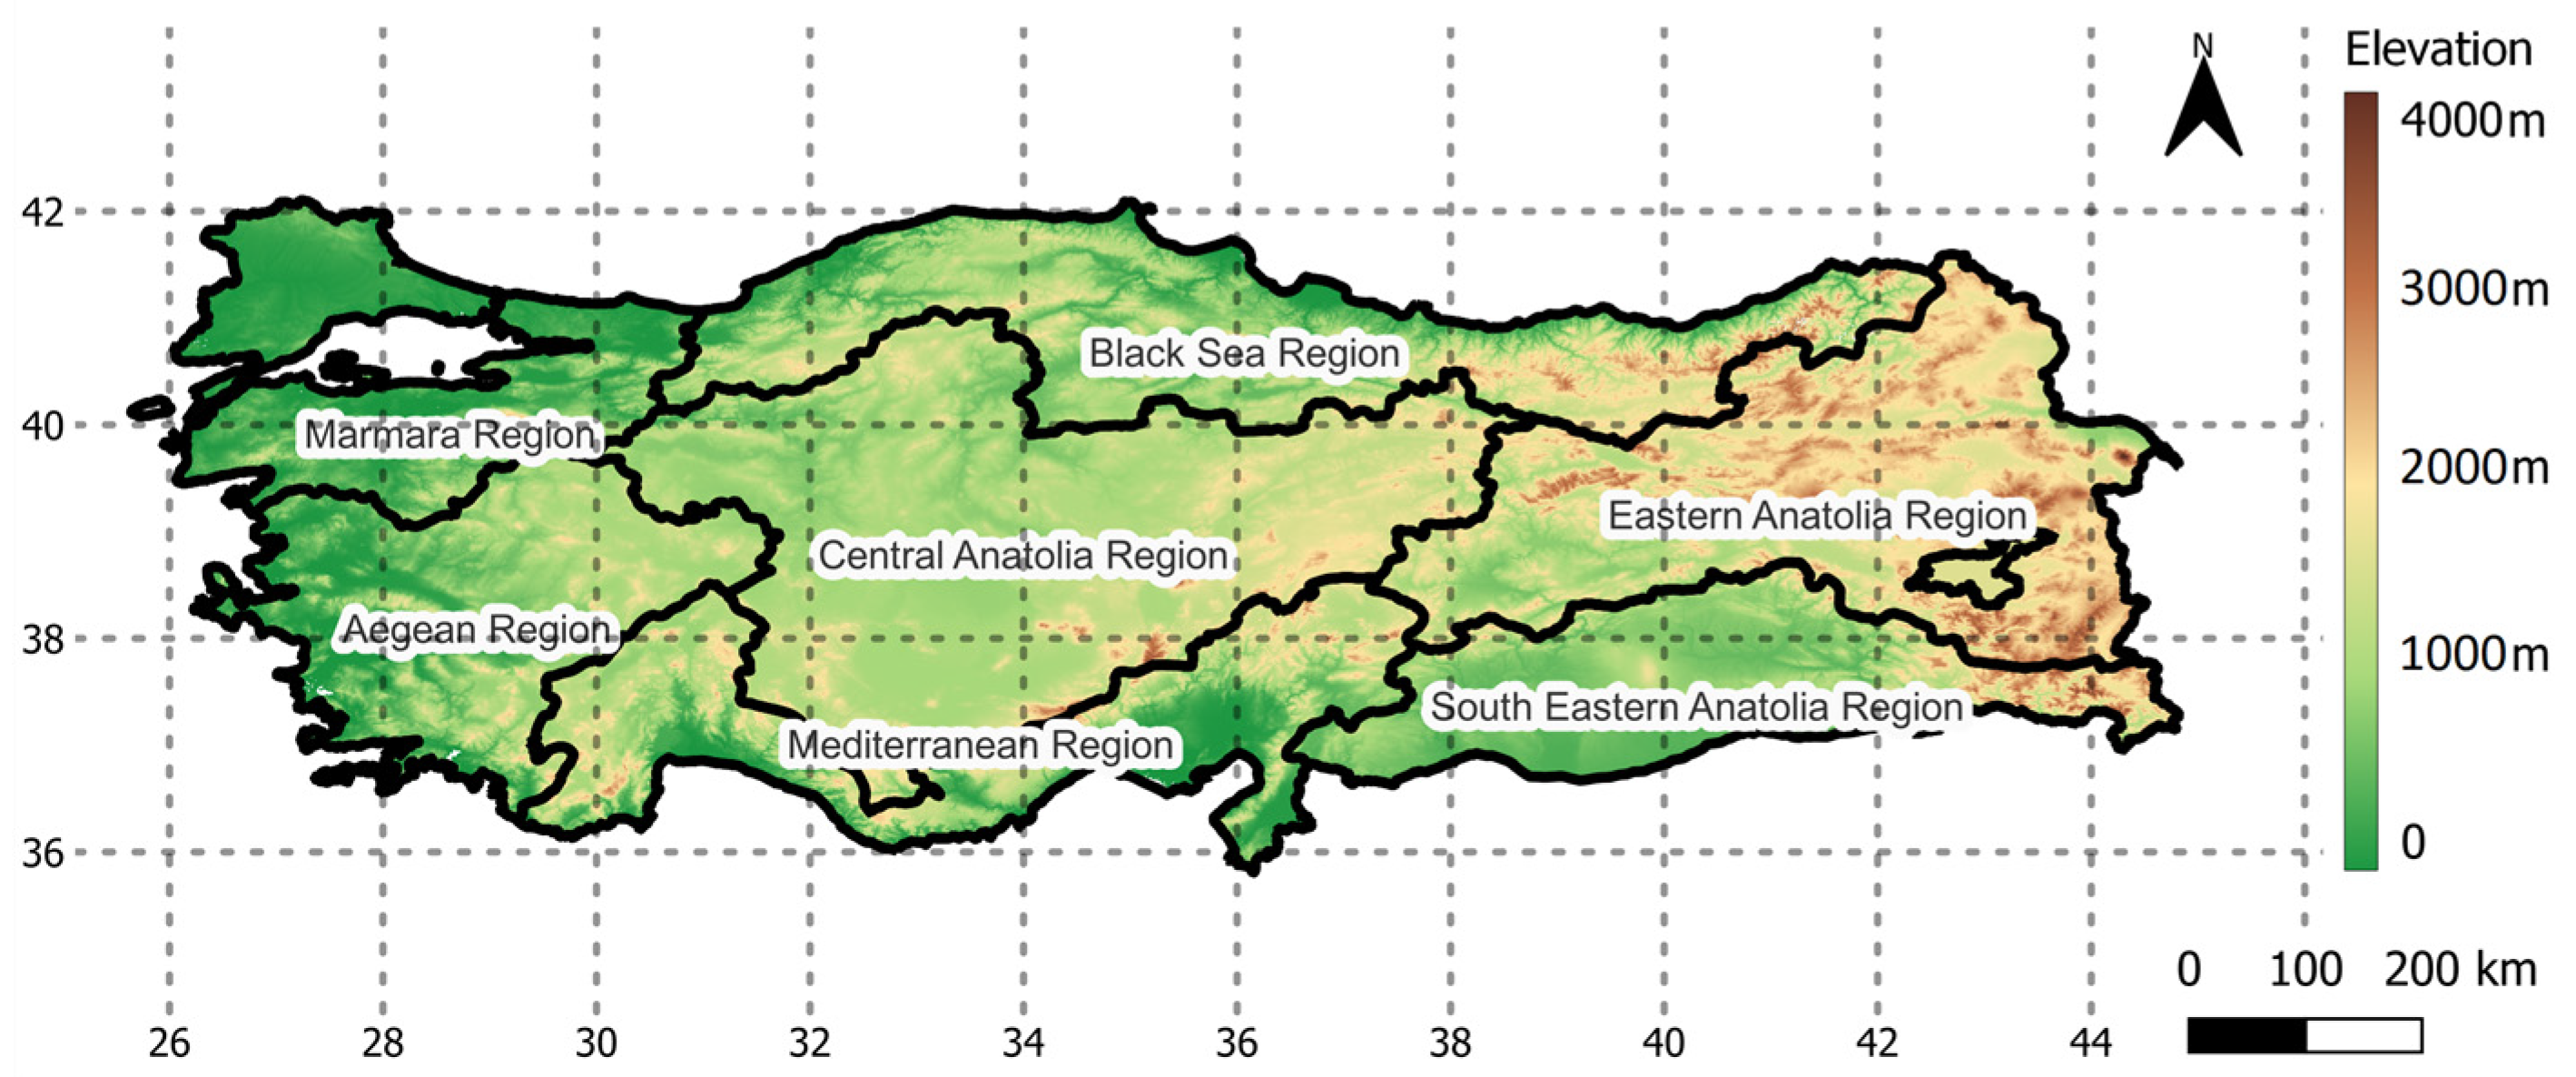
The location of Türkiye is mainly on the Anatolian Plateau in Western Asia, which has the coordinates 36° and 42° north latitude and 26° and 45° east longitude (Figure 1). The country has borders with the Black Sea in its north, with the Aegean Sea in its west, and the Mediterranean Sea in its south, and it has a total land area of 783.562 km2. A mild Mediterranean climate is mostly dominant in the Türkiye, yet because it has a complex topography, mountainous regions, and is impacted by the sea, other climate conditions such as temperate continental, oceanic, and dry mid-latitude steppes are also seen. While milder conditions are experienced in the coastal areas, mountains like Taurus and Northern Anatolia located parallel to the sea block the diffusion of marine effects towards the inland parts [40]. This leads to limited precipitation and continental climatic conditions for the inner parts of the country with hot, dry summers and cold winters [41].
Temperature and rainfall patterns also display diverse features in Türkiye. The Central Anatolia region gets around 400 mm of yearly precipitation, while the Black Sea region is subject to over 2200 mm, which is the highest amount in the country. Throughout the year, temperature levels are higher in the southern and southeastern parts, the Mediterranean and the Aegean coasts of Türkiye, in comparison to other regions. The highest and the lowest measured annual average temperature is 21.3 °C in the Mediterranean region (1962, Hatay-İskenderun) and −0.2 °C (1960) in the Eastern Anatolia region (Kars-Sarıkamış). Between the years 1991 and 2020, the country’s annual mean temperature and the rainfall values were 13.9 °C and 573.4 mm, respectively [42].

Figure 1.
Elevation map of Türkiye and its geographical regions [43].
Figure 1.
Elevation map of Türkiye and its geographical regions [43].
2.2. Methodology
This section will outline the proposed approach for analyzing historical and future climate data from a construction standpoint, with the goal of developing climate-aligned scheduling techniques. R software version 4.2.2 (R Foundation for Statistical Computing, Vienna, Austria) was used to perform all analyses conducted in this study.
2.2.1. Climate Variables Affecting Construction Activities, Climate Impact Factors, and Activity Performance Indices
The first step is to establish which combinations of climate variables and degrees of intensities are responsible for the performance of construction activities to be performed [7,33,44]. In this study, precipitation- and temperature-based variables were selected, and thresholds were assigned to these variables. These threshold values were obtained based on national and international standards, expert judgment, and a literature review. Consequently, a set of activities was also determined based on the inclusion of weather and climate impacts in their execution. In this study, Earthworks (E), Concrete (C), Formworks (F), Steelworks (S), Exterior Finishes (Envelope) (EV), Roof (R), Pavements (P), and Landscape (L) are the selected activities since they also represent remarkable phases of the construction projects. For the purpose of this research, the thresholds for the climate variables that are outlined in Table 1 shall be regarded as prohibiting the construction operations and activities that they are allocated to. The specific combinations of climate variables and their threshold values that can result in substantial implications for the execution of regular and frequent construction activities were utilized.

Table 1.
The climate variables and associated thresholds that lead to non-working days (derived based on [7]).
Once threshold selection and activity combination were completed, daily historical data (ERA5-Land) and bias-corrected CMIP6 data were analyzed. In the analyses, basically any daily calculated value that exceeded the threshold was accepted as non-workable, and the percentage of workable and non-workable days was calculated for each day of the year separately. No parameter can exceed the threshold value for a day to be considered workable; otherwise, activity execution is forbidden that day. For every single day of the selected period or analysis interval (historical, future, etc.), workable and non-workable days were calculated and translated into percentages considering the climate impact factors (Table 1).
The aforementioned variables, along with their respective threshold magnitudes, were selected due to their direct and straightforward correlation with the adverse physical effects they can have on major construction activities. Although the combination of chosen climate variables and activities could be enriched by other climate variables, such as wind, the aim of this study is to propose a framework to set a basis for the construction disputes that arise from weather- and climate-related delays. However, the combination of climate variables and construction activities in Table 1 might not be appropriate for every region, context, or project, so an adaptation will be needed.
The following climate impact factors were obtained for each individual day during the year for the historical and future periods of analysis considering all the grids over Türkiye.
Temperature-based impact factors:
- Minimum temperature ≤ 0 °C—Frost days
- Mean temperature ≤ 0 °C
- Max temperature ≤ 0 °C—Ice days
- Maximum temperature ≥ 40 °C
Precipitation-based impact factors:
- Precipitation ≥ 1 mm
- Precipitation ≥ 10 mm
- Precipitation ≥ 30 mm
Here, represents a specific day of a year such as January 2nd. The impact factors are calculated for every day of a year for the historical period and projection periods. An impact factor value between 0.00 and 1.00 indicates the likelihood of the occurrence of the same climate phenomenon on average. Consequently, an impact factor closer to 1 indicates that climate-sensitive construction activity might not suffer a delay. However, when more than one impact factor exceeds the threshold, which is a common case, the impact of both coefficients must be combined and, in this study, these combinations are presented and called activity performance indices (performance metrics for activities). Thus, the selected eight major construction activities for this study and their performance indices which were derived from related climate impact factors are shown below in Table 2.
Table 2.
Activity performance indices.
2.2.2. CMIP6 Global Climate Models
In order to monitor the changes in the climate, future projections based on the most recent Coupled Model Comparison Project (CMIP) version 6 global climate models will be used [45,46,47]. CMIP6 is understood to have performed better compared to its predecessor, CMIP5 [48]. The reason for these advancements includes determining the amount of natural or human-induced irradiation, the inclusion of aerosols, and land use effects [45,49,50,51]. Although the CMIP6 data are relatively new, there appears to be a growing interest in implementing the most recent projections [43,48,52].
While these studies produced different results through the regions of interest between CMIP6 and CMIP5, Bagçaci et al. [52] stated that CMIP6 products in Türkiye performed better than CMIP5 for precipitation and temperature, and thus the results of climate change impact studies should be updated with the most recent data in Türkiye. Based on the results of Bagcaci et al. [52], the top 10 ranked models over Türkiye were employed for precipitation and temperature separately in this study (Table 3). It should be noted that some of these models do not provide data for one or more of the interested variables for historical and future periods.
Table 3.
Top 10 CMIP6 climate models over Türkiye and their initial spatial resolutions.
In light of future climate projections, this study examines the Shared Socioeconomic Pathway (SSP) 5-8.5 and 2-4.5 future scenarios. Through the analysis of SSP5-8.5 and SSP2-4.5, a comprehensive picture of the dynamics of the future climate is revealed. With a radiative forcing of 8.5 watts per square meter (W/m2) by the end of the twenty-first century, SSP 5-8.5 depicts a world of fast economic expansion, high energy consumption, and persistent reliance on fossil fuels. This hypothetical situation emphasizes how urgent it is to address our reliance on fossil fuels and the dangers of doing nothing. SSP 2-4.5, on the other hand, is linked to a more moderate socioeconomic trajectory with sustainable practices and corresponds to a radiative forcing of 4.5 W/m2. In order to mitigate the worst effects of climate change, SSP2-4.5 emphasizes the significance of sustainable development and measures to reduce emissions. This comparative research offers insights that can guide climate policy, adaptation plans, and the quest for a more resilient and sustainable future. It also advances a comprehensive understanding of the intricate interactions between socioeconomic determinants and climatic consequences.
2.2.3. Downscaling and Bias Correction
Assessing the impact of climate change at a local level is a challenging process, primarily due to the difficulty in obtaining reliable information from global coarse-resolution models and then transforming it to the local scale. For this reason, downscaling and bias correction techniques have arisen in recent years to obtain data for regional and local impact studies. There are many downscaling methods that can be encountered in the literature; however, in this study, quantile delta mapping (QDM), which has proven to exhibit better performance with extremes [43,53], is used.
The quantile delta mapping method was developed to address and correct the systematic biases while preserving the relative changes in the modeled quantiles of the variable under investigation [53]. The basic equation of the quantile delta mapping method consists of the bias-corrected value obtained using the observation data and the relative change term obtained from the model data. The difference between this method and the detrended quantile mapping method is that all modeled quantiles are taken into account, not just the modeled mean.
The transfer function of regular quantile mapping is as follows:
where and represent the cumulative distribution functions of the observed and modelled data, respectively, for the historical period. is the model value at time t from the projection period.
The first step of QDM is the calculation of , the nonexceedance probability associated with the value at time t, with the following equation,
Then, the relative change in the model data over the historical and projection periods, , can be calculated as follows:
The bias correction of the modeled quantile can be calculated as
As the final step, relative change is introduced to the bias-corrected model to obtain the bias-corrected future projection at time t,
The downscaling and bias correction is applied to all models separately, then a multi-model mean ensemble is created from the outputs to be used as the final product.
2.2.4. Reference Data—ERA5-Land
The ERA5-Land dataset which is a reanalysis of global climate and historical weather, from the European Centre for Medium-Range Weather Forecasts (ECMWF) [54], will be used as reference data in this study. The ERA5-Land dataset is available from 1950 to present and provides access to hourly, high-resolution information on surface variables. The data have a grid range of approximately 9 km, which is obtained as a result of reworking the terrain component of the ERA5 climate reanalysis, which was previously available at a coarser spatial resolution [55]. Reanalyzing combines model data with observations collected from all over the world to synthesize a complete and consistent dataset globally. ERA5-Land is a customized variant of ERA5 data on land. The biggest difference from the original is that the horizontal resolution is presented as 0.10° × 0.10° instead of 0.25° × 0.25°. This difference makes it possible to operate on more precise scales [43]. This dataset is utilized in this study as a reference to downscale the CMIP6 global climate model projections and to determine the performance of bias-corrected and downscaled data.
3. Results
The calculations that follow serve as illustrative examples of the results produced by the suggested approach and are adaptable to each individual activity. It should be noted that the proposed approach has too many outputs in terms of combinations of location, selected period, climate scenario, and time of the year. In order to present the results as simplistically and compactly as possible, the results are presented under three sections. First, the activity performances from the historical period and the SSP 5-8.5 scenario covering the period of 2071–2100 are shown for January 30th and July 30th over the entirety of Türkiye. Subsequently, annual cycles of the components forming the activity performance indices are shown for the selected coordinates, considering the historical and far-future periods.
3.1. Spatial Variation in Activity Performances over Türkiye
For the Concrete activity, historical and future activity performance are presented with their constituent climate components in Figure 2a–h. The climate parameters and their threshold values affecting the performance of the Concrete activity were selected as the daily minimum temperature below 0 °C, maximum temperature exceeding 40 °C, and the daily precipitation over 10 mm. Figure 2a–d present the historical analyses for the Concrete works performance index (C) across Türkiye, while Figure 2e–h represent the same analyses by the end of the century under the SSP5-8.5 scenario. All figures show the results for January 30th. The workability of the activity was calculated for the selected day in Türkiye by evaluating and combining the probabilities of TMin 0 °C, TMax 40 °C, and PR 10 mm on the same day.
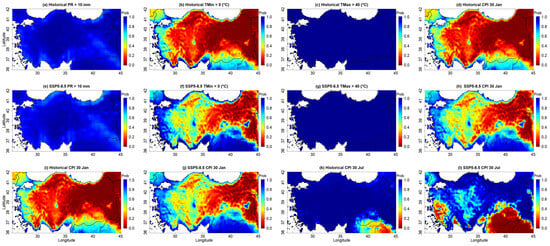
Figure 2.
Concrete activity performance index and its components for historical period January 30th (a–d), SSP5-8.5 2071–2100 period July 30th (e–h), Concrete activity performance index for historical and SSP5-8.5 2071–2100 periods January 30th (i–j) and July 30th (k–l).
When Figure 2a–h are analyzed, it can be noticed that the impact factor that is dominant in the performance of the Concrete activity is mostly the minimum temperature. The other two components have a relatively low impact (delay is less likely in Concrete activity because of these components) for January 30th. In addition, when the activity performances are examined for historical and future periods, it is seen that there is an increase in activity performance in the future period for the SSP5-8.5 scenario. The main reason behind this is the increase in minimum temperatures throughout the year because of global warming. Consequently, an increase in the performance of the Concrete works is expected for January 30th.
Besides the spatial figures that demonstrate how the activity performance indices are derived (Figure 2a–h), a comparison between two different times of the year, namely January 30th and July 30th, is given in Figure 2i–l for Concrete activity to obtain an insight about how activity performance can vary depending on the time of the year.
When Figure 2i–l are examined, it can be concluded to what extent the choice of time for both historical and future periods can affect the performance of the activity and, accordingly, the duration as well. It can be understood that the performances for Concrete activity in almost all of Türkiye, except coastal areas, were below 40% for January 30th. This rate was over 90% in the analyses on July 30th in the historical period. Southeast, Western, and Central Anatolia show a reduction in the number of workable days (which can be expected to cause delays) in the summer days of the projection period. These results reveal how critical the selection of start and finish dates is for the activity and, consequently, project durations. Considering the proposed approach and its detailed outputs, remarkable contributions can be accomplished for the planning of activities, while it can also be a good option for the problem mentioned above (Figure 2).
The analyses so far have been given in detail in order to show the variations that can be seen at different times of the year during historical or future periods and to ensure that the path followed when creating activity indices is more understandable. The effect of individual climate parameters such as minimum temperature, maximum temperature, and precipitation intensity may have different weights depending on the selected moment of the year or time period when creating activity performance indices from the proposed approach. Figure 3 and Figure 4 show all activity performances for the same days and periods.
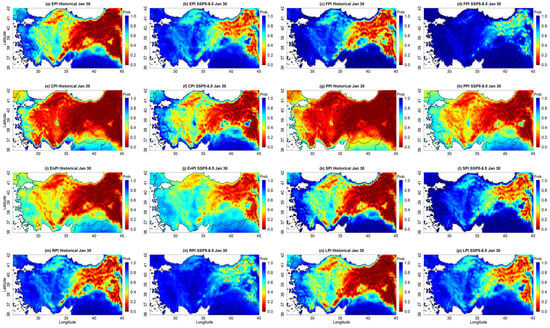
Figure 3.
Historical (1961–2014) and future (SSP5-8.5 2071–2100) activity performances (workability probability)–January 30th.
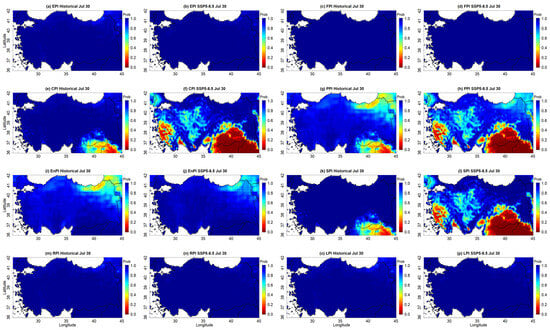
Figure 4.
Historical (1961–2014) and future (SSP5-8.5 2071–2100) activity performances (workability probability)—July 30th.
Earthworks (E) activity was analyzed throughout Türkiye for the selected days of the year for the historical period and the SSP 5-8.5 scenario 2071–2100 period. The results can be seen in Figure 3a,b (January 30th) and Figure 4a,b (July 30th). Based on the performance of the activity, it can be concluded that there will be significant improvement in the future in all regions except for the coastal areas during the winter, while summer performance is relatively unchanged. The increase in performance can be observed, particularly in the inner parts and the Eastern Anatolia region.
When the historical and future performance of Formwork (F) activity for January 30th are compared, the increasing workability values can be seen, especially for the coastal, eastern, and southeastern regions (Figure 3c,d). It is also possible to say that the dominant impact factor of the activity for the selected day is Tmax0 °C since an increasing minimum temperature is prominent in the future for the entirety of Türkiye [43]. Similar to Earthworks, summer workability is stationary (Figure 4c,d).
Considering the Pavement activity, Figure 3g,h and Figure 4g,h, the results exhibit increasing activity performance in the future, except in the Eastern and Southeastern Anatolia regions of Türkiye for January 30th. In Western and Central Anatolia, the pavement activity performance almost doubles compared to the historical performance values. However, the performance index for July 30th decreases in most of the regions.
The Envelope activity performance results exhibit increasing activity performance in the future over all regions of Türkiye for January 30th while the northeastern part of the country still exhibits lower activity performance (Figure 3i,j). In Western and Central Anatolia, the Pavement activity performance almost doubles compared to the historical performance values. Figure 4i,j show that performance slightly increases on July 30th in the future period, especially in the eastern Black Sea region.
Steel Works (S) activity (Figure 3k,l) performance is expected to increase in almost the entirety of Türkiye for January 30th. Especially the inner regions, middle Black Sea, and eastern regions benefit from this increase. However, there are still regions such as eastern and northeastern Türkiye that exhibit lower activity performance index, even with the impact of changing climatic conditions. When the possible changes on July 30th are considered (Figure 4k,l), a decrease in performance in all regions except the Black Sea and Eastern Anatolia regions is expected.
Considering the Roof activity, a significant increase in the performance index over the Eastern Anatolia region is expected for January 30th (Figure 3m,n), mainly due to the increasing temperatures. On the other hand, there is no significant change in summer workability (Figure 4m,n).
The last activity performance index, Landscape (L), increases in all regions for January 30th except for the coastal regions, where workability is already at maximum during historical period (Figure 3o,p). Similar to Roof activity, summer performance is relatively unchanged (Figure 4o,p).
The purpose of these performance maps is to illustrate how a daily activity performance can vary throughout the year, both in the past and future. Based on these maps, it is evident that performance analyses conducted over Türkiye indicate that the timing of activities has a significant influence on performance. These maps are also significant as they represent the various outcomes that can be achieved through the subject matter discussed in the article.
3.2. Temporal Variation for Performance Activity at Selected Locations
While the first section investigates the spatial distribution of performance indices for specific dates, this section focuses on the variations in an annual cycle and deviations for the specified timeframe and coordinates. Figure 5 displays the yearly variations in activity performances and their components for the geographical coordinates of Ankara. These changes are observed throughout the reference period and the future period spanning 2071–2100, under the SSP5-8.5 scenario. Given the evolving nature of construction projects, one potential option for implementing a risk-based approach is to incorporate scenario-based calculations. In addition, by calculating the annual cycle of performance for various periods and scenarios, more accurate predictions pertaining to construction project delays caused by weather and climate conditions can be facilitated.
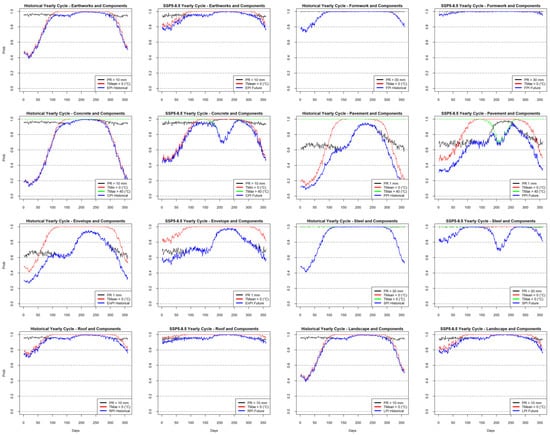
Figure 5.
Activity performance indices and components in one coordinate (Ankara, the capital city of Türkiye) over historical (1961–2014) and future (SSP5-8.5 2071–2100) periods.
The utilization of yearly distribution graphs is useful for tracking shifts in performance during different periods, which can be used to decide optimal start dates for activities. Considering the Earthwork activity performance index, it is possible to calculate the changes in a yearly cycle and anomalies for the selected period and coordinates. According to the analyses for the chosen coordinate, it is possible to expect an increase in activity performance in winter months due to the increase in mean temperatures (Figure 5).
The changes in the components that form the Formwork activity index for Ankara are also shown in Figure 5. The comparison of the same activity for the observation period and the 2071–2100 period under the SSP5-8.5 scenario shows that the Formwork activity performance will increase in the winter months for the future period (Figure 5), while the differences in the spring and summer months are not significant. Especially the increases in the first months of the year will probably have a positive impact on project durations at the selected coordinate for formwork activities.
In Figure 5, the annual variation in the Concrete activity index and the components that form it for the Ankara coordinates during the historical and future periods are given. Due to the almost negligible probability of the temperature being above 40 degrees and daily precipitation greater than 10 mm in the selected coordinates, it is seen that the minimum temperature parameter is the dominant component for the activity performance. When timeseries are examined, it can be said that Concrete works’ performance at the selected location will experience significant increases during the winter months. Especially in the first months of the year, differences up to 30% indicate that temporal negative effects will decrease in reinforced concrete construction and concrete casting works. However, as a reverse effect of this positive impact in winter, a decrease in workability can be seen in a certain period during the summer; nevertheless, it has a lower impact compared to the aforementioned increase in the winter months.
As in the Concrete activity, it is seen that the minimum temperature and precipitation parameters are more impactful on the performance of Pavement activity due to the low probability of the temperature exceeding 40 degrees for the selected coordinate (Figure 5). The parameter that is particularly effective in spring and summer is the precipitation component. When the historical period and the 2071–2100 period under the SSP5-8.5 scenario for the same activity are compared, it can be said that Pavement performance at the selected point will experience significant increases in the spring and winter months because of increasing temperatures. Increasing temperatures also cause a slight decrease in performance in summer months.
The 360-day variation in the impact factors that form the Envelope activity are shown in Figure 5 for the coordinates of Ankara during the interested periods. It is understood that the performance is influenced by rainfall in the spring and summer months and by temperature in the cold months, as expected. When timeseries are examined, it can be said that increases in performance can be expected in the spring and winter months at the selected point, and these increases will get closer to the observation period values as the summer months are approached, and significant differences will not occur during the period that starts at the end of spring and lasts until mid-autumn.
In Figure 5, the yearly distribution of the components that constitute the Steel Works activity during the observation period for the coordinates of Ankara is shown. It is understood that the daily mean temperature has a significant impact on activity performance. It can be said that significant improvements in Steel Works activity performance can be expected, especially in the winter months at the selected location, while a slight decrease will not be a surprise during the summer months.
When the components of Roof activity are investigated, it is seen that temperature has a significant effect on the performance of Roof activity (Figure 5). Significant increases in performance can be expected during the winter months for this activity at the selected location. In the case of Landscape activity, it is evident that temperature has a significant impact on activity performance. Also, significant performance improvements are expected during the winter months at the selected coordinates.
While Figure 5 shows the daily variation in all activities for a single location, Figure 6 shows the Concrete activity and its constituent parameters in four different cities in order to present the spatial differences in yearly cycles. It is observed that location change also has a significant effect on the performance of the activity. This figure proves that even the same activities can perform very differently based on the selected location of the project, even during the same period. The future behavior of these activities also must be evaluated with a special emphasis based on these variations, such as in Antalya, which presents a remarkable performance decrease in the future period, particularly in the summer months.
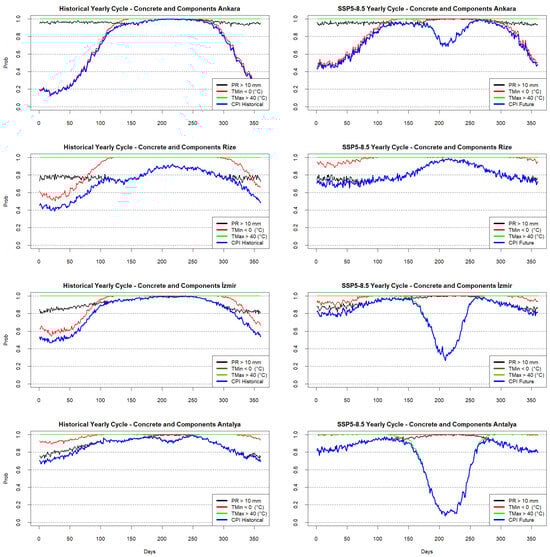
Figure 6.
Concrete activity performance index and components in four different locations over historical (1961–2014) and future (SSP5-8.5 2071–2100) periods.
3.3. Case Study
In this section, an application of the proposed climate-aligned scheduling is presented. The schedule of a hypothetical four-story reinforced concrete building employing a simplified design was used, which was originally prepared on the Oracle Primavera. It consists of 46 activities and is arranged and coded using predecessor activities with finish-to-start and start-to-start relationship types.
After coding the project plan, the resulting project duration is checked with the Oracle Primavera results in order to validate the coded model without considering climate effects. The reason behind coding the project plan rather than applying the activity performances to the duration of activities was the capability of finding the possible shortest duration, optimizing the start date, and determining the cycle of the project duration within the year for the selected scenario and/or period. A comprehensive analysis has been conducted over Türkiye to ascertain the extent of and variations in weather-related impacts across different geographical areas, and the results of nine major cities were presented for visual inspection.
Figure 7 shows the project duration change according to the selected start date for nine locations with different climatic conditions for the historical and far-future periods with two scenarios. This provides a particular evaluation of the project start date to maintain the project schedule and avoid unexpected delays. Furthermore, the figure also implies that a project can have very different schedules because of the selected location. In Figure 7, although the same project is investigated, nine different locations exhibit remarkably different historical and future schedules when activity performances are applied to the default project schedule (the schedule where activity durations were determined without considering the potential effect of climate).
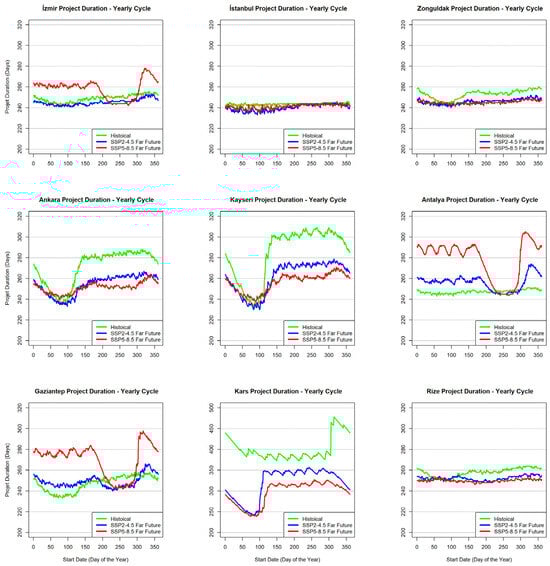
Figure 7.
Start date of the project versus project duration for nine representative cities for historical (1961–2100) period and future (2071–2100) period under SSP2-4.5 and SSP5-8.5 scenarios.
The process of transforming this fixed schedule into a climate-aligned schedule is relatively straightforward. Each scheduled activity is assigned an identified group of activity performance indices (E, F, C, P, E, V, S, R, or L). If an activity is not climate-sensitive, then it is left empty, which means that if the activity is not affected by climate, then its duration is directly included in the schedule without any modification. Then, the activity performance indices were calculated for all mentioned activities based on all scenarios and periods for the entirety of Türkiye (~10,000 grids) and for every single day of the selected period. This allows for the assessment of the activity duration on a daily basis, and each activity is determined by applying the activity performance indices to that duration by starting the project from day one to the last day of the year for the selected time period (historical, near, mid, or far future). This scheduling procedure was repeated until the project was finished. Initially, the original (climate-neglected) project duration was 207 days, which is approximately 7 months. In the analysis, working days are Monday to Sunday, and no extra holidays have been considered. It is worth saying that the coded project plan has the same duration as the Oracle Primavera results for the original schedules when climatic delays are not considered.
In order to accurately interpret the increase (or decrease) mentioned above, the spatial distribution and frequency of these increases (or decreases) must be considered. Spatial plots of the selected periods also show the minimum and maximum durations of the aforementioned project over the entirety of Türkiye for the historical period and future period (Figure 8).
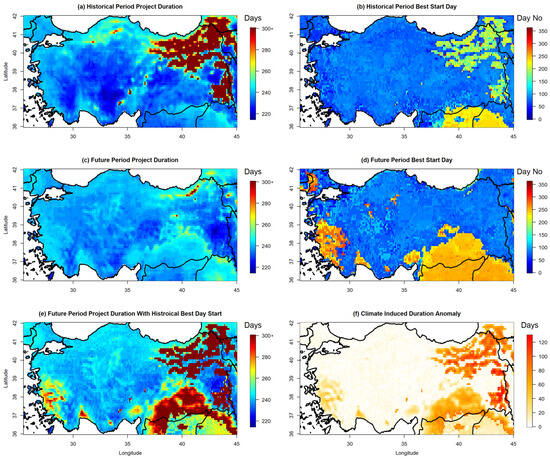
Figure 8.
Historical (1961–2014) and future period (SSP5-8.5 2071–2100) shortest project duration (a,c), optimal project start date (date of the year to achieve the shortest duration—b,d) and future project duration if climate change effects are not considered (e,f).
While Figure 8a,c show the minimum possible project durations for the historical 1961–2014 period and the SSP5-8.5 2071–2100 periods, respectively, Figure 8b,d represent the optimal start dates to achieve these durations. Figure 8b shows that, apart from the mountainous regions in the Eastern Anatolia region and southeastern borders, most of the country has similar optimal start days in the historical period. However, when the optimal starts by the end of the century for the SSP5-8.5 scenario are investigated, it is seen that there are significant shifts in Thrace, Aegean region, some parts of the Mediterranean region, and the Southeastern Anatolia region (Figure 8d). When the climate change impact is considered, significant decreases in the project duration in Eastern Anatolia are possible (Figure 8c). Figure 8e represents the project durations when climate change impacts are not considered, and historical start dates are utilized in the future. The difference between these durations and optimal durations is presented in Figure 8f which shows avoidable delays in various regions.
Based on these results, the project duration is expected to be extended due to the impact of the climate both in the historical and future periods. While the original project duration was 207 days, when the climate effects are considered, mean and median values increase to 255 days and 238 days, respectively (Figure 8a), for the historical periods. This indicates an extension in mean by 23%. This value is mostly caused by high delays in mountainous regions in Eastern Anatolia. While the duration increased only %5 in the lowest impacted grid, in some grids, project duration increased up to 100%. Considering the 2071–2100 period under the SSP5-8.5 scenario’s optimum durations (Figure 8c), both the mean and median were found to be 239 days, an extension of 16% over Türkiye. However, grid scale delays range between 4% and 81%. If the climate change effects are not considered, the mean and median project durations increase to 258 days and 244 days, respectively, an additional 10% delay in the project on average. Figure 8f shows that this avoidable increase might go up to 60% in some regions which might cause increasing indirect or overhead costs.
In Figure 9, the frequency of the project duration is presented by histograms. The duration extension that was seen in the eastern part of Türkiye in the historical period decreased in the future period, which also decreased the average project duration in the future. The frequency distribution of the project duration shows the response of the project duration to the selected period. It is also possible to figure out the largest responses, such as the locations with a project duration of over 400 days, in Figure 9. Furthermore, a change in the duration range can be obtained for the same project during different time periods. The data obtained can serve in various ways, such as determining the project location, the start date of a project at a specific location, or taking precautions by changing the schedule, activity type, method, and material of construction to some extent.
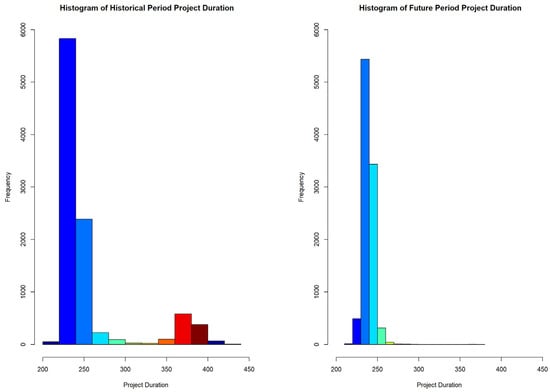
Figure 9.
Histogram of historical and future period project duration of the case study over Türkiye.
4. Discussion and Conclusions
4.1. Discussion
Contracts are one of the primary factors that need to be considered for a construction project’s success. Considering the project delivery, it is crucial to identify the risks accurately and allocate them fairly and equitably to ensure the project goals. Construction projects have considerably long project life cycles, which make it possible to face major risks that create pressure not only during the construction phase but also on the functionality and service life of the built asset. It is projected that climate change will be one of these major risks and exacerbate the adverse weather or extreme weather impacts by altering the magnitude and/or frequency of the events. Gumus et al. [43] have reported that there is an increasing trend in the frequency and intensity of extreme rainfall events. Similarly, there is an expected increase in the frequency of temperature extremes, such as the coldest, warmest, and mean daily maximum temperature, across all regions of Türkiye. These findings suggest that temperatures in Türkiye may increase by up to 7.5 degrees Celsius by the end of the century.
These results must be translated into activity performance to obtain accurate construction schedules since it is a common occurrence for construction projects to involve a large number of tasks that are vulnerable to changes in weather conditions. These tasks are often subject to a variety of weather variables, such as temperature, precipitation, and wind. Climate and weather sensitivities create risks such as suspension, extension of time, claims, and termination of the contract. According to Tariq and Gardezi [56], project planning and scheduling are the second of the top five delay causes for civil engineering construction projects from a global perspective, whereas delays in construction projects are the third among the top five conflict causes. Therefore, the likelihood of these unexpected consequences must be reduced to keep the contract running. If climate-sensitive activities are adopted and integrated consistently, these approaches may signify a shift in contract risk allocation and facilitate the understanding and management of projects in the context of climate change and the risks it brings. Quantitative research considering the intersection of climate change and impacts on construction productivity is scarce; therefore, the primary objective of this research was to develop an applicable approach that enables the parties and the practitioners of the construction contract to strategize from the short to the long term, taking into account the changes and fluctuations in climate and weather patterns. On the other hand, the consideration of data-driven planning is an essential tool to perform construction projects in an uncertain environment that accommodates many causes of delays, conflicts, and cost overruns [57,58]. The climate-aligned approach described in this study is not restricted to a limited number of climate variables or small geographical locations but enables for a wide range of activities to be considered depending on the data available. ERA5-Land hourly reanalysis data are used as reference set in this study, so the problems of representativeness, data length, inhomogeneous distribution of stations, missing data, and data quality were avoided, which are some of the main data problems for the climate and weather studies.
The primary accomplishment of this investigation is the formulation of a framework that quantifies the typical probability of a day being suitable for a specific type of activity with a high-resolution base. Seasonal or annual cycles substantially affect construction activities such as concrete pouring and curing, excavation, envelope, or general productivity [59,60,61]. The approach allows for the analysis in a single and joint probability manner, considering the weather and climate data for different periods, which enables us to anticipate the additional duration required for a particular project activity to be completed as a result of weather and climate change at a selected period for a selected future scenario and location. This allows for consideration of the characteristics of each activity, as well as the location and time of the year in which it is carried out. Moreover, the distribution of the project duration is also available by running the project activities to find the shortest project duration for a selected location and period, which is presented in the case study. A further step for this study can be obtaining the best fit distribution that resembles the project duration deviations. This shall be provided both temporally and spatially to determine how likely a particular duration will be. In addition, the proposed approach in this study will also be used to clarify and accurately define some of the key terms in the standard for contracts. For instance, several clauses deal with natural risks in FIDIC Conditions of Contracts and include key definitions such as “exceptionally adverse”, “normal”, and “unforeseeable” [62]. Through the implementation of the proposed approach, critical questions in a contract, such as the ownership of this risk, the determination of the risk, and the period of responsibility, can be more accurately answered, and a better risk allocation can be accomplished among the parties to the contract concerning climate- and weather-induced disputes.
There is a limited availability of studies that have examined the seasonal or annual variability of various combinations of weather and climate factors, according to [7,33,44]. The number of studies appears to be even lower when it comes to incorporating climate change. In this study, the inherent variability in climate and weather can be captured and visualized so that the impact of them on construction activities can be quantified and the time-varying aspects of weather and climate conditions can be considered. Furthermore, the impact of climate or weather also significantly impacts construction project materials or labor resources. Ismail et al. [63] and Zhang et al. [64] concluded that it can be empirically proven that environmental factors such as temperature and relative humidity have a significant impact on workers’ performance, whereas Amadi [65] claimed that the meteorological profile of wet-humid climates induces a significantly high percentage of the variance in the real-time demand for bagged cement on construction sites, which reveals that the issue should also be evaluated from a different perspective in terms of activity-specific material demand and supply. This should be one of the results of the duration and cost variability of construction activities during different periods. On the contrary, Ballesteros-Perez et al. [66] reported that contrary to common wisdom, construction activities do not end late on average, but the large variability in the activity duration is the major factor causing significant project delays and cost overruns. Considering this result, further research must be carried out for robust climate-aligned scheduling approaches.
The case study demonstrates a direct method for the computation of individual activity durations and the overall duration of a project. The ability to determine the duration of each activity based on the start date and location presents opportunities for additional applications in the fields of delay analysis and construction management. An examination could be conducted to determine the most effective strategies for reducing project durations and costs in situations where multiple projects need to be executed and their sequencing can be adjusted so that their results can be used for optimal risk and portfolio allocation, as well as resource management and allocation. Furthermore, the use of such an approach can represent an alternative solution for weather- and climate-based disputes and weather-related claims and could help to reduce the costs arising from conflicts. Furthermore, a study could be undertaken to determine the most suitable project location, if such a choice is viable, by combining the activity duration analyses. This analysis comprises both critical activities and non-critical activities that are not influenced by climate and weather conditions. The median, mean, or other agreed-upon values of the possible durations can be used to assess and allocate the project risk, both regionally and location-specific. A climate change or weather impact baseline can be assigned to the contract at the beginning of the project. Furthermore, changing project durations can be considered an example of a transition from deterministic to stochastic scheduling in the context of weather and climate. Moreover, a distribution of the varying project durations can serve as an alternative that informs regarding the shortest, longest, or most probable project execution durations and the probability of a project’s execution time. The results of Balushi et al.’s studies [67] indicate that implementing the influence of hot and humid weather can lead to an extension of 3–38% of the project duration compared to the planned duration. These results, however, depend on the temperature as a variable and neglect the compound effect of variables over construction activities.
Climate change studies employ diverse scenarios, and corresponding projections are being made using these scenarios. The results may vary depending on the scenarios selected for the future period and used to understand the impact of climate change on various sectors, including construction. Recent advancements in the high-resolution usage of climate model results enable the production of regional and local climate projections with sufficient confidence intervals. These projections indicate that changes in precipitation, temperature, and other climate parameters are inevitable. As a result, both the extreme values and the long-term averages for climate conditions are expected to change. The anticipated increase in the severity and frequency of extreme climate conditions could lead to schedule delays or disruptions, as well as other forms of disputes, as supported by Schuldt et al. [68]. Besides contractual aspects, Zidane and Andersen [69] touched upon a very important issue by expressing the social aspects of delays, which are rarely encountered. They argue that the identification of delay factors and causes enables society to receive the service of essential infrastructure projects on schedule or ahead of schedule. On the other hand, Hurlimann et al. [70] noticed that the risks induced by climate change were somewhat downplayed.
It is necessary that contractual terms such as “extreme”, “unpredictable”, and “maximum” be defined with greater clarity and be up to date in the construction contract. Furthermore, a method of working must be established that specifies the expected changes over time, how those changes will impact the project, how the impacts will be decided, and who will be held responsible. Studies such as Gumus et al. [43] and Bodiaf et al. [71] provide evidence regarding the altering climate conditions. These alterations must be handled carefully when designing and planning construction projects. Although there are studies that consider weather- and climate-related delays, these studies rarely account for future climate in modeling and identifying delays [68] and support the findings of Zemra Rachid et al. [72] as they emphasize ineffective planning and scheduling as one of the most important sources of delay. If the parties know the primary climate parameters that may affect the construction project, can estimate how those parameters will change in the area, or have access to information but do not include those details in the contract when deciding the length and conditions of the construction, they will not be able to request an adaptation. However, if reasonable research is conducted and the contractual clauses are established in a way that considers the climate in the area and the rules are followed, even if events of an unexpected nature occur or the limit is already set in the contract terms, requests for changes will be made.
4.2. Conclusions
Adverse weather and climatic conditions have a significant impact on construction projects, leading to delays, legal cases, and economic losses. In general, studies have mostly focused on limited interconnections between climatic variables, single variables, or historical time periods. On the other hand, this study provides a comprehensive analysis of the impact of the weather and climate on project planning and delivery in Türkiye not only for the historical period but also for future periods.
By analyzing daily combinations of climatic variables and developing performance maps, a scientific basis for classifying extreme and non-extreme weather conditions and their effects on construction activities was suggested. With the approach presented in this study, it is possible to reduce uncertainty created by climate change and variability, and this approach can be applied to a variety of projects and geographical regions considering the near to distant future.
The study revealed the sensitivity of construction activities to weather and climate conditions and introduced the need for effective strategies to mitigate delays and financial setbacks. The results of the study show that winter workability increases in the future while summer workability decreases in many regions because of increasing temperatures. According to the case study results, ignoring the effects of climate change might significantly increase construction durations.
The presented approach enables professionals to strategize for the medium and long term, considering seasonal and annual fluctuations in weather conditions in a site-specific manner. The probabilities of accountable weather and climate variables for specific activities present planners with an alternative path to estimate the additional duration required due to weather and climate conditions.
The study also emphasizes the connectedness of activities in construction projects and the importance of integrating weather and climate conditions into project planning to assess the overall impact on project duration when weather- or climate-sensitive activities are involved. The findings suggest that adverse weather conditions in Türkiye can significantly prolong construction projects, but implementing strategies to mitigate weather-related delays can lead to cost reductions. Overall, this research provides valuable insights and planning instruments for governments, contractors, and construction industry professionals at a national level.
4.3. Limitations and Future Research Needs
The proposed method has several potential promising applications as stated above; however, it has limitations and drawbacks. One major drawback is the reliance on accurate data for the reference period, which can be challenging to obtain because of the need for extensive coverage and a significant number of years of data from a wide range of weather stations or other sources, such as reanalysis. Furthermore, this study relies on current climate modeling technologies, which may have limitations in predicting long-term patterns. Although GCMs are the best option for future periods, post-processing is necessary before using data from these GCMs.
Additionally, the computational load involved in processing the data and the various outputs provided is high, and analyses with small study areas or specific time intervals can be less time-consuming. These data dependencies and computational intensities pose potential challenges for the proposed methodology. Finally, while the study focuses on weather- and climate change-related delays, other factors, such as economic conditions, resource availability, and policy changes, can also affect construction schedules and should be considered. Past project data with different site conditions, locations, and time periods should be reanalyzed to improve the results of the proposed method.
Furthermore, adding new climate variables, such as wind speed, could expand the variable range of the analyses. Although a ~9 km grid resolution provides a detailed overview, it may not capture microclimatic variations. Given Türkiye’s diverse geography, regional variability can play a significant role in weather and climate patterns and regional differences could have a significant impact on construction activities in specific locations.
Additionally, this study has several suggestions for further research besides the investigation of limitations. One suggestion is to utilize advanced statistical methods and machine learning algorithms [73] to improve the precision of climate risk predictions and handle large and complex datasets. Another opportunity is to validate risk maps and predictive models against historical climate data and actual construction delays to assess the accuracy and reliability of the predictions. Furthermore, emerging construction technologies, such as building information modeling (BIM) and smart construction management tools, can be integrated into predictive climate and weather risk maps to enhance decision making.
Future research might also include the use of regional climate models from CMIP6 when they are available instead of statistically downscaled global climate models. Additional climate scenarios can also be investigated over different periods to determine the uncertainty range of future climate change effects. Furthermore, it is necessary to explore the consequences of such changes in a variety of pilot projects, as this would enable a more complete understanding of the impact of climate on construction projects of varying durations and complexities.
Author Contributions
Conceptualization, S.O. and B.G.; Methodology, S.O.; Software, S.O. and B.G.; Formal analysis, S.O. and B.G.; Investigation, S.O.; Data curation, S.O. and B.G.; Writing—original draft, S.O.; Writing—review & editing, S.O., H.A.D., B.G. and I.Y.; Visualization, S.O.; Supervision, H.A.D. and I.Y. All authors have read and agreed to the published version of the manuscript.
Funding
This research received no external funding. APC is supported by UiT the Arctic University of Norway.
Data Availability Statement
CMIP6 data supporting this study’s findings are freely available from ESGF (https://esgf-node.llnl.gov/search/cmip6/, accessed on 14 March 2023), and Era5-Land data are freely available from ECMWF Copernicus (https://cds.climate.copernicus.eu/cdsapp#!/dataset/reanalysis-era5-land?tab=form).
Acknowledgments
The authors would like to thank Pablo Ballesteros-Pérez for his recommendations and Heather McWhinney for her valuable contributions.
Conflicts of Interest
The author declares no conflicts of interest.
References
- Cooper, D.F.; Grey, S.; Raymond, G.; Walker, P. Project Risk Management Guidelines: Managing Risk in Large Projects and Complex Procurements; John Wiley & Sons, Ltd.: London, UK, 2005. [Google Scholar]
- Loch, C.H.; DeMeyer, A.; Pich, M.T. Managing the Unknown: A New Approach to Managing High Uncertainty and Risk in Projects; John Wiley & Sons: Hoboken, NJ, USA, 2006. [Google Scholar]
- Pheng, L.S.; Hou, L.S. The Economy and the Construction Industry. In Construction Quality and the Economy. Management in the Built Environment; Springer: Singapore, 2019. [Google Scholar] [CrossRef]
- Johnson, R.M.; Babu, R.I.I. Time and cost overruns in the UAE construction industry: A critical analysis. Int. J. Constr. Manag. 2020, 20, 402–411. [Google Scholar] [CrossRef]
- Fashina, A.A.; Omar, M.A.; Sheikh, A.A.; Fakunle, F.F. Exploring the significant factors that influence delays in construction projects in Hargeisa. Heliyon 2021, 7, e06826. [Google Scholar] [CrossRef]
- Francisco de Oliveira, G.; Rabechini, R., Jr. Stakeholder management influence on trust in a project: A quantitative study. Int. J. Proj. Manag. 2019, 37, 131–144. [Google Scholar] [CrossRef]
- Ballesteros-Pérez, P.; Smith, S.T.; Lloyd-Papworth, J.G.; Cooke, P. Incorporating the effect of weather in construction scheduling and management with sine wave curves: Application in the United Kingdom. Constr. Manag. Econ. 2018, 36, 666–682. [Google Scholar] [CrossRef]
- Heravi, G.; Mohammadian, M. Investigating cost overruns and delay in urban construction projects in Iran. Int. J. Constr. Manag. 2019, 21, 958–968. [Google Scholar] [CrossRef]
- Pehlivan, S.; Öztemir, A.E. Integrated Risk of Progress-Based Costs and Schedule Delays in Construction Projects. Eng. Manag. J. 2018, 30, 108–116. [Google Scholar] [CrossRef]
- Çevikbaş, M.; Işık, Z. An Overarching Review on Delay Analyses in Construction Projects. Buildings 2021, 11, 109. [Google Scholar] [CrossRef]
- Honnappa, D.; Padala, S.P.S. BIM-based framework to quantify delays and cost overruns due to changes in construction projects. Asian J. Civ. Eng. 2022, 23, 707–725. [Google Scholar] [CrossRef]
- Abdelhadi, Y.; Dulaimi, M.F.; Bajracharya, A. Factors influencing the selection of delay analysis methods in construction projects in UAE. Int. J. Constr. Manag. 2019, 19, 329–340. [Google Scholar] [CrossRef]
- Sanni-Anibire, M.O.; Zin, R.M.; Olatunji, S.O. Causes of delay in the global construction industry: A meta analytical review. Int. J. Constr. Manag. 2020, 22, 1395–1407. [Google Scholar] [CrossRef]
- Zarei, B.; Sharifi, H.; Chaghouee, Y. Delay causes analysis in complex construction projects: A Semantic Network Analysis approach. Prod. Plan. Control 2018, 29, 29–40. [Google Scholar] [CrossRef]
- Do, S.T.; Nguyen, V.T.; Tran, C.N.N.; Aung, Z.M. Identifying and evaluating the key claim causes leading to construction delays. Int. J. Constr. Manag. 2022, 23, 1999–2011. [Google Scholar] [CrossRef]
- Alshammari, S.; Al-Gahtani, K.; Alhammad, I.; Braimah, N. A Systematic Method to Analyze Force Majeure in Construction Claims. Buildings 2017, 7, 115. [Google Scholar] [CrossRef]
- Rogalska, M.; Czarnigowska, A.; Hejducki, Z.; Nahurny, T.O. Methods of estimation of building processes duration including weather risk factors. Build. Rev. 2006, 1, 37–42. (In Polish) [Google Scholar]
- Alarcón, L.F.; Diethelm, S.; Rojo, O.; Calderón, R. Assessing the impacts of implementing lean construction. In Proceedings of the 13th International Group for Lean Construction Annual Conference, Santiago, Chile, 25–27 July 2006; International Group on Lean Construction: Sydney, Australia, 2005; pp. 387–393. [Google Scholar]
- Islip, D.; Wei, J.Z.; Kwon, R.H. Managing construction risk with weather derivatives. Eng. Econ. 2020, 66, 150–184. [Google Scholar] [CrossRef]
- Moselhi, O.; El-Rayes, K. Analyzing weather-related construction claims. Cost Eng. 2002, 44, 12–19. [Google Scholar]
- Nguyen, L.D.; Kneppers, J.; García de Soto, B.; Ibbs, W. Analysis of adverse weather for excusable delays. J. Constr. Eng. Manag. 2010, 136, 1258–1267. [Google Scholar] [CrossRef]
- Tian, W.; de Wilde, P. Uncertainty and sensitivity analysis of building performance using probabilistic climate projections: A UK case study. Autom. Constr. 2011, 20, 1096–1109. [Google Scholar] [CrossRef]
- Jung, M.; Park, M.; Lee, H.-S.; Kim, H. Weather-Delay Simulation Model Based on Vertical Weather Profile for High-Rise Building Construction. J. Constr. Eng. Manag. 2016, 142, 04016007. [Google Scholar] [CrossRef]
- IPCC. IPCC Climate Change 2021: The Physical Science Basis: Working Group I Contribution to the Sixth Assessment Report of the Intergovernmental Panel on Climate Change; Cambridge University Press: Cambridge, UK, 2021. [Google Scholar]
- Zhang, L.; Liu, B.; Du, J.; Liu, C.; Li, H.; Wang, S. Internationalization trends of carbon emission linkages: A case study on the construction sector. J. Clean. Prod. 2020, 270, 122433. [Google Scholar] [CrossRef]
- Murtagh, N.; Scott, L.; Fan, J. Sustainable and resilient construction: Current status and future challenges. J. Clean. Prod. 2020, 268, 122264. [Google Scholar] [CrossRef]
- Jafer, H.; Jawad, I.; Majeed, Z.; Shubbar, A. The development of an ecofriendly binder containing high volume of cement replacement by incorporating two by-product materials for the use in soil stabilization. Sci. Rev. Eng. Environ. Sci. (SREES) 2021, 30, 62–74. [Google Scholar] [CrossRef]
- Ezinna, P.C.; Nwanmuoh, E.; Ozumba, I.B.U. Decarbonization and sustainable development goal 13: A reflection of the maritime sector. J. Int. Marit. Saf. Environ. Aff. Shipp. 2021, 5, 98–105. [Google Scholar] [CrossRef]
- Contini, D.; Merico, E. Recent Advances in Studying Air Quality and Health Effects of Shipping Emissions. Atmosphere 2021, 12, 92. [Google Scholar] [CrossRef]
- Harun, M.; Ahmad, S.A.; Sulaiman, N.; Tria, D. Sectoral Energy-CO2 Emissions Using an Environmental Input-Output Framework. Int. J. Bus. Soc. 2021, 22, 1066–1075. [Google Scholar] [CrossRef]
- Shakoor, A.; Ashraf, F.; Shakoor, S.; Mustafa, A.; Rehman, A.; Altaf, M.M. Biogeochemical transformation of greenhouse gas emissions from terrestrial to atmospheric environment and potential feedback to climate forcing. Environ. Sci. Pollut. Res. 2020, 27, 38513–38536. [Google Scholar] [CrossRef]
- Wang, P.; Zhang, L.; Wang, K.; Fenn, P. Aetiology and Progression of Construction Disputes towards a Predictive Model. Ksce J. Civ. Eng. 2021, 25, 1131–1143. [Google Scholar] [CrossRef]
- Ballesteros-Pérez, P.; Rojas-Céspedes, Y.A.; Hughes, W.; Kabiri, S.; Pellicer, E.; Mora-Melià, D.; del Campo-Hitschfeld, M.L. Weather-wise: A weather-aware planning tool for improving construction productivity and dealing with claims. Autom. Constr. 2017, 84, 81–95. [Google Scholar] [CrossRef]
- Durdyev, S.; Hosseini, M.R. Causes of delays on construction projects: A comprehensive list. Int. J. Manag. Proj. Bus. 2020, 13, 20–46. [Google Scholar] [CrossRef]
- Weather vs Climate: What’s the Difference? (n.d.). Available online: https://www.esa.int/Applications/Observing_the_Earth/Space_for_our_climate/Weather_vs_climate_What_s_the_difference (accessed on 25 January 2024).
- White, C.J.; Carlsen, H.; Robertson, A.W.; Klein, R.J.; Lazo, J.K.; Kumar, A.; Zebiak, S.E. Potential applications of subseasonal-to-seasonal (S2S) predictions. Meteorol. Appl. 2017, 24, 315–325. [Google Scholar] [CrossRef]
- Stone, D.A.; Allen, M.R.; Stott, P.A.; Pall, P.; Min, S.-K.; Nozawa, T.; Yukimoto, S. The Detection and Attribution of Human Influence on Climate. Annu. Rev. Environ. Resour. 2009, 34, 1–16. [Google Scholar] [CrossRef]
- Werndl, C. On Defining Climate and Climate Change. Br. J. Philos. Sci. 2016, 67, 337–364. [Google Scholar] [CrossRef]
- Neal, R.; Fereday, D.; Crocker, R.; Comer, R.E. A flexible approach to defining weather patterns and their application in weather forecasting over Europe. Meteorol. Appl. 2016, 23, 389–400. [Google Scholar] [CrossRef]
- Oruc, S. Performance of bias corrected monthly CMIP6 climate projections with different reference period data in Turkey. Acta Geophys. 2022, 70, 777–789. [Google Scholar] [CrossRef]
- Amjad, M.R.; Yilmaz, M.T.; Yucel, I.; Yilmaz, K.K. Performance evaluation of satellite- and model-based precipitation products over varying climate and complex topography. J. Hydrol. 2020, 584, 124707. [Google Scholar] [CrossRef]
- General Diroctorate of Meteorology (GDM). Offical Statistics/Parameter Analysis. 2023. Available online: https://www.mgm.gov.tr/FILES/iklim/yillikiklim/2022-iklim-raporu.pdf (accessed on 1 March 2023).
- Gumus, B.; Oruc, S.; Yucel, I.; Yilmaz, M.T. Impacts of Climate Change on Extreme Climate Indices in Türkiye Driven by High-Resolution Downscaled CMIP6 Climate Models. Sustainability 2023, 15, 7202. [Google Scholar] [CrossRef]
- Ballesteros-Pérez, P.; del Campo-Hitschfeld, M.L.; González-Naranjo, M.A.; González-Cruz, M.C. Climate and construction delays: Case study in Chile. Eng. Constr. Arch. Manag. 2015, 22, 596–621. [Google Scholar] [CrossRef]
- Eyring, V.; Bony, S.; Meehl, G.A.; Senior, C.A.; Stevens, B.; Stouffer, R.J.; Taylor, K.E. Overview of the Coupled Model Intercomparison Project Phase 6 (CMIP6) experimental design and organization. Geosci. Model Dev. 2016, 9, 1937–1958. [Google Scholar] [CrossRef]
- O’Neill, B.C.; Tebaldi, C.; van Vuuren, D.P.; Eyring, V.; Friedlingstein, P.; Hurtt, G.; Knutti, R.; Kriegler, E.; Lamarque, J.-F.; Lowe, J.; et al. The Scenario Model Intercomparison Project (ScenarioMIP) for CMIP6. Geosci. Model Dev. 2016, 9, 3461–3482. [Google Scholar] [CrossRef]
- Touzé-Peiffer, L.; Barberousse, A.; Le Treut, H. The Coupled Model Intercomparison Project: History, uses, and structural effects on climate research. Wiley Interdiscip. Rev. Clim. Chang. 2020, 11, e648. [Google Scholar] [CrossRef]
- Bayar, A.S.; Yılmaz, M.T.; Yücel, I.; Dirmeyer, P. CMIP6 Earth System Models Project Greater Acceleration of Climate Zone Change Due to Stronger Warming Rates. Earth’s Futur. 2023, 11, e2022EF002972. [Google Scholar] [CrossRef]
- Stouffer, R.J.; Eyring, V.; Meehl, G.A.; Bony, S.; Senior, C.A.; Stevens, B.; Taylor, K.E. CMIP5 Scientific Gaps and Recommendations for CMIP6. Bull. Am. Meteorol. Soc. 2017, 98, 95–105. [Google Scholar] [CrossRef]
- Liu, X.; Li, C.; Zhao, T.; Han, L. Future changes of global potential evapotranspiration simulated from CMIP5 to CMIP6 models. Atmos. Ocean. Sci. Lett. 2020, 13, 568–575. [Google Scholar] [CrossRef]
- Wyser, K.; Kjellström, E.; Koenigk, T.; Martins, H.; Doescher, R. Warmer climate projections in EC-Earth3-Veg: The role of changes in the greenhouse gas concentrations from CMIP5 to CMIP6. Environ. Res. Lett. 2020, 15, 054020. [Google Scholar] [CrossRef]
- Bağçaci, S.; Yucel, I.; Duzenli, E.; Yilmaz, M.T. Intercomparison of the expected change in the temperature and the precipitation retrieved from CMIP6 and CMIP5 climate projections: A Mediterranean hot spot case, Turkey. Atmos. Res. 2021, 256, 105576. [Google Scholar] [CrossRef]
- Cannon, A.J.; Sobie, S.R.; Murdock, T.Q. Bias Correction of GCM Precipitation by Quantile Mapping: How Well Do Methods Preserve Changes in Quantiles and Extremes? J. Clim. 2015, 28, 6938–6959. [Google Scholar] [CrossRef]
- Muñoz-Sabater, J.; Dutra, E.; Agustí-Panareda, A.; Albergel, C.; Arduini, G.; Balsamo, G.; Boussetta, S.; Choulga, M.; Harrigan, S.; Hersbach, H.; et al. ERA5-Land: A state-of-the-art global reanalysis dataset for land applications. Earth Syst. Sci. Data 2021, 13, 4349–4383. [Google Scholar] [CrossRef]
- Yilmaz, M. Accuracy assessment of temperature trends from ERA5 and ERA5-Land. Sci. Total. Environ. 2023, 856, 159182. [Google Scholar] [CrossRef]
- Tariq, J.; Gardezi, S.S.S. Study the delays and conflicts for construction projects and their mutual relationship: A review. Ain Shams Eng. J. 2022, 14, 101815. [Google Scholar] [CrossRef]
- Radman, K.; Jelodar, M.B.; Lovreglio, R.; Ghazizadeh, E.; Wilkinson, S. Digital technologies and data-driven delay management process for construction projects. Front. Built Environ. 2022, 8, 1029586. [Google Scholar] [CrossRef]
- Soman, R.K.; Molina-Solana, M. Automating look-ahead schedule generation for construction using linked-data based constraint checking and reinforcement learning. Autom. Constr. 2022, 134, 104069. [Google Scholar] [CrossRef]
- Shoukry, S.N.; William, G.W.; Downie, B.; Riad, M.Y. Effect of moisture and temperature on the mechanical properties of concrete. Constr. Build. Mater. 2011, 25, 688–696. [Google Scholar] [CrossRef]
- Larsson, R.; Rudberg, M. Impact of Weather Conditions on In Situ Concrete Wall Operations Using a Simulation-Based Approach. J. Constr. Eng. Manag. 2019, 145, 05019009. [Google Scholar] [CrossRef]
- Al Refaie, A.M.; Alashwal, A.M.; Abdul-Samad, Z.; Salleh, H. Weather and labor productivity in construction: A literature review and taxonomy of studies. Int. J. Prod. Perform. Manag. 2020, 70, 941–957. [Google Scholar] [CrossRef]
- Oruc, S.; Koksal Oruc, B. Climate Impacts on Infrastructure Projects and Risk Allocation. J. Court Cassat. 2023, 49, 575–597. [Google Scholar]
- Ismail, A.R.; Nizam, C.M.; Haniff, M.H.M.; Deros, B.M. The Impact of Workers Productivity Under Simulated Environmental Factor by Taguchi Analysis. APCBEE Procedia 2014, 10, 263–268. [Google Scholar] [CrossRef]
- Zhang, W.; Ding, N.; Han, Y.; He, J.; Zhang, N. The impact of temperature on labor productivity—Evidence from temperature-sensitive enterprises. Front. Environ. Sci. 2023, 10, 1039668. [Google Scholar] [CrossRef]
- Amadi, A.I. A back-end view to climatic adaptation: Partitioning weather-induced cement demand variance in wet humid environment. Int. J. Build. Pathol. Adapt. 2021, 39, 153–174. [Google Scholar] [CrossRef]
- Ballesteros-Pérez, P.; Sanz-Ablanedo, E.; Soetanto, R.; González-Cruz, M.C.; Larsen, G.D.; Cerezo-Narváez, A. On the Duration and Cost Variability of Construction Activities: An Empirical Study. J. Constr. Eng. Manag. 2020, 146, 04019093. [Google Scholar] [CrossRef]
- Balushi, H.A.; AL-Alawi, M.; Shahri, M.A. Modeling, Investigating, and Quantification of the Hot Weather Effects on Construction Projects in Oman. J. Eng. Res. 2020, 17, 89–99. [Google Scholar]
- Schuldt, S.J.; Nicholson, M.R.; Adams, Y.A.; Delorit, J.D. Weather-Related Construction Delays in a Changing Climate: A Systematic State-of-the-Art Review. Sustainability 2021, 13, 2861. [Google Scholar] [CrossRef]
- Zidane, Y.J.-T.; Andersen, B. The top 10 universal delay factors in construction projects. Int. J. Manag. Proj. Bus. 2018, 11, 650–672. [Google Scholar] [CrossRef]
- Hurlimann, A.C.; Warren-Myers, G.; Browne, G.R. Is the Australian construction industry prepared for climate change? Build. Environ. 2019, 153, 128–137. [Google Scholar] [CrossRef]
- Boudiaf, B.; Dabanli, I.; Boutaghane, H.; Şen, Z. Temperature and Precipitation Risk Assessment Under Climate Change Effect in Northeast Algeria. Earth Syst. Environ. 2020, 4, 1–14. [Google Scholar] [CrossRef]
- Rachid, Z.; Toufik, B.; Mohammed, B. Causes of schedule delays in construction projects in Algeria. Int. J. Constr. Manag. 2019, 19, 371–381. [Google Scholar] [CrossRef]
- Senocak, A.U.G.; Yilmaz, M.T.; Kalkan, S.; Yucel, I.; Amjad, M. An Explainable Two-Stage Machine Learning Approach for Precipitation Forecast. J. Hydrol. 2023, 627, 130375. [Google Scholar] [CrossRef]
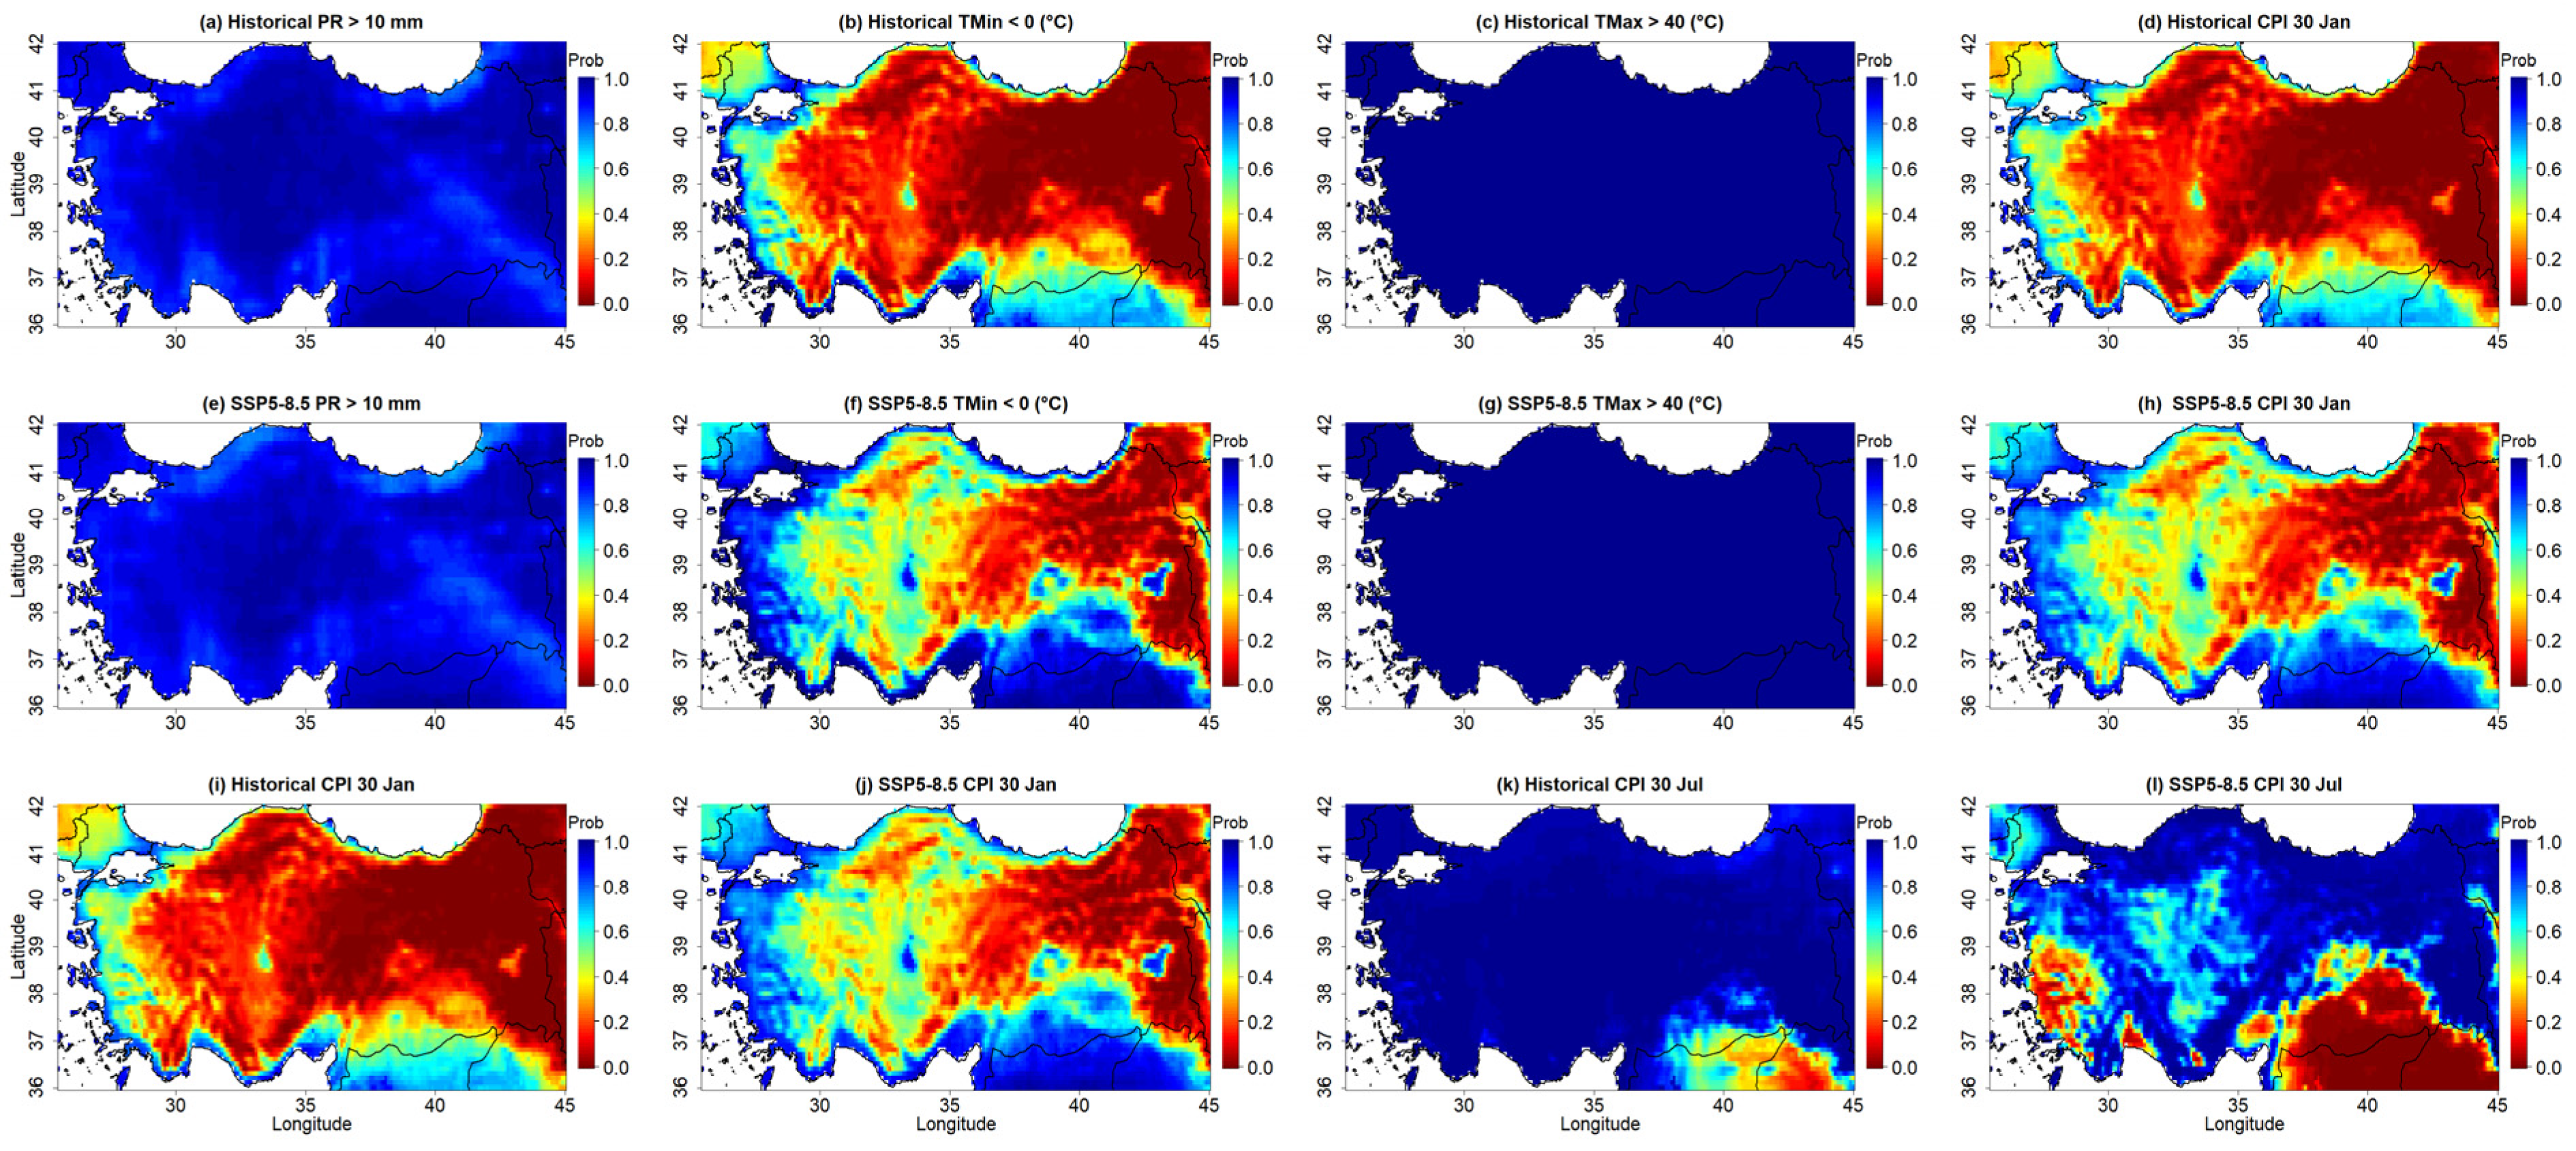

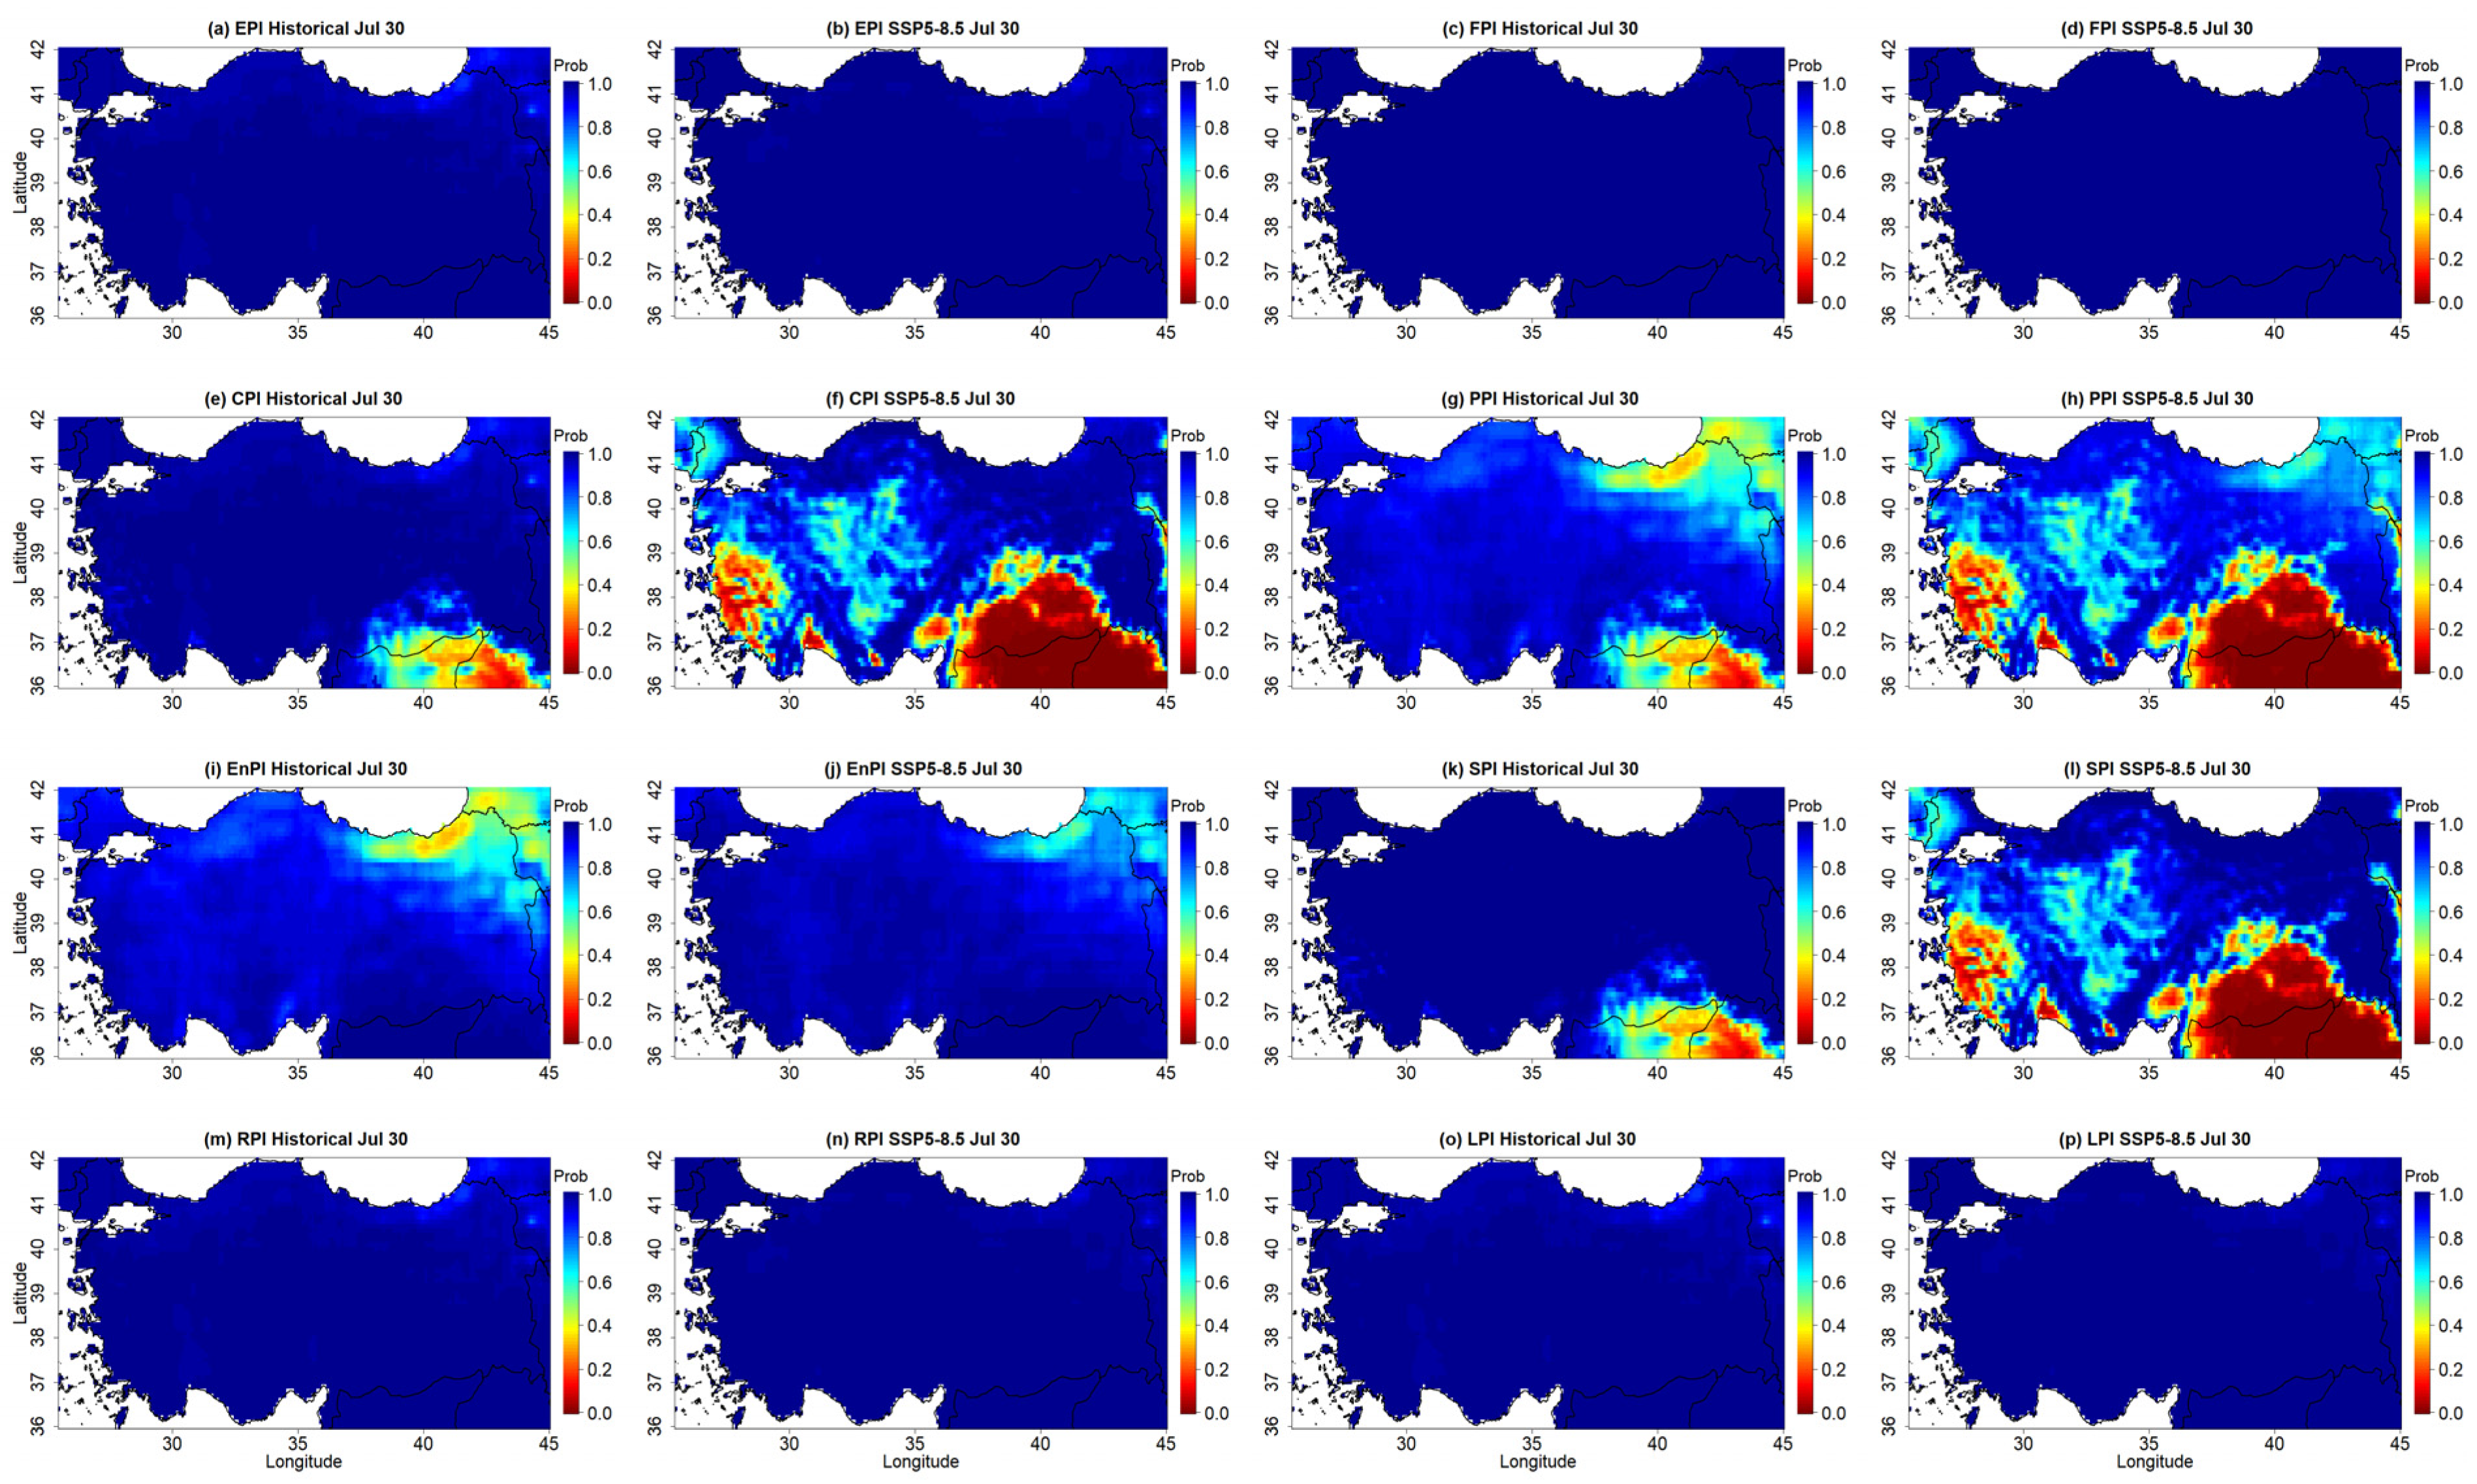
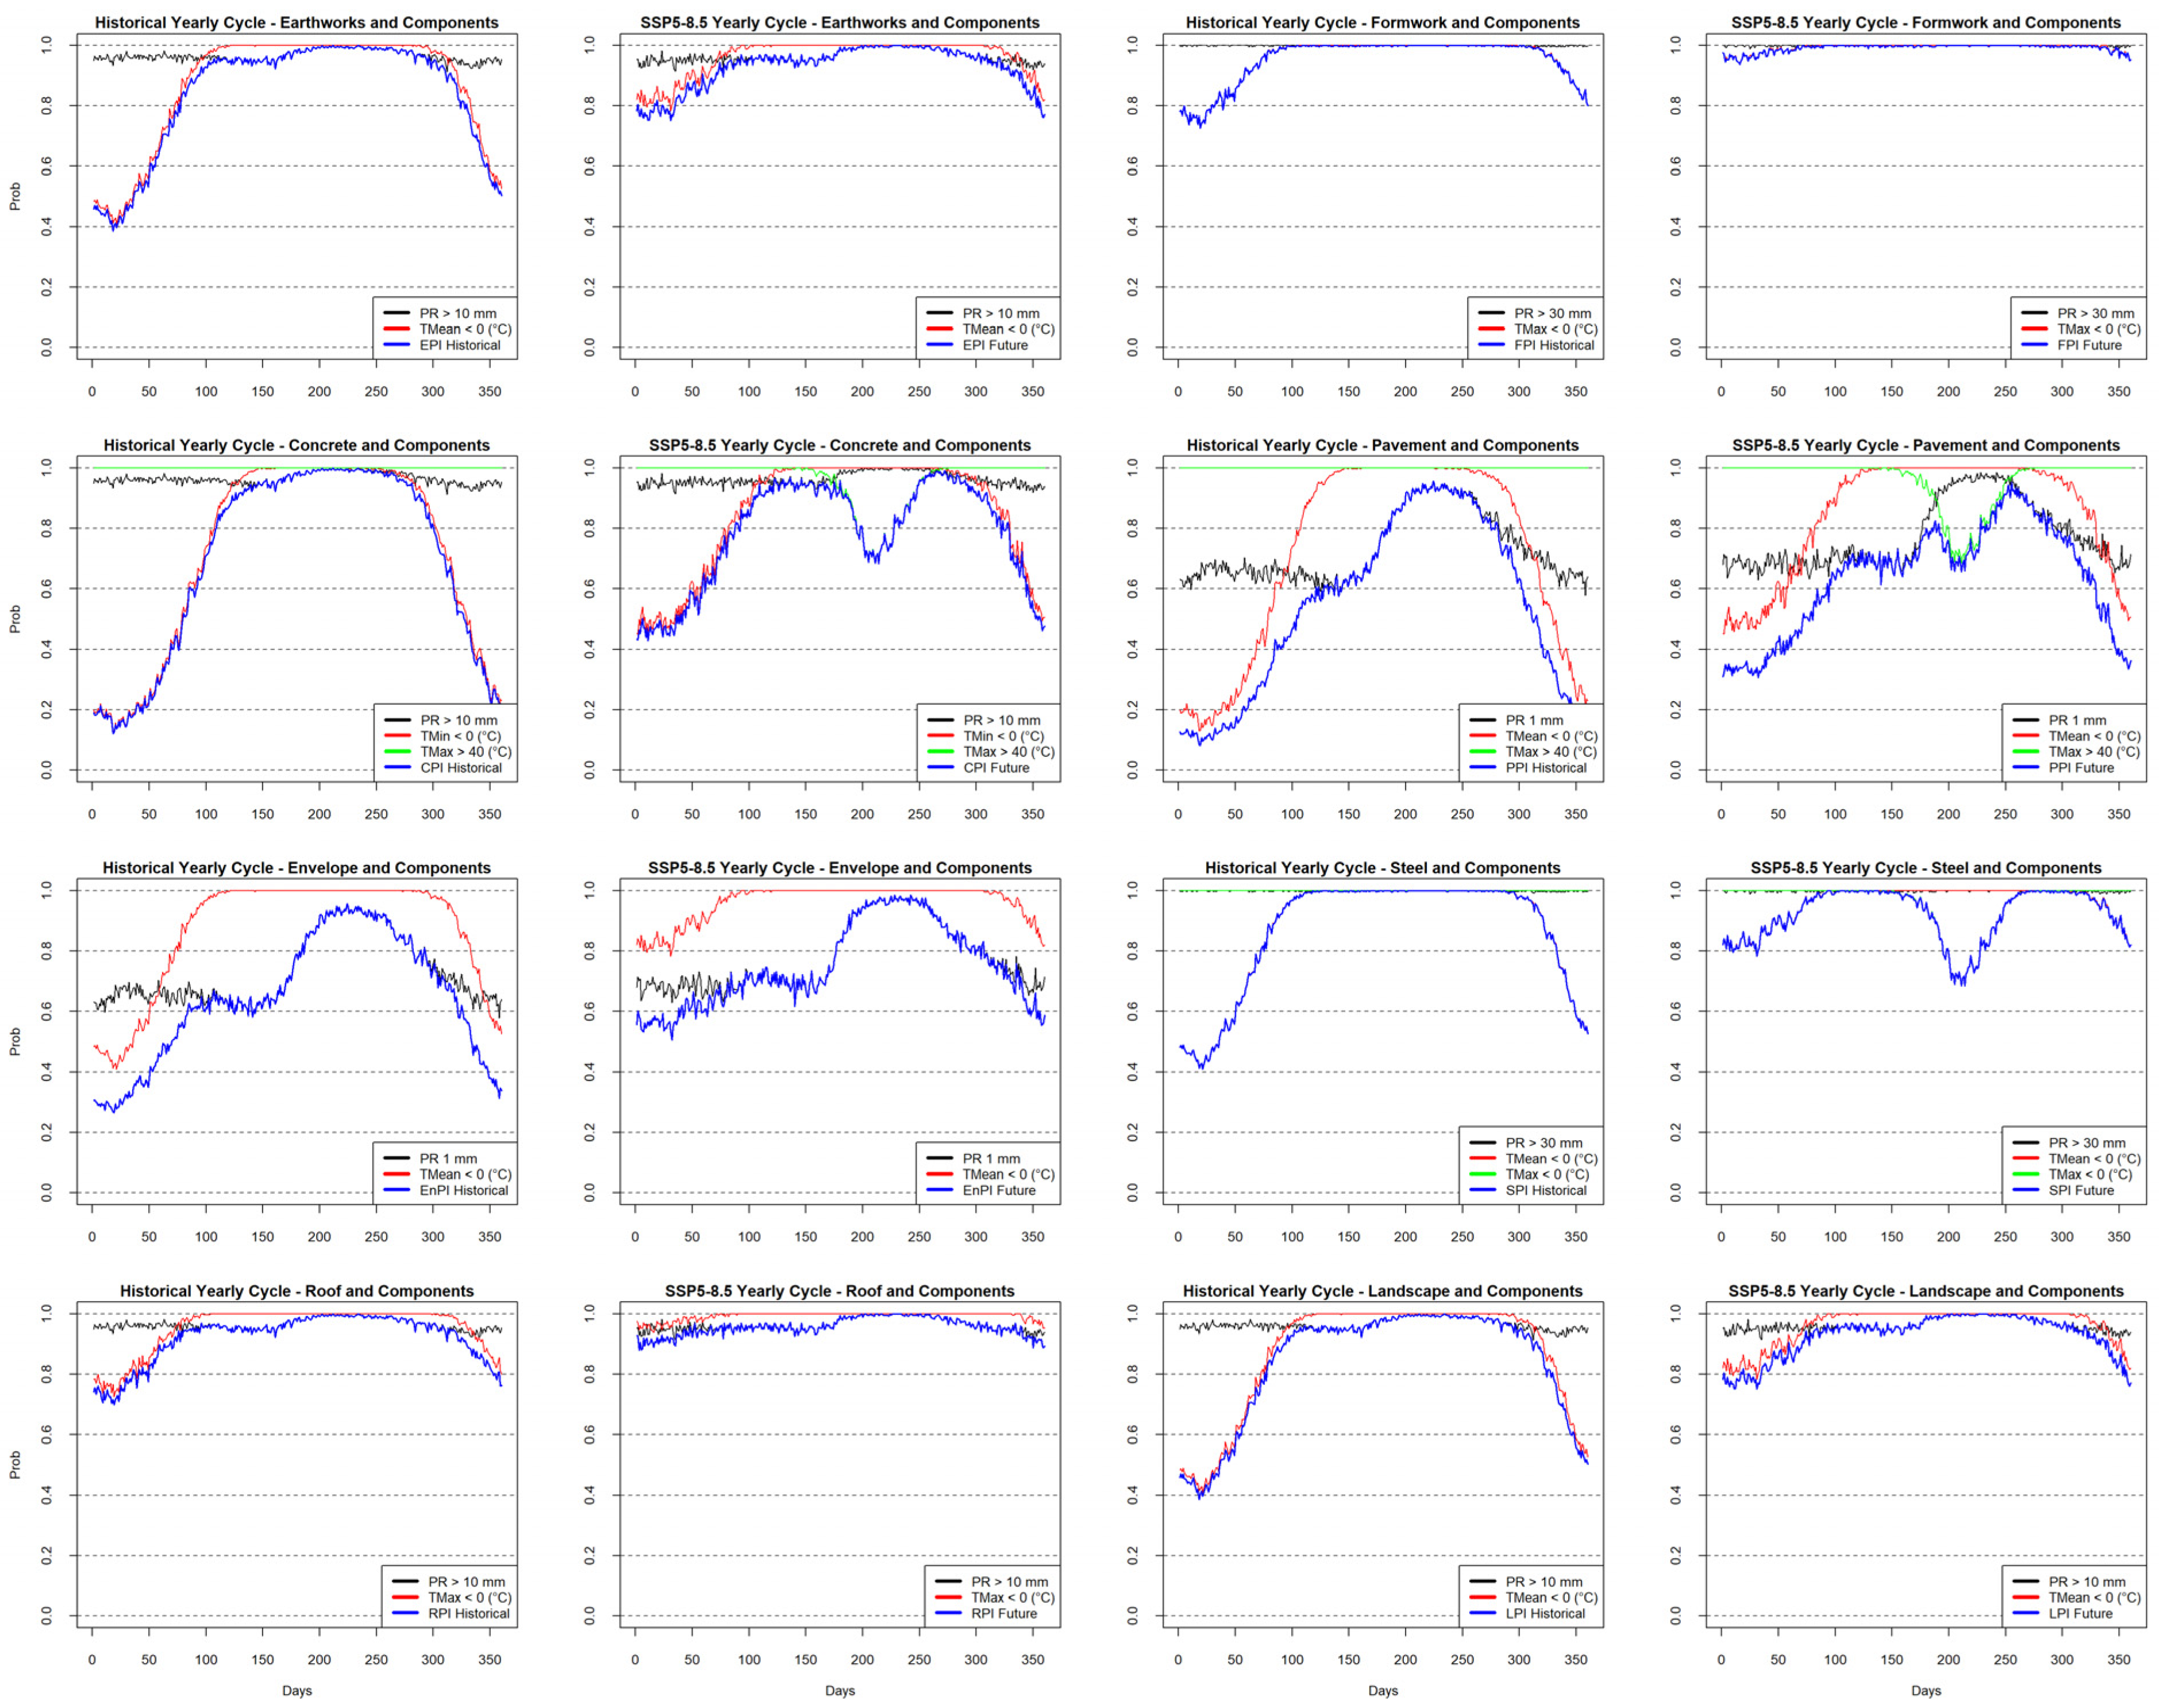
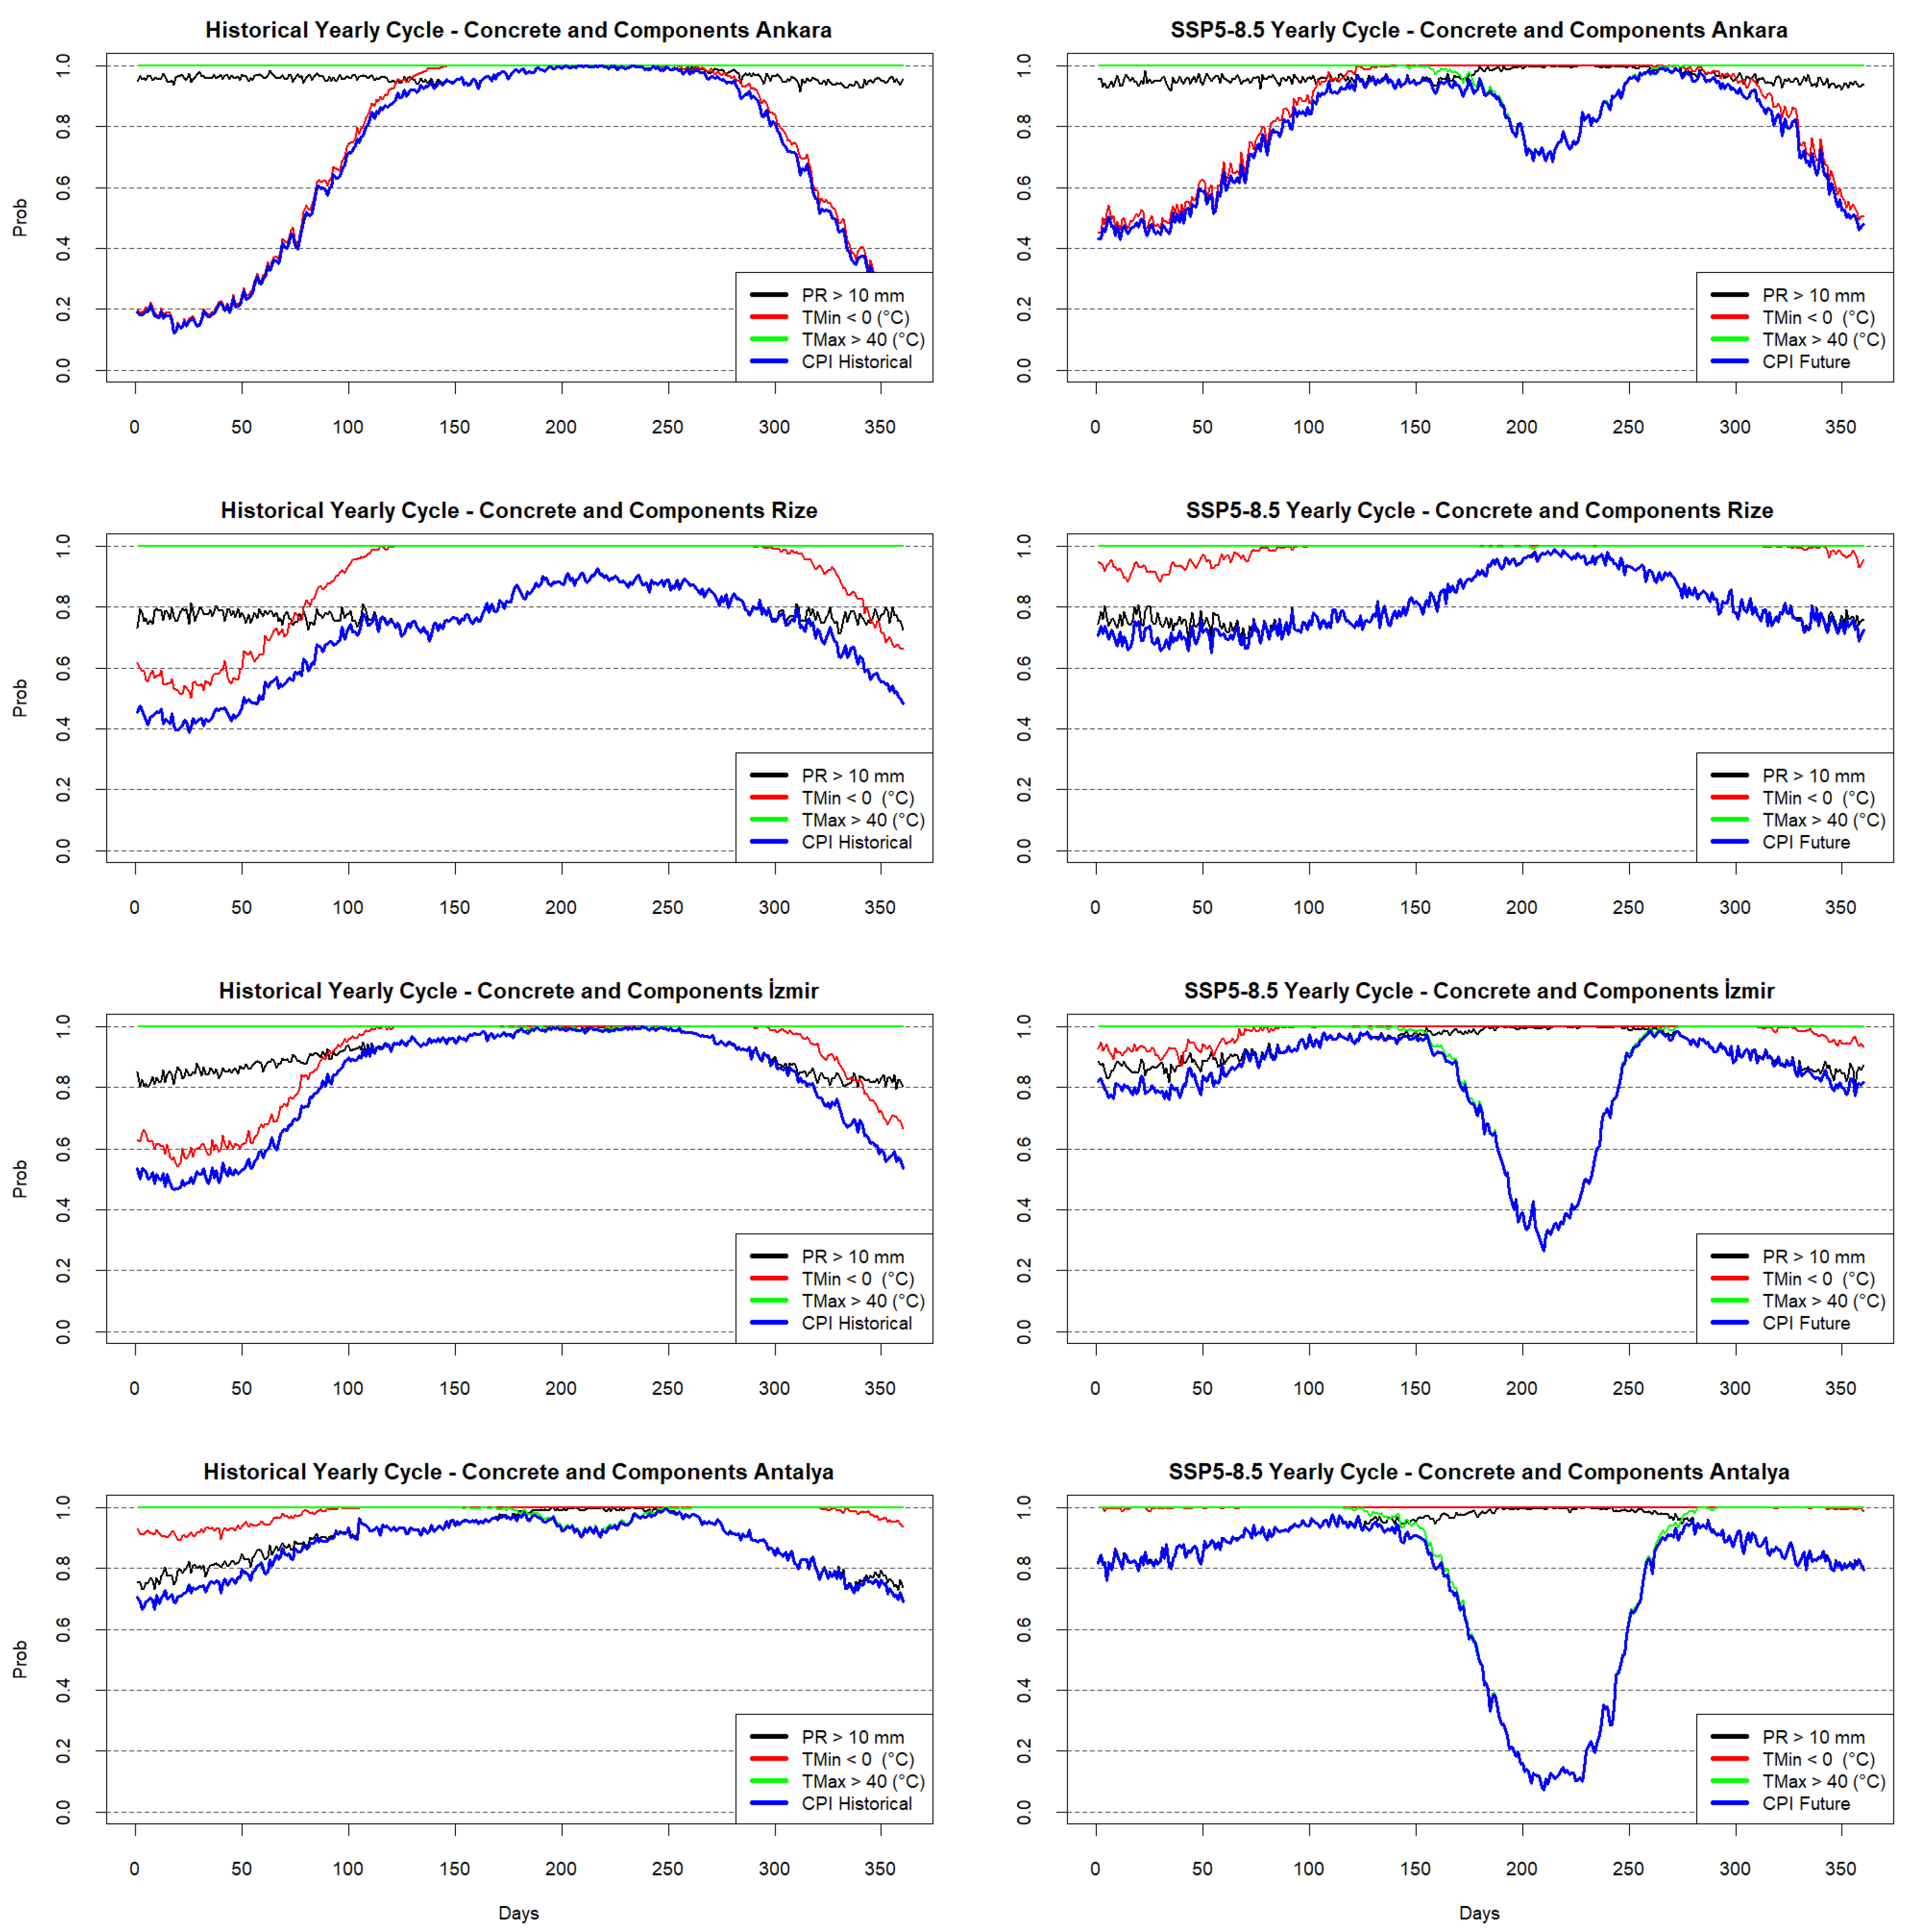
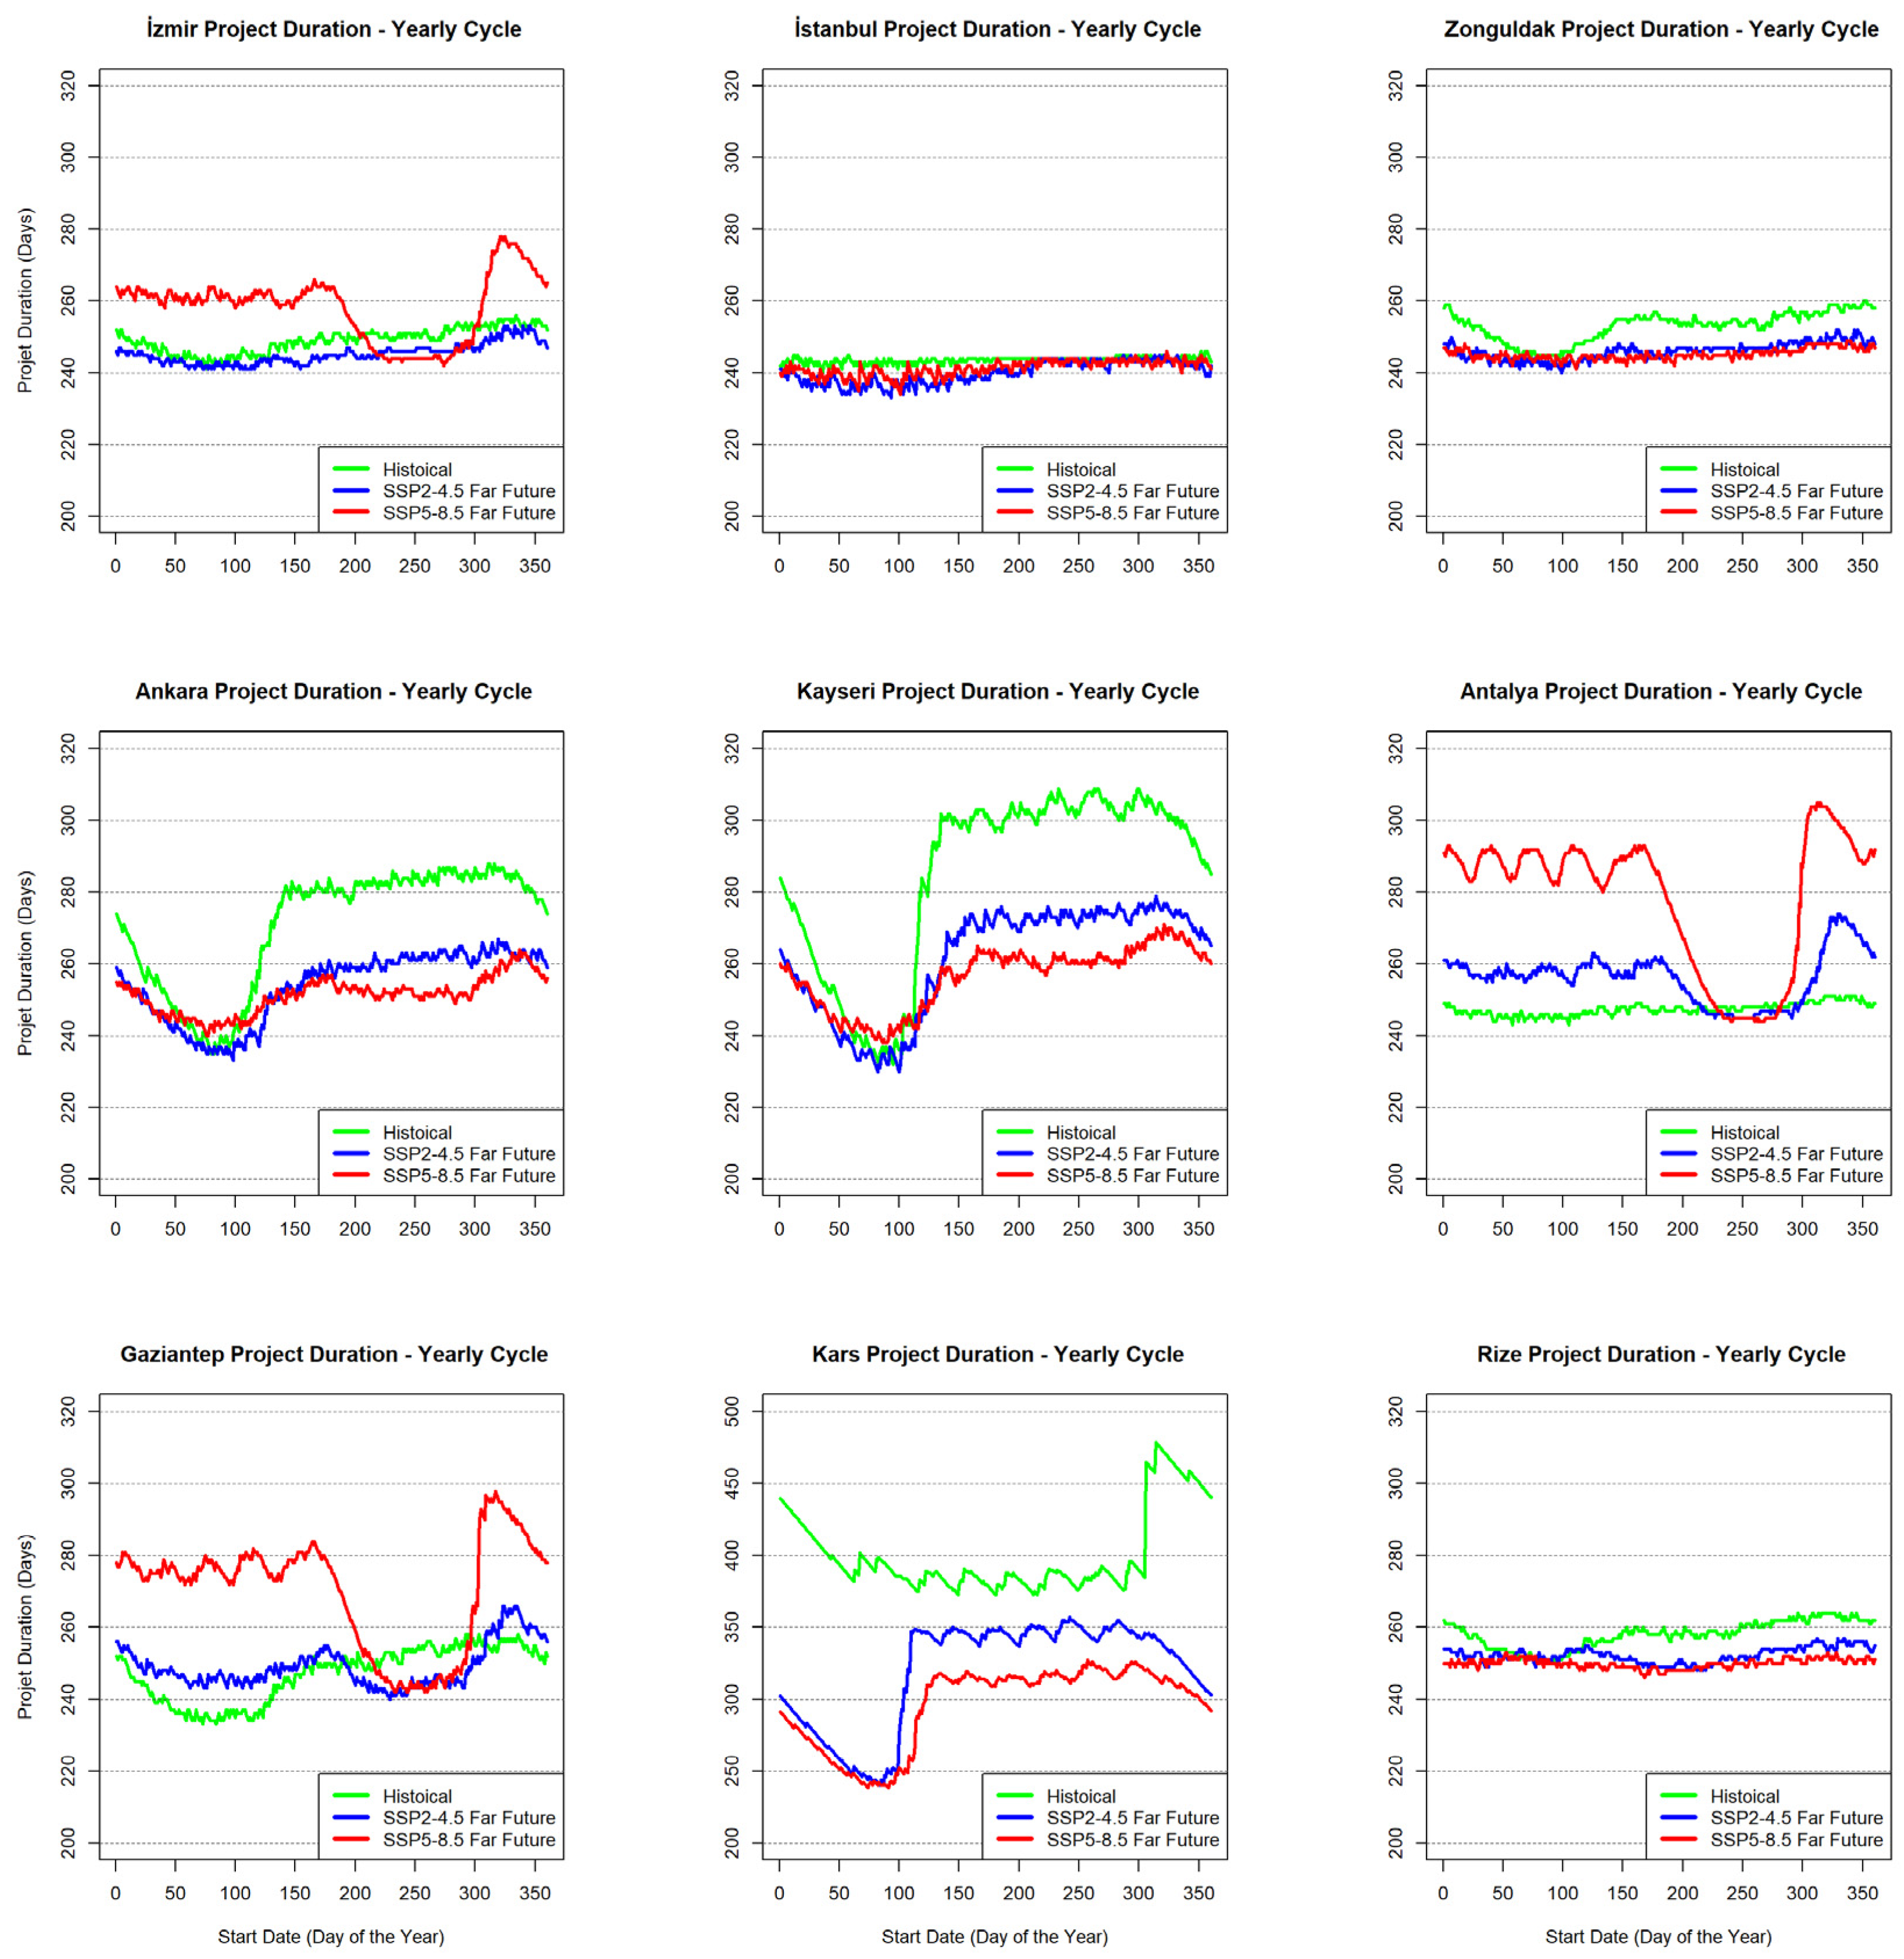
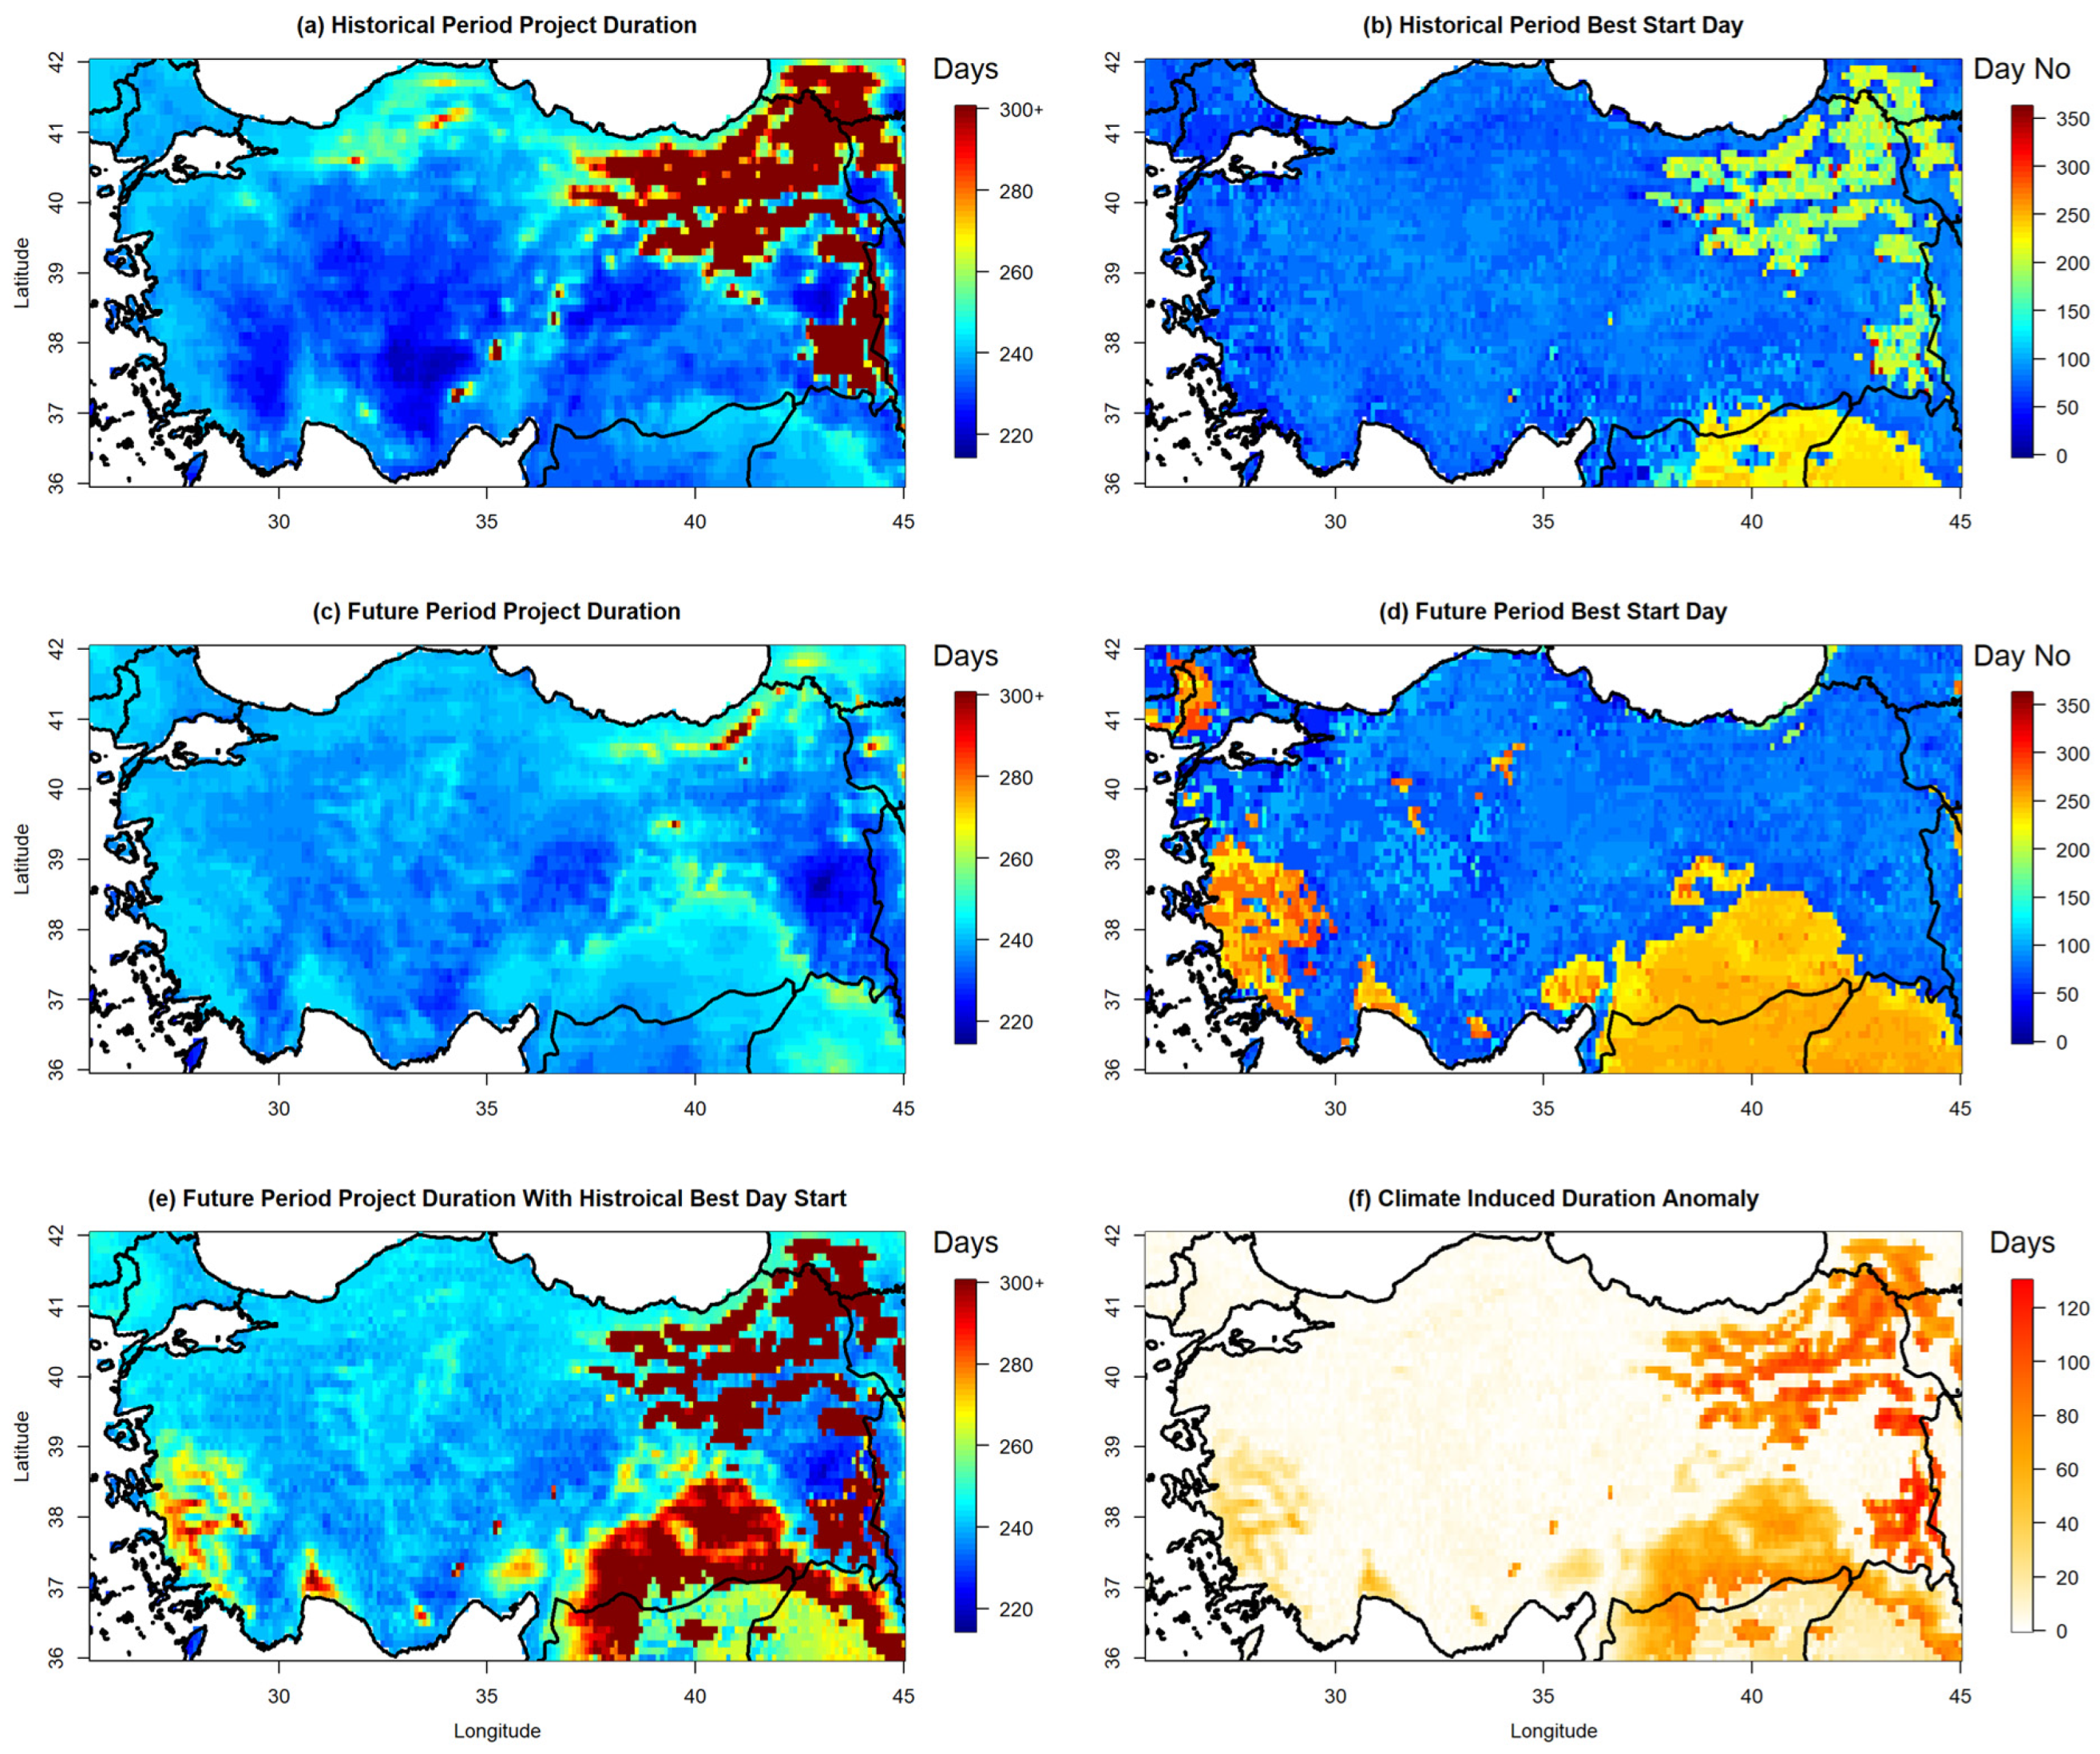

Disclaimer/Publisher’s Note: The statements, opinions and data contained in all publications are solely those of the individual author(s) and contributor(s) and not of MDPI and/or the editor(s). MDPI and/or the editor(s) disclaim responsibility for any injury to people or property resulting from any ideas, methods, instructions or products referred to in the content. |
© 2024 by the authors. Licensee MDPI, Basel, Switzerland. This article is an open access article distributed under the terms and conditions of the Creative Commons Attribution (CC BY) license (https://creativecommons.org/licenses/by/4.0/).