Abstract
The concept of a smart campus is rapidly gaining traction worldwide, driven by the growth of artificial intelligence (AI) and the Internet of Things (IoT), along with the digital transformation of higher education institutions. While numerous initiatives have been undertaken to enhance the capability of smart campus systems to keep pace with AI advancements, there have been few attempts to develop a cohesive conceptual framework for the smart campus, and to date, there has been limited empirical research conducted to validate the framework. This study bridges this gap by providing the first in-depth assessment of a holistic smart campus conceptual framework. The paper uses a Delphi study approach to validate and consolidate a framework for assessing the robustness of the smart campus assessment framework for application in university settings. The framework consists of four domains, 16 categories, and 48 indicators, comprising a total of 68 items that were validated by experts across the globe. Two rounds of structured questionnaires were conducted to achieve consensus on the framework. The first round involved 34 experts from diverse geographic and professional backgrounds in the smart campus field. The second round included 21 of the earlier participants, which was sufficient to determine consensus. In total, seven of the forty-eight indicators were agreed upon after Round 1, increasing to forty-three after Round 2. The results indicate strong agreement among the experts, affirming the framework’s robustness. This study offers an expert-based, interpretive assessment of the development of the smart campus concept, with a particular focus on validating the smart campus framework.
1. Introduction
The rapid advancements of artificial intelligence (AI) have significant implications and transformative impacts across all sectors of society, particularly in education, learning, and research within higher education institutions (HEIs) [1]. Moreover, the COVID-19 pandemic accelerated the digital transformation of HEIs. The development of smart campus frameworks has become important to address AI’s influence on university campuses [2,3]. This evolution has progressed to the evaluation of these frameworks for practical implementation within the university context [2,4,5,6].
A digitally transformed university campus, often referred to as a ‘smart campus’ [7,8], draws inspiration from the concept of the ‘smart city’ [9,10]. The smart campus is frequently seen as a scaled-down version of a smart city, benefiting from the research and implementation strategies of its urban counterpart [11]. Although the idea of a smart campus may seem familiar, its full potential is often overlooked due to the relatively recent adoption of digital technologies in many aspects of life. The advent of technologies, such as the Internet of Things (IoT), cloud computing, AI, Industry 4.0, and City 4.0, has revolutionized both business and education, driving unprecedented levels of efficiency and speed [12]. In addition, integrating cutting-edge technology and sustainable design can optimize energy consumption, enhance occupant comfort, and drive operational efficiency, thereby delivering significant returns on investment [13].
HEIs are increasingly integrating advanced technologies to transform teaching, learning, and research experiences for students and staff, offering alternative modes of attendance and collaboration [1,2]. HEI (or university, for simplicity) administrations worldwide are embracing the progressive advancement of digital campus transformations [14,15]. The smart campus model mirrors the smart city ecosystem by extending beyond traditional educational functions [11,16]—teaching, learning, and research—while also promoting lifelong learning, innovation, entrepreneurship, and Living Laboratories (Living Labs) that offer various programs designed to facilitate the development and implementation of cutting-edge technologies and practices [17,18,19,20].
Despite the apparent progress, there remains a significant gap in the establishment of comprehensive systems, frameworks, and policies to manage these rapid developments effectively [2,21]. While the current benefits of smart campuses are evident, they represent only the beginning of a larger revolution that requires strategic planning and action to fully realize its potential.
A pioneering smart campus conceptual framework [22] was developed, incorporating four key normative dimensions adapted from smart cities research [23]: society, economy, environment, and governance. These dimensions are aligned with the core principles of digital technology and big data. The rationale for adopting these dimensions from smart city research stems from the prevailing argument that the smart campus is a scaled-down version of the smart city [24]. This makes the smart campus an ideal testbed, functioning as an urban living lab to explore and apply smart city concepts [11].
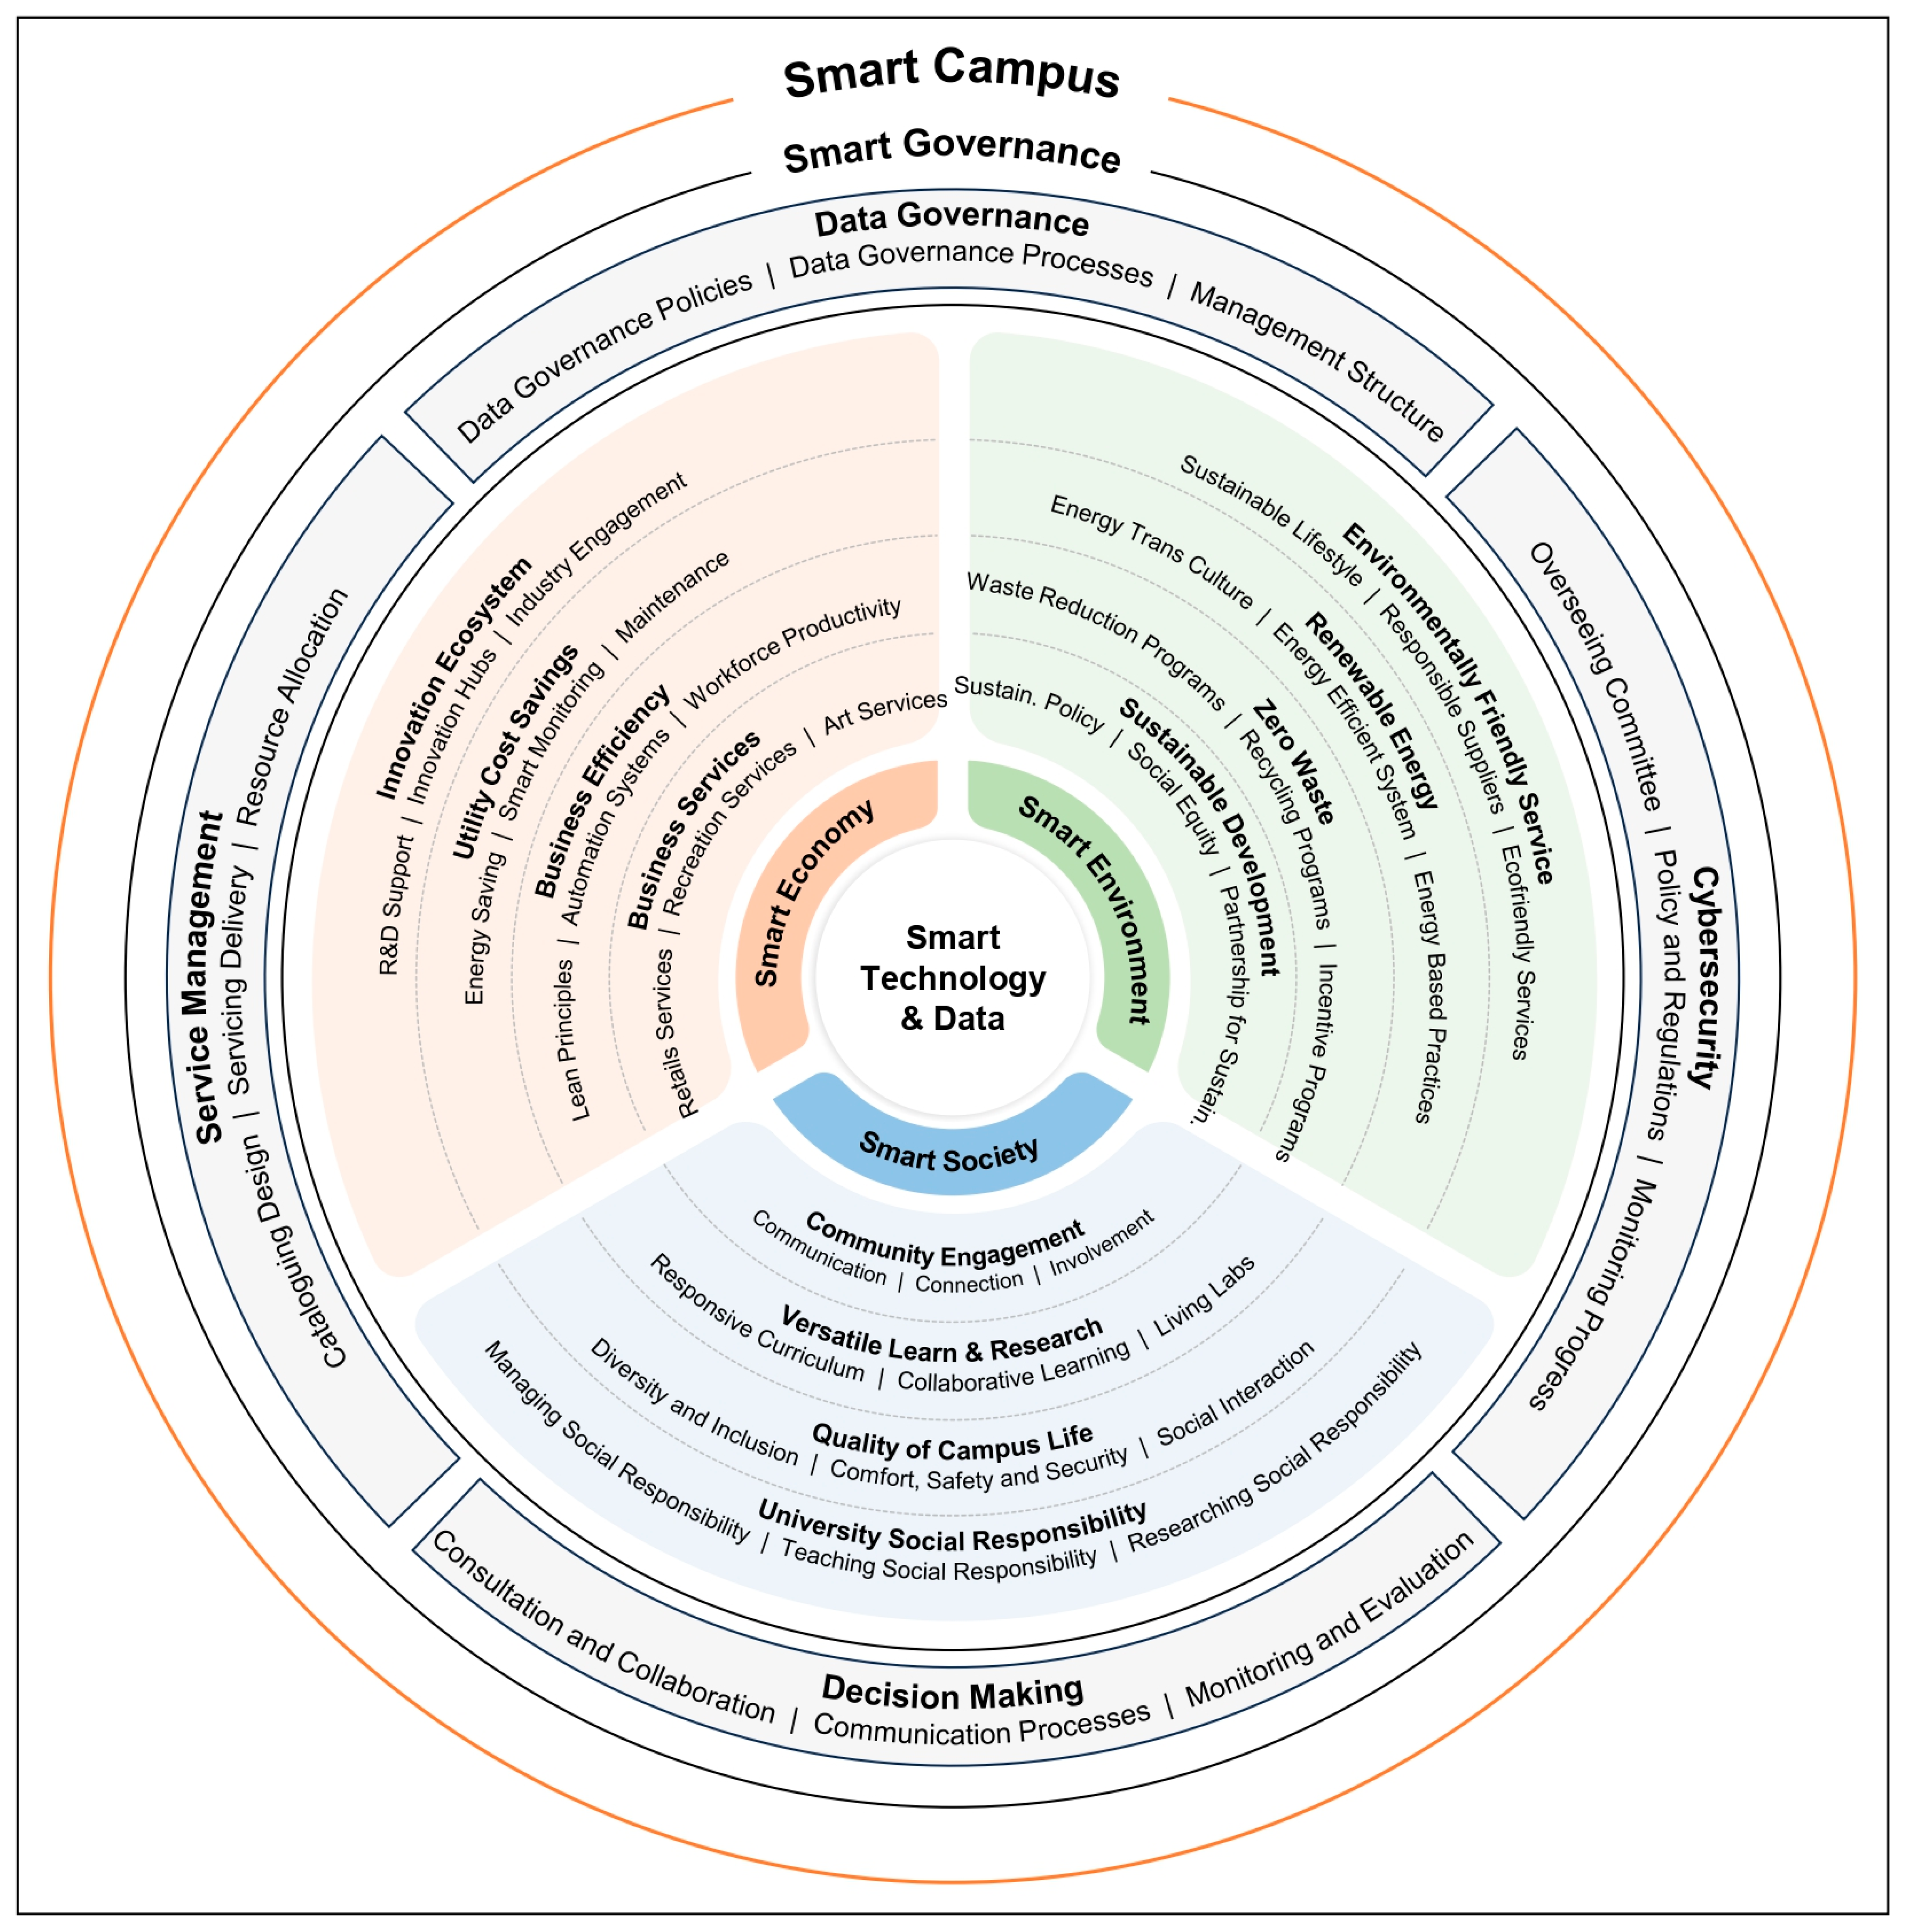
A recently developed smart campus assessment framework [14] builds on this foundation. Each of the four normative dimensions is further divided into their respective four categories, resulting in 16 categories in total, as shown in Figure 1 and Table 1. Additionally, each category includes three indicators, leading to a total of forty-eight indicators for assessment. These indicators are central to the framework, as they represent specific aspects within university settings [25]. The framework provides a hierarchical structure, allowing for a comprehensive and systematic assessment to be conducted.
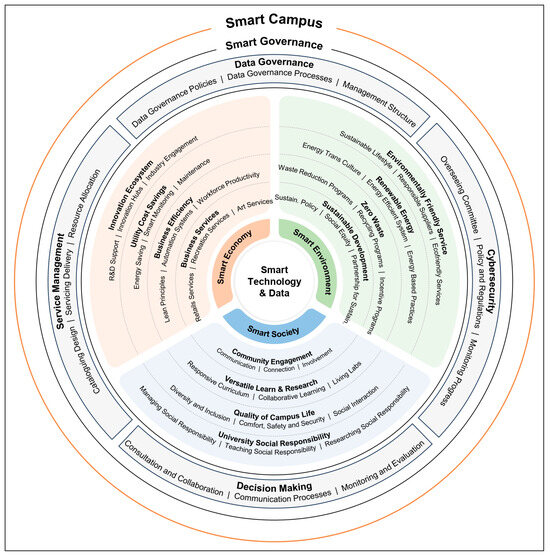
Figure 1.
Smart campus framework, adopted from [14].

Table 1.
Indicators of the smart campus assessment framework, adopted from [14].
There are various techniques for group interaction and data collection, such as the nominal group technique, focus groups, brainstorming, and the Delphi method, which have been used in research [26,27]. Among these, the Delphi method is particularly effective in achieving consensus among experts, making it well-suited for evaluating the components of a framework. This study engages both academic and professional participants in a structured assessment to reach the desired consensus. In this context, building consensus is challenging, as it involves assessing components with limited evidence in the higher education environment, requiring the consolidation of subjective expert judgments [28,29,30,31]. The study aims to validate the smart campus assessment framework through a combination of qualitative and quantitative expert input, representing the first Delphi study conducted on a smart campus.
The development of frameworks for smart campuses is still in its infancy, reflecting the emerging nature of this field. This Delphi study provides a crucial contribution by validating a comprehensive set of indicators, offering a foundational structure for the smart campus framework. These findings represent a significant breakthrough, addressing a critical gap in literature and paving the way for more systematic and evidence-based approaches in the smart campus movement. By establishing these validated indicators, the study supports future research and practical implementations aimed at advancing smart campus design, functionality, and integration within the broader smart city ecosystem.
The questionnaire is designed to gather both qualitative and quantitative data necessary for framework validation. Likert-scale questions are used for quantitative responses, while open-ended questions capture qualitative insights [27,32]. The comprehensive questionnaire consists of 61 questions divided into three sections, addressing the dimensions, categories, and indicators of the framework. The questionnaire design follows a pattern wherein each dimension is covered by one Likert-scale question and two open-ended questions. The 16 categories are assessed through four Likert-scale questions (grouped by dimensions) and eight open-ended questions. The 48 indicators are examined using 16 Likert-scale questions (grouped by 16 categories) and 32 open-ended questions. The final question invites participants to share their overall opinion on the survey, providing valuable feedback for further improvement and refinement of the framework.
To achieve consensus, the study employed a two-round survey approach designed to engage a diverse and qualified expert panel. The first round aimed to establish this expert group by inviting 1210 global experts with relevant experience in smart campus research to participate. From this outreach, 34 experts completed the questionnaire, meeting the recommended sample size range of 30–50 for heterogeneous expert panels [33,34,35,36]. These 34 respondents, representing various regions and sectors, were then invited to participate in the second round. During this phase, 21 experts provided complete responses, yielding a response rate of 62%. While no specific reasons were identified for the 13 non-responses, it was assumed that the decision not to participate further was based on individual choice. This iterative process ensured a robust panel for validating the indicators, which contributed to achieving consensus and advancing the smart campus framework.
Both qualitative and quantitative methods were used to analyze the data, measuring central tendency (mean, median, mode) and dispersion (standard deviation, interquartile range). On the other hand, the consensus level is commonly expressed as the ‘percentage of agreement’ [37,38]. Interestingly, the 70% consensus level on the framework was reached in the first round. While the data were largely positive, some experts suggested improvements in the questionnaire’s navigation and access to information. These refinements were implemented in the second round, leading to an even stronger consensus and ultimately validating the framework. The ‘eyeball’ technique [39] was used to summarize the experts’ comments in the open-ended questions.
The study demonstrates that the smart campus assessment framework is a robust tool for managing the growing influence of AI in universities. The subsequent sections will cover the methodology, results, discussions, and conclusion.
2. Research Design
2.1. Survey Questionnaire
The questionnaire was meticulously designed to gather in-depth insights into the smart campus assessment framework, integrating both qualitative and quantitative data. It was organized into three key sections corresponding to the framework’s components: dimensions, categories, and indicators. The primary objective was to assess whether expert consensus could be achieved on the framework. Participants were asked to rate the importance of each of the 68 components, comprising four dimensions, 16 categories, and 48 indicators. To ensure a holistic understanding, each closed-ended question was complemented by two open-ended questions, allowing participants to provide additional comments, clarifications, or feedback as necessary [31].
To capture both types of data, the questionnaire utilized a combination of Likert-scale questions and open-ended responses. The Likert-scale questions assessed the suitability and adequacy of the recommended dimensions, categories, and indicators. This approach enabled an evaluation of the consensus level among experts by calculating mean scores. The open-ended questions, in contrast, sought to understand the rationale behind the experts’ ratings and invited suggestions for renaming or adding new components to the framework [29,38,40].
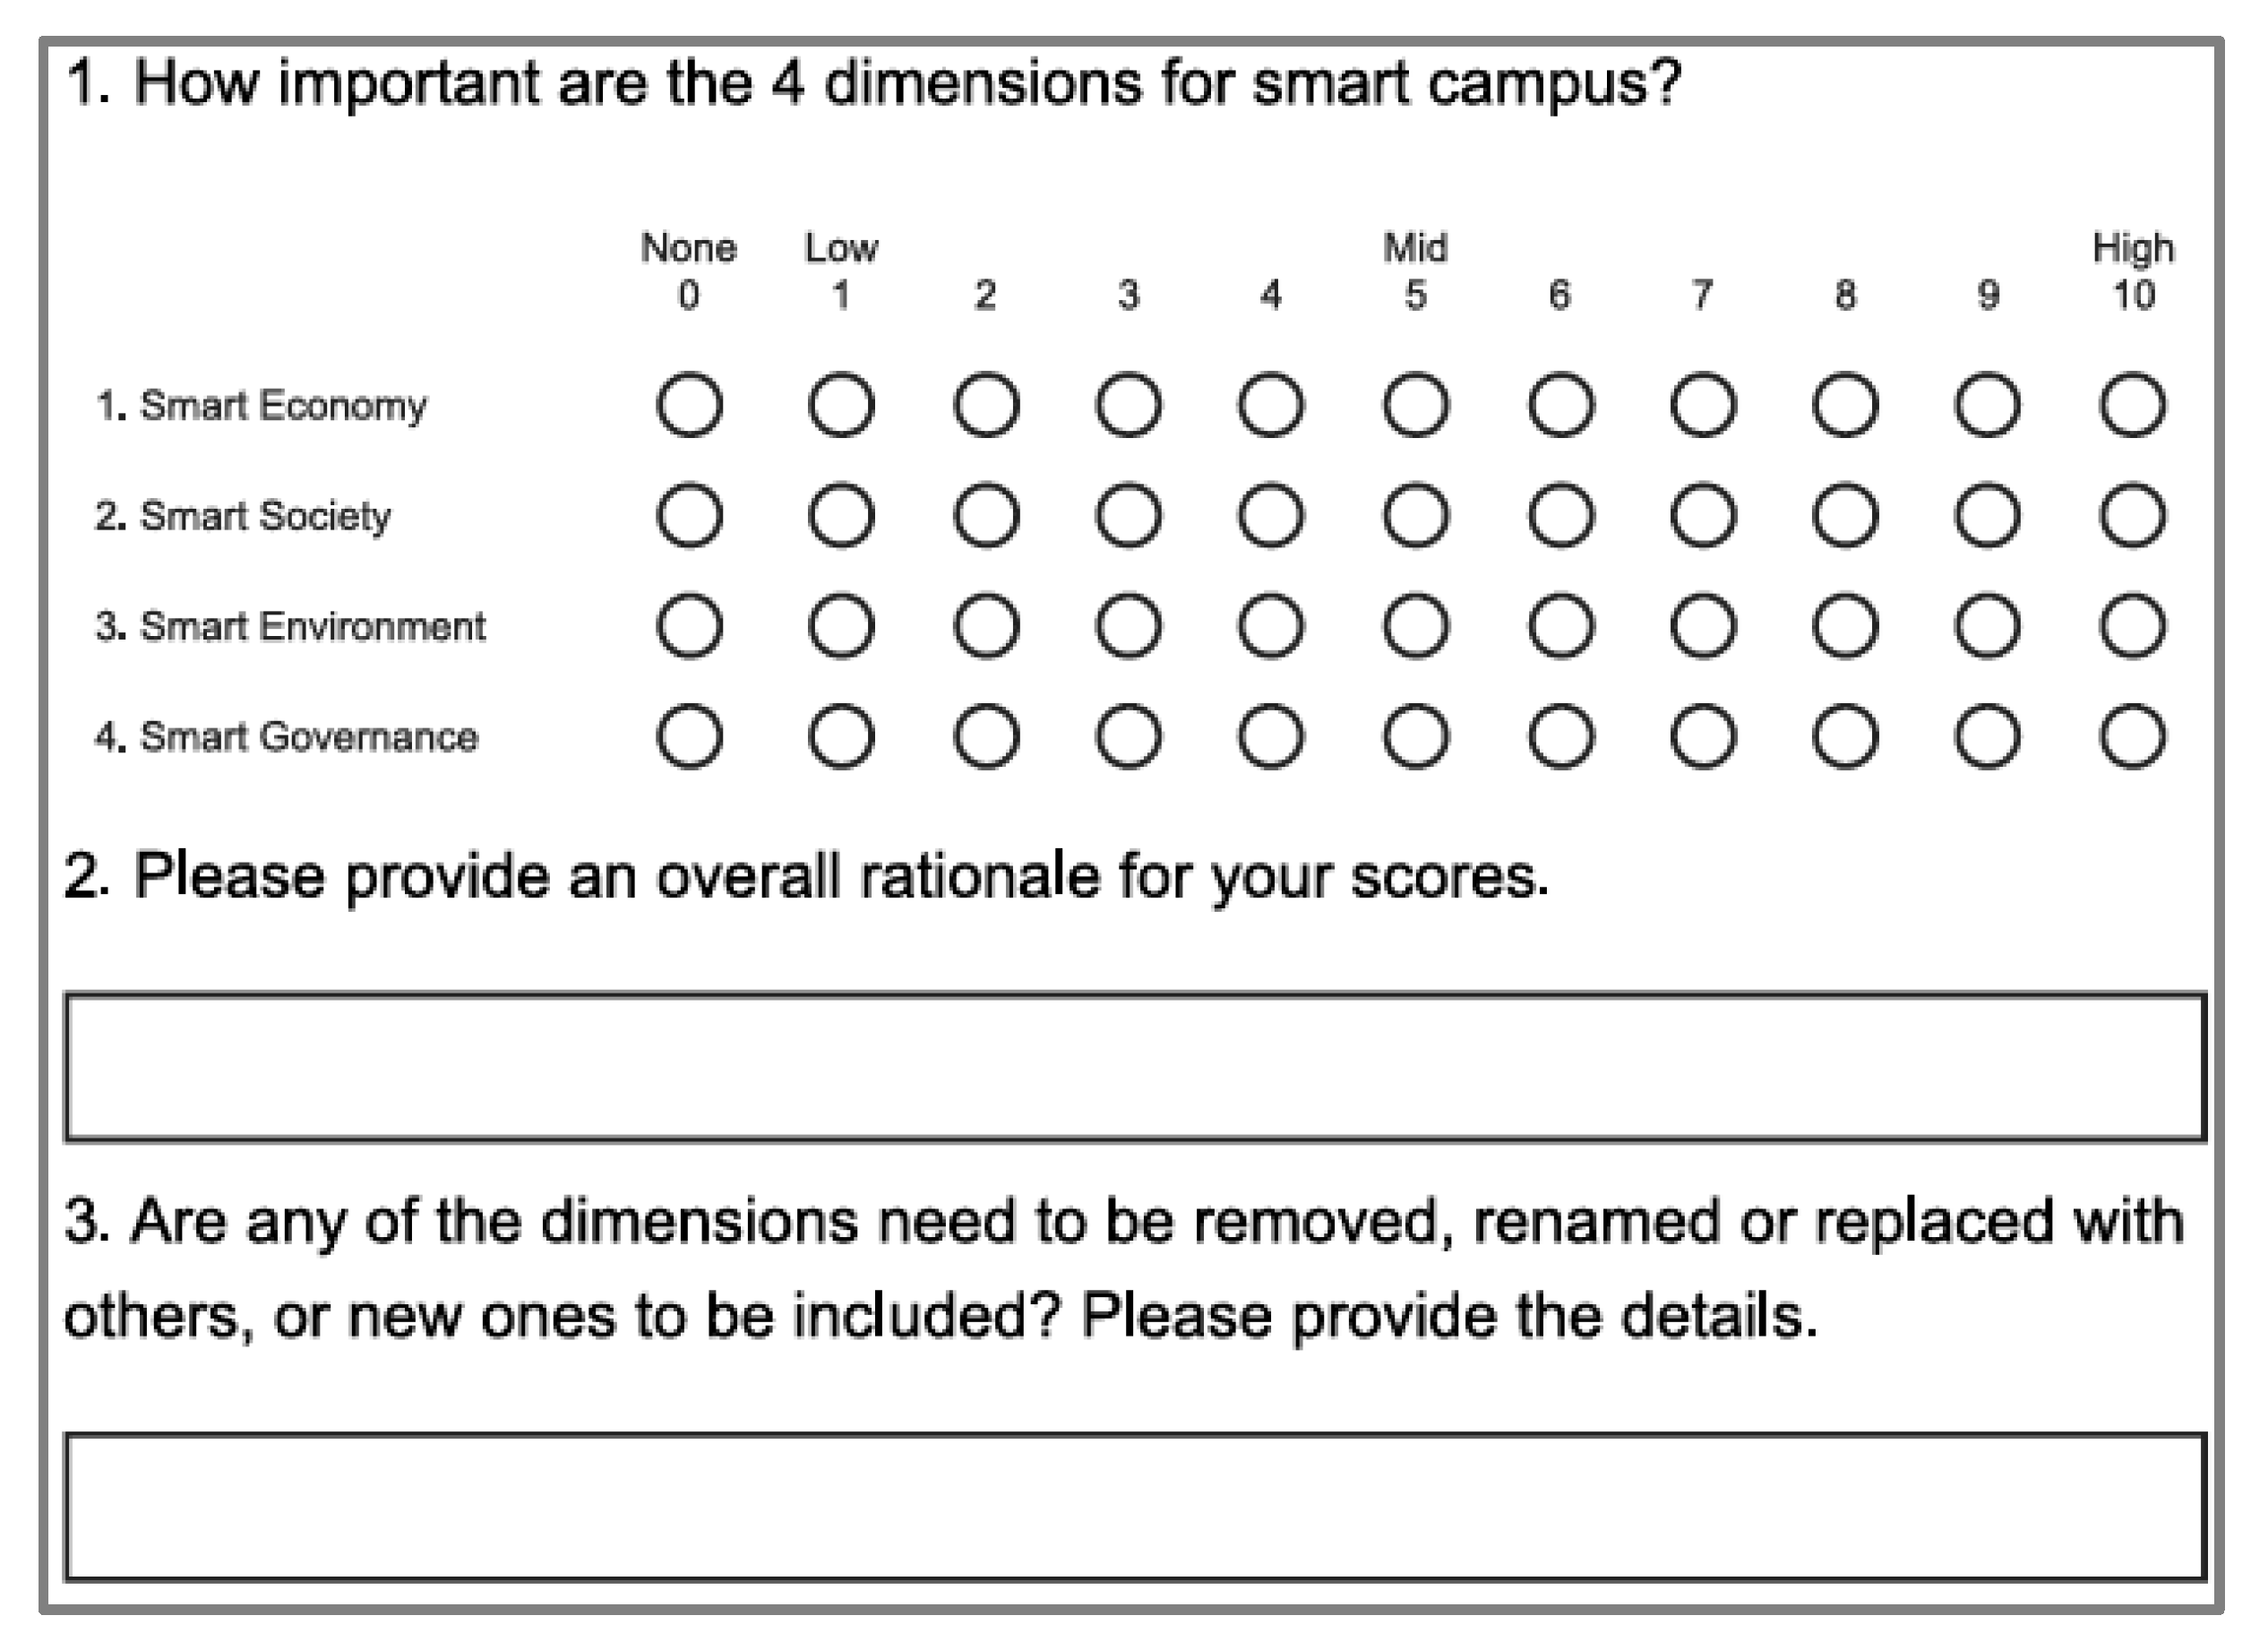
An 11-point Likert scale (ranging from 0—none to 10—high) was used to give participants a wider range of selection options, improving the precision of responses. This scale facilitated reporting and allowed for multi-category analysis of consensus levels (0–2: strongly disagree; 3–4: disagree; 5: neutral; 6–7: agree; 8–10: strongly agree). Figure 2 below illustrates a typical example of the quantitative and qualitative questions included in the questionnaire. This example focuses on the section of four dimensions and follows the same structure for the 16 categories and 48 indicators, ensuring consistency across all components of the framework.

Figure 2.
Sample questions of the survey.
2.2. Delphi Study
The Delphi study is argued to be used for the first time in research on smart campuses. It promotes consensus by engaging experts in a structured, anonymous feedback process. Each round involves questionnaires based on previous results and gathered information [41,42,43]. The Delphi technique’s strength lies in integrating qualitative and quantitative data into the decision-making [44,45]. As a systematic approach, it effectively facilitates consensus-building among experts, making it ideal for this study and similar research [29,31].
2.3. Delphi Rounds
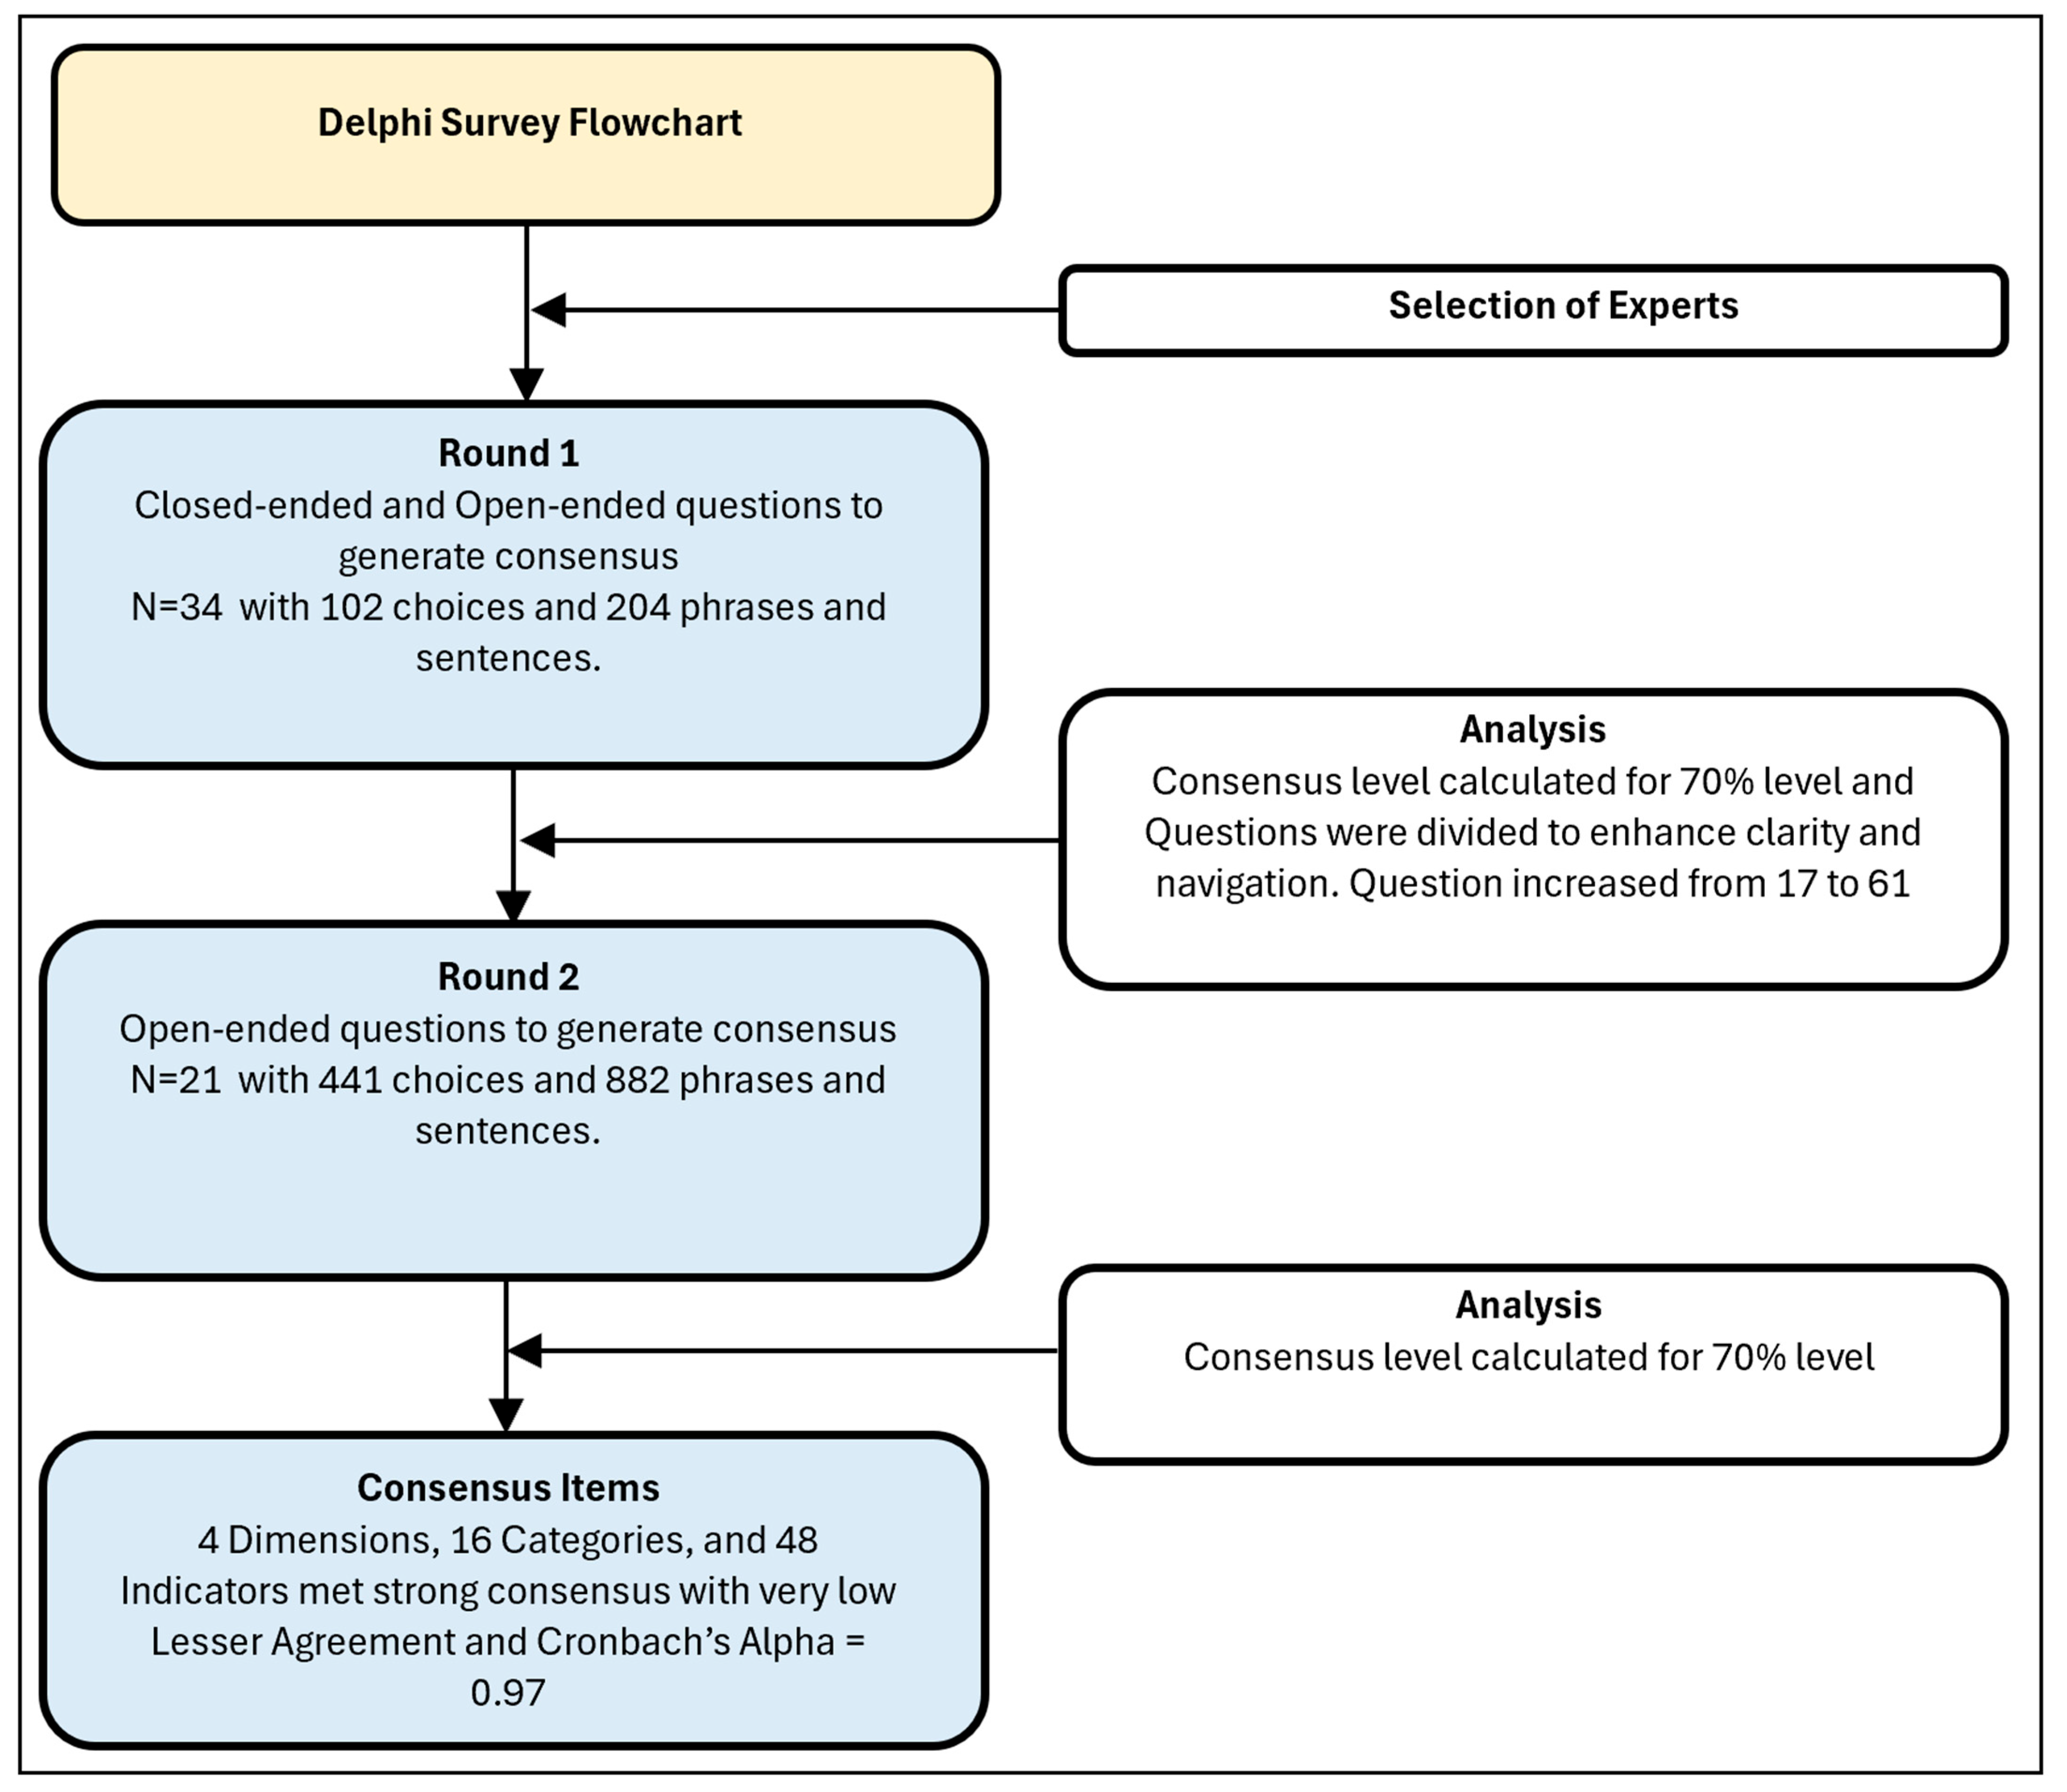
The number of Delphi survey rounds depends on when consensus is achieved among participants [38]. In this study, consensus was reached in the first round, but a second round was conducted to further refine and validate the framework. The second-round questionnaire was enhanced, particularly for the 48 indicators, improving navigation and access to information. This refinement minimized conflicting responses, allowing the study to be successfully completed in two rounds. Figure 3 illustrates the Delphi study process.
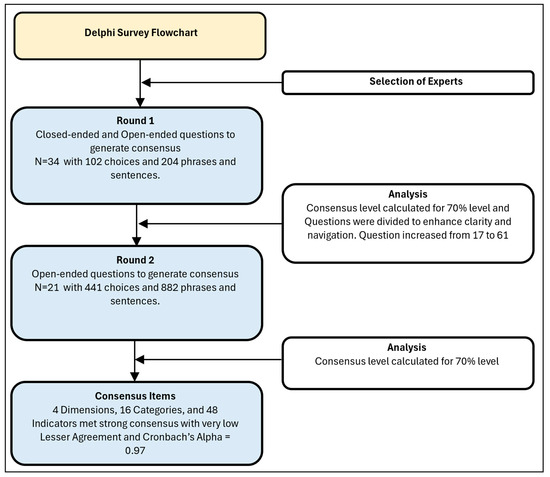
Figure 3.
Delphi study diagram.
2.4. Selection of Experts from Relevant Journals and Organizations
For this Delphi study, potential participants were drawn from authorship of 352 recently published works related to the smart campus concept and the components of the smart campus framework (comprising four normative dimensions, 16 categories, and 48 indicators). This process resulted in identifying 1150 potential participants whose publications were deemed highly relevant to the smart campus framework, as illustrated in Figure 4. The compiled articles encompassed a wide range of topics, including the overarching smart campus concept, the four domains of smart economy, society, environment, and governance, as well as the 48 specific indicators. Additionally, 50 participants were directly selected from organizations such as universities, private companies, and public entities. These individuals were chosen based on their expertise and experience in research and management related to smart campus concepts, ensuring a well-rounded and knowledgeable participant pool.
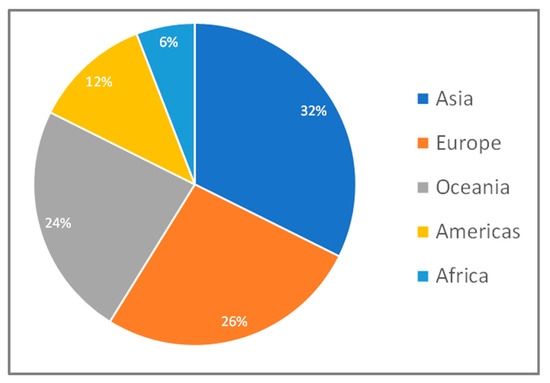
Figure 4.
Round 1 Delphi experts by region.
2.5. Delphi Participants
In May 2024, the initial questionnaire was distributed via Qualtrics to 1210 participants. Response rates were carefully monitored, with a follow-up conducted two weeks later to provide participants with sufficient time for completion. Two reminder emails were sent: the first two weeks after the initial invitation, and the second one week later. These efforts resulted in 34 fully completed survey responses over a two-month period, forming the expert study group. Figure 4 and Figure 5 below depict the geographic and professional distribution of participants, highlighting broad regional representation from the Americas, Europe, Asia, Oceania, and Africa. Asia recorded the highest participation, reflecting a strong focus on smart campus initiatives in the region, while Africa had the lowest participation, corresponding to a relatively lower emphasis on smart campus development. This distribution not only illustrates the global reach of the study but also underscores regional variations in the focus and adoption of smart campus concepts.

Figure 5.
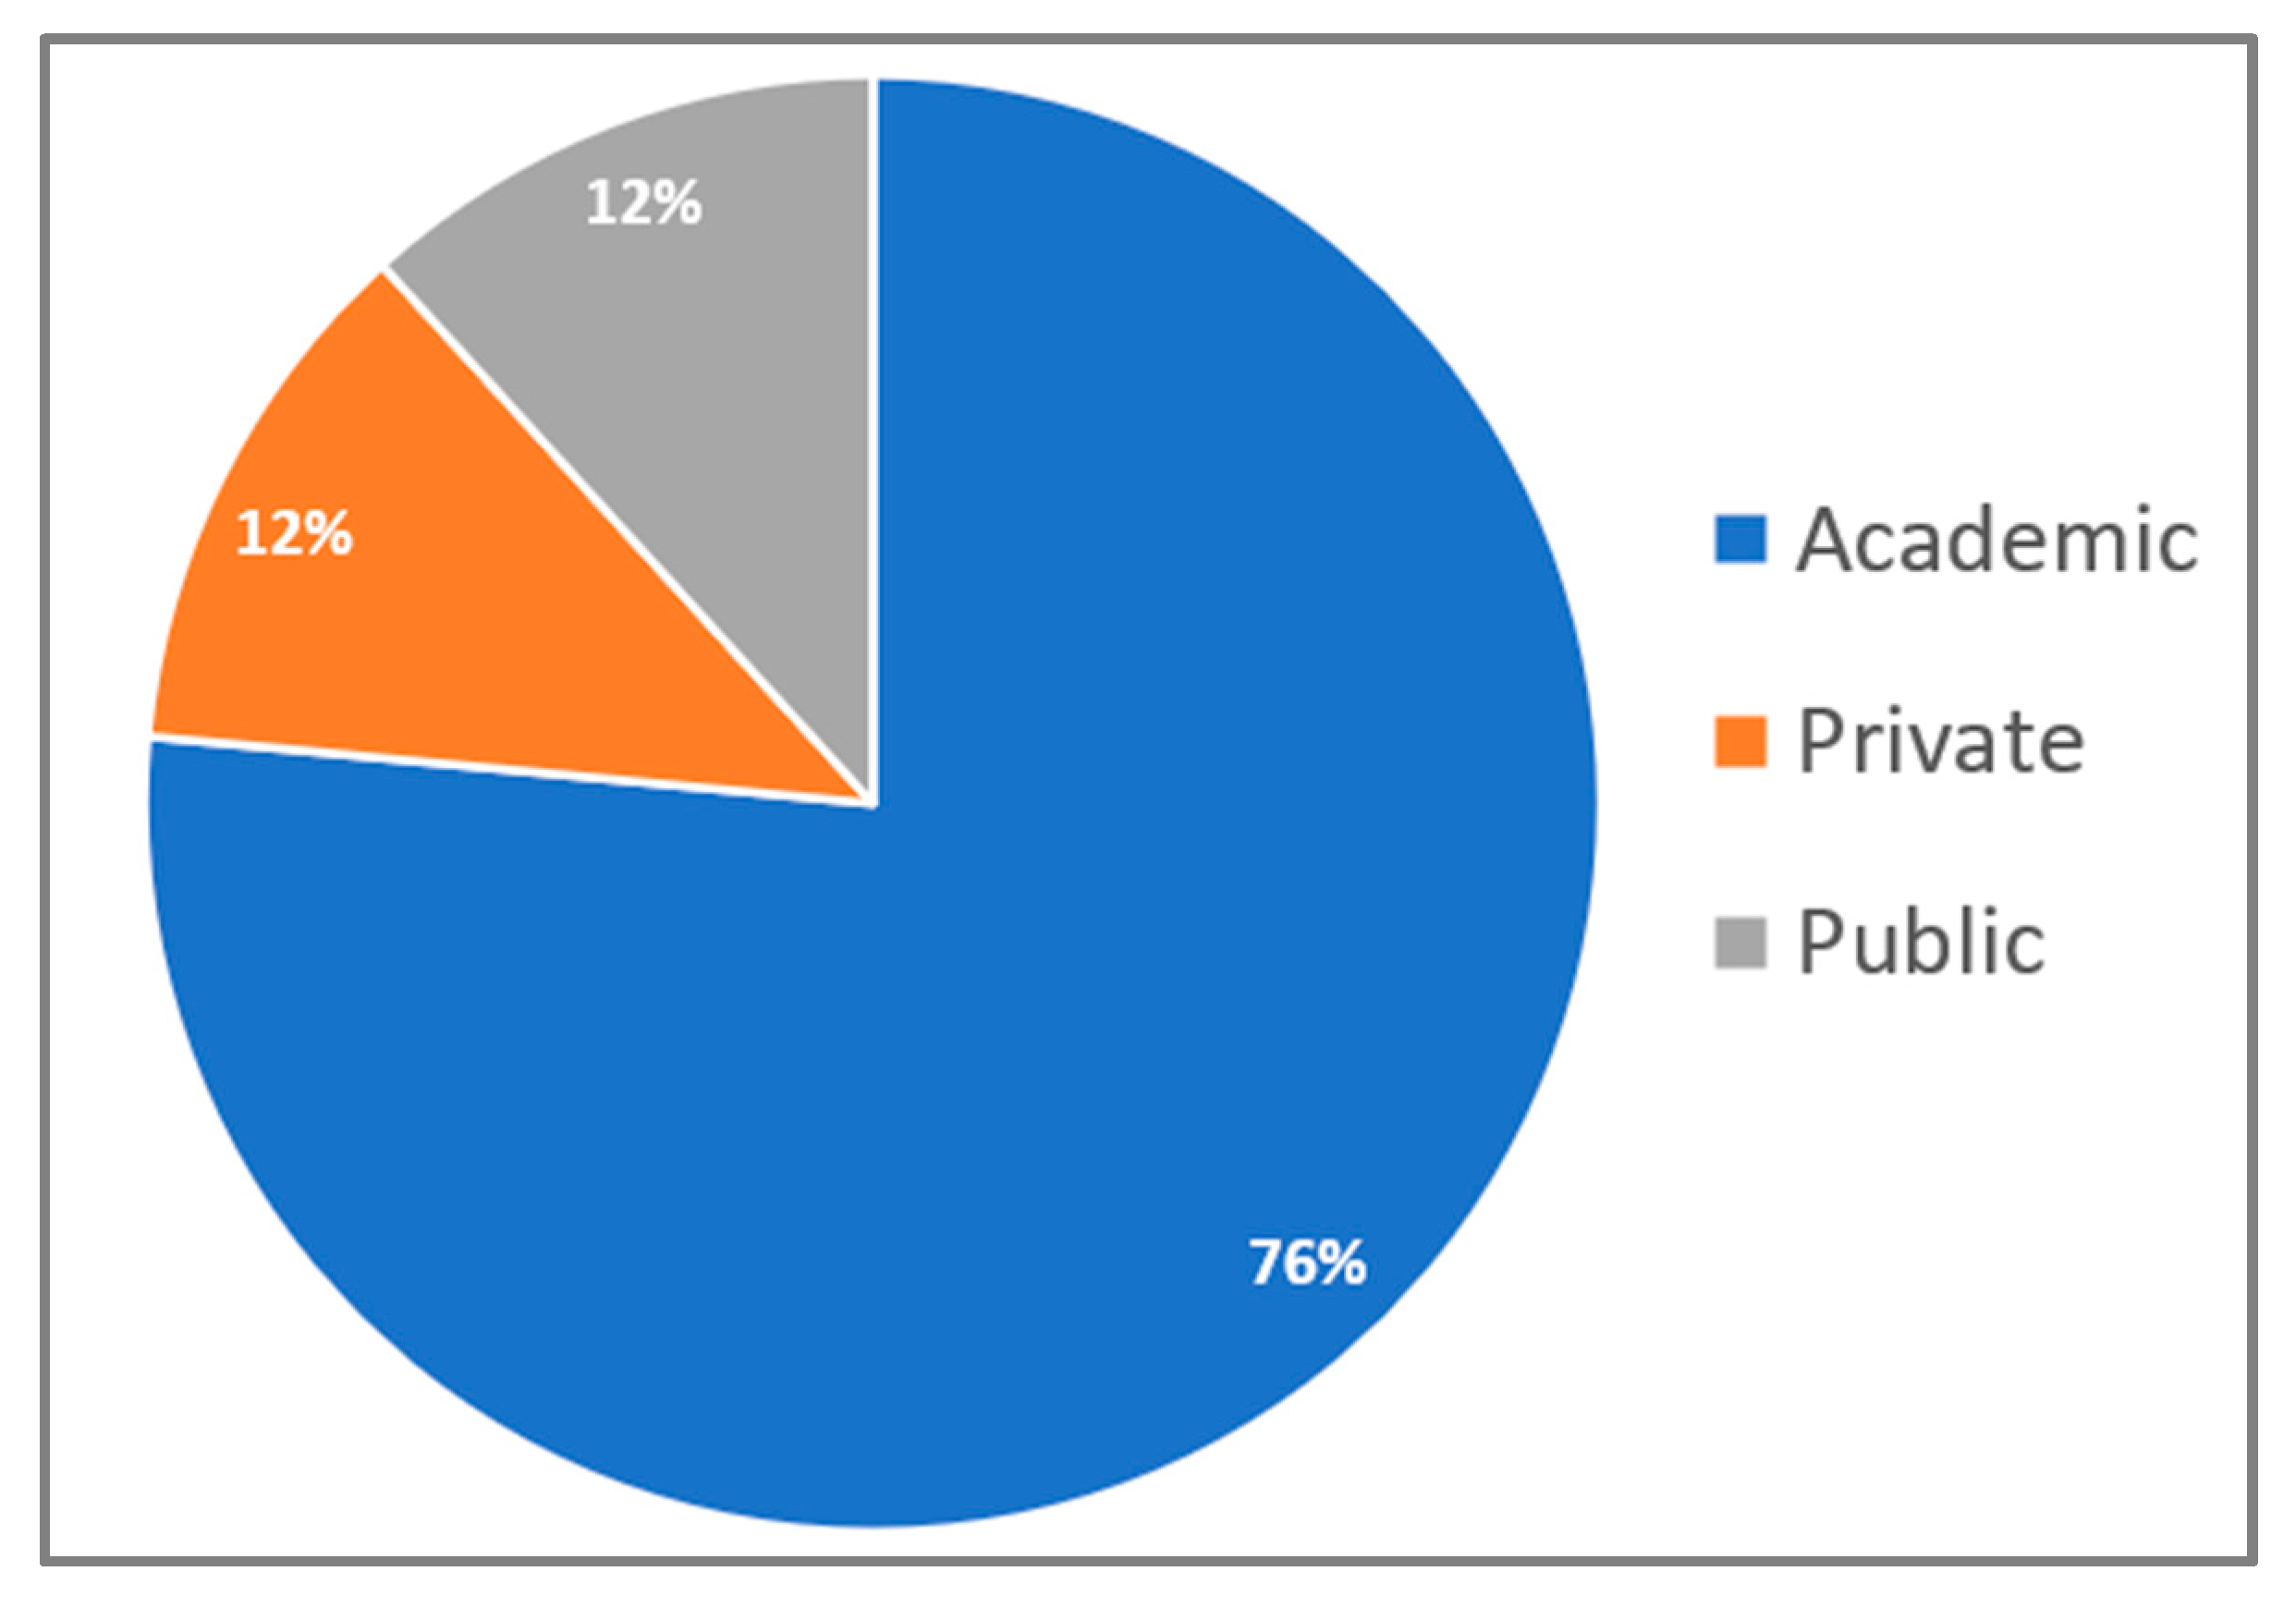
Round 1 Delphi experts by sector.
Figure 5 shows participant distribution across three main sectors: academic, private, and public. The academic sector had the highest representation at 76%, followed by the private sector. The public sector had the smallest presence.
This distribution aligns with the recent rise of the smart campus concept, which has primarily attracted academic research and scholarly interest. Researchers and academics in universities and colleges have been exploring solutions to global challenges in response to the growing influence of AI and IoT. While the private sector has contributed to technology development, it has produced fewer research publications, focusing more on economic opportunities. The public sector, with the least representation, has played a more passive role in research and publications. On average, participants had almost two decades of professional experience, adding substantial expertise to the study.
Table 2 shows the details of the experts under the three sectors: academic, public, and private. The academic sector included universities and colleges, the public sector, on the other hand, included state organizations, and finally, the private sector included all non-government and business organizations. As shown, the professional expertise of the participants spanned a wide range of areas relevant to the smart campus assessment framework. This diversity was complemented by a significant average work experience of 19 years, reflecting a high level of expertise among the respondents. The length of experience ranged from 5 to 50 years, further emphasizing the depth and breadth of knowledge within the expert group.
Table 2.
Salient characteristics of the Delphi experts.
2.6. Statistical Analysis
Data from expert responses were analyzed using qualitative and quantitative methods. Qualitative analysis focused on evaluating expert suggestions and comments regarding potential revisions to the proposed smart campus assessment framework. Quantitative analysis employed statistical methods to assess reliability, internal consistency, and expert agreement levels and measure the central tendency and dispersion of the questionnaire. In the Delphi studies, two key outcomes are typically analyzed: the statistical findings and the consensus levels. Common analytical statistics include measures of central tendency (mean, median, mode) and dispersion (standard deviation, interquartile range). Consensus levels are often defined by the percentage of agreement among experts [37,38].
This study employed an 11-point Likert scale, adhering to recommendations [38,44] that suggest that a standard deviation (SD) of less than 2 among expert scores reflects low dispersion, coupled with a higher mean value indicating strong agreement. While a minimum consensus level of 50% is commonly considered acceptable [33,45], this study adopted a more stringent threshold, targeting a 70% consensus level. This higher benchmark was established to ensure greater reliability and robust quality in the findings.
Calculations for the mean (M), standard deviation (SD), Cronbach’s alpha, and key metrics, such as ‘specific agreement’ (SA), ‘overall agreement’ (OA), ‘lesser agreement’, and the overall 70% consensus level, were performed. The analyses are conducted using the Excel spreadsheet, as shown in Table 3 and Table 4 below.
Table 3.
Analysis spreadsheet.
Table 4.
Analysis spreadsheet overall results.
Qualitative analysis focused on expert feedback from open-ended questions in two main areas: (a) the rationale behind expert scores, as well as suggestions for adding, modifying, or replacing dimensions, categories, and indicators, and (b) comments on factors they considered important for a smart campus. The ‘eyeball technique’ [39] was used to summarize these qualitative responses in gauging how close they are for consensus to be reached.
3. Analysis and Results
3.1. Round 1 Results
3.1.1. Responses to Dimensions
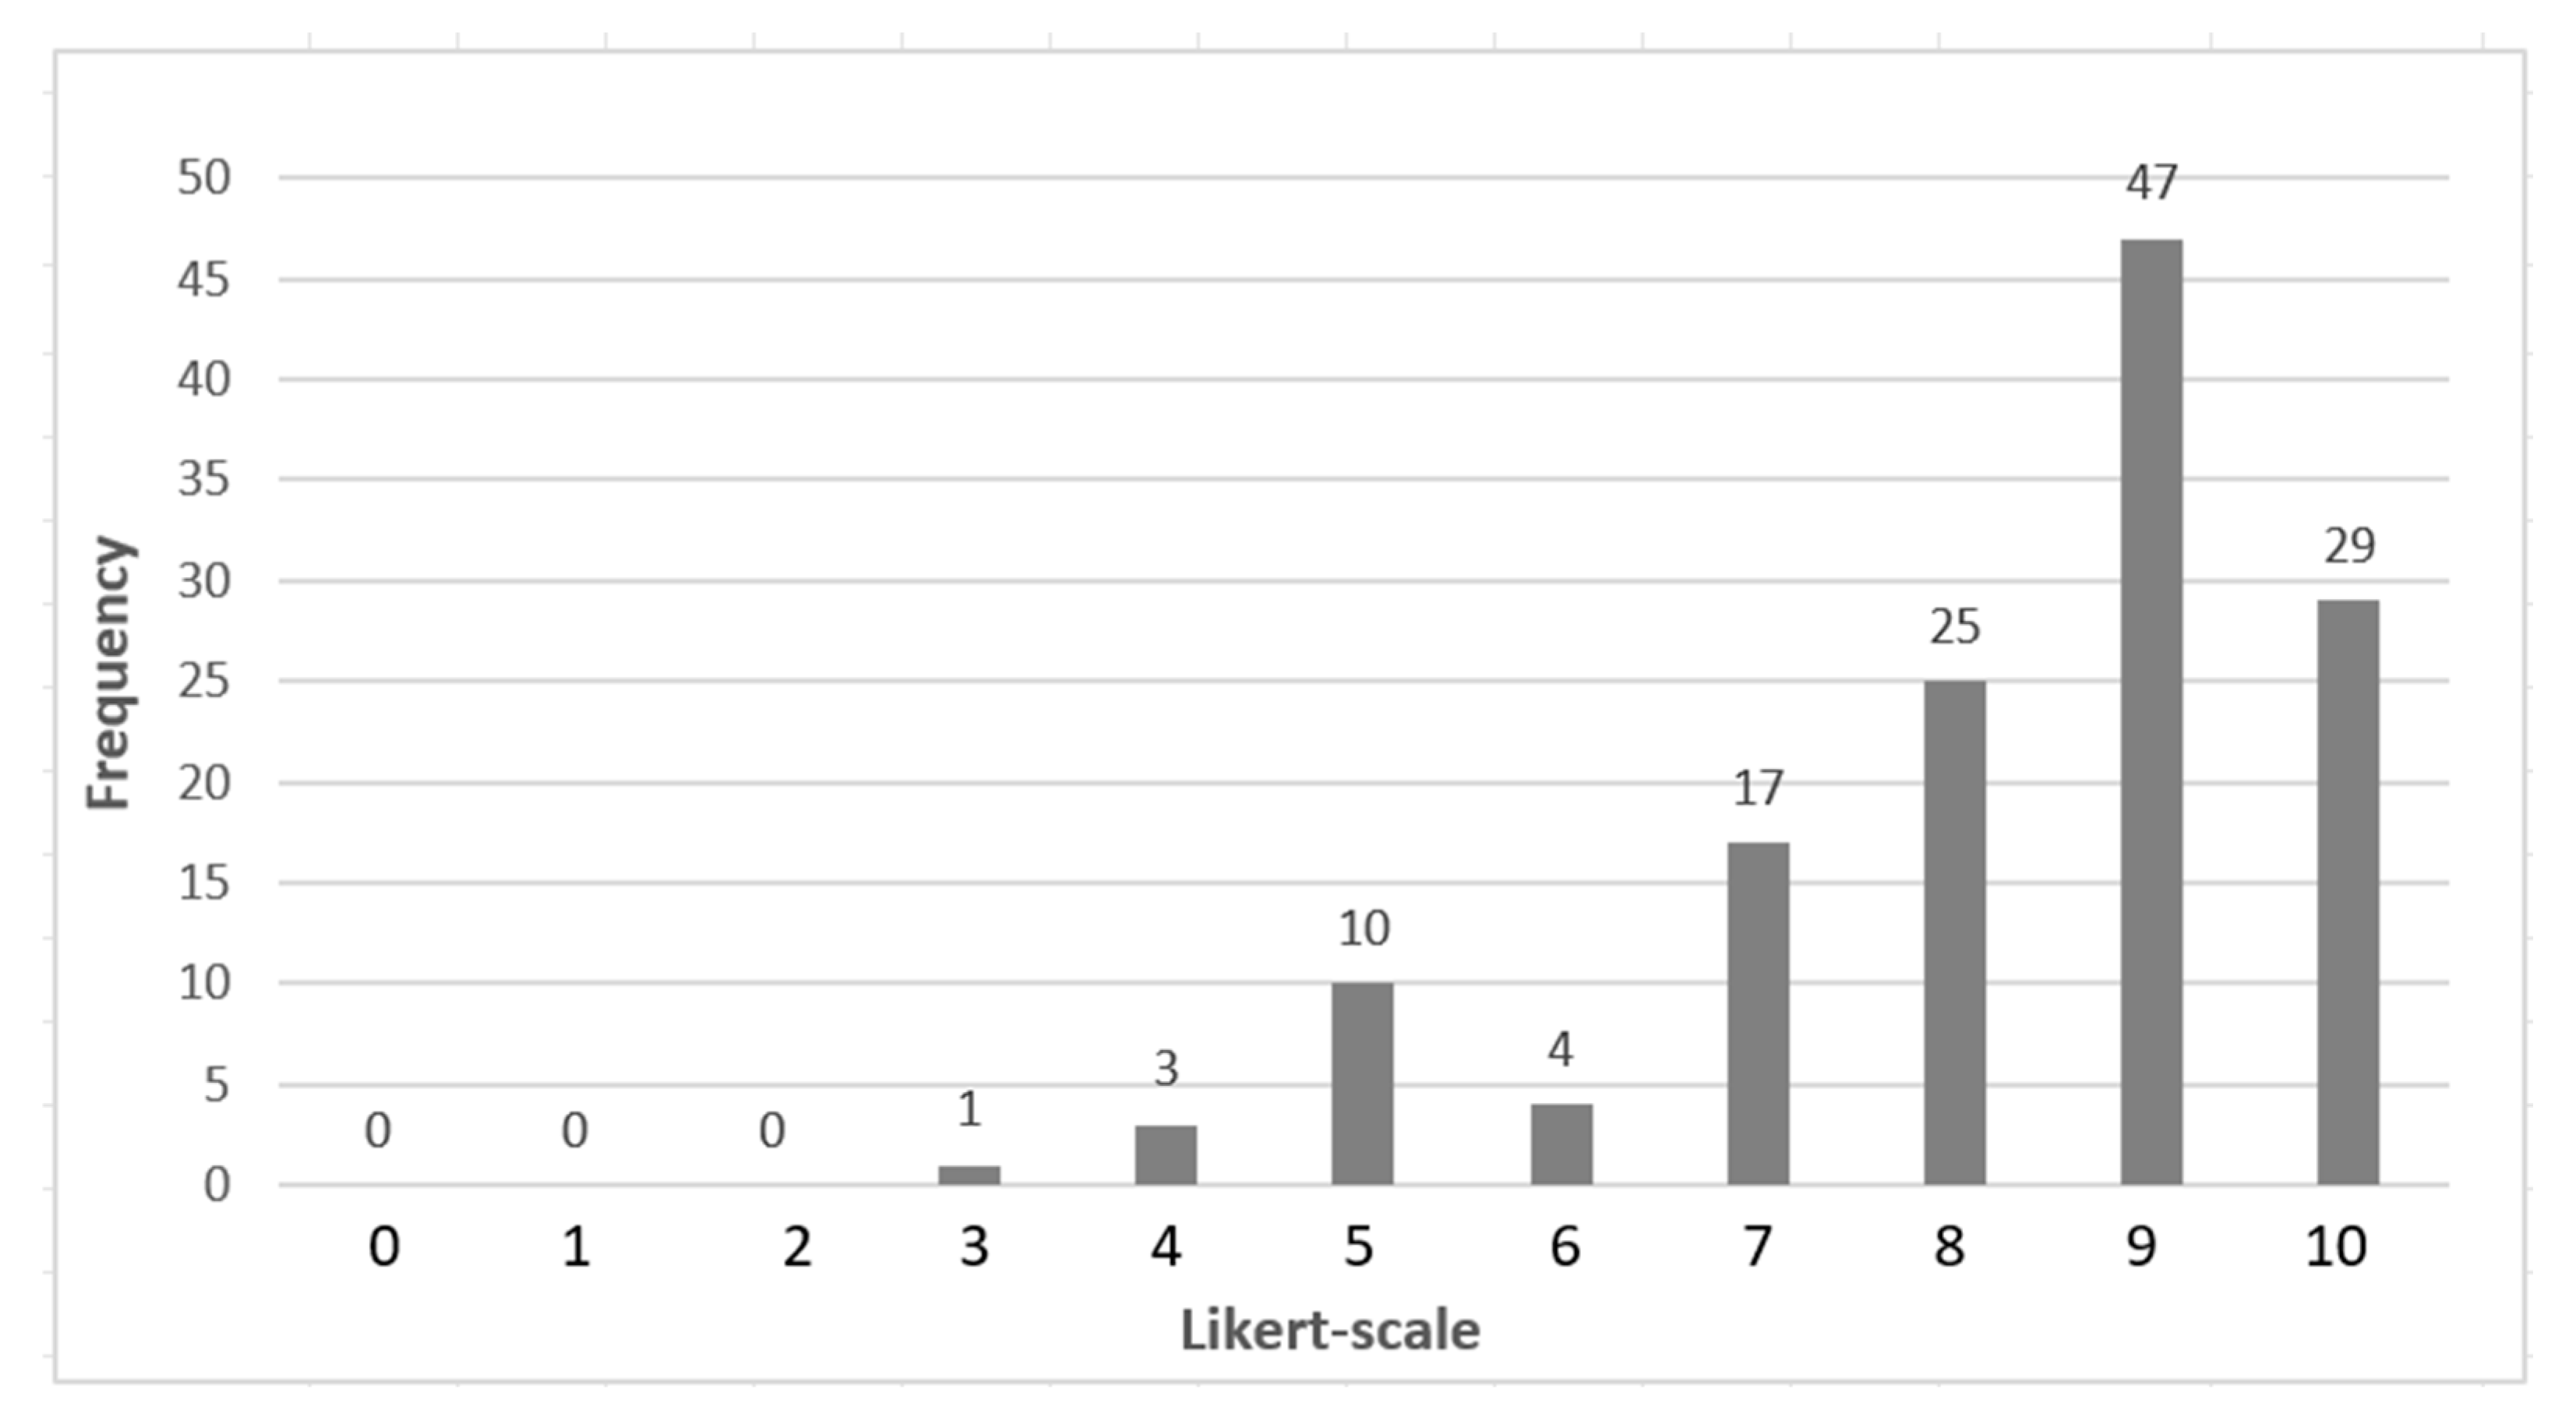
In Round 1, 34 experts provided a total of 136 scores across the four dimensions of the framework. The results indicated a high level of agreement, as shown in Table 5 and Figure 6 below. Only four scores fell below 5, while ten were at the midpoint of 5. Notably, 89% of scores (121) were above the midpoint, indicating a strong consensus among the experts.
Table 5.
Round 1 dimension data.
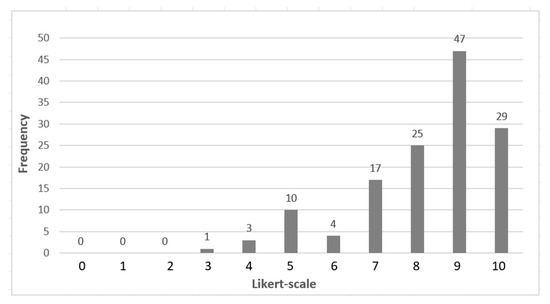
Figure 6.
Round 1 frequency of choices on dimensions.
Open-Ended Responses on Dimensions: The two open-ended questions on the four dimensions revealed strong agreement among 34 participants, with some (9%) reservations about including the Smart Economy dimension.
Overwhelming agreement examples included the following: “All four dimensions are interconnected”. “The key parameters for each dimension have been clearly identified”. “All dimensions are important. Smart economy and governance are essential for sustaining campus operations”. “Smart Society and Smart Governance are catalysts for enabling smart and smarter systems”.
Reserved comment examples included: “If the primary purpose of a university campus isn’t profitability, the Smart Economy dimension is less important compared to the others”. “I’m comfortable with the proposed dimensions, but ‘Smart Economy’ might seem less fitting in a university context”. “I’ve never encountered the term ‘Smart Society’ before”. “Looking at the aspects under business services, I don’t see a clear business link; they seem more aligned with quality of campus life”.
3.1.2. Responses to Categories
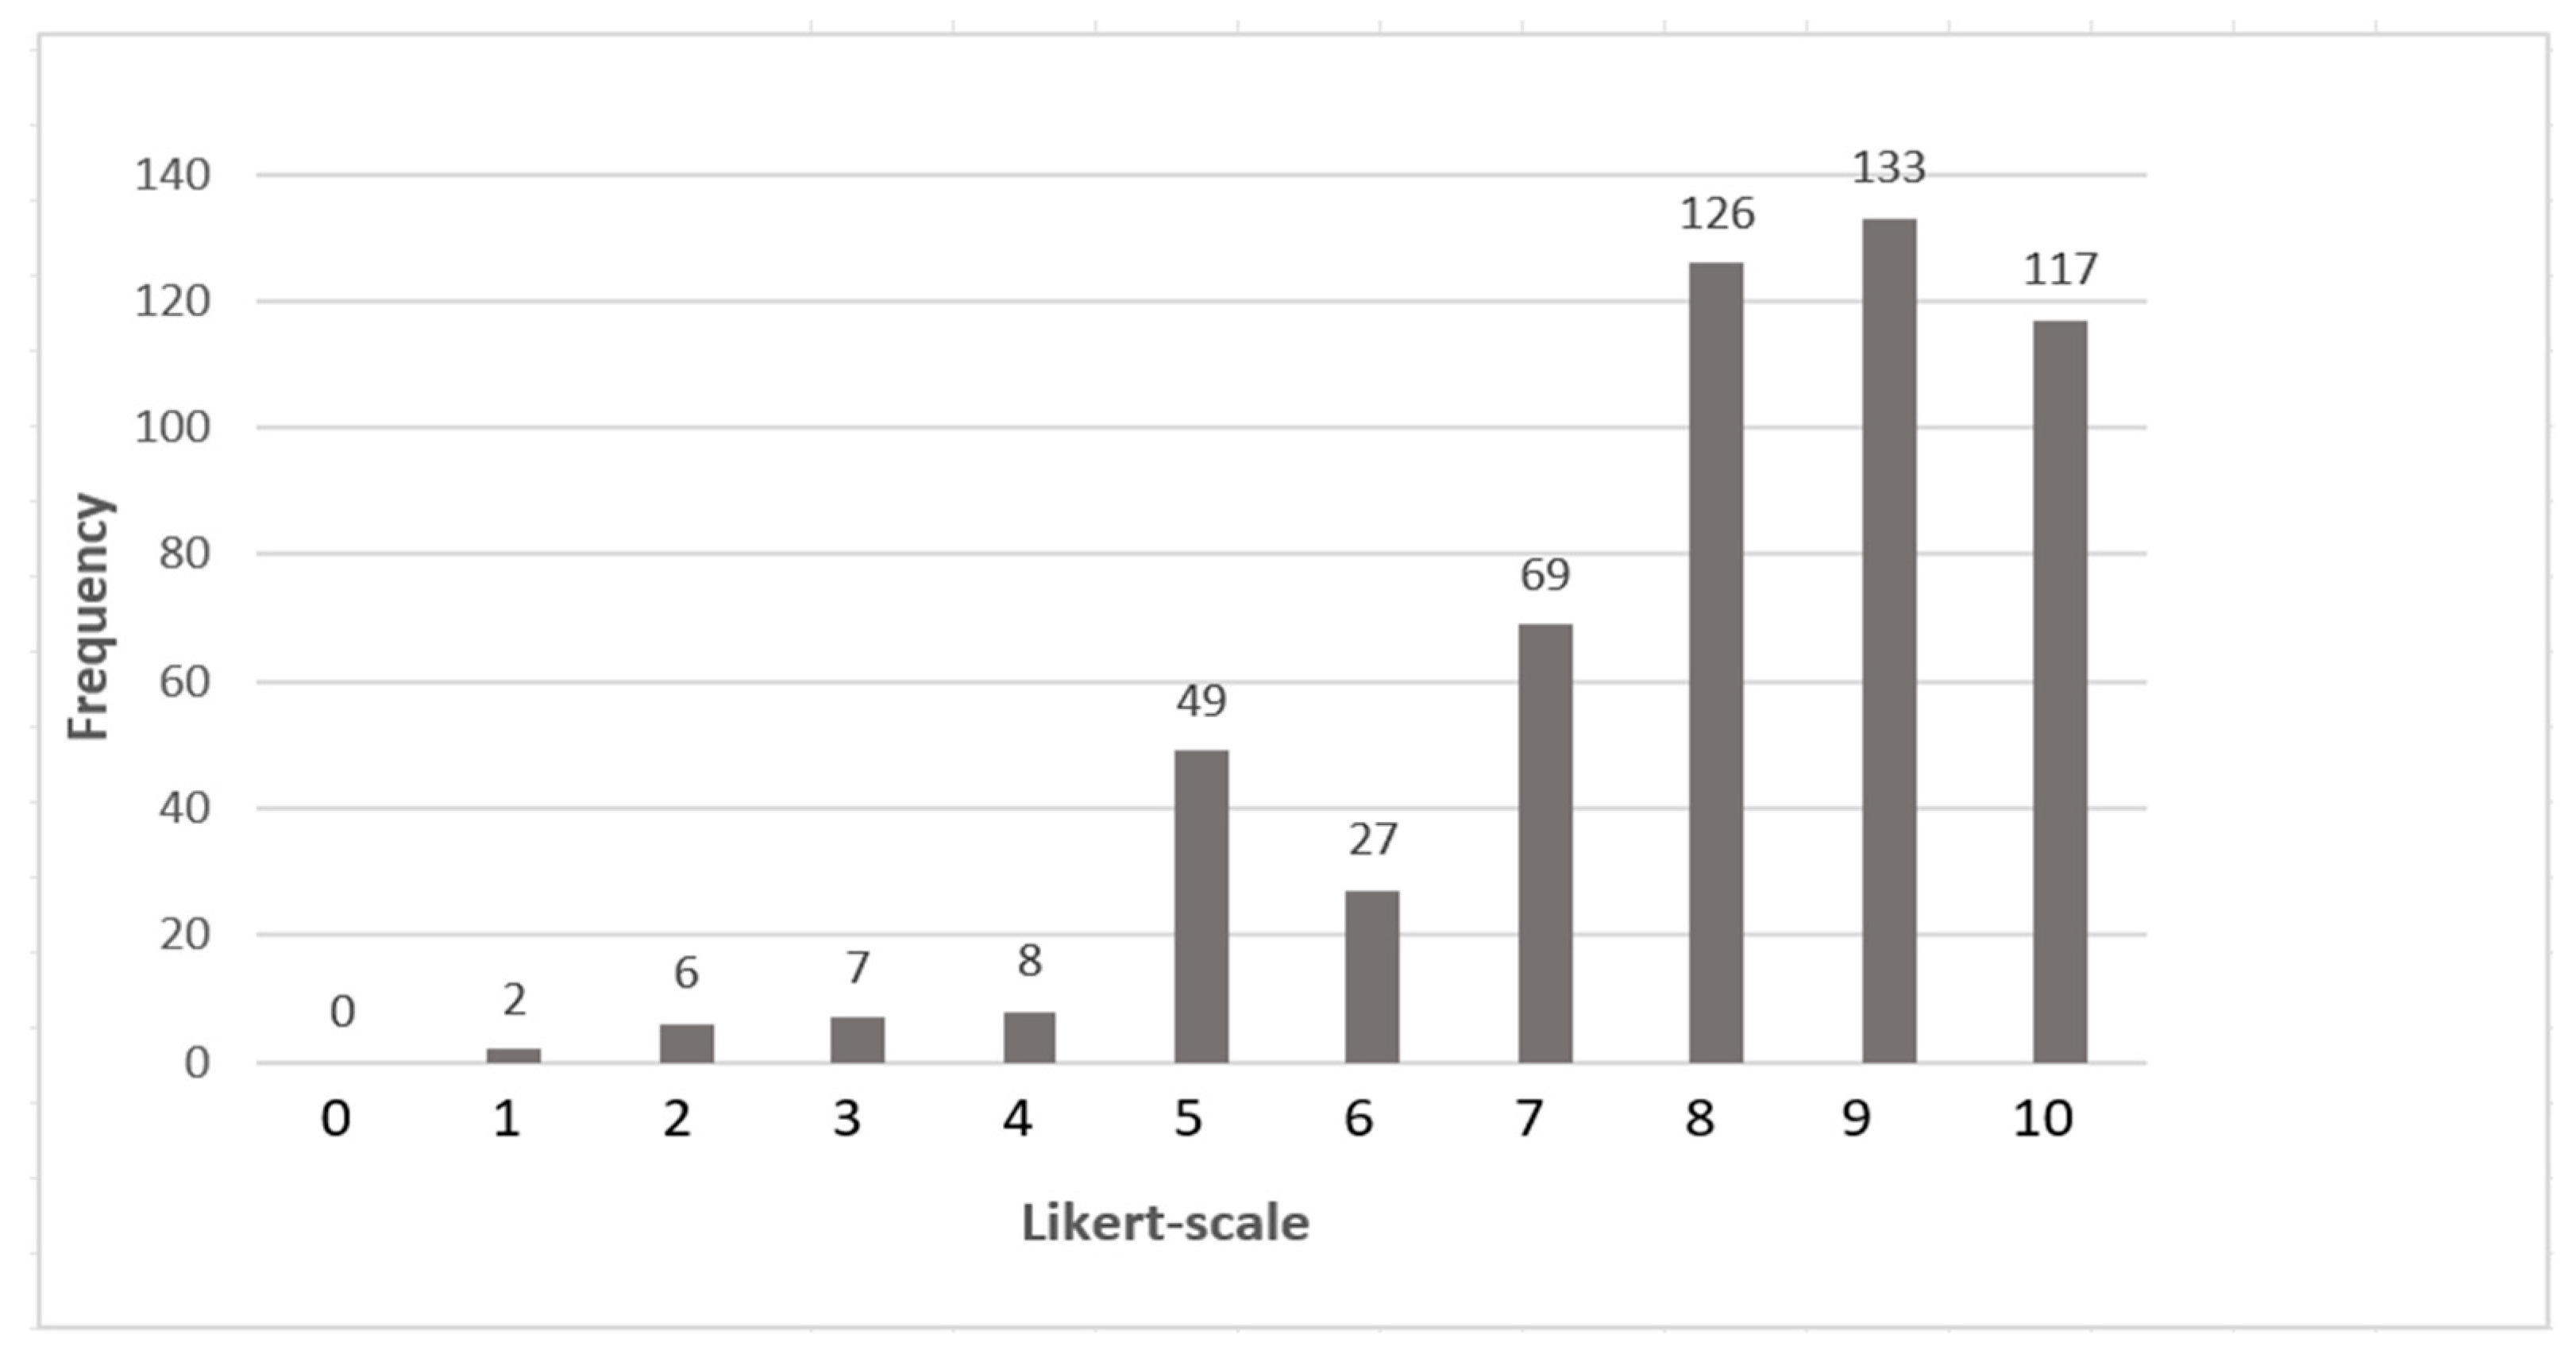
A total of 544 scores were recorded for the 16 categories, indicating strong agreement among participants (Table 6 and Figure 7). Only 23 scores fell below 5, with 49 at the midpoint of 5. Notably, 87% of the scores (472) were above the midpoint, demonstrating high consensus among the experts. It was noted that three out of sixteen categories had higher standard deviation, which is one of the factors that contributed to the need to perform the second round. These included Innovation Ecosystem (SD = 2.79), Quality of Campus Life (SD = 2.13), and Zero Waste (SD = 2.15).
Table 6.
Round 1 category data.

Figure 7.
Round 1 frequency of choices on categories.
Open-ended responses on categories: The two open-ended questions regarding the 16 categories revealed strong overall agreement among the 34 participants. As with the dimensions, a small minority (5 out of 34, or 15%) expressed reservations, particularly regarding the inclusion of Smart Economy categories in a university setting. Below are typical responses:
Agreement examples include the following: “Most of the indicators encourage universities to be responsible and mindful of their societal role by building a smart campus infrastructure”. “In my view, all categories are important, though their relevance may depend on the specific university context”. “There needs to be a paradigm shift towards adopting ‘Smart Concepts’ in all areas of human endeavor”. “The overall framework is impressive and highly comprehensive”.
Reserved comment examples include the following: “A university is not a business; it is a hub for knowledge development, and research is inherently unpredictable. Universities shouldn’t be managed like businesses”. “For me, not all aspects are equally important”. “Some categories need more specificity—‘Sustainable Development’ feels too broad”. “I don’t believe Recreation Services or Art Services should be classified under Smart Economy”.
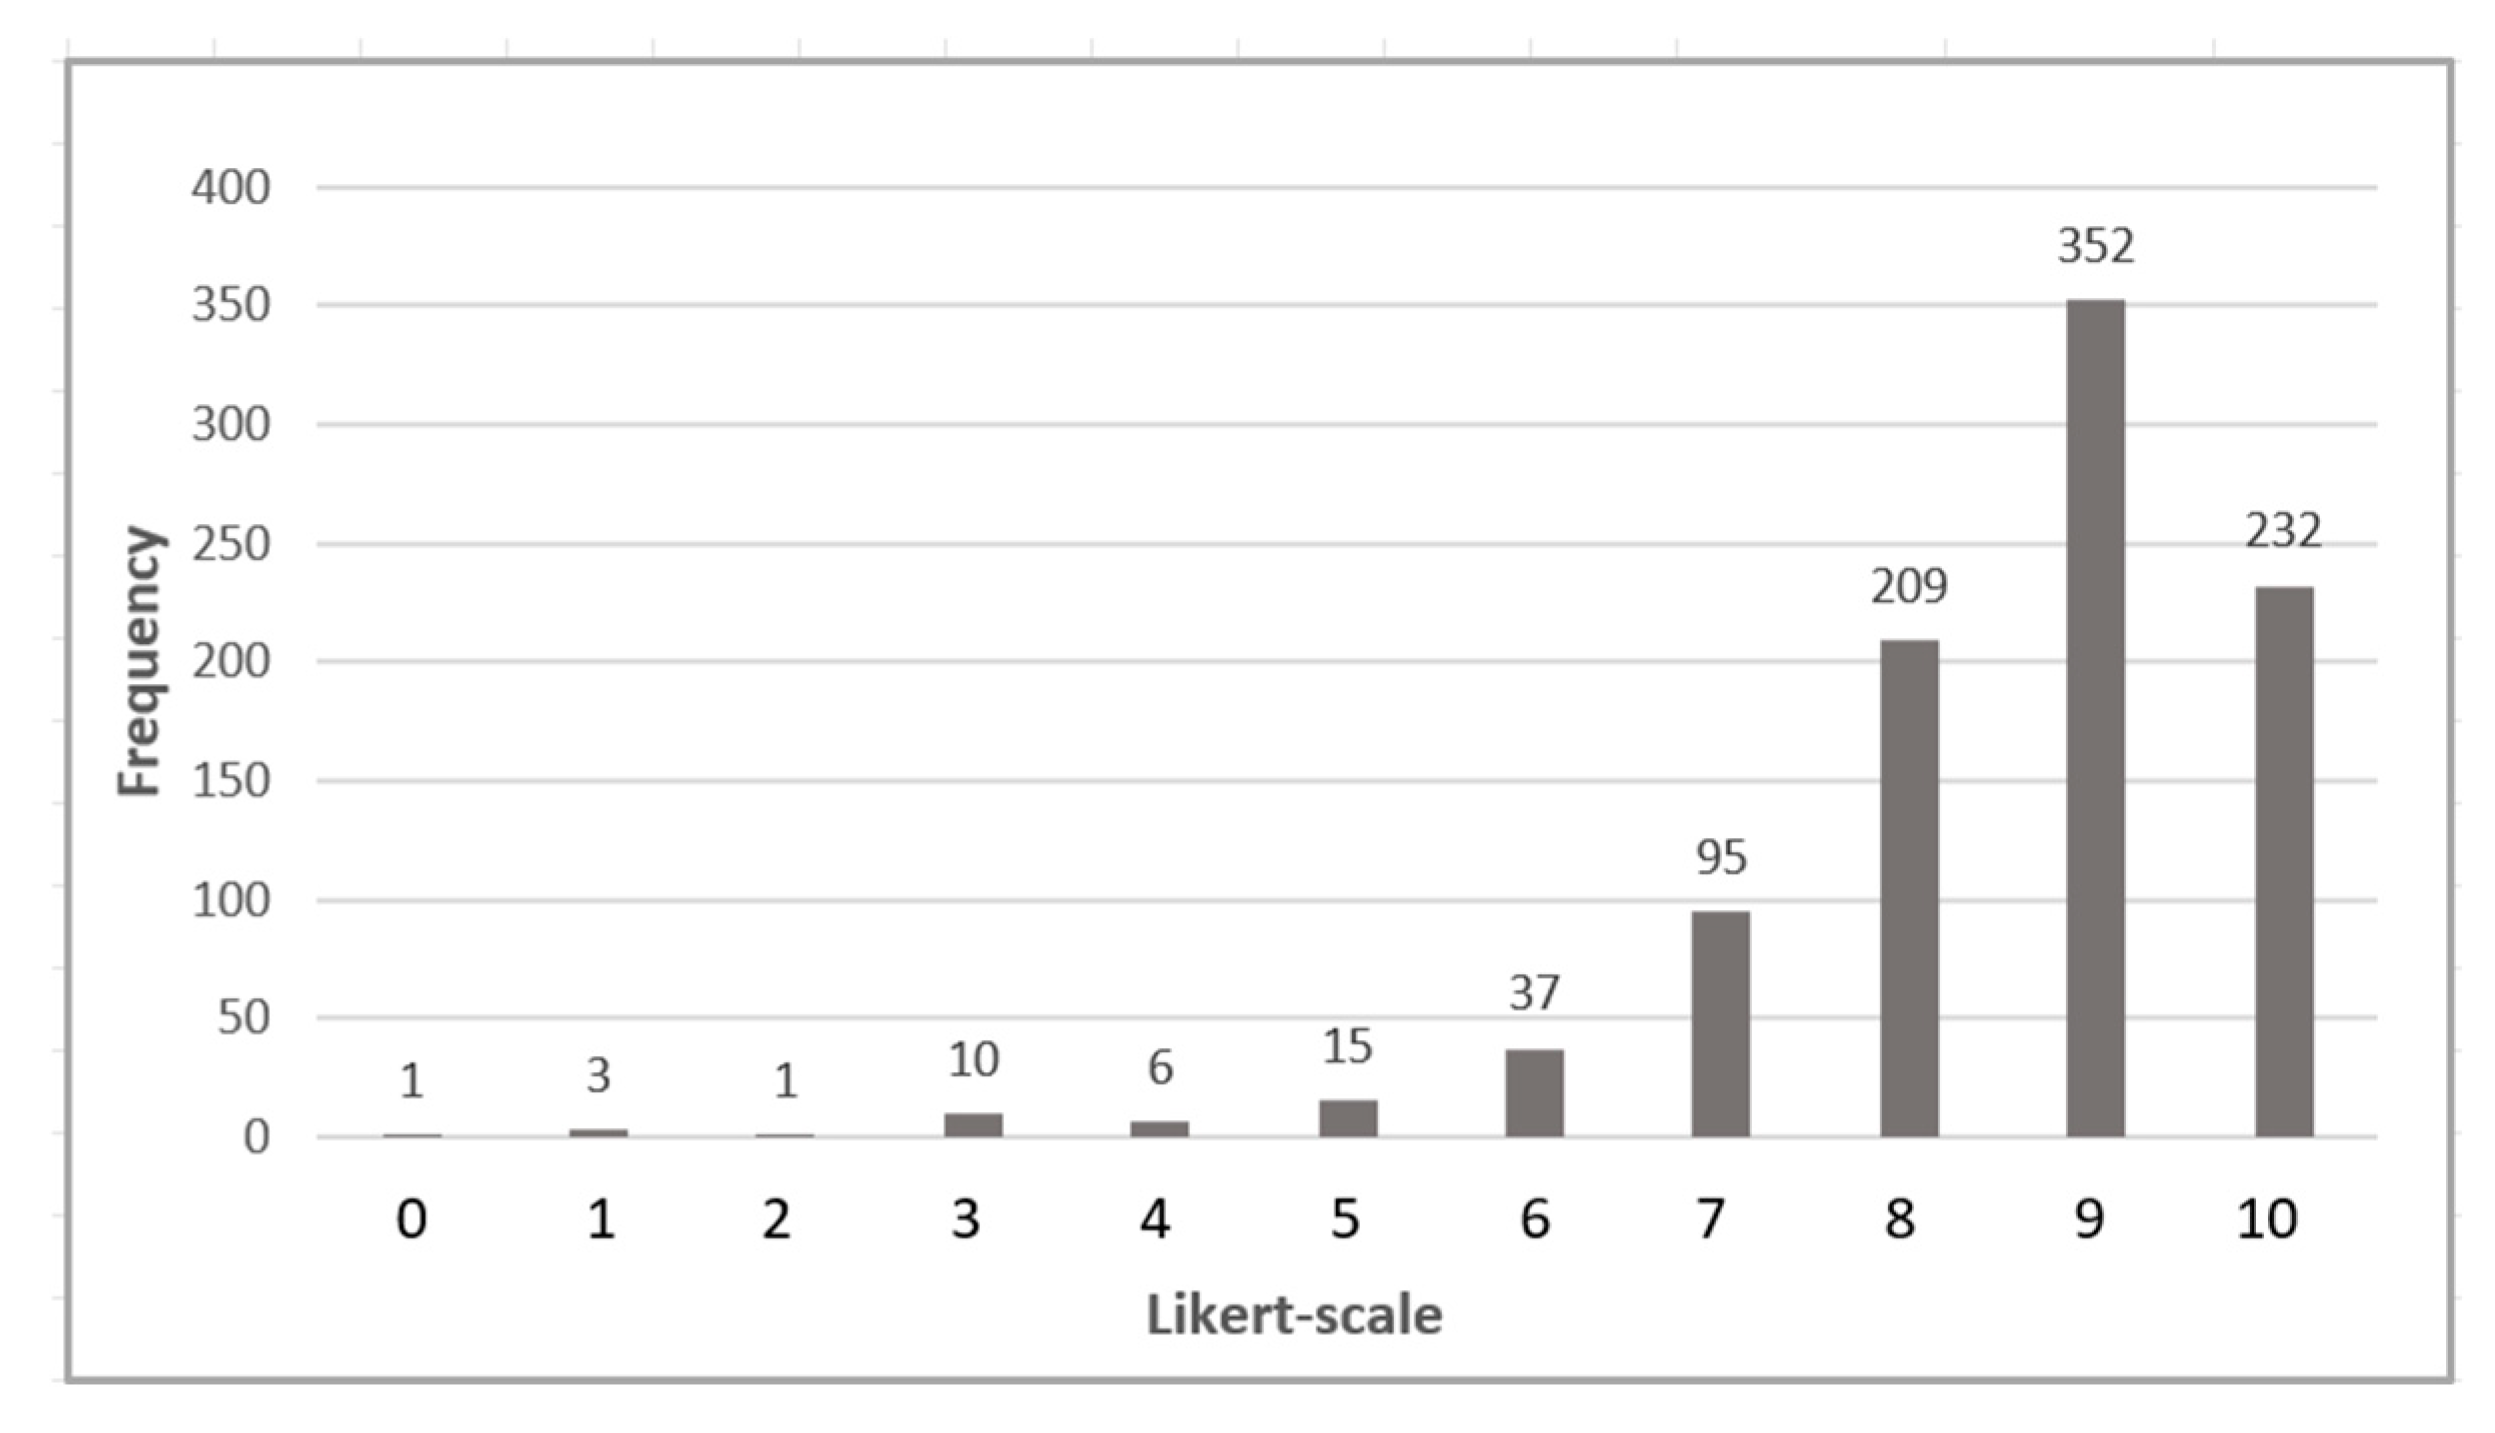
3.1.3. Responses to Indicators
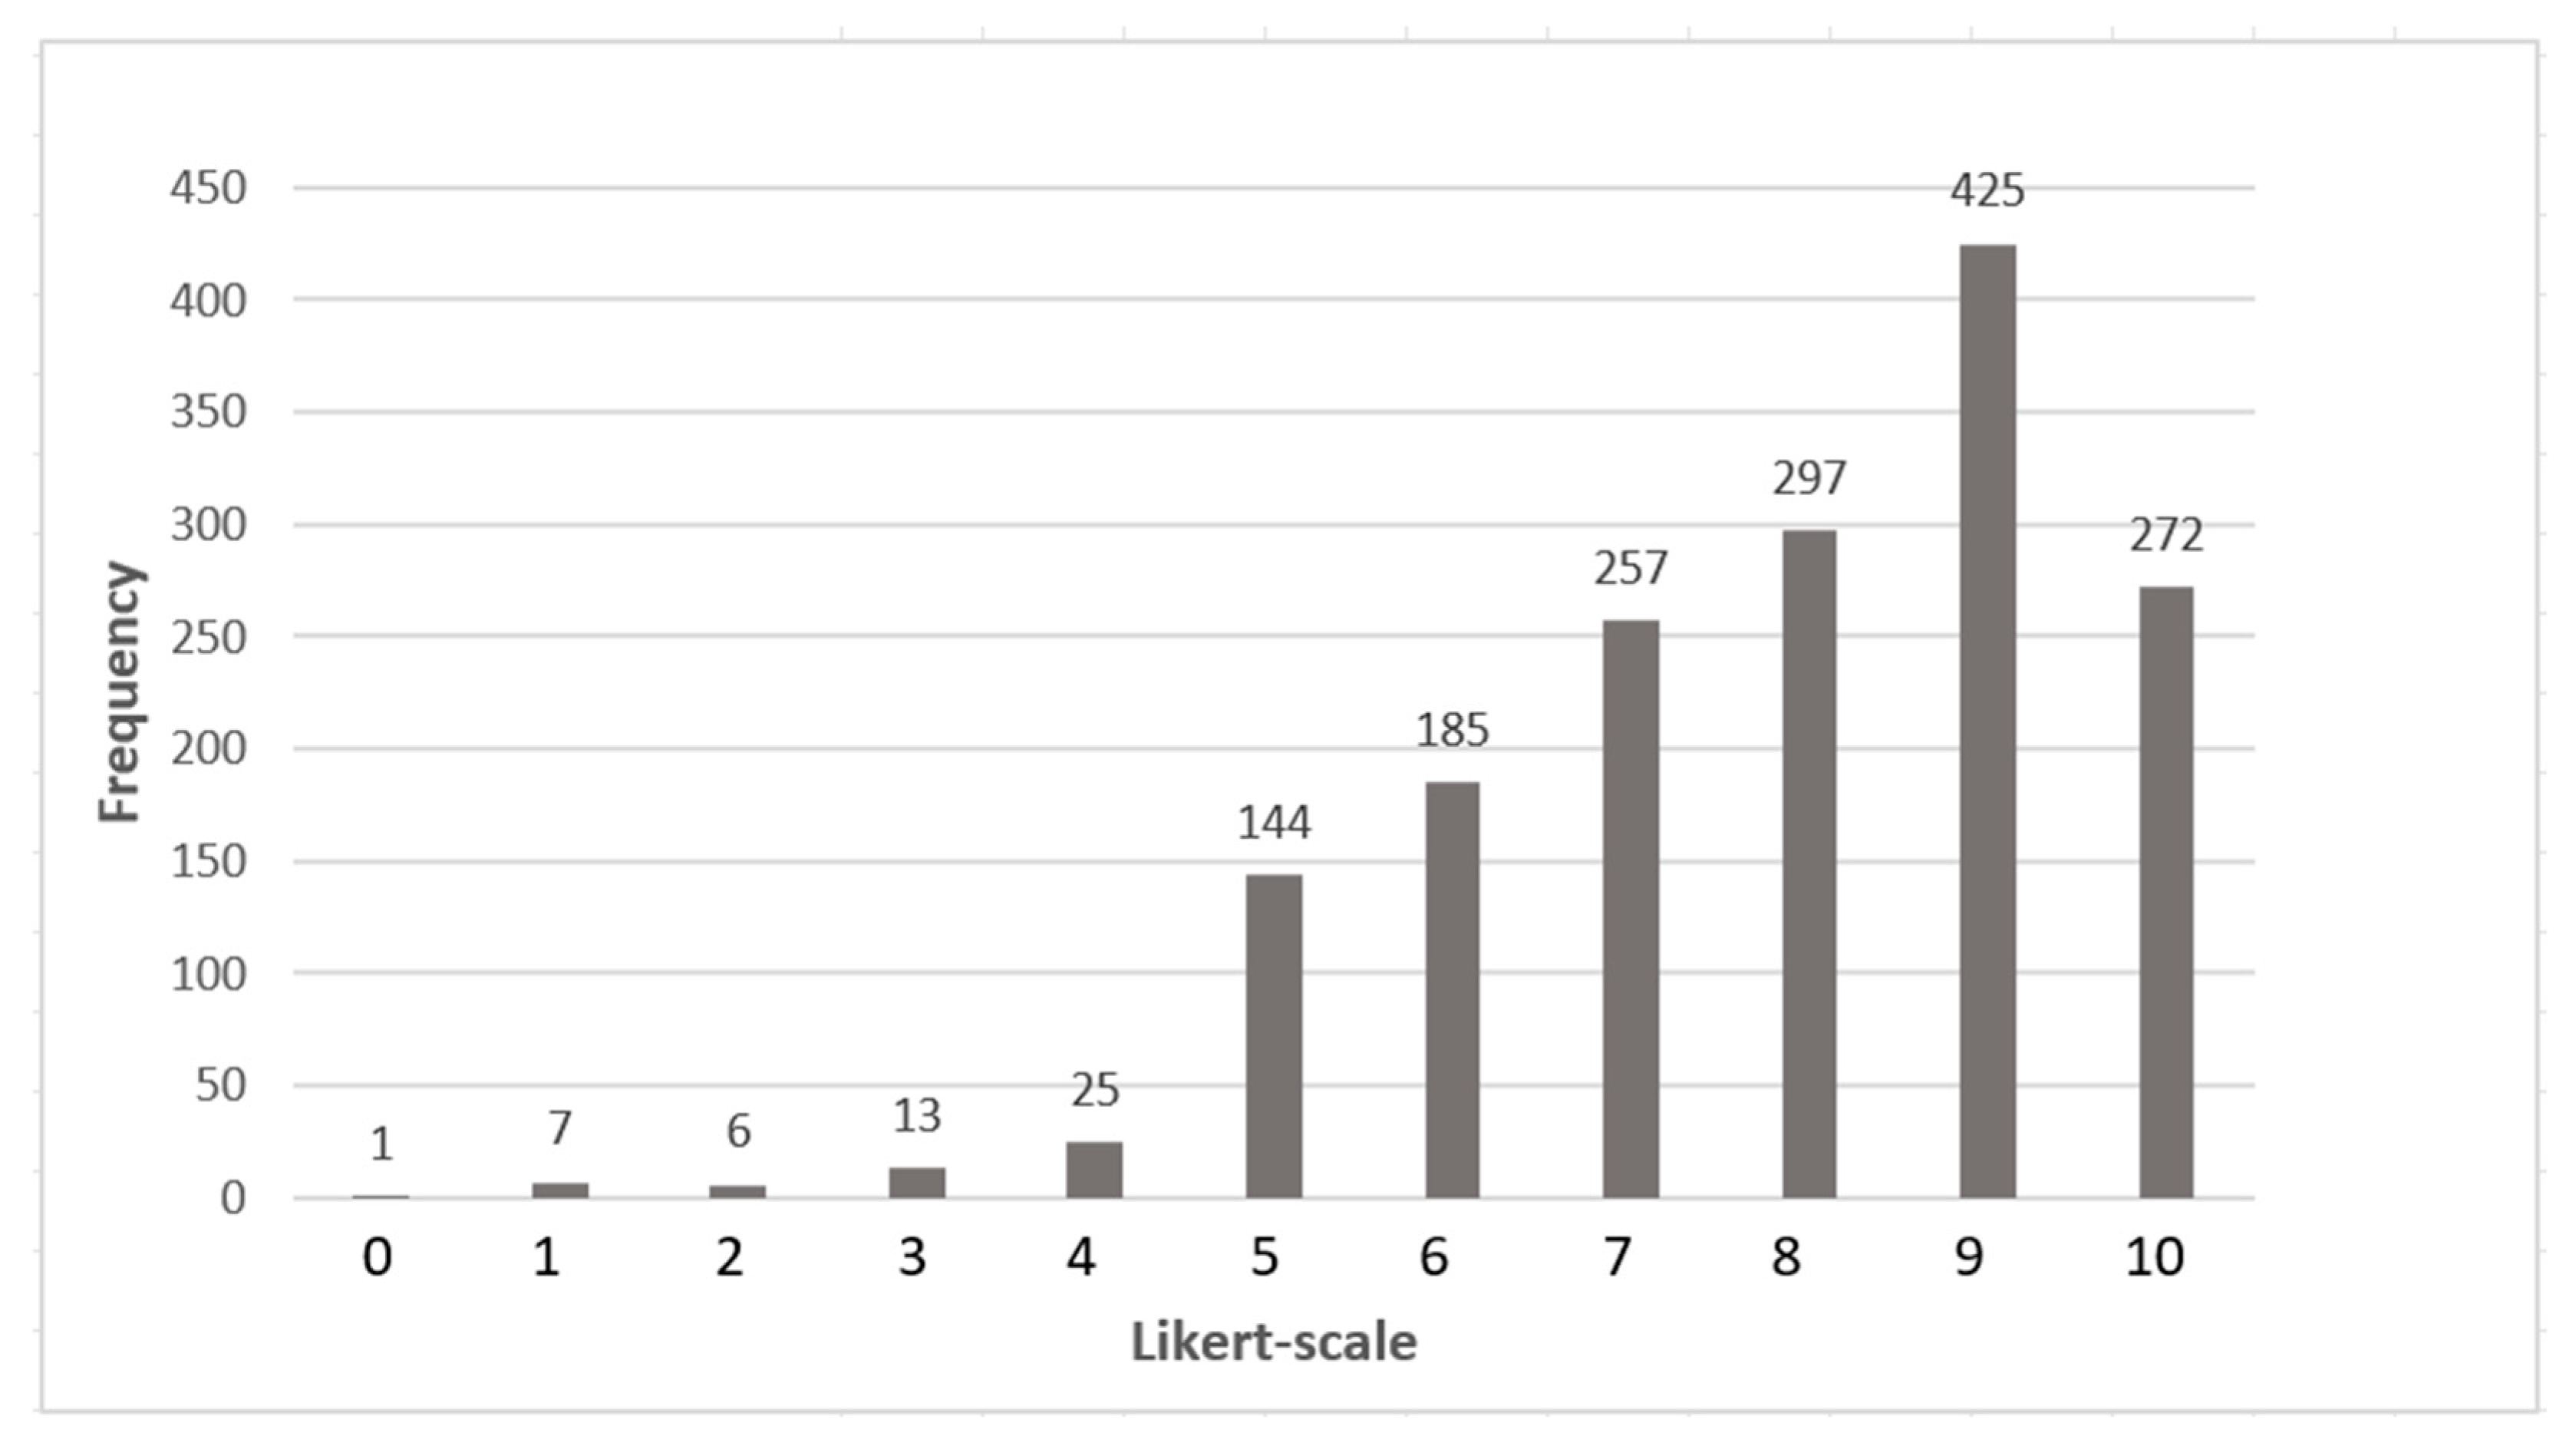
For the 48 indicators, a total of 1,632 scores were recorded. The results again showed strong agreement among participants, as illustrated in Table 7 and Figure 8 below. Only 52 scores were below 5, with 144 at the midpoint of 5. The vast majority of scores—1436, or 88%—were above the midpoint, indicating a strong level of consensus on the indicators. Notably, only three out of the forty-eight indicators had a high standard deviation, which included Retail Services (SD = 2.18), Workforce Productivity (SD = 2.10), and Diversity and Inclusion (SD = 2.15). This highlights the overall agreement among experts while identifying areas with slightly more varied opinions.
Table 7.
Round 1 indicator data.
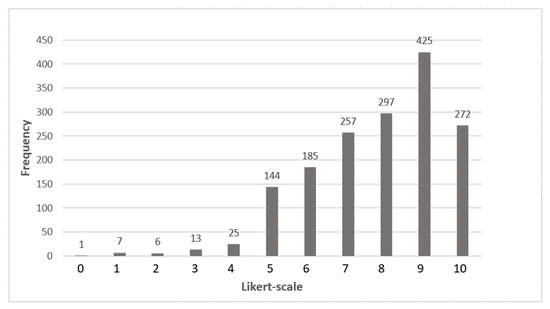
Figure 8.
Round 1 frequency of choices on indicators.
Open-ended responses on indicators: The two open-ended questions regarding the 48 indicators revealed strong overall agreement among the thirty-four participants, with four (12%) expressing concerns, primarily about the inclusion of Smart Economy indicators in a university setting. However, several participants raised general concerns about the high number of indicators and the lack of easy access to related information in the questionnaire. Typical responses are summarized below.
Overwhelming agreement examples included the following: “All of these contribute to a smart campus”. “All indicators are important, but institutions will have varying priorities and budget constraints, meaning some areas will be emphasized more than others at different times”. “These indicators are closely tied to quality of life and sustainability on campus, which are critical for a smart campus”. “The 48 indicators of the Smart Campus model are both sufficient and relevant, given the intended outcomes”.
Reserved comments included the following: “Some of the indicators are difficult to distinguish, such as communication and connection, or the energy-related ones”. “I’m questioning the definition of ‘Smart Campus’ based on some of these indicators. It makes me wonder about the overall concept you’re using”. “There are too many indicators—try to reduce them”. “This feels like an overly ambitious attempt to create an all-encompassing smart campus model with too many indicators”.
3.1.4. Overall Responses
The final responses from the expert participants generally reflected a positive view of the Delphi study. Typical comments include the following: “A very good survey. Good study”.
“Not easy to navigate through such a large amount of information... it would be helpful to have the framework on a separate screen to better understand and provide more accurate answers and suggestions”. “Very insightful research, but always consider the end user in the design”. “The Smart Campus Model is a smart design, as it aligns with and consolidates the aspirations of the UN SDGs pillars”. “This is a solid effort, and I wish it success. I would encourage a critical interrogation of the research premises and expected outcomes”. “The dimensions and indicators synthesized in this study are highly relevant, though there is a concern about privacy”. “The ‘purpose’ of university campuses and campus life varies greatly”.
3.2. Round 2
3.2.1. Responses to Dimensions
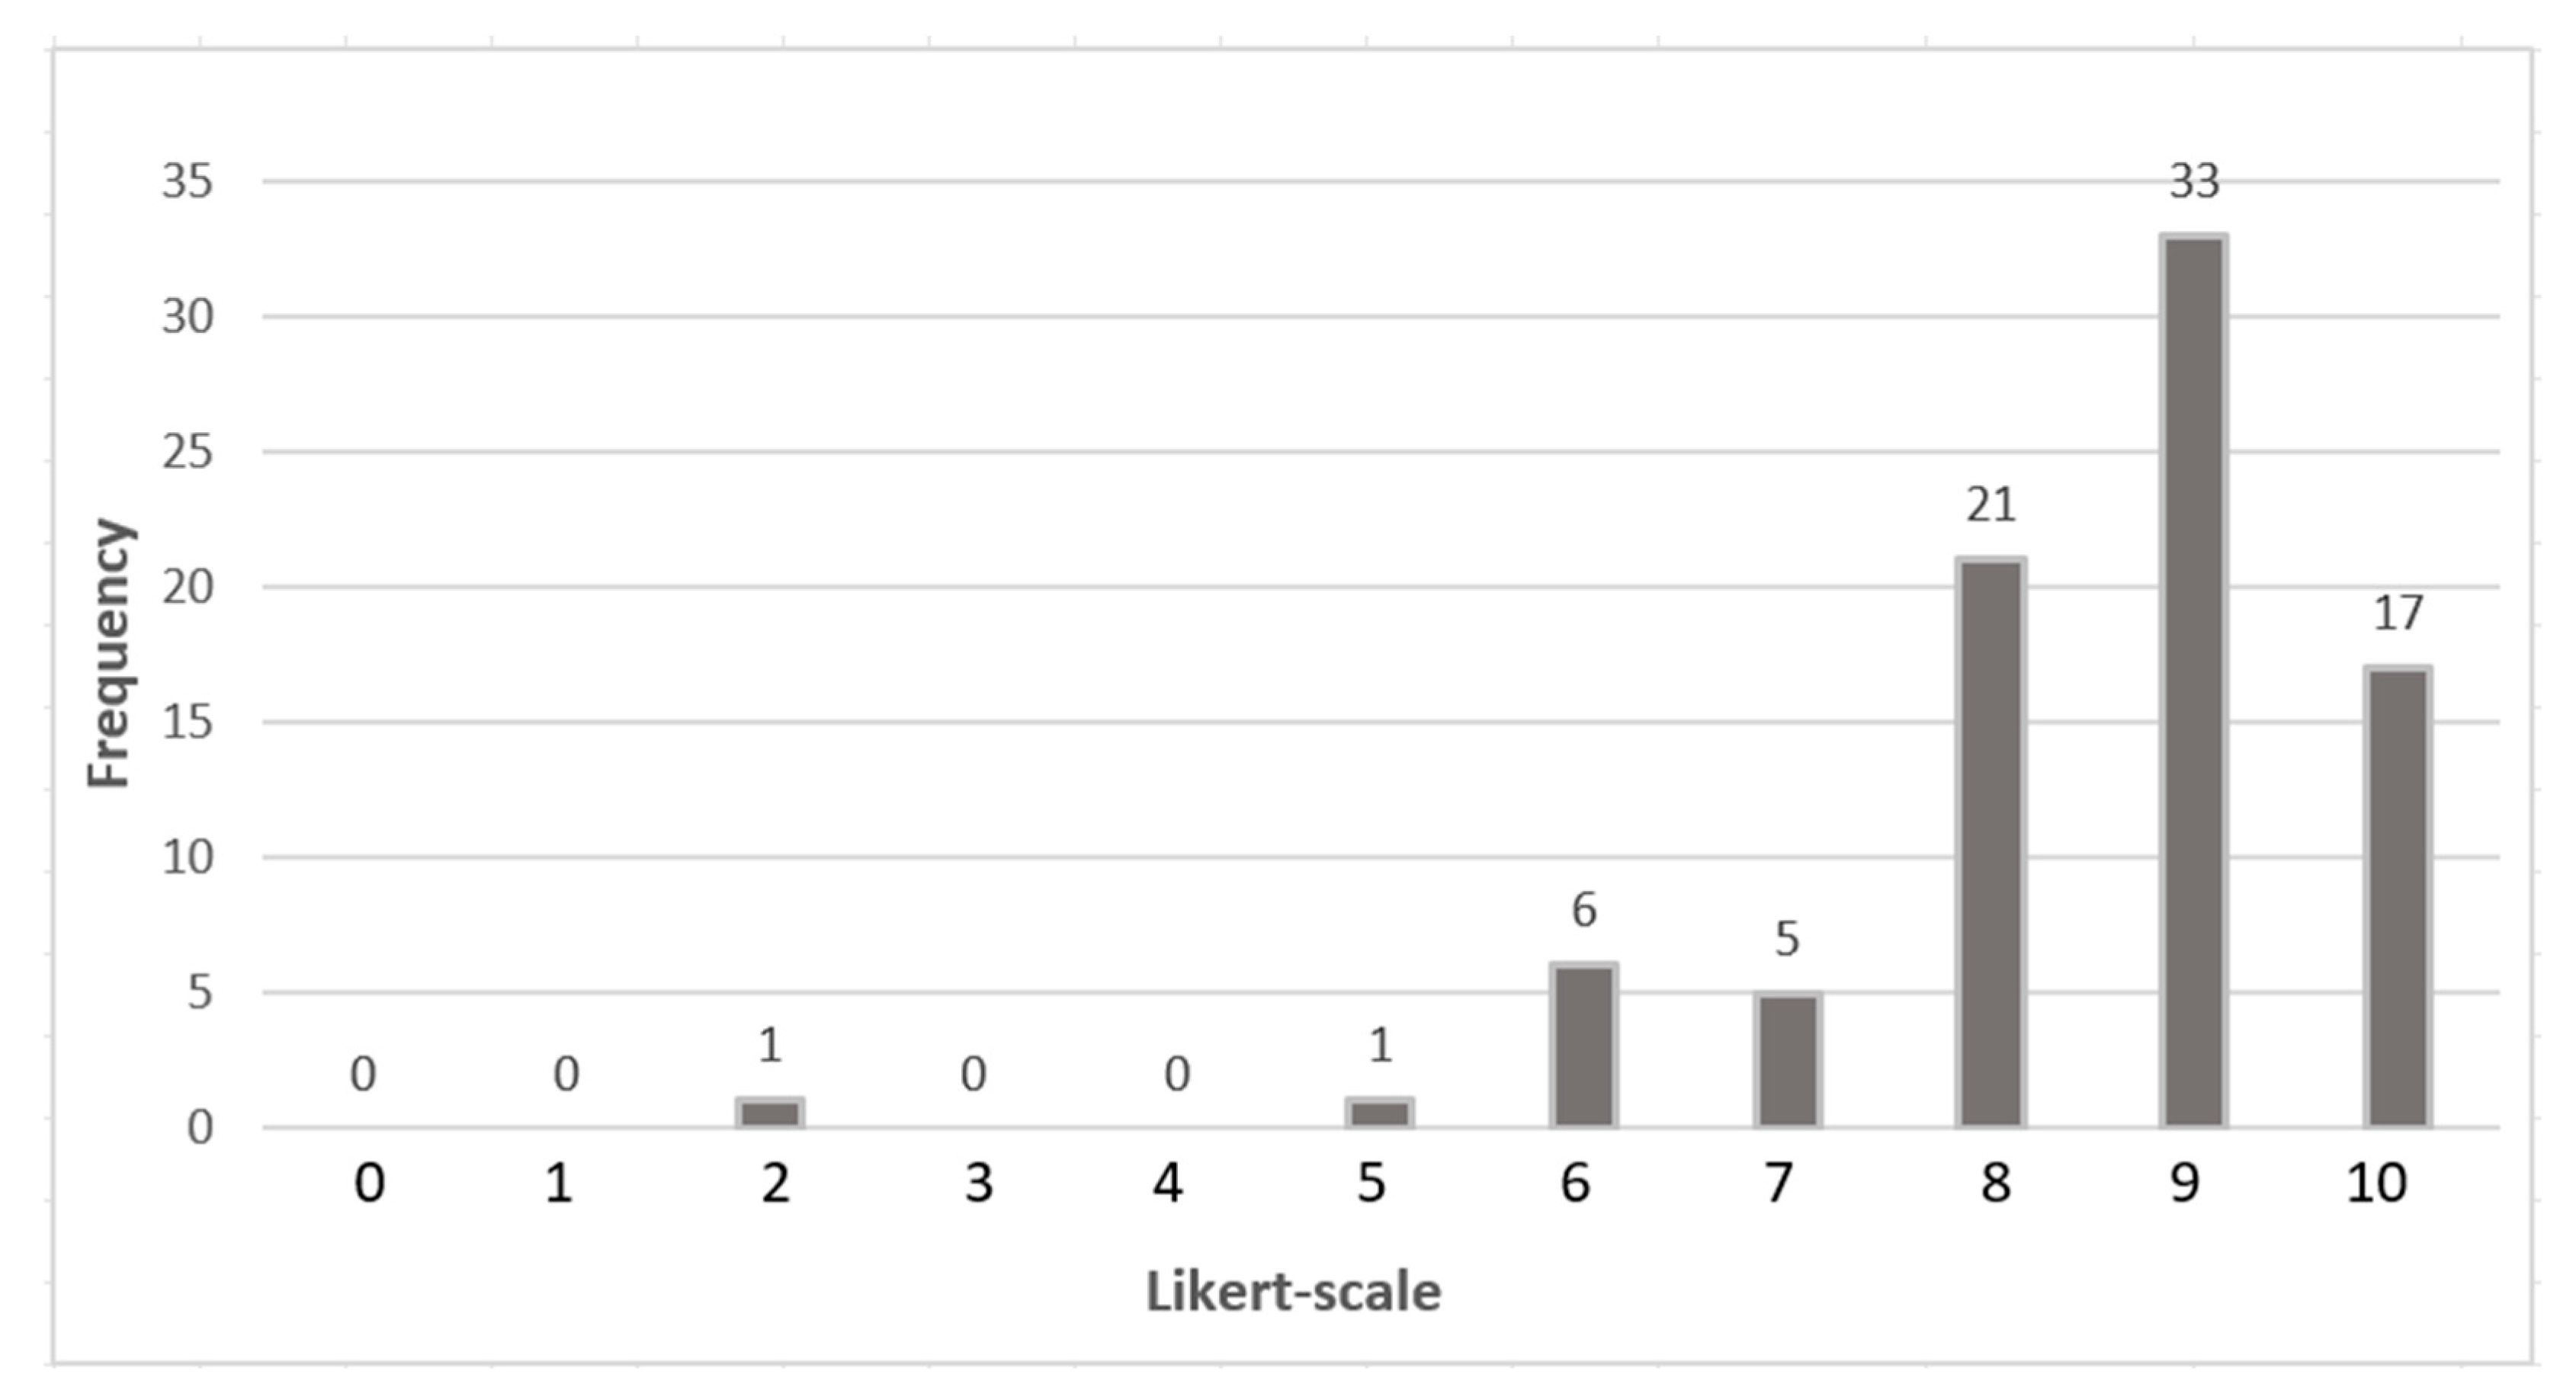
In Round 2, the survey was conducted exclusively with the expert group of 34 participants identified in the first round. Weekly reminders were sent over a three-week period, resulting in 21 fully completed responses and a response rate of 62%. In this round, responses from the 21 experts yielded a total of 84 scores across the four dimensions. The results demonstrated a strong consensus, as illustrated in Table 8 and Figure 9. Only one score fell below 5, and another was at the midpoint, while the vast majority—82 scores, or 98%—exceeded the midpoint, indicating a high level of agreement among participants.
Table 8.
Round 2 dimension data.
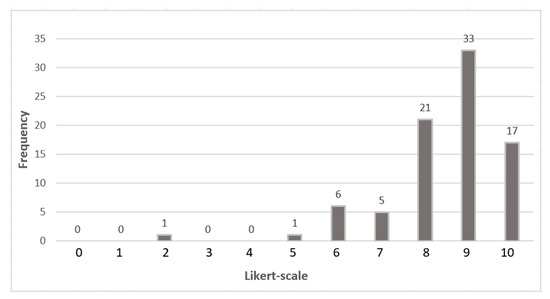
Figure 9.
Round 2 frequency of choices on dimensions.
Open-ended responses on dimensions: The two open-ended questions regarding the four dimensions elicited well-informed feedback from expert participants. Below are typical responses, categorized by counter and complimentary statements.
Counter statements include the following: “Learning isn’t the only mission, but it is central and influences other aspects. Quality of campus life is important, but there might be too much emphasis on diversity and inclusion compared to other elements”. “In my view, business services are slightly less important than the other dimensions”. “As mentioned before, the Smart Economy is the most problematic dimension here. Why turn campuses into business spaces at all?” “Universal social responsibility doesn’t seem as critical as the other dimensions”. “‘Quality of Campus Life’ as a title doesn’t align with its definition, which feels more like ‘personal development’”. “I would revise all the Smart Environment categories and definitions to better reflect real built-environment objectives”. “The Smart Economy, particularly the focus on business services, may need to be reconsidered”.
Complimentary statements include the following: “Sustainability, resilience, and entrepreneurship are crucial”. “I believe Smart Economy and Smart Governance are more important than the other two dimensions”. “If the economy supports society and fosters entrepreneurship skills in students, then it’s an important aspect of the smart campus”. “Smart Governance scored the highest because it’s the key enabler for achieving a smart campus”. “Smart Economy, in a sense, allows economic priorities to shape the other smart dimensions”. “All dimensions are equally important for the success of a smart campus”. “These dimensions address the key aspects required for the development and functioning of a smart campus”. “Smart Society should be at the heart of decision-making, as it overlaps with all other areas. Governance is second, as sustainable governance is essential for institutions”.
3.2.2. Responses to Categories
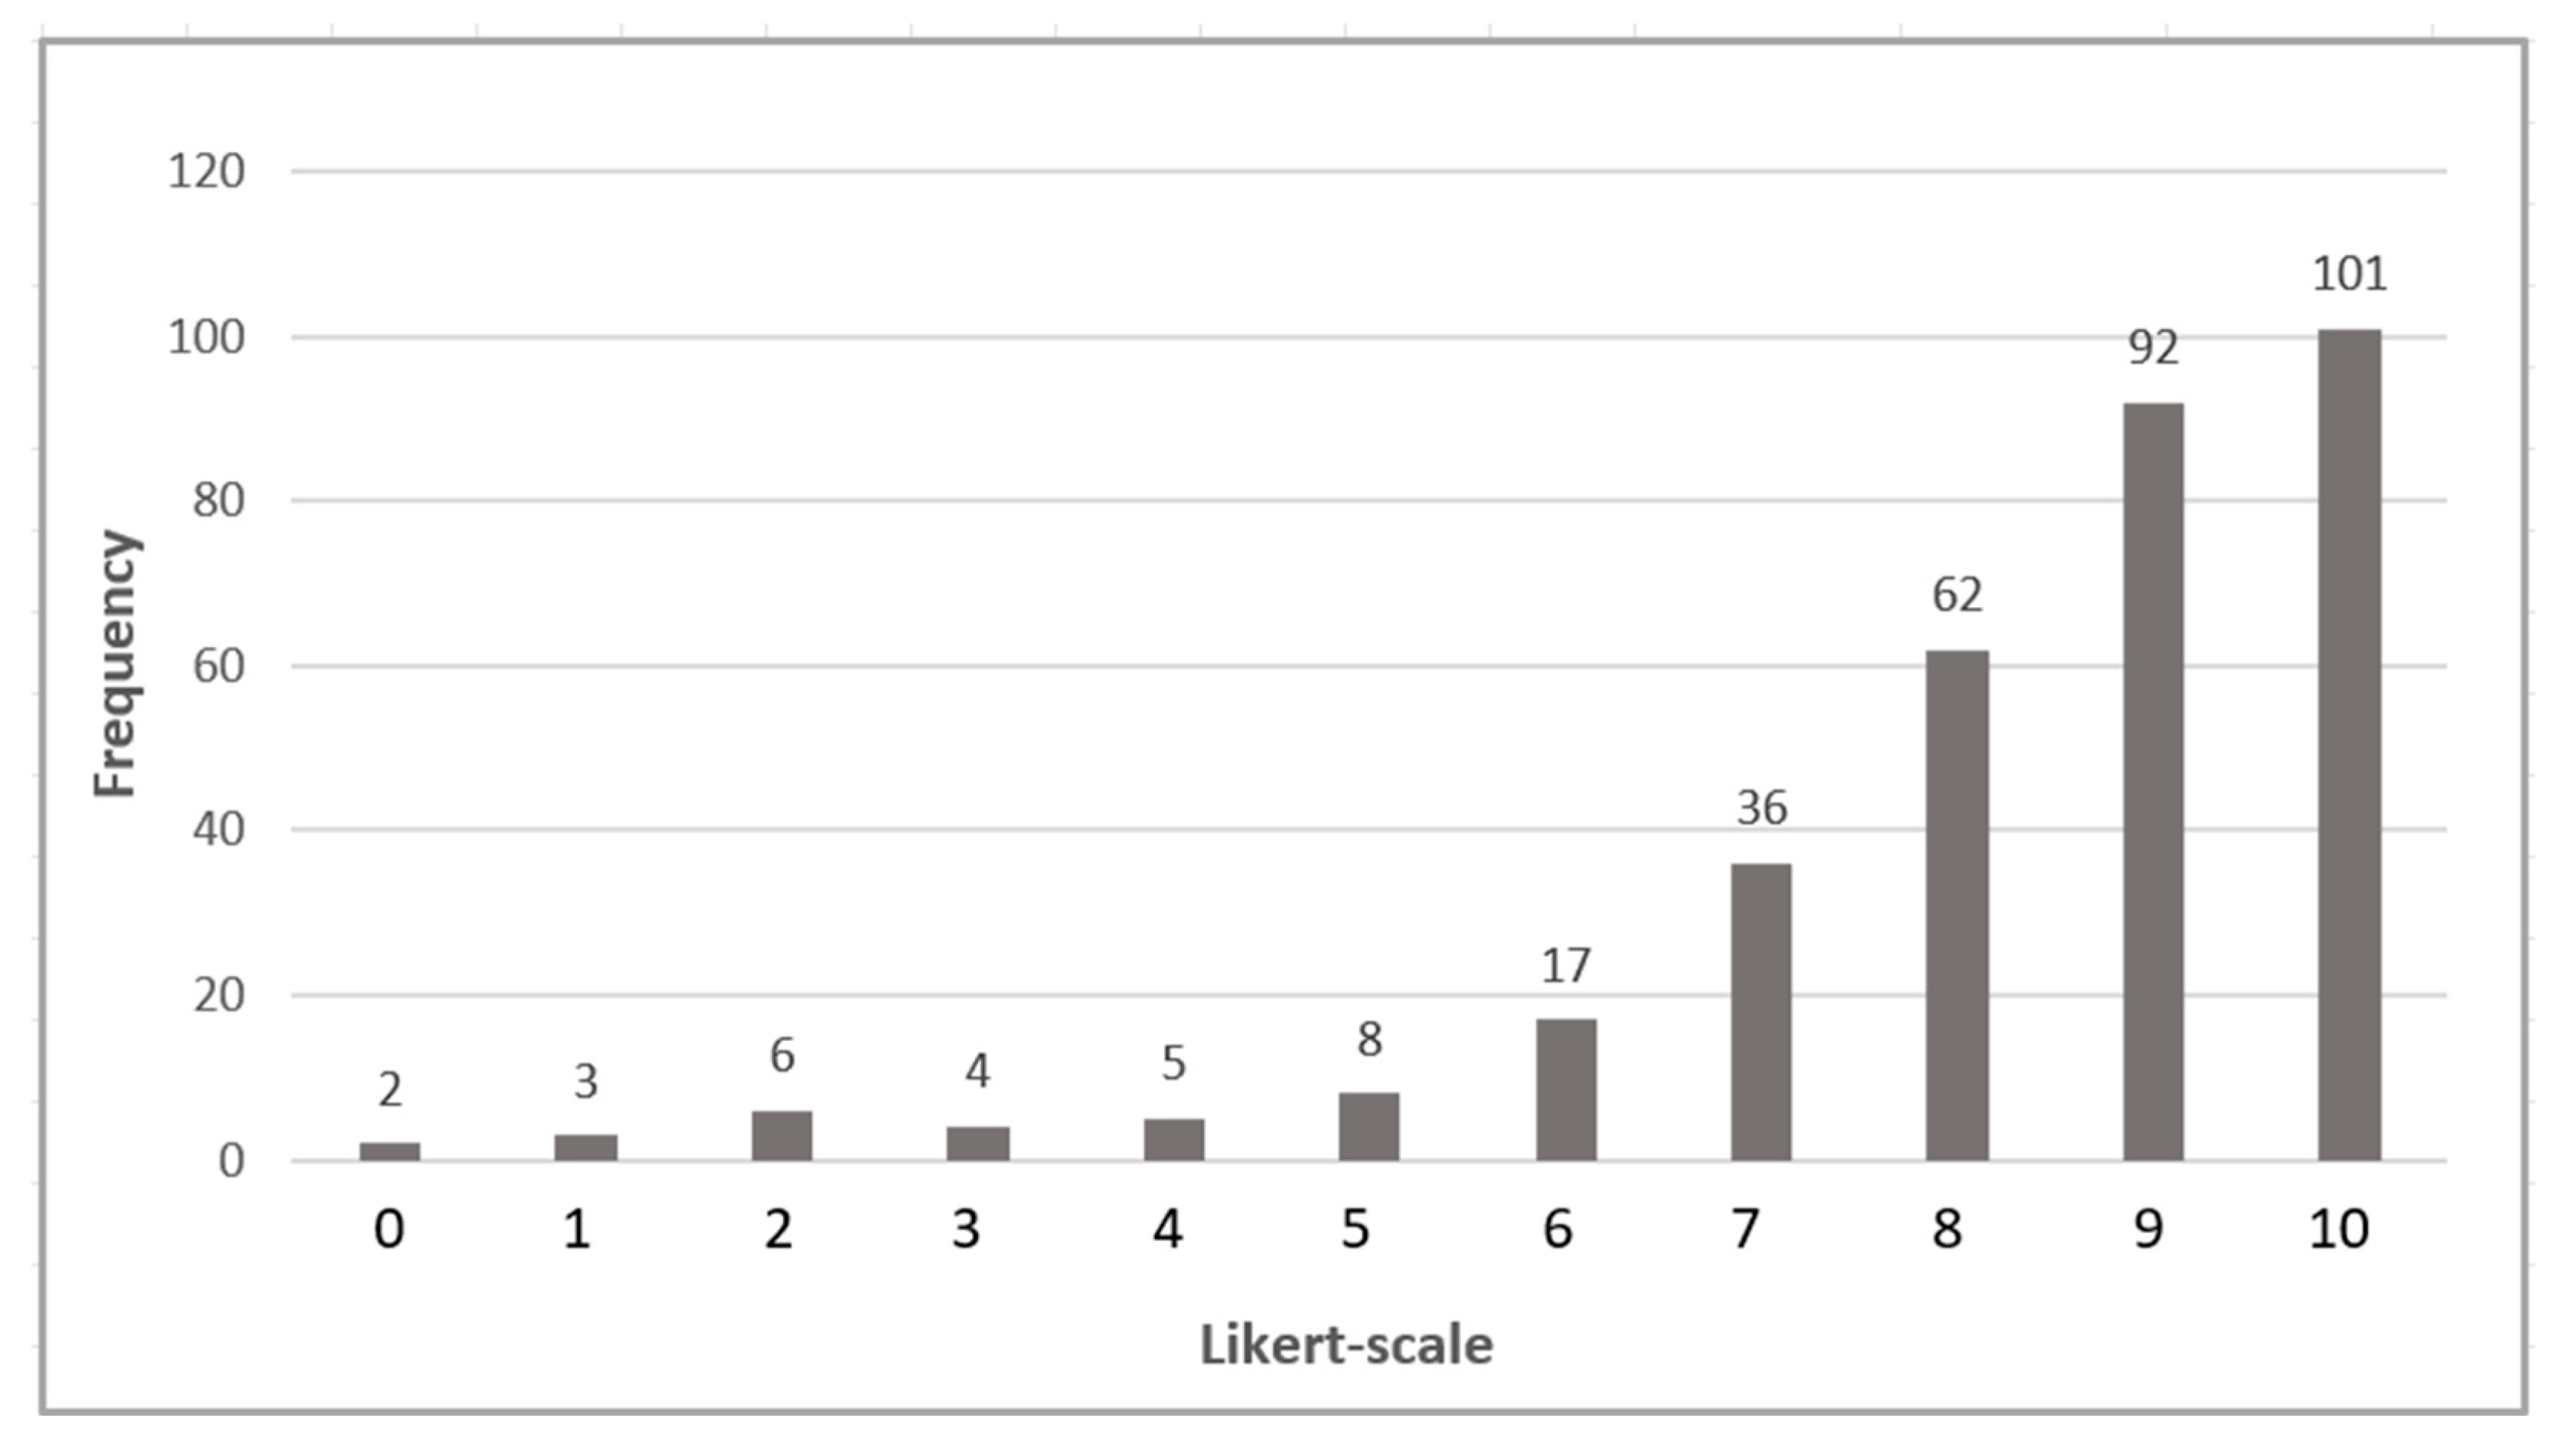
For the 16 categories, a total of 336 scores were recorded, reflecting strong overall agreement, as shown in Table 9 and Figure 10. Only fifteen scores fell below 5, with five scores at midpoint. The majority—316 scores, or 94%—were above the midpoint, demonstrating a high level of consensus among participants. In total, six categories recorded higher standard deviations, indicating greater variability in expert responses. These categories included Business Efficiency (SD = 2.55), Utility Cost Saving (SD = 2.64), University Social Responsibility (SD = 2.11), Sustainable Development (SD = 2.33), Zero Waste (SD = 2.09), and Data Governance (SD = 2.12). These variations suggest areas where expert opinions were less aligned, potentially highlighting complexities or differing priorities within these aspects of the smart campus framework [46].
Table 9.
Round 2 category data.
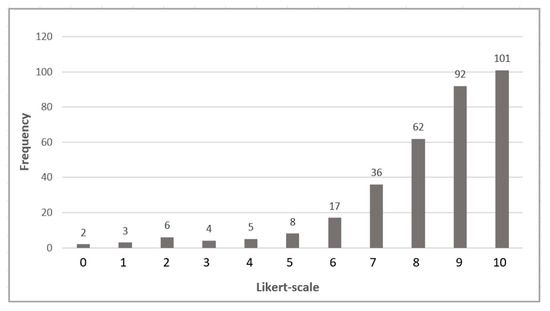
Figure 10.
Round 2 frequency of choices on categories.
Open-ended responses on categories: The two open-ended questions regarding the 16 categories revealed thoughtful and informed feedback from the expert participants. Below are typical responses, categorized into counter and complimentary statements. Note that more comments are considered in the discussion to demonstrate the crucial stage of Round 2. They do not represent an overwhelming response from the 21 experts. Nevertheless, the quantitative analysis demonstrated an overwhelming consensus.
Counter statements included the following: “If the focus is on diversity and inclusion, perhaps it should be its own category. Otherwise, the definition should be adjusted to give it equal weight with other aspects of campus life quality”. “Everything seems important here, but efficiency in this context doesn’t play the same role as it would in manufacturing environments”. “As mentioned earlier, the Smart Economy remains the most problematic dimension”. “The Smart Economy, especially business services, may need to be reconsidered. Recreation and Art Services might fit better under Smart Society”.
Complimentary statements included the following: “A university is, in many ways, a business and should be run efficiently and effectively to meet expectations for experience and outcomes”. “I prefer to maintain the same scores as in the previous questionnaire”. “Smart Economy is an important aspect for a successful smart campus”. “I don’t see a need to adjust my scores based on other participants’ input. I believe utility cost savings should be emphasized, as it could be a key rationale for establishing a smart campus”.
3.2.3. Responses to Indicator
A total of 961 scores were recorded for the 48 indicators, reflecting strong agreement among participants (Table 10 and Figure 11). Only 52 scores fell below 5, with 144 at the midpoint, while the vast majority—88%—of scores (765) were above the midpoint, demonstrating a high consensus among the experts. Only three indicators recorded high standard deviations, reflecting greater variability in expert responses. These indicators were Lean Principles (SD = 2.10), Workforce Productivity (SD = 2.13), and Diversity and Inclusion (SD = 2.10). This suggests that while overall consensus was strong, these specific indicators elicited more diverse perspectives among the experts.
Table 10.
Round 2 indicator data.

Figure 11.
Round 2 frequency of choices on indicators.
The two open-ended questions on the 48 indicators generated valuable feedback from the expert participants, with responses categorized as counter and complimentary remarks.
Counter statement examples: “Unfortunately, committees, policies, and regulations are often a necessary evil”. “This seems like a less important factor”. “Automation is useful, but not all university procedures can be automated. Also, contingency plans are needed for breakdowns or emergencies that could interrupt automated processes”. “At this point, there are so many variables that this is starting to feel like a management strategy exercise”. “There are already too many indicators, and many of them might conflict in practice”. “My responses are based on the situation in Papua New Guinea, where art services may not be as important”. “Replace ‘culture of diversity and inclusion’ with ‘a strong and distinctive campus culture’ that instills pride in students”. “Responsible suppliers may not always be the most efficient”. “Automation and Lean Principles allow staff to focus on innovation instead of routine tasks”.
Complimentary statements include the following: “These parameters are essential for a good system”. “In this section, I don’t feel the need to revise my previous considerations. In general, metrics and indicators serve as references or guidelines but should always be adjusted locally”. “It’s essential that the institution operates as a community, striving to meet the expectations of all stakeholders”. “All these activities are key to the success of a university. Depending on the subjects offered, industry engagement is crucial”. “I prefer to keep the same scores as in the previous questionnaire”. “I revisited my scores”.
3.2.4. Overall Responses
The final responses from the expert participants in Round 2 generally reflected a positive view of the Delphi study. Typical comments included the following: “The framework is holistic. I have a few suggestions, as mentioned in previous sections”. “I reiterate my earlier recommendation of Alvesson. The aspirational goals are solid, but this is a very lengthy survey, heavily reliant on discourse”. “I’m glad the earlier issues were addressed—responding to the questionnaire was much easier this time”. “Some areas are still challenging to evaluate”. “Congratulations, excellent work in assembling a comprehensive framework”.
3.3. Response Rate
A total of 34 experts in the Delphi group provided complete responses during Round 1. In Round 2, 21 of these experts submitted complete responses, yielding a response rate of 62%.
3.4. Statistical Analysis Parameters
- ▪ ‘A’ (agree): scales 6, 7;
- ▪ ‘SA’ (strongly agree): scales 8, 9, and 10;
- ▪ ‘OA’ (overall agreement): A + SA (must be >70% for consensus);
- ▪ Standard deviation: less than 2.0.
The analysis results for both rounds can be found in Table 11 below.
Table 11.
Analysis results.
Key findings show that the overall agreement (OA) levels for all components were above the 70% consensus threshold in both rounds, and standard deviations for all components were below 2.0, indicating strong agreement among experts and consensus was reached for all components in both rounds, confirming the robustness of the smart campus assessment framework.
These results highlight the successful application of the Delphi method in validating the smart campus framework and achieving expert consensus. It is important to note that the high standard deviation figures of 2.79 and 2.64 do not represent the sample as a whole but are specific to individual indicators within the sample. These values correspond to the Innovation Ecosystem category in Round 1 and the Utility Cost Saving category in Round 2, respectively, reflecting areas with greater variability in expert responses.
4. Findings and Discussion
4.1. Delphi Study Overview
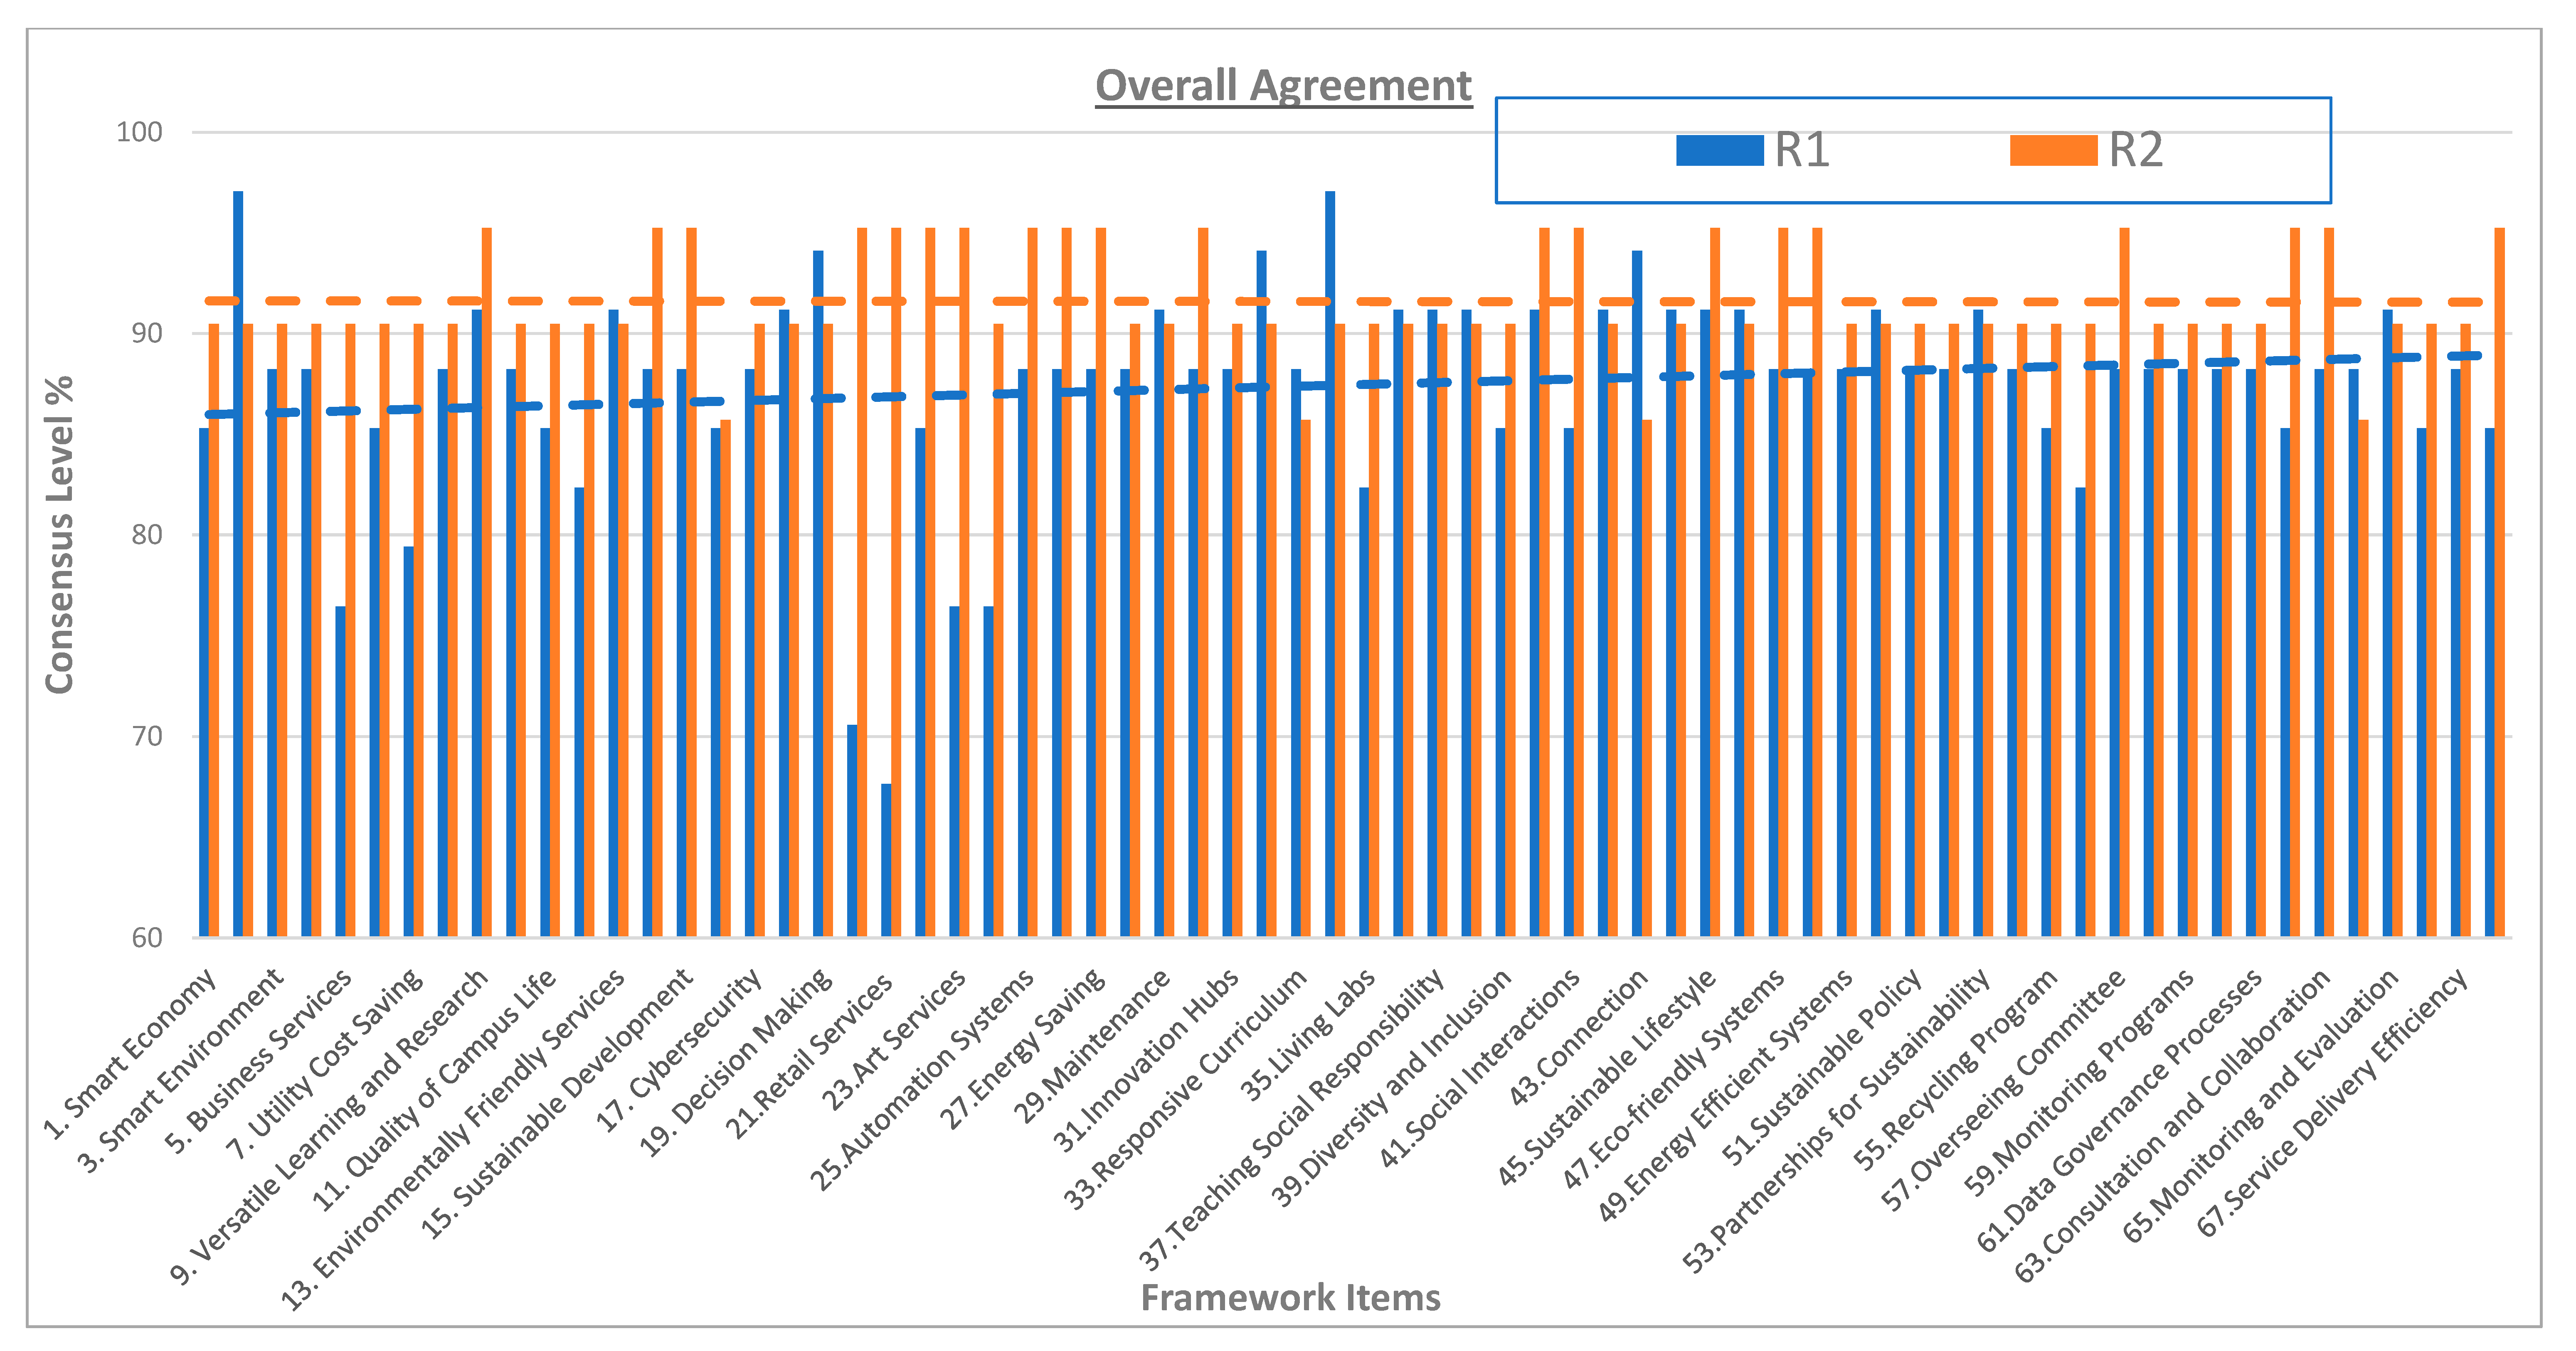
This Delphi study marks the first to employ this method for identifying and reaching consensus on a smart campus assessment framework. Conducted over two rounds spanning four months, the study’s results are shown in Figure 12, Figure 13, Figure 14 and Figure 15. Notably, consensus was achieved in Round 1, with 67 of the 68 items scoring an overall agreement (OA) above the 70% threshold, as shown in Figure 14. Thus, the smart campus makeup of the four smart dimensions of economy, society, environment, and governance was observed to model a smart university. Moreover, the 16 categories and 48 indicators provide the essential components for a robust smart campus framework.
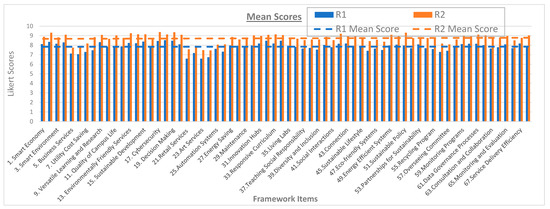
Figure 12.
Mean score of 68 items.
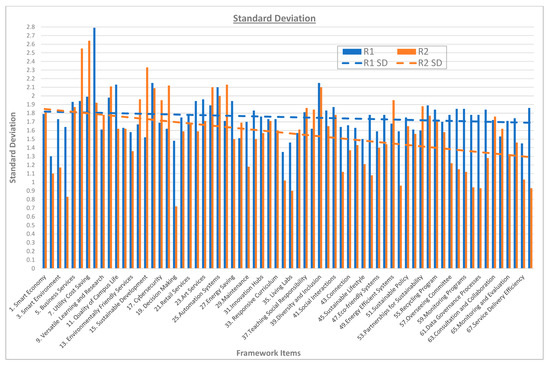
Figure 13.
Standard deviation of 68 items.
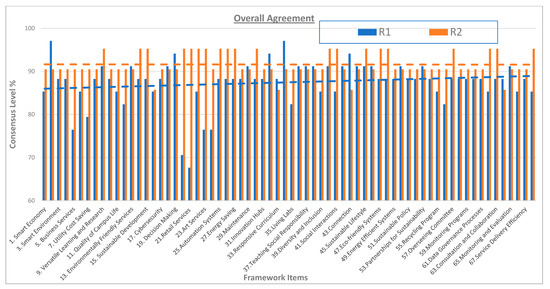
Figure 14.
Overall agreement consensus level.
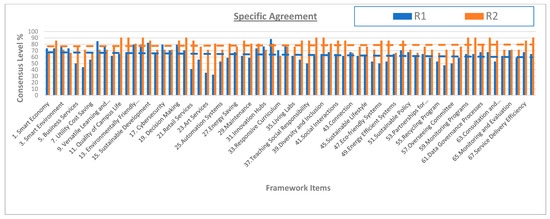
Figure 15.
Specific agreement consensus level.
A second round was conducted to further validate the framework, following the Delphi methodology.
The mean score was increased to a high of 9 in the second round, as shown in Figure 12. This demonstrated an increase in the agreement by the experts on the 68 items of the framework.
The standard deviation was also improved, as shown in Figure 13, to drop below the required threshold of 2.0. This demonstrated how close the experts’ responses were to confirming the 68 items of the framework. There were, however, five items out of the sixty-eight in Round 1 that had SDs higher than 2.0, which included Innovation Ecosystem, Quality of Campus Life, Automation Systems, Zero Waste, and Diversity and Inclusion. This is likely due to a degree of misunderstanding by the participants as the items are, by their nature, significant. Moreover, in Round 2, there were also nine out of sixty-eight items, which included Business Efficiency, Utility Cost Saving, University Social Responsibility, Sustainable Development, Zero Waste, Data Governance, Lean Principles, Workforce Productivity, and Diversity and Inclusion. It is noted that these incidents are marginal and did not have any significant bearing on the overall agreement level in the Delphi analysis.
In addition, the specific agreement (SA) for the 48 indicators in Round 1 underscored the complexity of the framework. Feedback revealed that some participants found the high number of indicators overwhelming, even though a diagram and a detailed description table were provided to aid understanding. While this feedback is noteworthy, the 48 indicators represent a key innovation of the research and cannot be consolidated into broader headings at this stage without compromising the study’s objectives. Despite these challenges, Figure 15 illustrates a consistent improvement in consensus across all 68 items, highlighting progress achieved through the Delphi process.
Positive feedback on the framework prevailed, with some concerns regarding the Smart Economy dimension due to contextual differences. The framework’s inclusion of Smart Economy represents a forward-looking approach, recognizing the emerging economic potential amidst the evolving higher education landscape.
To improve clarity and presentation, the Round 2 questionnaire was revised, increasing the number of questions from nine in Round 1 to sixty in Round 2. The 16 categories were grouped under their corresponding dimensions, increasing the category-related questions from three to twelve and indicator questions from three to forty-eight. This restructuring aimed to enhance participants’ understanding and facilitate a more informed consensus.
As anticipated, the changes led to improved results in Round 2. The low specific agreement of 20 in Round 1 tripled to 60, significantly raising consensus levels. Additionally, the overall agreement reached a perfect score of 68 items (100%), far exceeding the 70% consensus threshold. The Cronbach’s alpha was notably high and remained consistently high (0.98), indicating strong reliability and consistency among the participants’ responses. This bolstered confidence in the data collected through the Delphi process for the smart campus assessment framework.
In the final feedback from Round 2, participants expressed positive views on the study, although some noted the length of the questionnaire as a concern. This feedback will be considered in future studies, particularly when reviewing the framework’s 48 indicators for potential refinement.
4.2. Research Limitations
This research recognizes several limitations inherent in Delphi studies. One key factor is the relatively high response rate of 62%, which, while positive, still leaves the potential for non-response bias. A lower response rate could significantly impact the validity and reliability of the results. Additionally, the composition of the expert panel may influence the quality of the survey outcome. For instance, the participants’ geographical concentration in Asia and Europe could introduce regional bias, potentially limiting the generalizability of the findings to other global contexts.
Moreover, there is always the risk of bias in the researcher’s personal views, or preconceived notions could inadvertently influence the analysis and conclusions.
The very high Cronbach’s alpha value is also noted as a peculiar limitation, which may be caused by some level of exaggeration by the participants to rush through the survey or maybe a lack of comprehension.
To mitigate some of these limitations, the study ensured the involvement of highly credible experts from diverse backgrounds in academia and the private and public sectors. Furthermore, providing participants with feedback from Round 1 allowed for more informed responses in subsequent rounds. The survey’s anonymity also helped reduce social desirability bias and enabled participants to freely express their views on the dimensions, categories, and indicators for the smart campus assessment framework.
While these measures improved the study’s robustness, it is essential to recognize that some biases and limitations are inherent in any Delphi process. Future research could address the limitations by increasing the diversity of the expert panel to ensure broader regional representation and employ triangulation methods to reduce researcher bias in interpreting findings.
5. Conclusions
This study validated a comprehensive framework for assessing smart campus performance, designed to meet the evolving technological demands and operational complexities of modern higher education institutions. Through a two-round Delphi study, the framework was subjected to rigorous expert scrutiny across diverse academic, public, and private sector backgrounds. The consensus achieved on the framework’s 68 components—comprising four core dimensions, 16 categories, and 48 specific indicators—affirms its robustness and relevance for smart campus applications.
The Delphi process underscored the importance of structured frameworks in navigating the digital transformation of campuses. Experts widely endorsed the framework’s multidimensional approach, which captures essential elements of a smart campus: Smart Society, Smart Economy, Smart Environment, and Smart Governance. This alignment with smart city principles enables the smart campus framework to serve as both an evaluative tool and a roadmap for strategic planning, fostering sustainable and adaptive campus environments.
Notably, the study highlighted several areas that may require further refinement to enhance practical applicability. While consensus on the framework’s overall structure was strong, feedback from participants suggests that the Smart Economy dimension may benefit from additional contextualization to better align with non-commercial academic settings. Adjustments in categorization and indicator definitions could make the framework even more universally applicable, allowing it to accommodate diverse institutional goals without compromising its core intent. Additionally, the study revealed that some indicators could be streamlined to avoid redundancy, ensuring ease of implementation and assessment.
The study’s findings also reflect broader trends in the digital transformation of higher education. The COVID-19 pandemic accelerated the adoption of smart technologies, spotlighting the urgent need for frameworks that can guide this rapid evolution. The validated framework offers institutions a structured approach to assess and optimize their smart campus initiatives, balancing technological innovation with sustainability, inclusivity, and operational efficiency. As higher education institutions embrace AI, IoT, and other advanced technologies, frameworks like this one will be instrumental in measuring progress and identifying areas for further development.
Future research should continue to refine and expand the framework to keep pace with technological advancements and emerging needs in higher education. Periodic reassessments and updates could ensure that the framework remains adaptable to evolving priorities, such as cybersecurity, data governance, and environmental resilience. Moreover, expanding the expert panel to include voices from additional geographic regions and institutional types would further strengthen the framework’s global applicability.
In conclusion, this research presents a foundational tool for smart campus assessment, validated through expert consensus and designed to support higher education institutions in their journey toward becoming more intelligent, responsive, and resilient. By integrating a robust set of indicators across key performance areas, the framework offers a pathway for institutions to strategically plan, implement, and evaluate smart campus initiatives. This pioneering effort lays the groundwork for ongoing research and development in smart campus frameworks, setting a standard for data-driven, inclusive, and sustainable campus transformation. Through continuous enhancement, the framework can evolve to remain relevant, supporting the long-term goal of advancing higher education in a digitally connected and dynamic world.
Author Contributions
K.P.: Data collection, processing, investigation, analysis, and writing—original draft; T.Y.: Supervision, conceptualization, writing—review and editing; M.L. and T.W.: Supervision, writing—review and editing. All authors have read and agreed to the published version of the manuscript.
Funding
This research received no external funding.
Data Availability Statement
The data are available upon request from the corresponding author.
Acknowledgments
The authors thank the editor and anonymous referees for their invaluable comments on an earlier version of the manuscript.
Conflicts of Interest
The authors declare no conflicts of interest.
References
- Ali, M.B. Internet of Things (IoT) to Foster Communication and Information Sharing: A Case of the UK Higher Education; IGI Global: Hershey, PA, USA, 2021; pp. 1–20. [Google Scholar]
- Dong, Z.; Zhang, Y.; Yip, C.; Swift, S.; Beswick, K. Smart campus: Definition, framework, technologies, and services. IET Smart Cities 2020, 2, 43–54. [Google Scholar] [CrossRef]
- Al-Shoqran, M.; Shorman, S.; Al-Shoqran, M.; Shorman, S. A Review on smart universities and artificial intelligence. In The Fourth Industrial Revolution: Implementation of Artificial Intelligence for Growing Business Success Studies in Computational Intelligence; Springer: Cham, Switzerland, 2021. [Google Scholar]
- Pagliaro, F.; Mattoni, B.; Gugliermenti, F.; Bisegna, F.; Azzaro, B.; Tomei, F.; Catucci, S. A roadmap toward the development of Sapienza Smart Campus. In Proceedings of the 2016 IEEE 16th International Conference on Environment and Electrical Engineering (EEEIC), Florence, Italy, 7–10 June 2016. [Google Scholar]
- Aion, N.; Helmandollar, L.; Wang, M.; Ng, J. Intelligent campus (iCampus) impact study. In Proceedings of the 2012 IEEE/WIC/ACM International Conferences on Web Intelligence and Intelligent Agent Technology, Macau, China, 4–7 December 2012; pp. 291–295. [Google Scholar]
- Luckyardi, S.; Jurriyati, R.; Disman, D.; Dirgantari, P.D. A Systematic Review of the IoT in Smart University: Model and Contribution. J. Sci. Technol. 2022, 7, 529–550. [Google Scholar] [CrossRef]
- Hidayat, D.; Sensuse, D. Knowledge Management Model for Smart Campus in Indonesia. Data 2022, 7, 7. [Google Scholar] [CrossRef]
- Horvath, D.; Csordas, T.; Ásvanyi, K.; Faludi, J.; Cosovan, A.; Simay, A.; Komar, Z. Will Interfaces Take Over the Physical Workplace in Higher Education? A Pessimistic View of the Future. J. Corp. Real Estate 2021, 24, 108–123. [Google Scholar] [CrossRef]
- Zaballos, A.; Briones, A.; Massa, A.; Centelles, P.; Caballero, V. A Smart Campus’ Digital Twin for Sustainable Comfort Monitoring. Sustainability 2020, 12, 9196. [Google Scholar] [CrossRef]
- Imbar, R.; Supangkat, S.; Langi, A. Smart Campus Model: A Literature Review. In Proceedings of the 2020 International Conference on ICT for Smart Society (ICISS), New York, NY, USA, 19–20 November 2020; pp. 1–7. [Google Scholar]
- Huertas, J.; Mahlknecht, J.; Lozoya-Santos, J.; Uribe, S.; López-Guajardo, E.; Ramirez-Mendoza, R. Campus City Project: Challenge Living Lab for Smart Cities Living Lab for Smart Cities. Appl Sci. 2021, 11, 23. [Google Scholar] [CrossRef]
- Qureshi, M.; Khan, N.; Bahru, J.; Ismail, F. Digital Technologies in Education 4.0. Does it Enhance the Effectiveness of Learning? A Systematic Literature Review. Int. J. Int. Mob. Technol. 2021, 15, 31–47. [Google Scholar] [CrossRef]
- Marson, M. Smart Building Advantage: Unlocking the Value of Smart Building Technologies; Emerald: London, UK, 2024. [Google Scholar]
- Polin, K.; Yigitcanlar, T.; Washington, T.; Limb, M. Unpacking smart campus assessment: Developing a framework via narrative literature review. Sustainability 2024, 16, 2494. [Google Scholar] [CrossRef]
- Zhang, Y. Challenges and Strategies of Student Management in Universities in the Context of Big Data. Mob. Inf. Syst. 2022, 3537468. [Google Scholar] [CrossRef]
- Chen, Z.; Liu, Y. Research and Construction of University Data Governance Platform Based on Smart Campus Environment. In Proceedings of the 3rd International Conference on Artificial Intelligence and Advanced Manufacture, Manchester, UK, 23–25 October 2021; pp. 450–455. [Google Scholar]
- Yigitcanlar, T.; Dur, F. Making space and place for knowledge communities: Lessons for Australian practice. Australas. J. Reg. Stud. 2013, 19, 36–63. [Google Scholar]
- Metaxiotis, K.; Carrillo, J.; Yigitcanlar, T. Knowledge-Based Development for Cities and Societies: Integrated Multi-Level Approaches; IGI Global: Hersey, PA, USA, 2010. [Google Scholar]
- Sarimin, M.; Yigitcanlar, T. Towards a comprehensive and integrated knowledge-based urban development model: Status quo and directions. Int. J. Knowl. Based Dev. 2012, 3, 175–192. [Google Scholar] [CrossRef]
- Pancholi, S.; Yigitcanlar, T.; Guaralda, M. Place making for innovation and knowledge-intensive activities: The Australian experience. Technol. Forecast. Soc. Change 2019, 146, 616–625. [Google Scholar] [CrossRef]
- Min-Allah, N.; Alrashed, S. Smart Campus—A Sketch. Sustain. Cities Soc. 2020, 59, 102231. [Google Scholar] [CrossRef] [PubMed]
- Polin, K.; Yigitcanlar, T.; Limb, M.; Washington, T. The making of smart campus: A review and conceptual framework. Buildings 2023, 13, 891. [Google Scholar] [CrossRef]
- Yigitcanlar, T.; Degirmenci, K.; Butler, L.; Desouza, K. What are the key factors affecting smart city transformation readiness? Evidence from Australian cities. Cities 2022, 120, 103434. [Google Scholar]
- Awuzie, B.; Ngowi, A.; Omotayo, T.; Obi, L.; Akotia, J. Facilitating Successful Smart Campus Transitions: A Systems Thinking-SWOT Analysis Approach. Appl. Sci. 2021, 11, 2044. [Google Scholar] [CrossRef]
- AbuAlnaaj, K.; Ahmed, V.; Saboor, S. A strategic framework for smart campus. In Proceedings of the International Conference on Industrial Engineering and Operations Management, Dubai, United Arab Emirates, 10–12 March 2020; Volume 22, pp. 790–798. [Google Scholar]
- Landeta, J. Elmetodo Delphi. Unatecnica de Prevision de la Incertidumbre; Editorial Ariel, S: Barcelona, Spain, 1999. [Google Scholar]
- Silverman, D. Qualitative Research; Sage: London, UK, 2016. [Google Scholar]
- Avella, J. Delphi panels: Research design, procedures, advantages, and challenges. J. Doc Stud. 2016, 11, 305–321. [Google Scholar] [CrossRef]
- Hasson, F.; Keeney, S.; McKenna, H. Research guidelines for the Delphi survey technique. J. Adv. Nurs. 2000, 32, 1008–1015. [Google Scholar] [CrossRef]
- Vernon, W. The Delphi technique: A review. Int. J. Ther. Rehab. 2009, 16, 69–76. [Google Scholar] [CrossRef]
- Young, S.; Jamieson, L. Delivery methodology of the Delphi: A comparison of two approaches. J. Park Recreat. Adm. 2001, 19, 42–58. [Google Scholar]
- Shah, K.; Naidoo, K.; Loughman, J. Development of socially responsive competency frameworks for ophthalmic technicians and optometrists in Mozambique. Clin. Exp. Optom. 2016, 99, 173–182. [Google Scholar] [CrossRef] [PubMed]
- Ameyaw, E.E.; Chan, A.P.; Anna Walker, D. Evaluating key risks factors for PPP water projects in Ghana: A Delphi study. J. Facil. Manag. 2015, 13, 133155. [Google Scholar] [CrossRef]
- Mafi-Gholami, D.; Feghhi, J.; Danehkar, A.; Yarali, N. Classification and prioritization of negative factors affecting on mangrove forests using Delphi method (a case study: Mangrove forest of Homozgan Province, Iran. Adv. Biores. 2015, 6, 78–92. [Google Scholar]
- Nourouzian-Maleki, S.; Bell, S.; Hosseini, S.B.; Faizi, M. Developing and testing the framework for the assessment of neighbourhood liveability in two contrasting countries: Iran and Estonia. Ecol. Indic. 2015, 48, 263–271. [Google Scholar] [CrossRef]
- Alawadi, K.; Dooling, S. Challenges and opportunities for participatory planning approaches within Dubai’s urban context. J. Urban. 2016, 9, 276–301. [Google Scholar] [CrossRef]
- Diamond, I.; Grant, R.; Feldman, B.; Pencharz, P.; Ling, S.; Moore, A.; Wales, P. Defining consensus: A systematic review recommends methodologic criteria for reporting of Delphi studies. J. Clin. Epid. 2014, 67, 401–409. [Google Scholar] [CrossRef]
- Esmaeilpoorarabi, N.; Yigitcanlar, T.; Guaralda, M.; Kamruzzaman, M. Does place quality matter for innovation districts? Determining the essential place characteristics from Brisbane’s knowledge precincts. Land Use Policy 2018, 79, 734–747. [Google Scholar] [CrossRef]
- McVie, R. A Methodology for Identifying Typologies to Improve Innovation District Outcomes: The Case of South East Queensland. Ph.D. Thesis, Queensland University of Technology, Brisbane, QLD, Australia, 2023. [Google Scholar]
- Okoli, C.; Pawlowski, S. The Delphi method as a research tool: An example, design considerations and applications. Inf. Manag. 2004, 42, 15–29. [Google Scholar] [CrossRef]
- Brady, S. Utilizing and adapting the Delphi method for use in qualitative research. Int. J. Qual. Met. 2015, 14, 1609406915621381. [Google Scholar] [CrossRef]
- Hanafin, S. Review on Literature on the Delphi Technique; Department of Children and Youth Affairs: Dublin, Ireland, 2004. [Google Scholar]
- Ludwig, B. Predicting the future: Have you considered using the Delphi methodology? J. Ext. 1997, 35. [Google Scholar]
- Schmiedel, T.; Vom Brocke, J.; Recker, J. Which cultural values matter to business process management? Results from a global Delphi study. Bus. Process Manag. J. 2013, 19, 292–317. [Google Scholar] [CrossRef]
- Zeeman, H.; Wright, C.; Hellyer, T. Developing design guidelines for inclusive housing: A multi-stakeholder approach using a Delphi method. J. Hous. Built Environ. 2016, 31, 761–772. [Google Scholar] [CrossRef]
- Gudes, O.; Kendall, E.; Yigitcanlar, T.; Pathak, V.; Baum, S. Rethinking health planning: A framework for organising information to underpin collaborative health planning. Health Inf. Manag. J. 2010, 39, 18–29. [Google Scholar] [CrossRef]


Disclaimer/Publisher’s Note: The statements, opinions and data contained in all publications are solely those of the individual author(s) and contributor(s) and not of MDPI and/or the editor(s). MDPI and/or the editor(s) disclaim responsibility for any injury to people or property resulting from any ideas, methods, instructions or products referred to in the content. |
© 2024 by the authors. Licensee MDPI, Basel, Switzerland. This article is an open access article distributed under the terms and conditions of the Creative Commons Attribution (CC BY) license (https://creativecommons.org/licenses/by/4.0/).