


Urban Building Energy Modeling to Support Climate-Sensitive Planning in the Suburban Areas of Santiago de Chile


Abstract
1. Introduction
1.1. Literature Review
1.2. Research Objectives
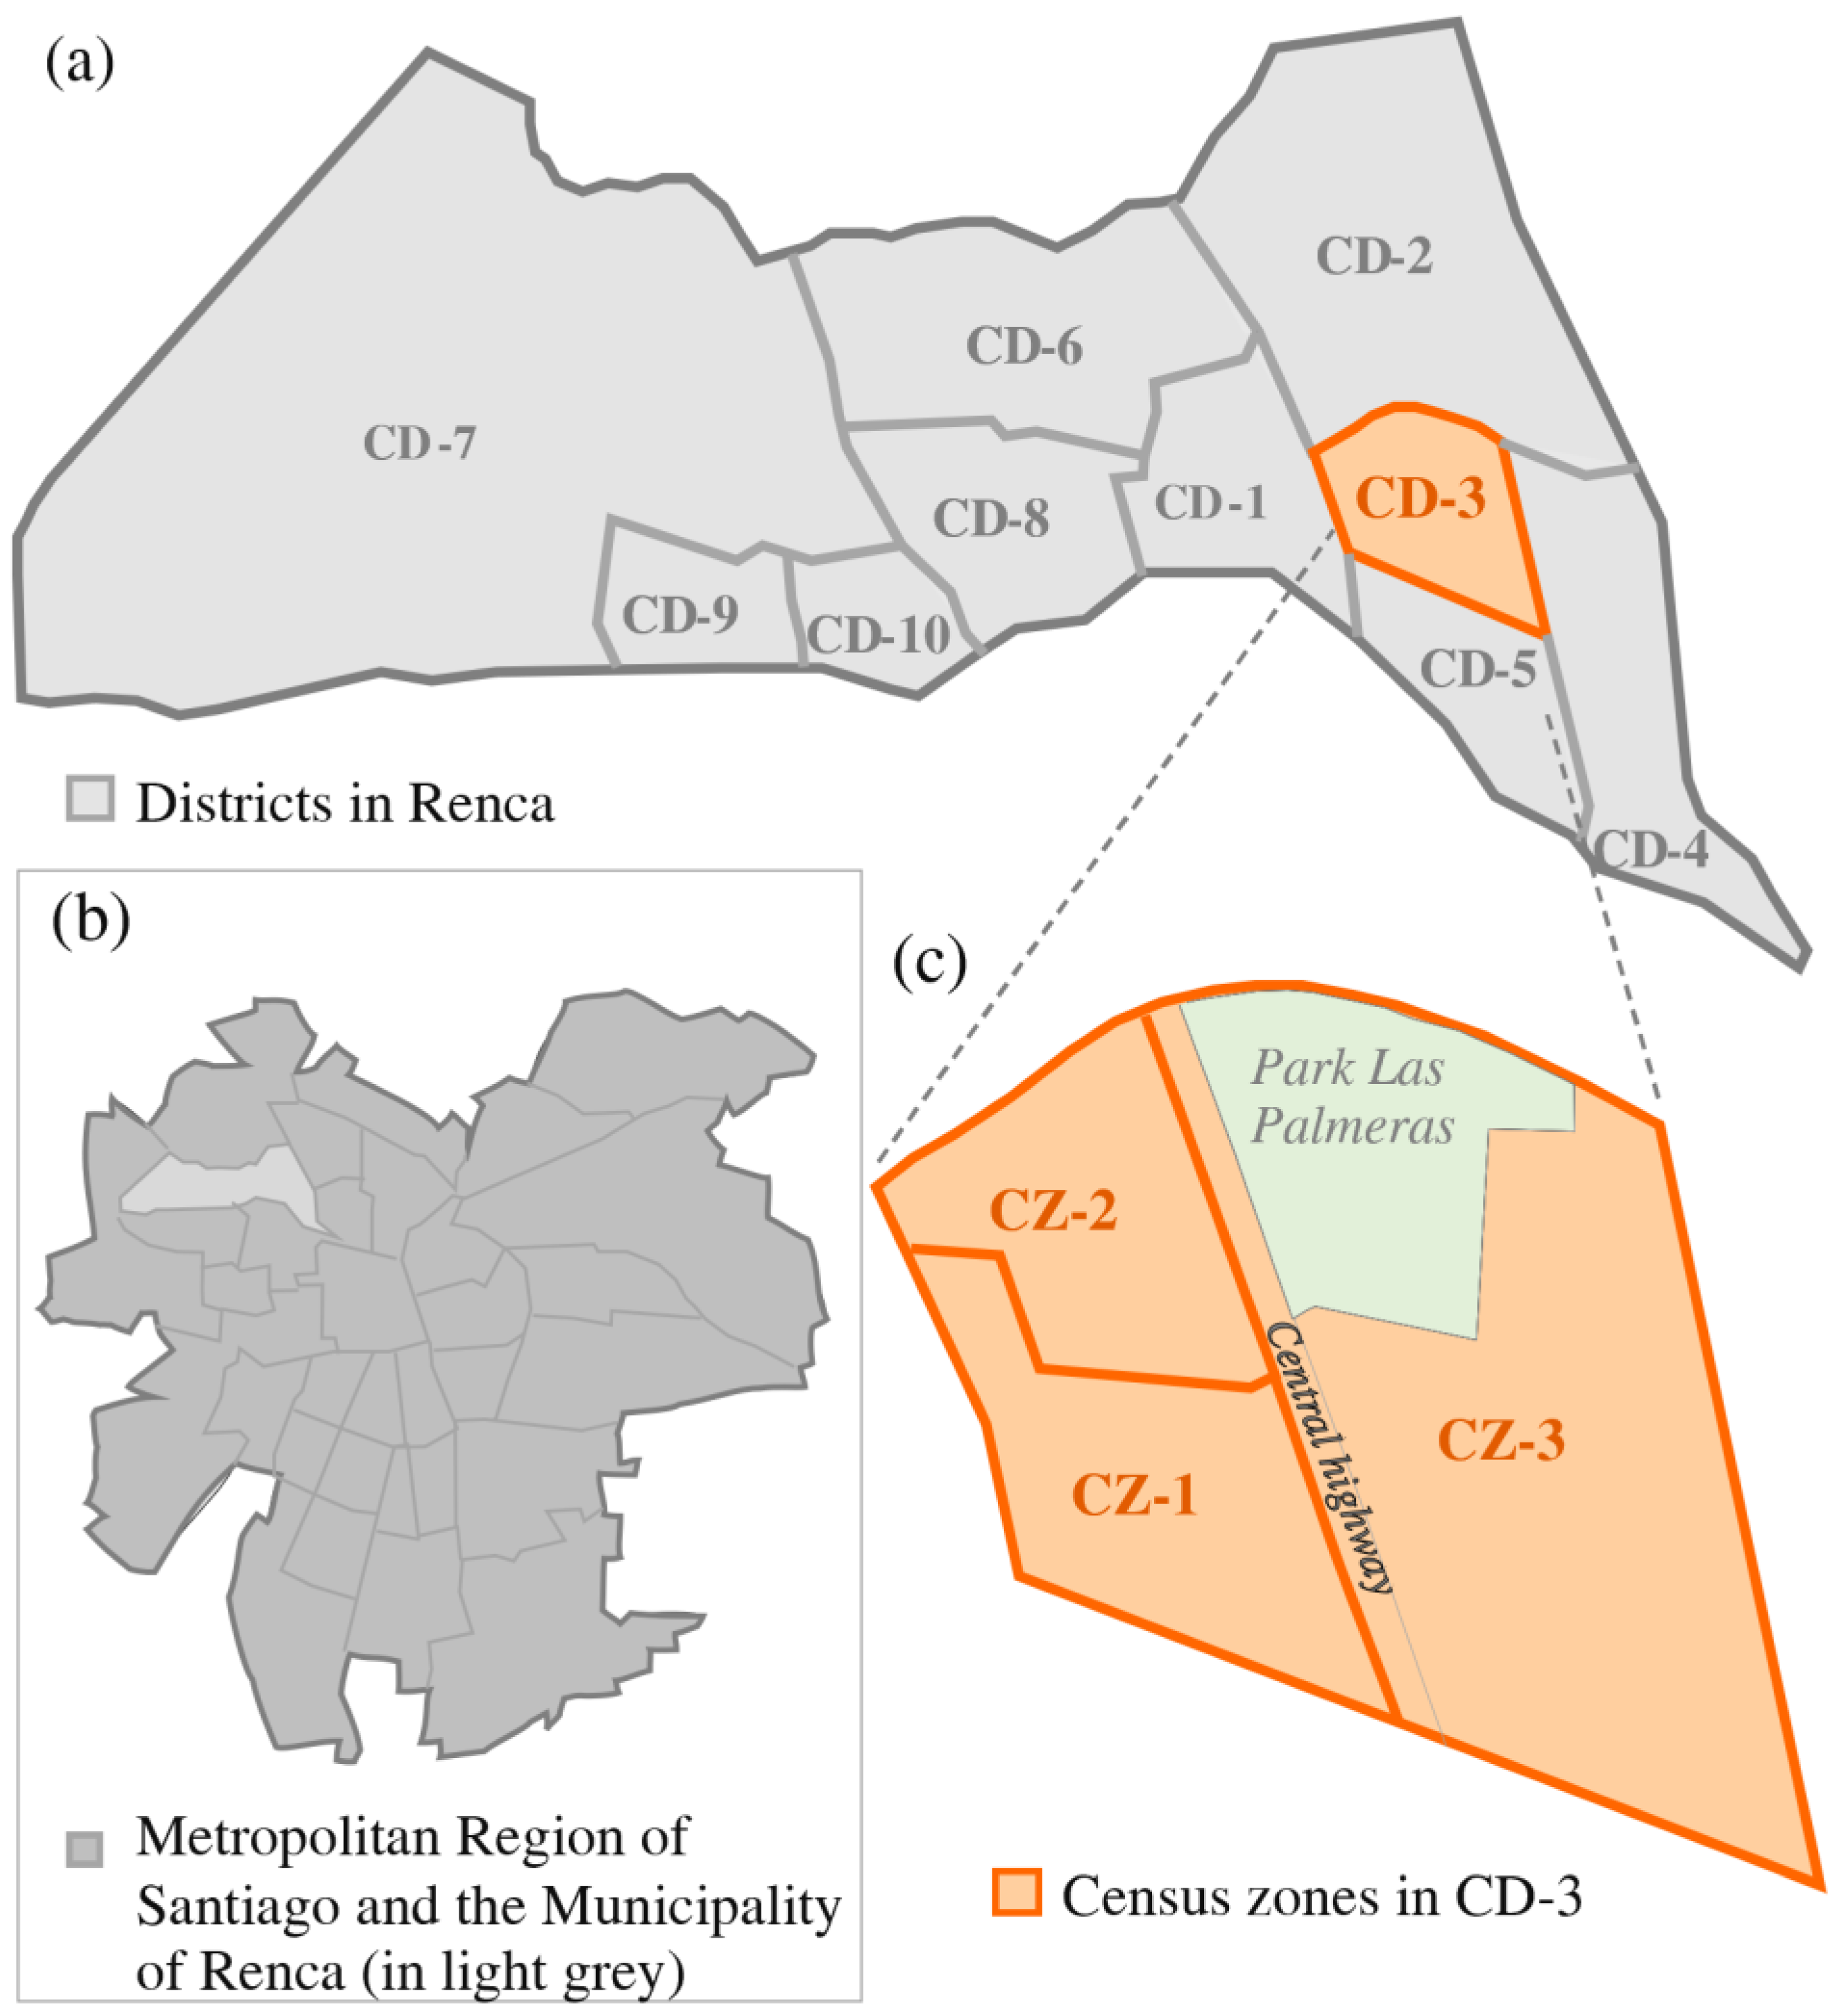
2. Renca and the District of José Miguel Carrera CD-3
2.1. Weather Data Characterization
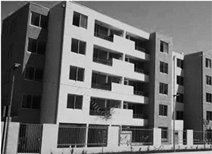
2.2. The Residential Building Stock in Renca
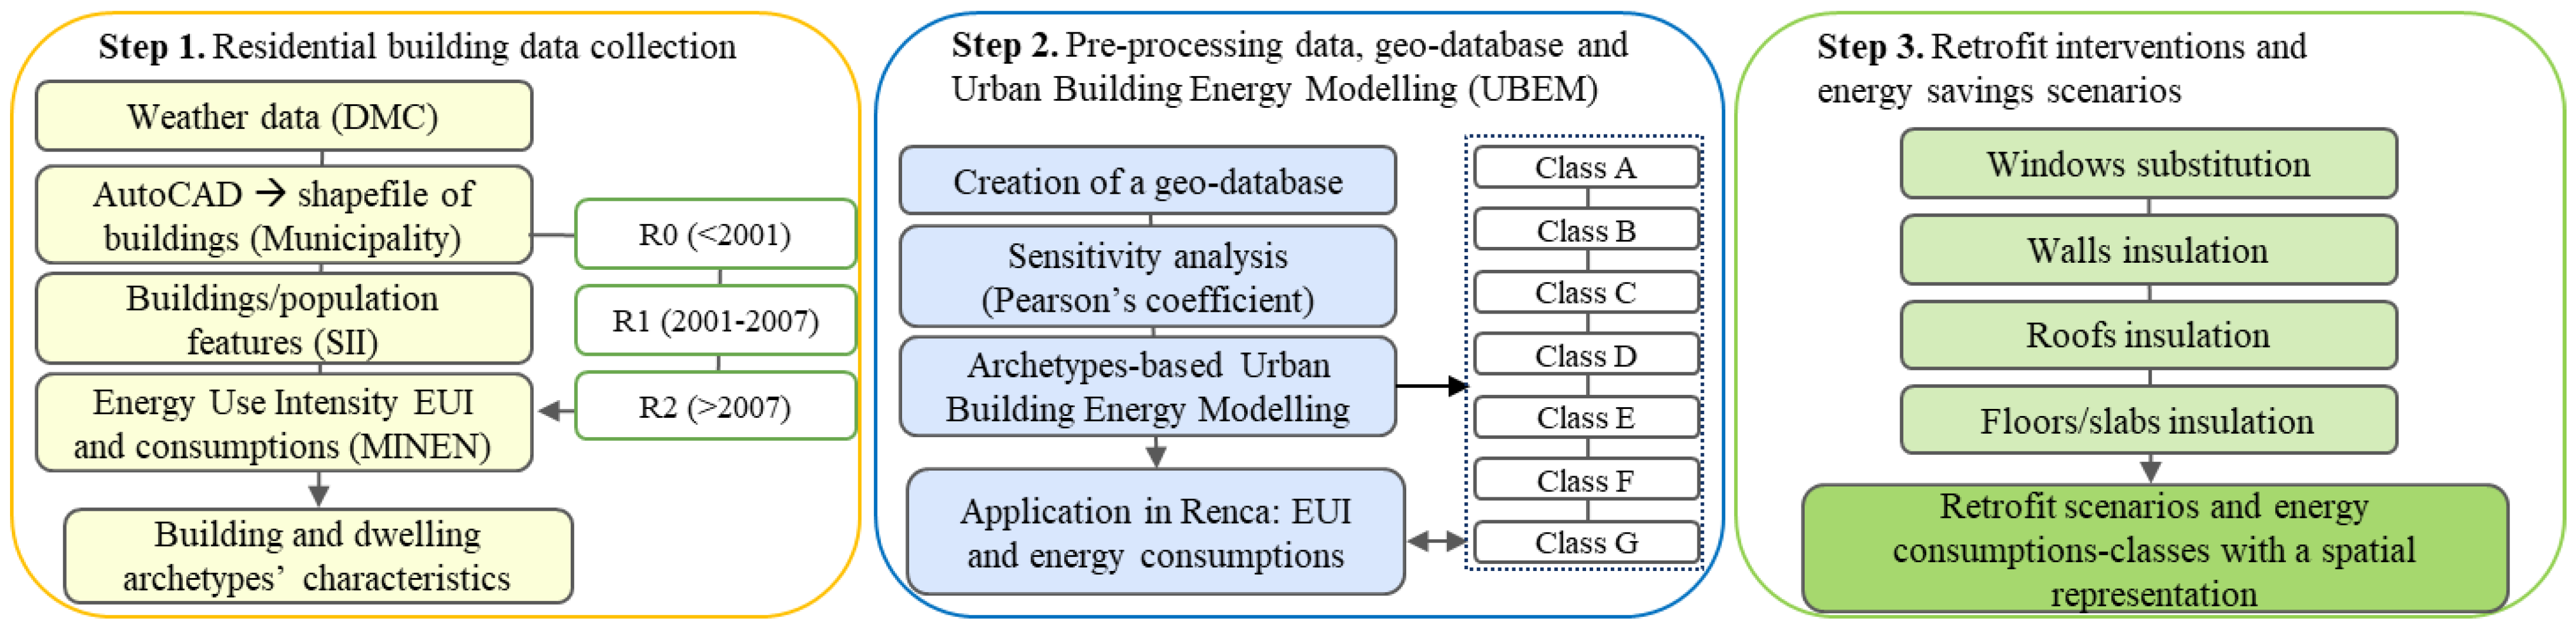
3. Material and Methods
- the cadaster of housing and population (2017) from the National Service of Internal Affairs (Servicio de Impuestos Internos, SII);
- the geometries of the building stock from the Master Plan of the commune of Renca (AutoCAD file of 2017);
- the energy consumptions in Chile and the characteristics of typical buildings from the Ministry of Energy in 2018 (Ministerio de Energía in Chile, MINEN);
- the Digital Elevation Model of the territory (DEM) from 2011;
- the weather data of 2017 from the Chilean Meteorological Office (Dirección Meteorológica de Chile, DMC).
- -
- data about the cadaster of housing and population (that is, at census section scale) were associated at the buildings; an example is the number of families or population in each building, which indicates the percentage of occupancy;
- -
- AutoCAD file of the Master Plan of Renca was geolocalized to calculate the geometries and associate the characteristics of the buildings, census sections, and districts in Renca;
- -
- archetype data was gathered and systematically compared with information from the existing built environment to assess their alignment within the commune of Renca;
- -
- the altitude of the terrain was associated at each building using a digital elevation model (DEM);
- -
- the weather stations were geo-localized, and the nearest one with similar altitude was identified to be representative of the local climate conditions.
Housing Data Collection (Step 1)
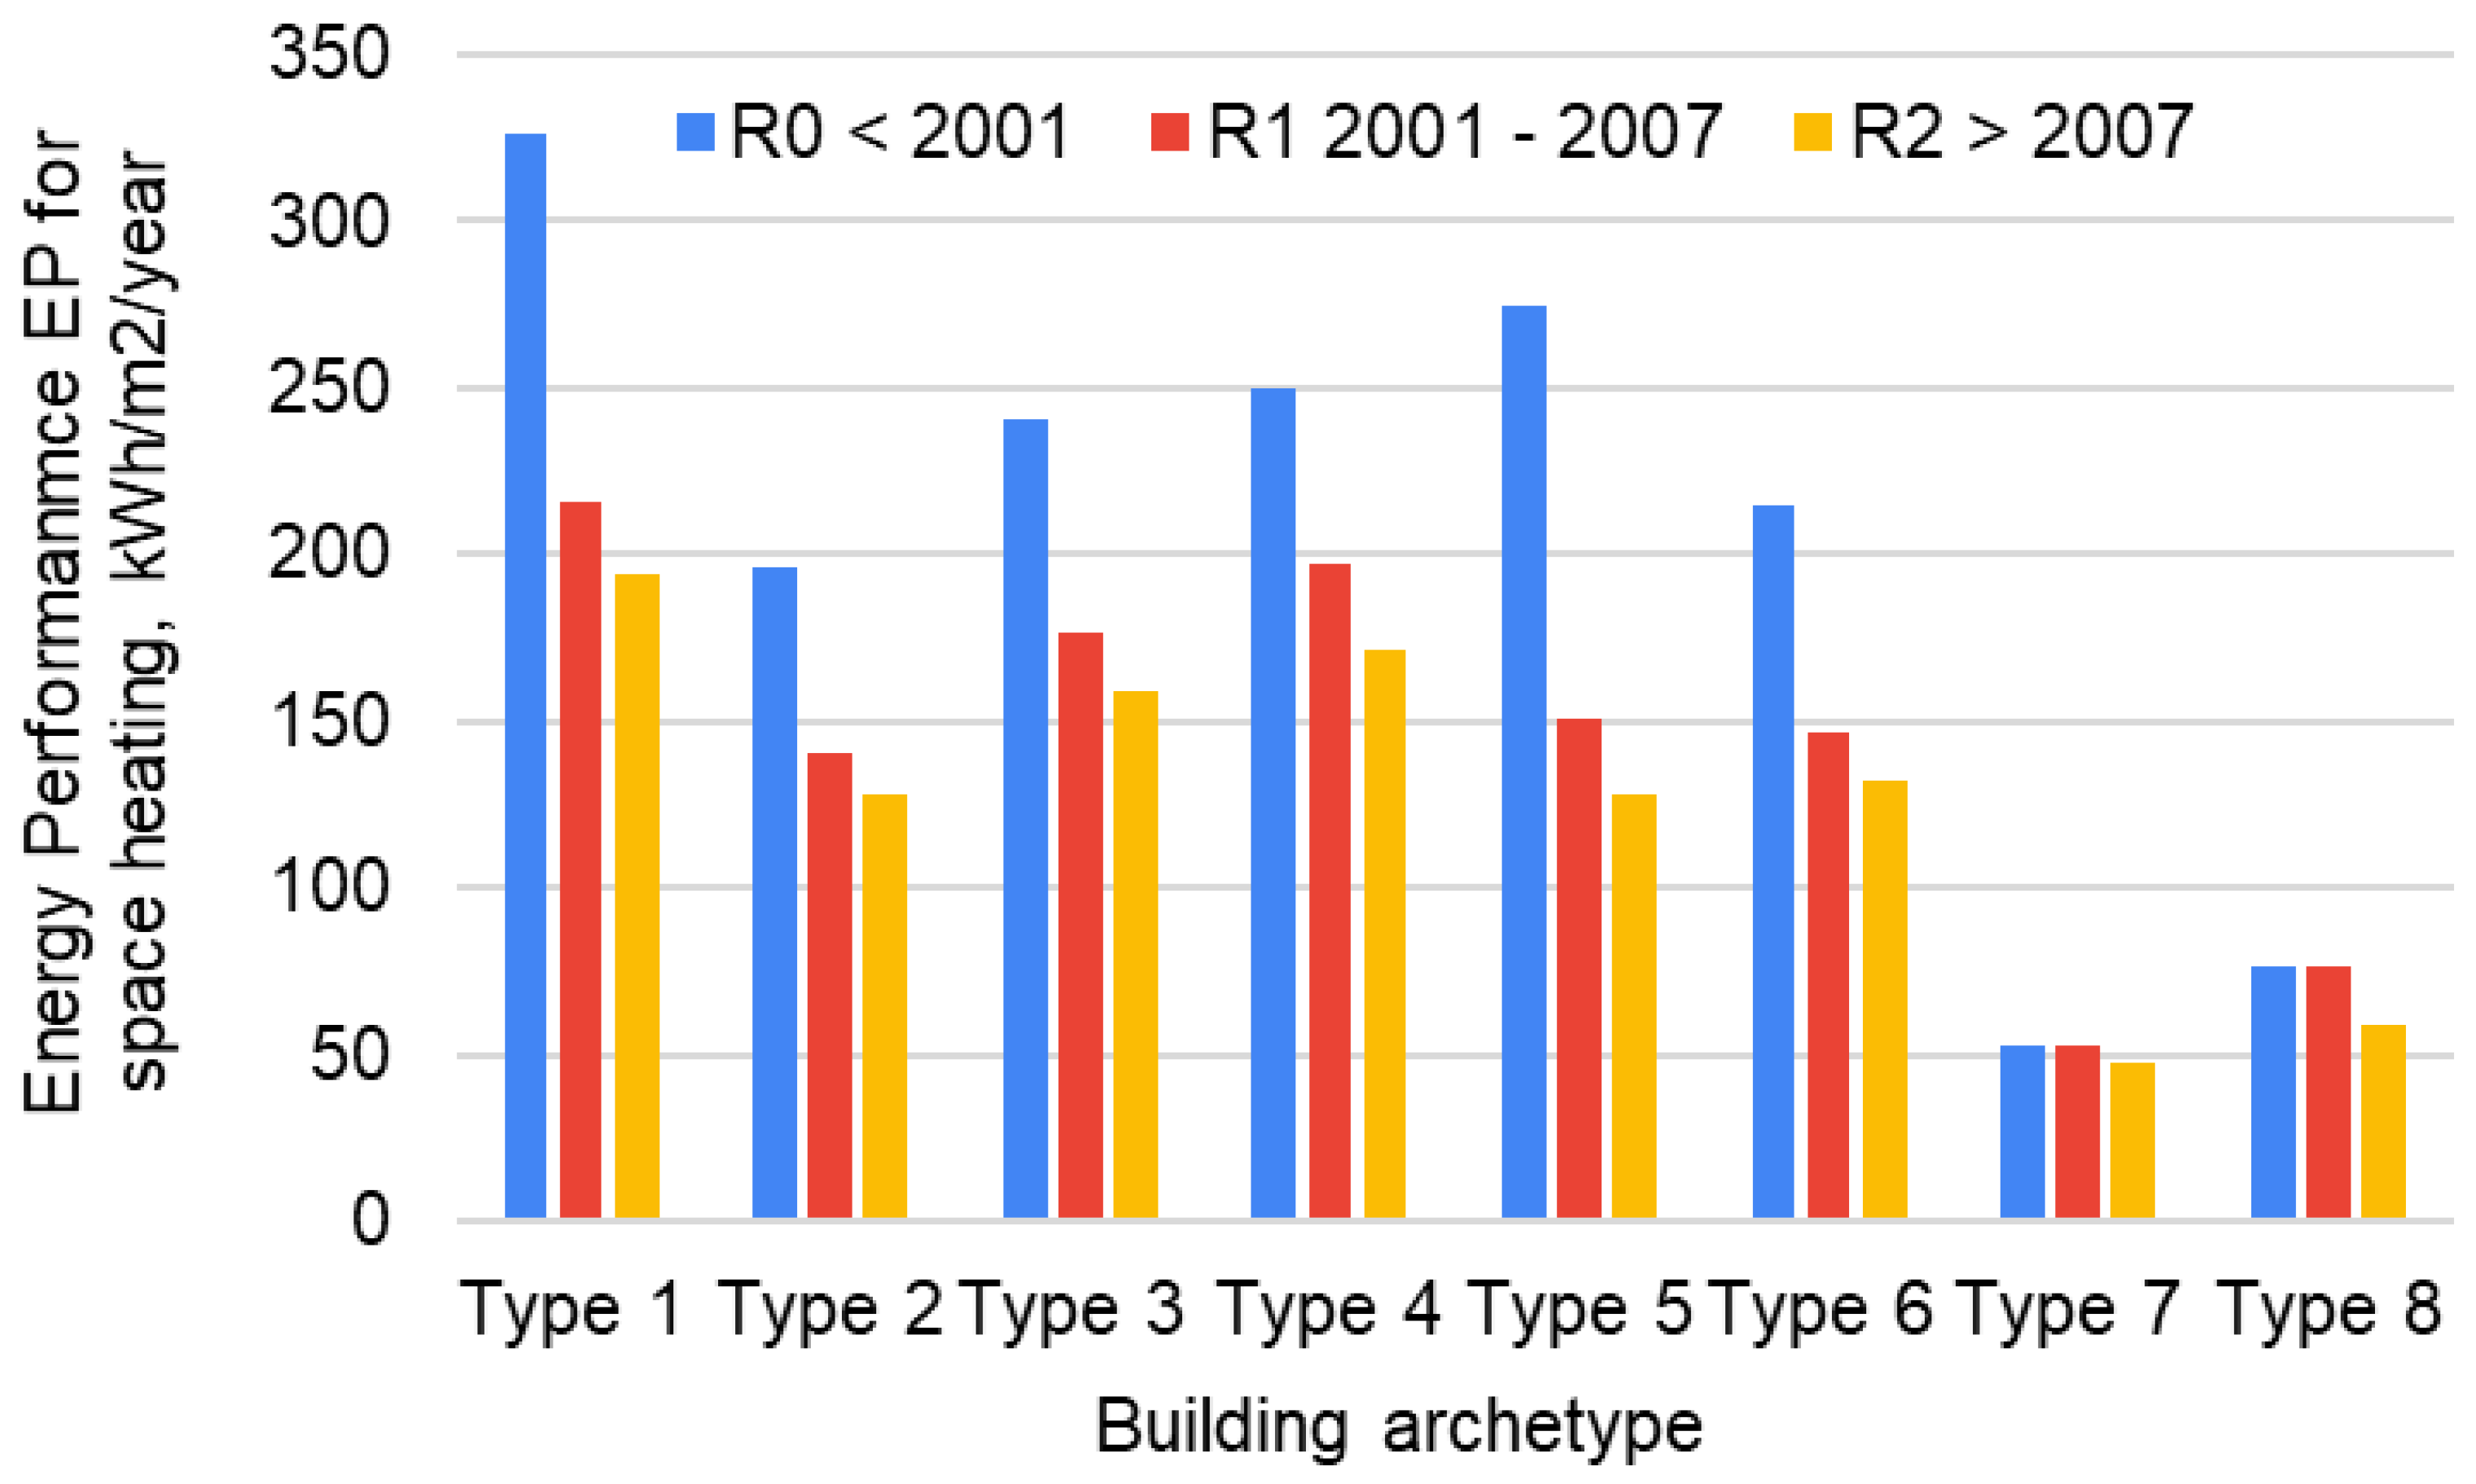
- different S/V values: the type 7 dwellings (with the lowest S/V ratio) and type 1 dwellings (with the highest S/V ratio) have an energy performance that varies between 50 and over 300 kWh/m2/year;
- different periods of construction (R0, R1, and R2): old buildings (i.e., R0) have a higher energy performance index; the EP is reduced by 20–30% from period R0 to R1 and by 3–10% from period R1 to R2;
- for the intermediate-floor apartments (types 7 and 8), energy-use changes only from period R1 to R2 because the walls represent the only heat-loss surfaces.
4. Results
4.1. Energy Modeling from Building Archetypes (Step 2)
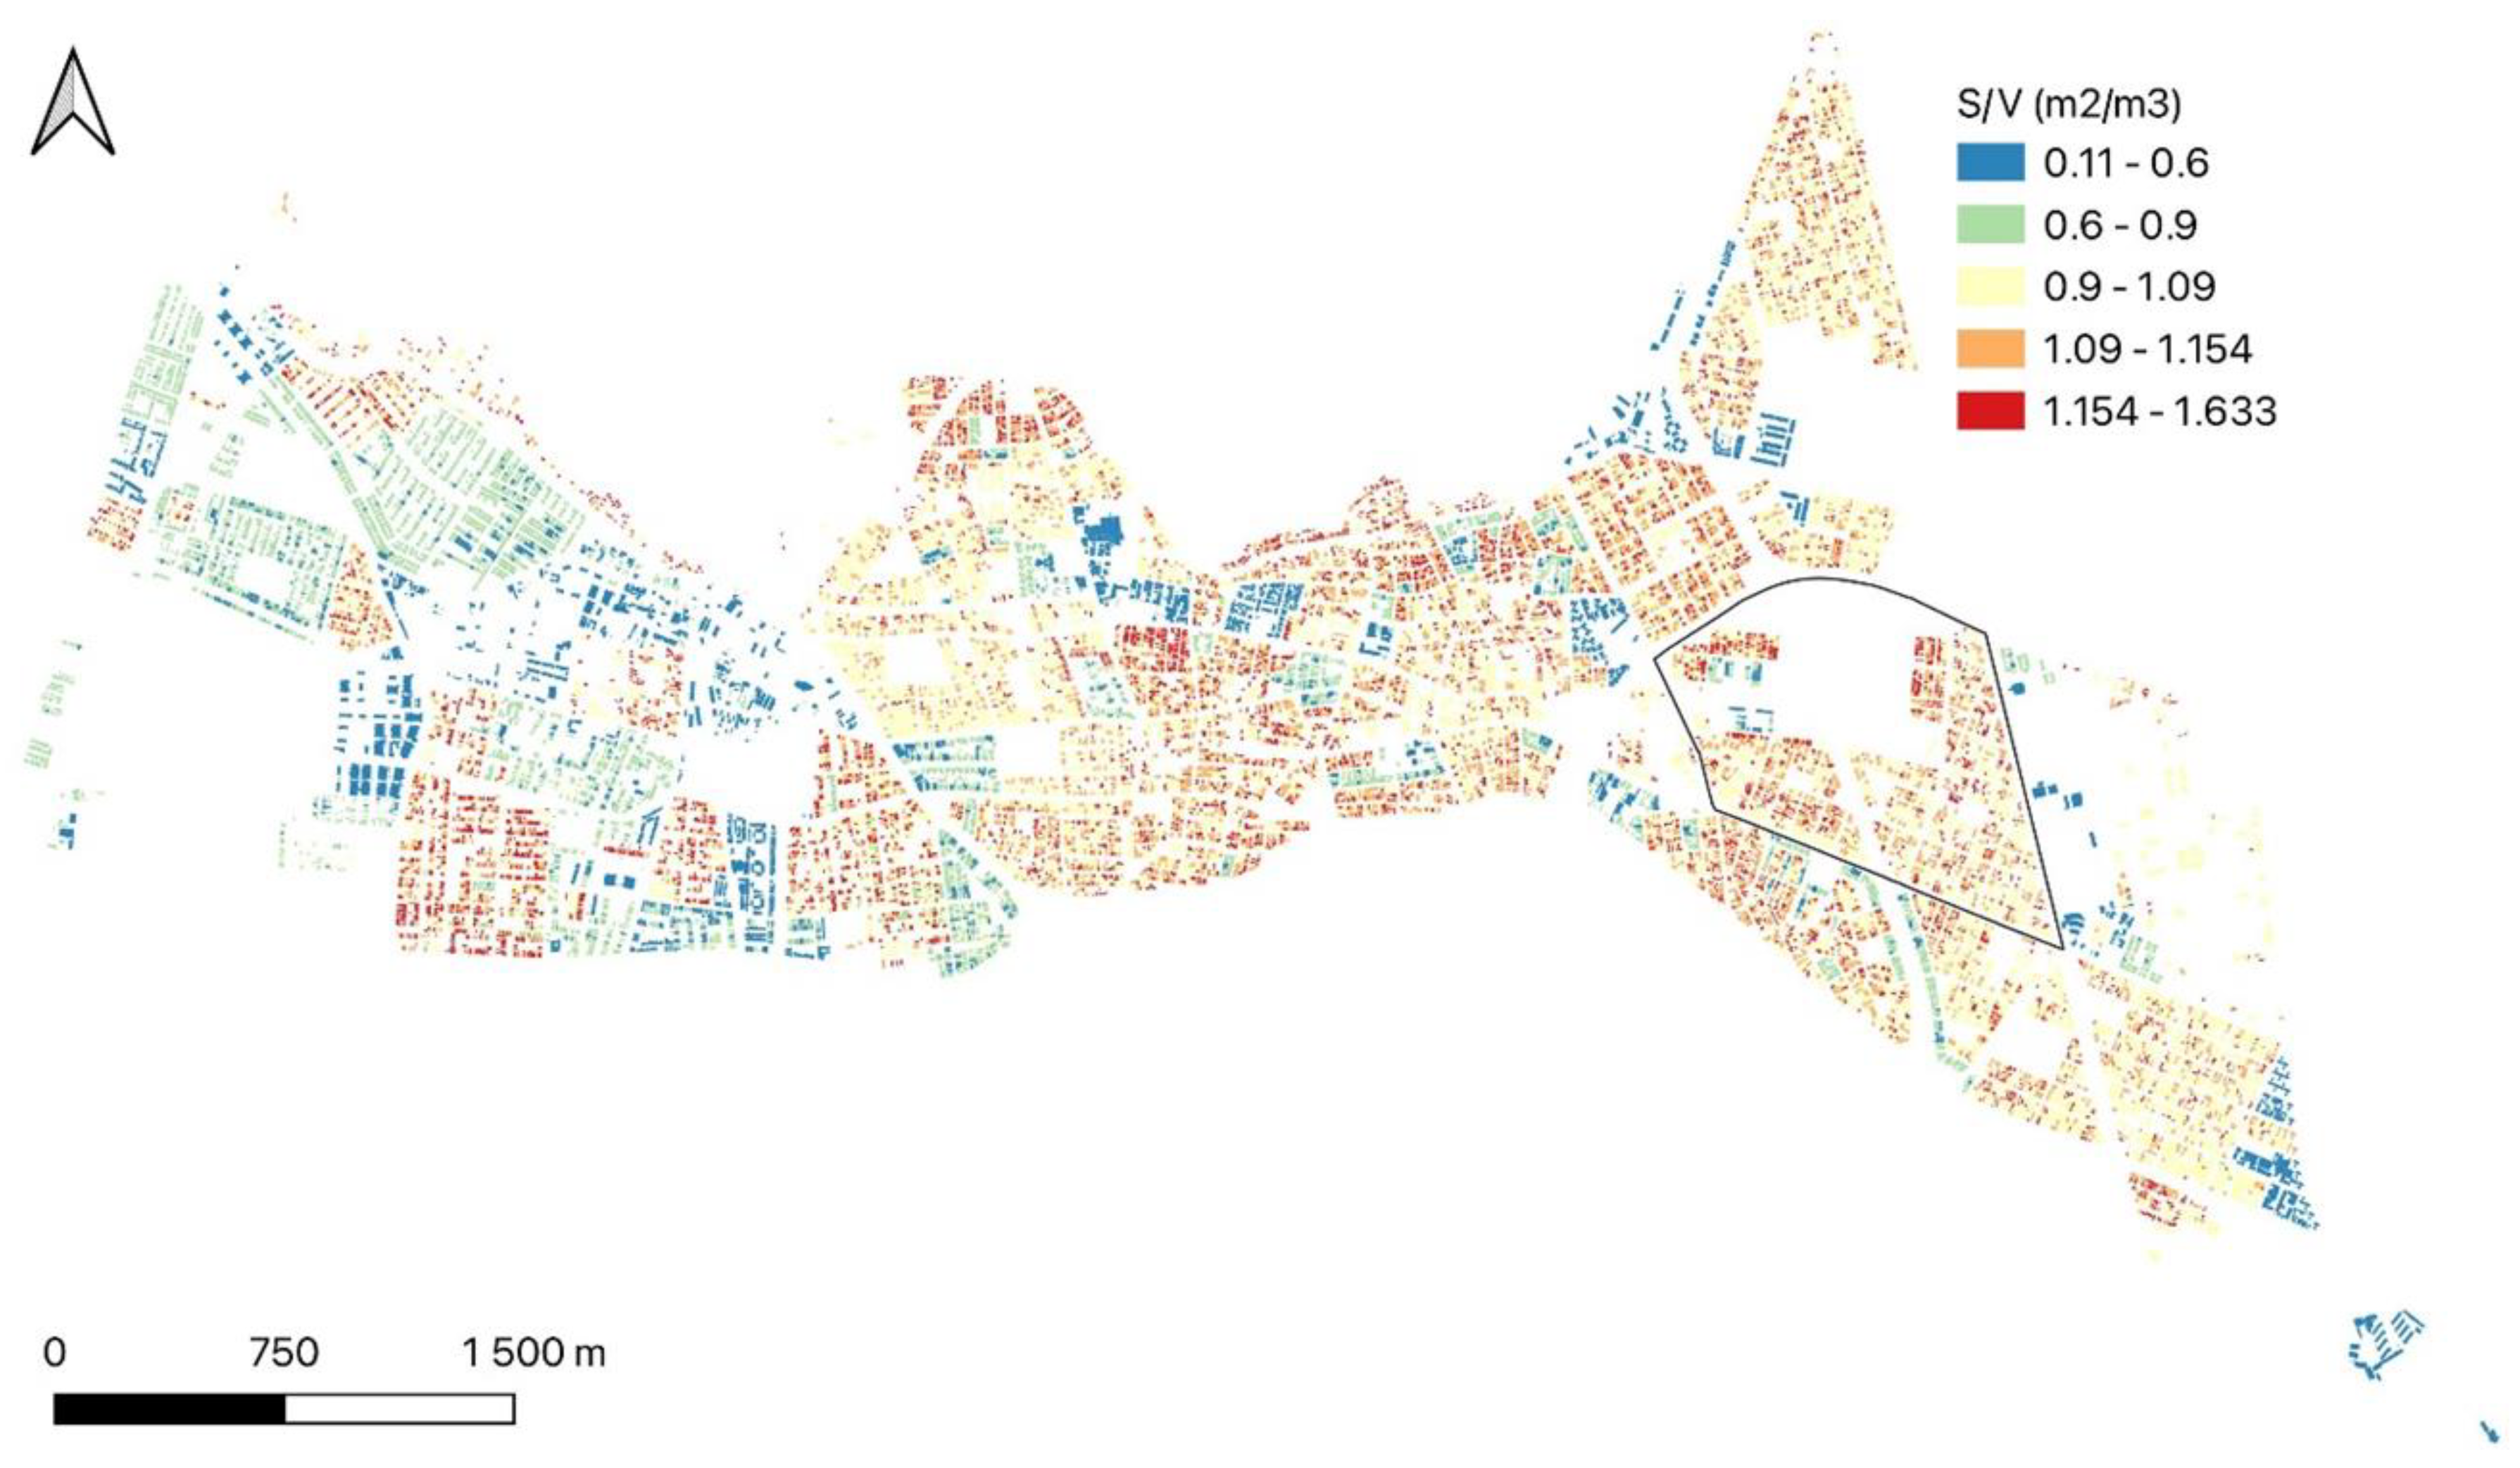
- a low-rise residential area of one-story single-family houses with S/V ratio higher than 1.09 m2/m3 (39.7%),
- terrace houses with two floors with an S/V = 0.9 − 1.09 m2/m3 (30.0%),
- little condominiums of 3–4 floors with an S/V of 0.6–0.9 m2/m3 (21.5%).
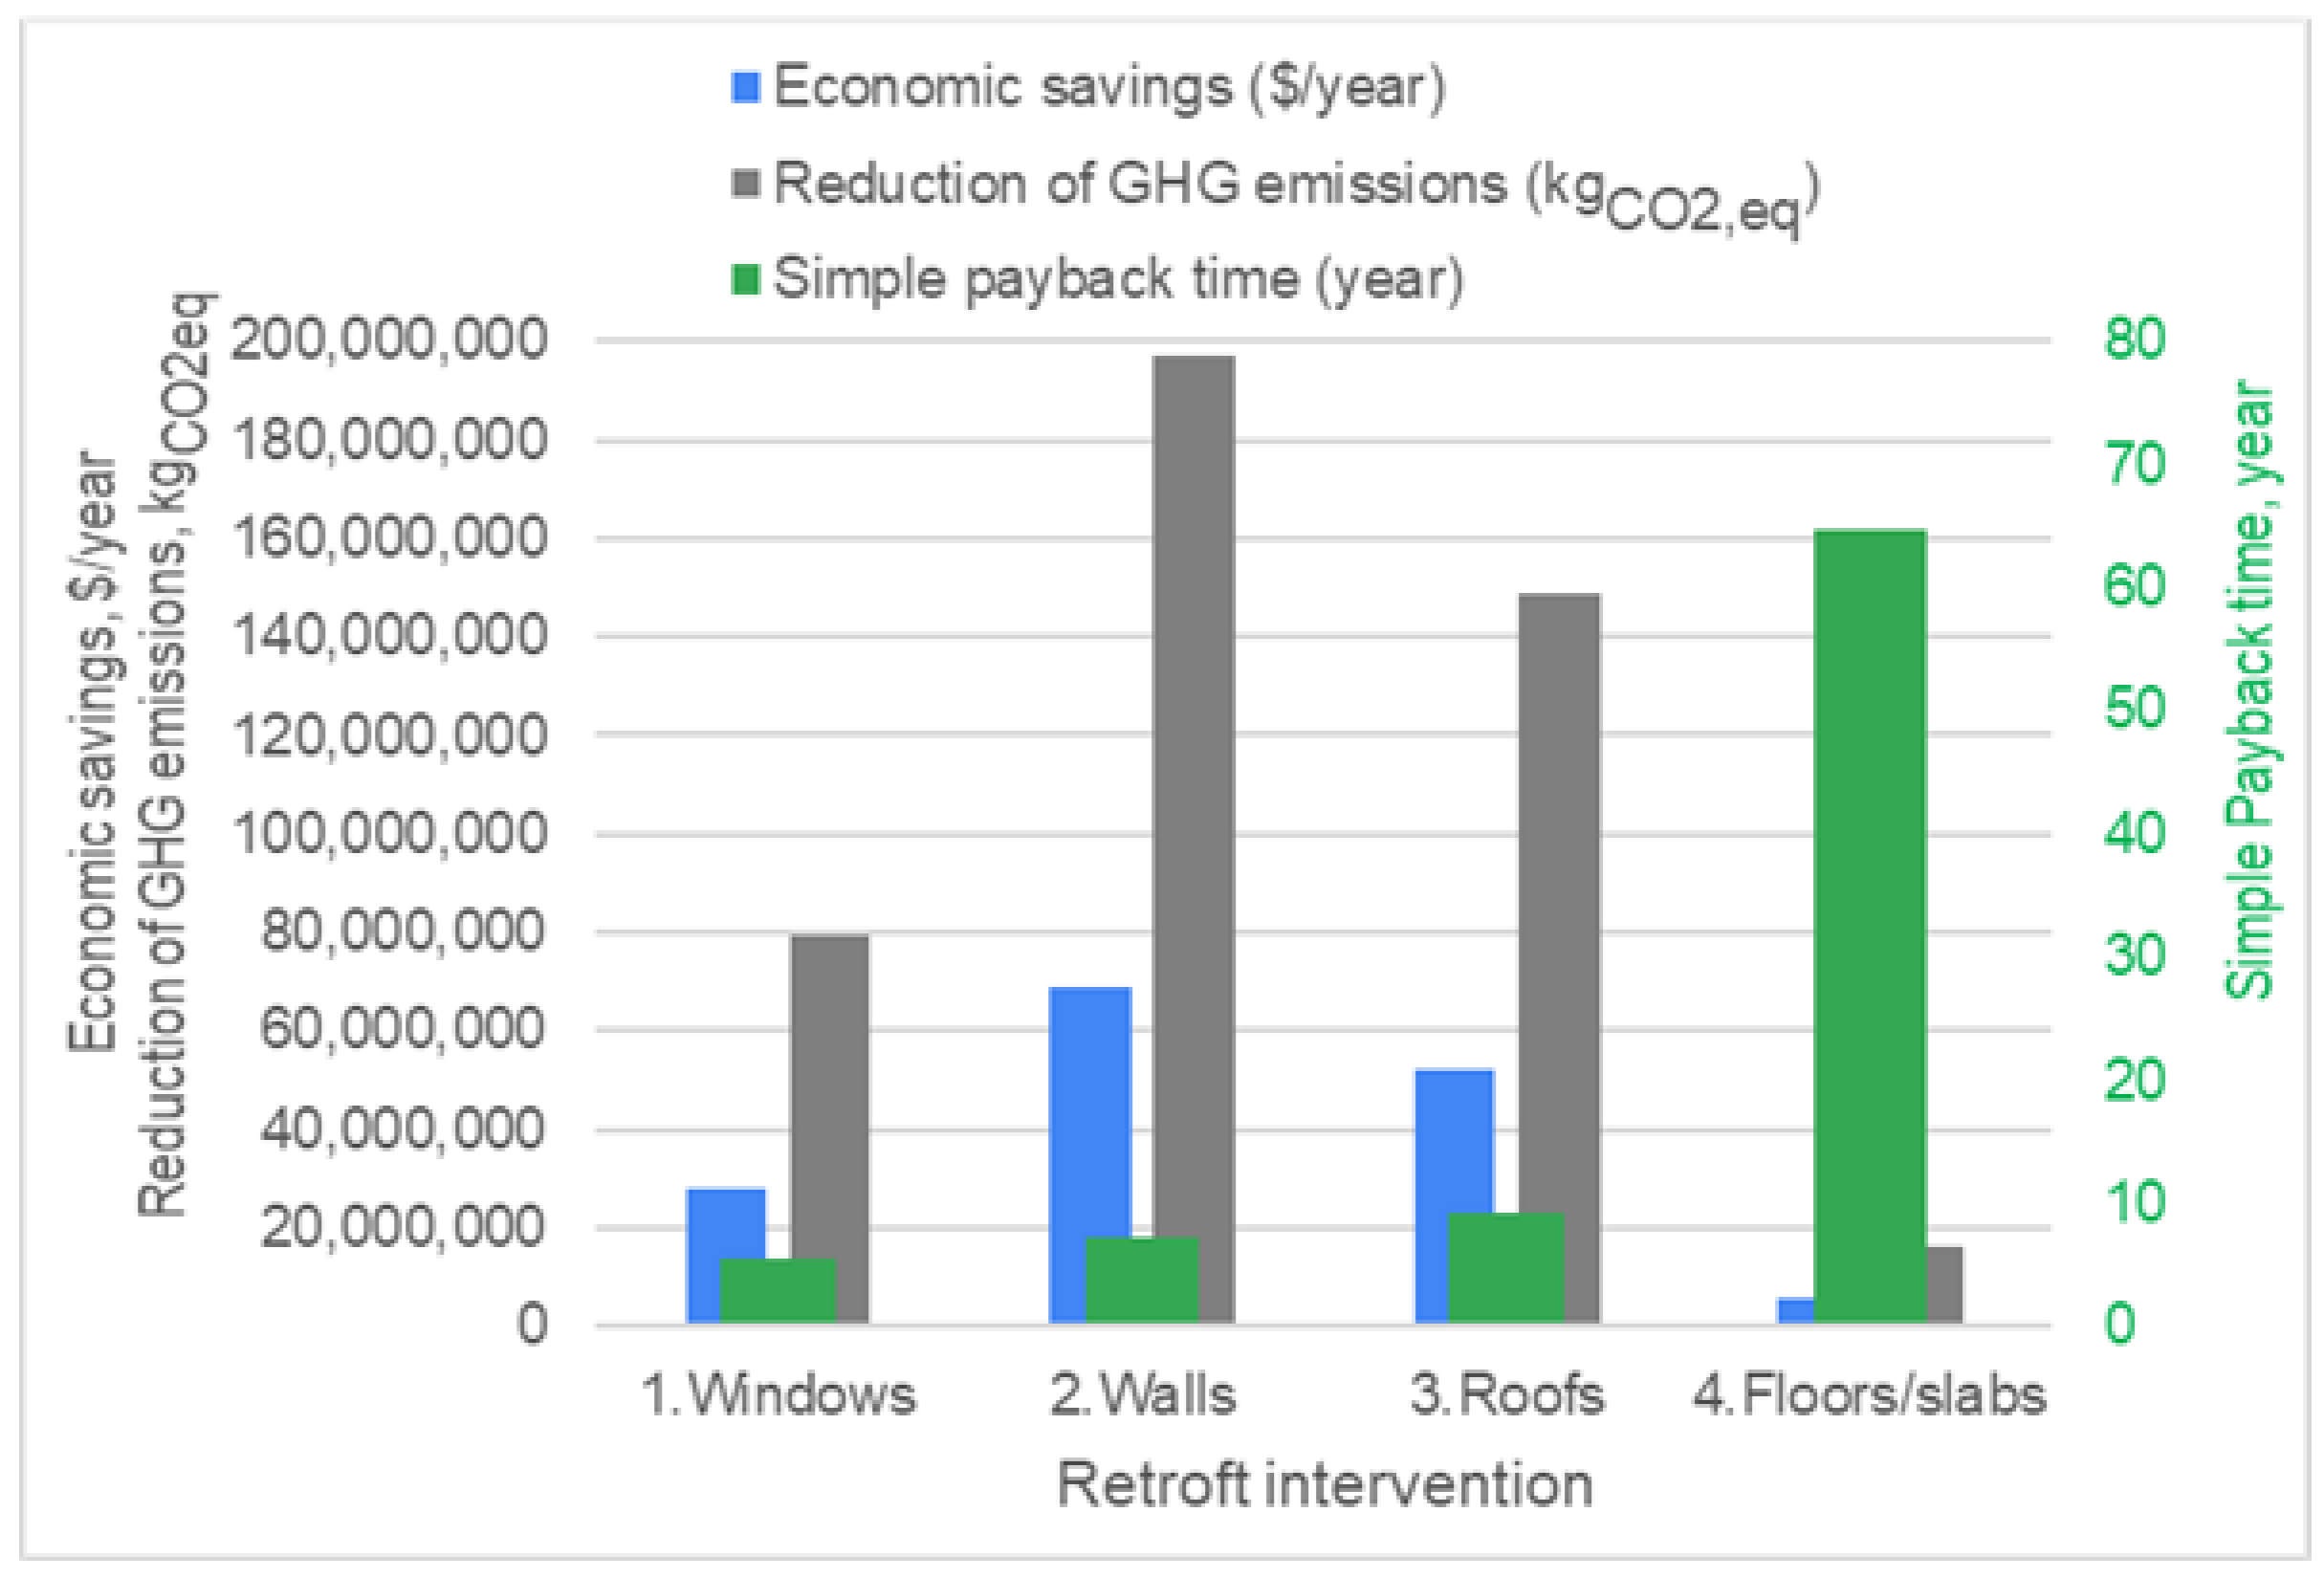
4.2. Retrofitting Interventions (Step 3)
- window replacement: existing windows are replaced with PVC casements and double-glazed windows (U = 1.1 W/m2/K);
- wall insulation: additional thermal insulation is installed on the outside of existing walls with a thickness of 20 cm;
- roof insulation: additional thermal insulation is installed on the inside of roofs with a thickness of 15 cm;
- floor insulation: additional thermal insulation is installed on the inferior slab/floor with a thickness of 1 cm.
- -
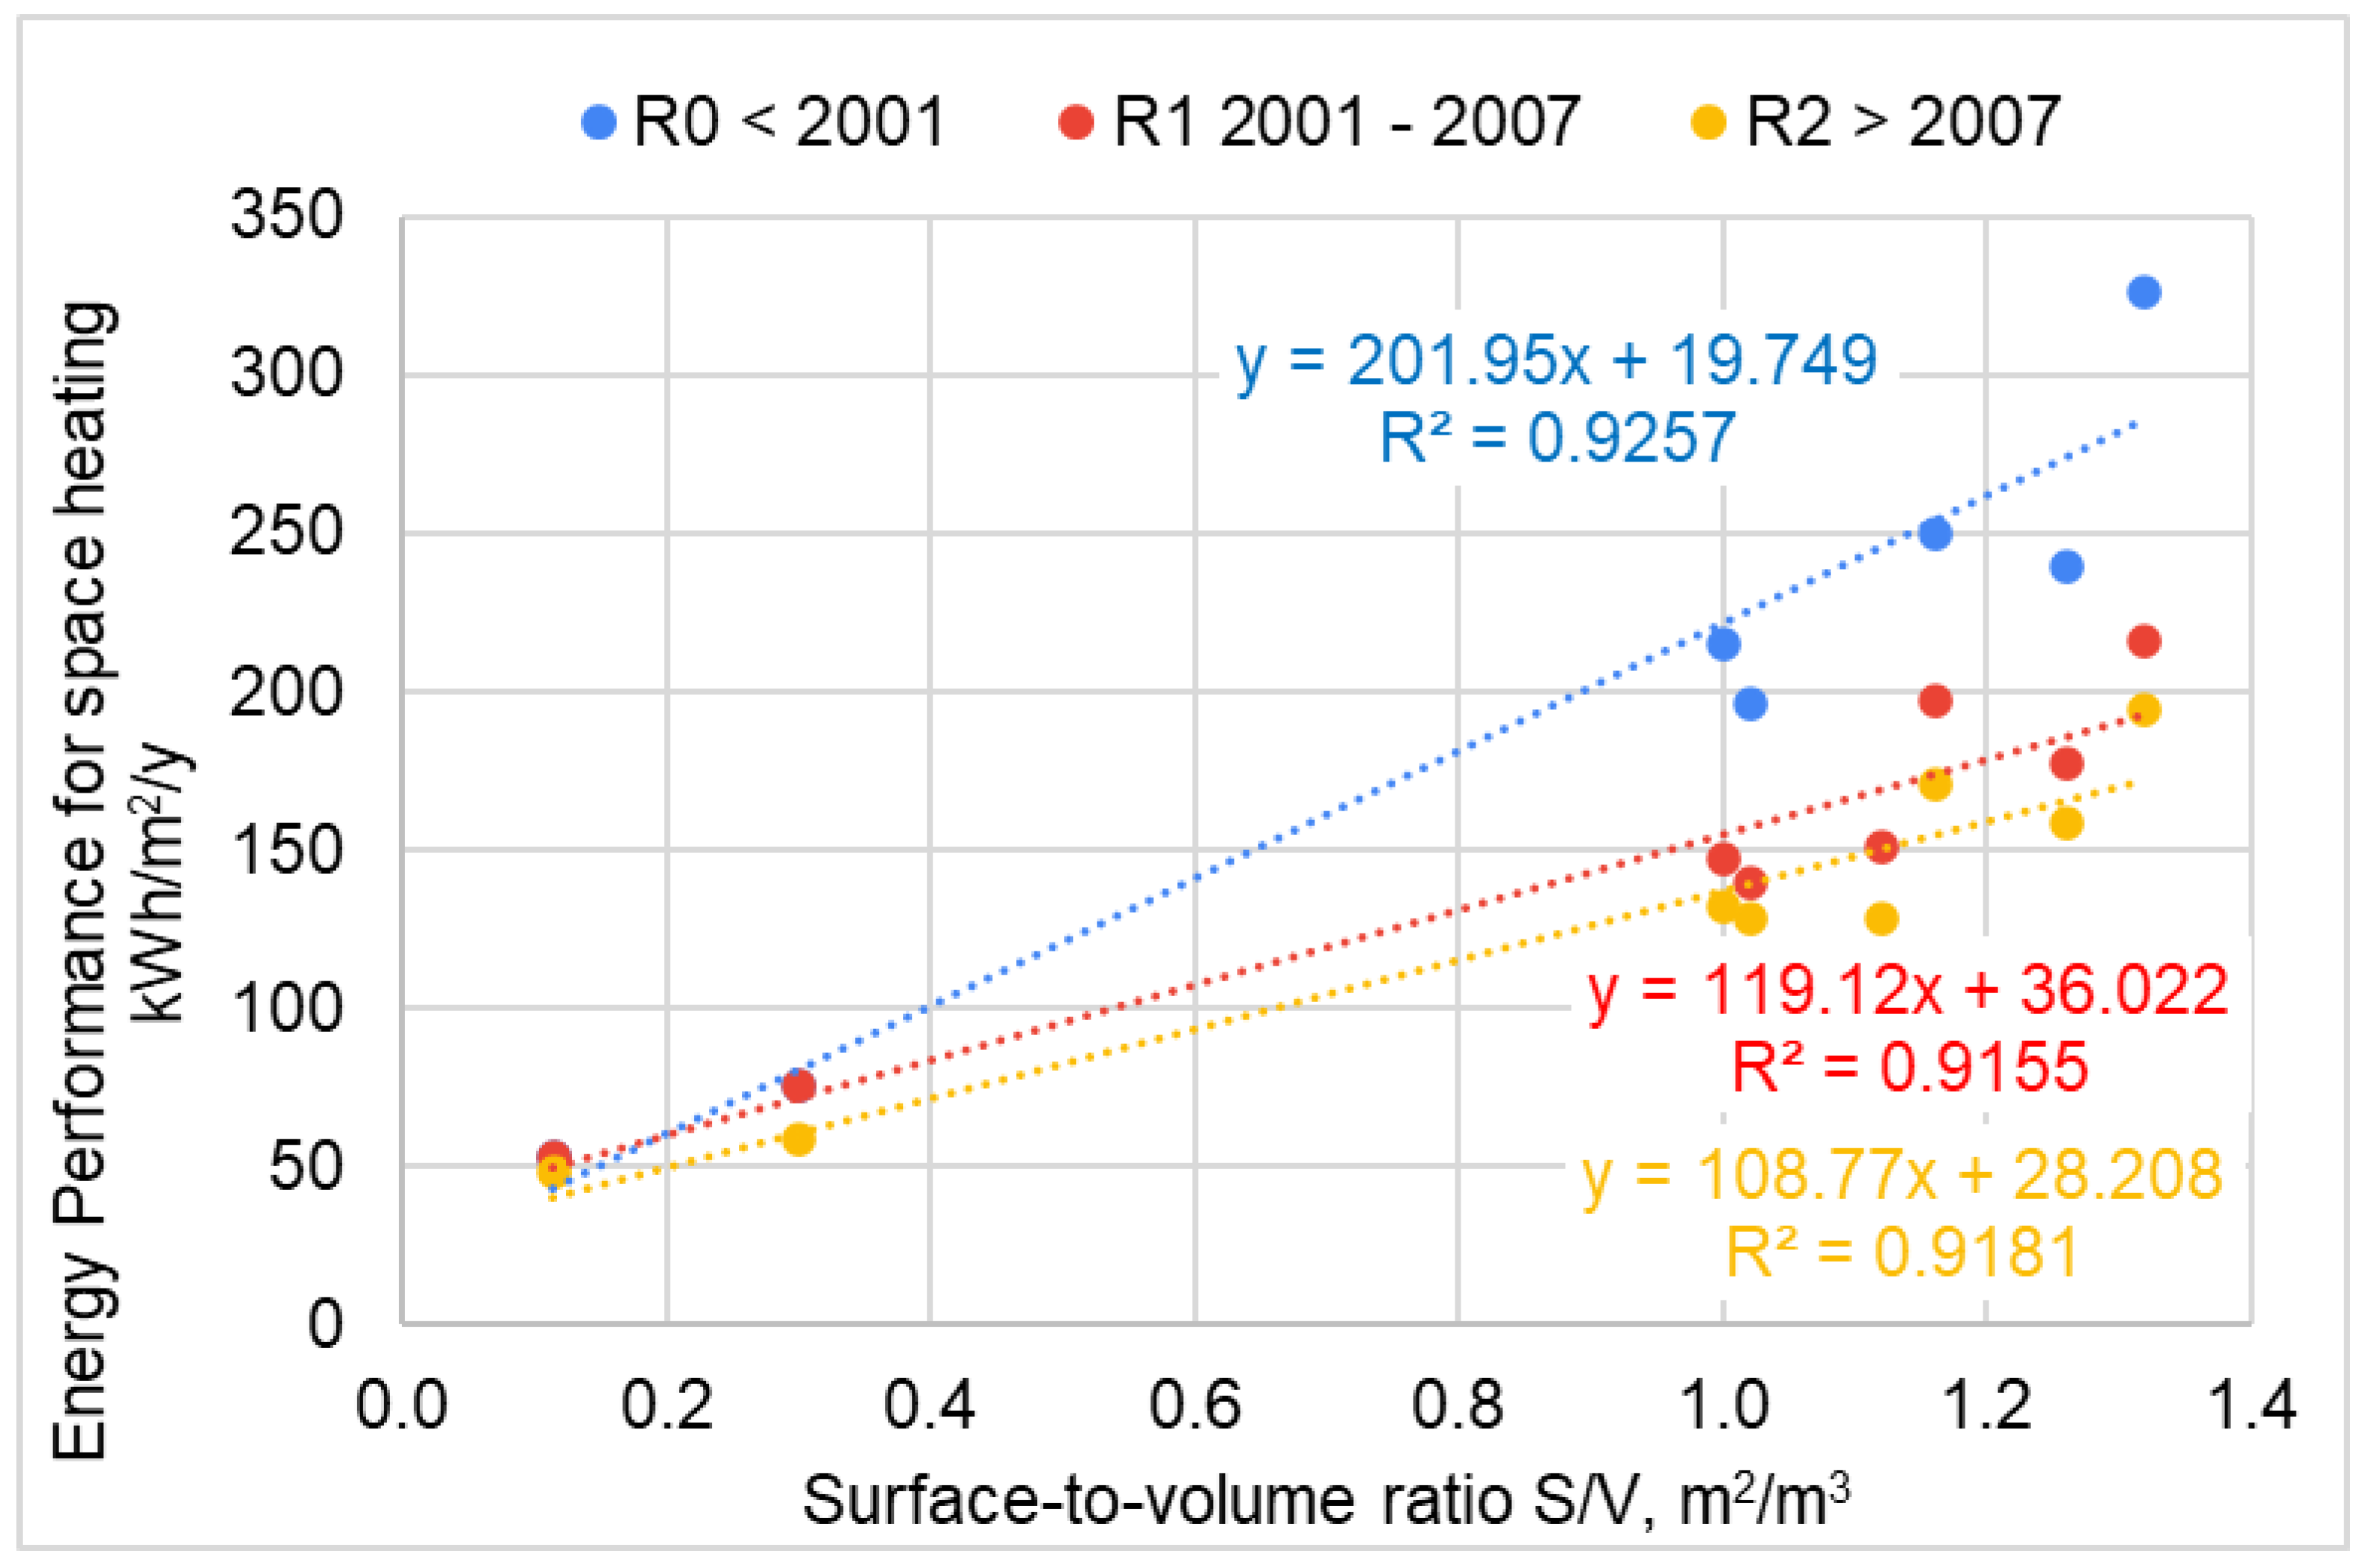
- the actual energy demand was calculated multiplying the EUI (from the equations in Figure 4) by the net heated area and the percentage of occupancy;
- -
- the actual energy consumption was calculated dividing the energy demand by the average efficiency of the space-heating systems, that is 66% (in Table 9);
- -
- the energy savings was calculated multiplying the energy consumption by the percentage energy savings reported in Table 6 evaluated by archetype;
- -
- the cost of retrofit interventions was evaluated multiplying the cost per unit of area (in Table 8) by the area to be retrofitted;
- -
- the economic savings were evaluated multiplying the energy savings by the average price of fuels for residential buildings, that is 0.106 USD/kWh (from Table 9).
5. Discussion
5.1. Policy Suggestions
5.1.1. Saving Energy with Energy Efficiency Measures
5.1.2. Use of RES and Solar Technologies
5.1.3. People’s Awareness and Smart Technologies
5.1.4. Energy and Climate Policies
- economic incentives that are provided to reduce the costs of the technologies to be installed;
- tax deductions for the expenditure of energy efficiency interventions or renewable technologies;
- economic incentives on clean energy production, mainly used for electrical energy produced by grid-connected photovoltaic systems;
- economic incentives on sharing energy between members of a community, mainly used for electrical energy;
- discounts on urbanization costs for new projects that have higher energy efficiency level compared with the energy requirements of standards;
- volumetric bonuses in derogation of urban plans for measures that have higher energy efficiency compared with the energy requirements of standards.
6. Conclusions
Author Contributions
Funding
Data Availability Statement
Conflicts of Interest
References
- IEA World Energy Outlook. 2021. Available online: https://www.iea.org/topics/world-energy-outlook (accessed on 12 September 2022).
- Liddell, C. Fuel poverty comes of age: Commemorating 21 years of research and policy. Energy Policy 2012, 49, 2–5. [Google Scholar] [CrossRef]
- Heindl, P. Measuring fuel poverty: General considerations and application to german household data. FinanzArchiv/Public Financ. Anal. 2015, 71, 178–215. [Google Scholar] [CrossRef]
- Charlier, D.; Legendre, B. Fuel poverty in industrialized countries: Definition, measures and policy implications a review. Energy 2021, 236, 121557. [Google Scholar] [CrossRef]
- Sy, S.A.; Mokaddem, L. Energy poverty in developing countries: A review of the concept and its measurements. Energy Res. Soc. Sci. 2022, 89, 102562. [Google Scholar] [CrossRef]
- Urquiza, A.; Amigo, C.; Billi, M.; Calvo, R.; Labraña, J.; Oyarzún, T.; Valencia, F. Quality as a hidden dimension of energy poverty in middle-development countries. Literature review and case study from Chile. Energy Build. 2019, 204, 109463. [Google Scholar] [CrossRef]
- Nussbaumer, P.; Nerini, F.F.; Onyeji, I.; Howells, M. Global Insights Based on the Multidimensional Energy Poverty Index (MEPI). Sustainability 2013, 5, 2060–2076. [Google Scholar] [CrossRef]
- Bouzarovski, S.; Petrova, S. A global perspective on domestic energy deprivation: Overcoming the energy poverty–fuel poverty binary. Energy Res. Soc. Sci. 2015, 10, 31–40. [Google Scholar] [CrossRef]
- Boardman, B. Fixing Fuel Poverty: Challenges and Solutions; Earthscan: Londres, UK, 2010. [Google Scholar]
- Fuller, S.; Barber, L.B.; Mah, D.N.-Y. Narratives of energy poverty in Hong Kong. Energy Build. 2019, 191, 52–58. [Google Scholar] [CrossRef]
- Esily, R.R.; Yuanying, C.; Ibrahiem, D.M.; Houssam, N.; Makled, R.A.; Chen, Y. Environmental benefits of energy poverty alleviation, renewable resources, and urbanization in North Africa. Util. Policy 2023, 82, 101561. [Google Scholar] [CrossRef]
- Thomson, H.; Day, R.; Ricalde, K.; Brand-Correa, L.I.; Cedano, K.; Martinez, M.; Santillán, O.; Delgado Triana, Y.; Luis Cordova, J.G.; Milian Gómez, J.F.; et al. Understanding, Recognizing, and Sharing Energy Poverty Knowledge and Gaps in Latin America and the Caribbean—Because Conocer Es Resolver. Energy Res. Soc. Sci. 2022, 87, 102475. [Google Scholar] [CrossRef]
- Encinas, F.; Truffello, R.; Aguirre-Nuñez, C.; Puig, I.; Vergara-Perucich, F.; Freed, C.; Rodríguez, B. Mapping Energy Poverty: How Much Impact Do Socioeconomic, Urban and Climatic Variables Have at a Territorial Scale? Land 2022, 11, 1449. [Google Scholar] [CrossRef]
- Plominsky, G.F.; Arias, A.M.; Rivera, M.I.; Zepeda-Gil, C. Pobreza energética en contextos de exclusión urbana: Nuevos enfoques para la acción desde América Latina. Rev. INVI 2023, 38, 1–16. [Google Scholar] [CrossRef]
- Wang, H.; Maruejols, L.; Yu, X. Predicting energy poverty with combinations of remote-sensing and socioeconomic survey data in India: Evidence from machine learning. Energy Econ. 2021, 102, 105510. [Google Scholar] [CrossRef]
- Nathan, H.S.K.; Hari, L. Towards a new approach in measuring energy poverty: Household level analysis of urban India. Energy Policy 2020, 140, 111397. [Google Scholar] [CrossRef]
- Reyes, R.; Schueftan, A.; Ruiz, C.; González, A.D. Controlling air pollution in a context of high energy poverty levels in southern Chile: Clean air but colder houses? Energy Policy 2019, 124, 301–311. [Google Scholar] [CrossRef]
- Molina, C.; Toro A, T.; Morales S, R.G.; Manzano, C.; Leiva-Guzmán, M.A. Particulate matter in urban areas of south-central Chile exceeds air quality standards. Air Qual. Atmos. Health 2017, 10, 653–667. [Google Scholar] [CrossRef]
- Pérez-Fargallo, A.; Leyton-Vergara, M.; Wegertseder, P.; Castaño-Rosa, R. Energy Poverty Evaluation Using a Three-Dimensional and Territorial Indicator: A Case Study in Chile. Buildings 2022, 12, 1125. [Google Scholar] [CrossRef]
- Li, S.; Meng, J.; Zheng, H.; Zhang, N.; Huo, J.; Li, Y.; Guan, D. The driving forces behind the change in energy consumption in developing countries. Environ. Res. Lett. 2021, 16, 054002. [Google Scholar] [CrossRef]
- AA.VV. Balance Energético (1992–2022); Ministerio de Energía (MINEN), Gobierno de Chile: Santiago, Chile, 2023; Available online: https://energia.gob.cl/pelp/balance-nacional-de-energia (accessed on 20 July 2023).
- AA.VV. Manual de Aplicación Reglamentación Térmica; Ministerio de Vivienda y Urbanismo (MINVU), Gobierno de Chile: Santiago, Chile, 2006. [Google Scholar]
- Jorquera, H.; Barraza, F.; Heyer, J.; Valdivia, G.; Schiappacasse, L.N.; Montoya, L.D. Indoor PM2.5 in an urban zone with heavy wood smoke pollution: The case of Temuco, Chile. Environ. Pollut. 2018, 236, 477–487. [Google Scholar] [CrossRef]
- Prieto-Parra, L.; Yohannessen, K.; Brea, C.; Vidal, D.; Ubilla, C.A.; Ruiz-Rudolph, P. Air pollution, PM 2.5 composition, source factors, and respiratory symptoms in asthmatic and nonasthmatic children in Santiago, Chile. Environ. Int. 2017, 101, 190–200. [Google Scholar] [CrossRef] [PubMed]
- Díaz-Robles, L.A.; Fu, J.S.; Vergara-Fernández, A.; Etcharren, P.; Schiappacasse, L.N.; Reed, G.D.; Silva, M.P. Health risks caused by short term exposure to ultrafine particles generated by residential wood combustion: A case study of Temuco, Chile. Environ. Int. 2014, 66, 174–181. [Google Scholar] [CrossRef] [PubMed]
- AA.VV. Planes de Descontaminación Atmosférica: Guías, Reglamentos y Normativas; Ministerio del Medio Ambiente (MMA), Gobierno de Chile: Santiago, Chile, 2023. [Google Scholar]
- AA.VV. Tercer Informe Bienal de Actualización de Chile Sobre El Cambio Climático; Ministerio del Medio Ambiente (MMA), Gobierno de Chile: Santiago, Chile, 2018. [Google Scholar]
- Sudhira, H.S.; Ramachandra, T.V.; Jagadish, K.S. Urban sprawl: Metrics, dynamics and modelling using GIS. Int. J. Appl. Earth Obs. Geoinform. 2004, 5, 29–39. [Google Scholar] [CrossRef]
- Deng, Z.; Chen, Y.; Yang, J.; Chen, Z. Archetype identification and urban building energy modeling for city-scale buildings based on GIS datasets. Build. Simul. 2022, 15, 1547–1559. [Google Scholar] [CrossRef]
- Dong, J.; Schwartz, Y.; Mavrogianni, A.; Korolija, I.; Mumovic, D. A review of approaches and applications in building stock energy and indoor environment modelling. Build. Serv. Eng. Res. Technol. 2023, 44, 333–354. [Google Scholar] [CrossRef]
- Borges, P.; Travesset-Baro, O.; Pages-Ramon, A. Hybrid approach to representative building archetypes development for urban models—A case study in Andorra. Build. Environ. 2022, 215, 108958. [Google Scholar] [CrossRef]
- Cooper, J.; Foster, S.; Dias, J.; Mason, E. Review of Social Housing Archetypes to Support EESSH2 Review, 2023, 10.7488/era/3650. Available online: https://www.climatexchange.org.uk/media/5888/cxc-review-of-social-housing-archetypes-to-support-eessh2-february-2023.pdf (accessed on 20 July 2023).
- Residential Archetyping for Energy Efficiency Programs. A Guide for Canadian Municipalities. 2022. Available online: https://www.cleanairpartnership.org/wp-content/uploads/2023/01/Archetyping-Guide-For-Energy-Efficiency-Programs-1.pdf (accessed on 20 July 2023).
- Mehta, K.; Zörner, W. Cracking the code: Mapping residential building energy performance in rural Central Asia through building typologies. SN Appl. Sci. 2023, 5, 349. [Google Scholar] [CrossRef]
- Vaisi, S.; Mohammadi, S.; Habibi, K. Heat Mapping, a Method for Enhancing the Sustainability of the Smart District Heat Networks. Energies 2021, 14, 5462. [Google Scholar] [CrossRef]
- Goy, S.; Maréchal, F.; Finn, D. Data for Urban Scale Building Energy Modelling: Assessing Impacts and Overcoming Availability Challenges. Energies 2020, 13, 4244. [Google Scholar] [CrossRef]
- Pasichnyi, O.; Wallin, J.; Kordas, O. Data-driven building archetypes for urban building energy modelling. Energy 2019, 181, 360–377. [Google Scholar] [CrossRef]
- Ang, Y.Q.; Berzolla, Z.; Reinhart, C. Smart meter-based archetypes for socioeconomically sensitive urban building energy modeling. Build. Environ. 2023, 246, 110991. [Google Scholar] [CrossRef]
- Ferrando, M.; Ferroni, S.; Pelle, M.; Tatti, A.; Erba, S.; Shi, X.; Causone, F. UBEM’s archetypes improvement via data-driven occupant-related schedules randomly distributed and their impact assessment. Sustain. Cities Soc. 2022, 87, 104164. [Google Scholar] [CrossRef]
- Ali, U.; Bano, S.; Shamsi, M.H.; Sood, D.; Hoare, C.; Zuo, W.; Hewitt, N.; O’Donnell, J. Urban building energy performance prediction and retrofit analysis using data-driven machine learning approach. Energy Build. 2024, 303, 113768. [Google Scholar] [CrossRef]
- Pongelli, A.; Priore, Y.D.; Bacher, J.-P.; Jusselme, T. Definition of Building Archetypes Based on the Swiss Energy Performance Certificates Database. Buildings 2022, 13, 40. [Google Scholar] [CrossRef]
- Mutani, G.; Alehasin, M.; Usta, Y.; Fiermonte, F.; Mariano, A. Statistical Building Energy Model from Data Collection, Place-Based Assessment to Sustainable Scenarios for the City of Milan. Sustainability 2023, 15, 14921. [Google Scholar] [CrossRef]
- Ballarini, I.; Corgnati, S.P.; Corrado, V. Use of reference buildings to assess the energy saving potentials of the residential building stock: The experience of TABULA project. Energy Policy 2014, 68, 273–284. [Google Scholar] [CrossRef]
- Ferguson ARA. Housing Models for Use with the Housing Technology Asesssment Platform. 2019. Available online: https://github.com/NRCan-IETS-CE-O-HBC/HTAP-archetypes (accessed on 8 July 2023).
- Osman, M.; Saad, M.M.; Ouf, M.; Eicker, U. From buildings to cities: How household demographics shape demand response and energy consumption. Appl. Energy 2024, 356, 122359. [Google Scholar] [CrossRef]
- Alasmar, R.; Schwartz, Y.; Burman, E. Evaluation of Energy Performance of The Most Prevalent Housing Archetypes in Jordan, CIBSE Technical Symposium, UK April 2022. Available online: https://www.cibse.org/knowledge-research/knowledge-portal/evaluation-of-energy-performance-of-the-most-prevalent-housing-archetypes (accessed on 8 July 2023).
- Cerezo, C.; Sokol, J.; AlKhaled, S.; Reinhart, C.; Al-Mumin, A.; Hajiah, A. Comparison of four building archetype characterization methods in urban building energy modeling (UBEM): A residential case study in Kuwait City. Energy Build. 2017, 154, 321–334. [Google Scholar] [CrossRef]
- Mutani, G.; Todeschi, V. GIS-based urban energy modelling and energy efficiency scenarios using the energy performance certificate database. Energy Effic. 2021, 14, 47. [Google Scholar] [CrossRef]
- Rosser, J.F.; Long, G.; Zakhary, S.; Boyd, D.S.; Mao, Y.; Robinson, D. Modelling Urban Housing Stocks for Building Energy Simulation Using CityGML EnergyADE. ISPRS Int. J. Geo-Inform. 2019, 8, 163. [Google Scholar] [CrossRef]
- AA.VV. Informe Balance Nacional de Energía 2019; MINEN Ministerio de Energía: Santiago, Chile, 2019; Available online: https://energia.gob.cl/sites/default/files/documentos/2020_informe_anual_bne_2019.pdf (accessed on 20 July 2023).
- AA.VV. Anuarios de Edificación (2010–2020); INE Instituto Nacional de Estadísticas: Santiago, Chile, 2020. [Google Scholar]
- AA.VV. Informe Final de Usos de la Energía de los Hogares en Chile; MINEN Ministerio de Energía: Santiago, Chile, 2018. [Google Scholar]
- Pérez-Fargallo, A.; Rubio-Bellido, C.; Pulido-Arcas, J.A.; Guevara-García, F.J. Fuel Poverty Potential Risk Index in the context of climate change in Chile. Energy Policy 2018, 113, 157–170. [Google Scholar] [CrossRef]
- Grass, D.; Cane, M. The effects of weather and air pollution on cardiovascular and respiratory mortality in Santiago, Chile, during the winters of 1988–1996. Int. J. Clim. 2008, 28, 1113–1126. [Google Scholar] [CrossRef]
- AA.VV. NCh-1079: Arquitectura y Construcción—Zoni-Ficación Climático Habitacional Para Chile y Recomendaciones Para el Diseño Arquitectónico; INN Instituto Nacional de Normalización: Santiago, Chile, 2008. [Google Scholar]
- Villalobos, C.; Chávez, C.; Uribe, A. Energy poverty measures and the identification of the energy poor: A comparison between the utilitarian and capability-based approaches in Chile. Energy Policy 2021, 152, 112146. [Google Scholar] [CrossRef]
- AA.VV. Síntesis de Resultados CENSO 2017; INE Instituto Nacional de Estadísticas: Santiago, Chile, 2018. [Google Scholar]
- AA.VV. Portal de Servicios Climáticos; DMC Dirección Meteorológica de Chile: Santiago, Chile, 2022; Available online: https://climatologia.meteochile.gob.cl/application/informacion/buscadorEstaciones (accessed on 20 July 2023).
- AA.VV. Ordenanza General de Urbanismo y Construcciones OGUC; Ministerio de Vivienda y Urbanismo MINVU, Gobierno de Chile: Santiago, Chile, 2019; Available online: https://www.bcn.cl/leychile/navegar?idNorma=8201 (accessed on 20 July 2023).
- AA.VV. Plan Regulador Comunal, 2021; Municipality of Renca: Renca, Chile, 2021; Available online: https://renca.cl/unidades-municipales/secretaria-comunal-de-planificacion/prc/ (accessed on 20 July 2023).
- Corporación de Desarrollo Tecnológico. Informe Final Uso de la Energía Hogares Chile 2018. Available online: https://energia.gob.cl/sites/default/files/documentos/informe_final_caracterizacion_residencial_2018.pdf (accessed on 20 July 2023).
- Mutani, G.; Todeschi, V. Space heating models at urban scale for buildings in the city of Turin (Italy). Energy Procedia 2017, 122, 841–846. [Google Scholar] [CrossRef]
- AA.VV. Manual de Procedimientos Calificación Energética de Viviendas en Chile, Gobierno de Chile, no. Febrero. 2018. Available online: https://www.calificacionenergetica.cl/media/Folleto-Calificacion-Energetica-de-Viviendas.pdf (accessed on 20 July 2023).
- WEC Word Energy Council. Available online: https://www.worldenergy.org/transition-toolkit/world-energy-trilemma-index (accessed on 20 July 2023).
- Ritchie, H.; Roser, M. Energy Production and Consumption. 2020. Available online: https://ourworldindata.org/energy-production-consumption (accessed on 20 July 2023).


| Month | Average Air Temperature (°C) | Solar Irradiation (kWh/m2) * | Diffuse-to-Global Irradiation (%) * | Cloud Cover (%) | Air Relative Humidity (%) | Wind Speed (m/s) | Daily Hours of Light (h) |
|---|---|---|---|---|---|---|---|
| 1 | 21.5 | 281.86 | 12 | 40 | 49.7 | 3.6 | 14.5 |
| 2 | 20.5 | 212.11 | 17 | 39 | 55.1 | 3.2 | 13.8 |
| 3 | 18.8 | 201.74 | 16 | 44 | 57 | 2.7 | 12.8 |
| 4 | 14.6 | 136.99 | 22 | 59 | 65.8 | 2.2 | 11.6 |
| 5 | 10.8 | 86.85 | 33 | 75 | 73.4 | 1.7 | 10.4 |
| 6 | 8.6 | 71.63 | 30 | 73 | 77.7 | 1.6 | 9.9 |
| 7 | 8.4 | 92.21 | 24 | 70 | 77.4 | 1.7 | 9.8 |
| 8 | 9.8 | 111.56 | 25 | 64 | 75.4 | 1.9 | 10.4 |
| 9 | 11.6 | 146.76 | 28 | 64 | 71.3 | 2.2 | 11.4 |
| 10 | 15 | 204.83 | 24 | 49 | 63 | 2.7 | 12.5 |
| 11 | 17.4 | 234.01 | 20 | 32 | 55.9 | 3.2 | 13.6 |
| 12 | 20 | 277.03 | 16 | 41 | 51.3 | 3.6 | 14.4 |
| Type 1. One-story detached, brick masonry house | Type 2. Two-story detached, brick masonry house | |||||||||
 | total useful area | 60.8 | m2 | 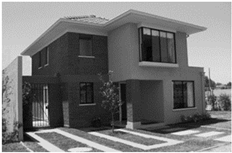 | total useful area | 123.3 | m2 | |||
| net heated area | 56.5 | m2 | net heated area | 221.2 | m2 | |||||
| wall area | 83.8 | m2 | wall area | 172.2 | m2 | |||||
| roof area | 60.8 | m2 | roof area | 123.3 | m2 | |||||
| ceiling height | 2.4 | m2 | ceiling height | 2.86 | m2 | |||||
| windows area | N-W | 5.4 | m2 | windows area | N-W | 28.7 | m2 | |||
| N-E | 7.8 | m2 | N-E | 16.4 | m2 | |||||
| S-W | 0.5 | m2 | S-W | 0 | m2 | |||||
| S-E | 4.8 | m2 | S-E | 7.3 | m2 | |||||
| S/V | 1.32 | m2/m3 | S/V | 1.02 | m2/m3 | |||||
| Type 3. Two-story detached, lightweight timber-frame | Type 4. Three-story detached, brick masonry house | |||||||||
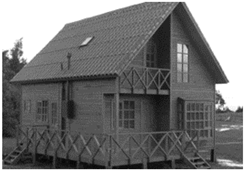 | total useful area | 67.72 | m2 | 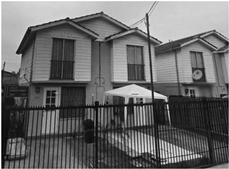 | total useful area | 27.94 | m2 | |||
| net heated area | 103 | m2 | net heated area | 51.98 | m2 | |||||
| wall area | 97 | m2 | wall area | 41.45 | m2 | |||||
| roof area | 67.7 | m2 | roof area | 27.94 | m2 | |||||
| ceiling height | 2.4 | m2 | ceiling height | 2.4 | m2 | |||||
| windows area | N | 10.1 | m2 | windows area | N | 3.3 | m2 | |||
| S | 5.9 | m2 | S | 2.9 | m2 | |||||
| W | 7.7 | m2 | W | 0 | m2 | |||||
| E | 0 | m2 | E | 0 | m2 | |||||
| S/V | 1.26 | m2/m3 | S/V | 1.16 | m2/m3 | |||||
| Type 5. One story semi-detached, brick masonry house | Type 6. Three-story terrace, brick masonry/timber frame | |||||||||
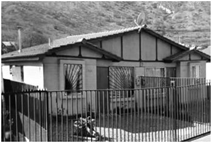 | total useful area | 67.42 | m2 | 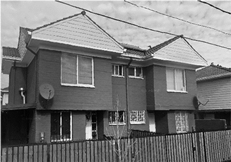 | total useful area | 52 | m2 | |||
| net heated area | 62.7 | m2 | net heated area | 84.7 | m2 | |||||
| wall area | 56.36 | m2 | wall area | 41 | m2 | |||||
| roof area | 81.7 | m2 | roof area | 56.5 | m2 | |||||
| ceiling height | 2.4 | m2 | ceiling height | 2.3 | m2 | |||||
| N | 3.95 | m2 | windows area | N | 5.8 | m2 | ||||
| S | 1.44 | m2 | S | 4.7 | m2 | |||||
| W | 0 | m2 | W | 1.6 | m2 | |||||
| E | 0 | m2 | E | 0 | m2 | |||||
| S/V | 1.12 | m2/m3 | S/V | 1.00 | m2/m3 | |||||
| Type 7. Single story intermediate apartment, brick masonry. | Type 8. Single story intermediate apartment, reinforced Concrete. | |||||||||
 | total useful area | 69.25 | m2 |  | total useful area | 118 | m2 | |||
| net heated area | 64.4 | m2 | net heated area | 109.7 | m2 | |||||
| wall area | 5.7 | m2 | wall area | 83.8 | m2 | |||||
| roof area | 0 | m2 | roof area | 0 | m2 | |||||
| ceiling height | 2.6 | m2 | ceiling height | 2.6 | m2 | |||||
| windows area | N | 16.3 | m2 | windows area | N | 12 | m2 | |||
| S | 0 | m2 | S | 9.8 | m2 | |||||
| W | 0 | m2 | W | 0 | m2 | |||||
| E | 0 | m2 | E | 0 | m2 | |||||
| S/V | 0.11 | m2/m3 | S/V | 0.30 | m2/m3 | |||||
| Period of Construction | Uglass | Uwall | Uroof | Ufloor |
|---|---|---|---|---|
| W/m2/K | ||||
| Ro | 5.8 | 2.3–3.4 | 3.2 | 1.4 |
| R1 | 5.8 | 2.3–3.4 | 0.47 | 1.4 |
| R3 | 5.8 | 1.9 | 0.47 | 0.7 |
| Energy Classes | Period of Construction | ||
|---|---|---|---|
| Reference Building | 268 kWh/m2/y | 159 kWh/m2/y | 111 kWh/m2/y |
| (energy saving % compared with reference building) | R0 <2001 | R1 2001–2007 | R2 >2007 |
| A (>60%) | EPnd,H < 107 | EPnd,H < 64 | EPnd,H < 44 |
| B (50/60%) | 107 ≤ EPnd,H < 134 | 64 ≤ EPnd,H < 80 | 44 ≤ EPnd,H < 56 |
| C (35/50%) | 134 ≤ EPnd,H < 174 | 80 ≤ EPnd,H < 103 | 56 ≤ EPnd,H < 72 |
| D (15/35%) | 174 ≤ EPnd,H < 228 | 103 ≤ EPnd,H < 135 | 72 ≤ EPnd,H < 94 |
| E (−10/15%) | 228 ≤ EPnd,H < 295 | 135 ≤ EPnd,H < 175 | 94 ≤ EPnd,H < 122 |
| F (−35/−10%) | 295 ≤ EPnd,H < 362 | 175 ≤ EPnd,H < 215 | 122 ≤ EPnd,H < 149 |
| G (<−35%) | EPnd,H ≥ 362 | EPnd,H ≥ 215 | EPnd,H ≥ 149 |
| Building Location | R0 < 2001 | R1 2001–2007 | R2 > 2007 |
|---|---|---|---|
| Renca | 83.0% | 6.4% | 10.6% |
| CD-3 district | 94.8% | 0% | 5.2% |
| Retrofitting Interventions | Energy Savings | ||
|---|---|---|---|
| Period of Construction: | R0 < 2001 | R1 2001–2007 | R2 > 2007 |
| 1. Window substitution (U = 1.1 W/m2/K) | 14.5% | 18.5% | 22% |
| 2. Wall thermal insulation, 20 cm | 36.5% | 50% | 46% |
| 3. Roof thermal insulation, 15 cm | 32% | 5.5% | 4.5% |
| 4. Slab thermal insulation, 1 cm | 2% | 3% | 4% |
| MWh/Year | 1. Windows | 2. Walls | 3. Roofs | 4. Slabs |
|---|---|---|---|---|
| Saved energy demand | 173,079 | 428,922 | 324,048 | 24,778 |
| Retrofitting Intervention | 1. Windows | 2. Walls | 3. Roofs | 4. Floors |
|---|---|---|---|---|
| Intervention costs ($/m2) | 216 | 120 | 105 | 80 |
| Retrofitted surfaces (m2) | 713,841.7 | 4,199,068.8 | 4,597,772.1 | 4,597,772.1 |
| Cost of interventions (k$) | 154,189,807 | 503,888,256 | 482,766,071 | 367,821,768 |
| Consumption savings (MWh/year) | 262,241,078 | 649,882,103 | 490,982,481 | 53,701,209 |
| Fuel | Households (%) | System Efficiency (%) | Price of Energy (USD/kWh) | GHG Emissions (kgCO2eq/kWh) |
|---|---|---|---|---|
| Liquefied petroleum gas | 40.3 | 65 | 0.110 | 0.254 |
| Kerosene | 35.6 | 60 | 0.104 | 0.270 |
| Firewood | 12.2 | 55 | 0.054 | 0.395 |
| Electricity | 11.4 | 100 | 0.154 | 0.480 |
| Natural Gas | 0.3 | 70 | 0.086 | 0.252 |
| Others | 0.2 | 70 | 0.102 | 0.330 |
| 1. Windows | 2. Walls | 3. Roofs | 4. Floors/Slabs | |
|---|---|---|---|---|
| Economic savings (k$/year) | 27,787,065 | 68,861,508 | 52,024,504 | 5,690,180 |
| Simple payback time (year) | 5.55 | 7.32 | 9.28 | 64.64 |
| GHG reduction (kgCO2,eq) | 79,408,696 | 196,789,450 | 148,673,423 | 16,261,156 |
Disclaimer/Publisher’s Note: The statements, opinions and data contained in all publications are solely those of the individual author(s) and contributor(s) and not of MDPI and/or the editor(s). MDPI and/or the editor(s) disclaim responsibility for any injury to people or property resulting from any ideas, methods, instructions or products referred to in the content. |
© 2024 by the authors. Licensee MDPI, Basel, Switzerland. This article is an open access article distributed under the terms and conditions of the Creative Commons Attribution (CC BY) license (https://creativecommons.org/licenses/by/4.0/).
Share and Cite
Mutani, G.; Alehasin, M.; Yang, H.; Zhang, X.; Felmer, G. Urban Building Energy Modeling to Support Climate-Sensitive Planning in the Suburban Areas of Santiago de Chile. Buildings 2024, 14, 185. https://doi.org/10.3390/buildings14010185
Mutani G, Alehasin M, Yang H, Zhang X, Felmer G. Urban Building Energy Modeling to Support Climate-Sensitive Planning in the Suburban Areas of Santiago de Chile. Buildings. 2024; 14(1):185. https://doi.org/10.3390/buildings14010185
Chicago/Turabian StyleMutani, Guglielmina, Maryam Alehasin, Huisi Yang, Xiaotong Zhang, and Gabriel Felmer. 2024. "Urban Building Energy Modeling to Support Climate-Sensitive Planning in the Suburban Areas of Santiago de Chile" Buildings 14, no. 1: 185. https://doi.org/10.3390/buildings14010185
APA StyleMutani, G., Alehasin, M., Yang, H., Zhang, X., & Felmer, G. (2024). Urban Building Energy Modeling to Support Climate-Sensitive Planning in the Suburban Areas of Santiago de Chile. Buildings, 14(1), 185. https://doi.org/10.3390/buildings14010185