1. Introduction
As more and more prefabricated reinforced concrete structures are being used in urban construction, certain issues need to be addressed. Conventional concrete columns have large volumes, heavy weights, and are prone to cracking during lifting, leading to challenges in the construction process. Currently, prefabricated concrete columns are typically made one layer at a time, which involves extensive wet operations, complex production and construction processes, and low construction efficiency [
1]. Moreover, the conventional method of connecting the reinforcement between prefabricated concrete columns using grouting sleeves requires high precision and presents significant technical challenges. Due to limitations in component production accuracy, issues such as misalignment of reinforcement and difficulties in placing beams and columns have been observed during component node construction, leading to time-consuming and labor-intensive work, compromised reinforcement connection quality, and difficulty in inspection, posing significant safety risks [
2].
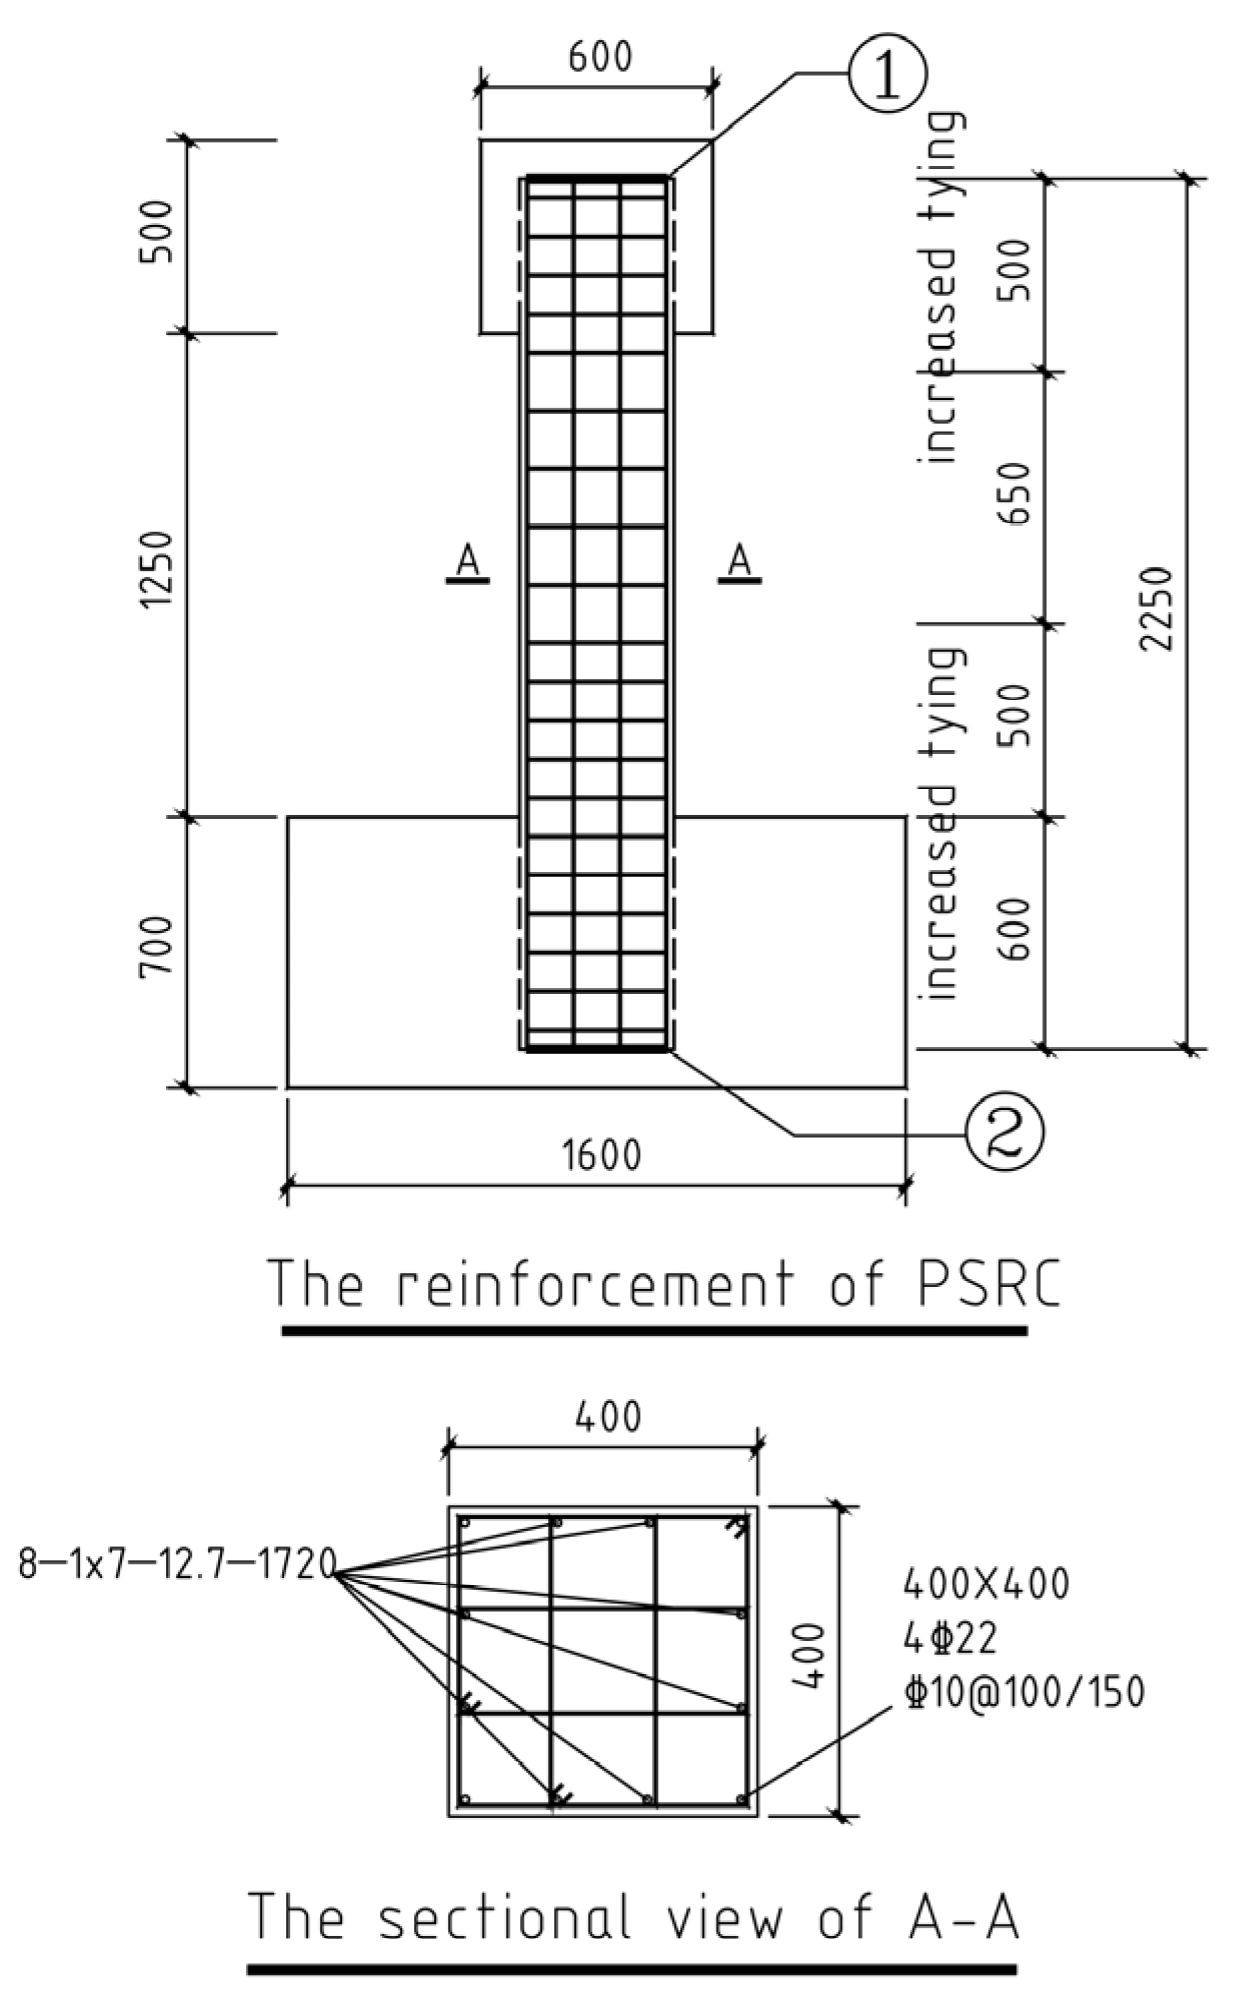
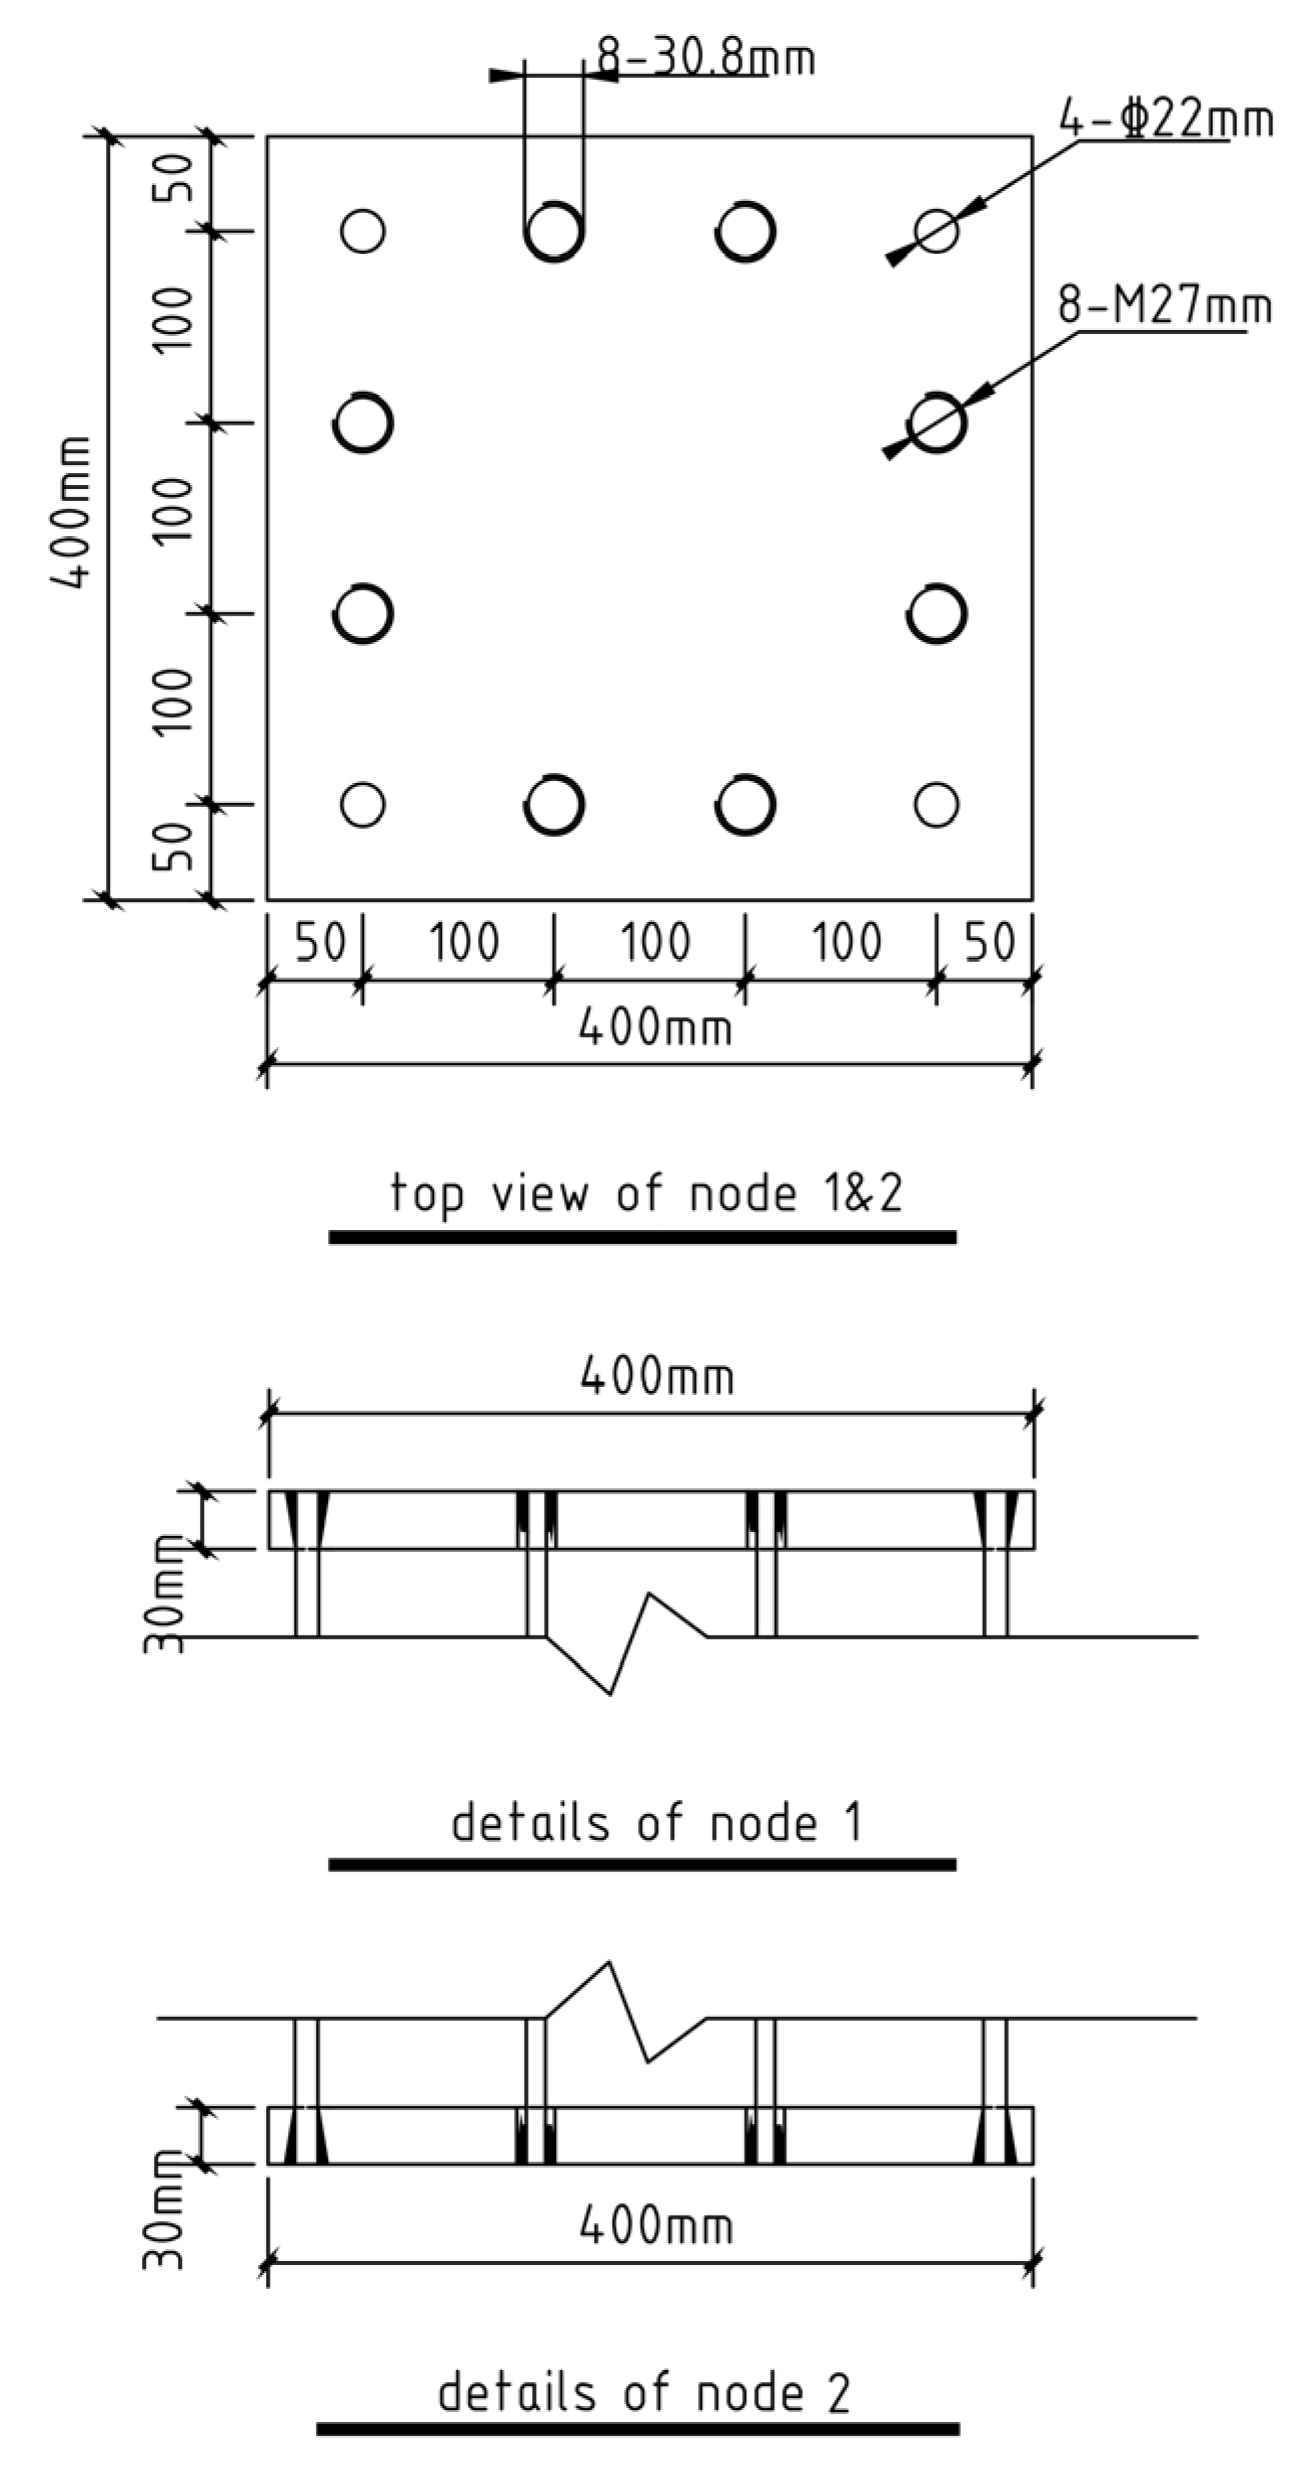
To overcome these challenges, reduce on-site wet operations, lower construction difficulties, and improve construction efficiency, a new type of prefabricated prestressed steel strand-reinforced concrete (PSRC) column is proposed. By using high-strength concrete, the cross-sectional dimensions of prefabricated columns are reduced, decreasing the weight of prefabricated components and simplifying construction. Appropriate levels of prestressed reinforcement are incorporated to reduce the occurrence of cracks during lifting, allowing the prefabricated columns to reach lengths of up to 15 m, with three floors in each section. This reduces the number of joints, improves construction efficiency, and enhances the structural load-bearing capacity, stiffness, and seismic performance of the components. To effectively anchor prestressed reinforcement, steel end plates are installed at the top and bottom of the prefabricated columns, enabling dry connections and enhancing connection reliability and construction quality assurance.
Scholars both domestically and internationally have conducted extensive research on the selection of reinforcement for prefabricated columns. Researchers [
3,
4,
5,
6] have studied the load-bearing and deformation performance of prefabricated concrete pipe columns. Zhang et al. [
3] found that prestressed composite reinforcement plays an important role in resisting corrosion and enhancing deformation capacity. Javier et al. [
7] have employed superelastic (SE) nickel-titanium shape memory alloy (SMA) bars in prefabricated columns to replace ordinary threaded steel bars, resulting in minimal concrete damage and residual deformation in quasi-static tests. A.M.H. et al. [
8] have combined shape memory alloy (SMA) with fiber-reinforced composite (FRP) reinforcement in prefabricated columns and analyzed their seismic performance through quasi-static tests, demonstrating that the use of superelastic SMA longitudinal bars in the plastic hinge region results in significantly smaller residual displacements compared with conventional columns while enhancing energy dissipation capacity. Mansour et al. [
9] conducted a finite element analysis on the shear response of H-shaped steel section composite beams encased in ultra-high-performance fiber-reinforced concrete (UHPFRC). The findings indicate that the inclusion of UHPFRC composite significantly enhances the ultimate load capacity of the beams. Moreover, the analysis suggests that an increase in the shear-span-to-depth ratio results in a reduction of the ultimate load value.
The PSRC column reinforcement utilizes large-threaded steel bars and prestressed steel strands in a composite reinforcement method. Unlike the conventional requirement for even distribution of longitudinal bars along the perimeter of the column cross-section, this composite reinforcement method uses large-diameter, high-strength steel bars at the four corners and evenly arranges prestressed steel strands along the edges. Tian et al. [
10] have proposed a method with wide spacing and high-strength longitudinal bars, which simplifies the construction of node areas, reduces construction difficulties, and improves construction efficiency while ensuring construction quality. The widespread application of prestressing technology can draw insights from prefabricated prestressed bridge piers and prestressed steel strand piles [
11,
12,
13,
14,
15]. Prestressed steel strands tackle issues related to the poor ductility of prestressed steel bars in ordinary prestressed piles, leading to compromised lateral resistance, flexural and shear ductility, and susceptibility to brittle failure.
In comparison to RC columns with the same reinforcement ratio, the production cost of PSRC columns has increased by approximately 5%, while the load-bearing capacity has improved by around 10%. Furthermore, PSRC columns can be manufactured up to fifteen meters in a single section, reducing the number of column-to-column joints. This not only controls the occurrence of cracks during lifting and transportation but also enhances the overall economic feasibility of the column.
This paper presents low-cycle reverse loading tests on five prestressed steel strand concrete composite reinforced columns under different axial compression ratios and different prestressed steel strand diameters. It analyzes the impact of different parameters on the seismic performance of the specimens, including failure modes, hysteresis behavior, load-bearing capacity, and stiffness degradation. Finite element analysis is conducted using DIANA 10.5 software, and the results are compared and verified against the experimental results. The paper also analyzes three parameters: prestressing value control, composite reinforcement ratio, and axial compression ratio, providing reference for the future application of PSRC columns.
3. Experimental Results and Analysis
3.1. Test Observations and Failure Modes
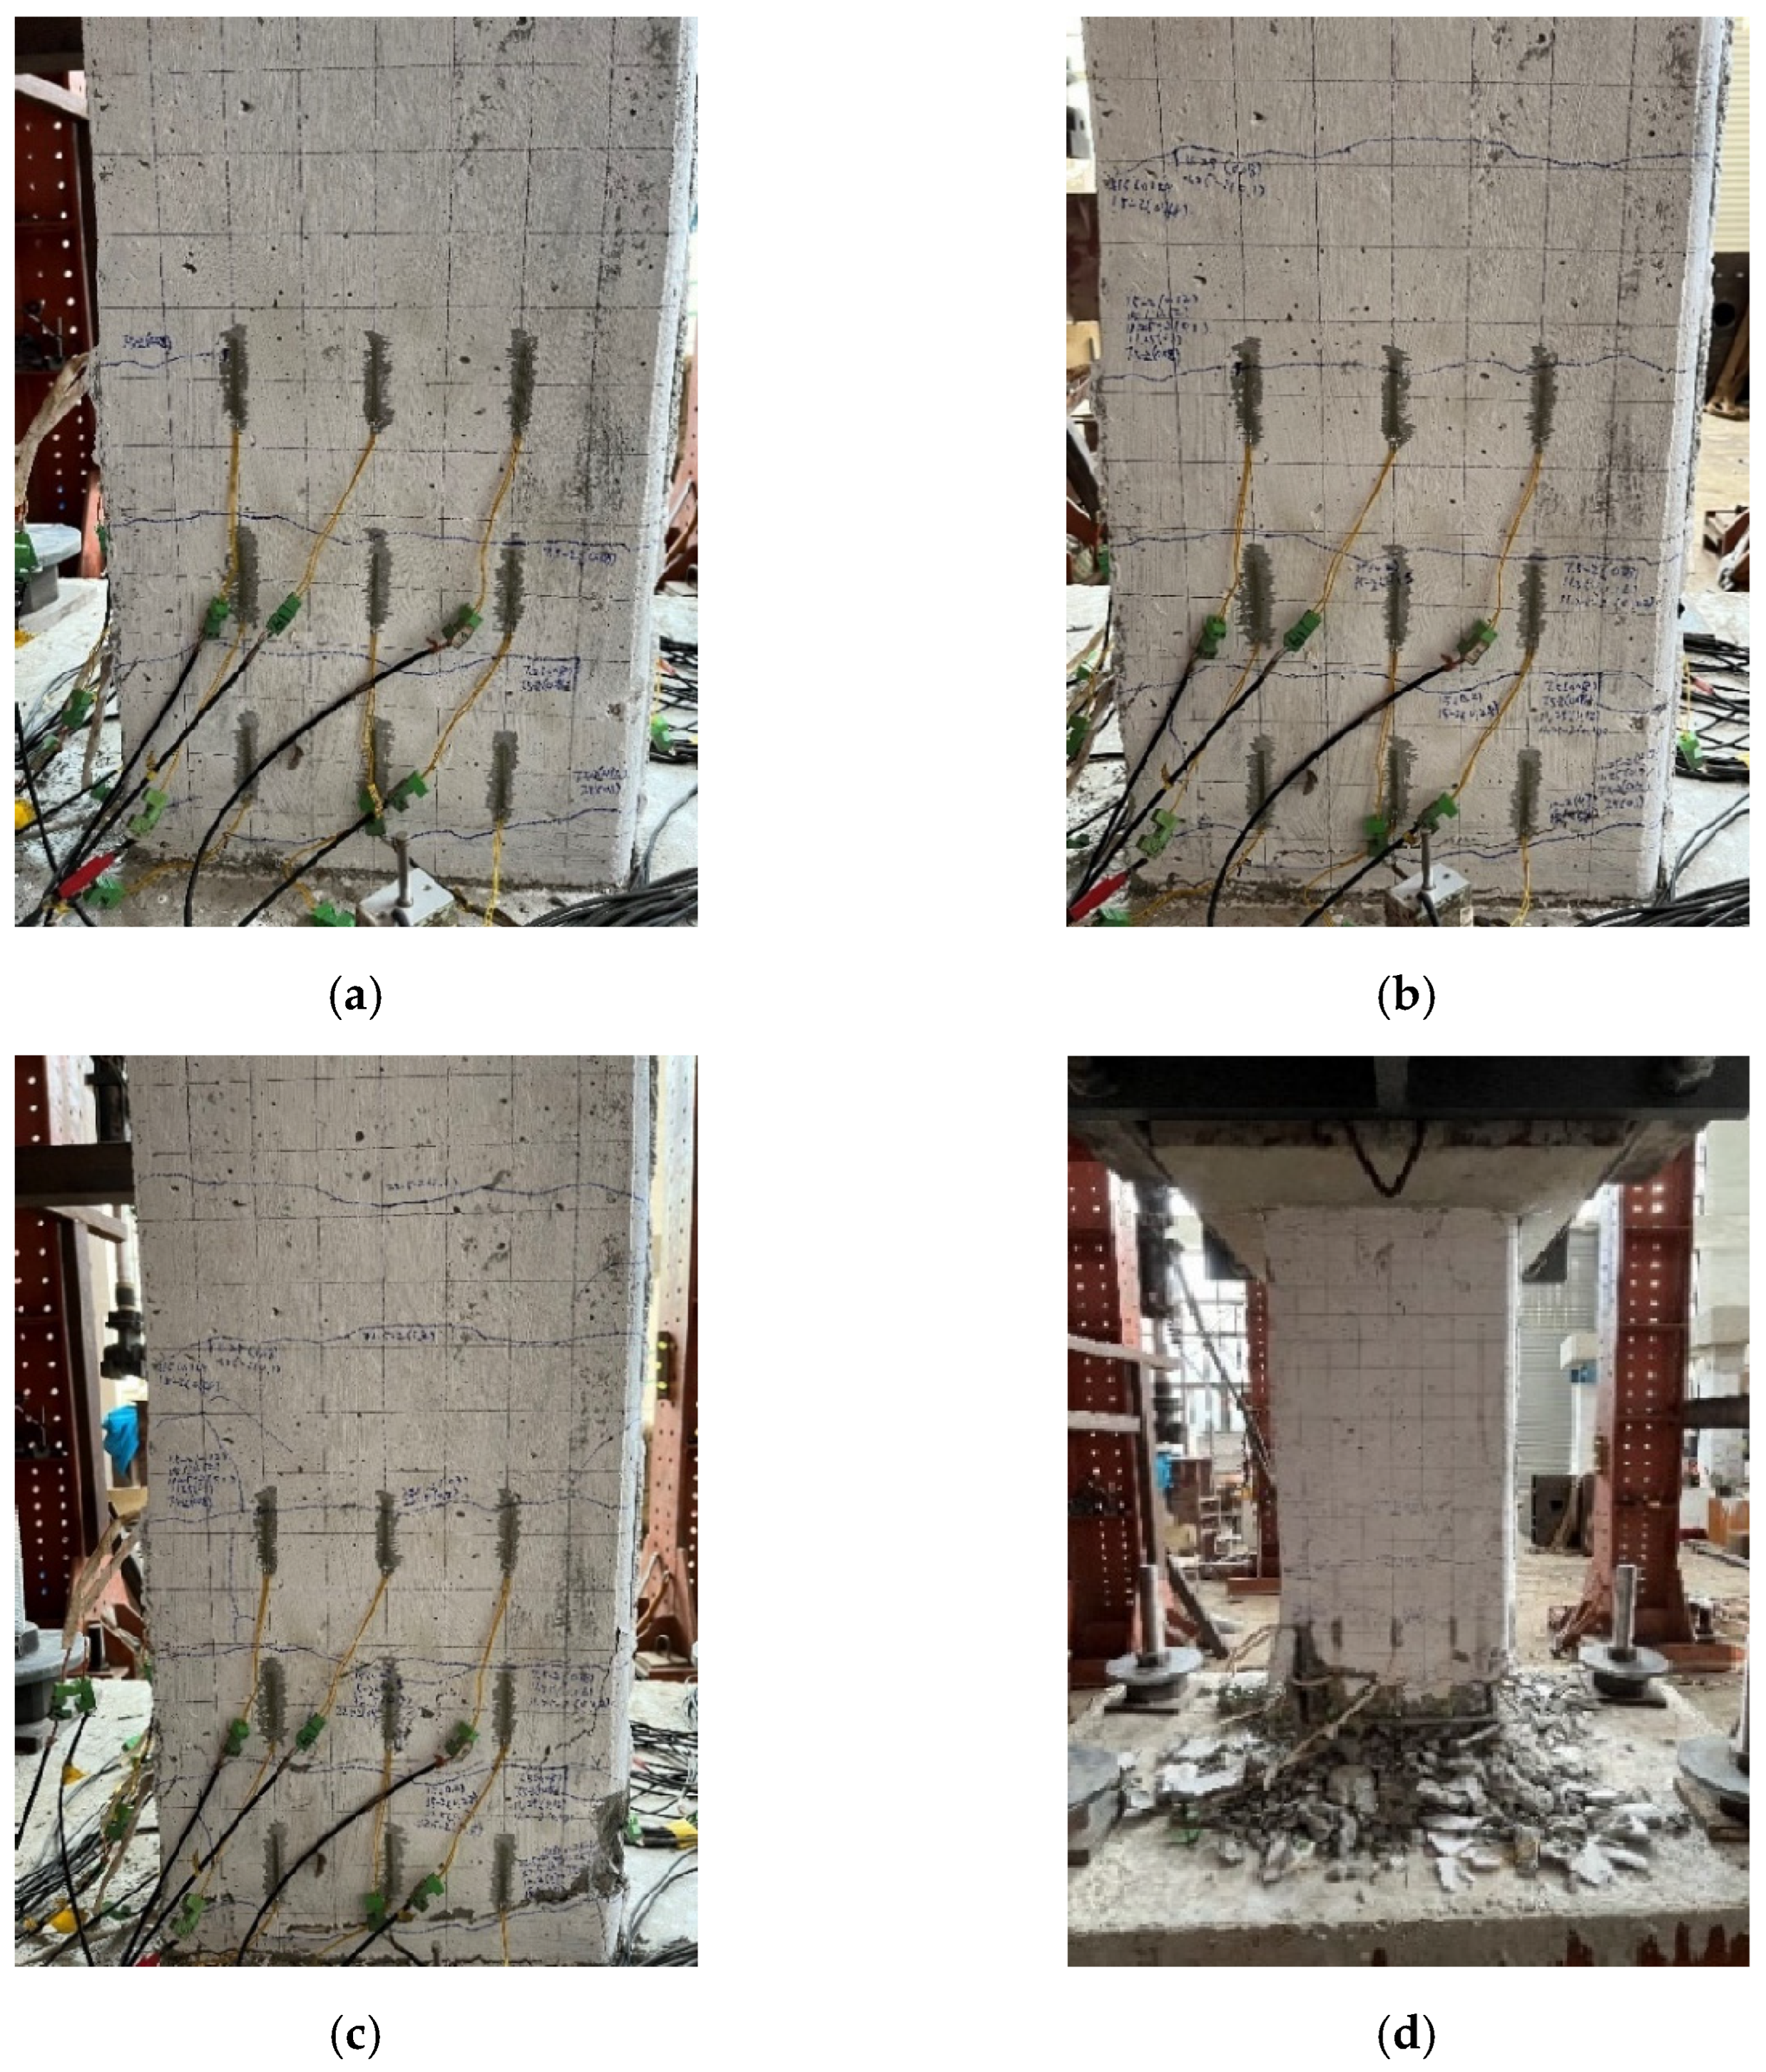
Under the action of low-cycle cyclic loading, the overall failure process of the five specimens was generally similar, exhibiting typical bending failure characteristics. Taking specimen PSRC3 as an example, the failure process is shown in
Figure 8. The load development process and crack propagation can be divided into four stages: the cracking load stage, the yielding stage, the peak load stage, and the failure stage.
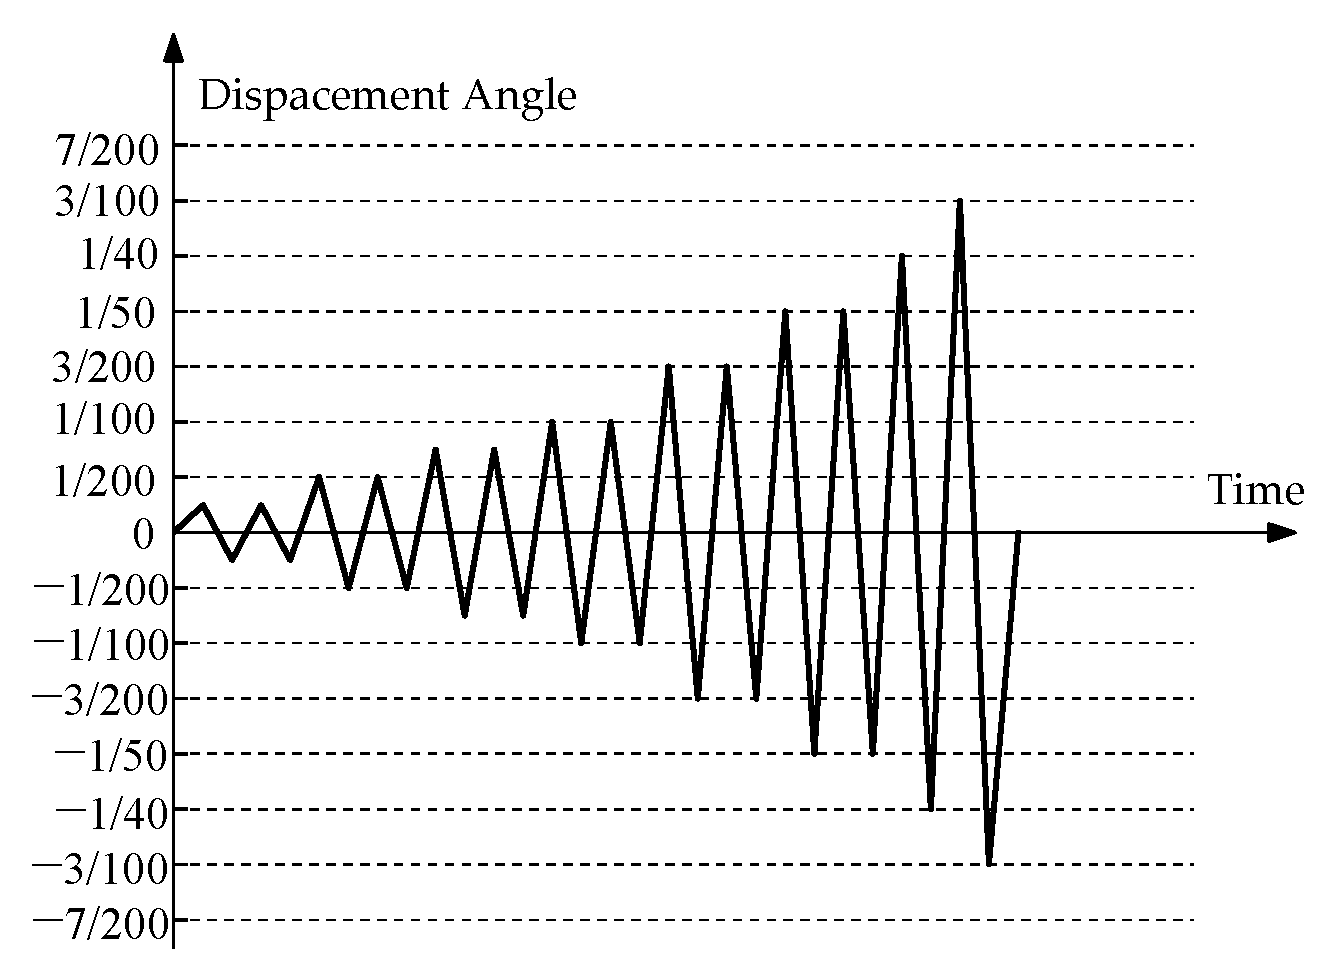
In the cracking load stage, when the displacement angle reached 1/400 (3.75 mm), the specimen was essentially in a linear state with little change in stiffness, and no cracks were visible. Upon applying the secondary displacement, the first crack appeared during the first cycle when the displacement angle reached 1/200 (7.5 mm). When the displacement angle reached 1/100 (15 mm), transitioning from the cracking stage to the yielding stage, the number of cracks increased continuously, and both their width and length further developed. Horizontal cracks appeared on the north and south sides of the column. When the displacement angle reached 3/200 (22.5 mm), entering the peak load stage, the cracks continued to increase, and their width notably increased. At the positive peak load, the maximum crack width reached 1.2 mm, and the concrete at the bottom of the column started to spall. Cracks on the north and south sides began to extend diagonally, forming a cross pattern. When the displacement angle reached 1/25 (60 mm), the load-bearing capacity had reduced to 68% of the peak load, and there were large pieces of crushed and detached concrete. Some longitudinal bars were exposed through the cracks, indicating specimen failure.
Overall, the experimental observations are in good agreement with expectations. The concrete at the bottom of the column was significantly crushed, and the concrete on the north and south sides of the column base, near the northeastern corner, was pulled apart. Plastic hinge rotation was evident, indicating that the specimens experienced flexural failure. The specimens exhibited good ductility, with the ability to achieve significant displacement angles without collapsing. This behavior demonstrates the combined reinforcement effect of large threaded bars distributed around the perimeter and prestressed steel strands placed in the middle.
3.2. Hysteresis Curves
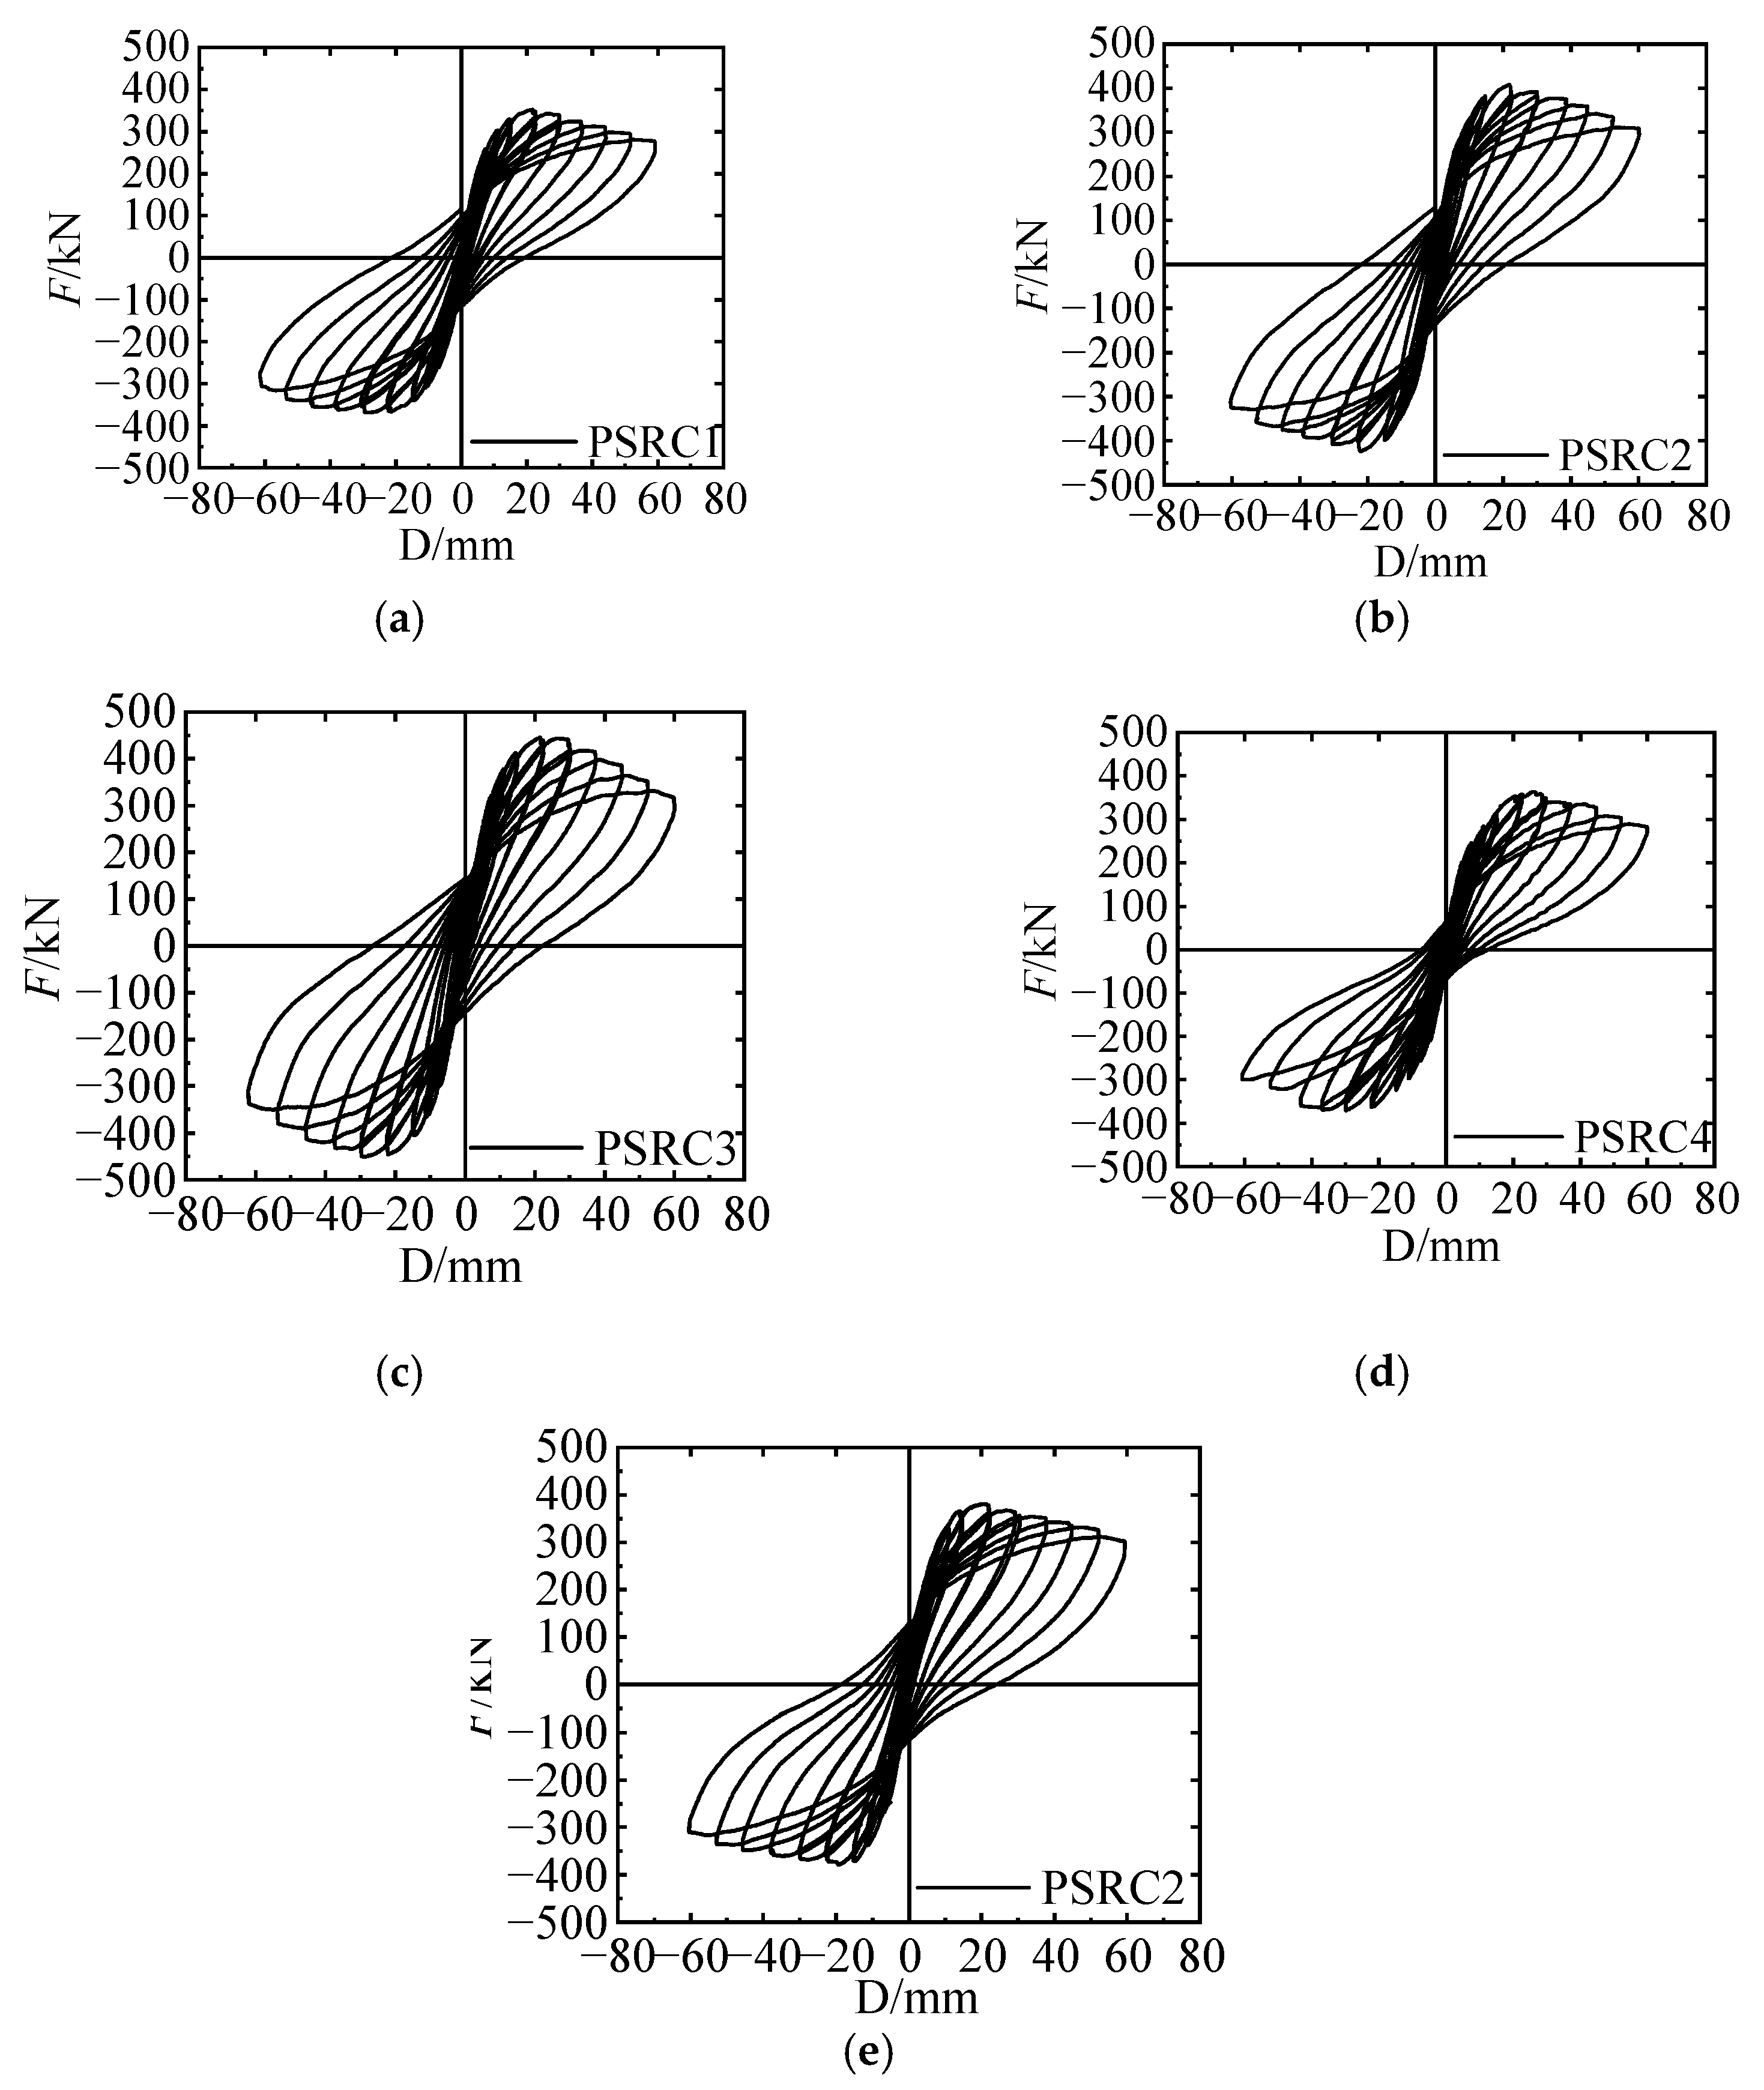
In this experiment, the measured horizontal load-displacement (F-D) hysteresis curves for each specimen are shown in
Figure 9. The vertical axis represents the horizontal load applied at the center of the loading point, and the horizontal axis represents the horizontal displacement at the center of loading (at a distance of 1500 mm from the column base). Positive and negative values on the horizontal axis represent forward and reverse loading, respectively. A comparison of the hysteresis curves for each specimen leads to the following conclusions:
The hysteresis curves of the five specimens exhibit a “bow-shaped” pattern with full hysteresis loops. During the initial loading stage, when the components are still in the elastic phase, the F-D curve shows essentially linear behavior after loading and unloading, with minimal residual deformation, and the steel does not yield. As displacement continues to increase, the components enter the elastoplastic phase, and after unloading, residual displacement remains. The F-D curve exhibits nonlinear behavior with an enlarged hysteresis loop, indicating strong energy dissipation capacity.
When the load reaches its peak, concrete crushing and spalling occur on both sides, and near zero vertical displacement, there is some pinching in the hysteresis loop. This pinching is due to the gradual loss of effectiveness in the steel strands and reinforcement within the composite reinforcement system, leading to some slipping during this phase. The hysteresis curves of the specimens are generally symmetric during both forward and reverse loading, with similar lateral stiffness in both directions. Due to damage accumulation in the concrete specimens under repeated loading, significant stiffness degradation occurs, resulting in a decrease in load values and hysteresis loop area in the second cycle compared with the first cycle at the same displacement.
Comparing
Figure 9a–c, it can be observed that the hysteresis curves of all specimens are relatively full and exhibit good energy dissipation capacity. With an increase in the axial load ratio, the initial stiffness of the specimens improves, and the horizontal load-bearing capacity increases. However, as the specimens reach the peak load, a higher axial load ratio results in a steeper descending segment of the curve, and ductility decreases. Three specimens show smaller residual displacements, primarily because the prestressed steel strands inside the column provide reduced stiffness degradation.
Comparing
Figure 9b,d,e, it can be observed that as the diameter of the prestressed steel strands increases, the initial stiffness and horizontal load-bearing capacity of the specimens improve. However, the trend of the descending segment of the curve is generally consistent among the three specimens. The residual displacements of the three specimens decrease with increasing diameter of the prestressed steel strands, primarily due to the increased prestress applied to the column by larger diameter prestressed steel strands.
The hysteresis loops of the PSRC columns are relatively full for several reasons. The use of prestressed steel strands enhances the performance of the concrete and also provides a certain recentering capability. After reaching peak load and specimen failure, good bonding properties between high-strength concrete and prestressed steel strands ensure the stiffness of the specimen during unloading. The recentering function of the steel strands during unloading does not cause a sharp drop in the load, resulting in a smoother decrease compared with RC components.
3.3. Skeleton Curves
The skeleton curves of the specimens in this experiment are shown in
Figure 10. The skeleton curve is derived by connecting the peak load points in each loading cycle, forming an envelope that delineates the trajectory of the maximum horizontal force peaks attained by the specimen across various loading cycles.
Examining the skeleton curve reveals distinct phases in the specimen’s behavior, characterized by elastic, elastoplastic, and descending stages. During the initial stages of loading, the specimen remains within the elastic range, exhibiting a linear correlation between force (F) and displacement (D). With progressive loading, the specimen transitions into the elastoplastic phase, leading to a reduction in the slope of the skeleton curve. Subsequent to further loading and entry into the failure stage, the concrete undergoes fragmentation, resulting in a consequential decrease in the column’s load-bearing capacity.
From the graph, it can be observed that the skeleton curve shapes of the various prestressed steel strand composite reinforcement columns are generally similar, all including the rising segment, peak load point, and descending segment. The Park method [
21] was used to extract the yield point, peak point, and ultimate point from the skeleton curves, and the corresponding characteristic point loads are listed in
Table 5.
As the axial load ratio increases, the initial stiffness of the specimen increases, and there is a relatively small difference in yield displacement. When the axial load ratio is increased from 0.2 to 0.35, the cracking load, yield load, and peak load of the specimens increase by 7.38%, 16.47%, and 15.60%, respectively. When the axial load ratio is further increased from 0.35 to 0.5, the cracking load, yield load, and peak load of the specimens increase by 8.33%, 7.47%, and 6.95%, respectively. In the post-peak stage, specimens with higher axial load ratios experience a rapid reduction in bearing capacity and earlier failure.
With an increase in the diameter of the prestressed steel strands, the initial stiffness of the specimen increases, while the ductility does not show significant differences. When the diameter is increased from 9.5 mm to 11.1 mm, the cracking load, yield load, and peak load of the specimens increase by 13.67%, 7.41%, and 3.46%, respectively. When the diameter of the prestressed steel strands is increased from 11.1 mm to 12.7 mm, the cracking load, yield load, and peak load of the specimens increase by 2.86%, 9.51%, and 9.58%, respectively.
In terms of the magnitude of improvement, the increase in peak load is not linearly related to the axial load ratio, and the difference in the improvement magnitude decreases with increasing axial load ratio.
The non-linear increase in peak load with increasing axial load ratio can be attributed to the enhancement of the flexural capacity of eccentrically compressed members. According to the M-N interaction diagram for eccentrically compressed members, as the axial load N increases linearly, the bending capacity M of the specimens also increases non-linearly. The experimental observations are consistent with this changing pattern.
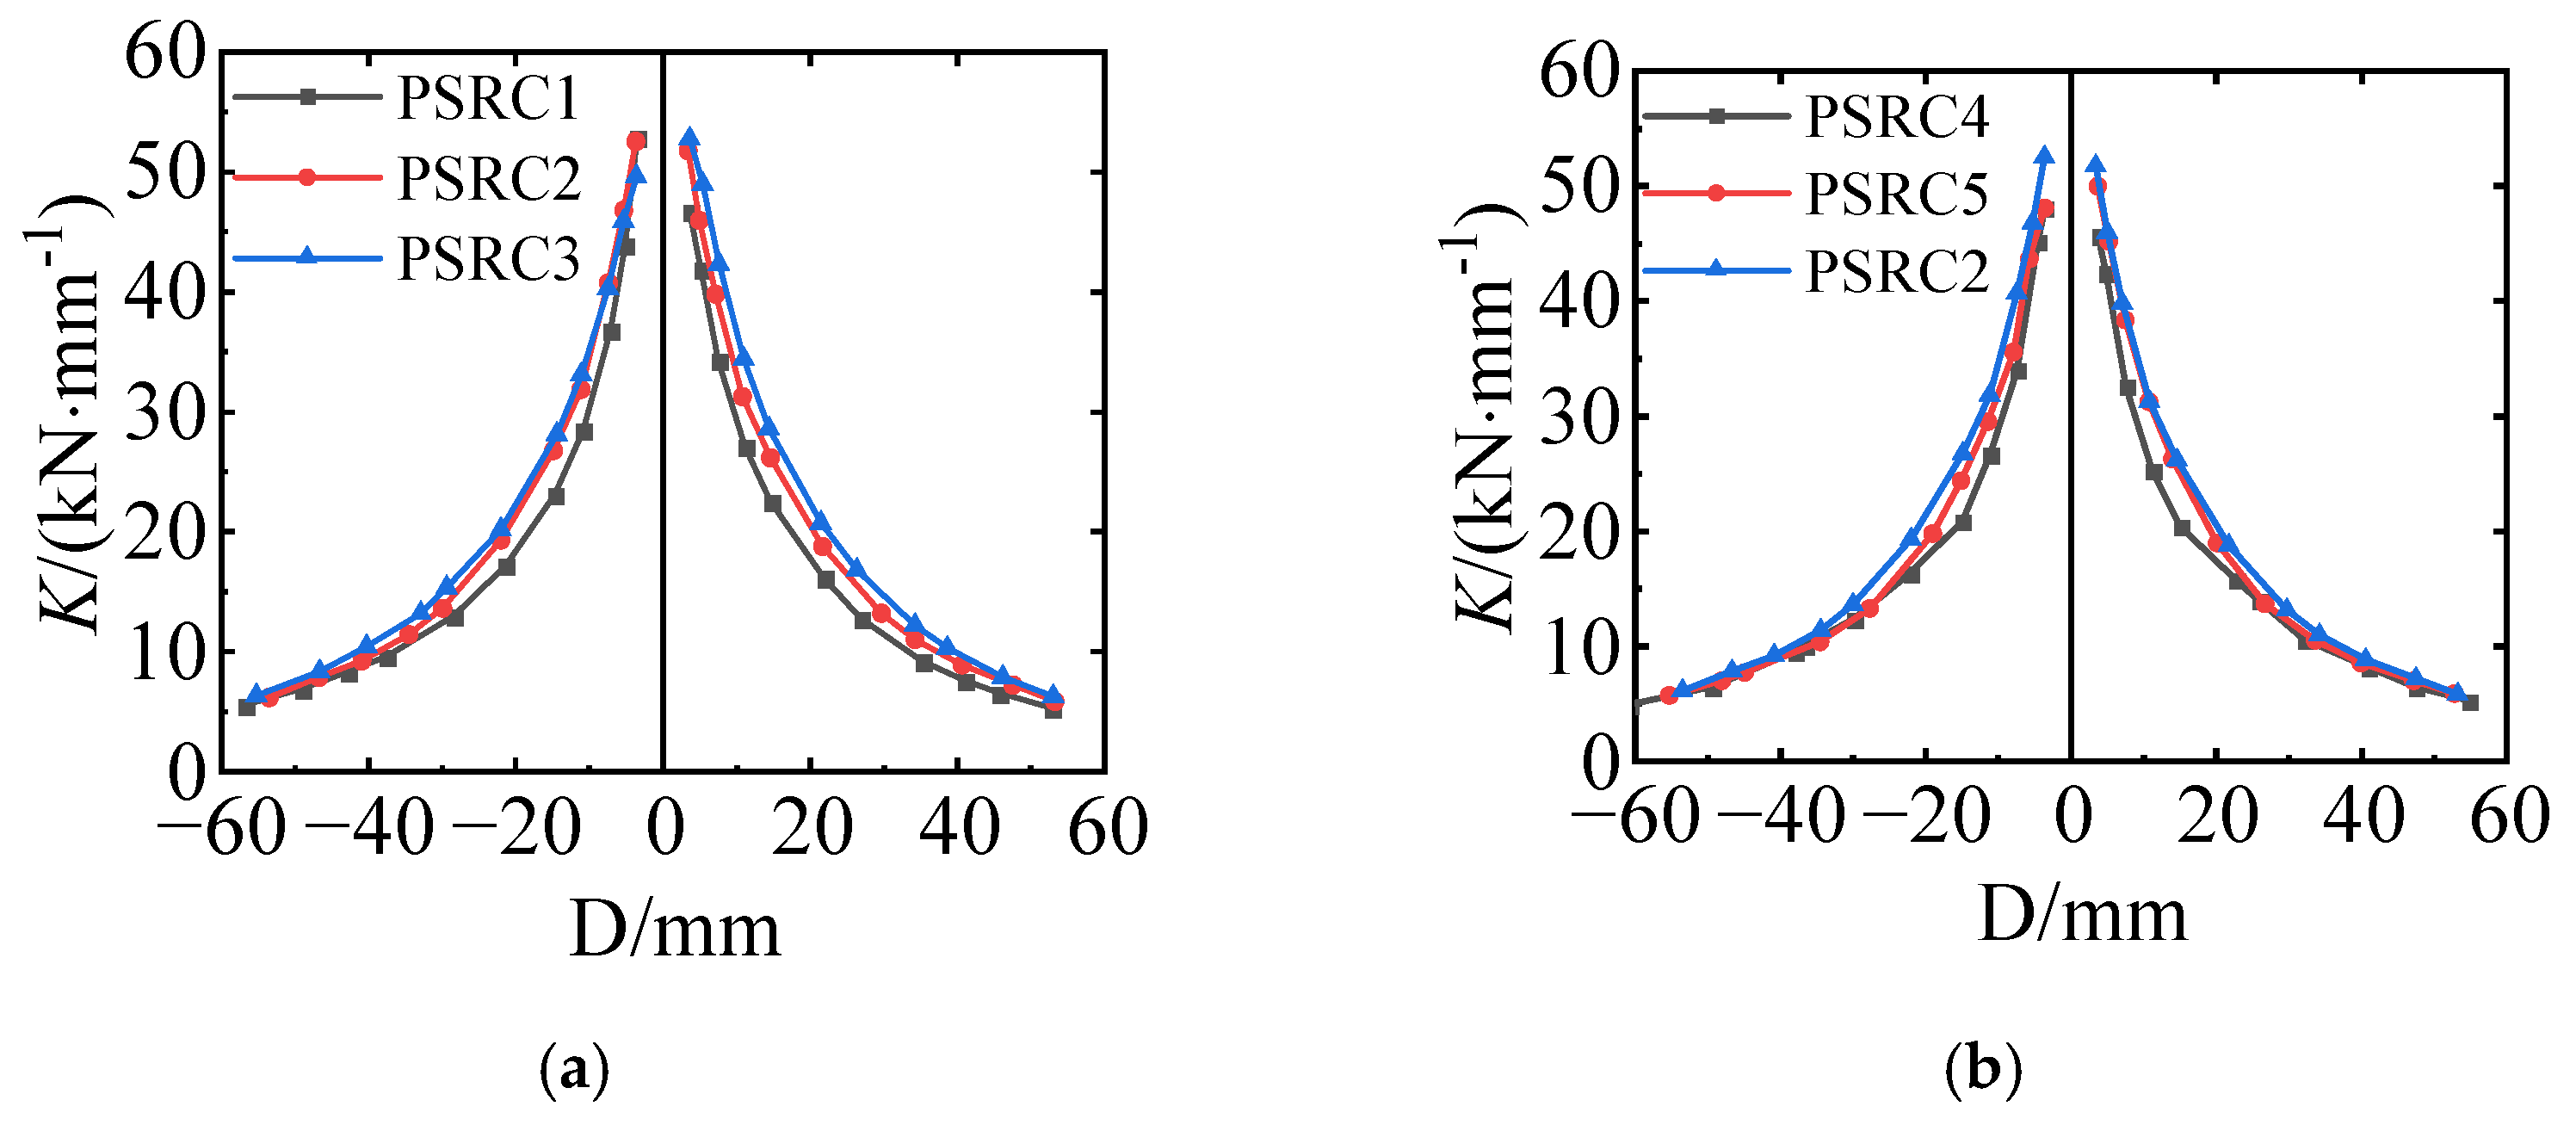
3.4. Stiffness Degradation
The stiffness(K) degradation curves of each specimen are shown in
Figure 11.
where
Kj is the stiffness at the
j-th displacement level, calculated separately for both the positive and negative directions.;
j is the grade of the displacement;
i is the number of cycles;
Pij and Δ
ij represent the maximum lateral load and displacement amplitude, respectively, for the
i-th cycle at the
j-th displacement level;
n is the total number of loading cycles for the
j-th displacement level.
Before cracking, the initial stiffness of the three specimens is relatively high, and it gradually decreases as the horizontal load increases. After cracking, as the cracks continue to develop, the concrete gradually loses its effectiveness, leading to accelerated stiffness degradation. Once the primary cracks have formed and no new cracks appear, the trend of stiffness degradation slows down.
With the increase in axial compression ratio, the stiffness of the specimens significantly increases. From the beginning of loading until the component enters the yielding stage, the rate of stiffness degradation in specimens with higher axial compression ratios decreases. However, after entering the yielding stage, the rate of stiffness degradation in specimens with higher axial compression ratios accelerates. Larger steel strand diameters result in higher initial stiffness in the specimens, but they also lead to a faster rate of stiffness degradation after entering the yielding stage. Increasing the diameter of prestressed steel strands helps to improve the initial stiffness of the specimens in the early stages.
The reasons behind the observed trends are as follows: Increasing the axial pressure ratio enhances the overall stiffness of the column. However, in the later stages of loading, the heightened axial pressure ratio exacerbates concrete cracking, leading to a more rapid decline in column stiffness. Increasing the diameter of the prestressed steel strands not only elevates the equivalent stiffness of the specimen cross-section but also imposes additional pressure on the column due to prestress. In the later stages of loading, although an increase in the area of the tensioned elastic prestressed steel strands occurs, the decline in stiffness is still primarily governed by the concrete failure.
3.5. Ductility Performance
Ductility is an important indicator that reflects the plastic deformation capacity of reinforced concrete structures and is also one of the key indicators for assessing structural seismic performance. The yield displacement (Δ
y), peak displacement (Δ
max), ultimate displacement (Δ
u), displacement ductility ratio (
μ), and inter-story displacement angles (
θ) for PSRC columns are shown in
Table 6.
where Δ
u is the ultimate displacement; Δ
y is the yield displacement; Δ is the displacement of the loading point; and
H is the height of the PSRC column.
Increasing the axial pressure ratio exacerbates the damage to the concrete at the base of the column. When the axial compression ratio increased from 0.2 to 0.35, the cracking displacement of the specimens increased by 4.66%, and there was little difference in yield displacement and peak displacement, resulting in a 12.70% decrease in displacement ductility. When the axial compression ratio increased from 0.35 to 0.5, the cracking displacement of the specimens increased by 4.44%, with little difference in yield displacement and peak displacement, resulting in a 3.41% decrease in displacement ductility.
When the diameter increased from 9.5 mm to 11.1 mm, the cracking displacement of the specimens increased by 9.65%, yield displacement decreased by 21.01%, peak displacement decreased by 29.21%, and displacement ductility increased by 33.08%. When the diameter increased from 11.1 mm to 12.7 mm, the cracking displacement of the specimens increased by 6.75%, yield displacement increased by 10.40%, peak displacement increased by 11.38%, and displacement ductility decreased by 16.51%. In comparison to conventional steel reinforcement, prestressed steel strands exhibit superior tensile ductility and better bond performance with concrete. An increase in the diameter of prestressed steel strands enhances ductility when the additional axial pressure ratio is not excessively high. However, with excessively high additional axial pressure ratios, the damage to the concrete in the later stages of loading becomes more severe, leading to a deterioration in ductility.
The ultimate displacement angles of the specimens with prestressed steel strand composite reinforcement columns in the test ranged from 1/32 to 1/26, all meeting the requirements of “Code for Seismic Design of Buildings” (GB50011-2010), [
22] which specifies that the ultimate displacement angle for structures with seismic design fortification capacity should exceed 1/50.
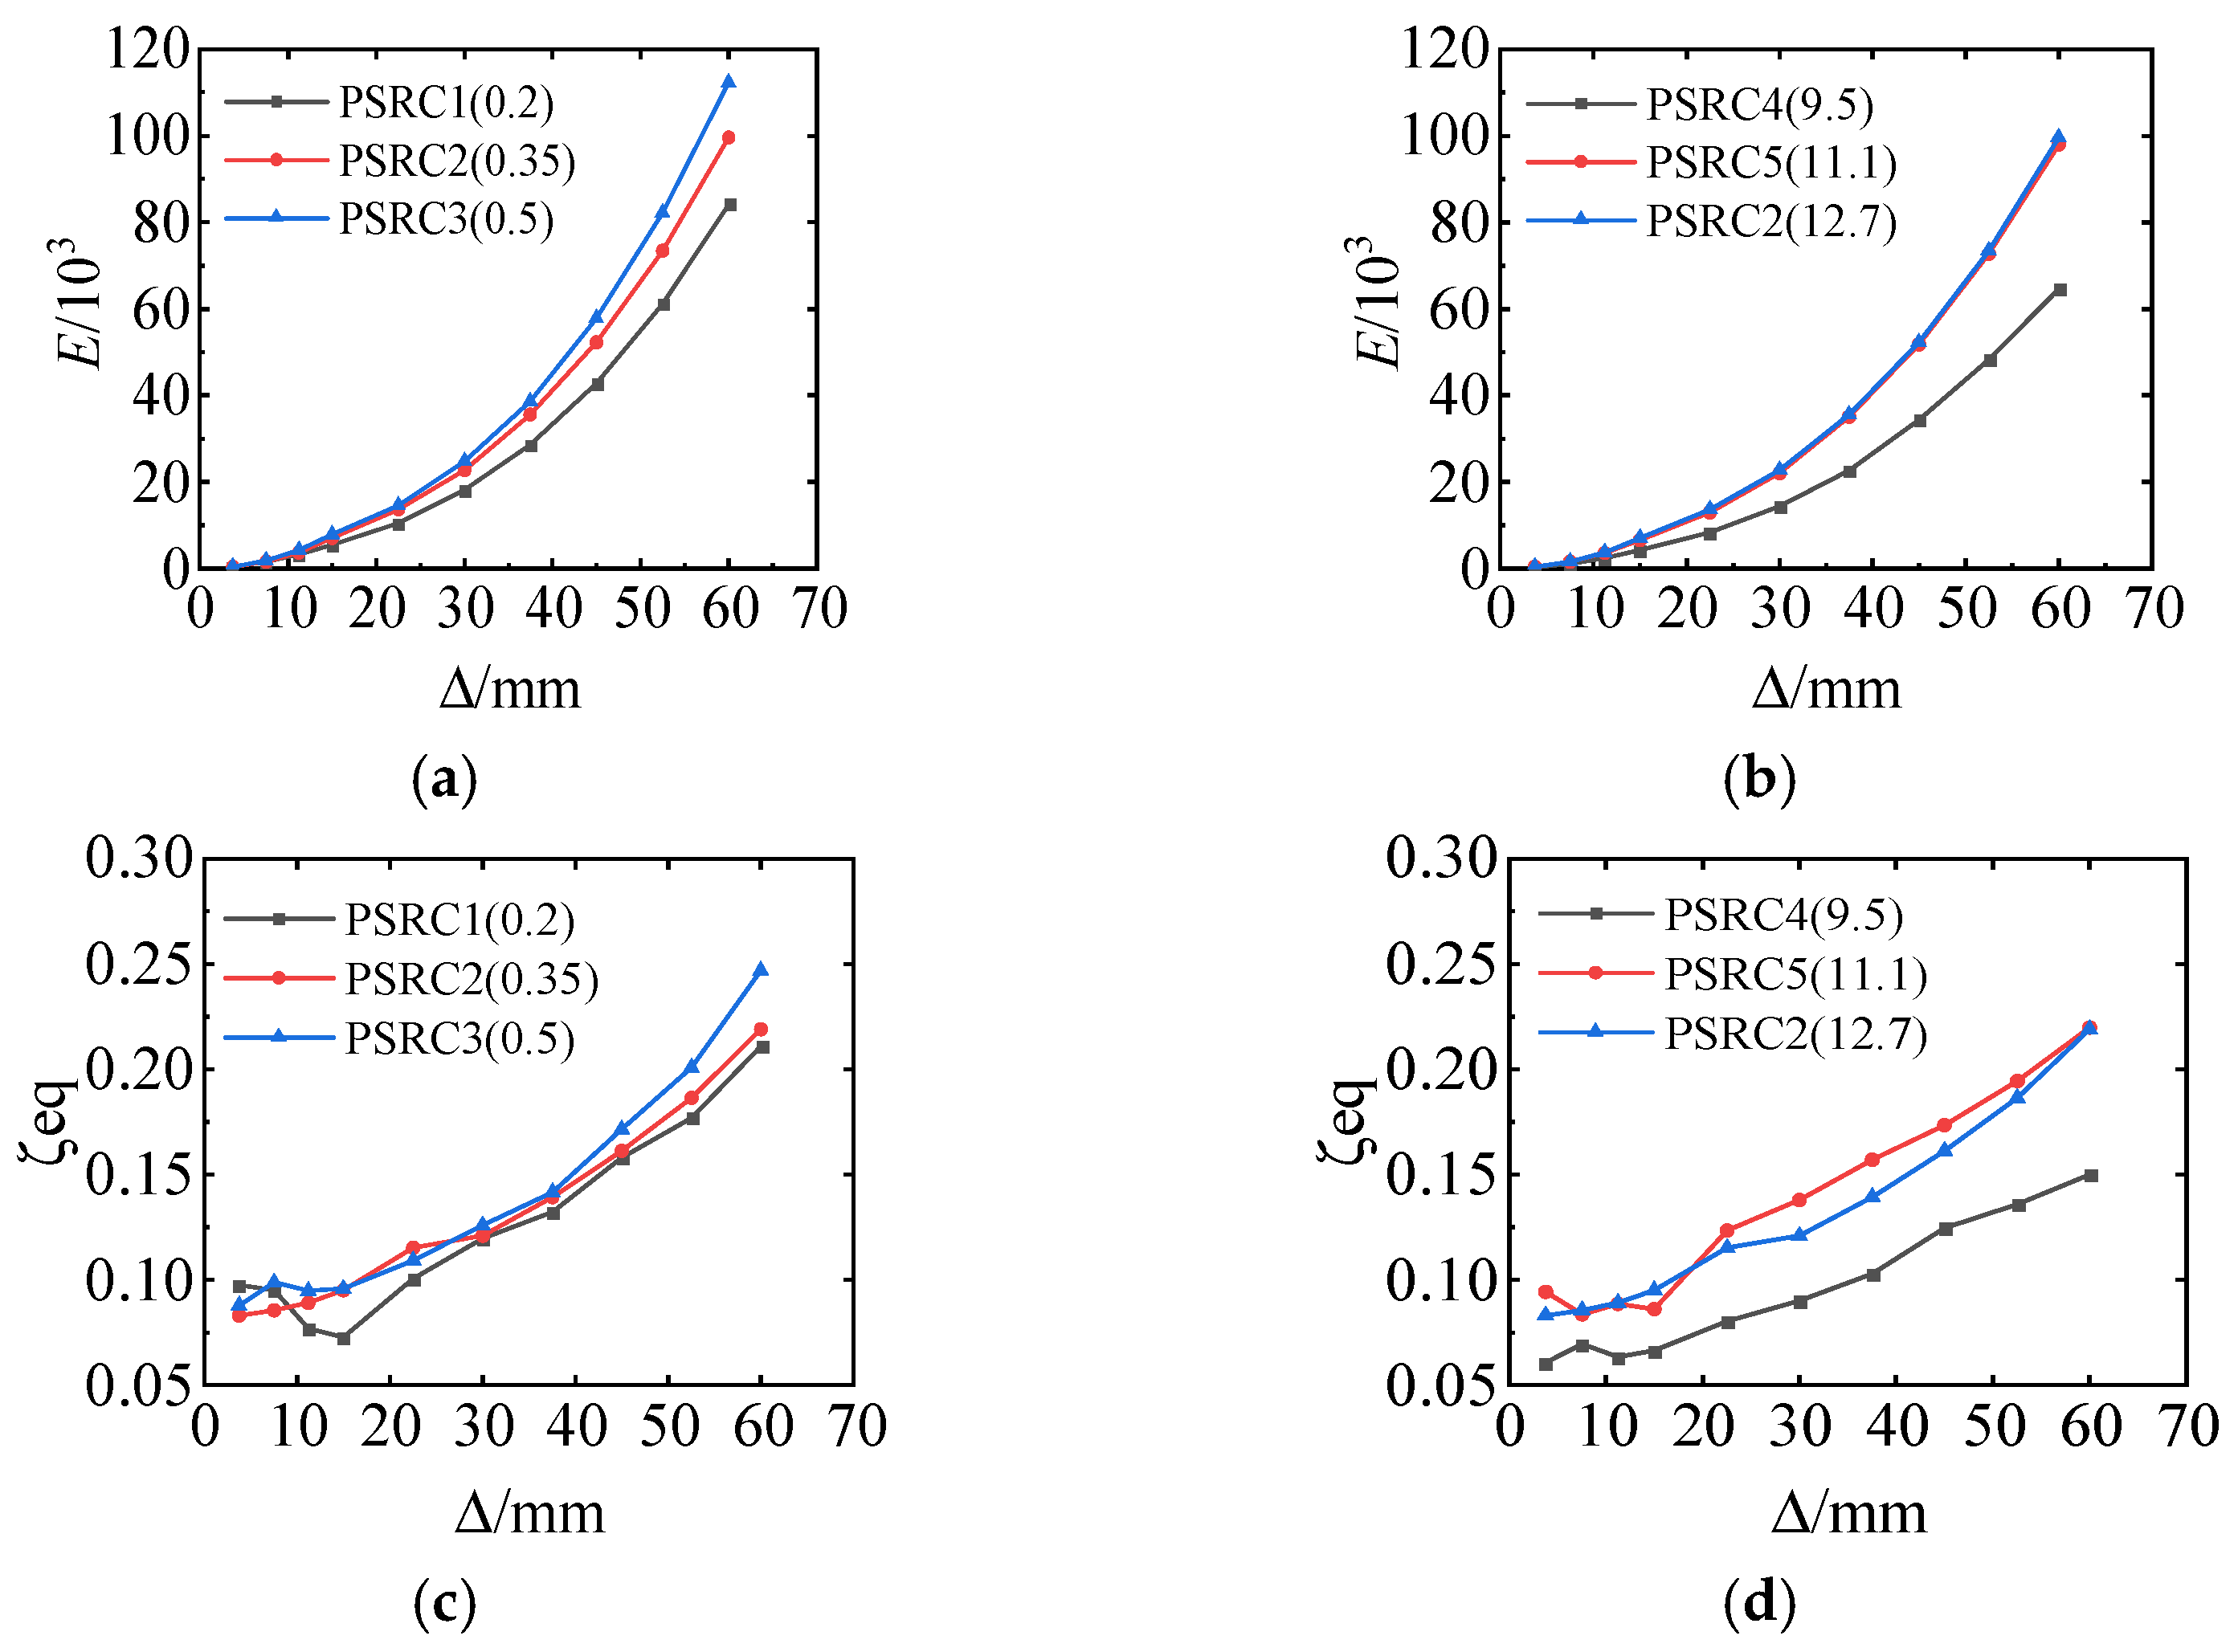
3.6. Energy Dissipation Capacity
Energy dissipation capacity is the ability of a structure to absorb and dissipate seismic energy. According to the “Code for Seismic Test Methods of Buildings” (JGJ 101-2015) [
23], energy dissipation capacity is expressed through cumulative energy dissipation and the equivalent viscous damping coefficient. The energy dissipation capacity of the specimens is shown in
Figure 12.
As the axial compression ratio increases, the cumulative energy dissipation of the specimen increases, and the overall trend of the curves is similar. The specimens dissipate energy through the failure of concrete. Under the influence of higher axial pressure ratios, the intensification of concrete failure leads to higher cumulative energy dissipation in the specimens. Regarding the equivalent viscous damping coefficient, a higher axial compression ratio results in a larger equivalent viscous damping coefficient for the same displacement.
With an increase in the diameter of the prestressed steel strand, there is some improvement in energy dissipation capacity, but there is not much difference in cumulative energy dissipation between specimen PSRC5 with a strand diameter of 11.1 mm and specimen PSRC3 with a strand diameter of 12.7 mm. The observed trend is a result of the larger diameter of prestressed steel strands. This increase intensifies the additional pressure exerted by prestress on the column, leading to exacerbated concrete damage. Simultaneously, the excellent tensile ductility and superior bond performance of steel strands with concrete mitigate the progression of concrete damage in the column. When considering the equivalent viscous damping coefficient, specimen PSRC1 with a strand diameter of 9.5 mm has the smallest damping coefficient, while specimen PSRC5 with a strand diameter of 11.1 mm has a slightly larger coefficient than specimen PSRC3 with a strand diameter of 12.7 mm. This indicates that the equivalent viscous damping coefficient is related to the form and proportion of composite reinforcement.
The equivalent viscous damping coefficients at the failure of the specimens are mostly greater than 15%, indicating good energy dissipation capacity for each specimen.
4. Finite Element Analysis (FEA)
4.1. Model Establishment
Based on the actual simulation in the DIANA finite element software, the concrete hysteresis model is selected based on the total strain-crack model, with the compressive curve using the Fukuda-Fukufu concrete compression curve model [
24] and the tensile curve using the concrete constitutive model in Appendix C of China’s current “Code for Design of Concrete Structures” (GB50010-2010) [
25]. The constitutive relationship for the reinforcing bars is based on the Menegotto-Pinto reinforcing bar model [
26], and the prestressed steel strand uses a bilinear model, as shown in
Figure 13.
A 30 mm steel collar is placed around the column head to transmit horizontal loads, and the axial load on the column head is applied as a distributed load to avoid local compression failure.
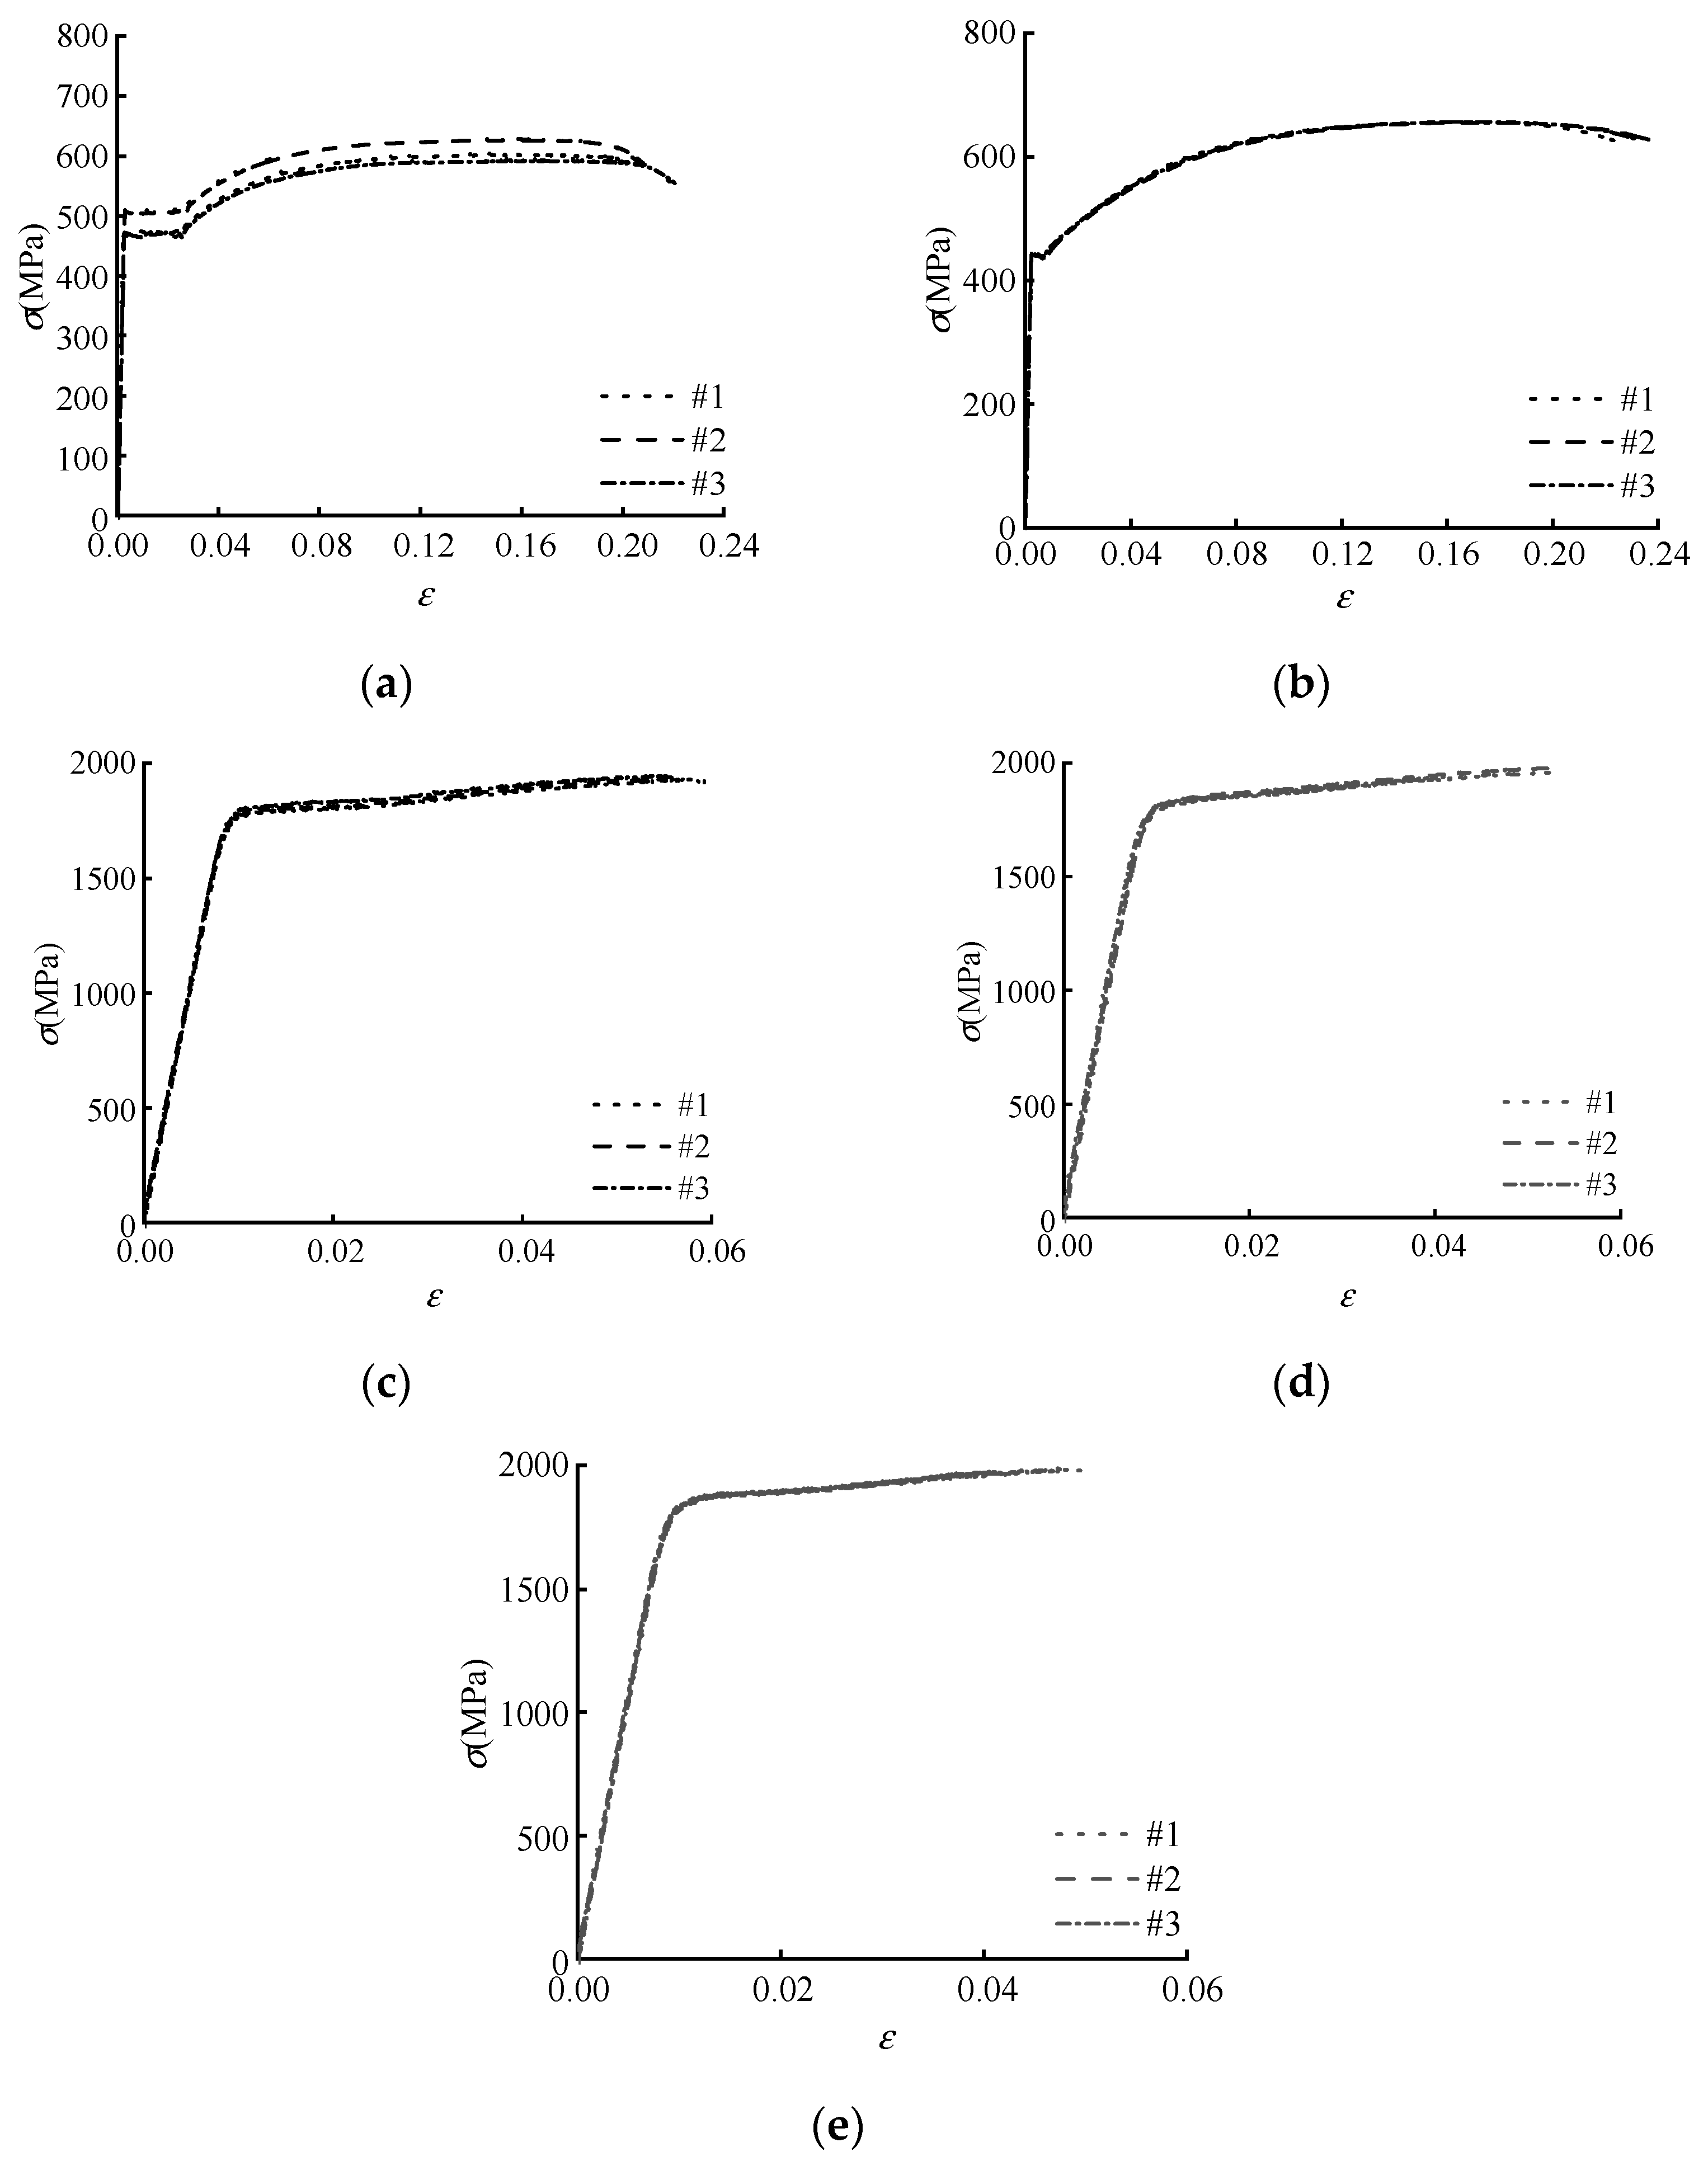
Material property: This section is consistent with the data obtained from material experiments.
Element: Solid elements HX24L is used for the steel collars, upper and lower anchors, and concrete. Embedded steel bar elements are used for the reinforcing bars. The HX24L element is a unit in the Diana software designed for simulating three-dimensional structures. It supports various stress-strain models and facilitates the simulation of interactions among multiple parts. The TP18L element, included in Diana, is specifically designed for simulating reinforcement, providing a good representation of the bonding relationship between concrete and reinforcement.
Mesh: Considering the influence of mesh division on the results of finite element software, the mesh sizes for the column body, column head, and base are set to 50 mm.
Constraint: The boundary conditions of the model are consistent with the actual experiments. The displacement and rotational degrees of freedom in the X, Y, and Z directions at the base of the column are simulated by constraining the base. Additionally, the displacement and rotation in the X direction are constrained by the sides of the column and the support.
Loading: Simulating the actual loading conditions, horizontal displacement along the y-direction is applied to the steel casing, and uniformly distributed loads in the z-direction are applied to the column head.
The model’s boundary conditions, mesh division, and load application are shown in
Figure 14.
4.2. Model Validation against Test Results
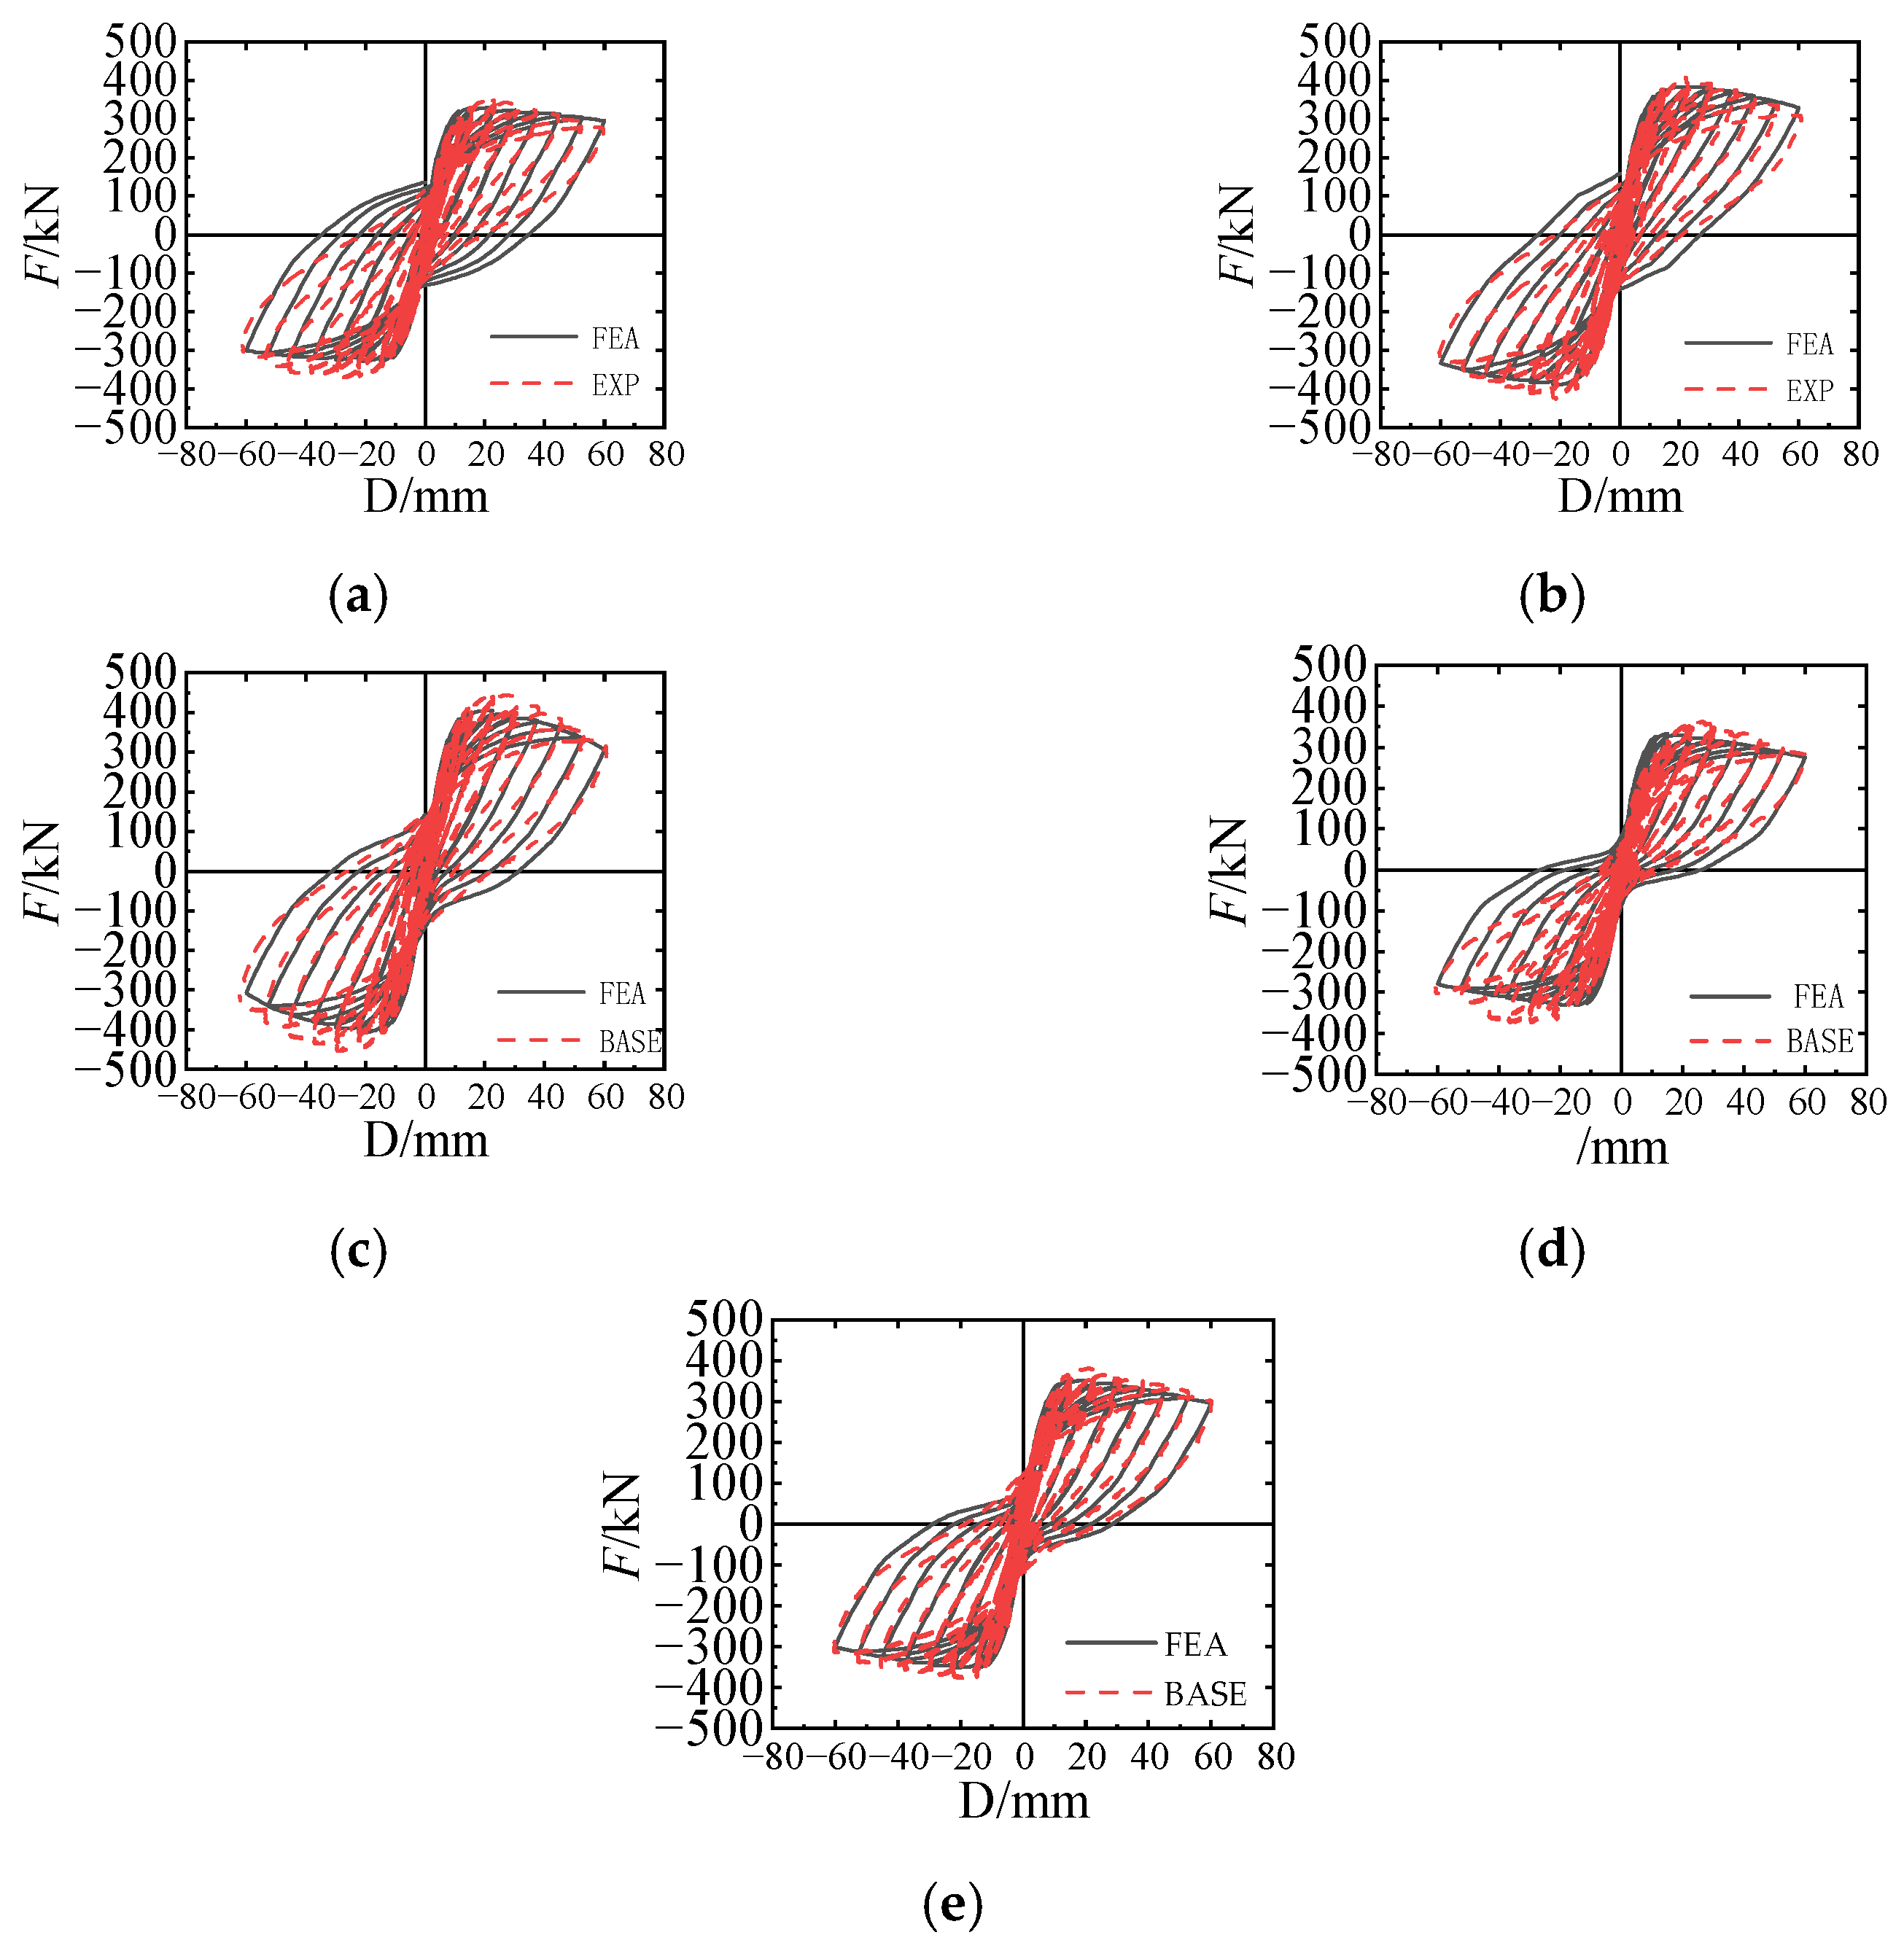
Comparison of Hysteresis Loops between Finite Element and Experimental Results, as Shown in
Figure 15.
The hysteresis curves obtained from finite element simulations generally agree well with the experimental results. In the early stages of loading, as the components enter the elastic phase, the initial stiffness is in good agreement between the models. However, in the elastic-plastic phase, some models show slightly higher stiffness than the experimental values. As the curves enter the descending phase, they become flatter. The main reasons for this difference are:
Different loading conditions: Finite element analysis assumes ideal unidirectional horizontal loading, while actual experiments involve low-cycle cyclic loading. This leads to significantly higher cumulative concrete damage in the experimental specimens compared with the unidirectional loading assumed in the finite element analysis.
Idealized rebar slip in finite element analysis: The rebar slip modeled in finite element simulations may be more idealized and uniform compared with the actual rebar slip in experiments.
Heterogeneous concrete material: The actual concrete material in experiments is not homogeneous, whereas finite element simulations often assume a uniform distribution of concrete properties.
Rebar failure: In the experimental process, rebar may experience breakage or uneven loading, which cannot be accurately simulated by the rebar models used in finite element analysis.
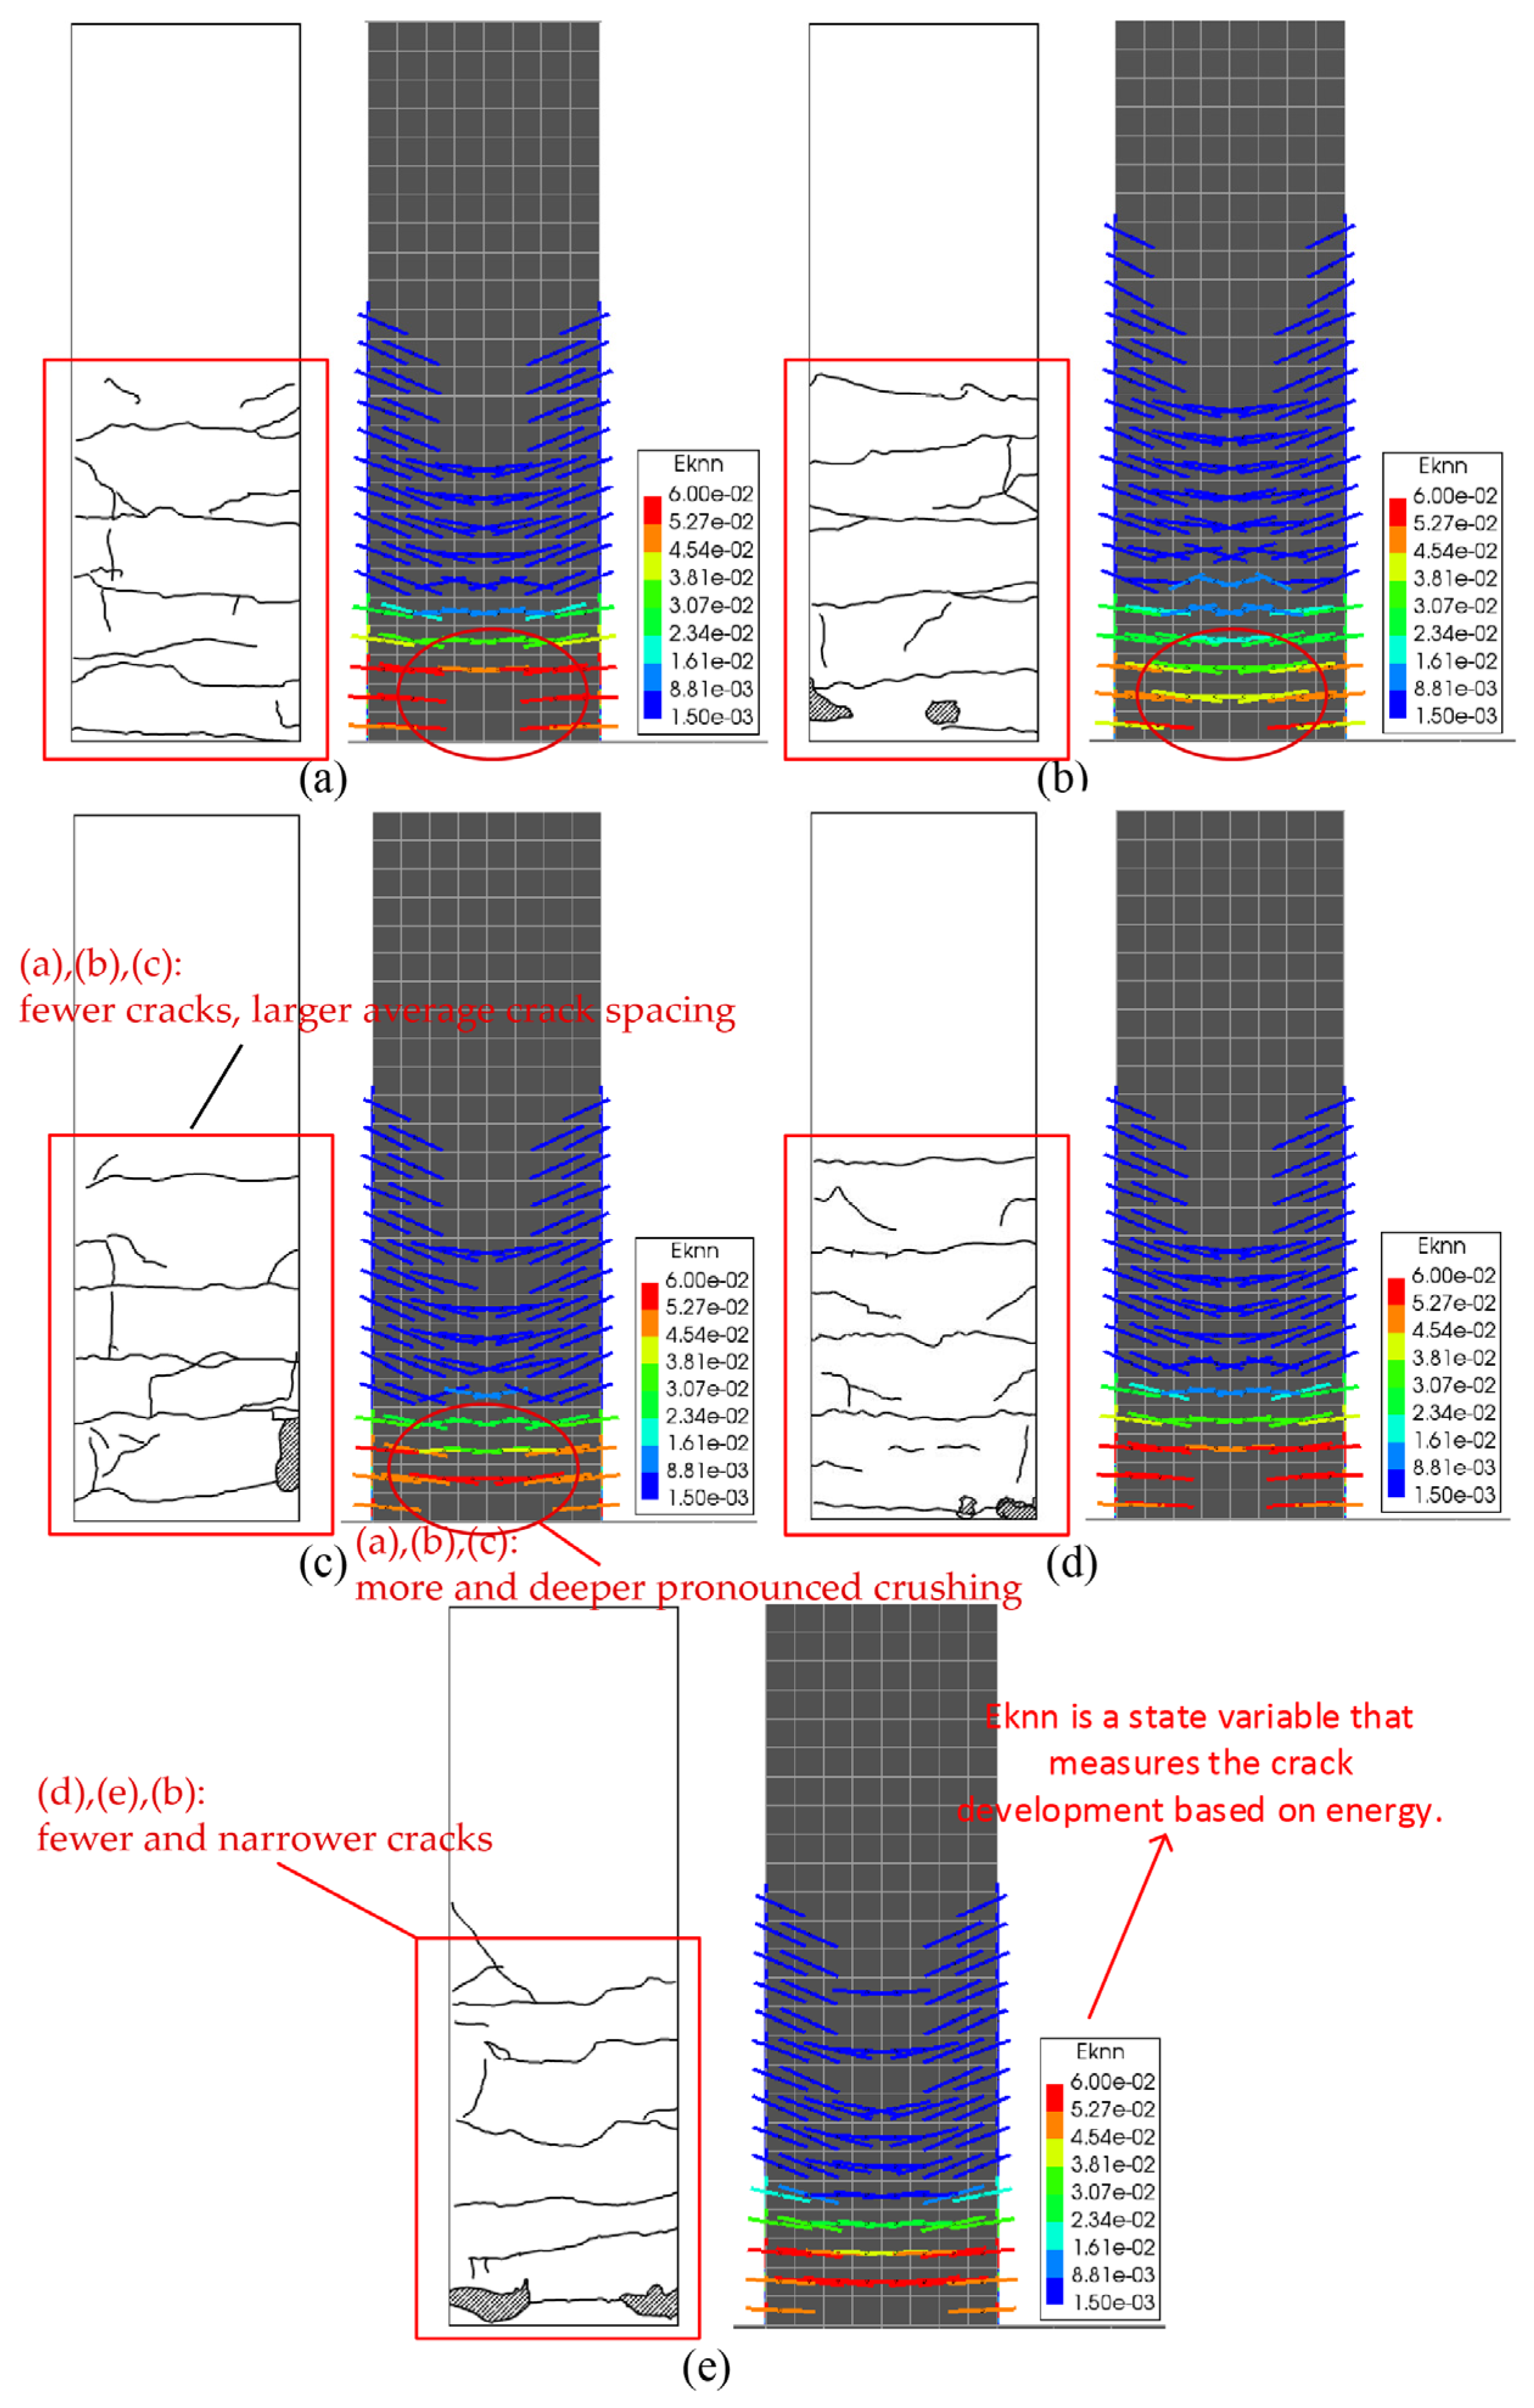
Figure 16 shows a comparison of crack development between experiments and finite element analysis. It can be observed that the crack distribution provided by DIANA in the strain analysis corresponds well to the actual crack development in the test specimens. The main characteristics include:
Concentrated distribution of main cracks in the lower region of the column.
Mainly compressive-bending cracks.
Crack propagation starts horizontally from the edges of the column vertices and extends towards the column’s central region.
As the axial load ratio increases, the opening displacement and load of the specimen increase. Specimens with higher axial load ratios exhibit horizontal cracks later in the loading process. Specimens with higher axial load ratios tend to have fewer cracks, larger average crack spacing, and more pronounced crushing of concrete at the bottom of the column. Similarly, with an increase in the diameter of prestressed steel strands, the opening displacement and load of the specimen increase, and horizontal cracks appear later with fewer and narrower cracks.
Analyzing the reasons for these observations:
Increasing the axial load ratio: For specimens with a large eccentrically compressed load, increasing the axial load ratio enhances their axial load-carrying capacity and the performance of concrete. Therefore, cracks appear later in the loading process. However, during the failure phase, due to the higher axial load ratio, the bending moment at the bottom of the column is also greater, resulting in more severe damage during failure.
Increasing the diameter of prestressed steel strands: Larger diameter prestressed steel strands result in higher total tensile prestress, which is equivalent to a higher total axial load on the column. This strengthens the performance of the column concrete, leading to later crack formation with fewer and narrower cracks.
The comparison between the experimental and finite element hysteresis curves and crack development patterns shows that both match well. Therefore, the model established using DIANA finite element software can effectively simulate the behavior of PSRC columns in experiments.
4.3. Pushover Curve and Mesh Sensitivity Analysis
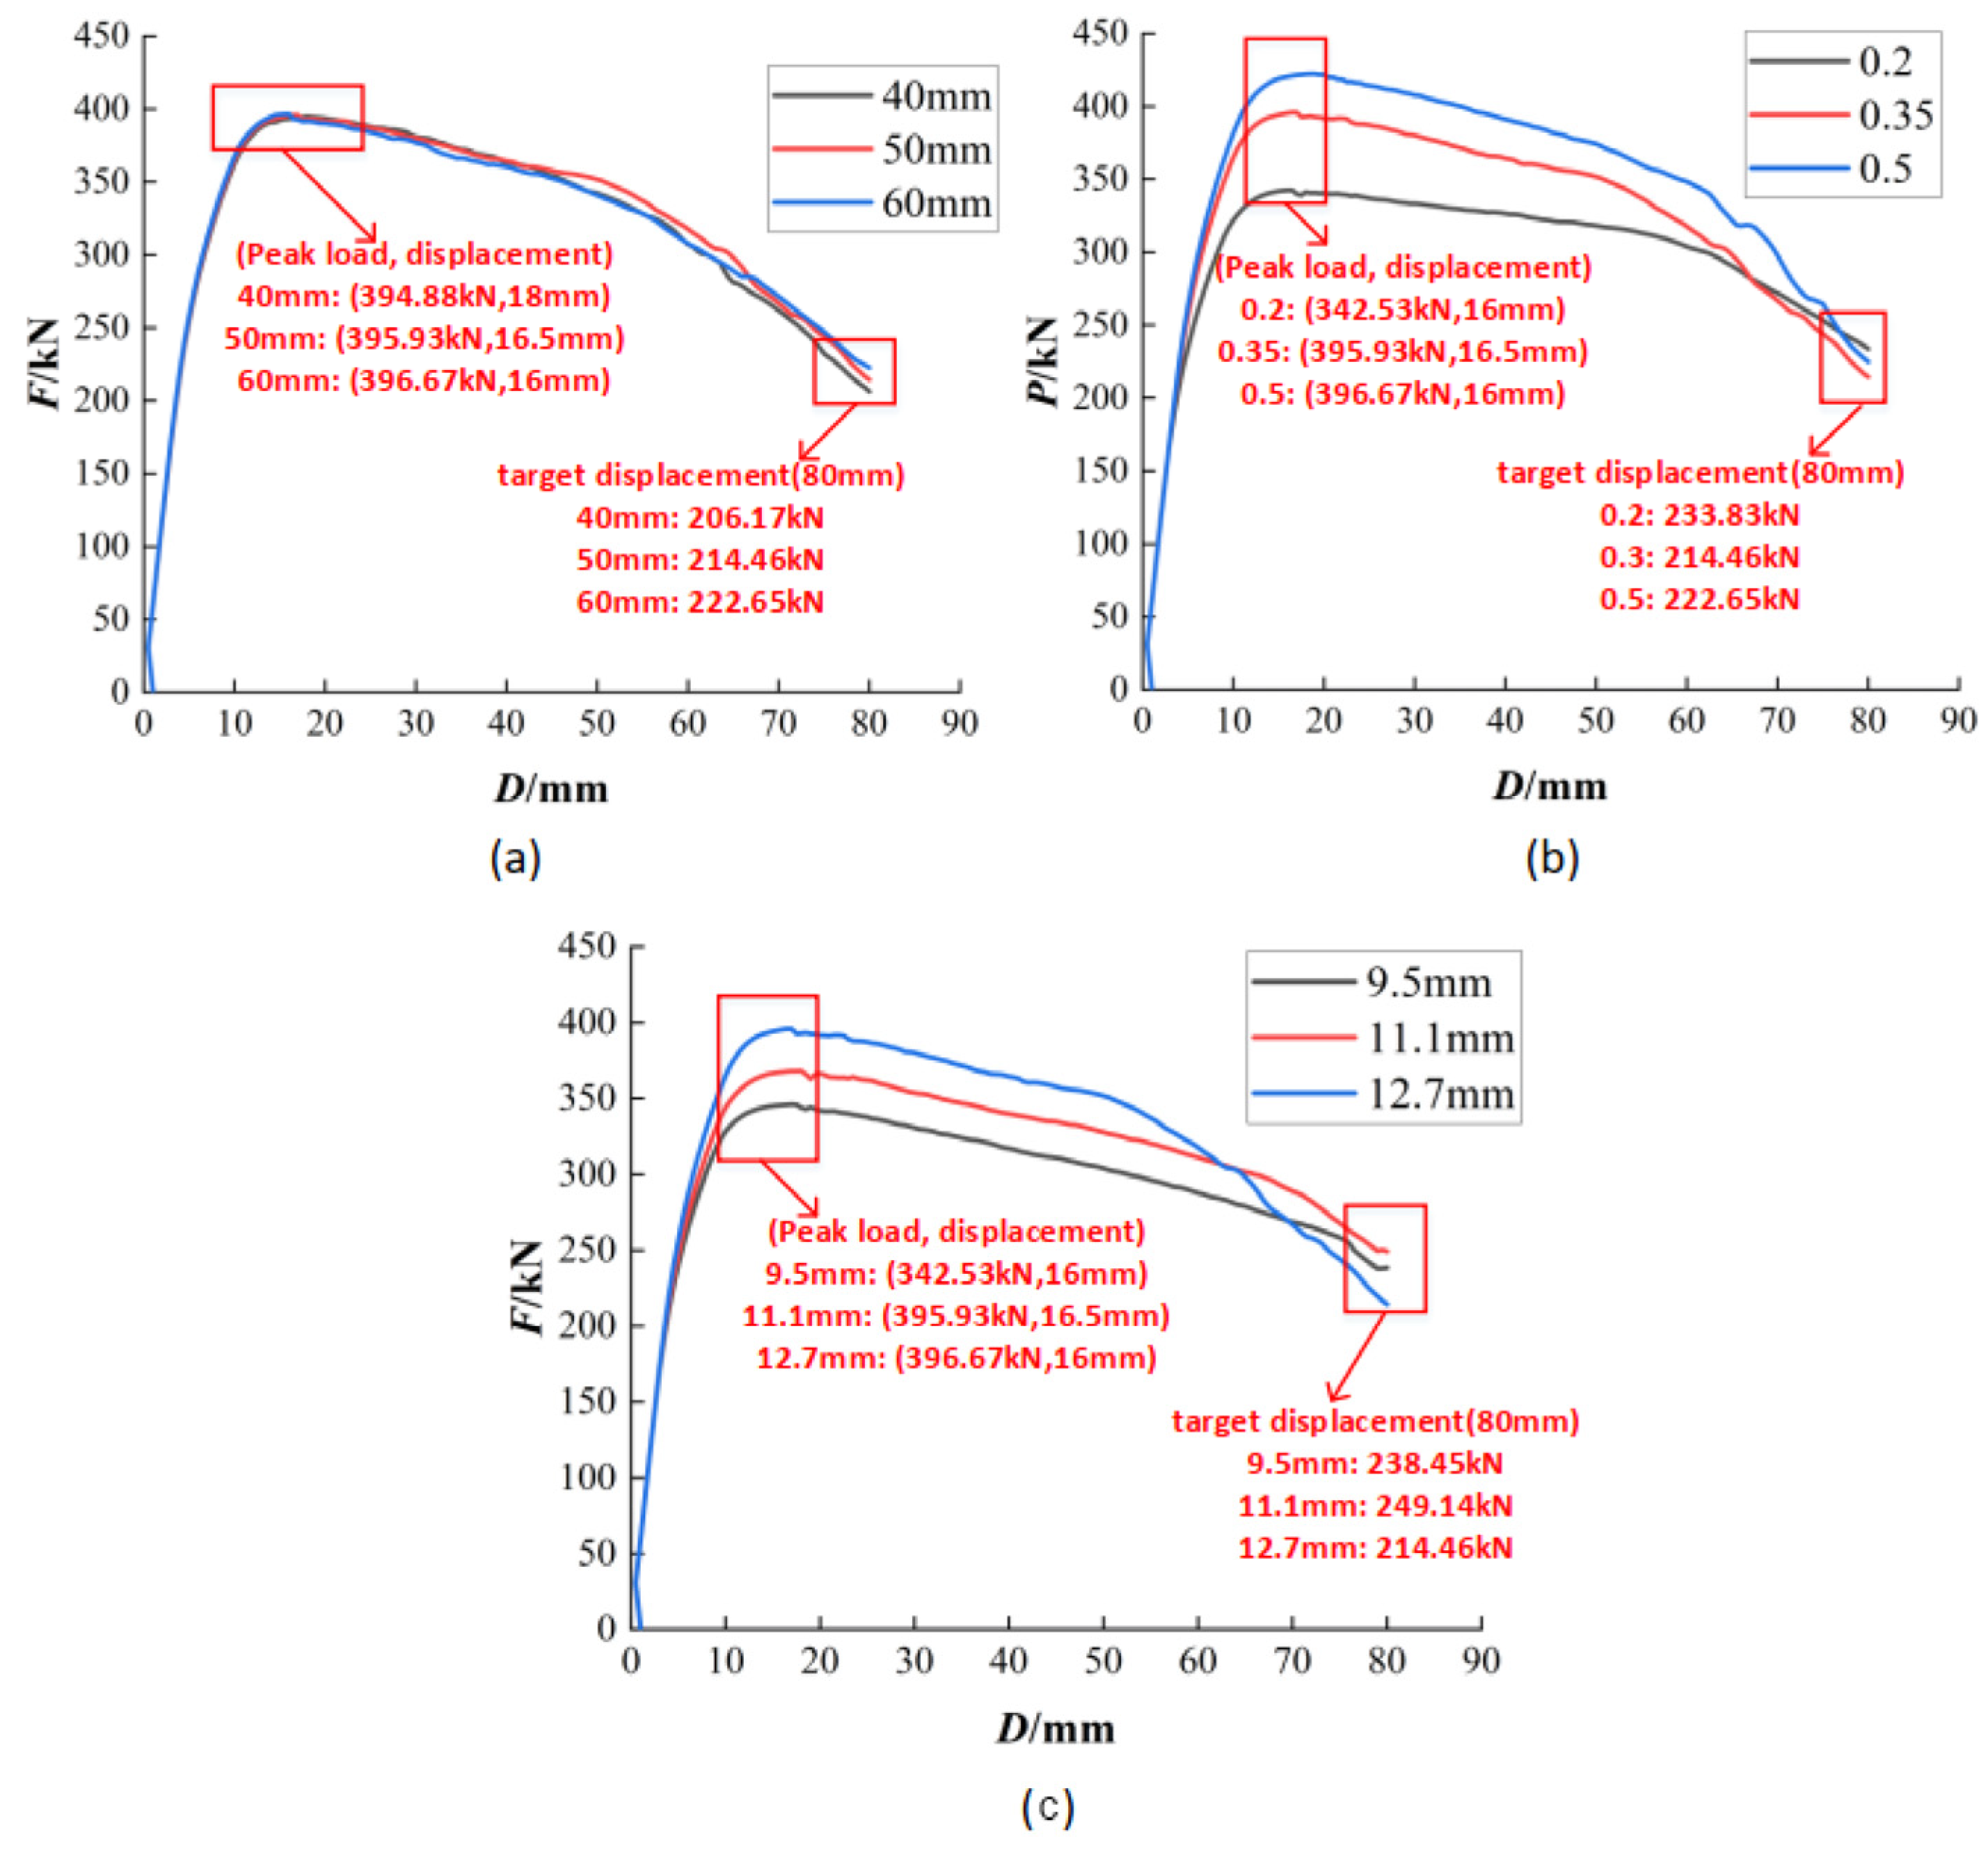
Pushover analysis involves gradually applying horizontal seismic loads to simulate the nonlinear behavior of structures under earthquake conditions. In this finite element analysis, displacement control was employed. The obtained pushover curve is depicted in
Figure 17.
Increasing the axial compression ratio results in higher peak load values and larger corresponding displacements for the specimen. This elevation in the axial compression ratio enhances the overall stiffness of the specimen, slowing down concrete cracking. However, in the descending segment, where the specimen is subjected to large eccentric compression, an increase in the axial compression ratio intensifies concrete damage, leading to a faster decline in the specimen’s load-bearing capacity.
Increasing the diameter of the steel strands enhances the specimen’s cross-sectional equivalent stiffness. Simultaneously, the prestress applied to the column increases its overall stiffness, resulting in higher peak load values for the specimen with less pronounced variations in corresponding displacements. In the descending segment, due to the prestress applied by the steel strands, the actual axial compression ratio of the column increases, leading to more severe concrete damage.
4.4. Parameter Analysis
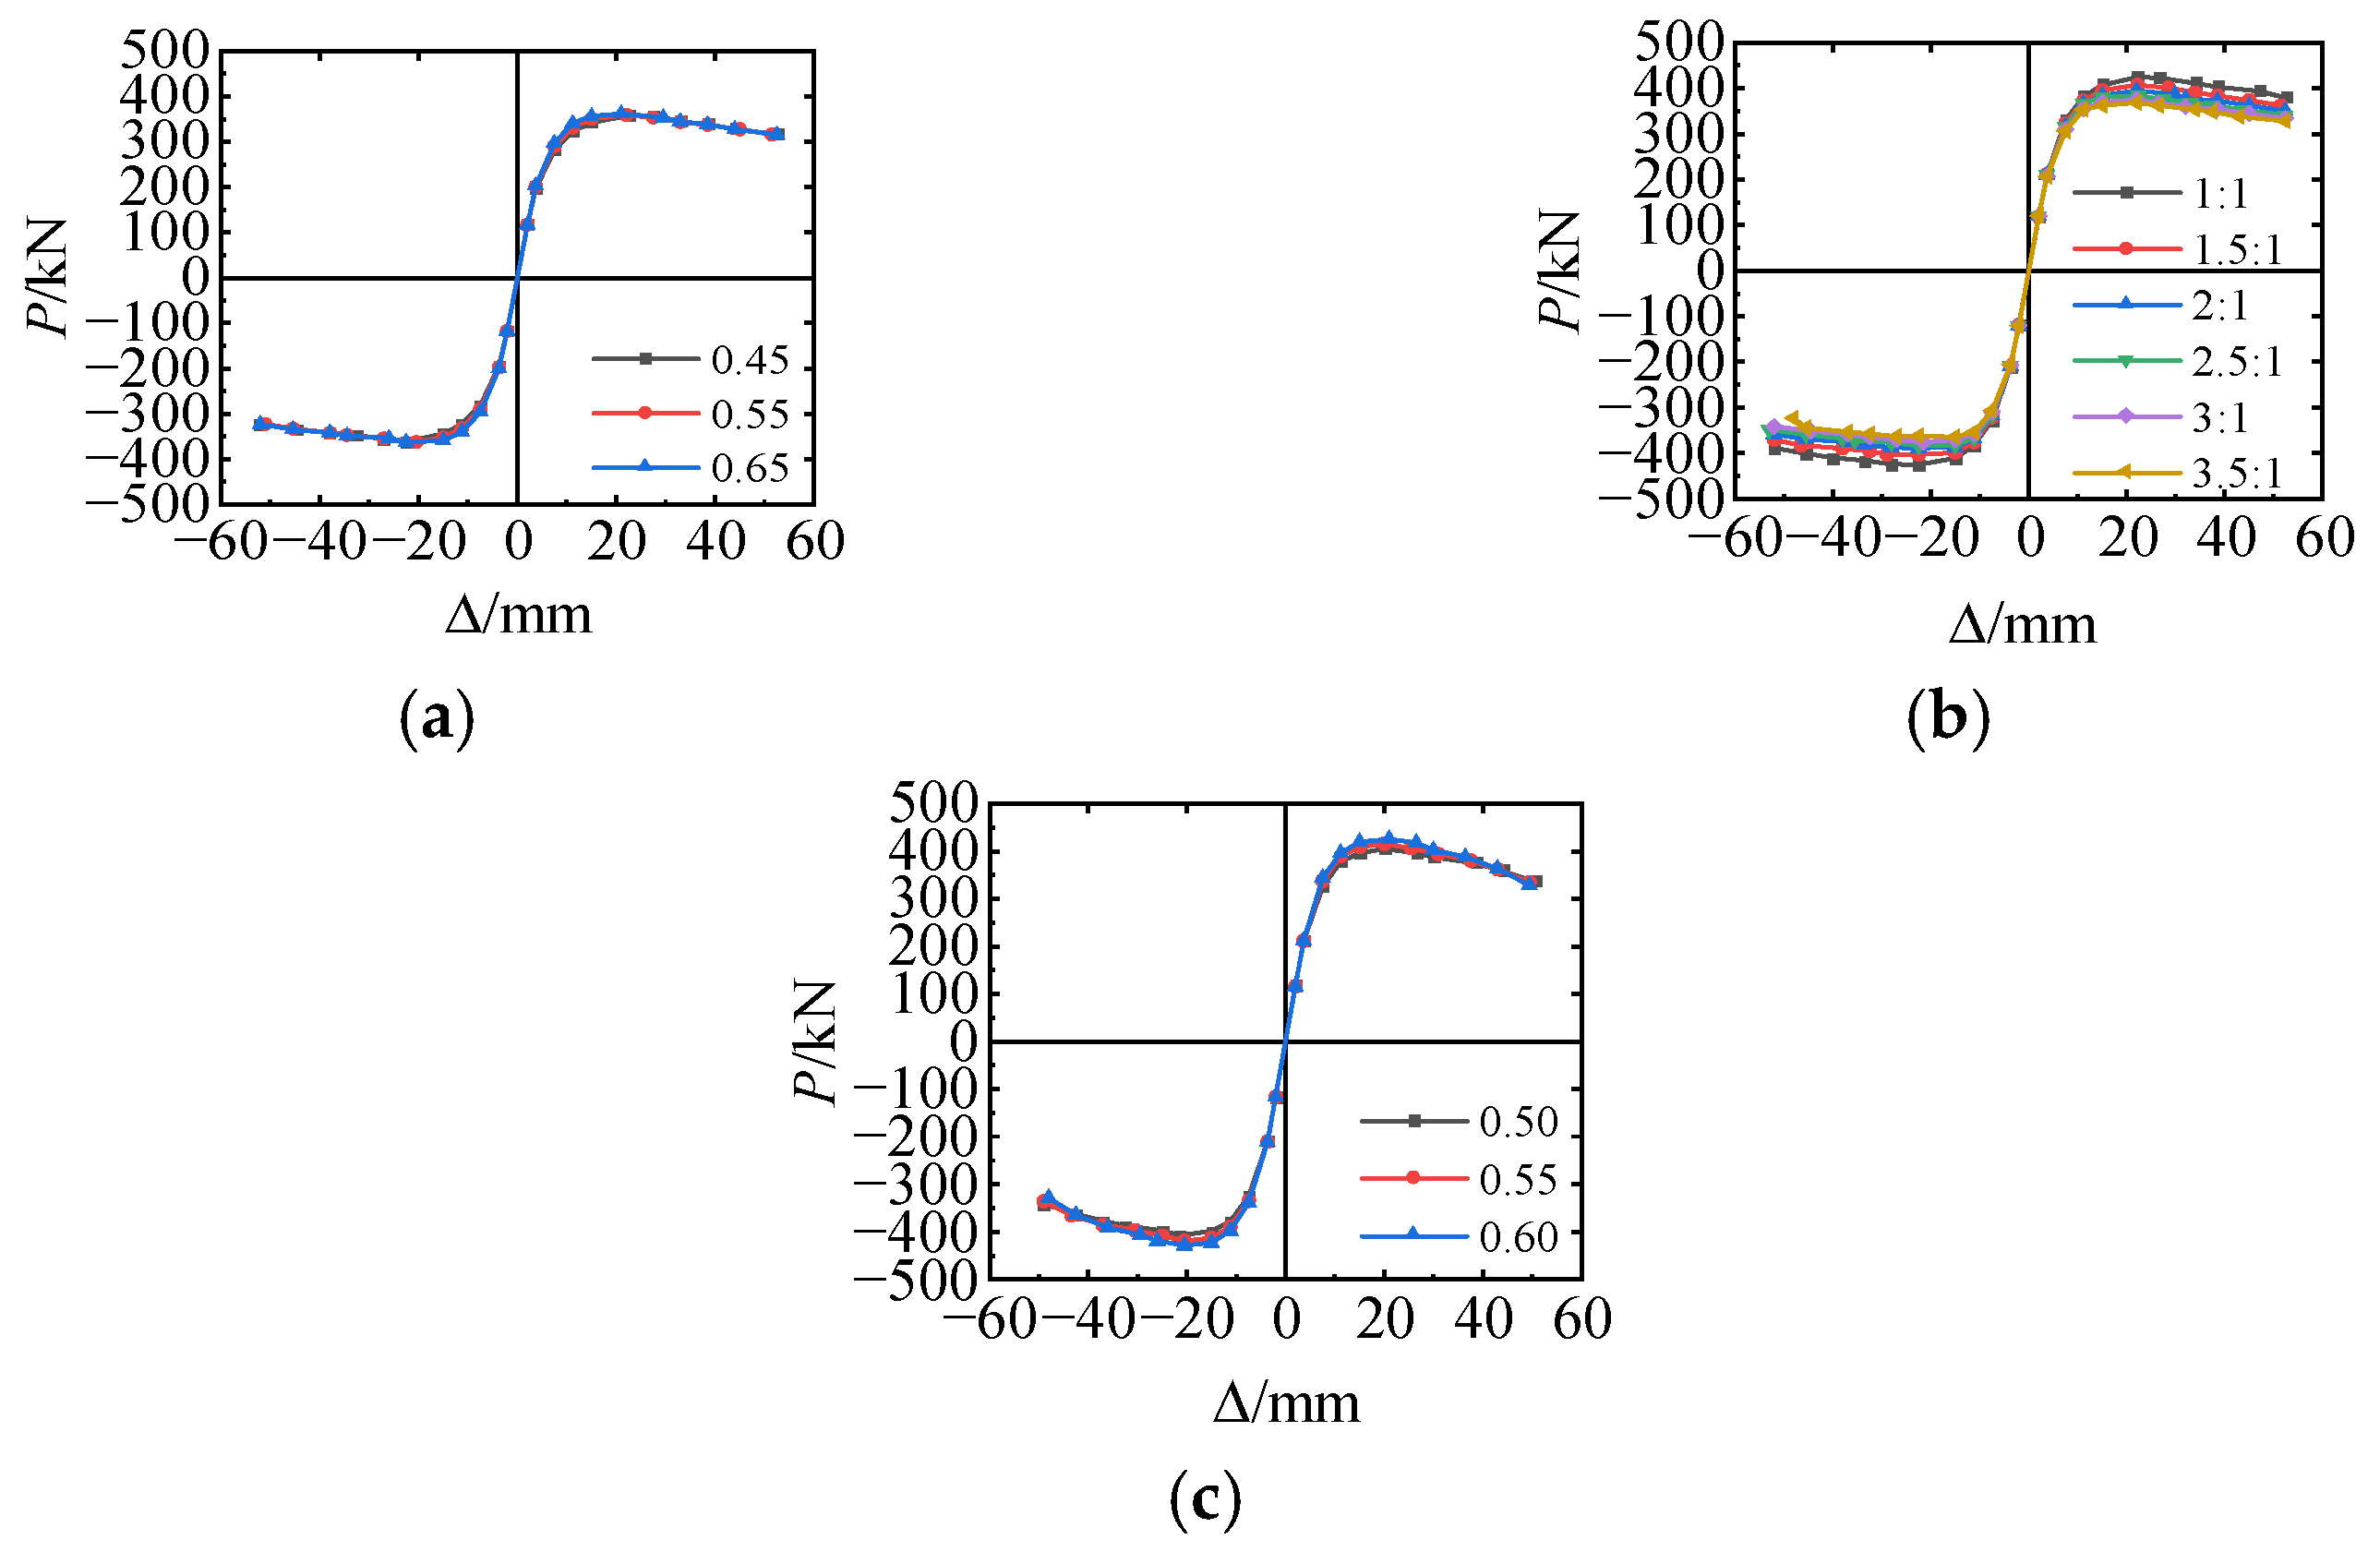
According to the finite element model described above, the influence of prestressing force control value, composite reinforcement ratio, and high axial load ratio on the seismic performance of PSRC columns is analyzed, as shown in
Figure 18.
4.4.1. Tensile Control Prestressing Force
From the skeleton curves in
Figure 18 and the data in
Table 7 for different tensile control prestressing force values, it can be observed that as the tensile control prestressing force increases from 0.45 to 0.55 and 0.65, the load-bearing capacity of the column component slightly increases, and the stiffness of the specimen before reaching the peak load also slightly increases. The descending segment of the skeleton curves remains mostly consistent, and there is little change in the displacement ductility ratio.
4.4.2. Composite Reinforcement Ratio
Taking into account the influence of the proportion of different threaded steel bar areas and steel strand areas in the composite reinforcement on the seismic performance of PSRC columns, PSRC component models with ratios of threaded steel bar area to steel strand area approximately equal to 1:1, 1.5:1, 2:1, 2.5:1, 3:1, and 3.5:1 were established, with longitudinal reinforcement ratios all below 5%.
From
Figure 18 and
Table 7, it can be seen that as the proportion of prestressed steel strands decreases, the load-bearing capacity of the PSRC component gradually decreases, and the initial stiffness also slightly decreases. The displacement ductility ratio increases first and then decreases. As the ratio of threaded steel bars to steel strands increases from 1:1 to 3.5:1, the peak load gradually decreases by 4.03%, 3.17%, 2.59%, 2.29%, and 1.79%, and the ductility ratio increases first and then decreases. When the reinforcement ratio is 2:1, the ductility ratio is the largest.
4.4.3. Axial Compression Ratio
In this section, numerical analysis of the mechanical properties of PSRC columns with two additional high axial compression ratios, 0.55 and 0.6, is added to the three axial compression ratios mentioned earlier. It can be observed that as the axial compression ratio increases, the load-bearing capacity of PSRC columns increases significantly. However, the growth trend gradually decreases with an increase in the axial compression ratio. When the axial compression ratio increases from 0.5 to 0.55, the peak load increases by 2.37%, and the displacement ductility ratio decreases by 7.10%. When the axial compression ratio increases from 0.55 to 0.60, the peak load increases by 2.65% and the displacement ductility ratio decreases by 6.44%, while the initial stiffness remains mostly unchanged.


